Abstract
As the demand for high-speed elevators grows, the requirements of elevator performance have also increased. Most of these are single variables that do not consider the comprehensive impact of multiple variables on performance, especially comfort. To overcome this problem, a stepped segmentation method for a theoretical high-speed elevator car air pressure curve (THEC-APC) adjustment is proposed that could actively help to select a suitable theoretical elevator car air pressure adjustment curve. By utilizing the proposed Particle Swarm Optimization (PSO) algorithm, the theoretical elevator car air pressure curve is optimized for multiple performances (including passenger comfort, energy consumption, and aerodynamic characteristics). In addition, the THEC-APC is smoothed by the Bezier curve for the variable destination floor. To verify the proposed method, the KLK2 (Canny Elevator Co., Ltd., 2015, Suzhou) high-speed elevator design process is applied. The numerical experiment results show that the proposed method can improve the accuracy and search efficiency of the optimal solution. Meanwhile, the proposed method helps to promote further air pressure compensation design for high-speed elevators.
1. Introduction
As the size of high-rise buildings continues to increase, the demand for a quicker elevator speed is rising, and the use of high-speed and ultra-high-speed elevators is becoming more and more popular. Although increases in elevator speed have improved transportation efficiency, the problem of elevator passenger discomfort has gradually become prominent [1,2,3,4]. In addition, the loss of elevator structure stability will continue to increase during high-speed operation, mainly as a result of the difference between air pressures inside and outside of the elevator car. Air pressure compensation during elevator operation can effectively reduce air pressure difference and keep the elevator running smoothly and comfortably.
When a high-speed elevator runs fast in the hoistway, it will produce strong airflow disturbances and drastic pressure changes due to the small cross-section of the hoistway and the complex structure of the elevator, which could result in serious stability and comfort problems for the elevator. An elevator car is a closed passenger compartment structure with similar air pressure properties to other closed passenger compartment structures such as high-speed train and vehicle cars [5,6,7,8]. Schwanitz et al. [9] simulated the pressure chamber TITAN to investigate pressure comfort for high-speed train passengers. They applied a generalized equation model to estimate the pressure change attributes that contribute to passenger discomfort, which could help improve train and tunnel designs. Diedrichs et al. [10] analyzed the car body characteristics of high-speed trains inside tunnels. The results revealed that the influence of a low frequency mode increases as wall clearance narrows, corresponding to the nominal lateral position of the train.
The research mentioned above can assist in high-speed elevator aerodynamic analysis and help to improve the operations of high-speed elevators. In order to build a physical elevator model for simulation, Bai et al. [11] carried out experiments by which to measure the aerodynamic characteristics of high-speed elevators. They analyzed the effects of different shapes of car and hoistway parameters on the aerodynamic characteristics of the elevator using experimental results. Duan et al. [12] simulated the running status of an elevator according to different design parameters under various operating conditions, and measured the instantaneous velocity field of the different elevator car shrouds. Using an aerodynamic analysis of high-speed elevators, Zhu et al. [13] found that traction ropes and counterweights have a great influence on airflow disturbances, which has been verified through high-speed elevator experiments. The aerodynamic characteristics of high-speed elevators obtained through experimental methods are high in accuracy as well as in cost. Numerical simulation analyses of the fluid mechanics inside hoistways has been widely used to save costs and improve efficiency. Shi et al. [14] established a two-dimensional model of unsteady turbulence caused by a high-speed elevator system that focused mainly on the transient changes of aerodynamics when a counterweight moves in the hoistway, and obtained the aerodynamic characteristics of the elevator when the car-counterweight was staggered. Through the modeling and simulation analysis of high-speed elevators, Matsuda et al. [15] concluded that high-speed elevator cars and airflow will produce strong airflow disturbances. Wang et al. [16] utilized the static incompressible Navier–Stokes equation to numerically simulate the three-dimensional turbulence of a high-speed elevator hoistway. Through a simulation analysis of different blocking ratios, the results showed that as the blocking ratio decreased, the pressure and resistance of high-speed elevators also decreased.
To further improve the quality of elevator operation, elevator vibration factors should be studied as one of the five international standard elevator quality factors (ISO18738 (2012)). Taplak et al. [17] predicted and analyzed the vibrations of an elevator system based on the proposed adaptive neural network predictor. The simulation results showed that its prediction performance was good. Jiang et al. [18] established a traction dynamic model of a high-speed elevator with time-varying characteristics. This helped provide data on the mass, stiffness, damping, and dynamic characteristics of the system. After the analysis of the elevator system vibration causes, several damping methods were proposed. Zhang et al. [19] used a linear motor to design an elevator car’s active shock absorber. Considering the effect of uncertain external excitations on the car system, they designed a back propagation neural network Proportion Integration Differentiation (PID) controller to intelligently and actively control the car’s vibrations. Tusset et al. [20] pointed out that the horizontal response of the elevator in vertical operation had non-linear characteristics under the excitation of the deformation of the guide rails. They used a magnetorheological damper to dampen vibrations. The experimental results showed that this method could effectively suppress vibrations during elevator operation. Along with the vibration problem is the noise problem of elevator systems. Yang et al. [21] proposed a mobile band-pass filter to improve the performance of active noise control in an elevator car. The noise control was able to be applied to dynamic systems with time-varying states, and the control effect was good. According to the principle of noise generated by the traction machine, Kawasaki et al. [22] proposed a numerical calculation model of the structure sound based on the electromagnetic force of the traction machine. They further proposed a method to evaluate the noise of the traction machine.
When analyzing the aerodynamic characteristics of high-speed elevators, both the performance parameters as well as the energy consumption of an elevator’s operation should be considered at the same time. Especially for ultra-high-speed elevators, energy consumption is often extremely high [23,24,25]. Hu et al. [26] developed a multi-objective genetic algorithm (MOGA) for elevator control in which the optimization goals were energy consumption and an acceptable waiting time for passengers. The optimization results showed that, compared to the traditional nearest-service principle method, MOGA could reduce energy consumption by 23.6%. Zhang et al. [27,28] proposed an optimization method for energy-saving dispatching measures during an elevator’s peak mode. By analyzing the optimization goals of elevator energy-saving dispatching, a robust scheduling optimization model was established to handle the elevator dispatching strategy under uncertain peak traffic flow. Finally, the proposed method was verified by the experiments’ effectiveness. Desdouits et al. [29] improved the control method of elevator energy storage equipment. By setting two controllers—an advanced controller (based on linear rules) and a low-level controller (based on simple logic)—the elevator energy cost was optimized. Experimental results showed that this method could achieve 35% energy-saving efficiency. Based on a direct current (DC) micro-grid, Zhang et al. [30] proposed an energy conservation approach for elevators. The method resulted in a high energy efficiency of 15.87–23.1% and 24.1–54.5% in the experimental test and field data collection, respectively.
With increases in elevator speed, problems with operation safety, structure stability, passenger comfort, and the dynamic characteristics of the elevator have gradually become complex and worth consideration. Kobayashi et al. [31] proposed a magnetorheological fluid semi-active damper to improve the safety and reliability of elevators. The damper reduced impact force to passengers when the drives of the elevator failed. Wang et al. [32] studied non-linear and uncertain load disturbances during elevator startup. They proposed an active disturbance rejection control strategy to ensure riding comfort, which suppressed sliding distance and speed to a certain extent. Elevator resonance can seriously affect elevator structure stability. Yang et al. [33] studied the transverse vibrations of a super-high-speed elevator considering guide rail excitation and air disturbance. They constructed a four-degree-of-freedom model and employed the Newmark- method to analyze transverse vibrations. Zhang et al. [34] conducted a dynamics analysis of high-speed traction elevators. They constructed a time-varying dynamic model and used the fine integral method to analyze the vertical vibrations of a car-hoisting rope system. In addition, with the development of advanced technology, an innovative elevator has been developed to surpass the technical limitations of tradition elevators. Without the use of cables as a lifting system, a cableless elevator will not violently vibrate in high-rise and super-high-rise buildings. ThyssenKrupp Elevator introduced a product known as MULTI (ThyssenKrupp, 2016, Essen, Germany) [35] in which multiple lift cars could be in the same hoistway and access power from a liner motor without hoist ropes. Multi-supported horizontal and vertical transportation, greatly increased flexibility and significantly reduced energy consumption.
The existing research on the performance of high-speed elevators has mainly focused on the fields of vibration and noise, most of which are single variables that do not consider the comprehensive impacts of multiple variables on performance, especially comfort. Furthermore, the air pressure regulation of an elevator car is realized through a high-coupling and non-linear air pressure compensation control system. The operation condition of a high-speed elevator in the shaft is repetitive and controllable. An effective design of the air pressure curve of an elevator car can provide a theoretical basis for the elevator car physical control system. To improve an elevator’s performance as well as passenger comfort, passive methods such as changing the external structure of the elevator car are often used. Studies on the active control of air pressure in the car have been performed less frequently. In view of this, an optimization method of the car air pressure curve has been proposed to improve elevator performance as well as the comfort of passengers’ ears. To resolve the design problem of high-speed elevator car air pressure curves, a theoretical elevator car air pressure adjustment curve is suitably selected. Based on the selected curve, a theoretical elevator car air pressure curve (THEC-APC) multi-performance optimization method utilizing (competitive mechanism based multi-objective particle swarm optimizer) CMOPSO is proposed. In addition, after the optimization solution is obtained, the THEC-APC is smoothed for the variable destination floor to reduce the effect of the sudden changes in the air pressure curve. A general depiction of the proposed method is shown in Figure 1.
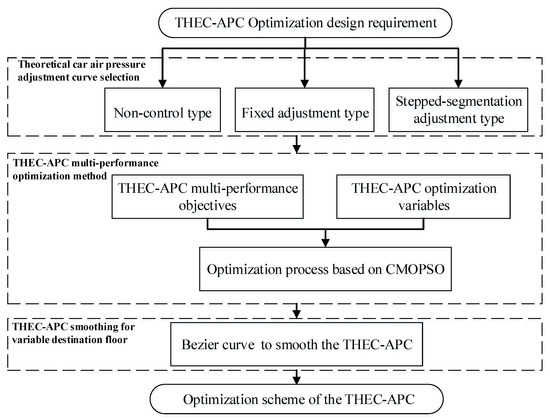
Figure 1.
Introductory paragraph of the proposed method.
The remainder of this paper is organized as follows. Three theoretical car air pressure adjustment curves are introduced in Section 2. The THEC-APC multi-performance optimization method is proposed in Section 3, including multi-performance objectives, optimization variables, and the optimization algorithm. In Section 4, the THEC-APC smoothing method is proposed. To verify the proposed method, a numerical experiment is conducted on a KLK2-type high-speed elevator design. Finally, a conclusion is presented in Section 6.
2. Theoretical Elevator Car Air Pressure Adjustment Curve Selection
Before formulating the air pressure compensation scheme for high-speed elevator cars, the THEC-APC needs to be designed to obey the air pressure compensation system. The theoretical curve should be converted into stored data that can be generated online or offline, according to certain principles; this establishes the pressure compensation control. Unlike elevator speed curves, which have been heavily studied, there is not enough research to standardize the THEC-APC. According to the existing research on high-speed elevator car air pressure adjustment schemes, the THEC-APC can be summarized into the following three types:
- (a)
- Non-Control Type
In this situation, there are no air pressure compensation measures conducted for the inside of the elevator car. The air inside and outside the elevator car are freely exchanged through the ventilation fan and the leaking gap. At this time, the air pressure curve in the car changes with the height of the elevator. In general, the air pressure adjustment curve changes slowly when the elevator starts and brakes, and changes drastically in the middle high-speed stage, which is shown as the black curve in Figure 2.
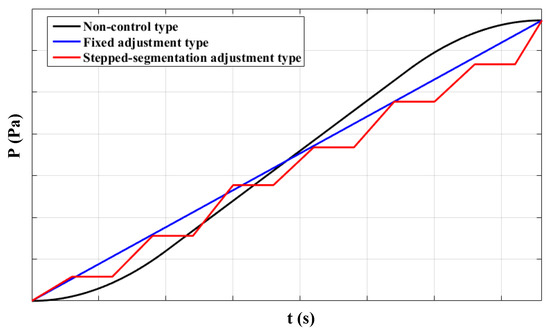
Figure 2.
Three typical air pressure adjusting curves.
- (b)
- Fixed Adjustment Type
In this situation, the inlet ventilation fan performs simple active compensations for the air pressure inside the car. The air compensation rate remains constant, which shapes the fixed-adjustment-type air pressure adjustment curve into a straight line. This is shown as the blue curve in Figure 2. Compared with the non-control-type curve, the fixed-adjustment-type curve can slightly reduce the rate of air pressure change in the middle high-speed stage.
- (c)
- Stepped-Segmentation Adjustment Type
In this situation, the adjustment curve is divided into several segments. Through this multiple-stepped-segmentation air pressure control, passengers can achieve air flow between the outside world and their middle ear cavities in a short period of time, thereby eliminating ear pressure and reducing the time of discomfort. This is shown as the red curve in Figure 2.
In this paper, the stepped-segmentation adjustment-type curve is utilized as it is shown in Figure 3. In this adjustment-type curve, the air pressure in the elevator car increases in steps. The air pressure in the elevator car is first compensated with a large air pressure change rate in a short period of time. In this period, the passenger can be fully aware of the pressure change and perform active swallowing actions to balance the air pressure inside and outside the ear canal. At the mean amount of time, this helps to ease the abnormal feeling of the ear [36,37]. For the subsequent period of time, the air pressure is maintained within a small variation range so that passengers are given enough time to adjust. The lines with arrows in Figure 3 represents the amounts and the directions of compensation required for the air pressure adjustment.
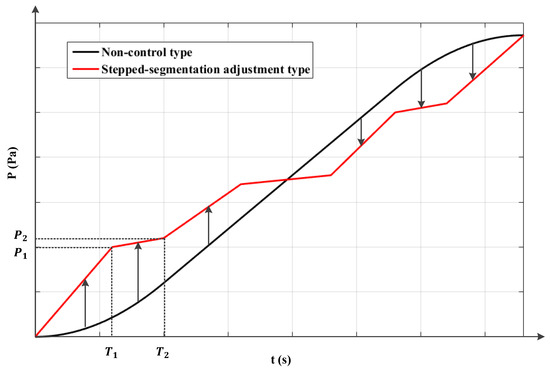
Figure 3.
Segmented adjustment curve.
The stepped-segmentation air pressure adjustment method can eliminate the ear blocking feeling caused by pressure change in an elevator car, and can greatly reduce a passenger’s discomfort time. Following Figure 3, a curve function model is established as follows:
where denote the air pressure change rate in each segment of the adjustment curve, and denotes the k-th segment point on the THEC-APC.
3. THEC-APC Multi-Performance Optimization Method
3.1. THEC-APC Multi-Performance Objectives
The ultra-high-speed elevator air pressure compensation process is complicated. In the process of air pressure adjustment compensation, the impact of multiple operating conditions changes during elevator operation must be considered. As floor numbers continues to increase, elevators run faster, and the requirements for controlling high-speed elevators continues to increase. To safely operating high-speed elevators, it is necessary to consider the passenger comfort index, the energy-saving index of the operation of the air pressure compensation system, and the adjustment accuracy index. Therefore, when designing the THEC-APC of a high-speed elevator car, these performances need to be used as evaluation indicators.
- A.
- Passenger comfort index
In this paper, passenger ear comfort while riding a high-speed elevator is used as the main passenger comfort index. According to Equation (1), and p(t) are closely related to passenger ear comfort. Therefore, a quantitative passenger ear comfort evaluation function is needed to determine the air pressure change rate value of each section of the THEC-APC. When the air pressure inside the human eardrum exceeds external air pressure by 400–670 Pa, the eardrum produces a feeling of swelling. When the air pressure inside the human eardrum is less than the external air pressure, the eustachian tube cannot be opened passively, and can only be actively opened by the action of active swallowing [38]. Therefore, a strong ear pressure sensation often occurs as an elevator descends. When the internal and external pressure difference is reduced to 500 Pa, the eustachian tube is automatically closed, and thereafter opened approximately every 1200 Pa or so to ease the pressure difference. The relationship between the air pressure change rate (or air pressure change value) and the eardrum displacement can be obtained by constructing a human ear pressure transmission model [39]. The relationships are shown in Figure 4. The ear comfort evaluation mechanism based on the eardrum displacement was obtained through the experiments shown in Table 1.
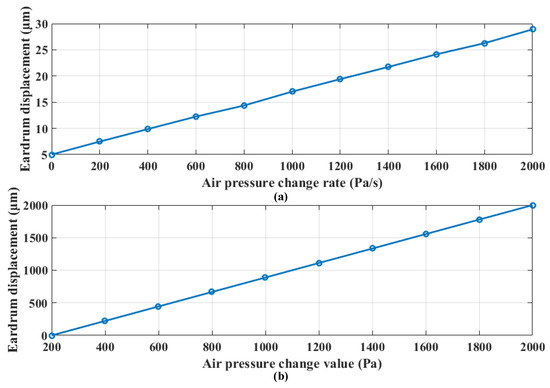
Figure 4.
Relationship between air pressure change and eardrum displacement (a); relationship between air pressure change rate and eardrum displacement (b); relationship between air pressure change value and eardrum displacement.

Table 1.
Comfort evaluation standard for ear tympanic membrane displacement.
The passenger comfort index reflects the quality of passengers’ comfort when riding an elevator. In the comfort evaluation standard, the level of comfort index increases with increasing discomfort. Therefore, in practical measurement, the lower the passenger comfort index, the higher the comfort level. From a psychological point of view, certain subjective feelings of the human body can be directly quantified and calculated, most of which can be described by an exact quantity. Average comfort based on the air pressure change rate and total ear pressure time based on the pressure change are simultaneously used as the standards by which to measure the comfort of the air pressure adjustment curve. These factors can be obtained by using the air pressure adjustment curve to invert the air pressure value. In this way, total ear pressure time can be calculated. This method relates the human comfort index to ear pressure time [40]. Considering the difference of the units, the normalization processing is performed to construct the passenger comfort index function as follows:
where denotes the comfort level corresponding to the air pressure change rate at time ; denotes the value of the air pressure that produces ear pressure; denotes the value of the air pressure when the ear pressure sensation disappears; g(t) denotes the function of the THEC-APC. The value of g(t) is the air pressure at time t. Once the air pressure values are obtained as and , the inverse functions and are used to denote the certain times corresponding to and , respectively. and denote the weights for different evaluation criteria, respectively. There are several methods by which to combine the comfort level of the ear tympanic membrane displacement and the air pressure adjustment time t. For the sake of further multi-objective optimization calculation complexity, the simple weight calculation method is used to obtain the passenger comfort index. When the system performs air pressure compensation, the power is mainly consumed by the intake and exhaust fans. The air flows into the elevator car through the suction of the intake fan, and is discharged out of the elevator car by the exhaust fan.
- B.
- Energy-saving index
The energy-saving index measures the energy consumed by the elevator car air pressure compensation system during elevator operation.
where denotes the flow volume; denotes the pressure head; N denotes the power, which is the amount that changes with time, so it can also be expressed as ; n denotes the speed of the fan; and the subscript m denotes it is at the m fan-speed of each performance parameter. The energy consumption of the high-speed elevator car air pressure compensation system can be calculated based on the power consumed by the fan during elevator operation.
where W denotes the total energy consumption of air pressure compensation system, and denotes the power of the elevator car air pressure adjustment fan. Since the THEC-APC design process occurs before the elevator car system is manufactured, these equations can be used after the design process. During the design process, it is difficult to accurately obtain the numbers and working statuses of the pressure adjustment fans, and it is also difficult to obtain the power consumption of the fans. Therefore, energy consumed by the air pressure compensation system is equivalent to the fan compensation amount in Figure 3, which is equal to an area composed of two pressure adjustment curves. This kind of simplification is beneficial for further multi-objective optimization calculations. Since every optimization objective consists of several variables, computational complexity increases exponentially with an increase in optimization variables. If the objective function is far more complicated, it will lead to unnecessary computation. In other words, under the condition that the logic of the optimization objective function be reasonable, the optimization objective function should be expressed in the simplest way possible.
where and denote the pressure compensation start time and end time, respectively. denotes the air pressure adjustment curve in non-control mode, while denotes the air pressure adjustment curve in segmented adjustment mode. The smaller the amount of the energy-saving index, the better the energy-saving efficiency.
- C.
- Precision pressure adjustment index
The air pressure inside and outside of an elevator car need to be equally compensated for when a high-speed elevator runs to a specific destination floor, and this is achieved via precise pressure adjustment of the elevator car air pressure adjustment system. If there is a difference between the inside and outside of the elevator car door, it will be difficult to open the car door. Furthermore, if the car door is opened, it will cause discomfort (such as an uncomfortable ear pressure sensation). However, it is difficult to adjust the pressure difference to zero due to multiple interference factors. Therefore, the precise pressure adjustment index is the difference between the total air pressure value compensated for by the high-speed elevator air pressure compensation system during the entire operation and the total pressure change of the elevator from the departure floor to the destination floor. This can be expressed as:
where denotes the precision pressure adjustment index; denotes the total air pressure adjustment during high-speed elevator operation; and denotes the absolute pressure difference between the departure floor and the destination floor. In general, when an elevator stops, the difference between the air pressure inside and outside of the elevator car door should be kept within 50 Pa to guarantee high safety and comfort, which means . When , the air pressure difference inside and outside of the car door is too large, and the car door cannot be opened normally.
3.2. THEC-APC Optimization Variables
When optimizing the THEC-APC to reduce calculation complexity and shorten calculation time, it is necessary to set a reasonable variable space and reasonable ranges of variables in the multi-objective optimization algorithm. In addition, when the air pressure optimization results do not meet the requirements of the performance indexes, the objective functions and values of the variables need to be re-determined.
- A.
- Elevator Car Air Pressure Change Rate () and Corresponding Time ()
According to the passenger comfort index function established above, rate and amount of change air pressure are the main factors affecting comfort in a high-speed elevator car. In the THEC-APC design process and the elevator car air pressure change rate () and its corresponding time () are the most influential parameters. In general, the pressure change rate of non-control-type elevator equipment is kept constant during the speed lifting of an elevator car. On the contrary, when the amount of change in air pressure is constant and the compression time is set to an initial time, the pressure change rate will increase, causing the human ear to react to the pressure change with a feeling of blockage. Therefore, it is preferable to set the compression phase time at least 3 s. In addition, it takes approximately 4 s from the moment a person feels an ear blockage until the ear blockage position is eliminated by a swallowing action. Therefore, it is preferable to set the non-pressurized phase time to at least 6 s. Meanwhile, a lower amount of air pressure change in the segmented curve will cause the air pressure compensation system to perform unnecessary adjustments resulting in energy loss. If the air pressure change amount is set too high, it will cause the human ear to exceed the threshold. The ride comfort is greatly reduced, so the pressure change is set at 500–2000 Pa. The relevant research also defines the impact of pressure fluctuations on human comfort, stipulating that the apparent threshold of discomfort in a human ear is 1800 . Therefore, in the THEC-APC design process, the corresponding air pressure change rate and air pressure change amount should not exceed the above-mentioned threshold of discomfort for the human ear.
- B.
- Elevator Constant Speed () and Corresponding Acceleration Time ()
Changes in the acceleration and speed of an elevator have certain effects on the air pressure in the elevator car. The total adjustment time of the car air pressure adjustment curve is determined by the total operating time of the elevator, and elevator running will also affect the comfort of passengers. Therefore, it is necessary to focus on the selection of the elevator speed curve. The elevator speed curve usually includes a triangular speed curve, a trapezoidal speed curve, a parabolic-linear speed curve and a sinusoidal speed curve. To reduce the complexity of the solution, the commonly used trapezoidal speed curve—simplified from an s-type curve—is selected in this paper, as shown in Figure 5. A large number of optimization variables will make multi-objective optimization problems difficult to solve. For this reason a trapezoidal speed curve is utilized, as the varying number of the subsequent multi-objective optimizations will exponentially increase to use an s-type curve. The elevator speed curve is determined by the elevator constant speed (; the maximum speed of the elevator) and its corresponding acceleration time (). For the high-speed elevators discussed in this article, the maximum acceleration should be between 0.7 and 1.5 in order to reduce the corresponding acceleration of the elevator during the starting and braking process (the highest speed is 7–10 m/s).
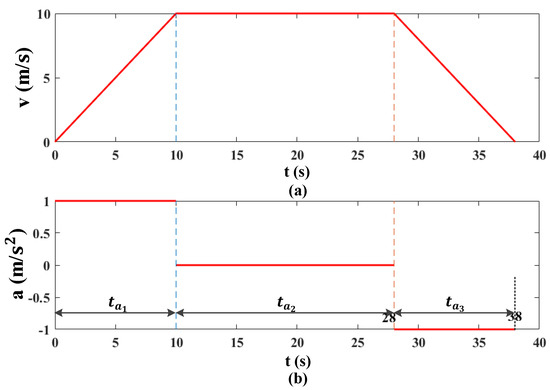
Figure 5.
Elevator speed curve (a) and acceleration curve (b).
3.3. THEC-APC Multi-Performance Optimization Process Based on CMOPSO
According to the multi-performance index evaluation standard proposed in Section 3.1, the passenger comfort index, energy-saving index, and the precision pressure adjustment index should all be considered as optimization objectives during the THEC-APC design process. The factors affecting air pressure change in an elevator car include not only the elevator’s operating speed and acceleration, but also parameters such as air pressure change rate and amount of air pressure change for each pressure adjustment curve. Therefore, the design of the THEC-APC is a typical multi-objective optimization problem. A normal multi-objective optimization problem can mathematically be expressed as:
where is the n-dimensional decision variable; is the objective function set; m denotes the amount of the objective function; and and denote the inequality and equality constraints, respectively. When optimizing a multi-objective problem, it is often hoped that all target performance indicators reach the optimal state. However, because objective functions in the optimization process often have complex coupling relationships, the improvement of one performance is often accompanied by a reduction in other objective performances. As is shown in Figure 6, the 2nd adjustment curve’s ear discomfort time is shorter than the 1st adjustment curve’s. In addition, compared to the 1st adjustment curve, passengers have a longer active air pressure adjustment time in the 2nd adjustment curve. However, the 2nd adjustment curve requires fans to generate more air pressure compensation than the 1st adjustment curve, which leads to a poorer energy-saving ability. When solving multi-objective optimization problems, a compromise such as a Pareto solution is often adopted. After obtaining the Pareto optimal solution set, the solution that best meets the design requirements can be selected according to the degree of emphasis on different performance indexes.
Figure 6.
Comparison of different adjustment curves.
The multi-objective particle swarm optimization (MOPSO) algorithm is a commonly used multi-objective optimization algorithm. Since the objectives of the THEC-APC multi-performance optimization are convex optimization functions, the MOPSO algorithm can be successfully used. For more general cases (such as the optimization objectives) that can only be expressed as non-convex functions, convex relaxation algorithms [41] will be used to transform non-convex optimization problems into convex optimization problems. The structure of the MOPSO algorithm is simple, and its convergence speed is fast. However, it has the disadvantages of low search accuracy, and can easily to fall into a local optimum. Most of the existing multi-objective particle swarm optimization algorithms largely depend on the global or personal best particles stored in the external files, which lack universality. The competitive-mechanism-based multi-objective particle swarm optimizer (CMOPSO) [42] is utilized to solve the THEC-APC multi-performance optimization problem. This algorithm has the following advantages: (a) for functions with continuous parameters, it has a strong ability to find extreme values; (b) updating particles based on the elite competition mechanism can better balance the convergence and distribution of the algorithm; (c) compared to the traditional MOPSO algorithm, there is no need to apply for additional storage space to use an external file, since the searched historical data do not need to be recorded, and this reduces computational complexity. The specific steps of the CMOPSO algorithm are as follows:
- Step 1. Randomly initialize particle swarm , including the initialization of population particle position and velocity .
- Step 2. Obtain the N fitness values of each particle through the objective function and update the temporary particle swarm using the learning mechanism based on elite competition.
- Step 3. Use a non-dominated sorting-based environment selection strategy to select the next-generation population containing N particles from populations P and .
- Step 4. If the optimal solution end requirement is met, stop searching; otherwise, go to Step 2.
The core of the CMOPSO algorithm is a learning mechanism based on elite competition, as shown by the schematic diagram in Figure 7. and are randomly selected reference particles from the elite solution set. Particle is a particle from the previous generation that has not been updated. Comparing the angle ( and ) between particle and particles and , if in this elite competition, particle wins, and particle will use particle as the learning object to update the speed and position. The speed and position update function of particle can be expressed as:
where and denote the speed and position update function of particle at t time; denotes the current position of the winning particle; and and are randomly generated vectors in the interval [0, 1].
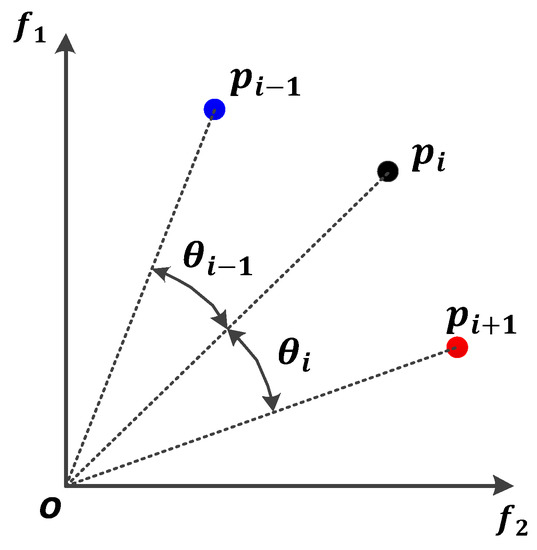
Figure 7.
Competition mechanism schematic diagram.
The design of the THEC-APC is affected by factors such as the speed and acceleration of the elevator, as well as the amount and rate of elevator car air pressure change compensated for by each segment. Each factor has corresponding constraints that can be used to obtain the multi-objective optimization model:
The THEC-APC multi-performance optimization process based on the CMOPSO algorithm is shown in detail in Figure 8.
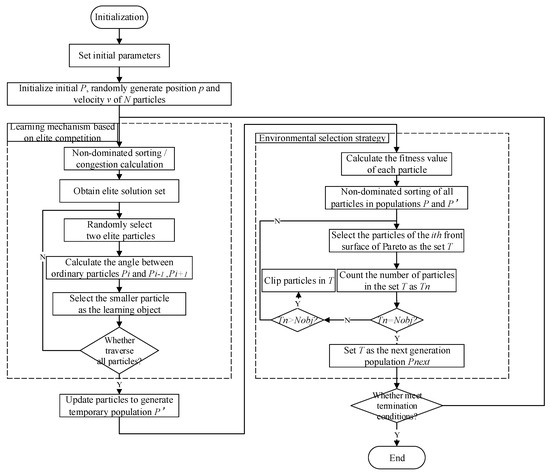
Figure 8.
Flow chart of the THEC-APC multi-performance optimization based on the competitive-mechanism-based multi-objective particle swarm optimizer (CMOPSO) algorithm.
4. THEC-APC Smoothing for Variable Destination Floor
The THEC-APC obtained using the CMOPSO algorithm is only a simple segmented polyline. In practice, there is a sudden change in the air pressure change when the fan compensates for the car, which the pressure compensation system cannot achieve. Therefore, it is necessary to smooth the THEC-APC. For computational complexity, a Bezier curve is adopted to smooth the THEC-APC. To ensure that the compensation amount of the fan does not change suddenly during the entire compensation phase, the Bezier curve can be determined according to the position vector () of given N + 1 points:
where is the basis function for the following calculation method:
Meanwhile, the Bezier curve should satisfy the following conditions:
If the curve function of the THEC-APC is expressed as P(t), the adjustment amount of one of the corresponding curves is . To prevent sudden changes in the barometric compensation rate at the turning point and to avoid drastically changing the shape of the THEC-APC, two reference points () on both sides of the turning point are selected. These two reference points along with the turning point can be used for the Bezier curve smoothing. The second-order Bezier curve equation connecting these three points can be expressed as:
In the actual high-speed elevator operating cases, the destination floor is not fixed. When the destination floor changes, there will be a pressure difference between the inside and outside of the car, and this will cause the car door to become difficult to open and passengers to feel uncomfortable when the door is opened due to the sudden air flow. To this end, the THEC-APC should be further adjusted, as shown in Figure 9. Suppose a scenario in which a high-speed elevator moves from departure floor a to destination floor b; if the passengers at any time modify the destination floor to floor c, then the curve dynamic adjustment function can be expressed as:
where is the exact time that the target floor changes; and denote each corresponding THEC-APC before dynamic adjustment, respectively; denotes the THEC-APC after dynamic adjustment; and .
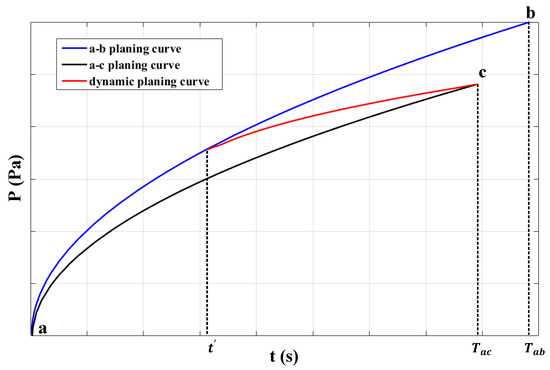
Figure 9.
THEC-APC dynamic adjustment.
5. Numerical Experiment Verification
The KLK2-type high-speed elevator from Canny Elevator Co., Ltd. is utilized as the verification elevator. The proposed method is used in the KLK2 (Canny Elevator Co., Ltd., 2015, Suzhou) high-speed elevator THEC-APC design process. A random generating method is adopted to initial the air pressure parameter samples of the KLK2 elevator car. The initial samples are optimized based on the CMOPSO optimization algorithm. The particles can be expressed as , where k denotes the k-th generation particle population during sample update, i denotes the i-th particle in a specific particle population, and j denotes the j-th steps. To address the problem of the traditional particle swarm algorithm with many parameter settings and irrational parameter values, the CMOPSO algorithm based on a competition mechanism was selected to solve the THEC-APC multi-objective optimization problem. The particle swarm was initiated according to the optimization parameters, with an initial population number of 200 and a termination of iterations number set to 200. The algorithm parameters of CMOPSO and were 0.8. The maximum inertia factor was 1.2 while the minimum inertia factor was 0.1. When the number of iterations was 32, the optimal solution in the offspring population reached the iteration termination condition. The optimal solution of THEC-APC for 100 high-speed elevator cars is shown in Table 2. The height of the selected elevator test tower was 280 m, and the pressure difference between the departure floor and the destination floor was about 3300 Pa. In the verification test, the elevator started from the bottom of the test tower and ran uninterrupted to the top of the test tower. As is illustrated in Section 3, the pressure change of each segment of the segmented adjustment curve was set to a reasonable range of 500–2000 Pa. Therefore, in this verification test, the most reasonable number of segments for the TC-TAPC was three segments, and the eight design parameters that followed are listed in Table 2. Meanwhile, the objective function values for 100 optimal solutions are shown in Table 3.
Table 2.
Optimal solution set for 32th-generation offspring.
Table 3.
Objective function value corresponding to the optimal solution set.
The Pareto optimal solution distribution is shown in Figure 10 after 32 iterations. , , denote the passenger comfort index, energy-saving index, and precision pressure adjustment index, respectively.
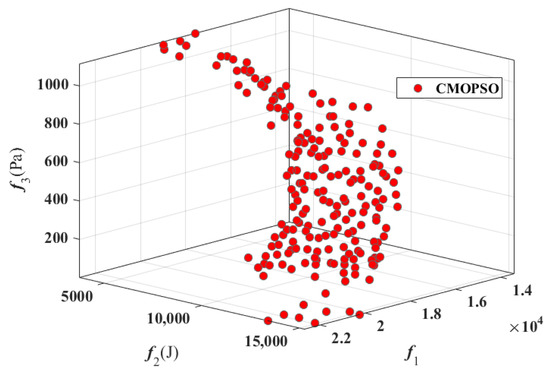
Figure 10.
Pareto optimal solution distribution.
When selecting the optimal solution, the principle of first ensuring the accuracy of the compensation then ensuring passenger comfort should be followed. Therefore, from the 200 optimal solutions obtained, the solution with the smallest difference in internal and external air pressure was selected (with a value of 5.7 Pa). The passenger comfort index (a value of 8921.5) was also acceptable in the optimal solution; meanwhile, the energy-saving index was 28275.6 J, and the precision pressure adjustment index was 5.7 Pa, corresponding to scheme No. 55. The detail of scheme No. 55 is shown in Table 2. The THEC-APC can be determined by the optimized solution, as shown in Figure 10. The smoothed THEC-APC is shown in Figure 11 as well. The comparison results between the optimal stepped-segmentation curve and the non-control curve are shown in Table 4.
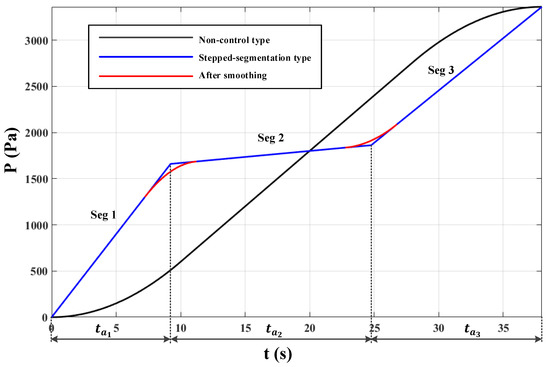
Figure 11.
THEC-APC of the optimal solution.
Table 4.
Comparison results between the optimal stepped-segmentation curve and the non-control curve.
Since the non-control-type curve only requires the exhaust fan to run at a constant speed to achieve the ventilation function, the total accumulation was lower than the segmented adjustment-type curve, and the compensation accuracy index was not much different. The segmented adjustment-type curve was significantly more comfortable for passengers than the non-control-type curve, which proves the practicability of the segmented adjustment-type curve. To ensure that the selected algorithm did not fall into the local optimal solution, two other typical non-dominant genetic algorithms were used to again determine the ideal air pressure adjustment curve of the elevator car and compared with the CMOPSO algorithm. The optimal solutions of each algorithm were selected as shown in Table 5.
Table 5.
Comparison results between the CMOPSO, NSGA-III, and MOPSO algorithms.
Table 5 shows that, based on the same optimal solution selection rules, the evaluation indexes corresponding to the optimal solution obtained by the CMOPSO algorithm were significantly better than the ones obtained by the MOPSO algorithm. At the same time, they were similar to the ones obtained by the NSGA-III algorithm, which proves the reliability and accuracy of the solution obtained by the CMOPSO algorithm. Considering the initialization of the multi-objective optimization algorithm, the certain randomness of the final result, and the subjectivity of the selection rule of the optimal solution, the convergence iterative process of the algorithms needed to be compared again, as shown in Figure 12 and Table 6. Table 6 illustrates that, to obtain the optimal solutions with fewer iteration steps and an acceptable computation time, the CMOPSO algorithm showed a better algorithm performance than the NSGA-III and MOPSO algorithms. (Generation distance (GD) and inverted generation distance (IGD) reflect the similarity degree between the Pareto solution obtained by the algorithm and the real Pareto solution, for which the smaller, the better).
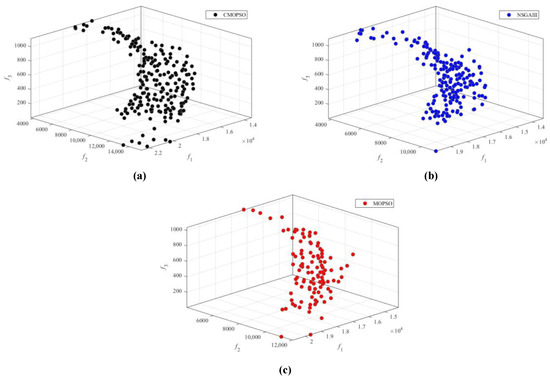
Figure 12.
Comparison of Pareto optimal solution distribution: (a) CMOPSO (b) NSGA-III (c) MOPSO.
Table 6.
Algorithm performance comparison (CMOPSO, NSGA-III, MOPSO).
6. Conclusions
Aiming to solve the problem of air pressure curve design for high-speed elevator cars, a multi-objective optimization method of air pressure curvature was proposed to improve passenger comfort and save energy during elevator operation, as well as to improve the accuracy of air pressure of the flat floor. In the process of designing the multi-objective optimization algorithm, the specific number of influencing factors and their corresponding optimization spaces were determined. The CMOPSO optimization algorithm was implemented to solve the multi-performance optimization of THEC-APC adjustment. The theoretical air pressure adjustment curve of a KLK2 high-speed elevator car was obtained through the calculation of an example, which verified the feasibility of the optimization method.
The results of the numerical experiment in the KLK2 high-speed elevator design process showed that, based on the same optimal solution selection rules, evaluation indexes corresponding to the optimal solution obtained by the CMOPSO algorithm were significantly better than the ones obtained by the MOPSO algorithm. At the same time, they were similar to the ones obtained by the NSGA-III algorithm. This proved the reliability and accuracy of the solution obtained by the CMOPSO algorithm. In addition, with fewer iteration steps and an acceptable computation time, the CMOPSO algorithm proved better in algorithm performance (GD and IGD indexes) than the NSGA-III and MOPSO algorithms.
7. Future Work
Air pressure adjustment in elevator cars is normally realized by an air pressure compensation device, the main components of which are two centrifugal fans with variable frequency adjustments. One of these fans is responsible for sending air into the car, while the other is responsible for exhausting air outside the car. The air pressure in the car changes according to a certain rule, and the air pressure compensation device has been applied and verified on products of elevator companies such as Hitachi and Mitsubishi. In follow-up work, we will build an air pressure compensation system with dual fans, study the control method used in the structural design of the system, and use various sensors to change the air pressure in the car for passenger comfort. Therefore, the theory mentioned in this article can be applied to practical elevator car air pressure control.
Author Contributions
Conceptualization, L.Q.; methodology, Z.W.; software, H.Z.; validation, W.L. and L.Z.; formal analysis, L.Q., H.Z. and Z.W.; investigation, L.Q., Z.W., W.L. and S.Z.; resources, W.L., S.Z. and L.Z.; data curation, H.Z.; writing—original draft preparation, H.Z.; writing—review and editing, Z.W.; visualization, H.Z. and Z.W.; supervision, Z.W.; project administration, L.Q. and Z.W.; funding acquisition, Z.W. All authors have read and agreed to the published version of the manuscript.
Funding
This work has been funded by the National Natural Science Foundation of China (51905476), the Jiangsu Province Science and Technology Achievement Transforming Fund Project (BA2018083).
Conflicts of Interest
No conflict of interest exits in the submission of this manuscript.
Data Availability Statement
The data used to support the findings of this study are available from the corresponding author upon request.
References
- Ding, B.; Zhang, Y.-M.; Peng, X.-Y.; Li, Q.-C.; Tang, H.-Y. A hybrid approach for the analysis and prediction of elevator passenger flow in an office building. Autom. Constr. 2013, 35, 69–78. [Google Scholar] [CrossRef]
- Al-Sharif, L.; Abu Alqumsan, A.M.; Aal, O.F.A. Automated optimal design methodology of elevator systems using rules and graphical methods (the HARint plane). Build. Serv. Eng. Res. Technol. 2012, 34, 275–293. [Google Scholar] [CrossRef]
- Pepyne, D.L.; Cassandras, C.G. Design and implementation of an adaptive dispatching controller for elevator systems during up-peak traffic. IEEE Trans. Control Syst. Technol. 1998, 6, 635–650. [Google Scholar] [CrossRef][Green Version]
- Cortés, P.; Onieva, L.; Muñuzuri, J.; Guadix, J. A viral system algorithm to optimize the car dispatching in elevator group control systems of tall buildings. Comput. Ind. Eng. 2013, 64, 403–411. [Google Scholar] [CrossRef]
- Biotto, C.; Proverbio, A.; Ajewole, O.; Waterson, N.P.; Peiró, J. On the treatment of transient area variation in 1D discontinuous Galerkin simulations of train-induced pressure waves in tunnels. Int. J. Numer. Methods Fluids 2012, 71, 151–174. [Google Scholar] [CrossRef]
- Yoon, T.; Lee, S. Efficient prediction methods for the micro-pressure wave from a high-speed train entering a tunnel using the Kirchhoff formulation. J. Acoust. Soc. Am. 2001, 110, 2379–2389. [Google Scholar] [CrossRef] [PubMed]
- Linic, S.; Ocokoljic, G.; Ristic, S.; Lucanin, V.; Kozić, M.; Rašuo, B.; Jegdić, B. Boundary-layer transition detection by thermography and numerical method around bionic train model in wind tunnel test. Therm. Sci. 2018, 22, 1137–1148. [Google Scholar] [CrossRef]
- Anthoine, J. Alleviation of Pressure Rise from a High-Speed Train Entering a Tunnel. AIAA J. 2009, 47, 2132–2142. [Google Scholar] [CrossRef]
- Schwanitz, S.; Wittkowski, M.; Rolny, V.; Samel, C.; Basner, M. Continuous assessments of pressure comfort on a train—A field-laboratory comparison. Appl. Ergon. 2013, 44, 11–17. [Google Scholar] [CrossRef]
- Diedrichs, B.; Krajnović, S.; Berg, M. On The Aerodynamics of Car Body Vibrations of High-Speed Trains Cruising Inside Tunnels. Eng. Appl. Comput. Fluid Mech. 2008, 2, 51–75. [Google Scholar] [CrossRef]
- Bai, H.; Shen, G.; So, A. Experimental-based study of the aerodynamics of super-high-speed elevators. Build. Serv. Eng. Res. Technol. 2005, 26, 129–143. [Google Scholar] [CrossRef]
- Duan, Y.; Shen, G.X.; Zhang, Y.G. Aerodynamic testing simulation facility for high-speed elevator. J. Beijing Univ. Aeronaut. Astronaut. 2004, 30, 444–447. [Google Scholar]
- Zhu, W.; Teppo, L. Design and analysis of a scaled model of a high-rise, high-speed elevator. J. Sound Vib. 2003, 264, 707–731. [Google Scholar] [CrossRef]
- Shi, L.-Q.; Liu, Y.-Z.; Jin, S.-Y.; Cao, Z.-M. Numerical Simulation of Unsteady Turbulent Flow Induced by Two-Dimensional Elevator Car and Counter Weight System. J. Hydrodyn. 2007, 19, 720–725. [Google Scholar] [CrossRef]
- Matsuda, H. Cause and modification of the aerodynamic noise on high speed elevator. J. INCE Jpn. 1994, 18, 32–36. [Google Scholar]
- Wang, X.; Lin, Z.; Tang, P.; Ling, Z. Research of the blockage ratio on the aerodynamic performances of high speed elevator. In Proceedings of the 2015 4th International Conference on Mechatronics, Materials, Chemistry and Computer Engineering, Xi’an, China, 12–13 December 2015; Atlantis Press: Paris, France, 2015. [Google Scholar]
- Taplak, H.; Erkaya, S.; Yildirim, Ş.; Uzmay, I.; Yıldırım, Ş. The Use of Neural Network Predictors for Analyzing the Elevator Vibrations. Arab. J. Sci. Eng. 2013, 39, 1157–1170. [Google Scholar] [CrossRef]
- Jiang, X.; Rui, Y. Research on vibration Control of traction elevator. In Proceedings of the 2015 International Industrial Informatics and Computer Engineering Conference, Xi’an, China, 10–11 January 2015; Atlantis Press: Paris, France, 2015. [Google Scholar]
- Zhang, Q.; Yang, Z.; Wang, C.; Yang, Y.; Zhang, R. Intelligent control of active shock absorber for high-speed elevator car. Proc. Inst. Mech. Eng. Part C J. Mech. Eng. Sci. 2018, 233, 3804–3815. [Google Scholar] [CrossRef]
- Tusset, A.M.; Santo, D.R.; Balthazar, J.M.; Piccirillo, V.; Santos, L.C.C.D.; Brasil, R.M.L.R.F. Active vibration control of an elevator system using magnetorheological damper actuator. Int. J. Nonlinear Dyn. Control. 2017, 1, 114–131. [Google Scholar] [CrossRef]
- Yang, I.-H.; Jeong, J.-E.; Jeong, U.-C.; Kim, J.-S.; Oh, J.-E. Improvement of noise reduction performance for a high-speed elevator using modified active noise control. Appl. Acoust. 2014, 79, 58–68. [Google Scholar] [CrossRef]
- Kawasaki, R.; Hironaka, Y.; Tanaka, T.; Daikoku, A.; Hasegawa, S.; Nishimura, M. Noise and Vibration Analysis of Elevator Traction Machine(Mechanical Systems). Trans. Jpn. Soc. Mech. Eng. Ser. C 2010, 76, 2032–2038. [Google Scholar] [CrossRef][Green Version]
- Xiao, J.; Xie, J.; Chen, X.; Yu, K.; Chen, Z.; Luan, K. Robust Optimization of Power Consumption for Public Buildings Considering Forecasting Uncertainty of Environmental Factors. Energies 2018, 11, 3075. [Google Scholar] [CrossRef]
- Bilbao, E.; Barrade, P.; Etxeberria-Otadui, I.; Rufer, A.; Luri, S.; Gil, I. Optimal Energy Management Strategy of an Improved Elevator With Energy Storage Capacity Based on Dynamic Programming. IEEE Trans. Ind. Appl. 2013, 50, 1233–1244. [Google Scholar] [CrossRef]
- He, J.; Mao, C.; Lu, J.; Yang, J. Design and Implementation of an Energy Feedback Digital Device Used in Elevator. IEEE Trans. Ind. Electron. 2011, 58, 4636–4642. [Google Scholar] [CrossRef]
- Hu, Z.; Liu, Y.; Su, Q.; Huo, J. A multi-objective genetic algorithm designed for energy saving of the elevator system with complete information. In Proceedings of the 2010 IEEE International Energy Conference, Manama, Bahrain, 18−22 December 2010; pp. 126–130. [Google Scholar]
- Zhang, J.; Zong, Q. Energy-saving scheduling optimization under up-peak traffic for group elevator system in building. Energy Build. 2013, 66, 495–504. [Google Scholar] [CrossRef]
- Zhang, J.; Zong, Q. Energy-saving-oriented group-elevator dispatching strategy for multi-traffic patterns. Build. Serv. Eng. Res. Technol. 2014, 35, 543–568. [Google Scholar] [CrossRef]
- Desdouits, C.; Alamir, M.; Boutin, V.; Le Pape, C. Multisource elevator energy optimization and control. In Proceedings of the 2015 European Control Conference (ECC), Linz, Austria, 15−17 July 2015; pp. 2315–2320. [Google Scholar]
- Zhang, Y.; Yan, Z.; Yuan, P.F.; Yao, J.; Ding, B. A Novel Reconstruction Approach to Elevator Energy Conservation Based on a DC Micro-Grid in High-Rise Buildings. Energies 2018, 12, 33. [Google Scholar] [CrossRef]
- Kobayashi, N.; Kawase, K.; Sato, S.; Nakagawa, T. Experimental Verification of Effects in an Emergency Stop by Installation of Magnetorheological Fluid Damper to an Elevator. IEEE Trans. Magn. 2017, 53, 1–4. [Google Scholar] [CrossRef]
- Wang, G.; Wang, B.; Li, C.; Xu, D. Weight-transducerless control strategy based on active disturbance rejection theory for gearless elevator drives. IET Electr. Power Appl. 2017, 11, 289–299. [Google Scholar] [CrossRef]
- Yang, Z.; Zhang, Q.; Zhang, R.; Zhang, L. Transverse Vibration Response of a Super High-Speed Elevator under Air Disturbance. Int. J. Struct. Stab. Dyn. 2019, 19, 1950103. [Google Scholar] [CrossRef]
- Zhang, Q.; Yang, Y.-H.; Hou, T.; Zhang, R.-J. Dynamic analysis of high-speed traction elevator and traction car–rope time-varying system. Noise Vib. Worldw. 2019, 50, 37–45. [Google Scholar] [CrossRef]
- Smith, R.; Palazzola, M.A.; Allen, S.D.; Frank, D.; Xu, J. Linear Motor for an Elevator; ThyssenKrupp Elevator AG: Essen, Germany, 2016; EP17708489.4. [Google Scholar]
- Ando, H.; Sudo, K.; Miyoshi, W.; Miyada, H. Elevator Equipment and its Pressure Control Method; State Intellectual Property Office Intellectual Property Press: Beijing, China, 2007; CN200810184378.6. [Google Scholar]
- Hekun, Y.; Shi, W.L.; Hagiwara, T.; Miyada, H.; Miyoshi, W. Control Method of Internal Pressure of Elevator Car; State Intellectual Property Office Intellectual Property Press: Beijing, China, 2016; CN201610453048.7. [Google Scholar]
- Yamamoto, K.; Shinji, L.; Suzuki, I. Elevator Air Pressure Control Device. United States. Mitsubishi Electric Corporation (Tokyo, JP). 9017153. Available online: http://www.freepatentsonline.com/9017153.html (accessed on 28 April 2015).
- Fuller, J.W. Control of pressure—Comfort and motion in mega-rise elevators. Elev. World 1999, 47, 148–157. [Google Scholar]
- Funai, K.; Hayashi, Y.; Koizumi, T.; Tsujiuchi, N. Analysis of tympanic membrane behavior and ear pressure discomfort for super high speed elevators. Elev. World 2006, 54, 50–60. [Google Scholar]
- Li, L. Selected Applications of Convex Optimization; Springer Science and Business Media LLC: Berlin/Heidelberg, Germany, 2015. [Google Scholar]
- Zhang, X.; Zheng, X.; Cheng, R.; Qiu, J.; Jin, Y. A competitive mechanism based multi-objective particle swarm optimizer with fast convergence. Inf. Sci. 2018, 427, 63–76. [Google Scholar] [CrossRef]


© 2020 by the authors. Licensee MDPI, Basel, Switzerland. This article is an open access article distributed under the terms and conditions of the Creative Commons Attribution (CC BY) license (http://creativecommons.org/licenses/by/4.0/).