Article

Operational Profile Based Optimization Method for Maritime Diesel Engines

1
Department of Electrical Engineering and Automation, School of Electrical Engineering, Aalto University, 02600 Espo, Finland
2
School of Technology and Innovation, University of Vaasa, 65200 Vaasa, Finland
3
Engine Research and Technology Development, Wärtsila Marine Solutions, 65200 Vaasa, Finland
*
Author to whom correspondence should be addressed.
Energies 2020, 13(10), 2575; https://doi.org/10.3390/en13102575
Submission received: 27 April 2020 / Revised: 15 May 2020 / Accepted: 18 May 2020 / Published: 19 May 2020
(This article belongs to the Section B: Energy and Environment)

Abstract

:
This paper presents an approach to a new engine calibration method that takes the engine’s operational profile into account. This method has two main steps: modeling and optimization. The Design of Experiments method is first conducted to model the engine’s responses such as Brake Specific Fuel Consumption (BSFC) and Nitrogen Oxide ( N O x ) emissions as the functions of fuel injection timing, common rail pressure and charged air pressure. These response surface models are then used to minimize the fuel consumption during a year, according to a typical load profile of a ferry, and to fulfill the N O x limits set by International Maritime Organization (IMO) regulations, Tier II, test cycle E2. The Sequential Quadratic Programming algorithm is used to solve this minimization problem. The results showed that the fuel consumption can be effectively reduced with the flexibility to trade it off with the N O x emissions while still fulfilling the IMO regulations. In general, this method can decrease the manual calibration effort and improve the engine’s performance with a tailored setting for individual operational profiles.

Graphical Abstract

1. Introduction and Motivation

Engine calibration is a process consisting of a large effort to optimize a large number of parameters in order to achieve the desired engine performance. This process refers to the control of the engine’s actuators to yield optimal performance and fuel economy while fulfilling emission legislation. Static maps (look-up tables), which store the values of engine’s optimal control values, have been a common control strategy in the internal combustion engine industry. Finding these optimal maps is important but challenging for the manufacturers. Much research has been conducted over the years to solve the problem with different optimization and searching methods.
The research in [1] proposed an optimization method using univariate search in which each input factor is varied at a time until the search does not provide any significant reduction in the objective function [2]. It is an exhaustive and inefficient method because only one factor is varied at a time and it requires that all varied factors are independent, which might lead to finding the local minimum not the global minimum. Advanced methods such as neural networks or genetic algorithms have been applied earlier in [3,4,5,6]. These types of methods provide a good solution for the optimization problems but they are not convenient and suitable for large engine research because they need to have a large amount of data to be able to learn the system and find an optimum. Large engines always require much time and human labor to operate. It also takes time for the measurement to be stable before recording.
Furthermore, there are two efficient and similar searching methods which are the Folding, Shrinking Hyper Parallelepiped (FSHP) search (proposed in [7]) and the Response Surface Methods (RSM). Optimization using the RSM has been presented in [8,9,10]. In both methods, different level fractional factorial experiments are conducted which then allow the objective function to be represented in a hypersurface. The experiments are often designed by statistical design methods such as the Design of Experiments (DoE) method. The hypersurface should contain the entire parameter domain of interest and the evaluation of the objective function can be proceeded from point to point and covers all corners of the hypersurface. These searching methods assure that the optimum point is global because all factors are investigated at once and interactions between factors are taken into account. Moreover, they are also more efficient than the neural networks and the genetic algorithms methods as there are fewer experiments needed (the number of experiments depends on the selection of the level of fraction). Thus, this research was conducted using a similar response surface method.
Nevertheless, in the above mentioned research, the emission legislation aspect was not clearly discussed and operational profile based optimization has not been considered. In some applications such as base load power plants, engines run at constant and steady state conditions while in other fields engines have to perform in a broader speed and load range. For many marine applications, engines operate in a broad operating profile (Figure 1 shows an example of percentual running time at various engine power loads for a diesel-electric propulsion system in a specific ferry) and a hardware set with fixed control system gives little opportunity for a good optimization. Utilizing the situation by optimizing the engines for different operating profiles can bring benefits on fuel saving and yet fulfill the emission regulations [11]. Engine optimization considering the operational profile has been little investigated. Recently, Knafl et al. [12] introduced an optimization algorithm for air- and fuel-path using operational profiles in medium-speed diesel engines. The work has solved very well the optimization problem and even taken the IMO emission regulations into account. However, the method was not presented clearly due to confidentiality reasons.
This research presents an operational profile based diesel engine optimization method, specifically targeting to large bore, medium-speed diesel engines used in marine transportation and in stationary power plants. The fundamental optimization algorithm is inherited from the proposed method in [13] and then extended in this work with the presence of engine’s operational profiles. The IMO emission regulation for Nitrogen Oxide ( N O x ) is taken as nonlinear constraint for the optimization. However, a key issue to note is that the N O x constraint is not given in advance. It can vary as long as it fulfills the IMO constraint over the whole operation range of the engine.
The aim of this study is to prove that by using operational profile based optimization method, the fuel consumption over the whole engine’s working cycle can be effectively reduced without exceeding the IMO N O x limits.
The remainder of this paper is structured as follows. Section 2 presents the problem formulation and the IMO emission regulations. In Section 3, the operational profile based optimization algorithm is presented alongside with the engine test bed configuration. The optimization results and detailed analysis results are shown in Section 4. Section 5 discusses possible improvements and future works. Conclusion of the paper is given in Section 6.

2. Problem Formulation

There is a vast number of input parameters which can affect the engine’s performance, but in this paper the following three parameters are investigated: the charged air pressure P c h a r g e , the fuel injection pressure F I P and the start of injection S o I . The brake specific fuel consumption (BSFC) is used as the engine’s output response and the nitrogen oxide ( N O x ) emissions are the optimization constraints. The output response and the constraints are chosen according to the aim of the research as to reduce the fuel consumption and to fulfill the emission regulations. The input parameters are considered as the ones which have significant effects on the fuel consumption and emission production. Moreover, these inputs are accessible and measurable in the test site.
Each of the inputs has different impacts on the fuel consumption and the emissions produced. The charged air pressure can be set to a high value to increase the efficiency of combustion and to reduce the unburned components [14] but too high pressure can boost the N O x formation [15]. High injection pressure can increase the fuel economy but increases the N O x emissions at the same time [16]. Early injection timing can increase in-cylinder pressure, temperature and hence increase the N O x formation while a later injection timing reverses the results [17]. However, using early injection increases the engine’s efficiency and reduces the fuel consumption. Due to the direct trade-off between the fuel consumption and the N O x formation, attempt to overminimize one of them will lead to failure in fuel economy (too low N O x , too high BSFC) or problems in fulfilling emission regulations (too low BSFC, too high N O x ). In this study, the N O x emissions are considered as constraints for the BSFC minimization problem to meet the IMO regulations.
Emissions limits for international maritime engine applications are published by the International Maritime Organization (IMO) in the revised MARPOL annex VI, “Regulations for the prevention of air pollution from ships” [18]. N O x emissions limits for Tier II and III are shown in Figure 2, although in this paper only Tier II is studied and its limit is defined in Equation (1).
N O x = 44 w 0.23 ( g / kWh )
in which w is the rated speed in revolution per minute (rpm). Based on the engine application, a test cycle consists of a number of stationary test points with individual weighting factors defined. Test cycle E2 (Constant-speed main propulsion application including diesel-electric drive and all controllable-pitch propeller installations) was chosen with the following test points and weighting factors in Table 1.
The test cycle is conducted in a way that the engine is operated at the four operating test points in Table 1 and the N O x production at each point is recorded. The weighted sum of N O x emissions level over the E-2 test cycle as calculated in Equation (2) is then compared to the respective Tier II limit.
N O x = 0.15 n 1 + 0.15 n 2 + 0.5 n 3 + 0.2 n 4
in which n 1 , n 2 , n 3 , n 4 are the N O x levels (g/kWh) at the test points in Table 1, respectively. An example set of experiment values of n 1 , n 2 , n 3 , n 4 with corresponding loads are shown in Figure 3.
N O x limits for other loads which are outside of the E2 test cycle are expected to lie on the line connecting the limits from the E2 test cycle (to be called N O x line). Each unique set of [ n 1 , n 2 , n 3 , n 4 ] results in a different N O x line and hence creates a new set of N O x limits for the whole power range (Figure 4). Figure 4 shows three different example sets of N O x production. It indicates that with different engine settings, the N O x productions at each of the four points in the E2 test cycle are different but the weighted sum of N O x emissions of each setting still fulfills the IMO Tier II regulations.
Since the N O x emissions are used as the constraints in the fuel consumption optimization, different sets of N O x lines affect the optimization results differently. For example, too strict limits may cause the fuel consumption to raise up. The goal is to find an optimal N O x limit set that can minimize the fuel consumption while fulfilling the IMO Tier II regulation.
This paper introduces an approach to determine the best N O x limit set based on the IMO Tier II emission regulations and then use it as a constraint to solve the fuel consumption minimization problem over the whole working cycle of the engine according to the vessel operational profile.

3. Methodology

3.1. Optimization Methodology

According to the proposed method in [13], by running the Design of Experiments (DoE) method [19] on selected operating points (speed-load), the BSFC and the N O x emissions at each point are presented as the functions of fuel injection timing (SoI), common rail pressure ( F I P ) and charged air pressure ( P c h a r g e ). The two functions are expressed in Equations (3) and (4).
B S F C ( i ) = a 0 + a 1 P c h a r g e + a 2 F I P + a 3 S o I + ( linear ) a 12 P c h a r g e F I P + a 13 P c h a r g e S o I + a 23 F I P S o I + ( interaction ) a 11 P c h a r g e 2 + a 22 F I P 2 + a 33 S o I 2 ( quadratic )
N O x ( i ) = b 0 + b 1 P c h a r g e + b 2 F I P + b 3 S o I + ( linear ) b 12 P c h a r g e F I P + b 13 P c h a r g e S o I + b 23 F I P S o I + ( interaction ) b 11 P c h a r g e 2 + b 22 F I P 2 + b 33 S o I 2 ( quadratic )
where i is an index denoting each selected operation point. Each selected point is then represented by Equations (3) and (4). The optimization problem applying for each selected operating point is stated in Equation (5)
minimize P c h a r g e , F I P , S o I B S F C ( i ) subject to : N O x ( i ) α
This nonlinear constrained minimization problem is solved by using the Sequential Quadratic Programming method [20]. However, the constraint limit α has not been efficiently investigated in [13] as the IMO emission regulations have not been considered. Therefore, the following algorithm introduces a method to fully investigate all possibilities of α in order to achieve the optimal result.

STEP 1

Let f 1 , f 2 , f 3 and f 4 be the functions of N O x emissions at the four points of the test cycle E2. These functions are expressed by using Equation (4) in terms of each triplet of the three main parameters ( P c h a r g e , S o I and F I P ) as follows.
f 1 ( x 1 , x 2 , x 3 ) = f 1 ( P c h a r g e 1 , S o I 1 , F I P 1 ) f 2 ( x 4 , x 5 , x 6 ) = f 2 ( P c h a r g e 2 , S o I 2 , F I P 2 ) f 3 ( x 7 , x 8 , x 9 ) = f 3 ( P c h a r g e 3 , S o I 3 , F I P 3 ) f 4 ( x 10 , x 11 , x 12 ) = f 4 ( P c h a r g e 4 , S o I 4 , F I P 4 )
All variables from x 1 to x 12 are bounded in predefined intervals
l i x i u i for i = 1 , 2 , 3 , , 12
In each of the intervals, k values of x i are selected evenly. Therefore, statistically there are k 3 possible values for each of the functions f 1 , f 2 , f 3 and f 4 . In other words, there are k 3 possible values for each of n 1 , n 2 , n 3 , n 4 mentioned in Section 2 and ( k 3 ) 4 = k 12 possible combinations of [ n 1 , n 2 , n 3 , n 4 ] .

STEP 2

In Step 1, there are k 12 possible combinations of N O x values at the four points of the test cycle E2. However, not all of their weighted sums in Equation (2) can satisfy the IMO Tier II limit in Equation (1). In this step, all combinations whose weighted sums are not smaller than or equal to the IMO limit are eliminated.
For each eligible combination of [ n 1 , n 2 , n 3 , n 4 ] , a N O x line is created similarly as in the example ones in Figure 3. An example of all the eligible N O x lines in the case of k = 4 (meaning 4 12 lines subtracted by the number of eliminated lines) is demonstrated in Figure 5. This figure shows all admissible lines in which the weighted N O x sum of each line (according to Equation (2)) fulfills the IMO Tier II limit.

STEP 3

In this step, each of the eligible N O x lines found in step 2 will be used to solve the optimization problem in Equation (5) iteratively. This minimization problem is applied to a number of chosen operating points which were used to run the DoE method. As mentioned in Section 2, the limit α for the operating points which are outside of the test cycle E2 can now be extracted from the being considered N O x line.

STEP 4

The results in Step 3, after using one N O x line to solve Equation (5), are a set of optimal values of BSFC at the chosen operating points. In order to calculate the fuel consumption during the whole working cycle of the engine, the BSFC values over the whole power range (according to the engine’s operational profile) must be calculated. Therefore, the BSFC values of the whole range are interpolated from the set of optimal BSFC values from step 3. Figure 6 shows an example of the interpolation.

STEP 5

By using the operational profile of an engine (as in Figure 1), the total fuel consumption over a working cycle can be calculated as
i = 1 m B S F C ( i ) × P o w e r ( i ) × T i m e P e r c e n t ( i ) × T o t a l W o r k i n g T i m e
in which:
  • m is the number of points in the operational profile
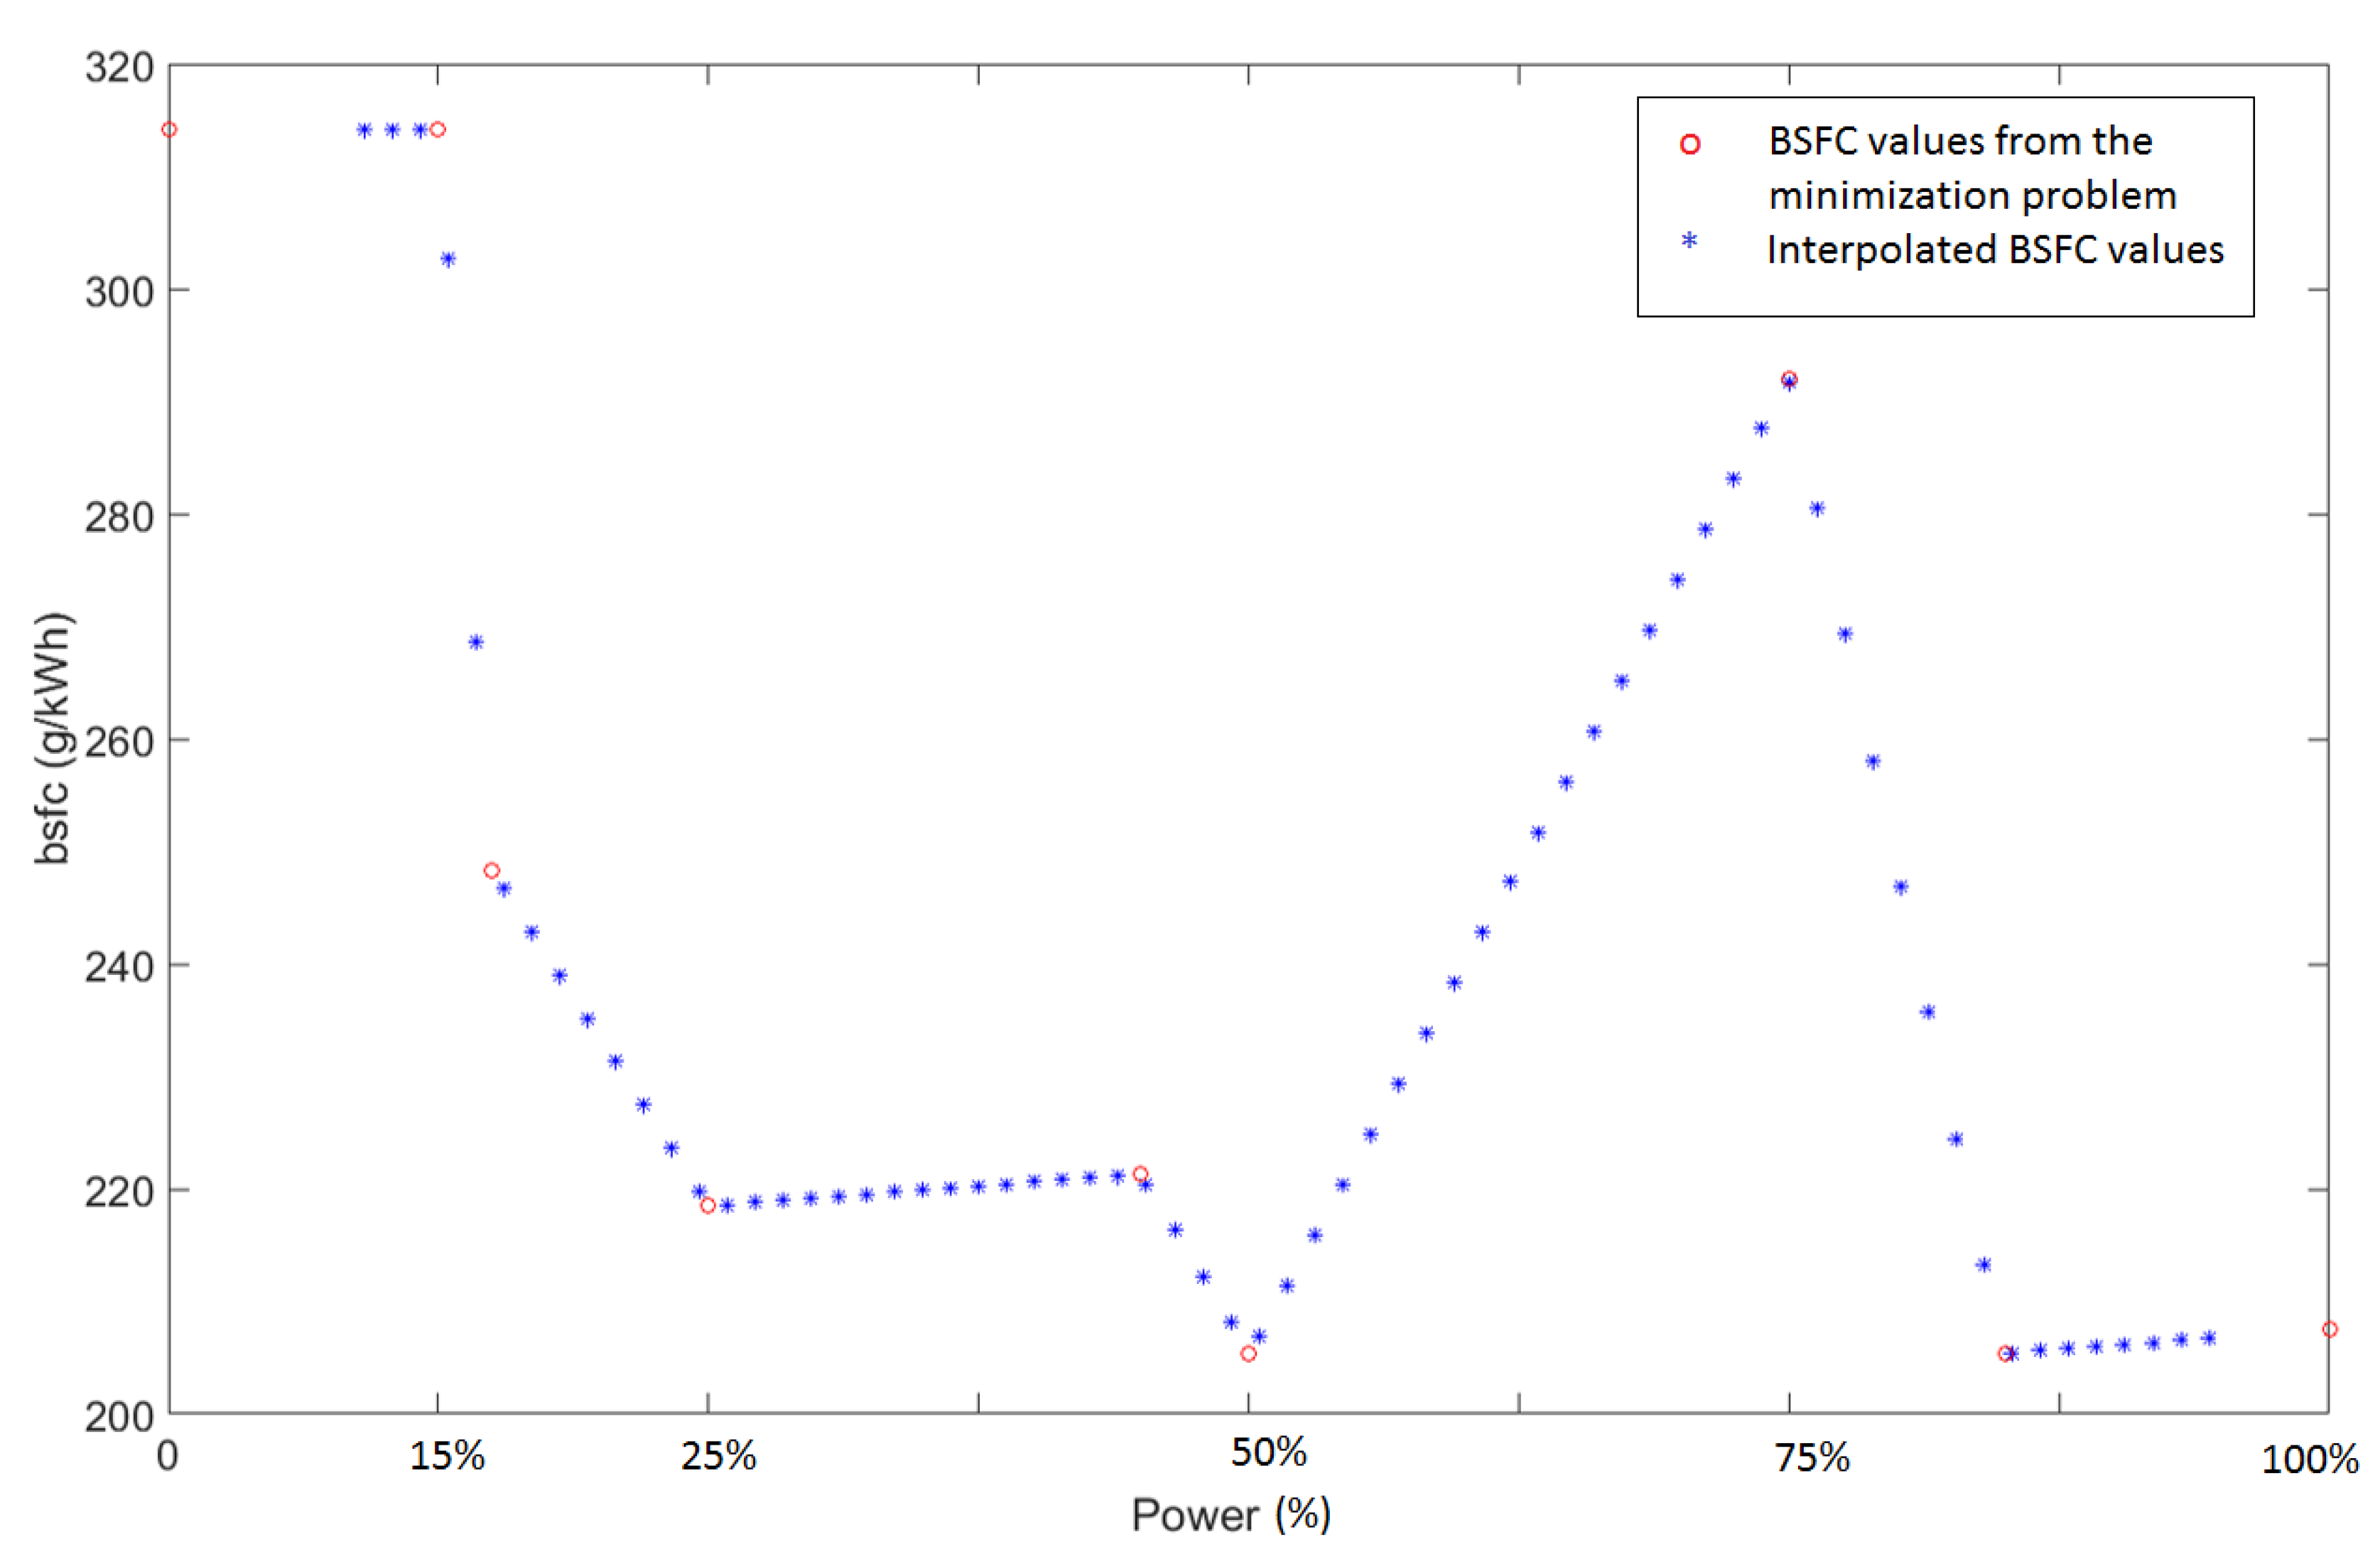
  • BSFC(i) is the values calculated from Step 4 (as in Figure 6) (in g/kWh)
  • Power(i) is the corresponding load (in kW)
  • Time Percent(i) is the running time percentage of the corresponding load (in percent)
  • Total Working Time is total running time in a working cycle (in hours)
The procedure goes back to STEP 3 and starts with another eligible N O x line until the total smallest fuel consumption over a working cycle is found.

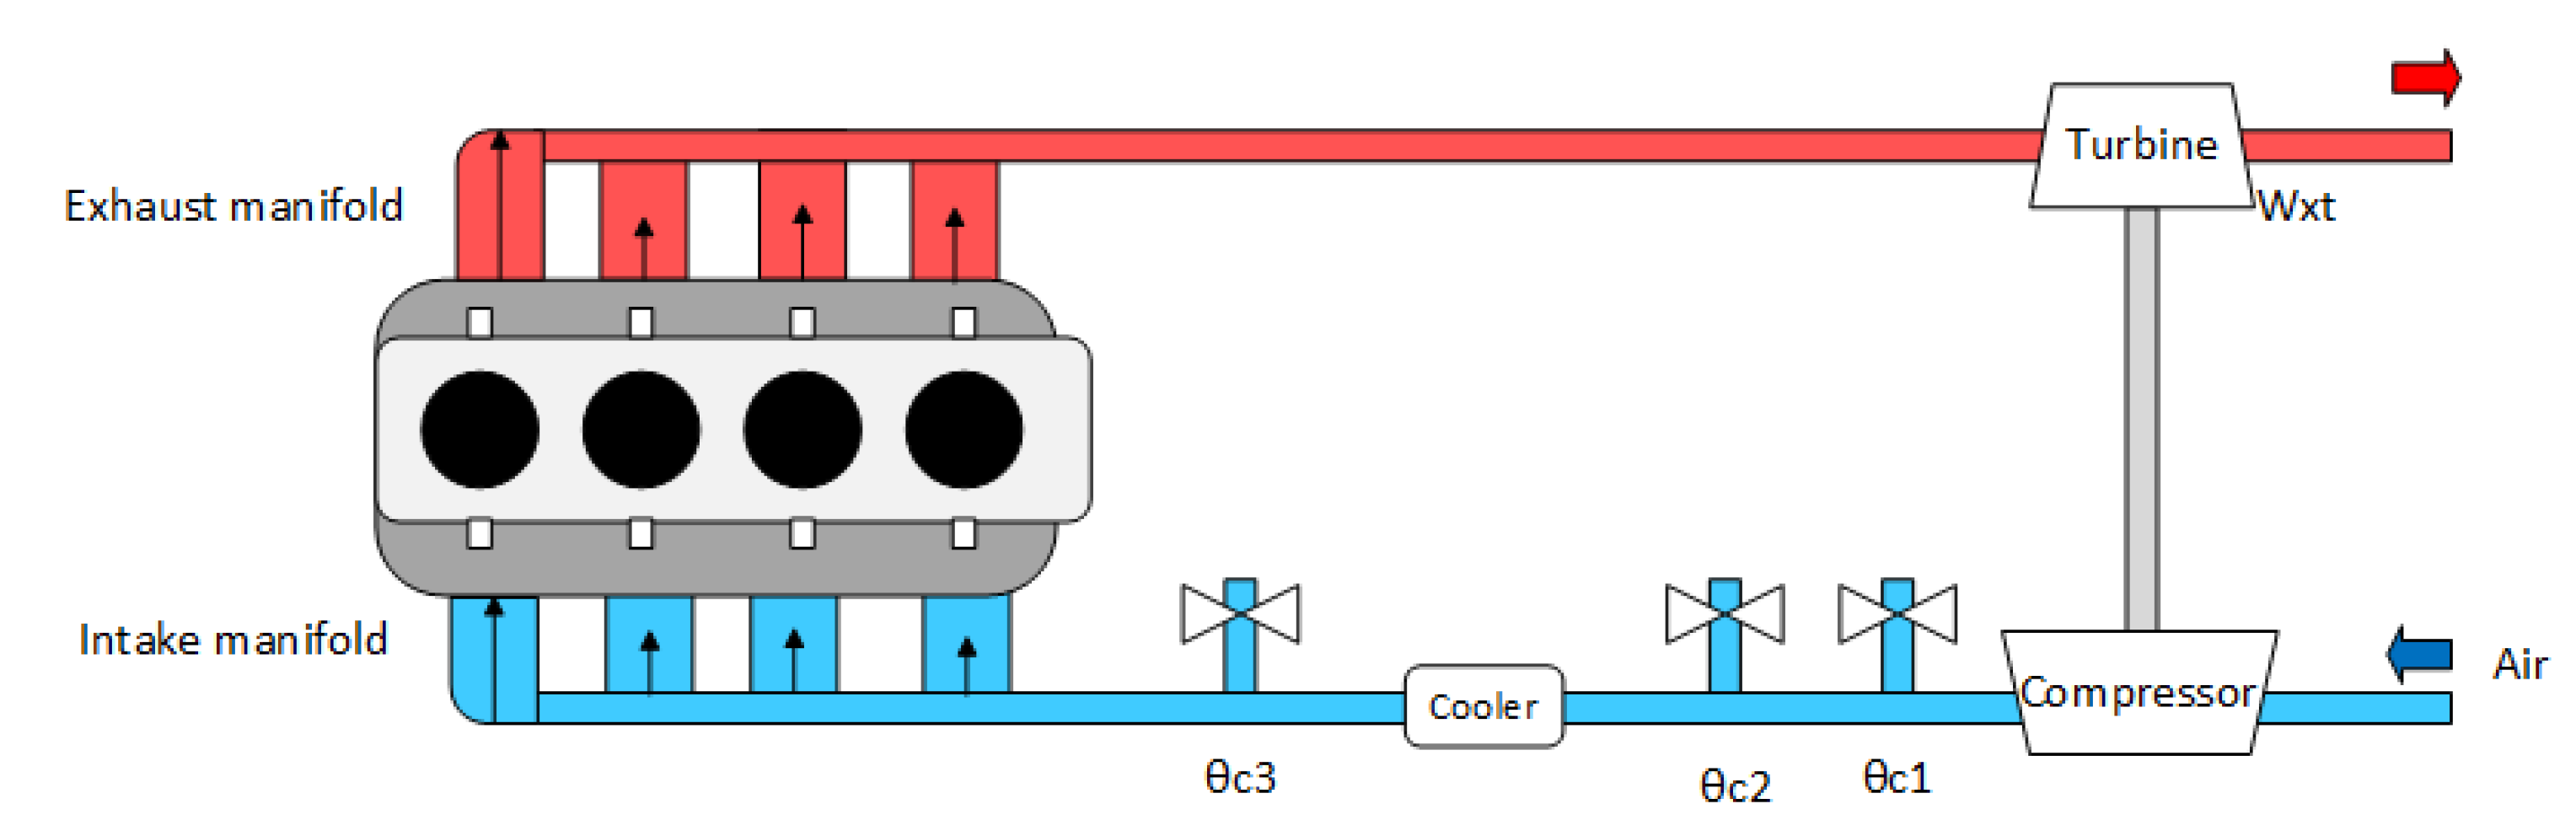
3.2. Experimental Apparatus

The experimental measurements were performed in Vaasa Energy Business Innovation Centre (VEBIC), Finland. The engine used is a 4 cylinders Wärtsilä line engine which is of 200 mm bore diameter common rail diesel engine (4L20). It is connected to an ABB generator, a frequency converter and running against the local electrical grid. The test fuel is the commercial light fuel oil (LFO). The main specification of the test engine is given in Table 2.
This Wärtsilä 4L20 engine is equipped with 4 Kistler piezoelectric cylinder pressure sensors, 4 exhaust temperature sensors, one stage fixed geometry exhaust gas driven turbocharger, intake air pressure and temperature measurement system and a fuel consumption measurement system. However, there is no exhaust after-treatment systems and waste-gate installed. The analytic instruments used during this work are listed in Table 3.
The fuel injection system is a common rail system with solenoid injectors. The common rail pressure ( F I P ) is regulated with an inlet-metering valve, positioned prior to a fuel pump. Air controlled circulation valve allows fuel to flow through the system, while the overpressure release valve ensures the pressure safety working range. Fuel injection timings ( S o I ) and duration are determined by the current pulses sent to the injectors which are controlled by Wärtsilä indoor hardware platform. The charge air pressure ( P c h a r g e ) is manually controlled by the three valves installed before and after the charge air cooler. As shown in Figure 7, two valves are installed before charge air cooler, the diameters being 25 mm ( ϕ c 1 and ϕ c 2 ); the other one is installed after the charge air cooler with a diameter of 12 mm ( ϕ c 3 ). The valves were opened according to the required charge air pressure.
Upon each test day, the instrumentation and engine were first warmed up, then during the test the engine was set at the test speeds, loads, F I P , P c h a r g e , S O I and allowed to stabilize for a sufficient amount of time before the necessary results were recorded. The fuel oil mass flow M g/s is measured through HBM weight cell, Sartorius X3 as listed in Table 3 and from this the BSFC is calculated according to M 3600 / l o a d . Here the fuel oil mass flow is measured as an average during 5 minutes of engine run. Engine torque is measured through HBM torque flange, and load is calculated from this. S O I is monitored through a current probe. The emission measurements data were obtained manually from the instruments listed in Table 3 and it is processed according to the ISO 8178 standard with the simultaneously measured ambient condition.
According to the method in [13], the DoE test plan is made based on the operating range of the engine shown in Table 4, where the selected 14 test points are marked by “✓”.
Every operating point is tested for 13 runs according to the Box–Behnken design method described in [13]. The levels of the parameters SoI, P c h a r g e and FIP are decided based on the engine’s nominal values. Those selected levels are also verified based on the engine performance by running and changing each parameter level at a time. Therefore, in every operating point, first the nominal state is executed, then the higher and lower levels are tackled manually by monitoring the related engine operating characteristics. Afterward, the 13 runs are carried out one by one, and thus the whole test consists of 182 (14 × 13) runs.

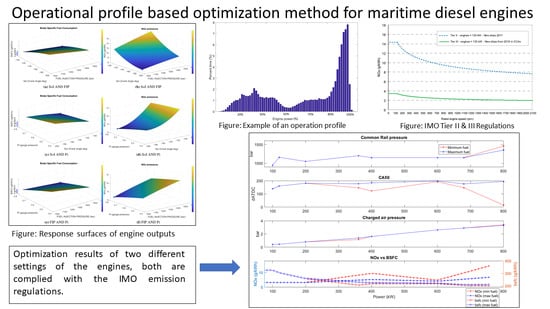
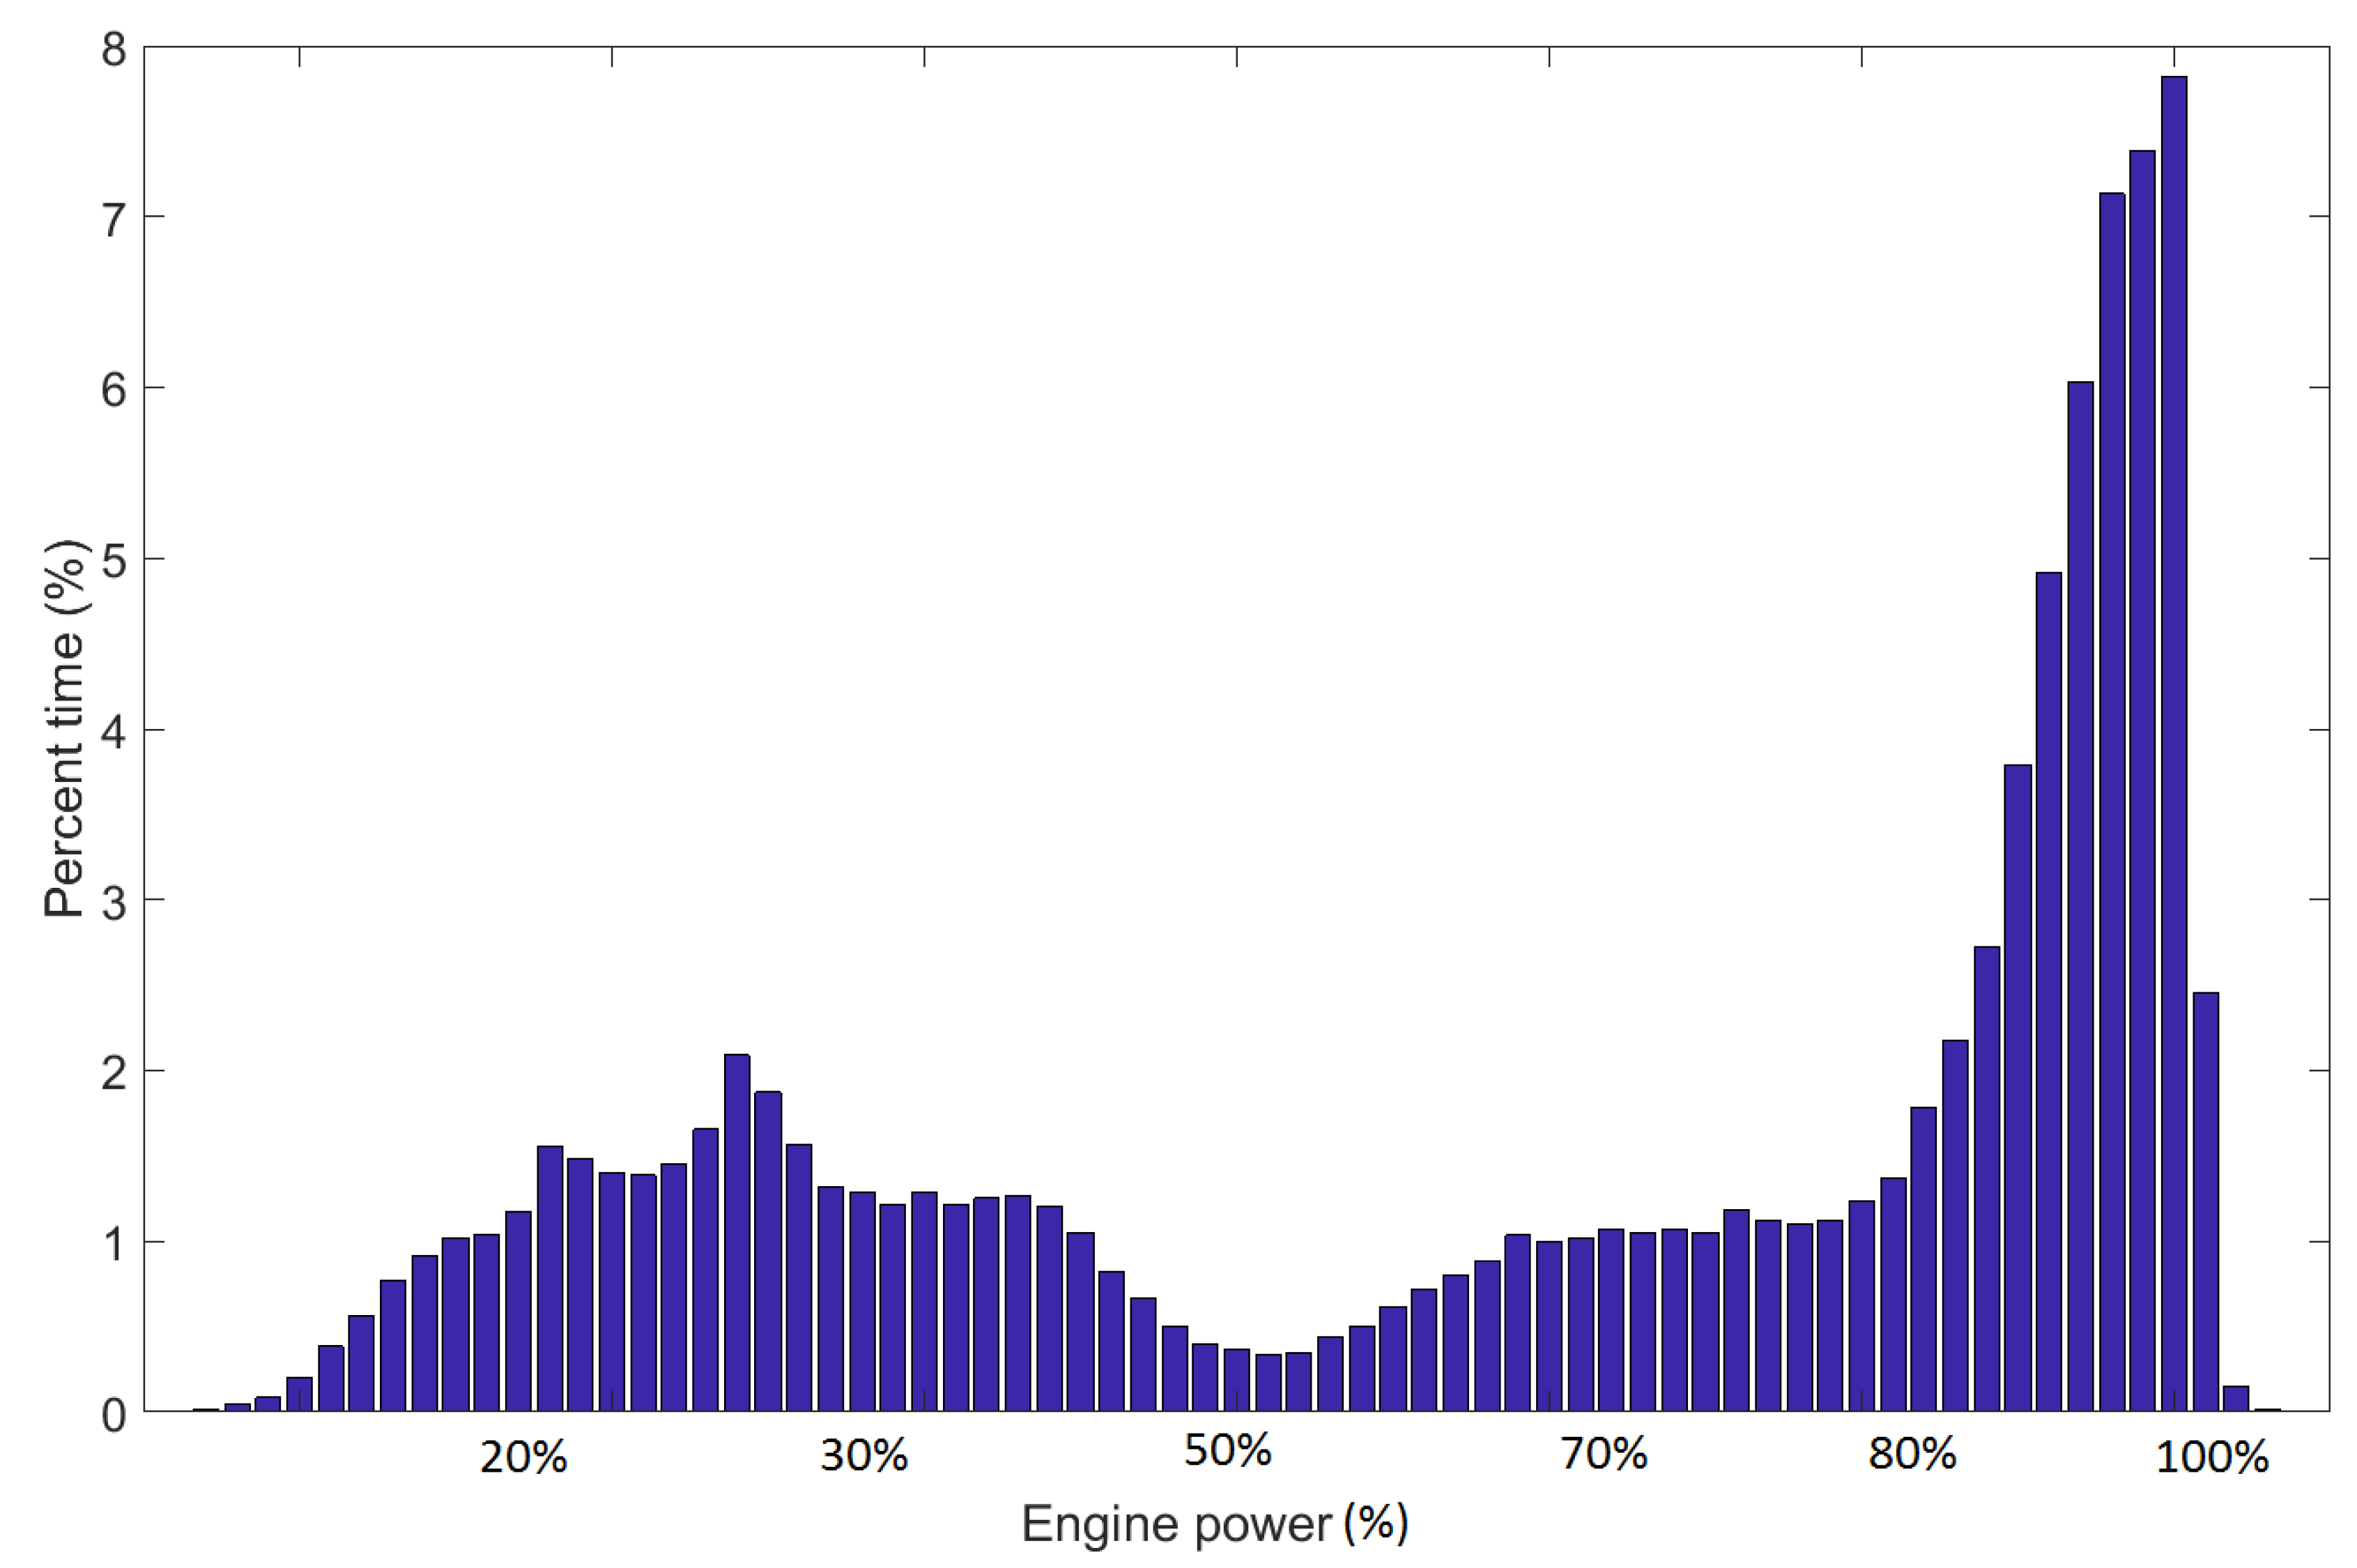
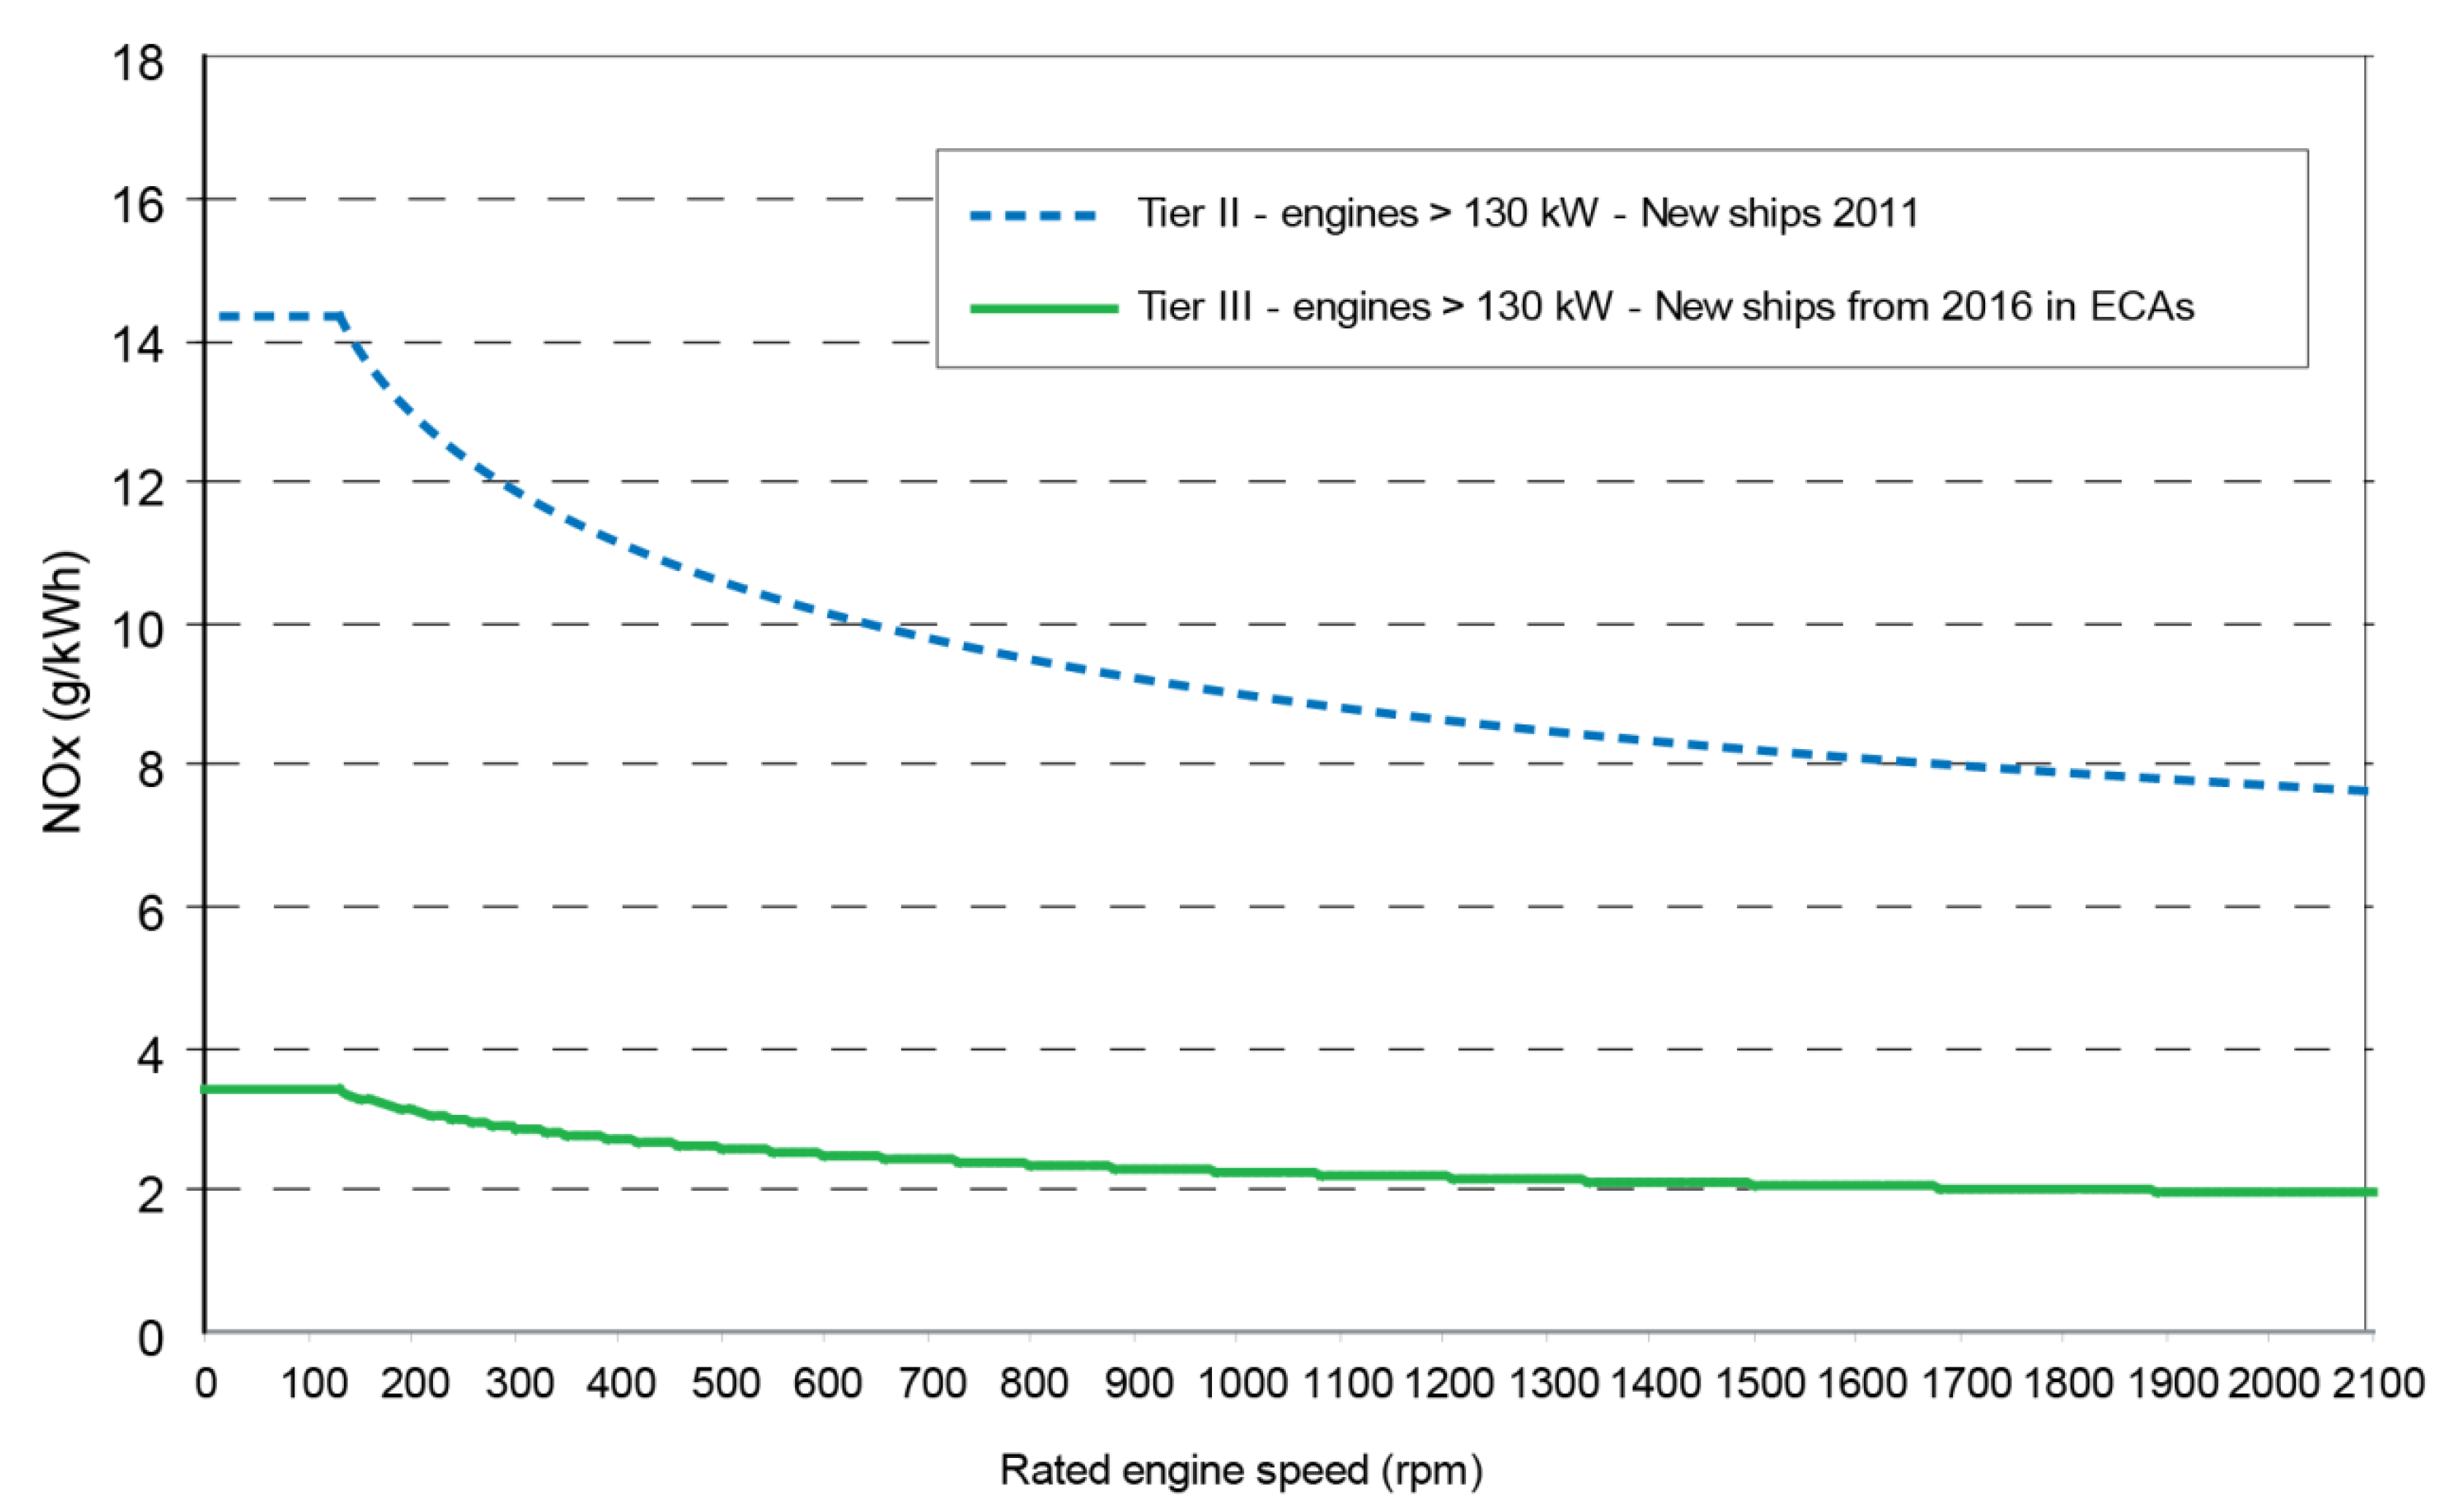
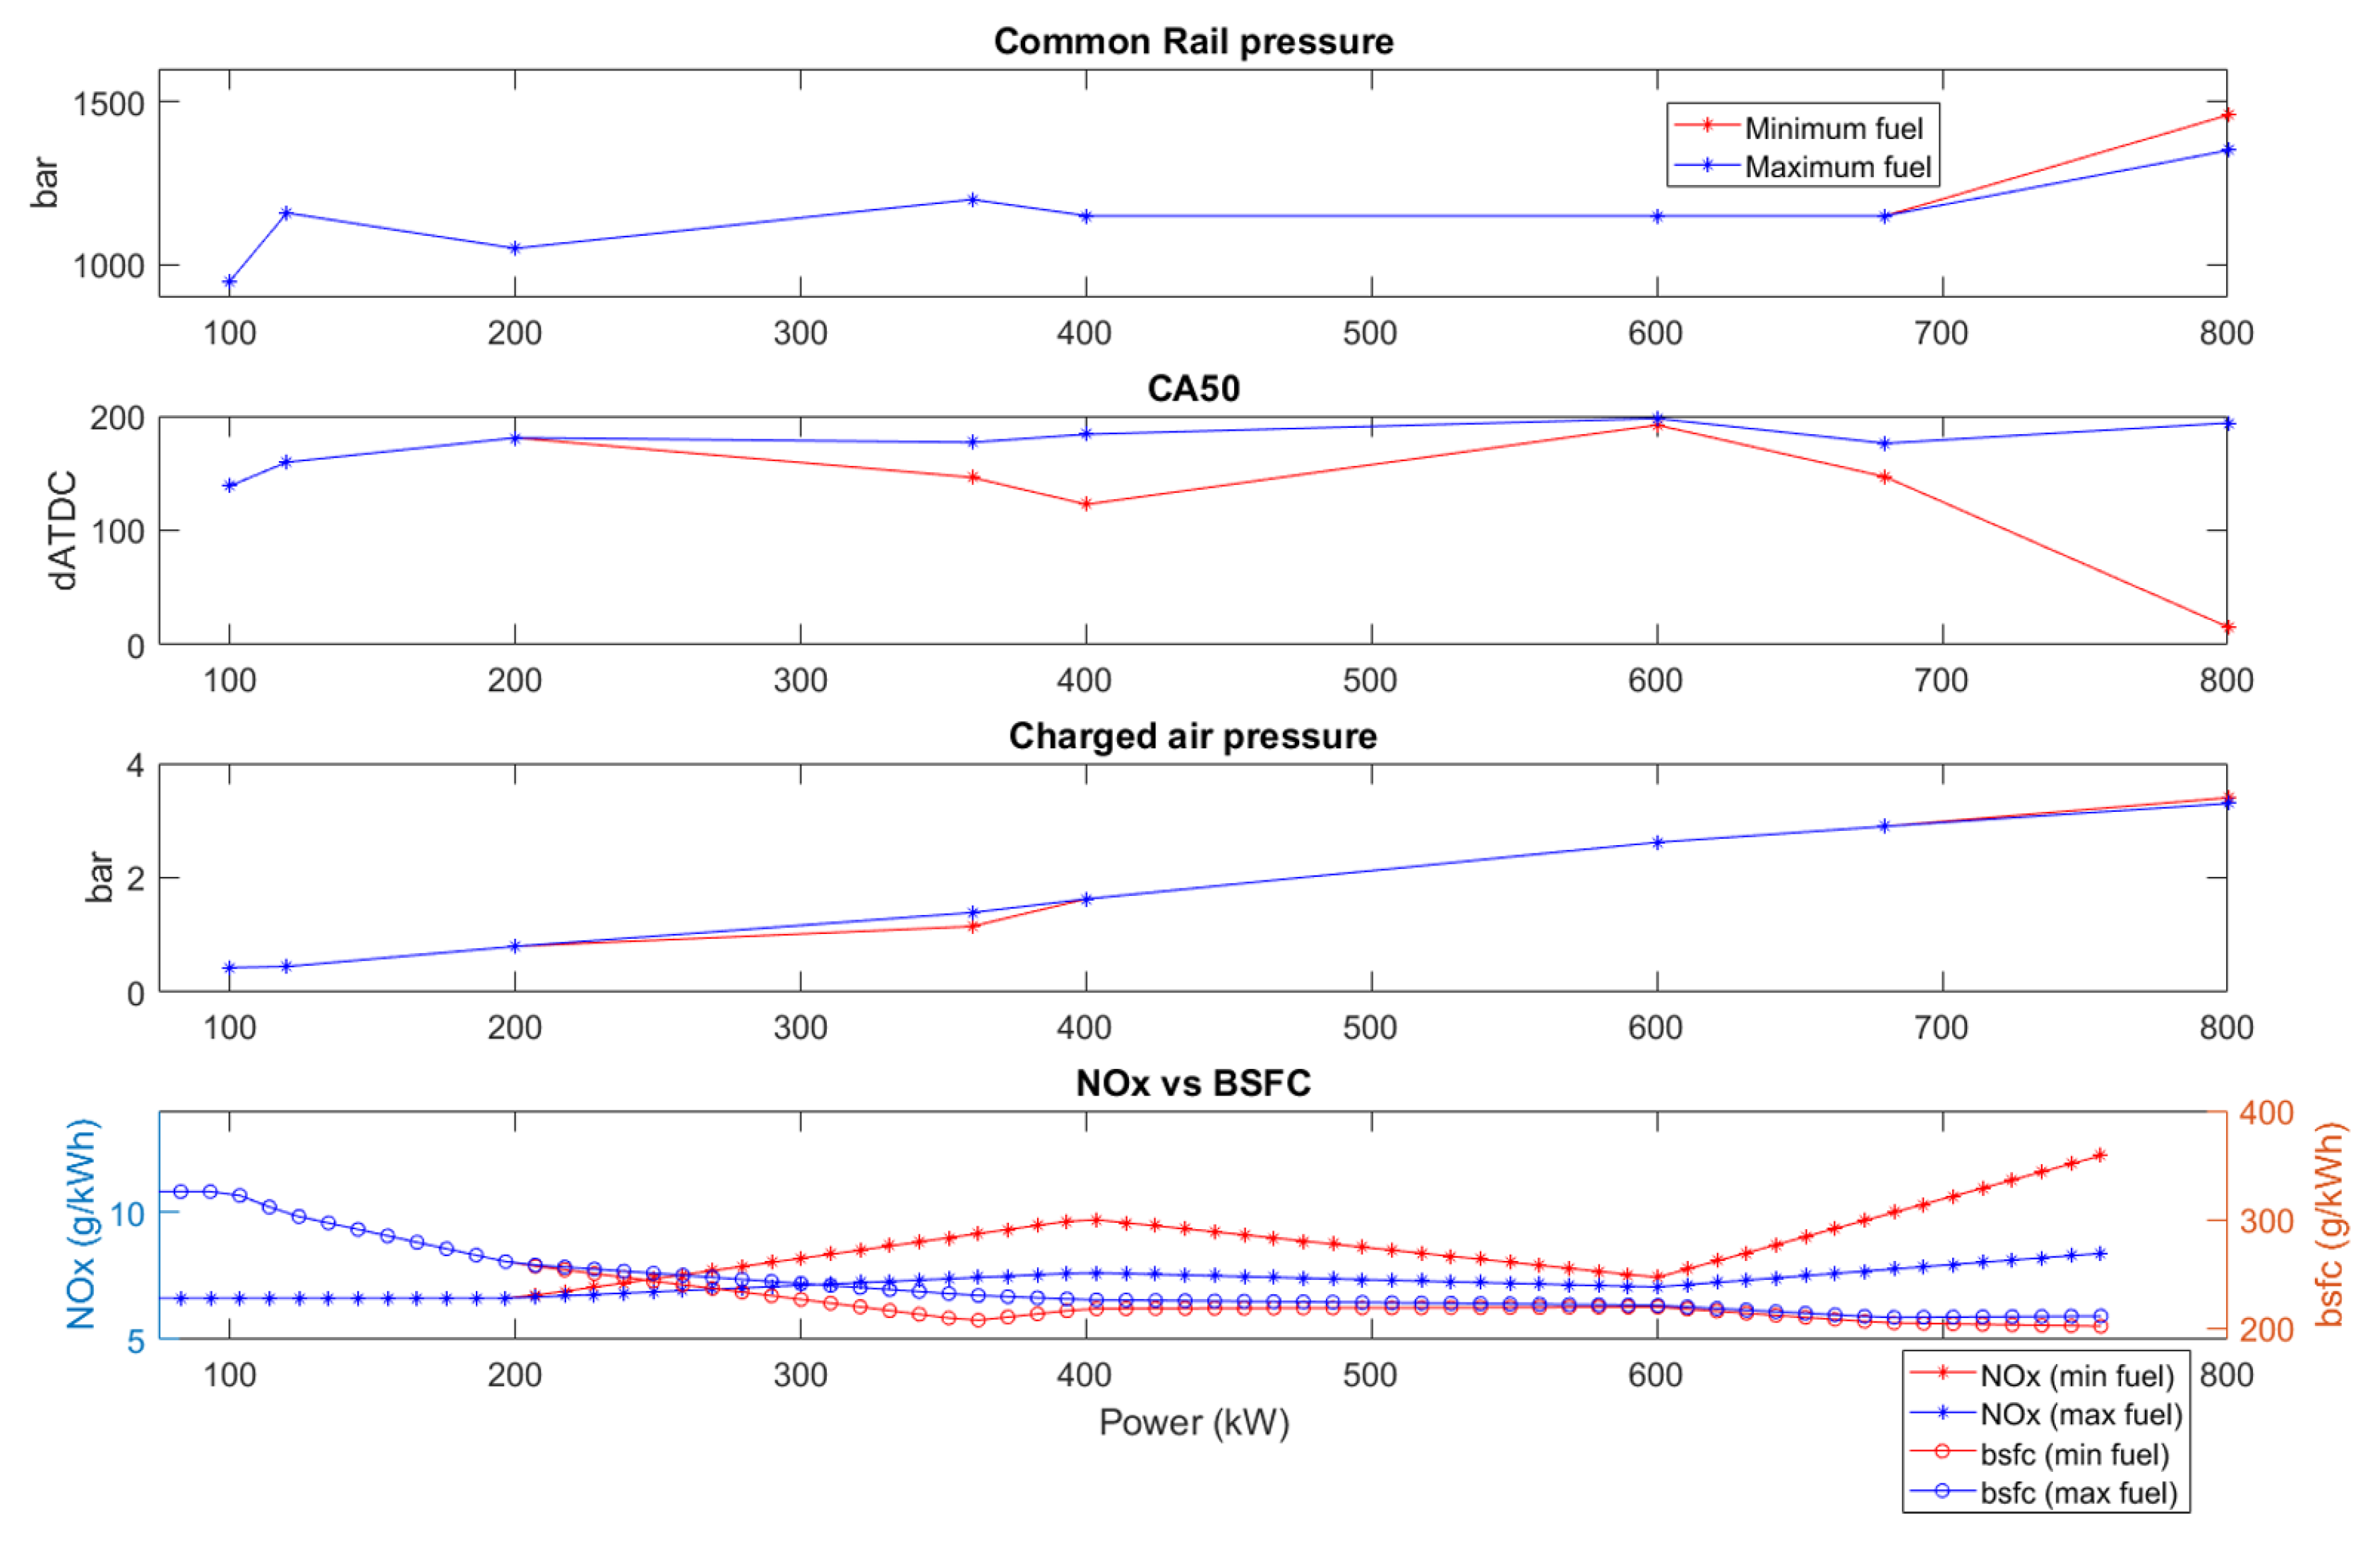
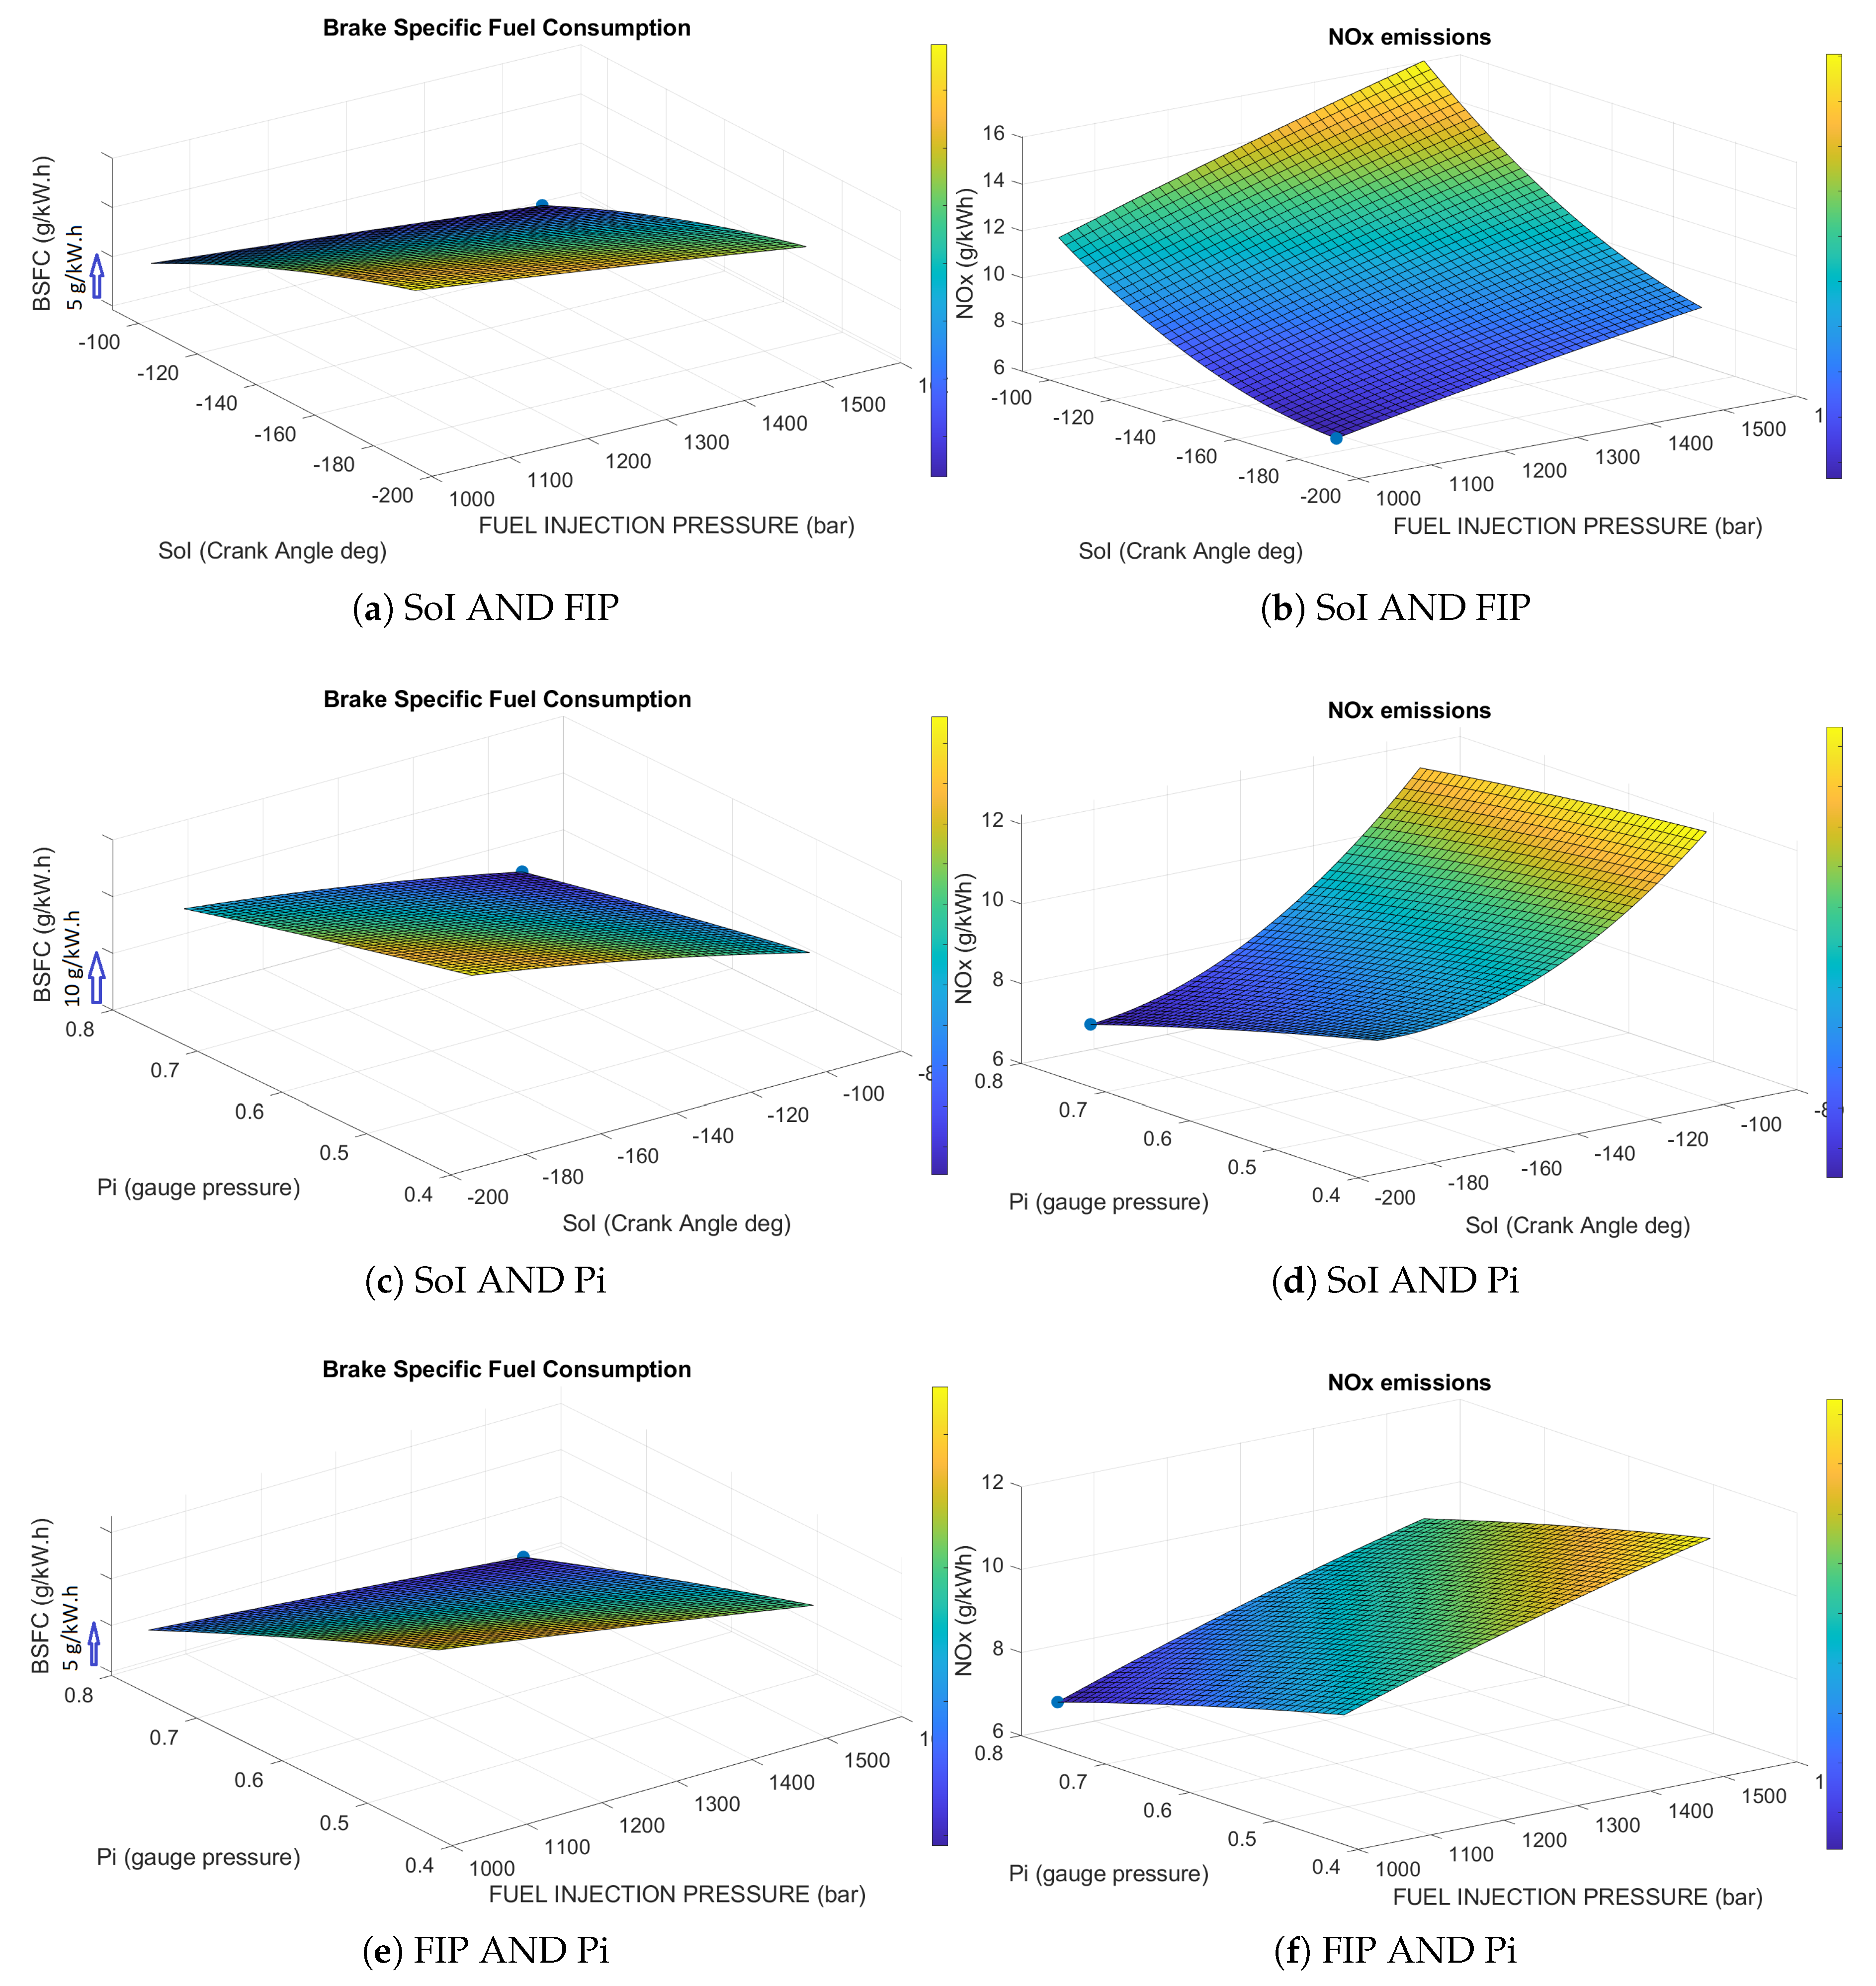
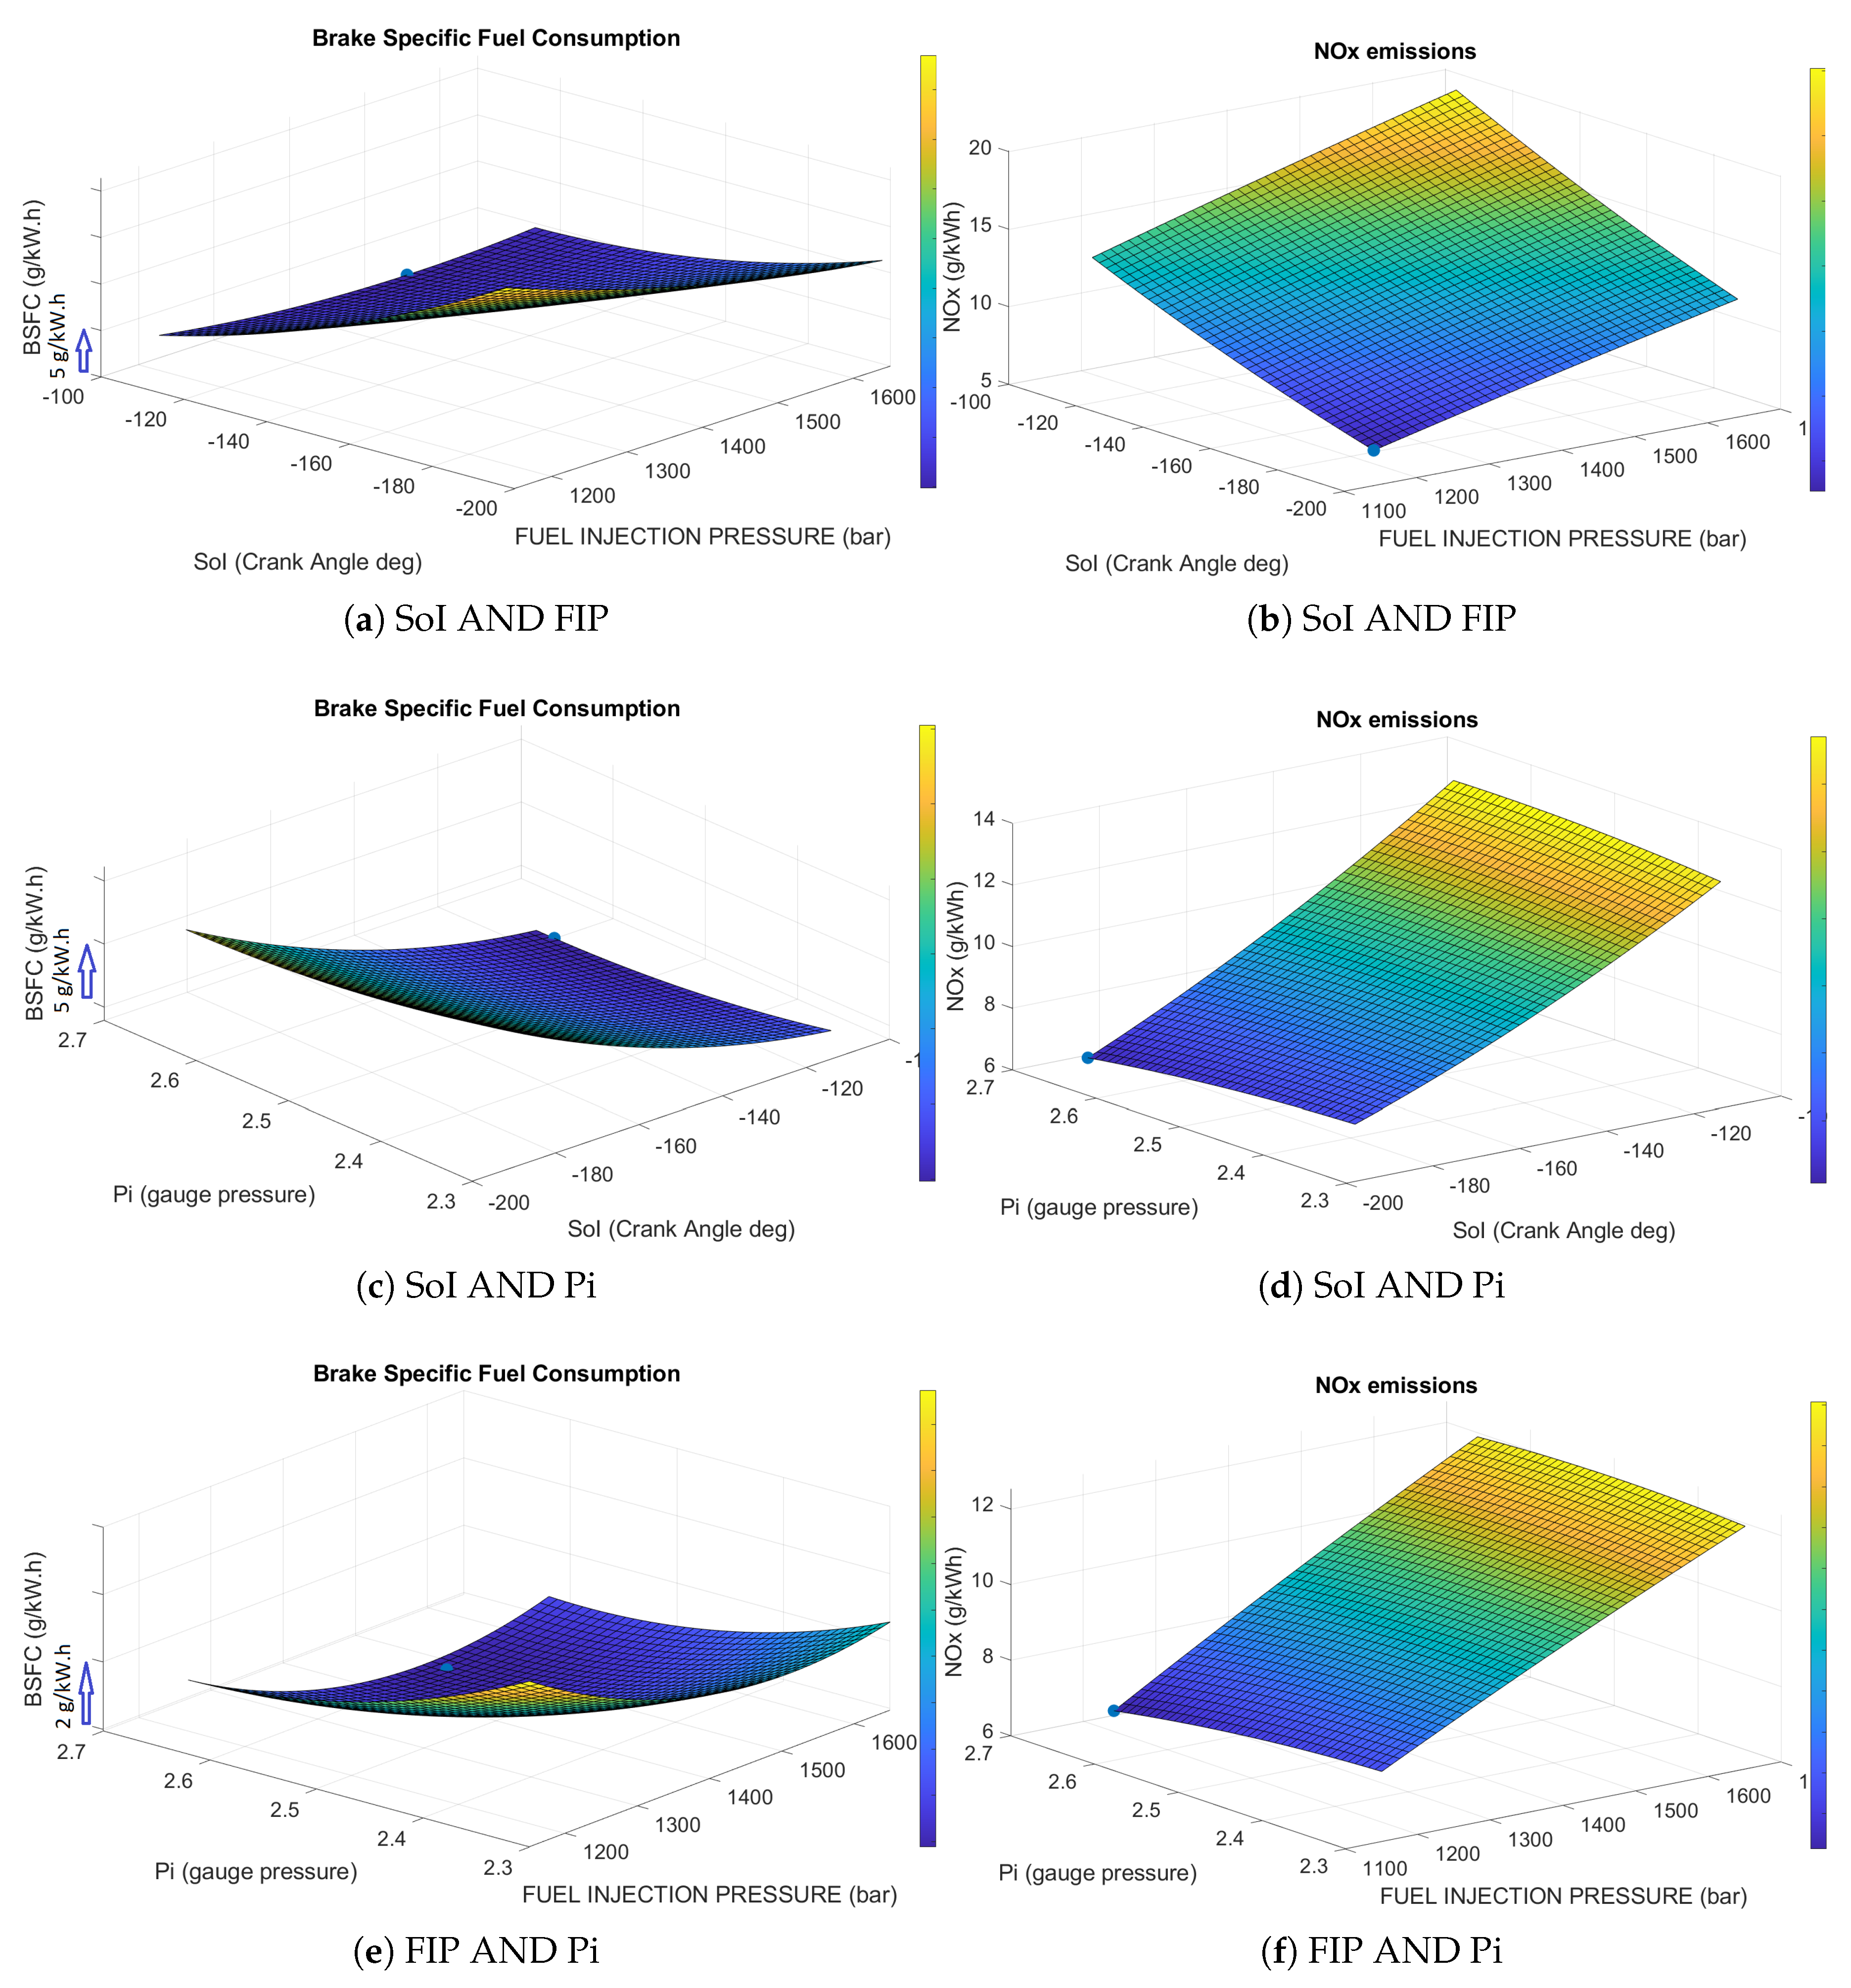
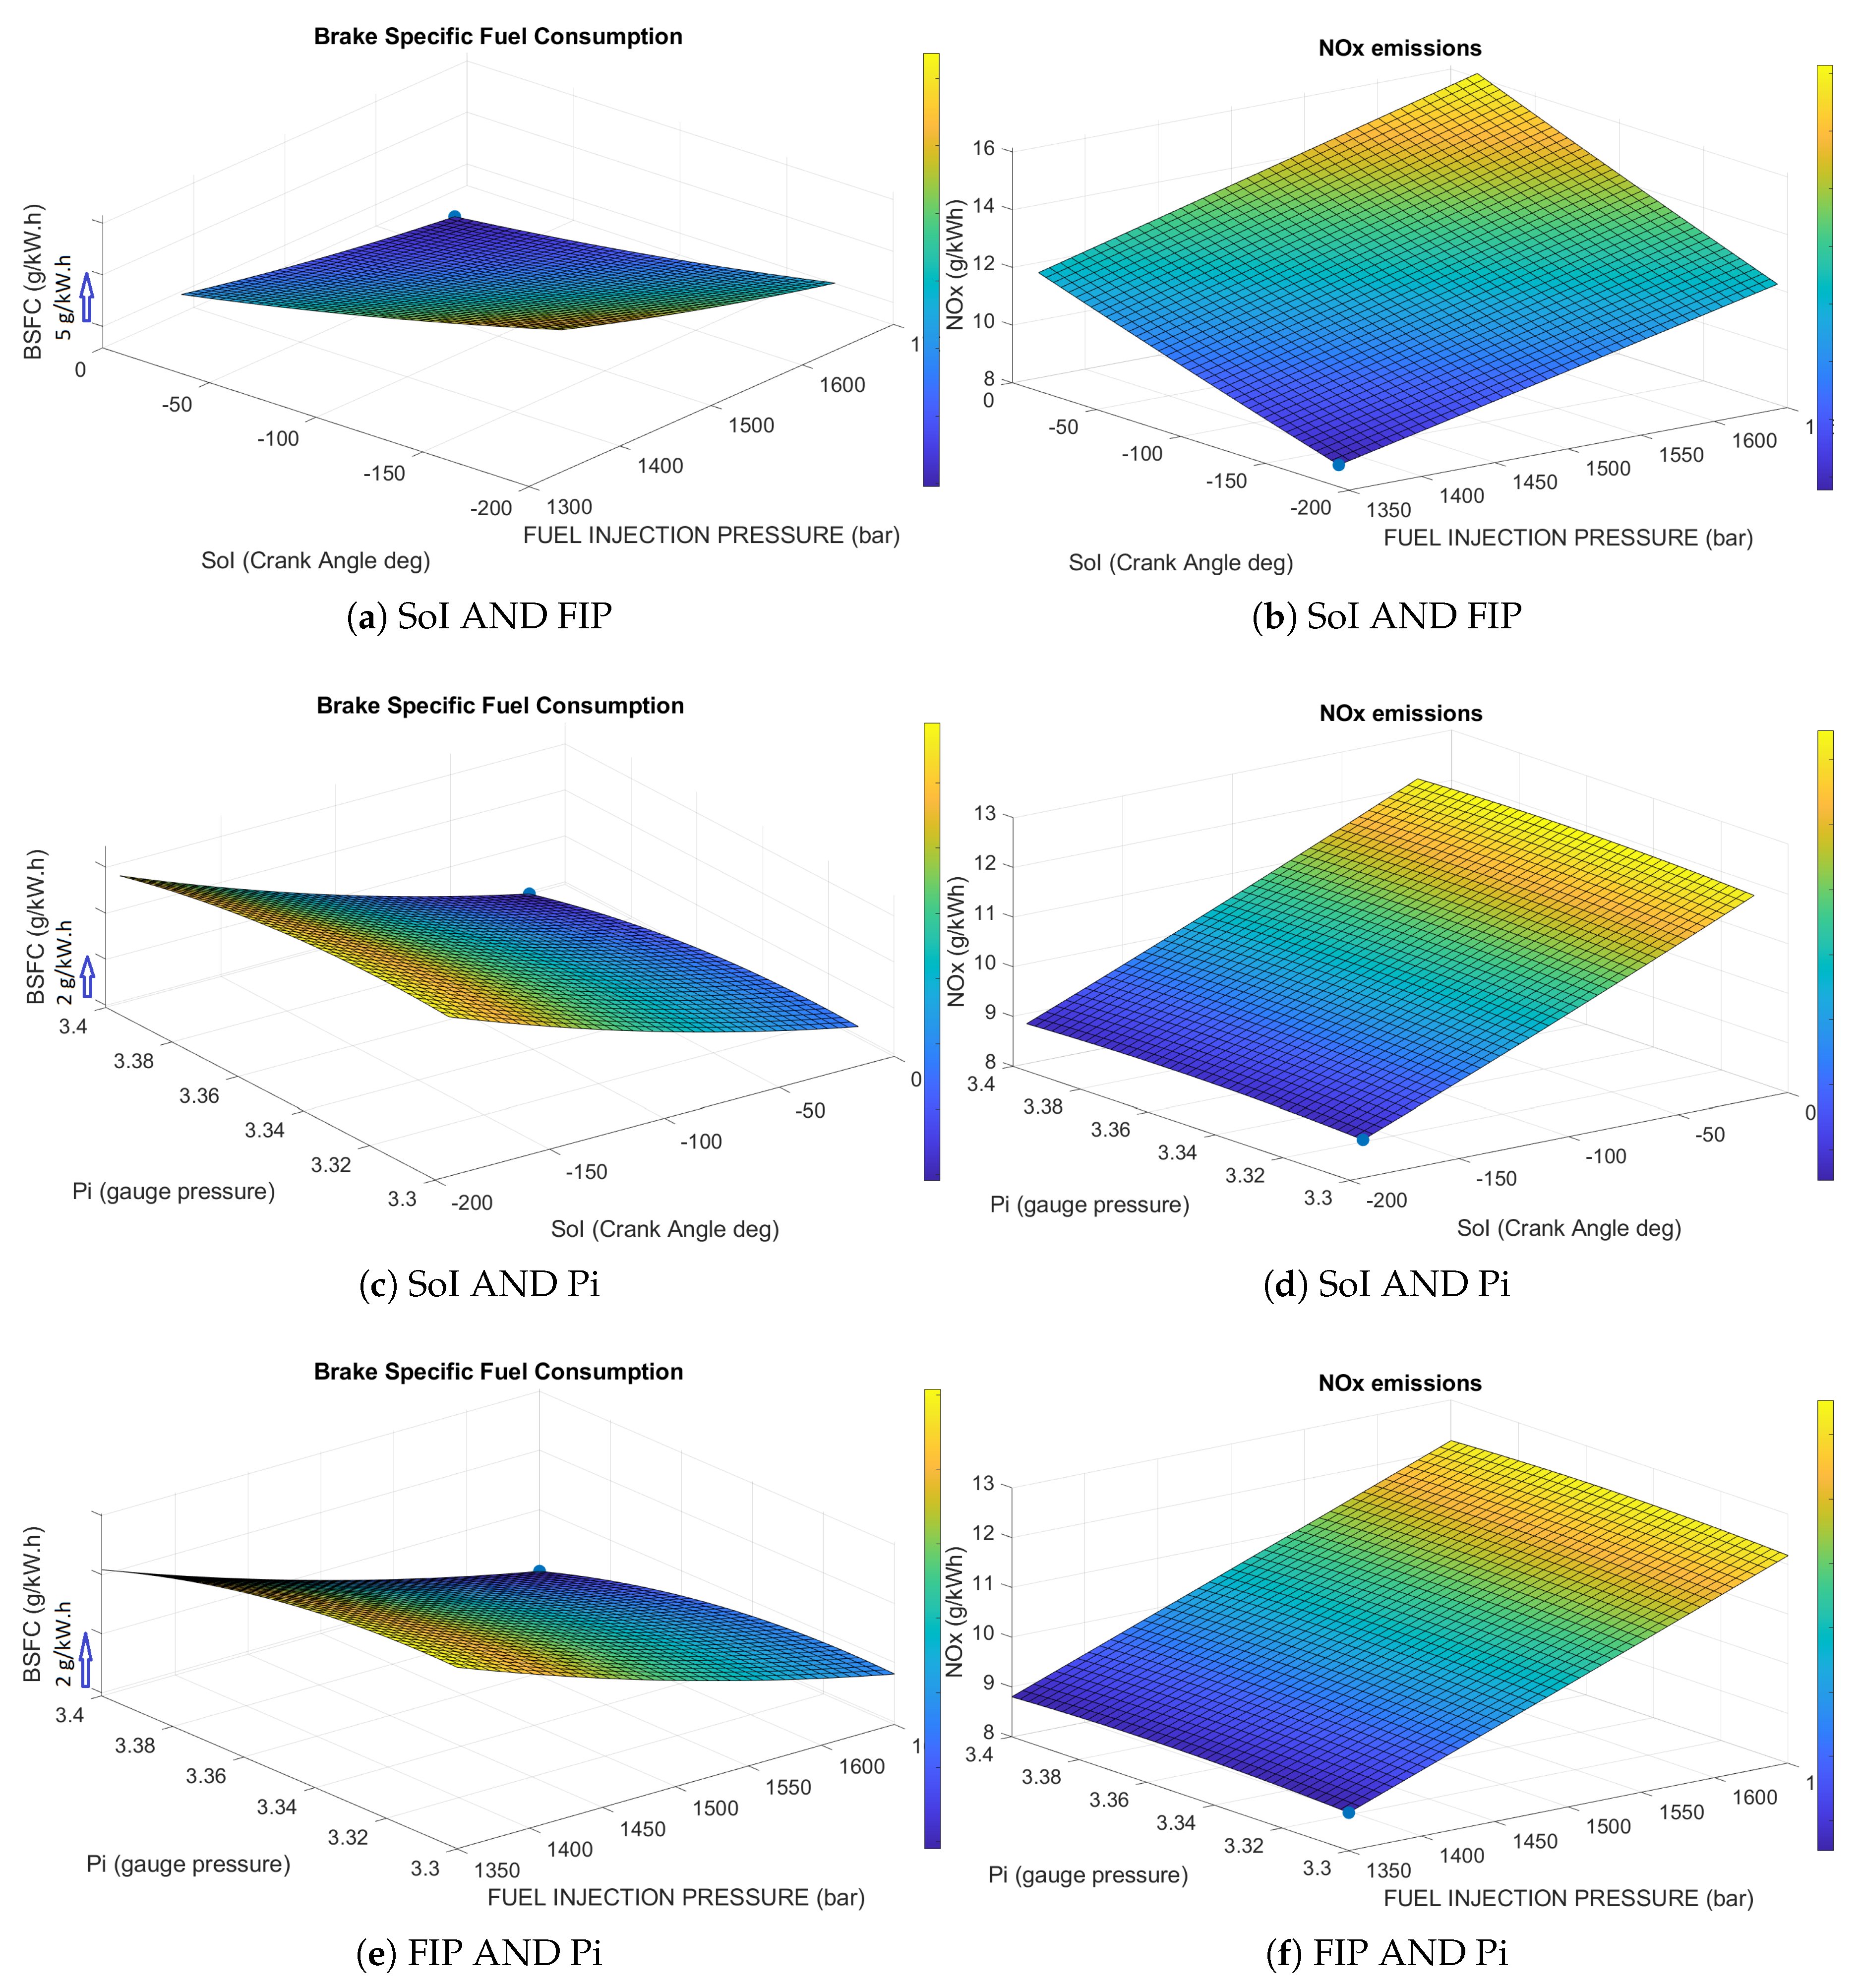
4. Results and Analysis

4.1. Results

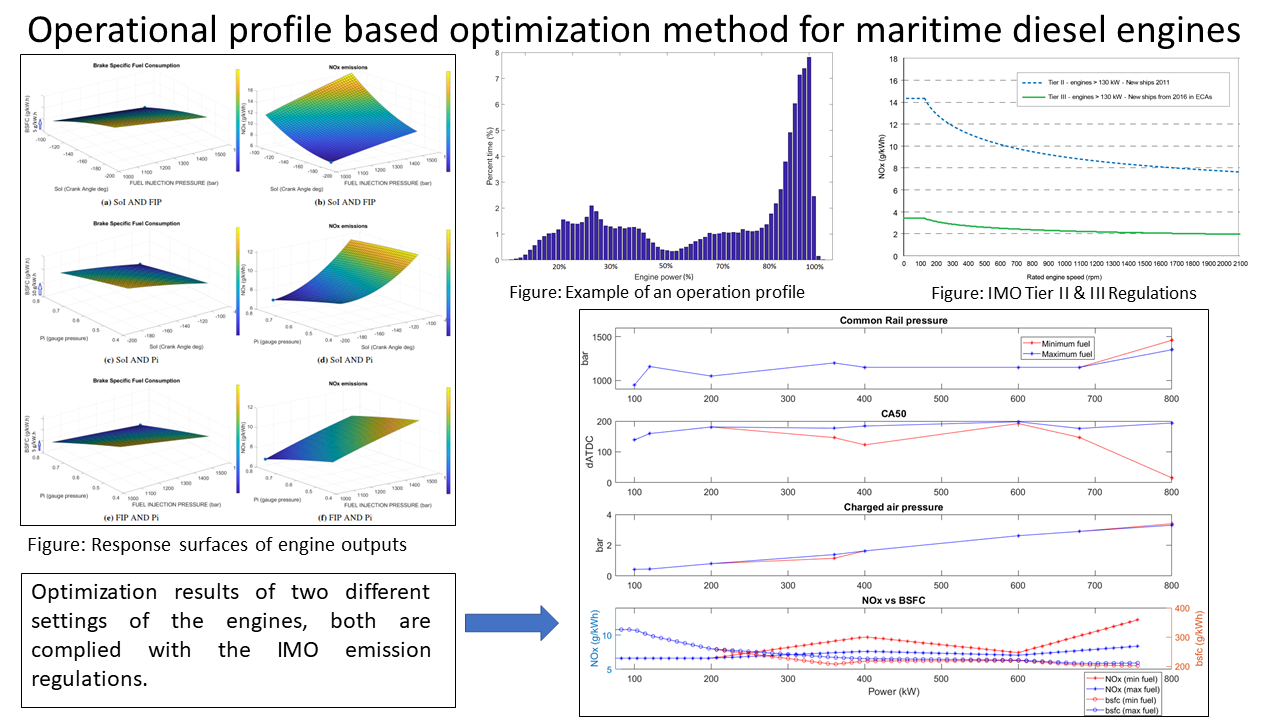
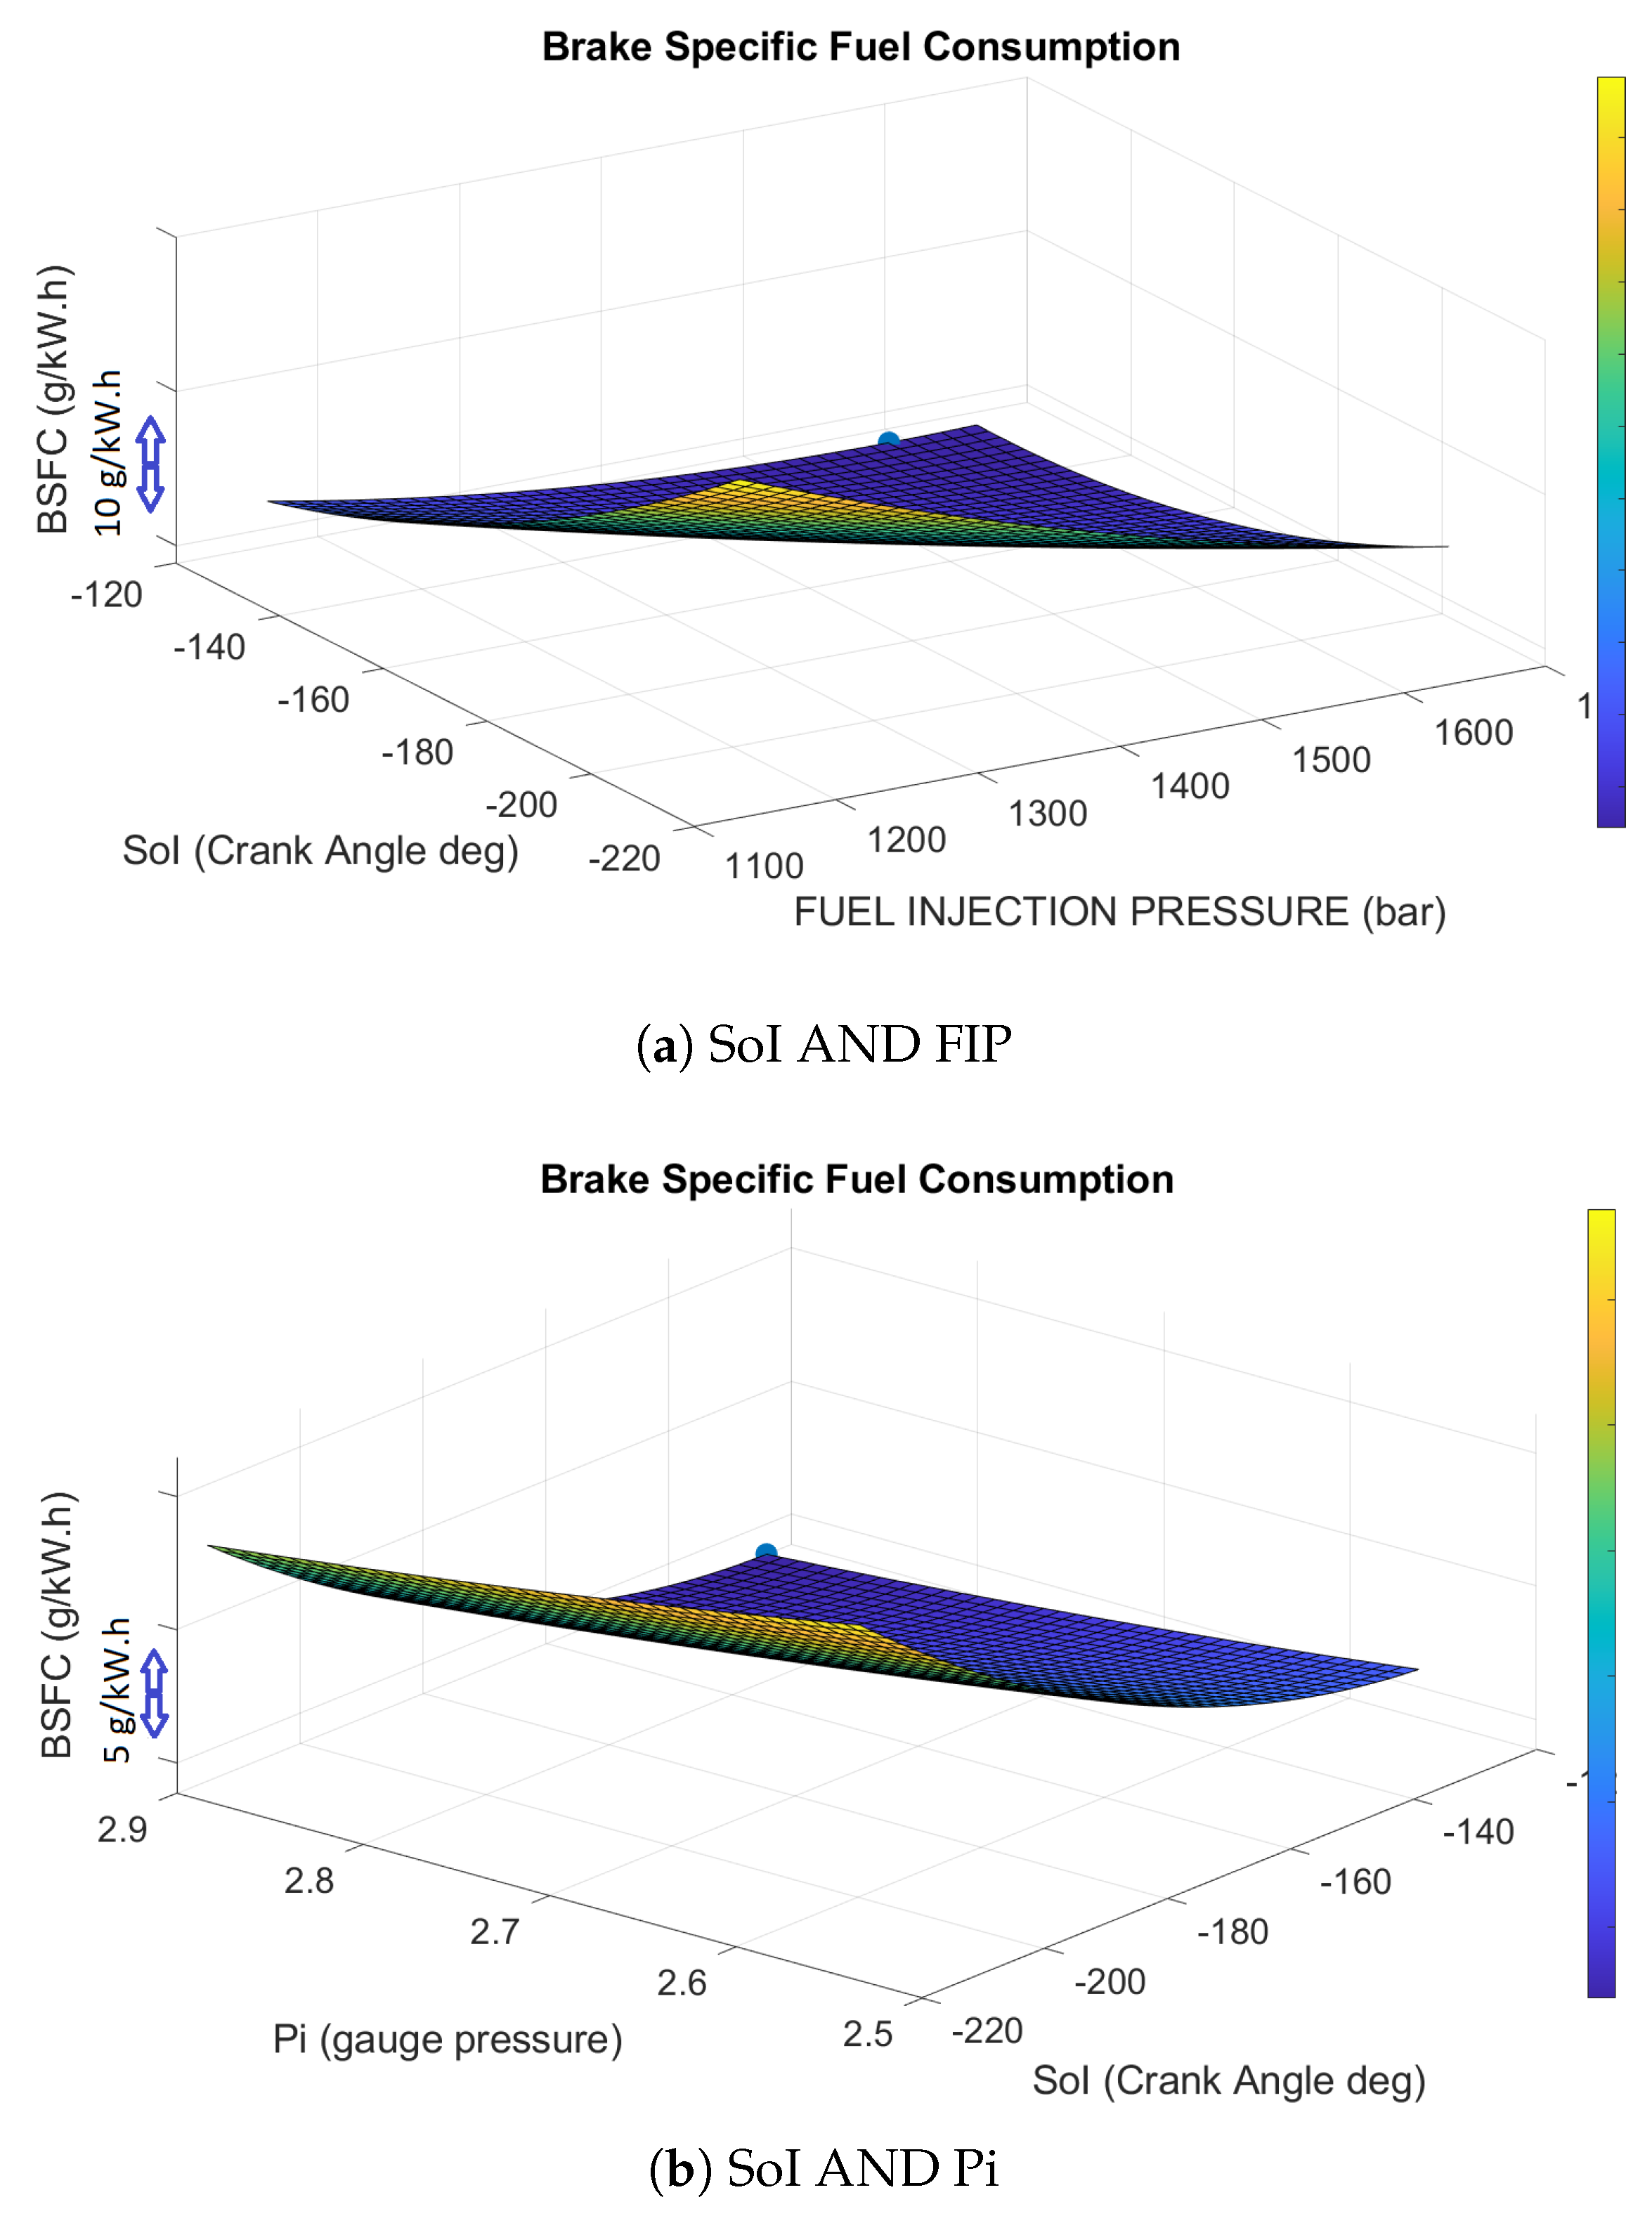
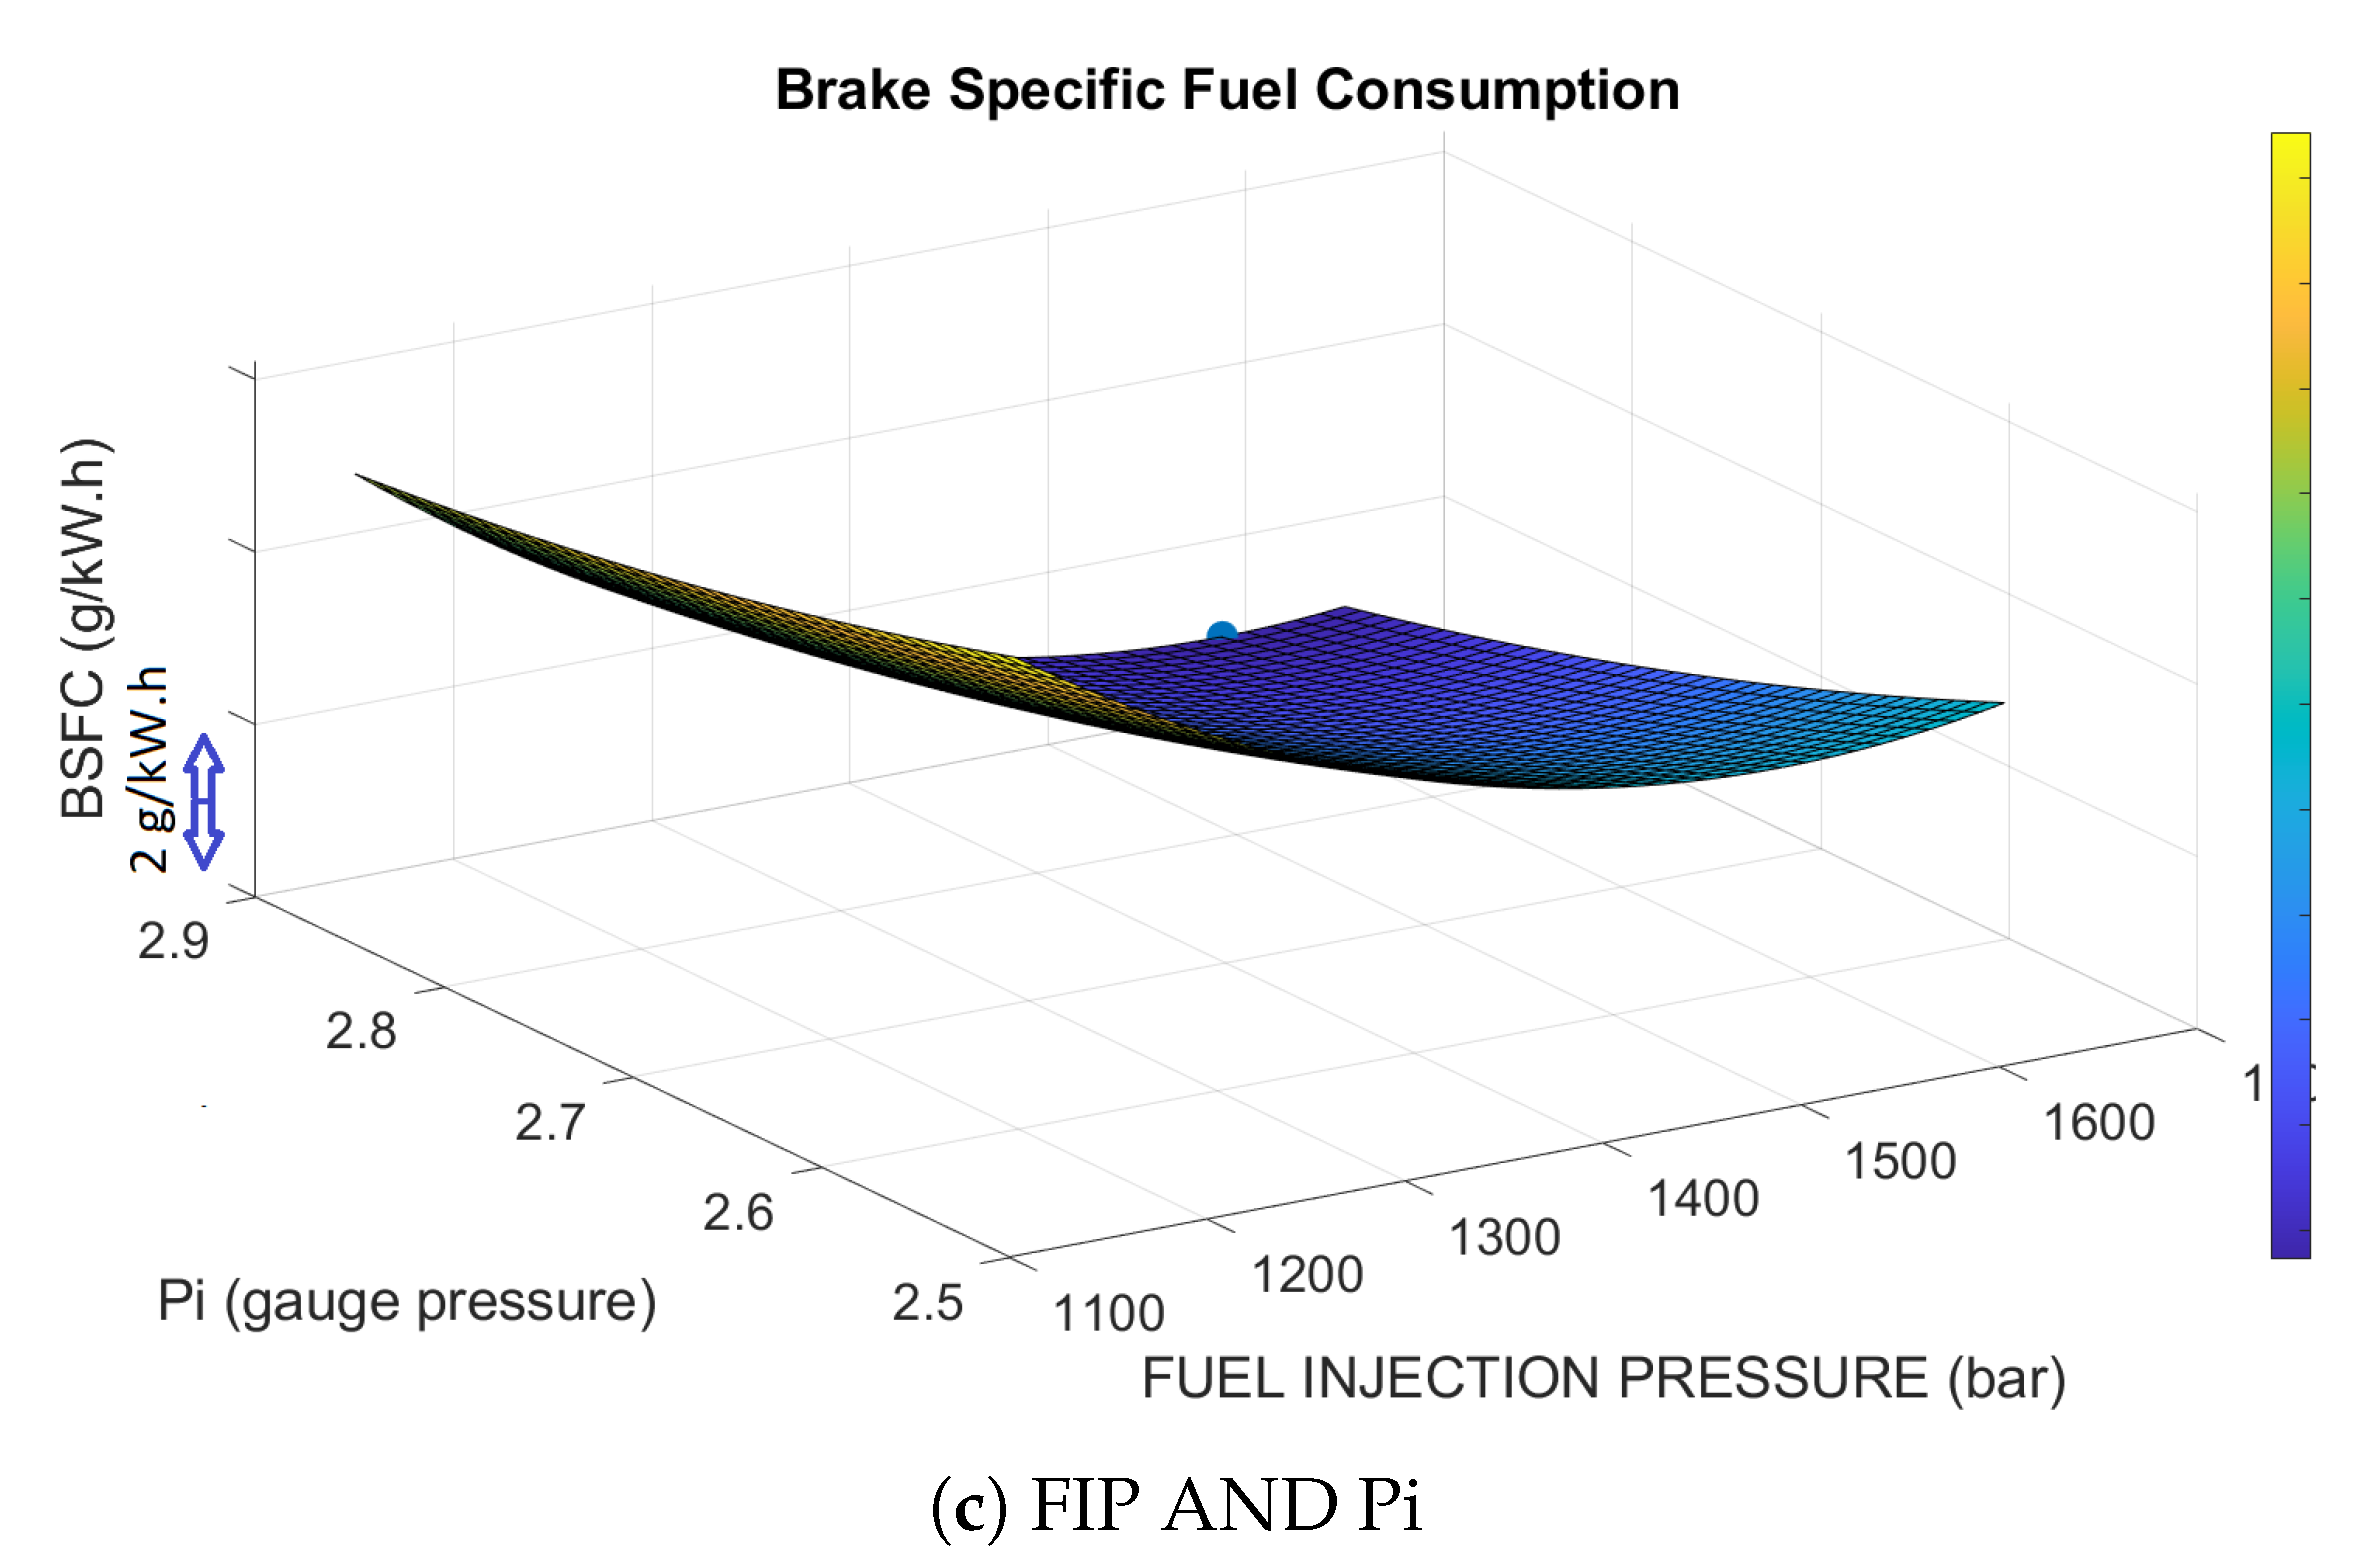
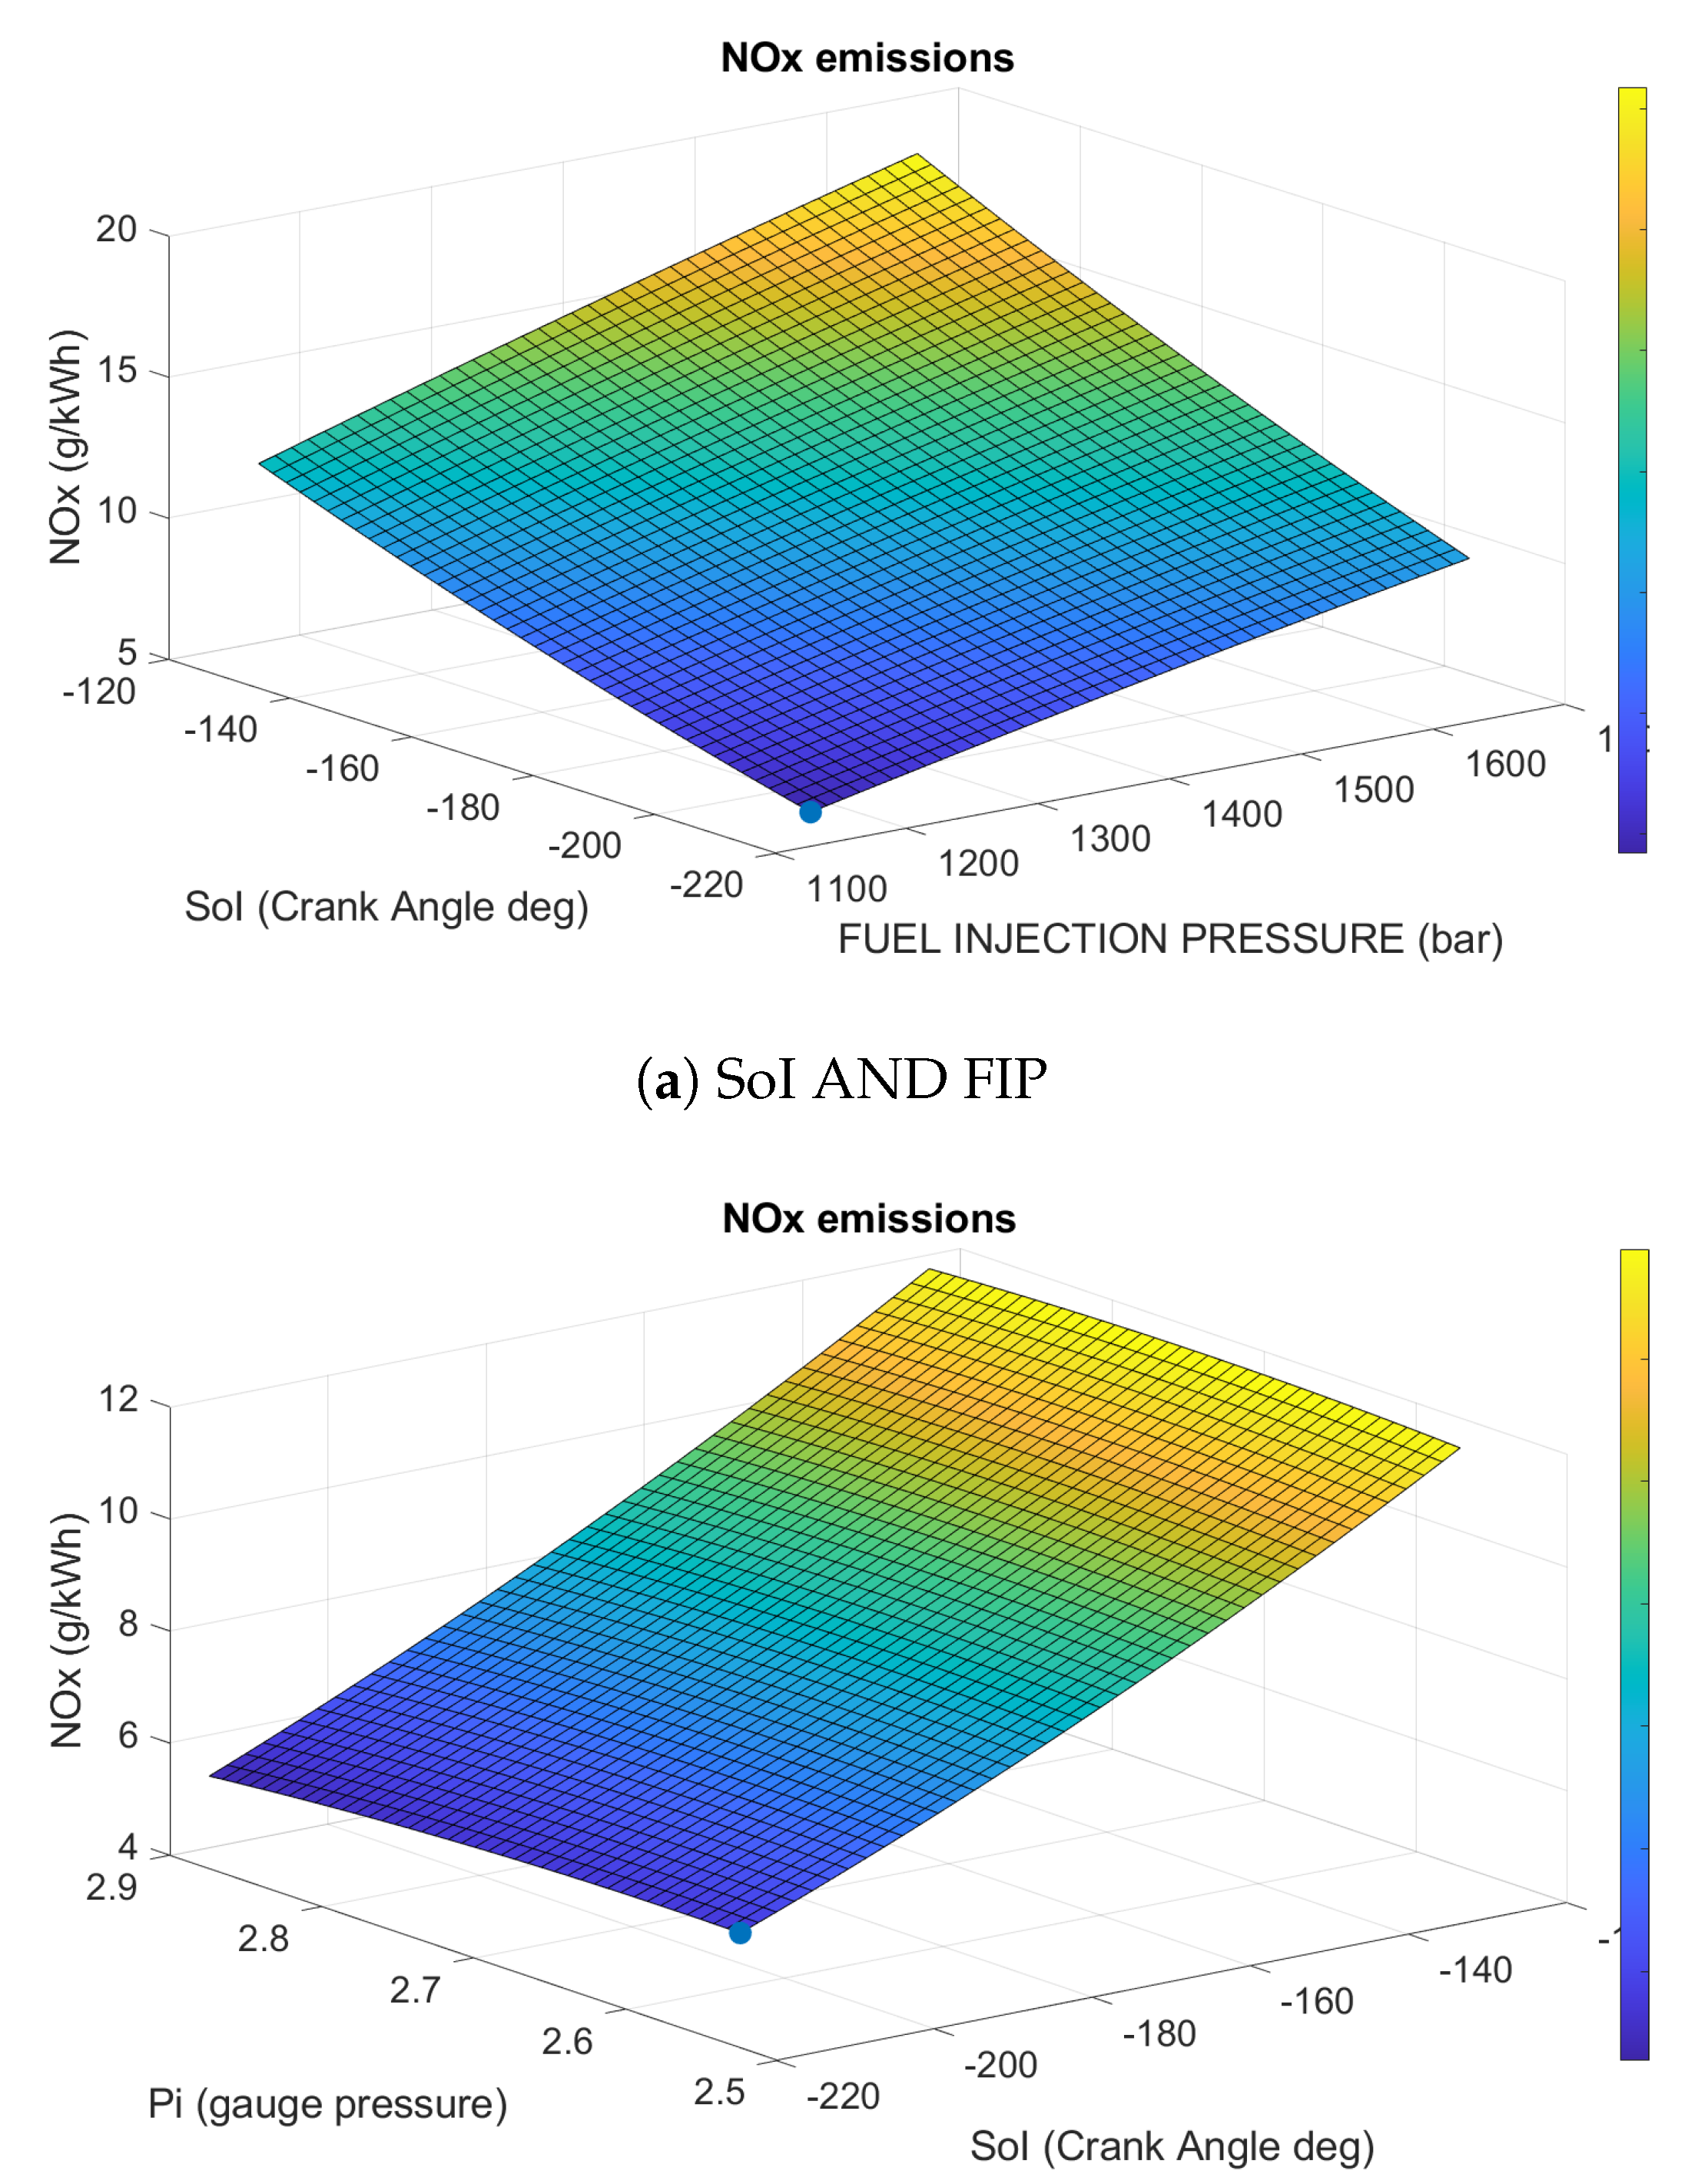
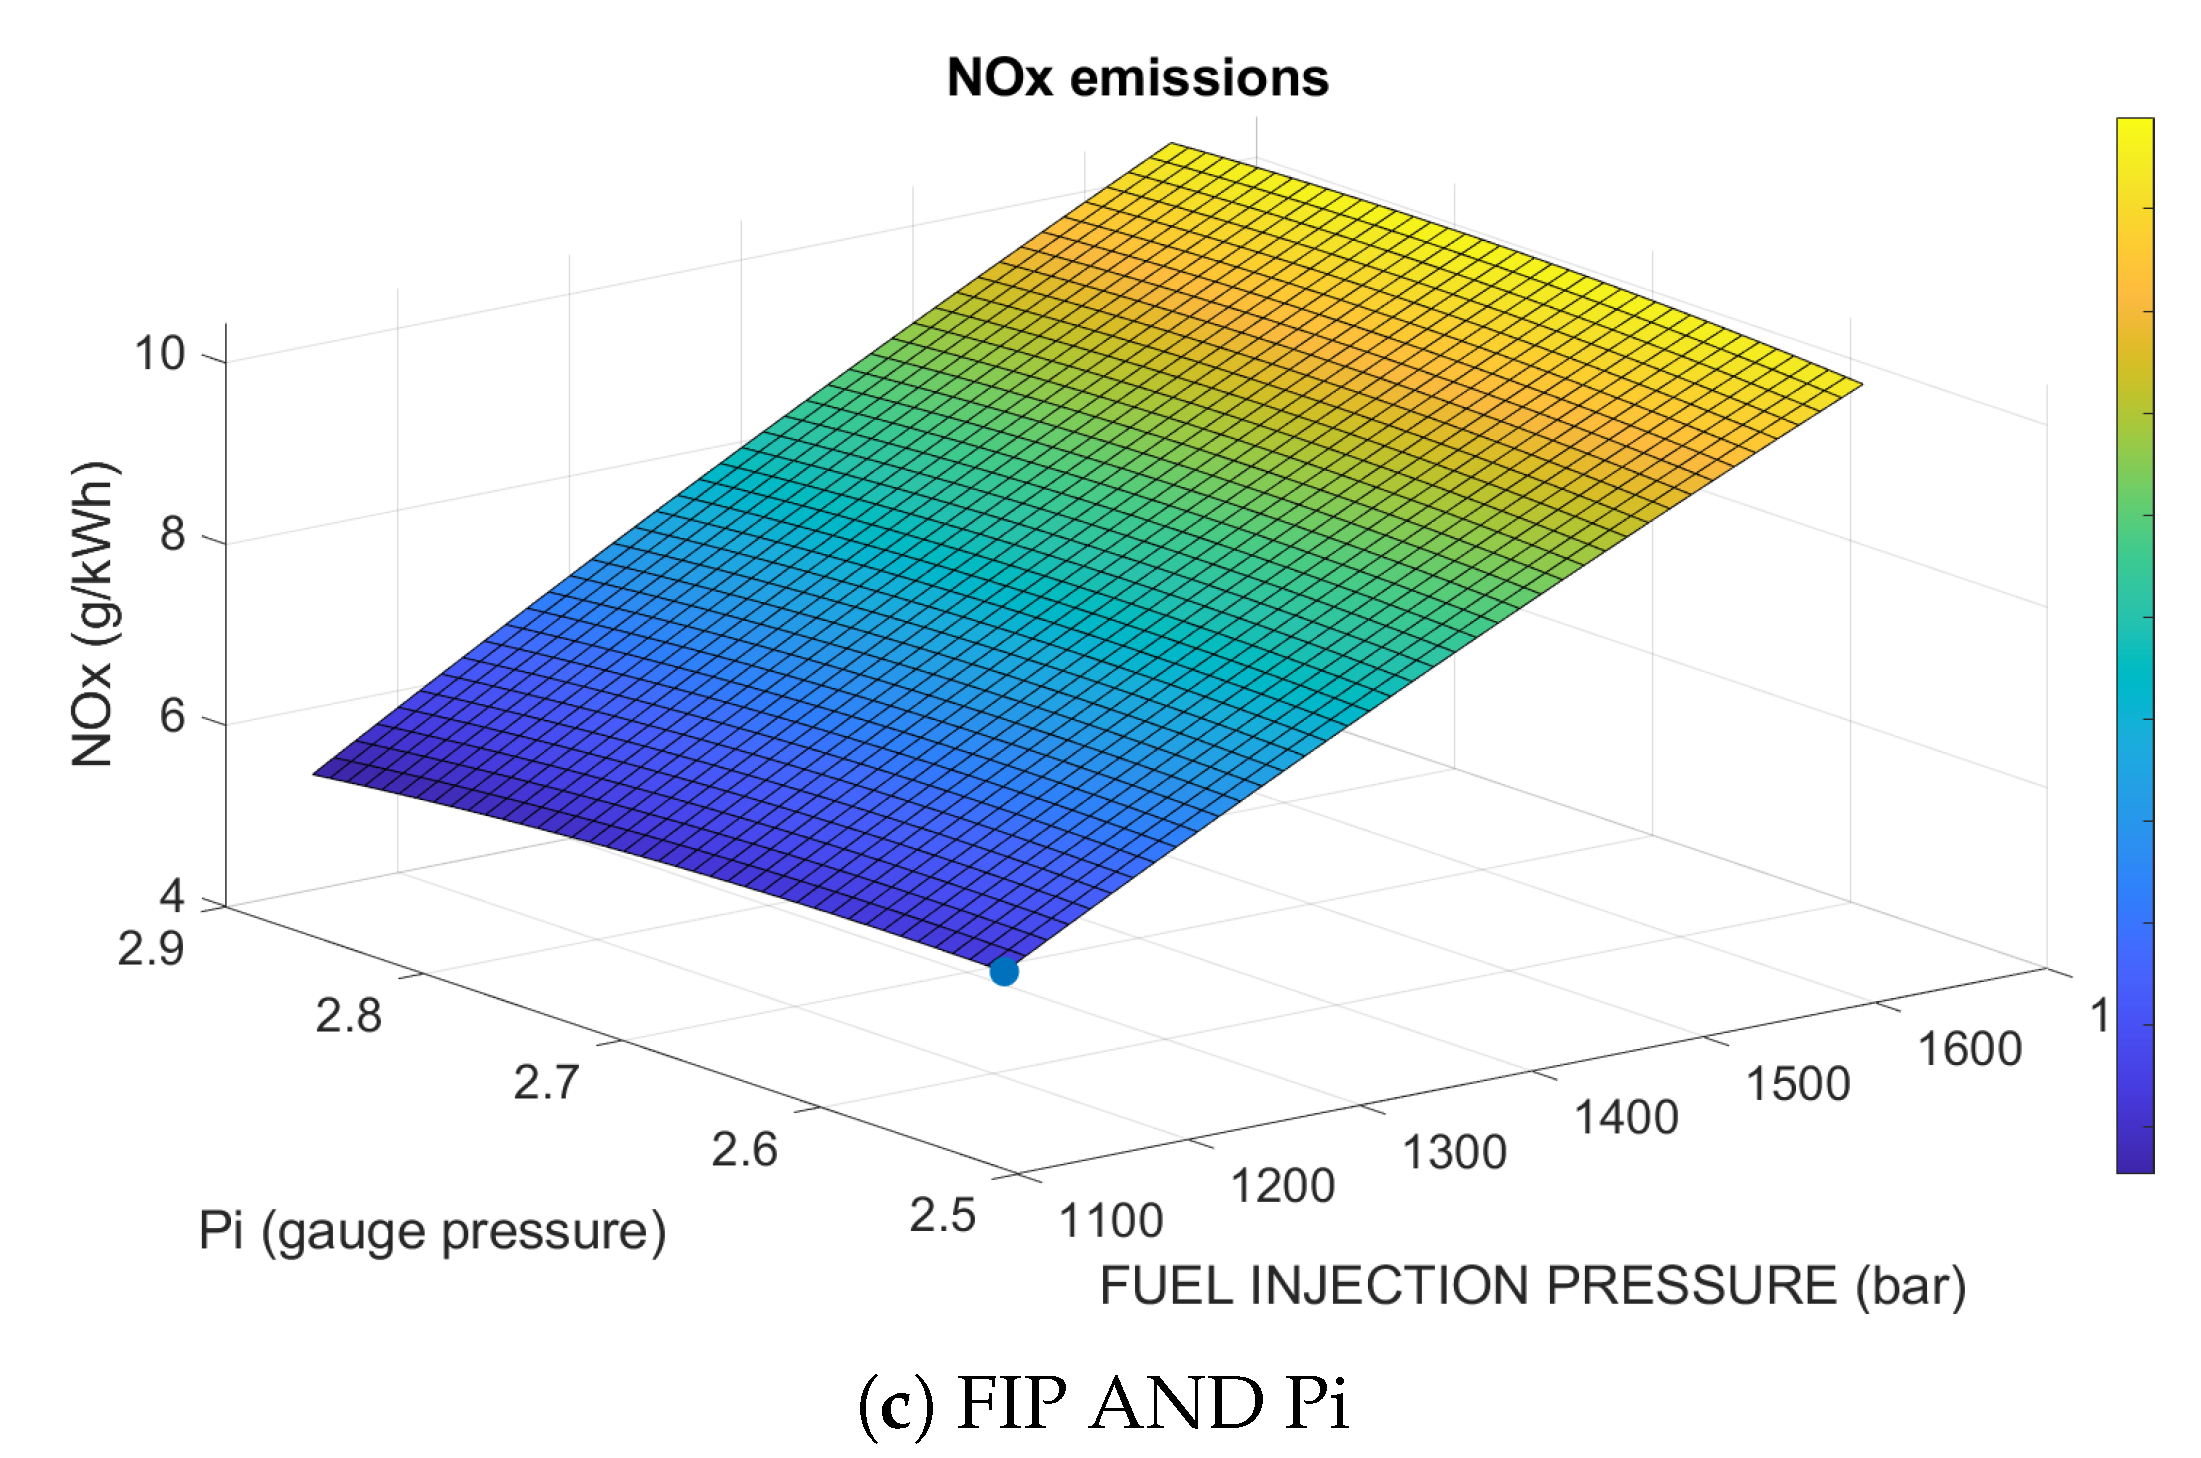
4.1.1. Modeling Results

The outcomes of using the DoE method in the modeling process are the response surfaces of the engine’s BSFC and N O x emissions at each of the selected operating point. Figure 8 and Figure 9 show two examples of the BSFC and the N O x at one operating point. More examples are shown in Figure A1, Figure A2, Figure A3 and Figure A4. The modeling has been done with three input parameters; however, for visualization purpose, every two of the parameters are plotted with the response. Scales of the axis have been removed due to confidentiality reasons.

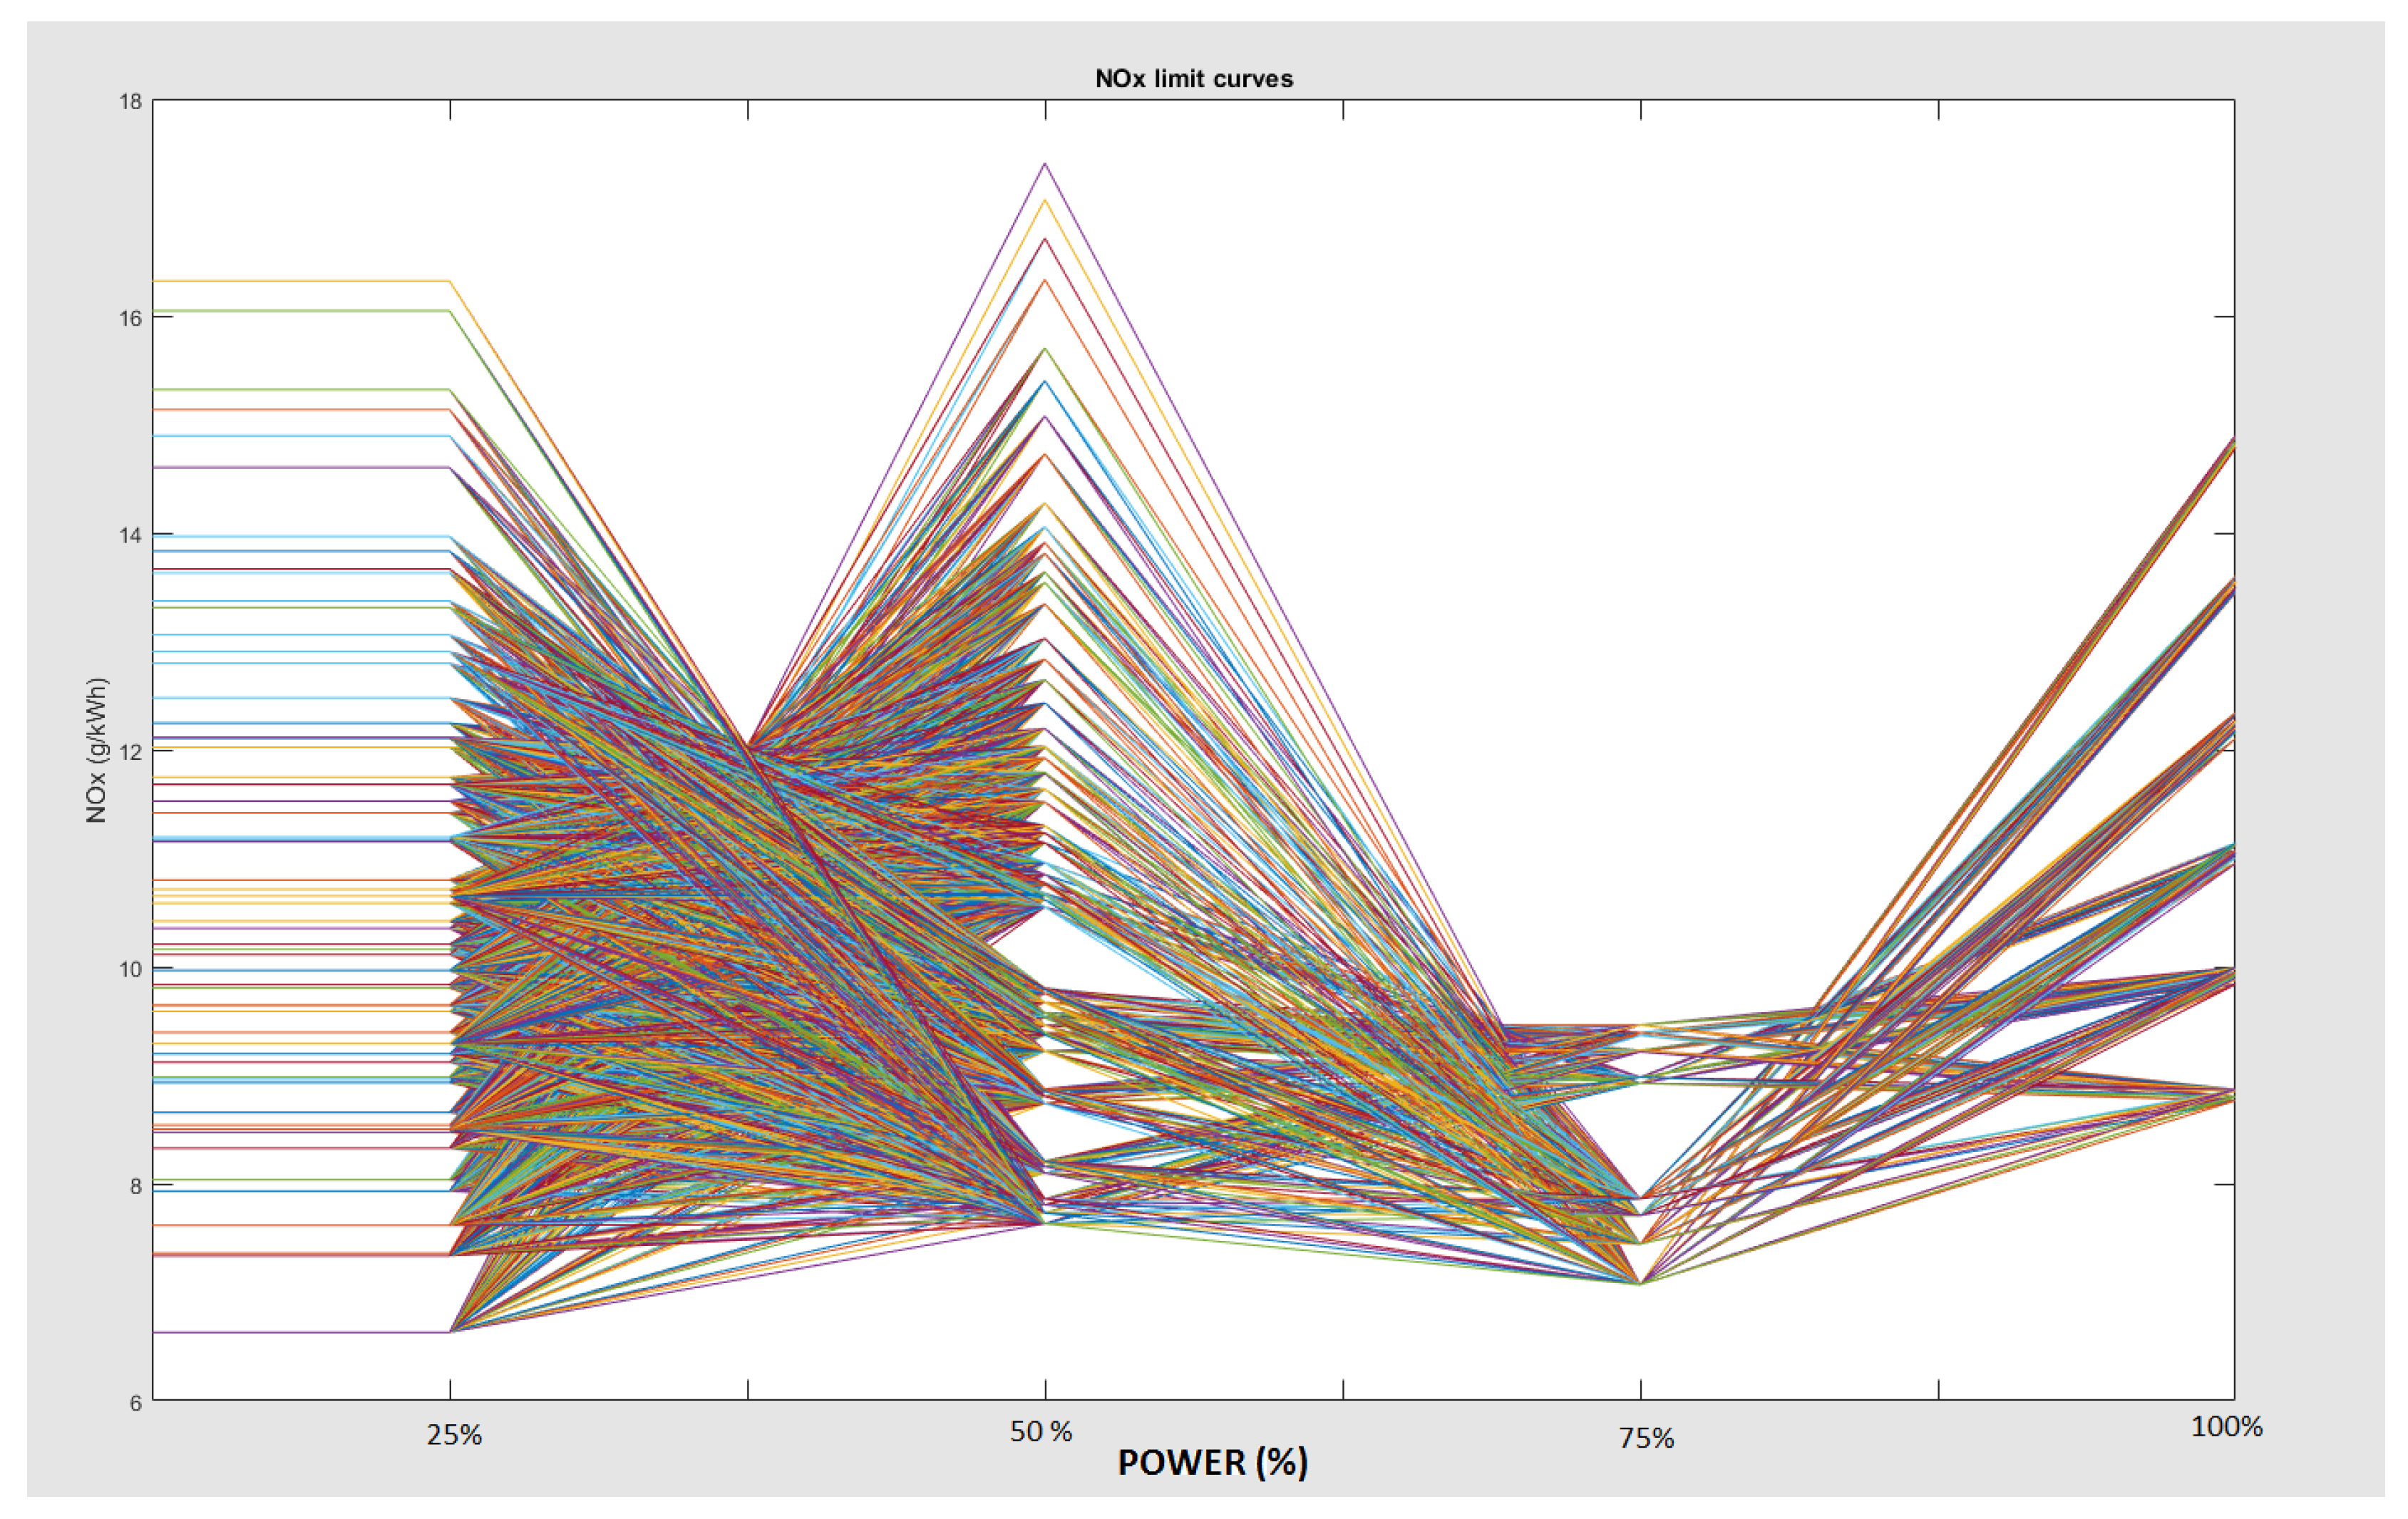
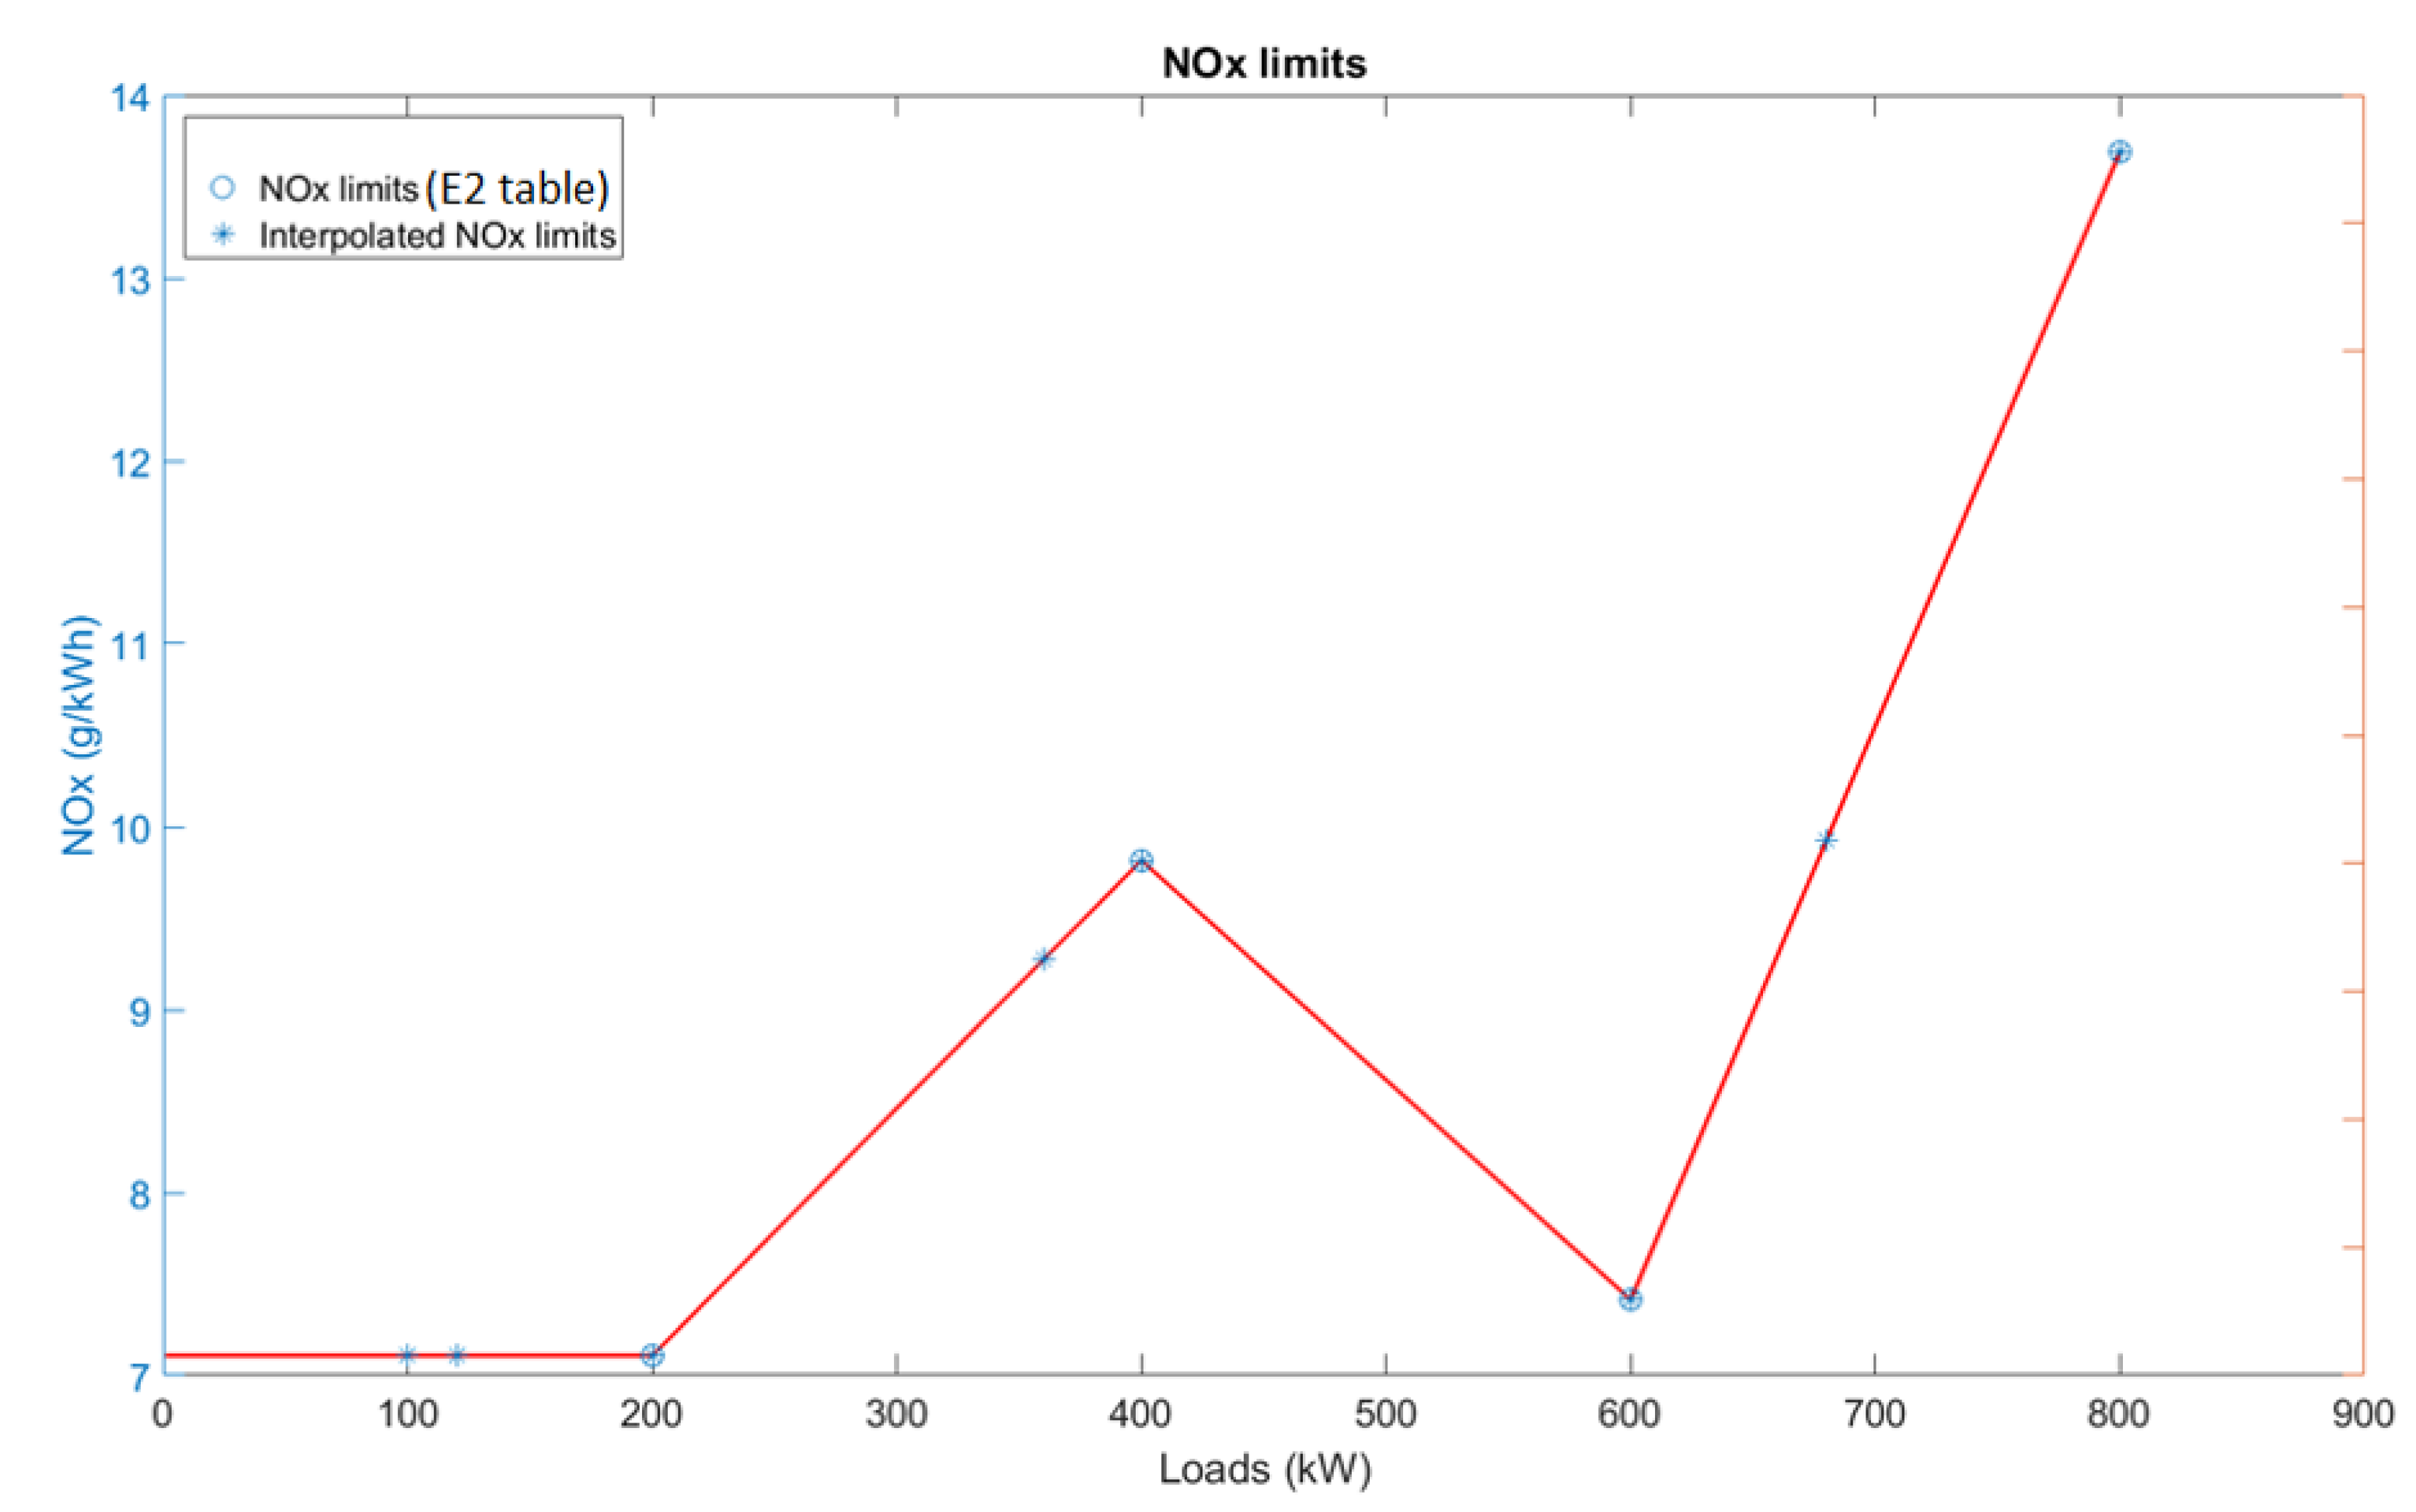
4.1.2. Optimization Results
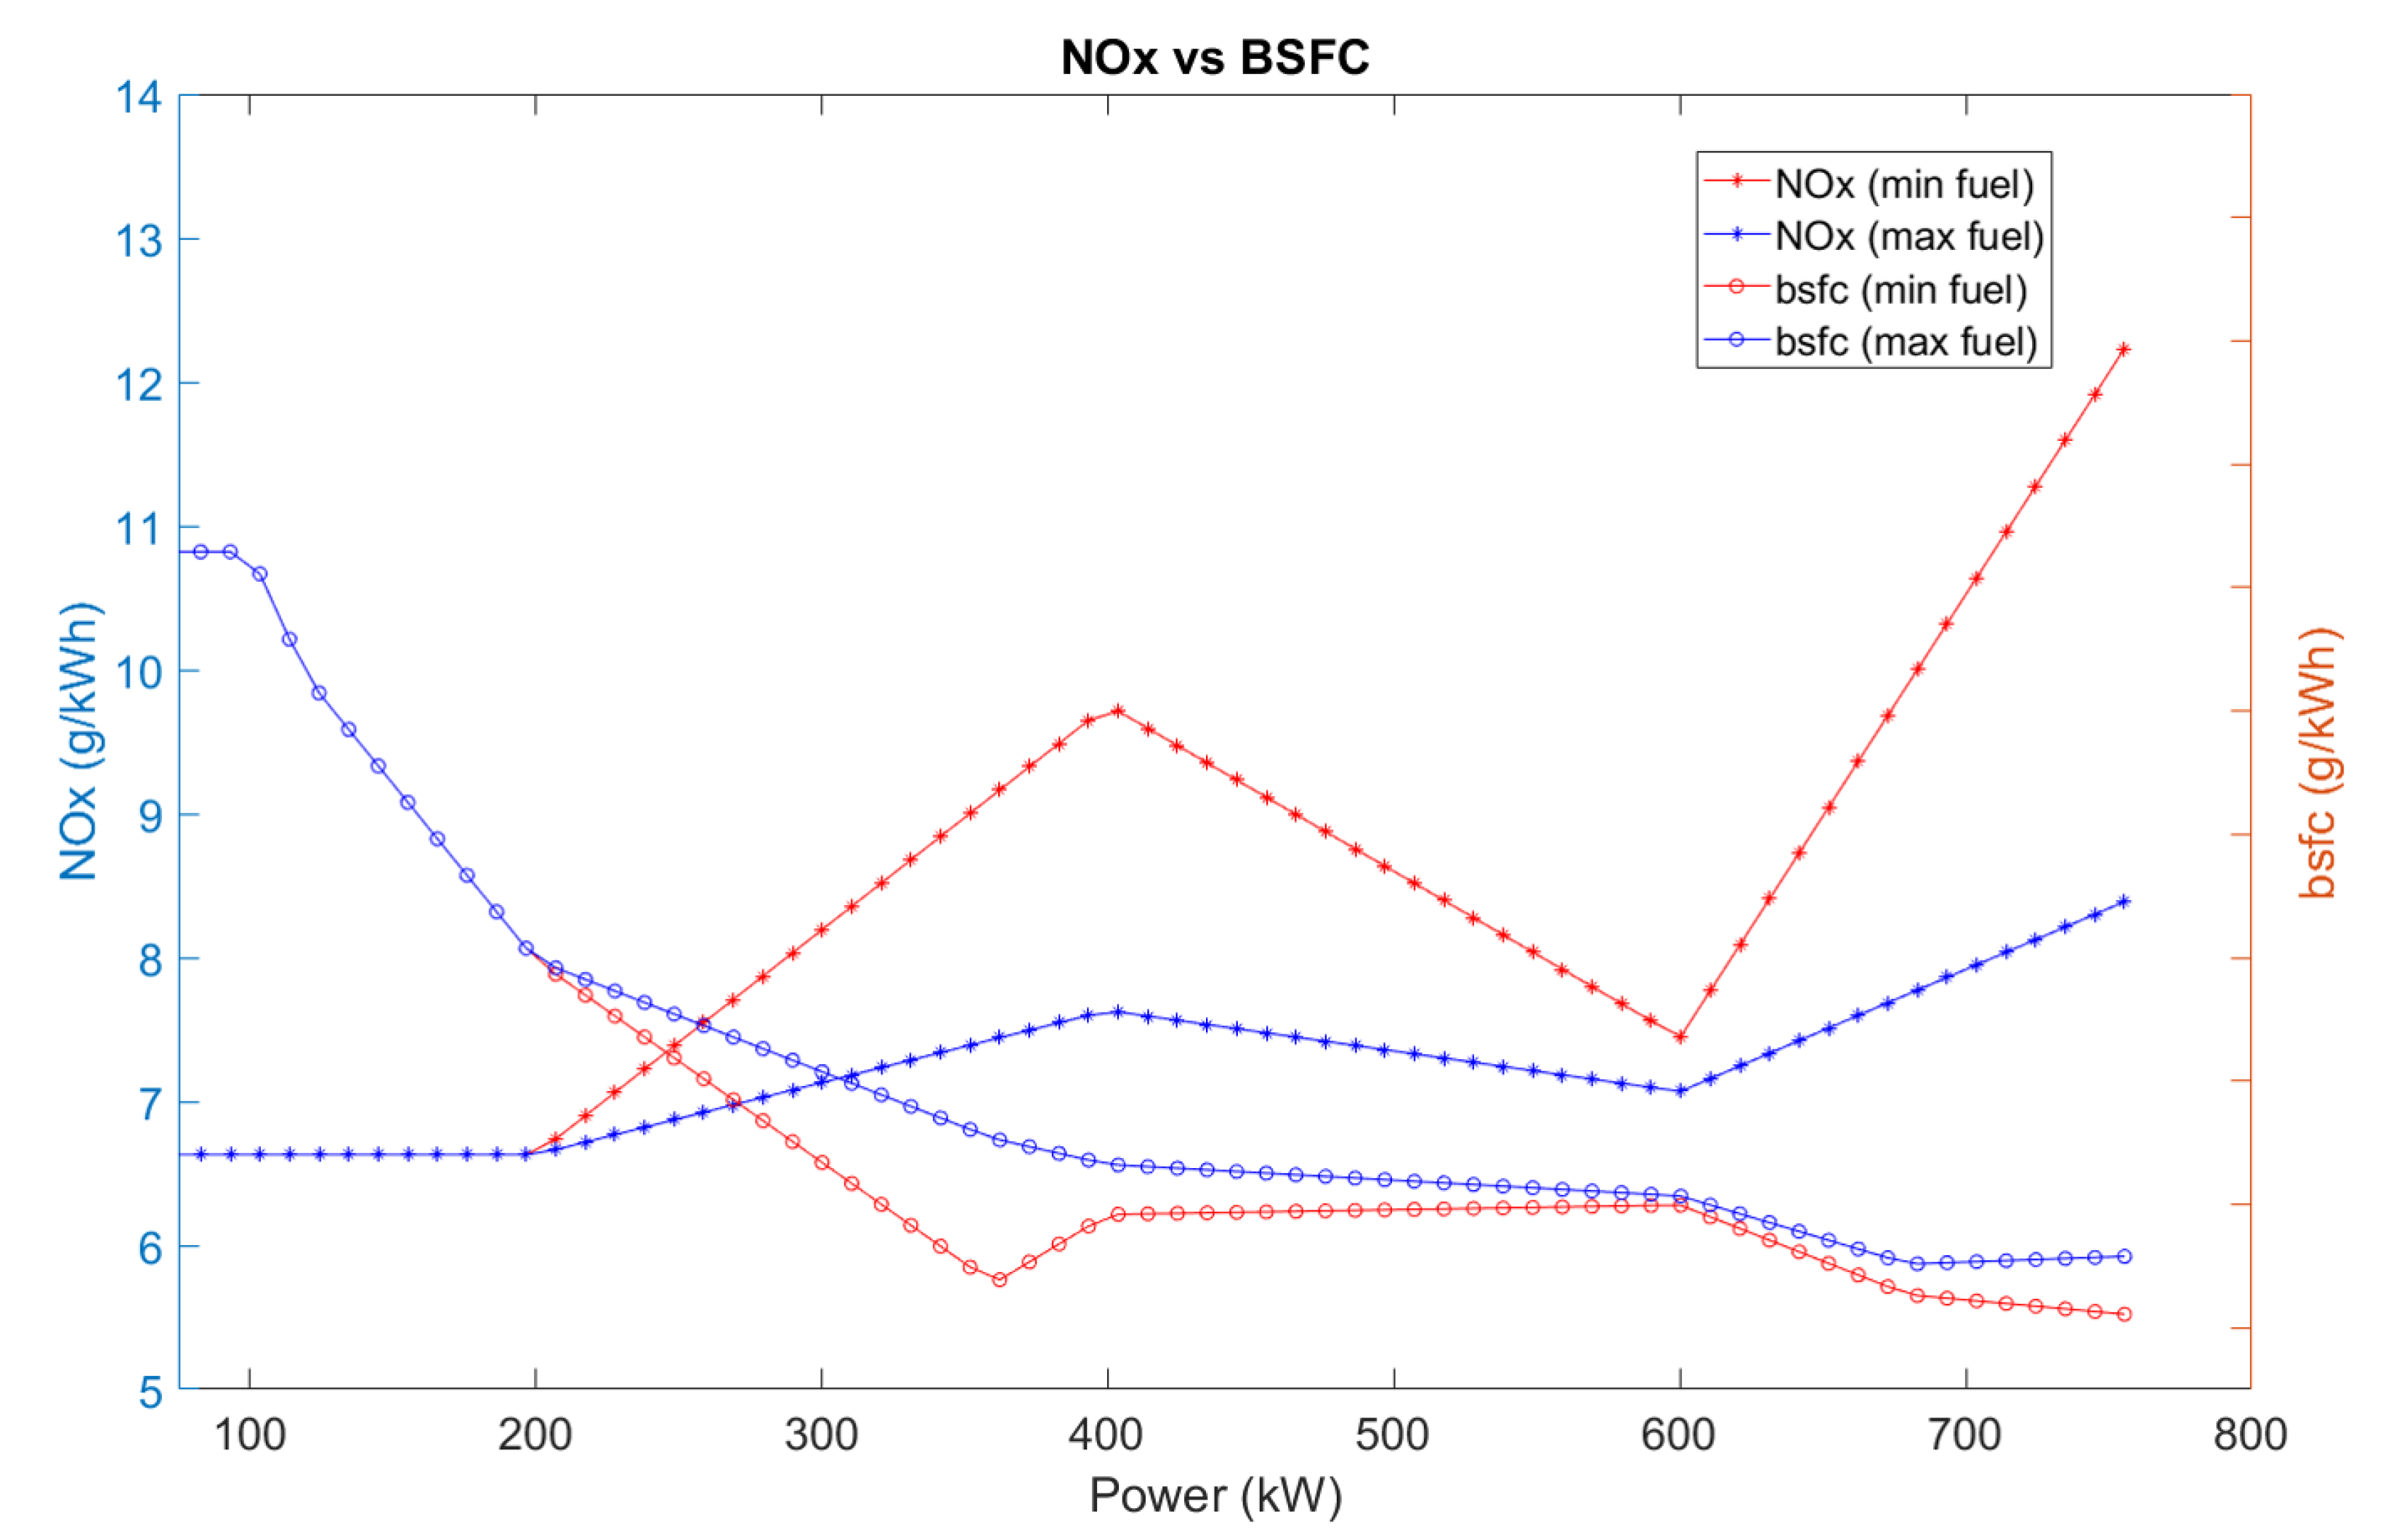
In STEP 1 and STEP 2 of the algorithm discussed in Section 3, k is chosen to be 4 due to computational capabilities. Hence, there are 4 12 possible N O x lines and by adding the condition of the IMO Tier II in Equation (1), all the eligible N O x lines are plotted in Figure 10. Within each eligible N O x line, the N O x limits of the points outside of the E2 test cycle are interpolated as demonstrated in Figure 11.
Each of the N O x limit sets are then used as constraints to solve the minimization problem in Equation (5) on the selected operating points (8 points used in this paper). Result of the minimization problem is a set of eight optimal values of the BSFC. In order to calculate the full working cycle fuel consumption, the BSFCs of other operating points within the whole power range are interpolated from these eight values of BSFC. The interpolation is shown in Figure 6.
The fuel consumption in accordance to each N O x line is then calculated by using the operational profile of the typical ferry. Results of the maximum BSFC consumed and the minimum BSFC consumed cases are shown in Table 5 alongside their respective total N O x produced.

4.2. Analysis

The proposed method delivers a sufficient optimization toolbox in which both emission legislation and operational profiles of diesel engines have been considered. In comparison with other brute-force methods, this method assures that the engine’s response is thoroughly optimized under the emission constraints and more importantly, the inclusion of the engine’s operational profiles gives the optimization procedure more flexibilities to balance the trade off between the emissions production and the fuel consumption. In that way, the engine operators are able to save fuel and follow the emission legislation at the same time.
Figure 12 shows the BSFC and the N O x emissions within the whole power range of both minimum fuel consumption and maximum fuel consumption cases. The trade-off between the BSFC and the N O x emissions is clearly shown in this result. It can be seen that the BSFC curves (with circles) and the N O x curves (with stars) are going in opposite directions. When the fuel consumption is high, the emissions is kept low and vice versa. Hence a good optimization strategy should be able to balance this trade-off in order to save the fuel but keep the emissions under the constraints. Furthermore, when comparing Figure 12 with the operational profile in Figure 1, it can be seen that at the loads where the ferry operates more frequently, the total N O x production is high and the fuel consumption is kept low. On the other hand, the N O x is low and the fuel used is high at the loads where the ferry seldomly operates.
Finding the best N O x lines is the most important problem in order to achieve a good optimization result. As posted in Equations (6) and (7), the value of k plays a big role in creating the possible N O x lines. More N O x lines means there are more possibilities to find a better optimization result. Nevertheless, higher values of k, which create more N O x lines, also cause problems for the computational complexity since the algorithm runs the optimization problem within each of the eligible N O x lines.
In Figure 13, effects of the engine parameters on the production of N O x emissions and the fuel consumption is demonstrated. The comparison is made by using the results of the maximum fuel consumption case and the minimum fuel consumption case. Furthermore, the crank angle at 50% of fuel burned (CA50, degree after top dead center) is used for analyzing instead of the SoI. As can be seen from the graph, an earlier injection creates more N O x emissions but slightly reduces the fuel consumption as it is expected that the start of injection has the biggest impact. Moreover, a high injection pressure would also reduce the fuel consumption but increase the N O x . A bigger controllability would have made a bigger impact of both P c h a r g e and FIP.

5. Discussion

The paper delivers an optimization method with promising results; however, there are things that can be improved in future works.
(1)
First of all, the models of the BSFC and the N O x can be improved by having more input parameters such as speed and load of the engine so that errors in the interpolation process of the BSFC can be avoided.
(2)
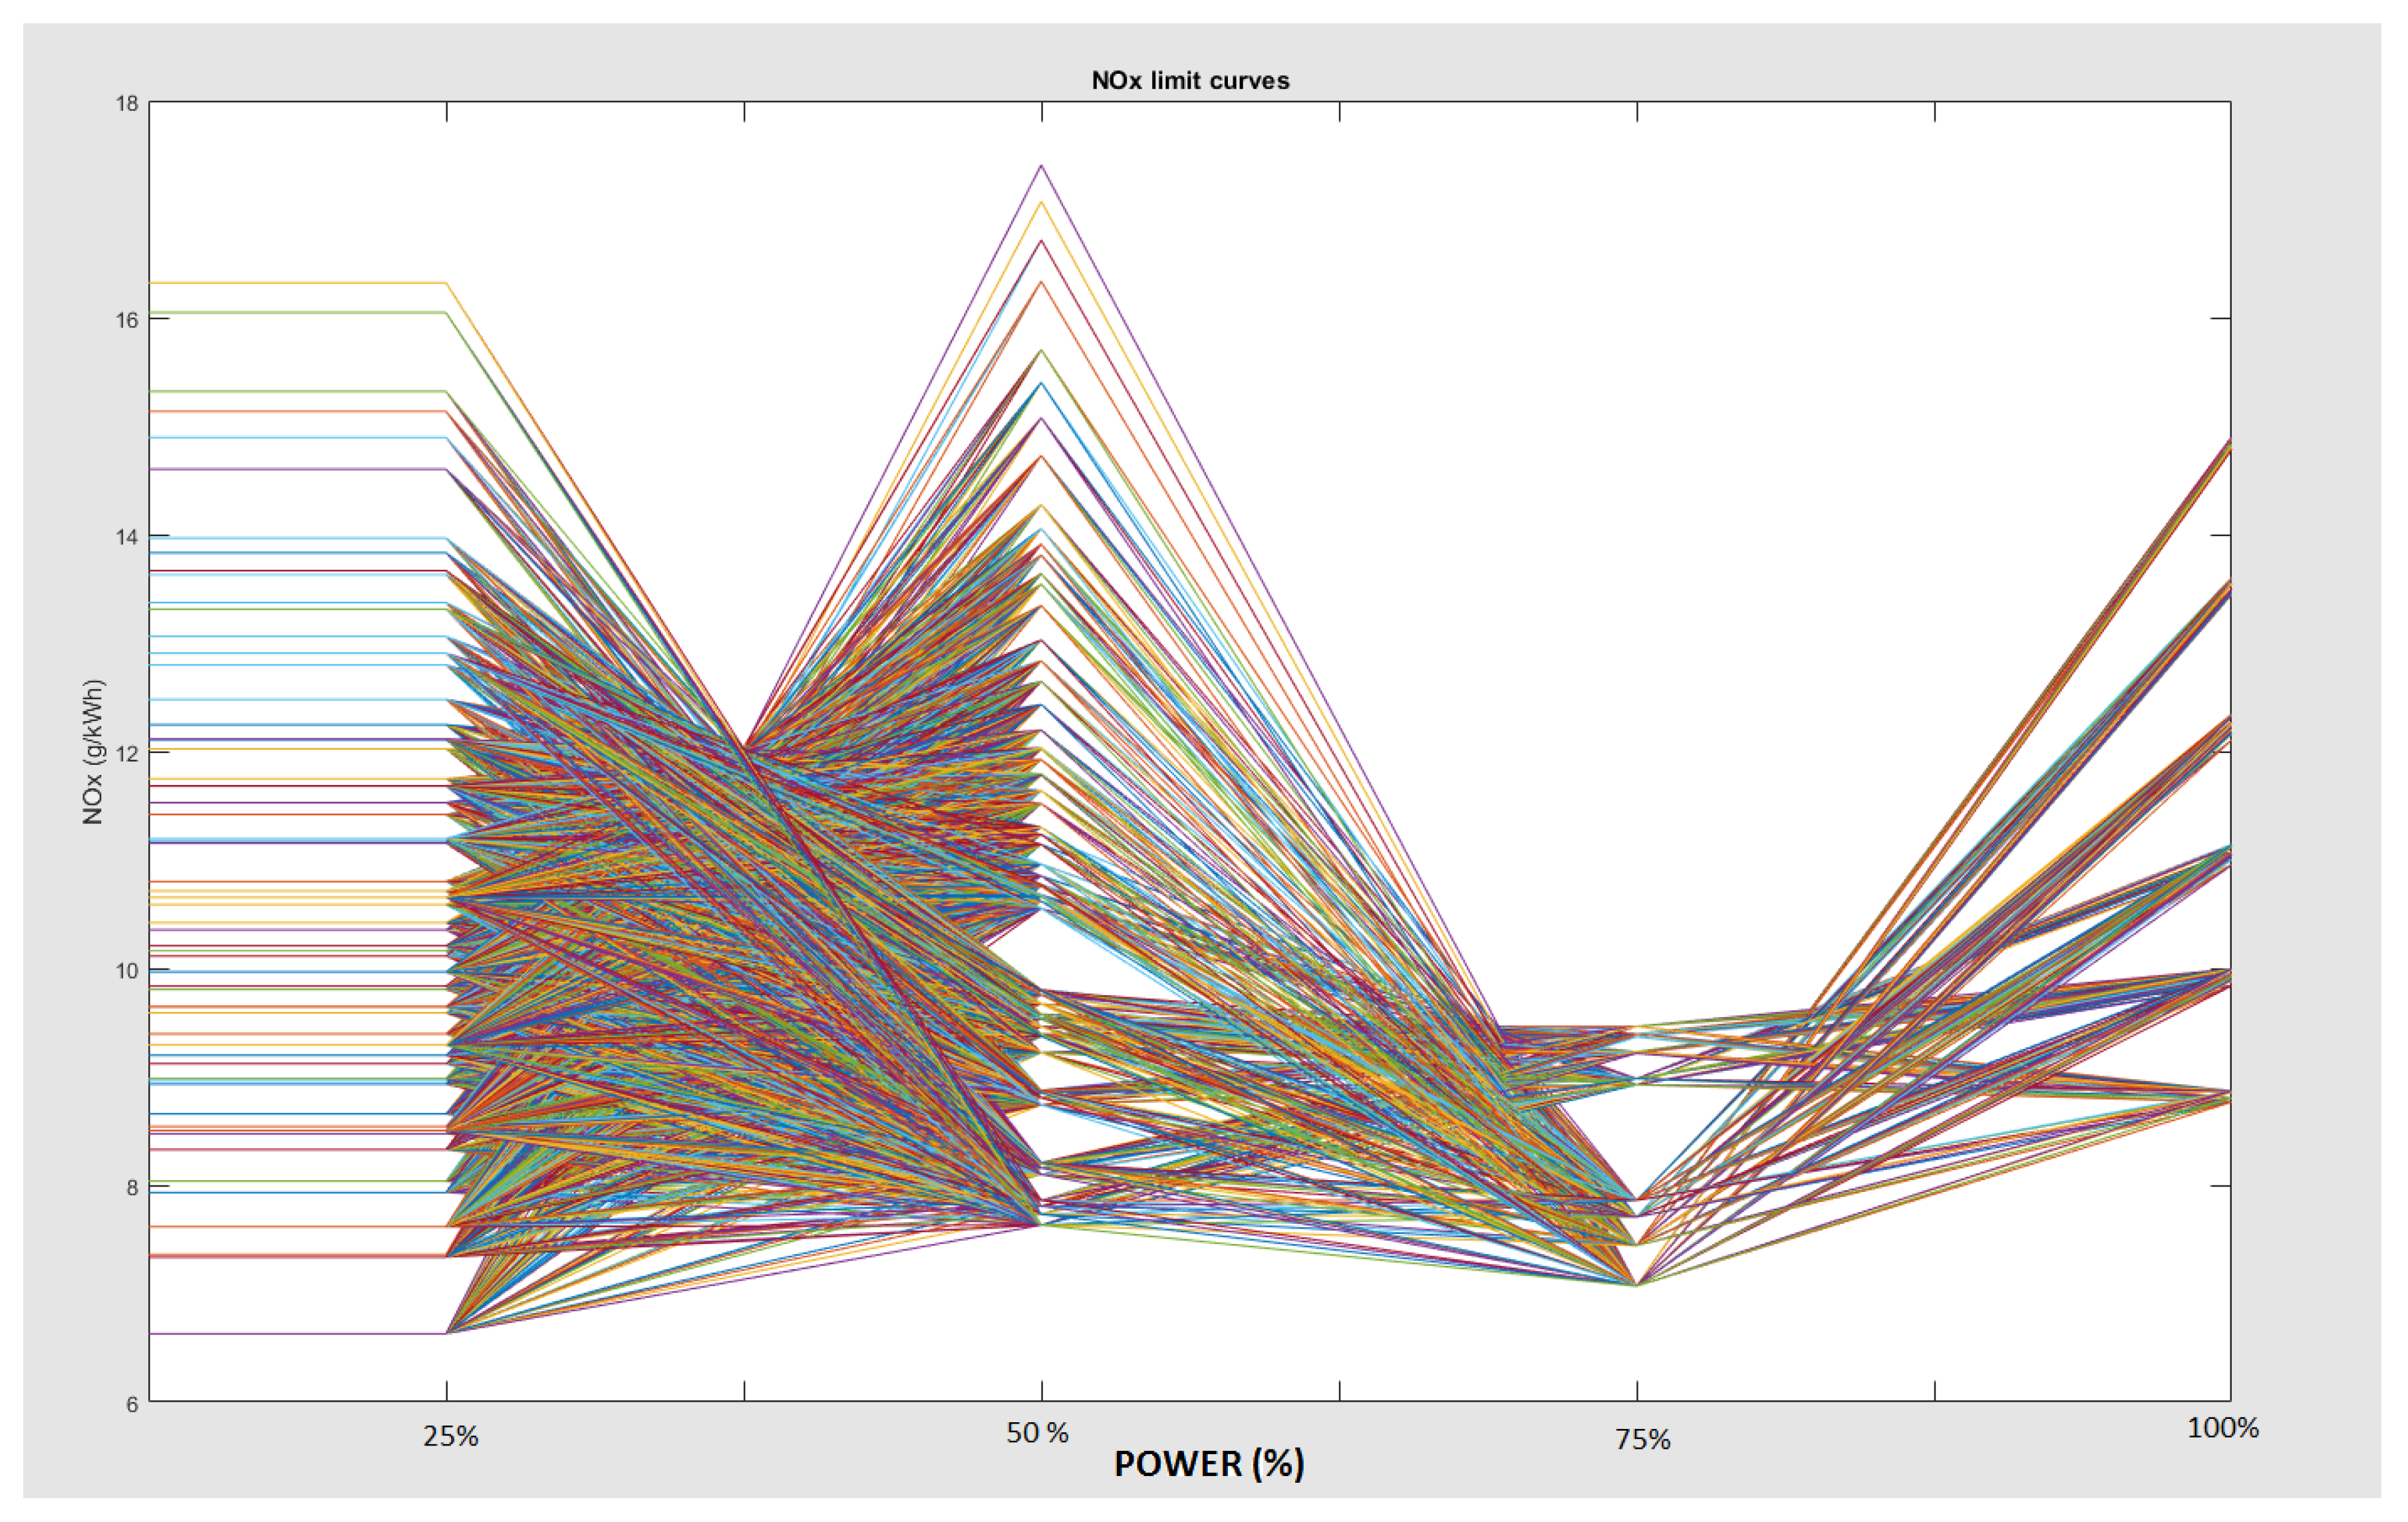
Secondly, in STEP 1 and STEP 2 of the algorithm, the value of k can be increased for higher accuracy but it requires more computational effort and resources. Furthermore, the functions f i ( P c h a r g e i , S o I i , F I P i ) could be made as continuous functions instead of discrete functions.
(3)
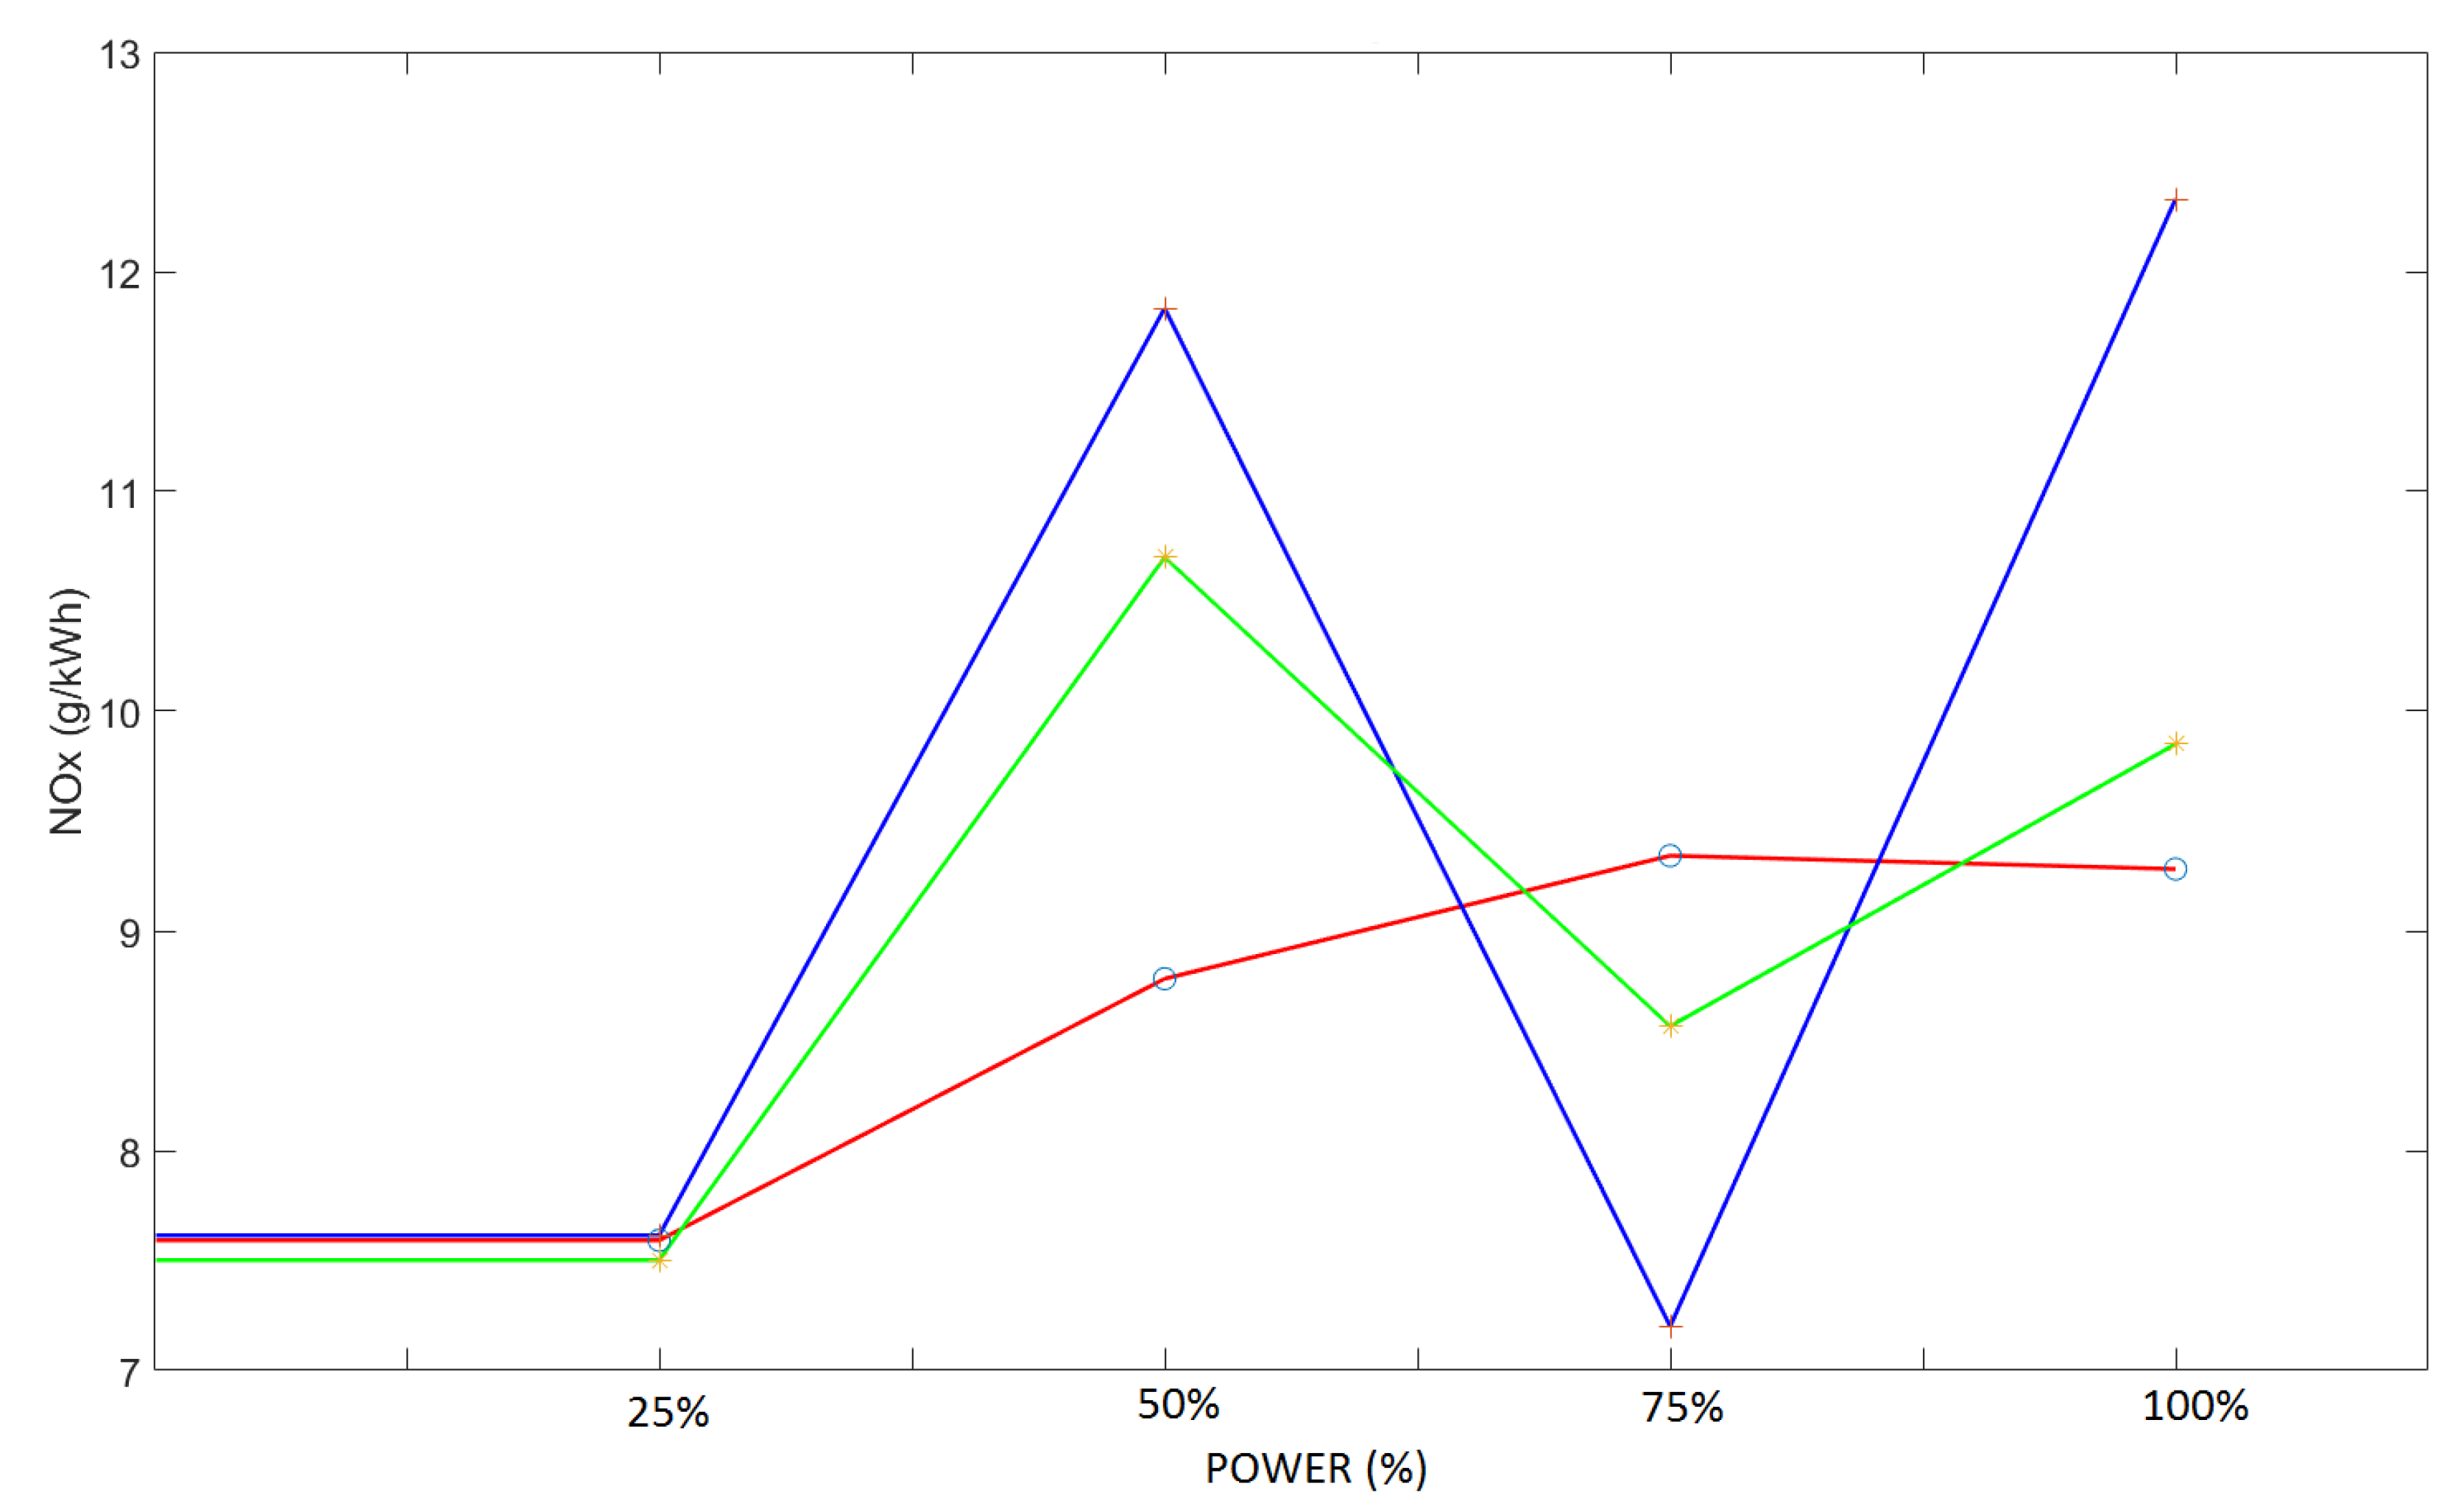
As the value of k increases, the number of possible N O x lines increases exponentially and more appropriate conditions should be applied alongside the IMO Tier II condition in (1). For instance, by using the fact that the BSFC and the N O x emissions have a direct trade-off, if the BSFC needs to be minimized then only maximum eligible N O x lines are taken. Hence, by reducing the number of eligible N O x lines, less computation will be needed.
(4)
It should be noticed that to reduce the total amount of fuel used, the total amount of emitted N O x is slightly increased although the N O x limits according to the IMO Tier II are still fulfilled. This fact shows the lack of coverage of the emission legislation. Due to this, different optimization strategies have a big difference in the total N O x emitted, as long as the limits are satisfied.
(5)
Last but not least, it would be better to include more physical constraints to the optimization algorithm rather than only the N O x emissions constraint. The thermal load of the engine, the soot limit or the C O x emissions would make the optimizer become more sufficient.

6. Conclusions

In this paper, an operational profile based optimization method, targeting large bore, medium-speed maritime diesel engines, is demonstrated with promising results. This method aims for fuel efficiency and fulfilling the IMO emission regulations. The main conclusions of this paper can be stated as follows:
(1)
The optimization method has been proven to be capable of saving fuel consumption and fulfilling the IMO Tier II emission regulation (E2 test cycle in particular).
(2)
Using operational profile for optimizing the fuel consumption creates more possibilities to calibrate the engines according to their working cycles. Flexible settings are needed for the engines to operate in different conditions and applications.
(3)
By using different N O x constraints (different N O x lines), the total fuel consumption can be optimized to serve different purposes while the IMO Tier II is still fulfilled. In Table 5, the difference between the minimum and the maximum fuel consumption during a working cycle of 5000 h is around 17 tons (approximately 3.1%) while the according produced N O x difference is around 25%. This shows a lot of opportunities for the engine calibration to balance the trade-off between the BSFC and the N O x emissions.

Author Contributions

Conceptualization, J.H.; Data curation, H.N.K. and X.S.; Methodology, H.N.K. and X.S.; Project administration, K.Z. and J.H.; Software, H.N.K.; Supervision, K.Z. and J.H.; Writing—original draft, H.N.K.; Writing—review and editing, K.Z., X.S. and J.H. All authors have read and agreed to the published version of the manuscript.

Funding

The authors are grateful to the EU project HERCULES 2 (Grant No. 634135-2), funded by the European Commission, Grant No. 634135-2.

Conflicts of Interest

The authors declare no conflict of interest.

Abbreviations

The following abbreviations are used in this manuscript:
BSFCBrake Specific Fuel Consumption
IMOInternational Maritime Organization
N O x Nitrogen Oxides
FIPFuel Injection Pressure
SoIStart of Injection
DoEDesign of Experiments
RSMResponse Surface Methods
FSHPFolding, Shrinking Hyper Parallelepiped

Appendix A

The response surfaces of BSFC and N O x emissions at 1000 RPM and 200-400-600-800 kW are shown in the following figures.
Figure A1. Response surface of the BSFC & N O x at 1000 RPM-200kW.
Energies 13 02575 g0a1
Figure A2. Response surface of the BSFC & N O x at 1000 RPM-400kW.
Energies 13 02575 g0a2
Figure A3. Response surface of the BSFC & N O x at 1000 RPM-600kW.
Energies 13 02575 g0a3
Figure A4. Response surface of the BSFC & N O x at 1000 RPM-800kW.
Energies 13 02575 g0a4

References

  1. Montgomery, D.; Reitz, R.D. Six-mode cycle evaluation of the effect of EGR and multiple injections on particulate and NOx emissions from a DI diesel engine. SAE Trans. 1996, 105, 356–373. [Google Scholar]
  2. Rao, S.; Desai, R. Optimization theory and applications. IEEE Trans. Syst. Man Cybern. 1980, 10, 280. [Google Scholar] [CrossRef]
  3. Lenz, U.; Schroeder, D. Artificial Intelligence for Combustion Engine Control; Technical Report, SAE Technical Paper 960328; SAE International: Warrendale, PA, USA, 1996. [Google Scholar]
  4. Tsao, G.M.; Chang, T.; Tsao, K. An Expert System Based Approach to Internal Combustion Engine Experimentation; Technical Report, SAE Technical Paper 910052; SAE International: Warrendale, PA, USA, 1991. [Google Scholar]
  5. Pilley, A.; Beaumont, A.; Robinson, D.; Mowll, D. Design of experiments for optimization of engines to meet future emissions targets. In Proceedings of the 27th International Symposium on Automotive Technology and Automation, Aachen, Germany, 31 October–4 November 1994. [Google Scholar]
  6. Edwards, S.P.; Pilley, A.; Michon, S.; Fournier, G. The Optimisation of Common Rail FIE Equipped Engines Through the Use of Statistical Experimental Design, Mathematical Modelling and Genetic Algorithms. SAE Trans. 1997, 106, 505–523. [Google Scholar]
  7. Montgomery, D.; Reitz, R. Applying design of experiments to the optimization of heavy-duty diesel engine operating parameters. In Statistics for Engine Optimization; Edwards, S., Grove, D., Wynn, H., Eds.; Professional Engineering Publishing Ltd.: London, UK, 2000. [Google Scholar]
  8. Toyoda, M.; Shen, T. D-optimization based mapping calibration of air mass flow in combustion engines. In Proceedings of the 2016 European Control Conference (ECC), Aalborg, Denmark, 29 June–1 July 2016; pp. 1259–1264. [Google Scholar]
  9. Langouët, H.; Métivier, L.; Sinoquet, D.; Tran, Q.H. Engine calibration: Multi-objective constrained optimization of engine maps. Optim. Eng. 2011, 12, 407–424. [Google Scholar] [CrossRef]
  10. Montgomery, D.T.; Reitz, R.D. Optimization of heavy-duty diesel engine operating parameters using a response surface method. SAE Trans. 2000, 109, 1753–1765. [Google Scholar]
  11. Baldi, F.; Larsen, U.; Gabrielii, C. Comparison of different procedures for the optimisation of a combined Diesel engine and organic Rankine cycle system based on ship operational profile. Ocean Eng. 2015, 110, 85–93. [Google Scholar] [CrossRef] [Green Version]
  12. Knafl, A.; Stiesch, G.; Friebe, M. Optimal utilization of air- and fuel-path flexibility in medium-Speed diesel engines to achieve superior Performance and fuel Efficiency. In Proceedings of the 27th CIMAC World Congress on Combustion Engine Technology, Shanghai, China, 13–16 May 2013. [Google Scholar]
  13. Khac, H.N.; Zenger, K. Designing optimal control maps for diesel engines for high efficiency and emission reduction. In Proceedings of the 2019 18th European Control Conference (ECC), Naples, Italy, 25–28 June 2019; pp. 1957–1962. [Google Scholar] [CrossRef] [Green Version]
  14. Abdullah, N.R.; Shahruddin, N.S.; Mamat, R.; Ihsan Mamat, A.; Zulkifli, A. Effects of air intake pressure on the engine performance, fuel economy and exhaust emissions of a small gasoline engine. J. Mech. Eng. Sci. 2014, 6, 949–958. [Google Scholar] [CrossRef]
  15. Richard, S. Introduction to Internal Combustion Engines; Palgrave Macmillan: London, UK, 2012. [Google Scholar]
  16. Xu, Z.; Li, X.; Guan, C.; Huang, Z. Effects of injection pressure on diesel engine particle physico-chemical properties. Aerosol Sci. Technol. 2014, 48, 128–138. [Google Scholar] [CrossRef] [Green Version]
  17. Jayashankara, B.; Ganesan, V. Effect of fuel injection timing and intake pressure on the performance of a DI diesel engine—A parametric study using CFD. Energy Convers. Manag. 2010, 51, 1835–1848. [Google Scholar] [CrossRef]
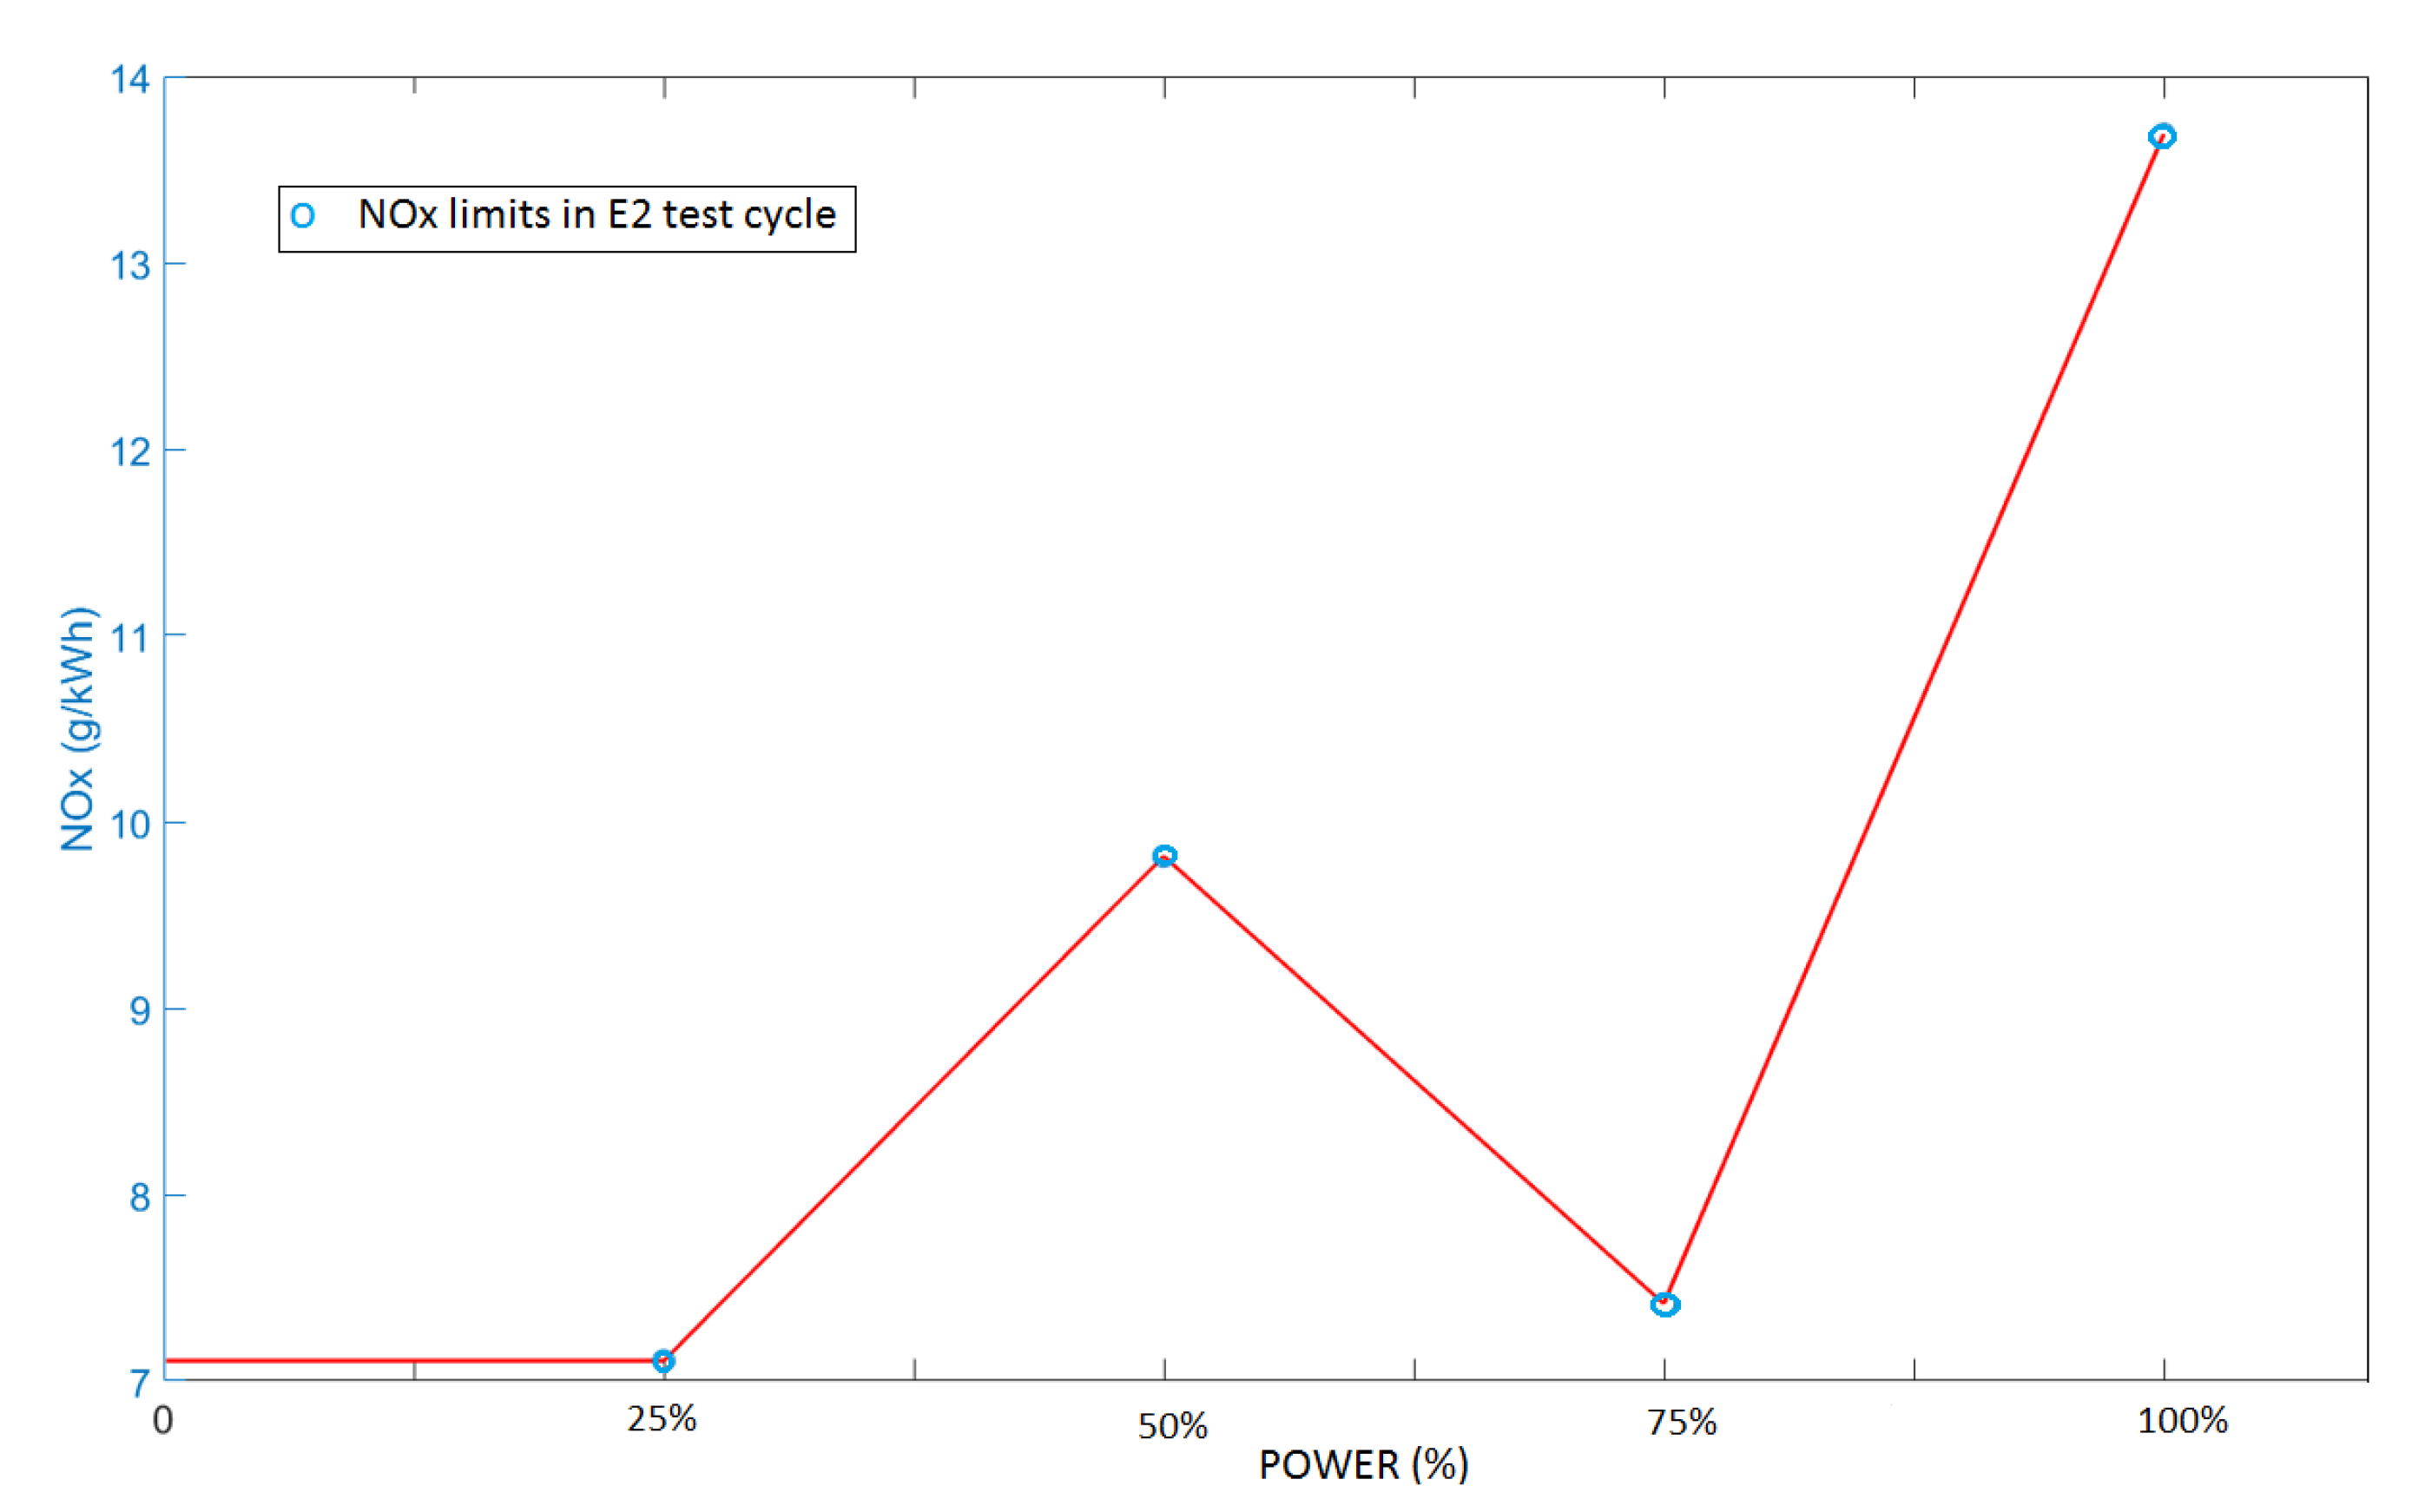
  18. VI, R.M.A. Regulations for the Prevention of Air Pollution from Ships and NOX Technical Code 2008; International Maritime Organization: London, UK, 2009. [Google Scholar]
  19. Mathews, P.G. Design of Experiments with MINITAB; ASQ Quality Press: Milwaukee, WI, USA, 2005. [Google Scholar]
  20. Boggs, P.T.; Tolle, J.W. Sequential quadratic programming. Acta Numer. 1995, 4, 1–51. [Google Scholar] [CrossRef] [Green Version]
Figure 1. Example of a load profile for a typical ferry engine.
Energies 13 02575 g001
Figure 2. IMO N O x emission limits.
Energies 13 02575 g002
Figure 3. IMO E2 test cycle.
Energies 13 02575 g003
Figure 4. Three different N O x lines of three different engine settings.
Energies 13 02575 g004
Figure 5. Examplary of eligible N O x lines.
Energies 13 02575 g005
Figure 6. Exemplary of bsfc interpolation over the power range.
Energies 13 02575 g006
Figure 7. Manual valves to control the charged air pressure.
Energies 13 02575 g007
Figure 8. Response surface of the BSFC at one operating point.
Energies 13 02575 g008aEnergies 13 02575 g008b
Figure 9. Response surface of the N O x at one operating point.
Energies 13 02575 g009aEnergies 13 02575 g009b
Figure 10. Eligible N O x lines.
Energies 13 02575 g010
Figure 11. Interpolation of N O x limits within the power range.
Energies 13 02575 g011
Figure 12. Demonstration of the trade-off between the BSFC and N O x emissions.
Energies 13 02575 g012
Figure 13. Effects of engine parameters on the BSFC and the N O x emissions.
Energies 13 02575 g013
Table 1. E-2 test cycle [18].
Speed (%)100100100100
Power (%)255075100
Weighting factor0.150.150.50.2
Table 2. WÄRTSILÄ 4L20 engine specifications.
Cylinder number4
Cylinder bore200 mm
Piston stroke280 mm
Swept volume0.0088 m 3
Rated speed1000 rpm
Rated power800 kW
Table 3. Analytic instruments.
ParametersDevices
N O x Eco Physics CLD 822 M hr
CO, C O 2 Siemens Ultramat 6
HydrocarbonsJ.U.M.VE7
Cylinder pressureKistler KiBox
Injection timingCurrent probe
Fuel consumptionHBM weight cell, Sartorius X3
Table 4. Selection of operating point.
Speed (rpm)1000900800700600
Load (kW)
100 kW
150 kW
200 kW
300 kW
400 kW
600 kW
800 kW
Table 5. The BSFC and N O x emissions results.
Yearly fuel consumption (tons)
Minimum FuelMaximum FuelPercentage
CaseCase(Min-Max)
550.9567.3−3.1%
Yearly NO x produced (tons)
Minimum FuelMaximum FuelPercentage
CaseCase(Min-Max)
24.719.725.4%

