Article

Development of an Integrated Assessment Model at Provincial Level: GCAM-Korea

Department of Energy Systems Research, Ajou University, Suwon 16449, Korea
*
Author to whom correspondence should be addressed.
Energies 2020, 13(10), 2565; https://doi.org/10.3390/en13102565
Submission received: 20 April 2020 / Revised: 12 May 2020 / Accepted: 14 May 2020 / Published: 18 May 2020
(This article belongs to the Special Issue Applied Energy System Modeling 2018)

Abstract

:
Integrated assessment modeling at a higher spatial scale is a prerequisite for deriving region-specific implications from the model. The Global Change Assessment Model (GCAM) was chosen for GCAM-Korea, a detailed integrated assessment model (IAM) of Korea’s socioeconomic and energy systems. GCAM-Korea is developed based on GCAM-USA. Data for 16 provinces have been collected from various sources. Some data have been pre-processed to fit within the specific structure of GCAM-USA data. Other types of data were newly added through new structures. The model results were validated to be compatible with historical trends. It was found that provincial energy plans or policies could be compiled in detail using the proposed model while maintaining consistency with national level modeling results. The cross-border air pollution issue in Northeast Asia could also be addressed by combining GCAM-Korea and air quality models in the future.

Graphical Abstract

1. Introduction

In the development of an integrated assessment model (IAM), higher spatial resolution offers various advantages. Easterling [1] suggested 10 reasons why regional study is necessary in view of the IAM. Rotmans [2] highlighted two advantages of regional IAM:
i) Integrated assessments can focus on concrete societal problem, issues which are already at stake in a specific region, ii) Integrated assessments can be made geographically-explicit, which allows for visualizing the trade-offs between problems, sectors, resources and scale levels to be made.
Giupponi et al. [3] pointed out that “introducing spatial and actor heterogeneity” is one of the priorities as IAM evolves. In Hamilton et al. [4], ‘spatial scale’ was highlighted as one of the 10 dimensions for IAM to be concerned. According to the previous studies, capturing the heterogeneity within regions (nations, states, provinces, even GIS (Geographic information system)-level) is a main motivation for modeling IAM at a more detailed spatial scale. Of course, this begs the question of just how detailed a model’s spatial resolution should be. The answer could depend on multiple factors: how detailed of a spatial scale do stakeholders and researchers want, how the model represents the various types of fields including socioeconomics, energy, hydrology, land use, emission, etc. and if there are enough data available. In the case of GCAM-Korea, the rationale for developing provincial-level modeling is discussed below.
Korea has a system of local autonomy comprised of nine provinces and eight independent metropolitan areas. The newest metropolitan area, Sejong city, was established in 2012 and became the 17th high-level local government (in this study, all 17 metropolitan areas and provinces are simply referred to as “provinces”). Within these high-level jurisdictions, there are 226 lower-level local governments (75 cities, 82 counties and 69 districts) [5]. Historically, the provinces have displayed unbalanced growth, while Korea’s economy grew rapidly based on the growth pole strategy [6]. This rapid growth was associated with accelerating urbanization and industrialization. Seoul and the other metropolitan cities mostly led the development of Korea [7]. This geographically concentrated development also determined population patterns. Currently, 70% of Korea’s population resides in urban areas [8]. Additionally, 47% of Korea’s GDP was counted in Seoul [9].
Every five years, the Korean government establishes a “National Energy Master Plan” for long-term, comprehensive national energy planning. In the latest plan (2019–2040), one of the provisions emphasizes the local government’s responsibility and the role of provincial energy plans. In particular, the provision calls for the “Provincial Energy Plan,” which is expected to be established by local governments every five years. It is noted that the provincial energy plans should be established in conjunction with the national energy plan. For example, the total amount of the energy demand separately planned at the provincial level should add up to the nationally planned one. However, it would be difficult to maintain consistency between the provincial and national levels unless there a model is developed that contains all provincial energy systems and the national system simultaneously.
For such purposes of modeling at the provincial level, thus far, six provinces have used econometric models, five provinces employed the Model for Analysis of Energy Demand (MAED) [10] and three provinces used the RIEEE (Research Institute for Energy, Environment and Economy) model developed by Kyungpook National University [11]. Unfortunately, those efforts model neither supply and transmission sectors nor provincial energy systems consistently with the national one. For the other provinces’ energy plan, the methodology or model could not be identified [12,13,14,15]. A summary of such discussions can be provided as shown in Table 1.
In part to address this shortcoming, GCAM was chosen as a base platform for the development of a model capable of incorporating Korea’s provincial energy systems. The application of GCAM for such development provides several advantages. First, the GCAM energy system represents final demand sectors as well as the supply and transformation sectors. Second, all provincial energy systems can be modeled under the national energy system, which makes the analysis of provincial level consistent with that of national level. Third, endogenously calculated resource prices ensure that supply and demand are balanced at equilibrium prices. Fourth, competition among technologies is modeled using the conditional logit model of McFadden [16] in GCAM, which can avoid the winner-takes-all phenomenon occurring in linear programming-based models [17,18].
With these points in mind, this study aims to (i) develop a Korean provincial-level energy system model, GCAM-Korea, so that provincial heterogeneity can be captured, (ii) open the model for reproducibility and transparency (See Appendix A) and (iii) compare the model results with historical values for empirical validation. For a fuller explanation of the base platform model, GCAM and other region-specific GCAM models are introduced in Section 2.1 and Section 2.2. The process of modeling GCAM-Korea is explained in Section 2.3 in terms of socioeconomics (Section 2.3.1), energy balance (Section 2.3.2), electricity transformation (Section 2.3.3) and end-use sector (Section 2.3.4). Validation of model results follows in Section 3. Finally, the vision for GCAM-Korea is discussed in Section 4.

2. Methodology and Data

2.1. Global Change Assessment Model

GCAM is an integrated assessment model developed by the Joint Global Change Research Institute (JGCRI), a joint research group between the Pacific Northwest National Laboratory and the University of Maryland [32]. The current version of GCAM (v5.1) represents the interactions of the economy, energy, agriculture, land use, emission, climate and water systems [33,34]. According to Kim et al. [33], GCAM is designed to provide technology detail with a ‘bottom-up’ approach within a ‘top-down’ economic structure. Calvin et al. [35] introduced GCAM v5.1’s new features such as water demand and an improved data processing system. GCAM has been broadly applied in a variety of studies. For example, GCAM was chosen to create the representative concentration pathways for the IPCC’s Fifth Assessment Report (AR5) and the shared socioeconomic pathways (SSPs) and scenarios for the Climate Change Science Program [36,37,38].
GCAM has global coverage in the form of 32 separate regions and it runs for every five years until 2100 based on calibration year of 2010. As a partial equilibrium model, GCAM solves global market equilibrium prices of energy resources such as coal, natural gas and crude oil. Supply curves reflecting the extraction costs of the primary energy resources are given. Primary energies are transformed into secondary ones in transformation sectors, for example, from crude oil to refined liquids in refinery. Final service demands, generally speaking, are driven by price of service demand, population, and income with some additional parameters. Essentially, iterative adjustments of the global market prices continue until the equilibrium of supply and demand is found. Finally, all of the markets are cleared with equilibrium prices.
To be parsed into GCAM, the format of the input data is Extensible Markup Language (XML). The process of generating XML files is called the gcamdata system [39]. The gcamdata system imports comma-separated values (CSV) files and exports XML files through primary assumptions and three levels of data: levels 0, 1 and 2. Level 0 data means raw data such as IEA energy balance. Levels 1 and 2 data means pre-processed data from raw data (level 0 data). In the final step, batches of level 2 data make XML files. The entire gcamdata system is processed by an R package, simply called gcamdata.

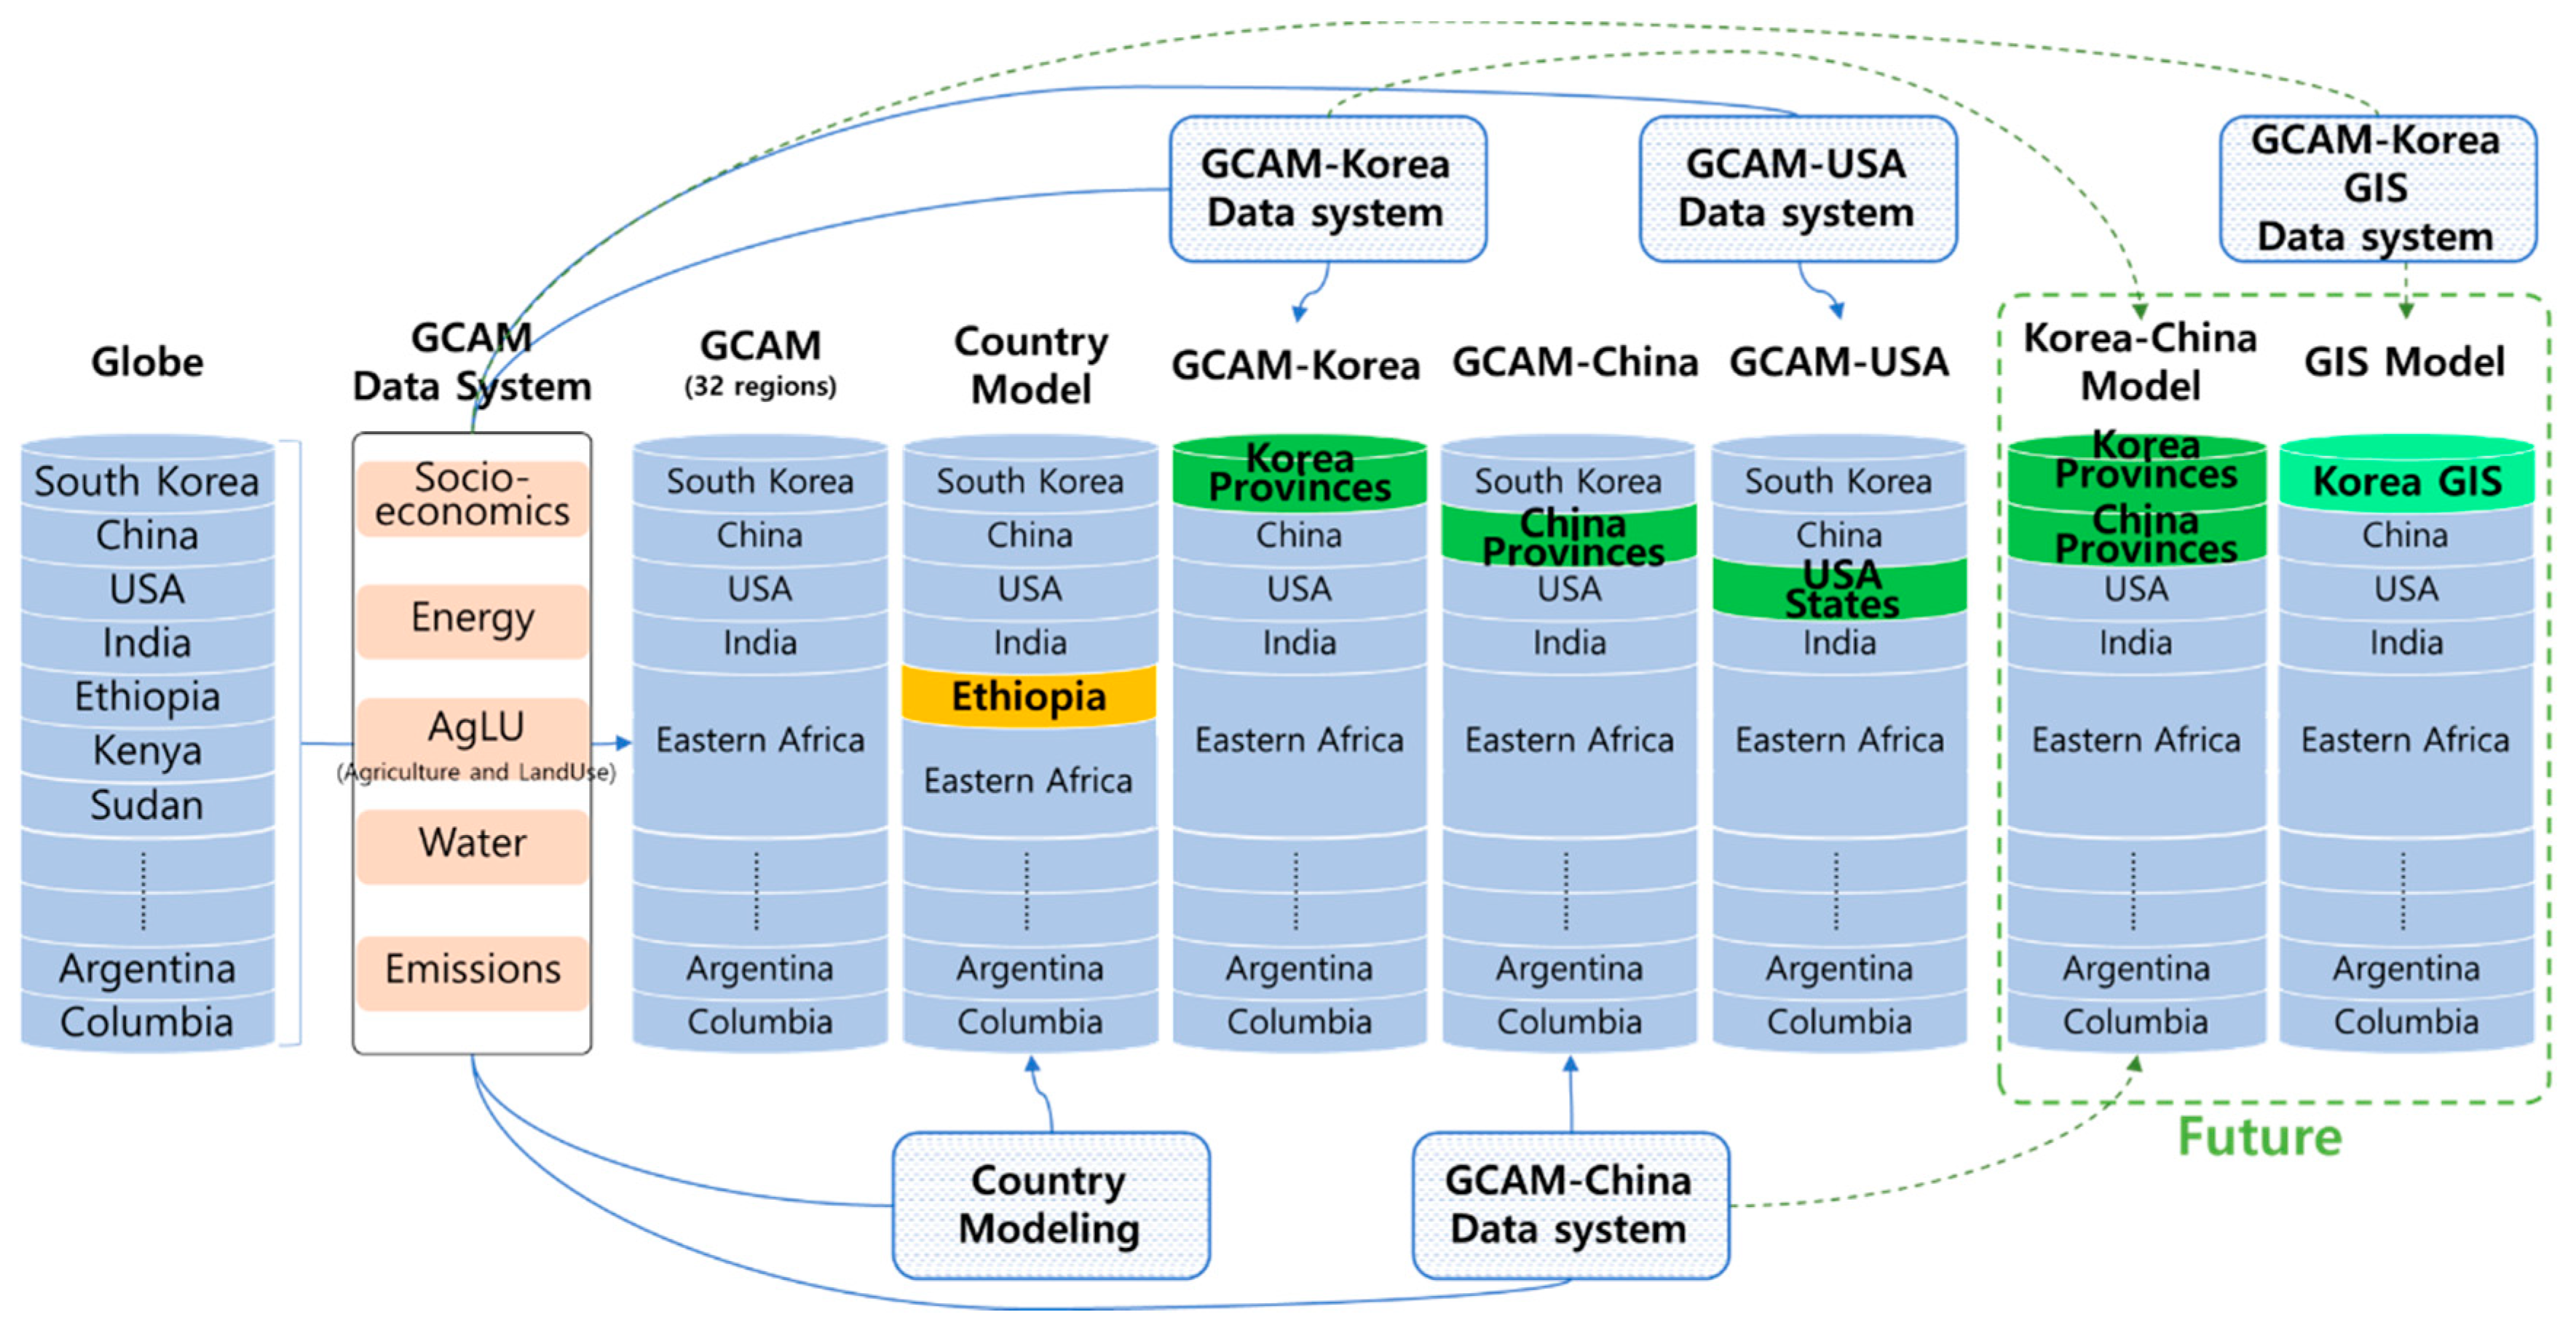
2.2. Overview of Region-Specific GCAM Models

The data framework of GCAM is designed to be flexible such that the input structure determines the model structure. Owing to flexible data structure, the spatial representation of GCAM could be modified in various scales—detaching a country from an aggregated region [40], disaggregating a country into provinces (states) and even more as shown in Figure 1. The country model by Yurnaidi and Kim [41] analyzes biomass utilization and its policies in Ethiopia, a modification of GCAM in a country scale, separately from eastern African region, one of aggregated regions in GCAM. Furthermore, GCAM could be modeled at higher spatial resolution. Some region-specific versions have been developed such as GCAM-USA, as well as those for China, India, Canada and Boston. Chaturvedi et al. [42] experimented with the ability of GCAM to capture the historical trends using a building-focused GCAM in which the building sector of the USA is disaggregated into 50 states. Zhou et al. [43] also used the 50-state buildings energy model to capture the heterogeneity among the states. Kyle et al. [44] improved spatial resolution of the midwestern United States to study its importance in agriculture and land-use sector analysis. Shi et al. [45] compared the emissions of GCAM-USA with EPA inventories as well as particulate matter, which broke the barrier between IAM and air quality management. Iyer et al. [46] used GCAM-USA to investigate pathways to reach an 80% greenhouse gas emissions reduction by 2050. Bond-Lamberty et al. [39] described an improved data processing system, including the structure of the GCAM-USA data system. Yu et al. [47,48] analyzed the Chinese building sector within disaggregated regions. Yu et al. [49,50] examined the role of nuclear and CCUS deployment in China to see the policy impact on low-carbon society using GCAM-China. Chen et al. [51] formed China’s emission pathway at provincial-level, using GCAM-TU (Tsinghua University version). Yu et al. [52] constructed GCAM-India and GCAM-Gujarat. GCAM-India represents India’s building sector with detailed types and services. As an embedded part in GCAM-India, GCAM-Gujarat has been developed to focus on Gujarat’s building sector.
A notable feature of GCAM-USA is that it is an open source model on GitHub [32] as an embedded structure in GCAM. GCAM-USA represents energy and socioeconomic components at the state level, and includes all 50 states as well as the District of Colombia. In addition to better spatial resolution, the modeling of electricity trade among grid regions as well as states within a grid region is being discussed. Even though it is not found in the open source GCAM-USA model, the modeling of load duration curves has been implemented by Iyer [53]. Some parts of the energy system, however, are still represented at the national level, as shown in Table 2.

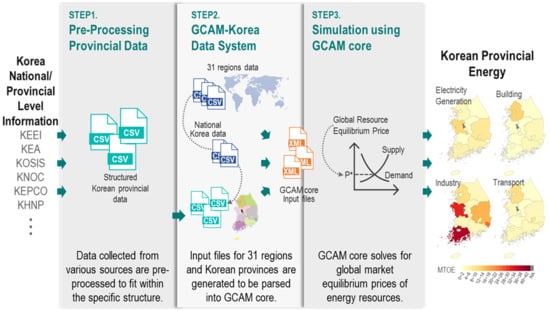
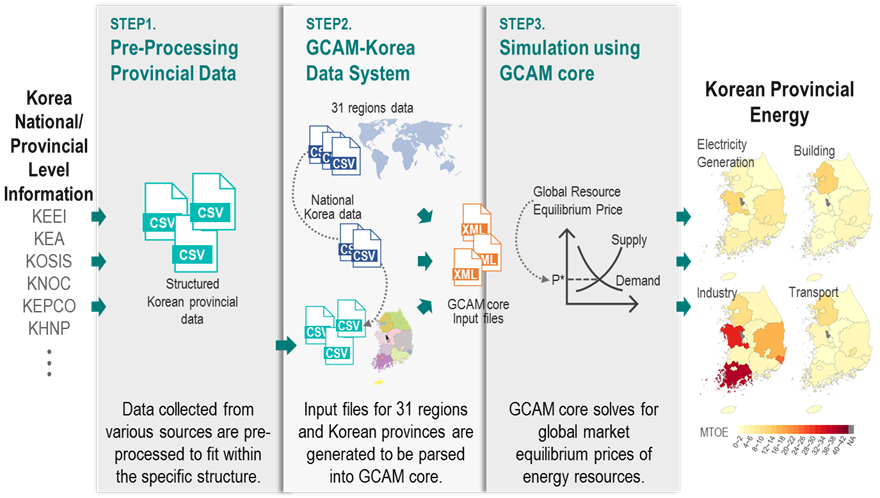
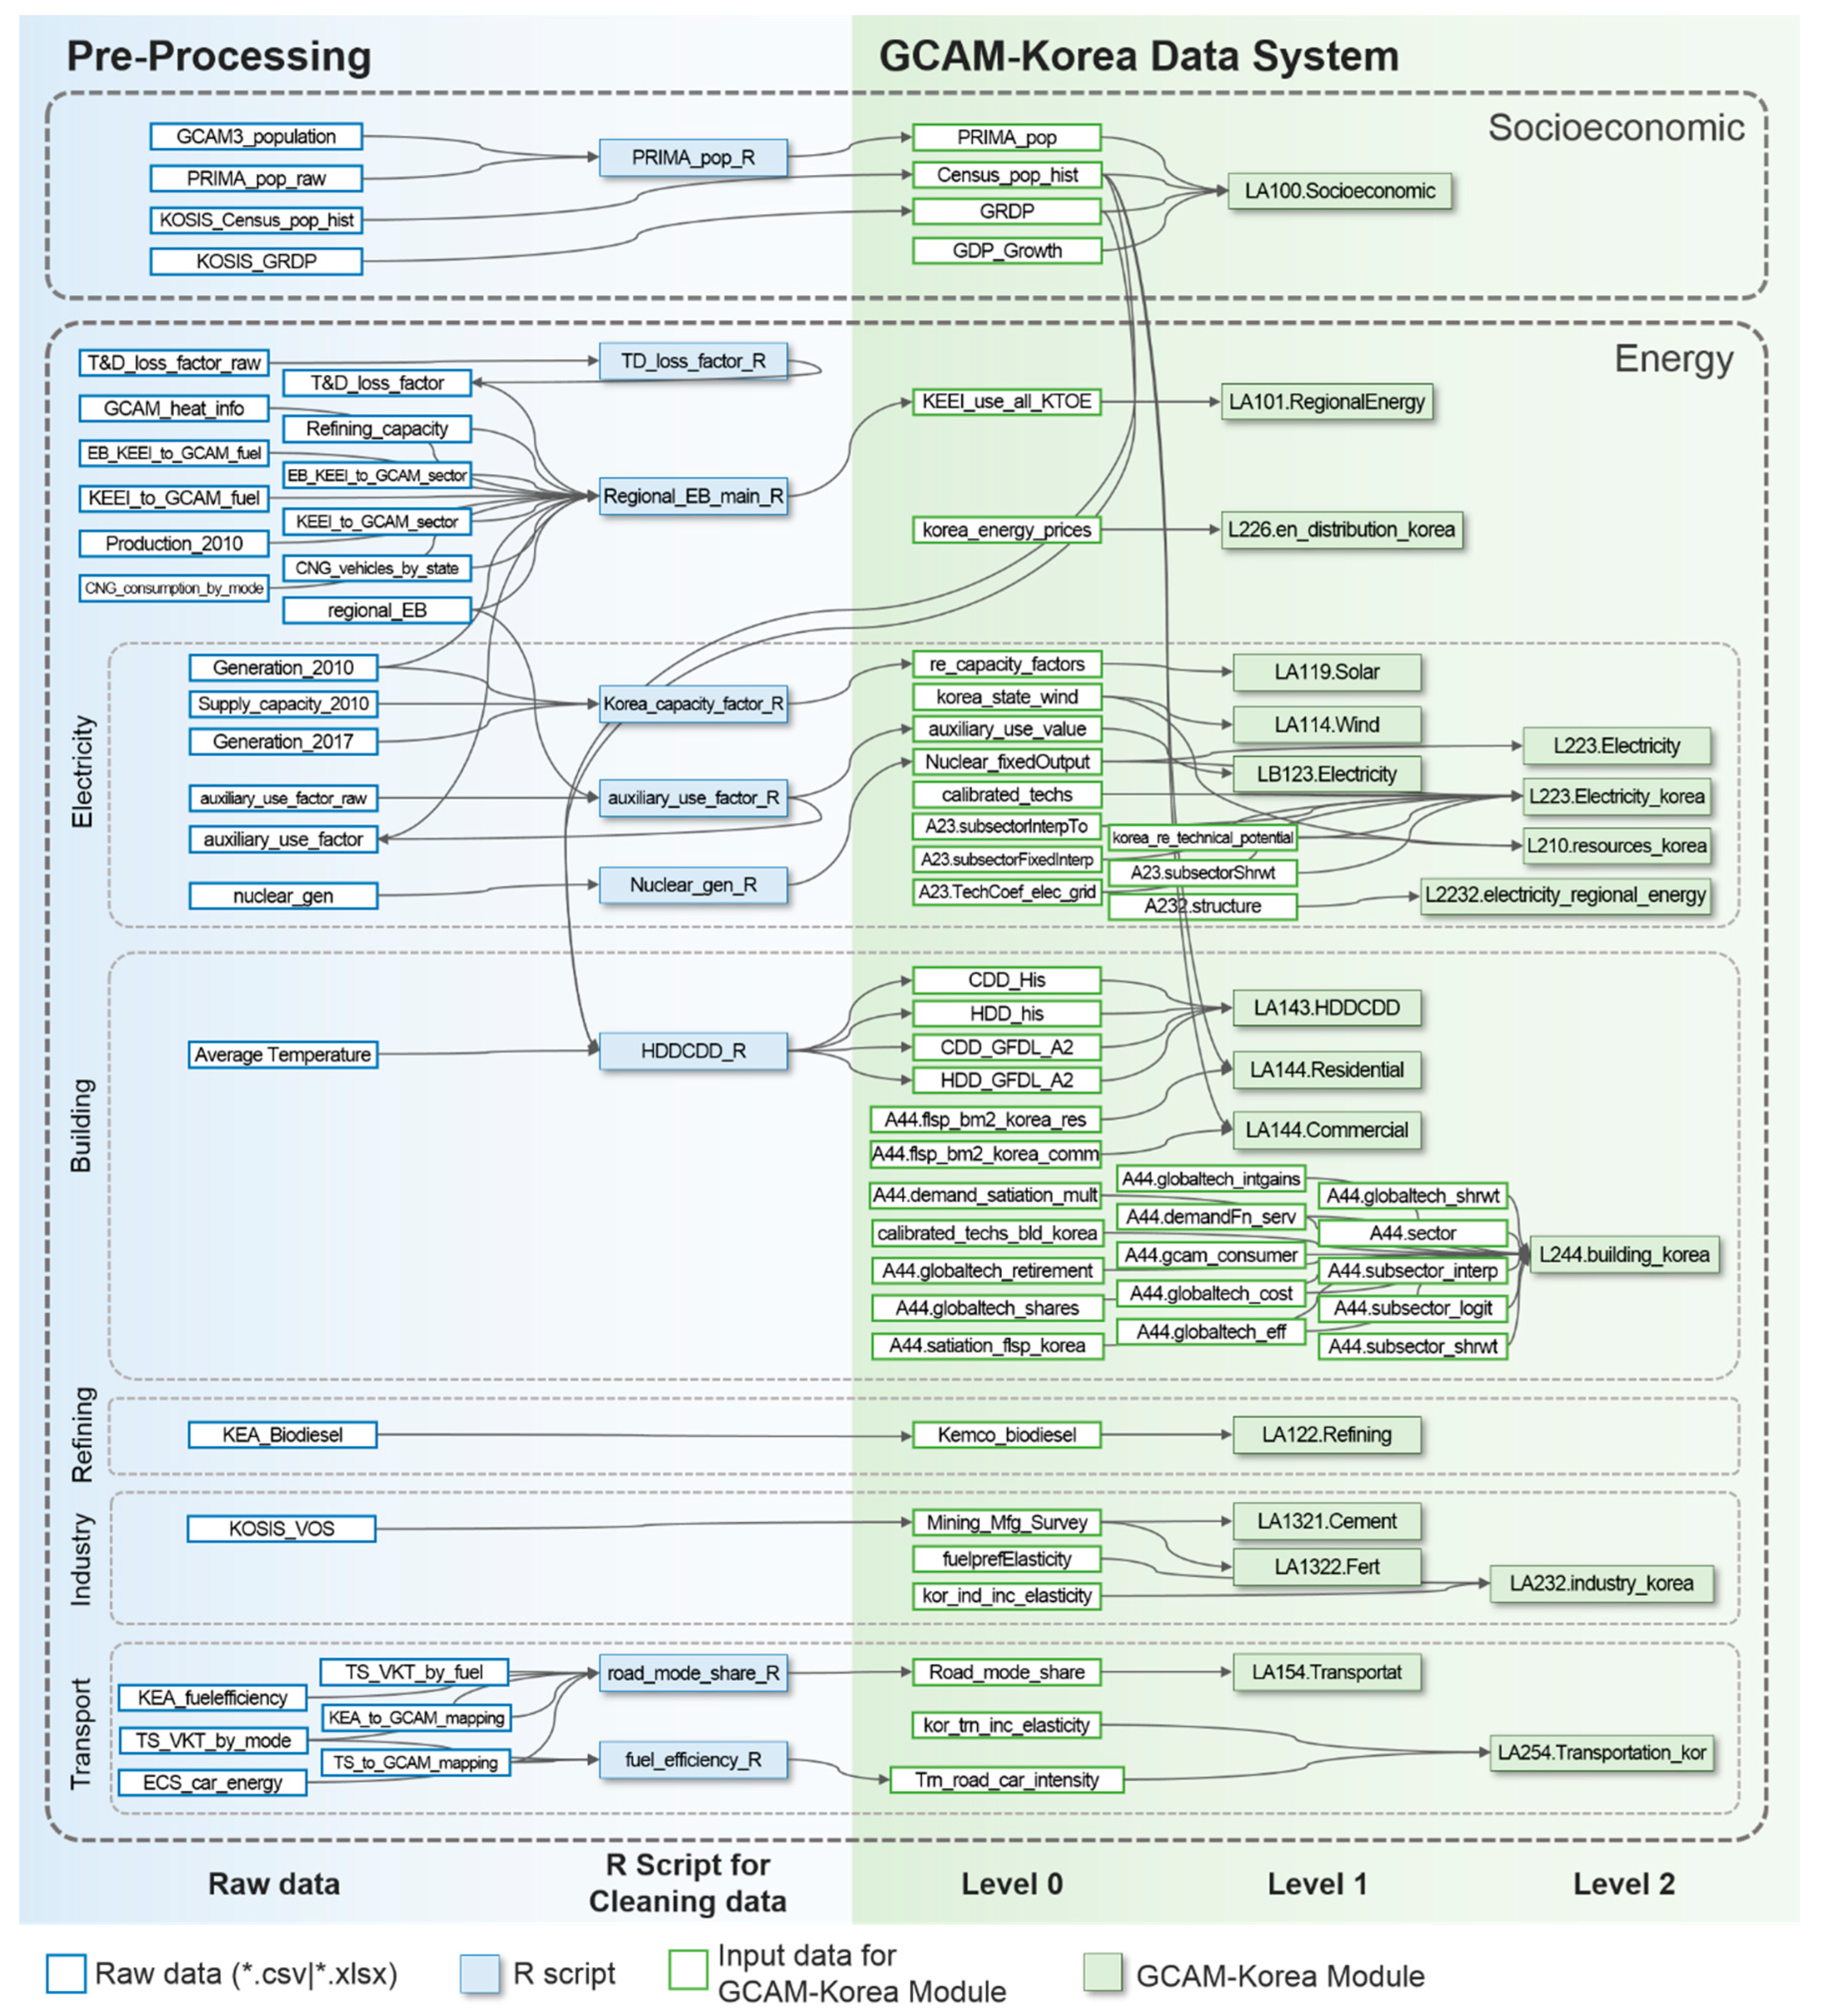
2.3. Modeling GCAM-Korea

GCAM-Korea subdivides the Korean energy system into 16 provinces. GCAM-Korea represents 16 of the 17 provinces while omitting Sejong province since there is not enough data to model Sejong separately and just 0.5% of the Korean population resides in Sejong. Figure 2 shows the spatial representation of GCAM-Korea.
Figure 3 shows details of how provincial data is pre-processed and connected to the GCAM data system. In GCAM, the disaggregation of a national energy system requires only altering input data, not GCAM core code, because input data determine structures of the model such as regions and technologies. GCAM-Korea at provincial level can easily be accomplished referring to GCAM-USA, since it has 50 different states and this structure can be applied to provincial level in Korea. The provincial data of 16 provinces have been collected from various sources. Next, some of these data have been pre-processed to fit in with the specific structure of GCAM-USA data. This pre-processing obviates the burden of code modifications from GCAM-USA modules, while also reducing potential harmful errors due to modifications. Other types of data are newly added through new structures, such as those for Korea’s nuclear power phase-out policy, modal share in transportation sector etc. In addition to data, some parameters are also adjusted to reflect the historical performance or trend of each province, such as fuel preference and income-elasticity in 2015 and 2020.

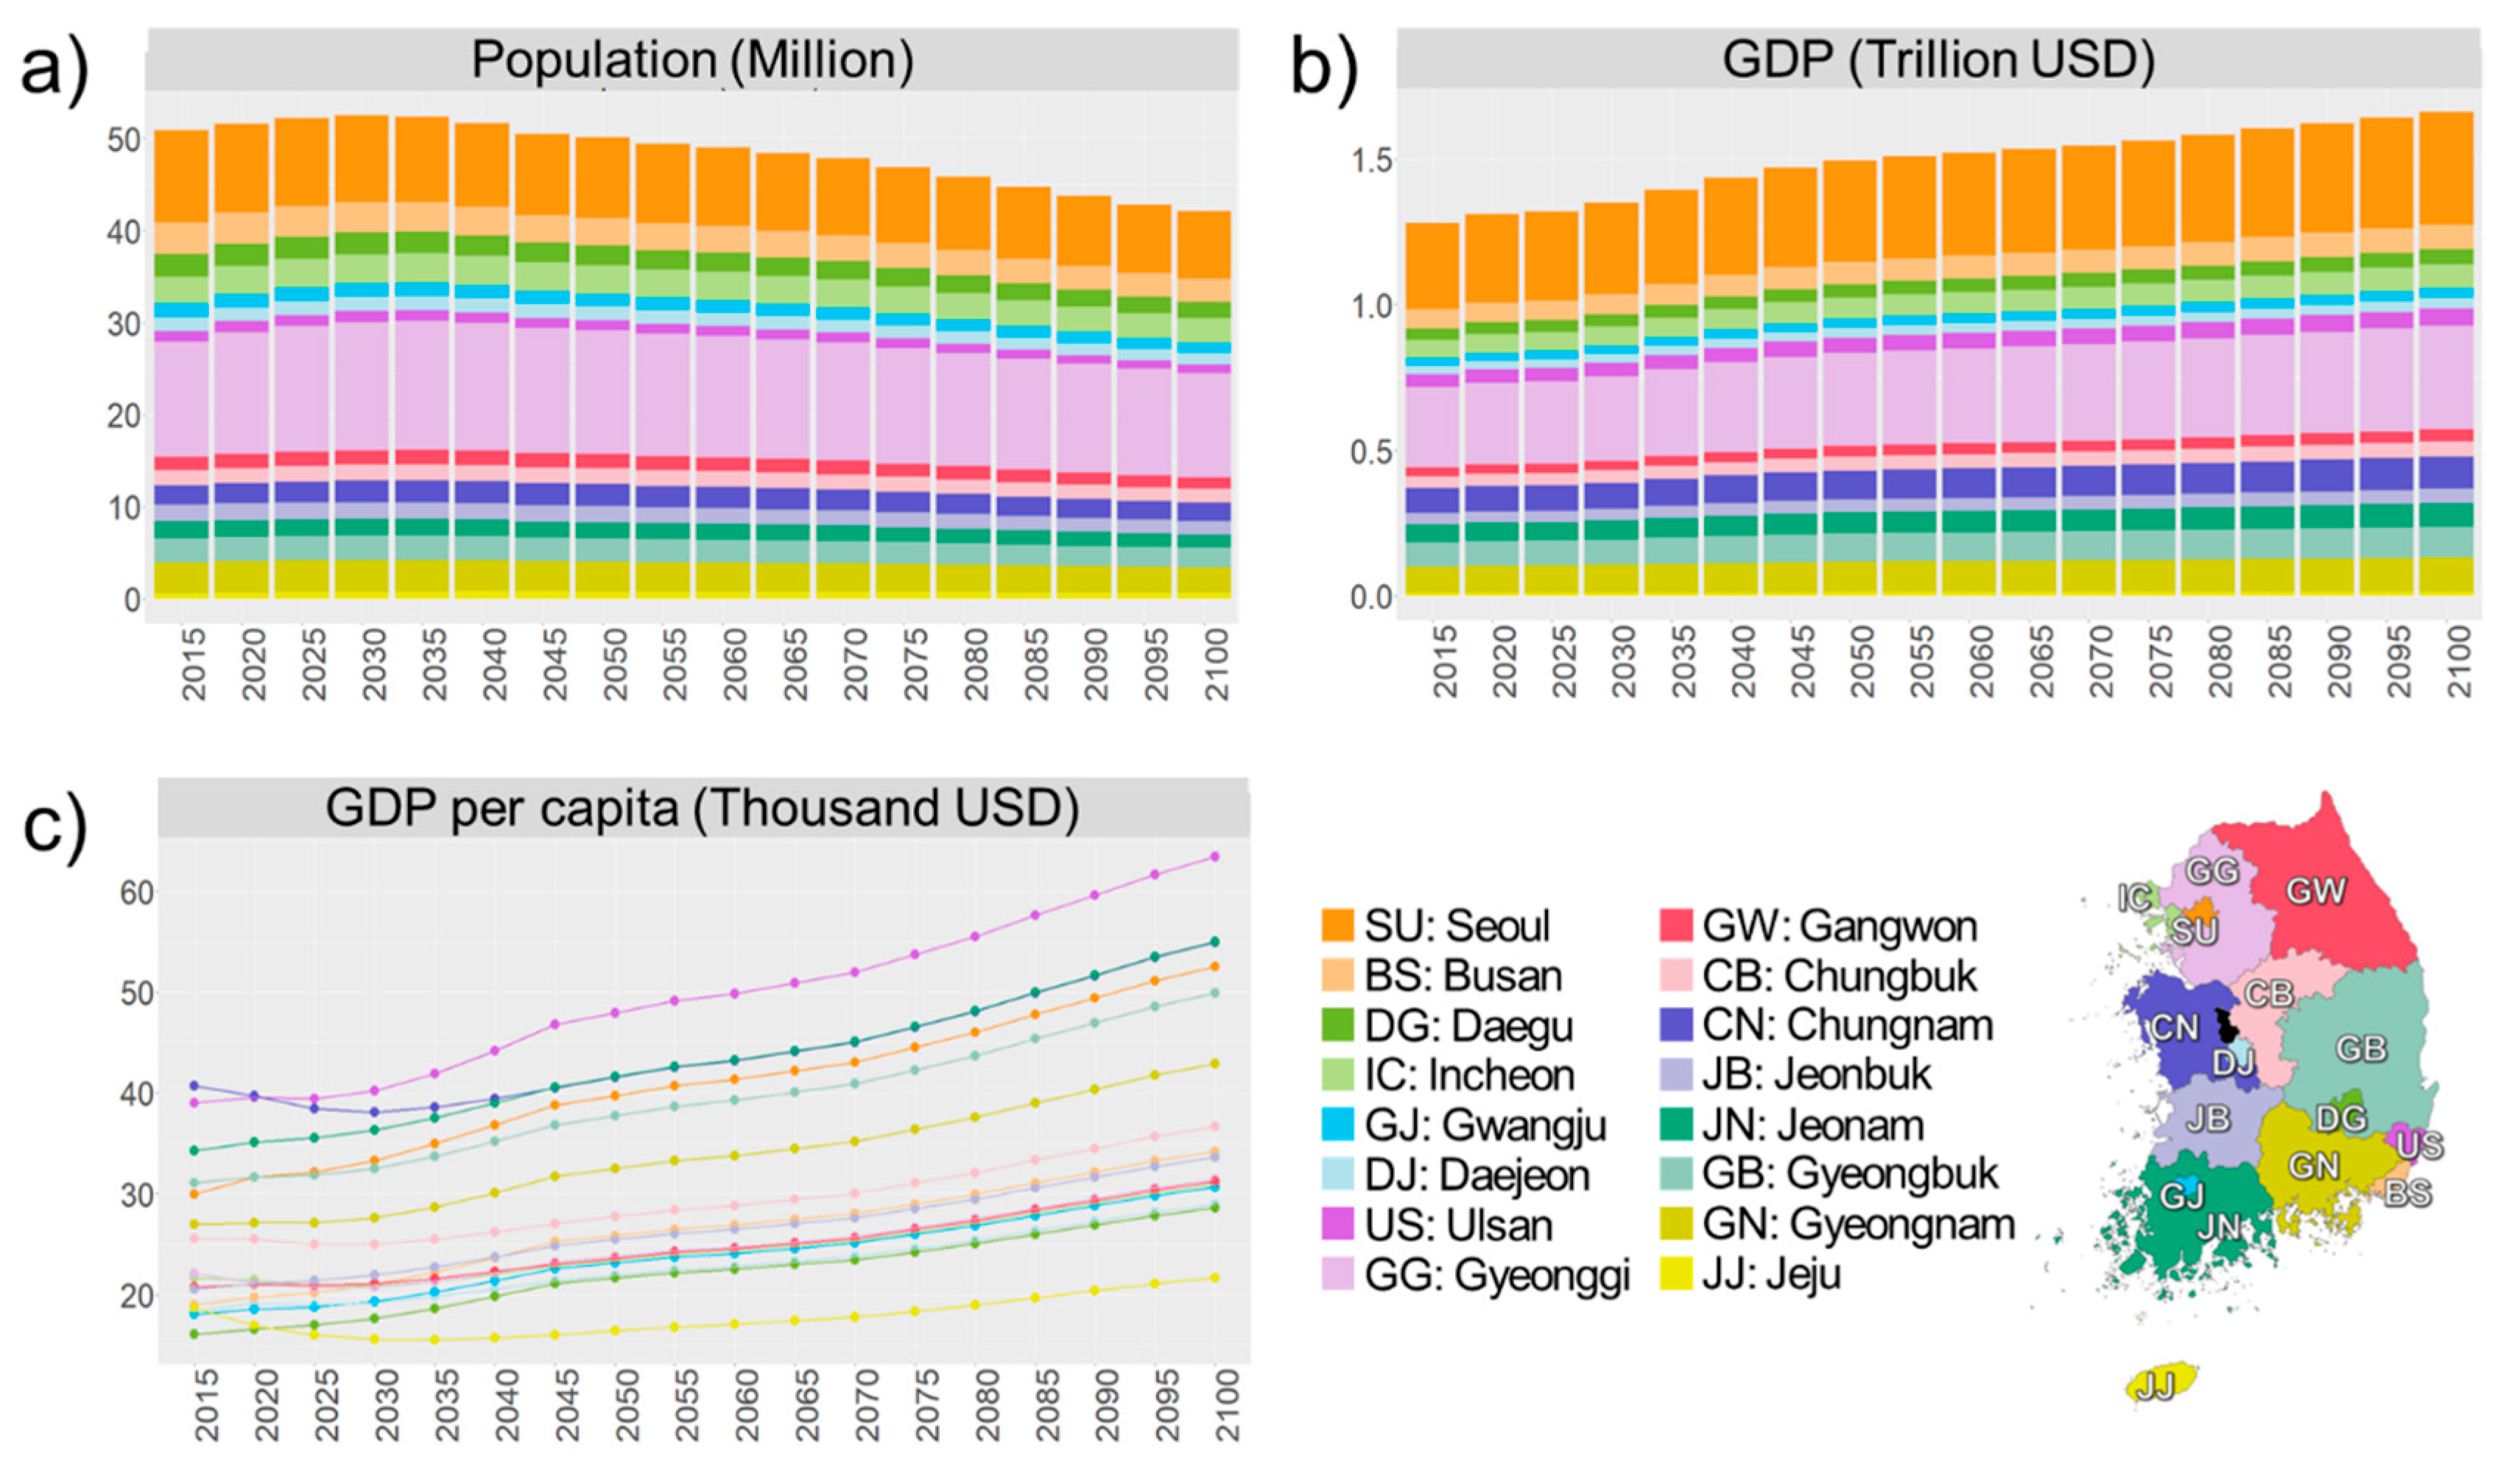
2.3.1. Socioeconomics

The SSP is one of the critical inputs in IAM. GCAM uses the official SSPs as well as modified SSPs, the so-called gSSP (difference between official SSPs and GCAM SSPs is described in [54]). In general, this study adopts gSSP2 for the baseline as shown in Figure 4.
KOSIS [55] projects provincial level population of Korea up to 2045, based on low, medium and high-growth scenarios. The medium scenario (2010–2045) was adopted in this study. For the projection in the remaining period (2045–2100), the growth rate of the gSSP2 scenario was successively multiplied by the estimates of the medium scenario, starting from 2045. On the other hand, since there is no future forecast of Korea Gross Regional Domestic Product (GRDP), this study applied the growth rate of the gSSP2 scenario for the whole model period in the same manner of the population projection (see Supplementary Materials and model information found at GitHub).

2.3.2. Energy Balance

For energy supply, transformation and demand data at the provincial level, the provincial energy balance was obtained from the Korea Energy Economics Institute as internal information not publicly available yet. Some critical issues using this provincial energy balance include the following: First, in the provincial energy balance, the ‘Renewable’ product represents all renewable products. Because GCAM models various renewable sources separately, with biomass, wind, solar and geothermal each having its own technologies such as photovoltaic (PV) and concentrated solar power (CSP), the ‘Renewable’ product in the provincial energy balance should be disaggregated into various sources (see Supplementary Materials). Second, ‘Heat’ is one of the products in the provincial energy balance, but GCAM does not model heat explicitly except for China, EU-12, Eastern Europe, Non-EU and Russia in which heat consumption is sizeable. Alternatively, energy inputs to generate heat are apportioned into final energy sectors without an energy transformation process. Biomass, refined liquids and gas are fueled to generate heat, with shares of 44%, 41%, and 15%, respectively [56] (see Supplementary Materials). Heat is consumed only in the building sector and accounts for 1.04% of the total final energy consumption. Third, the refining process is not represented in the provincial energy balance. Instead, this study utilizes the refining capacity of the four main refinery corporations, Hyundai Oilbank, S-Oil, GS Caltex and SK Energy (see Supplementary Materials). Fourth, bunkering is not represented in the provincial energy balance. This problem is related to the distinction between the domestic and international energy consumption of ships and aircraft. Additionally, the absence of bunkering data at a provincial level as well as the different criteria to distinguish between domestic and international energy consumption make the distinction ambiguous (see Supplementary Materials). Fifth, the own use of power plants as well as transmission and distribution losses are represented together in the flow of the provincial energy balance. KEPCO [57] provided information on own use and transmission and distribution losses separately (see Supplementary Materials).
Even though the provincial energy balance captures most of the quantitative energy flows, it is still not capable of capturing the detailed or qualitative characteristics in the energy system. Thus, additional data should be added to energy balance, such as efficiency, capacity factor and sector-specific data.

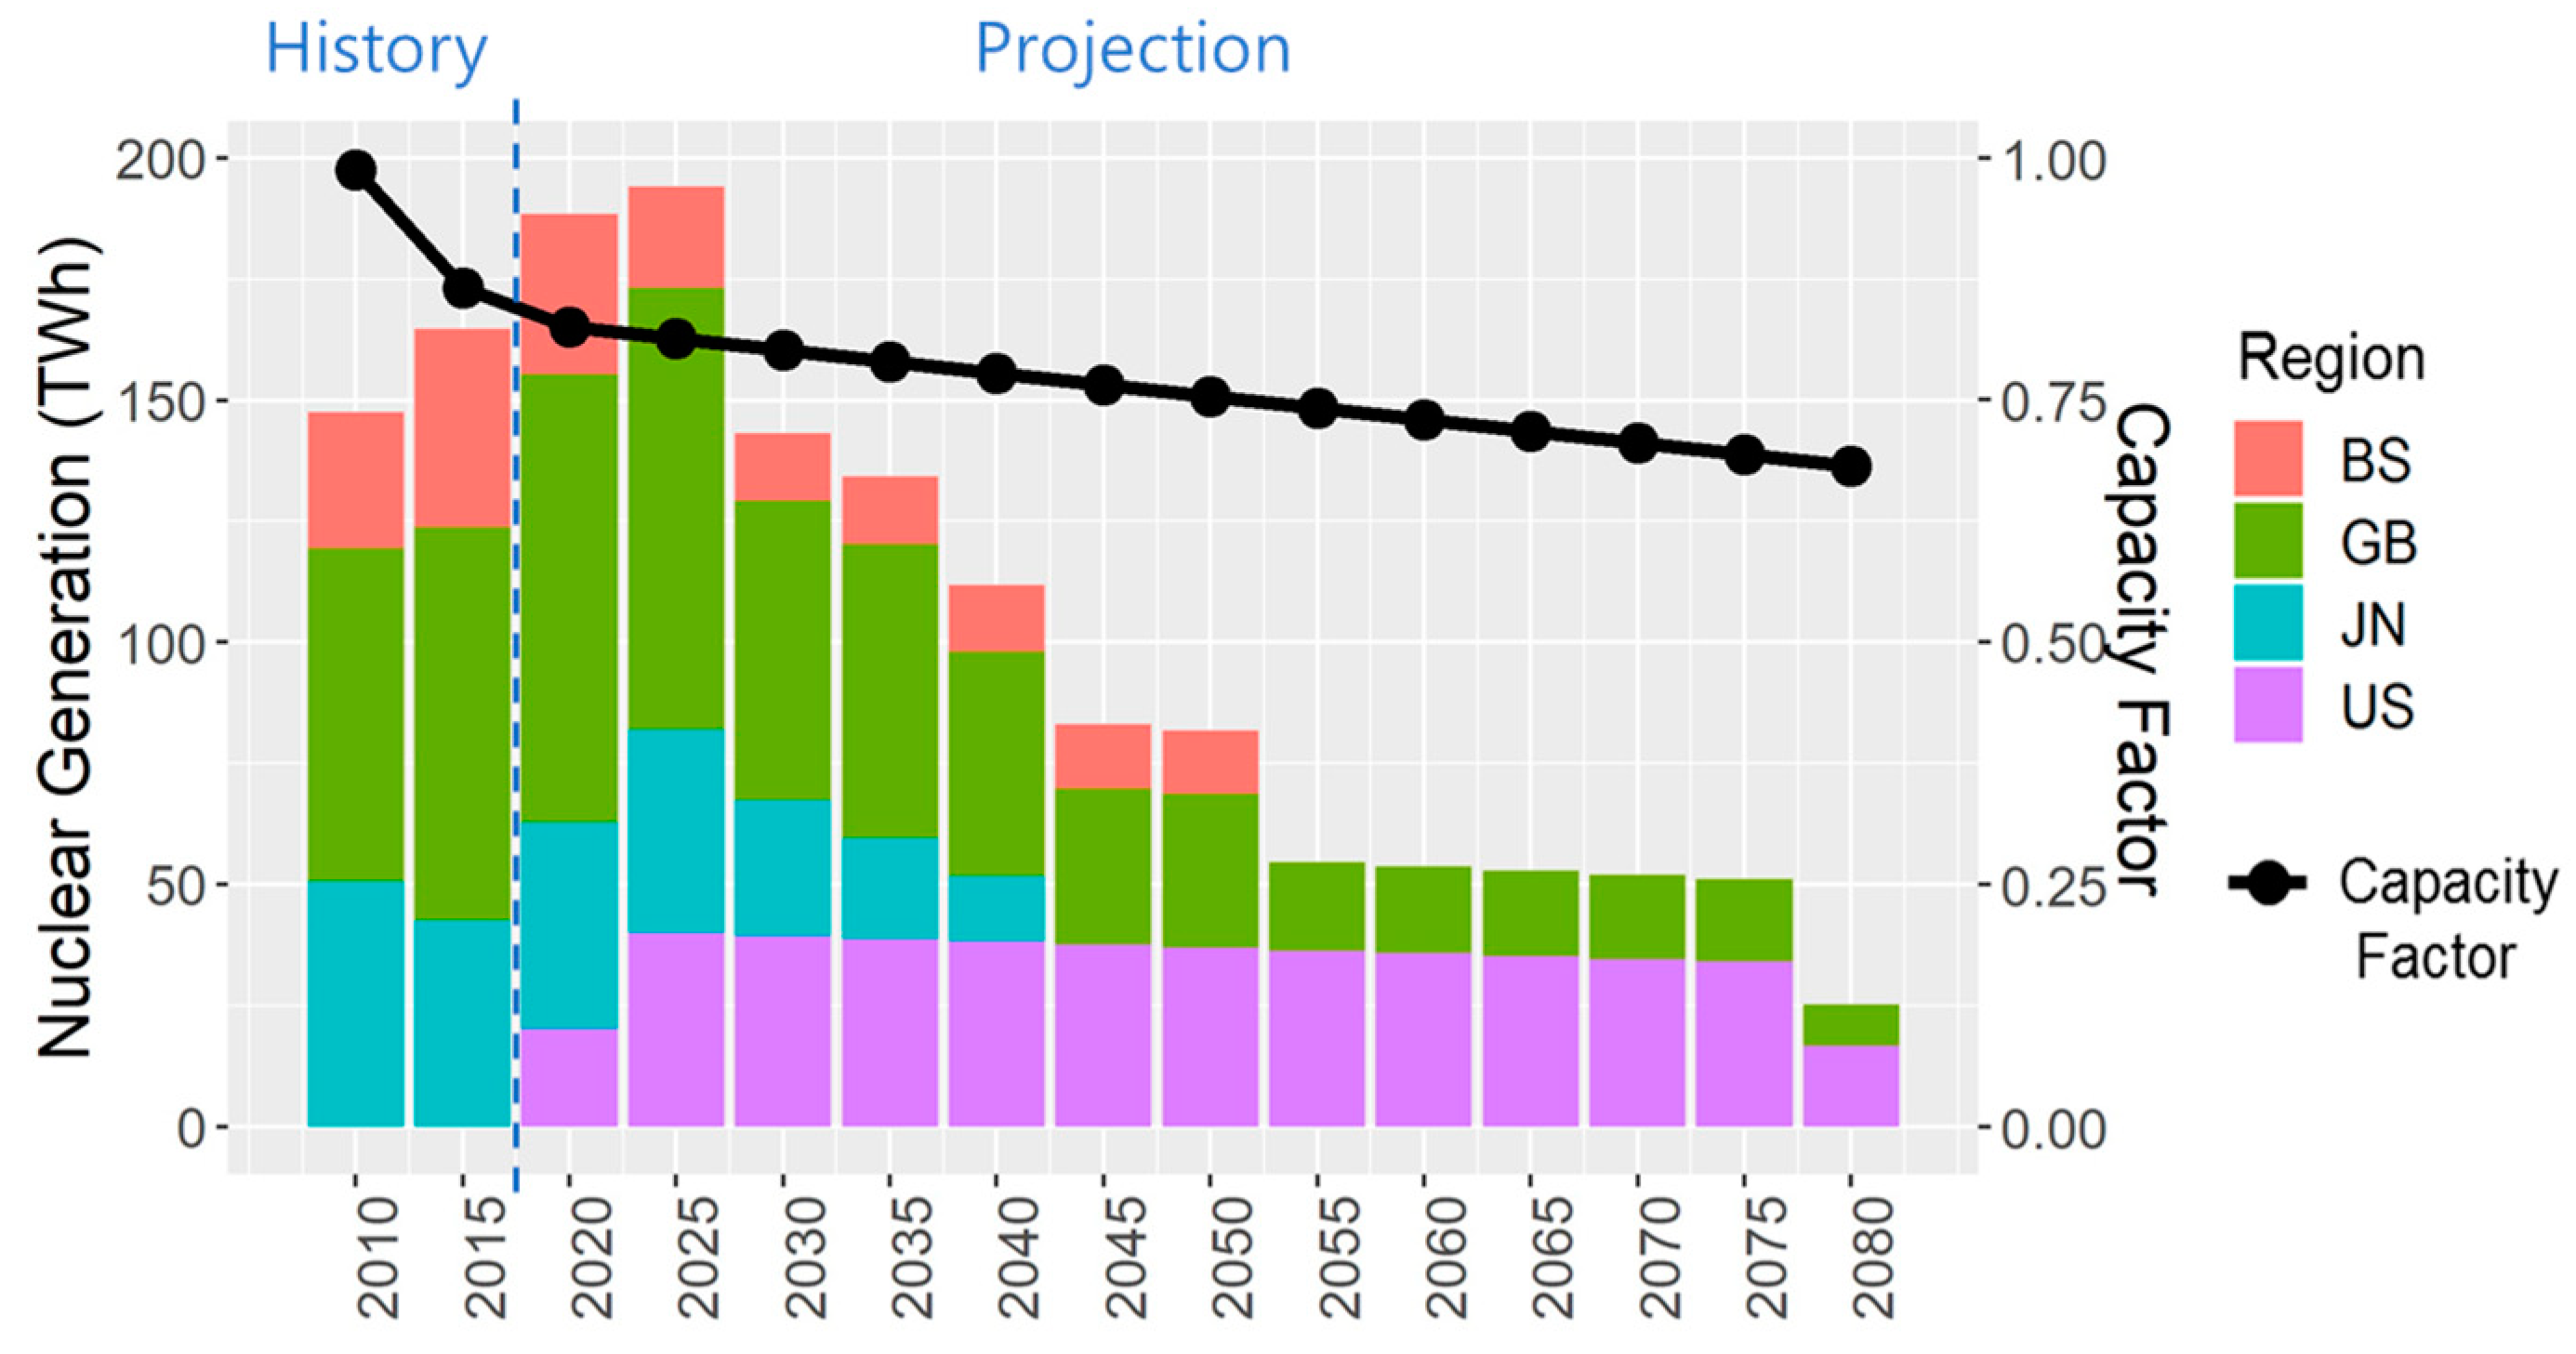
2.3.3. Electricity Transformation

Because nuclear power plants operate according to the government’s plan, electricity generation from nuclear power should be modeled as a pre-controlled technology as opposed to a competing one. According to Korea’s nuclear phase-out policy, nuclear power plants are planned to be shut down gradually as shown in Figure 5 and GCAM-Korea is modeled accordingly in terms of fixed-output technology. Efficiency of electricity generation from coal, gas, liquids and biomass is modeled the same for each technology across provinces because there is no additional information yet available at the provincial level. The capacity factors of PV and onshore wind technologies are calculated at provincial level based on historical performance [58] (see Supplementary Materials).
Because there is only one electricity corporation, Korea Electric Power Corporation (KEPCO) monopolizes power generation, transmission, distribution and even the retail market in Korea; thus, benefits from modeling electricity grid and trade disappear. Even though load duration curve has not been modeled in GCAM-Korea yet, load duration modeling at provincial level is under progress based on Jeon and Kim [59], who modeled load duration curves for supply and demand sides simultaneously using GCAM at the national level.

2.3.4. End-Use Sector
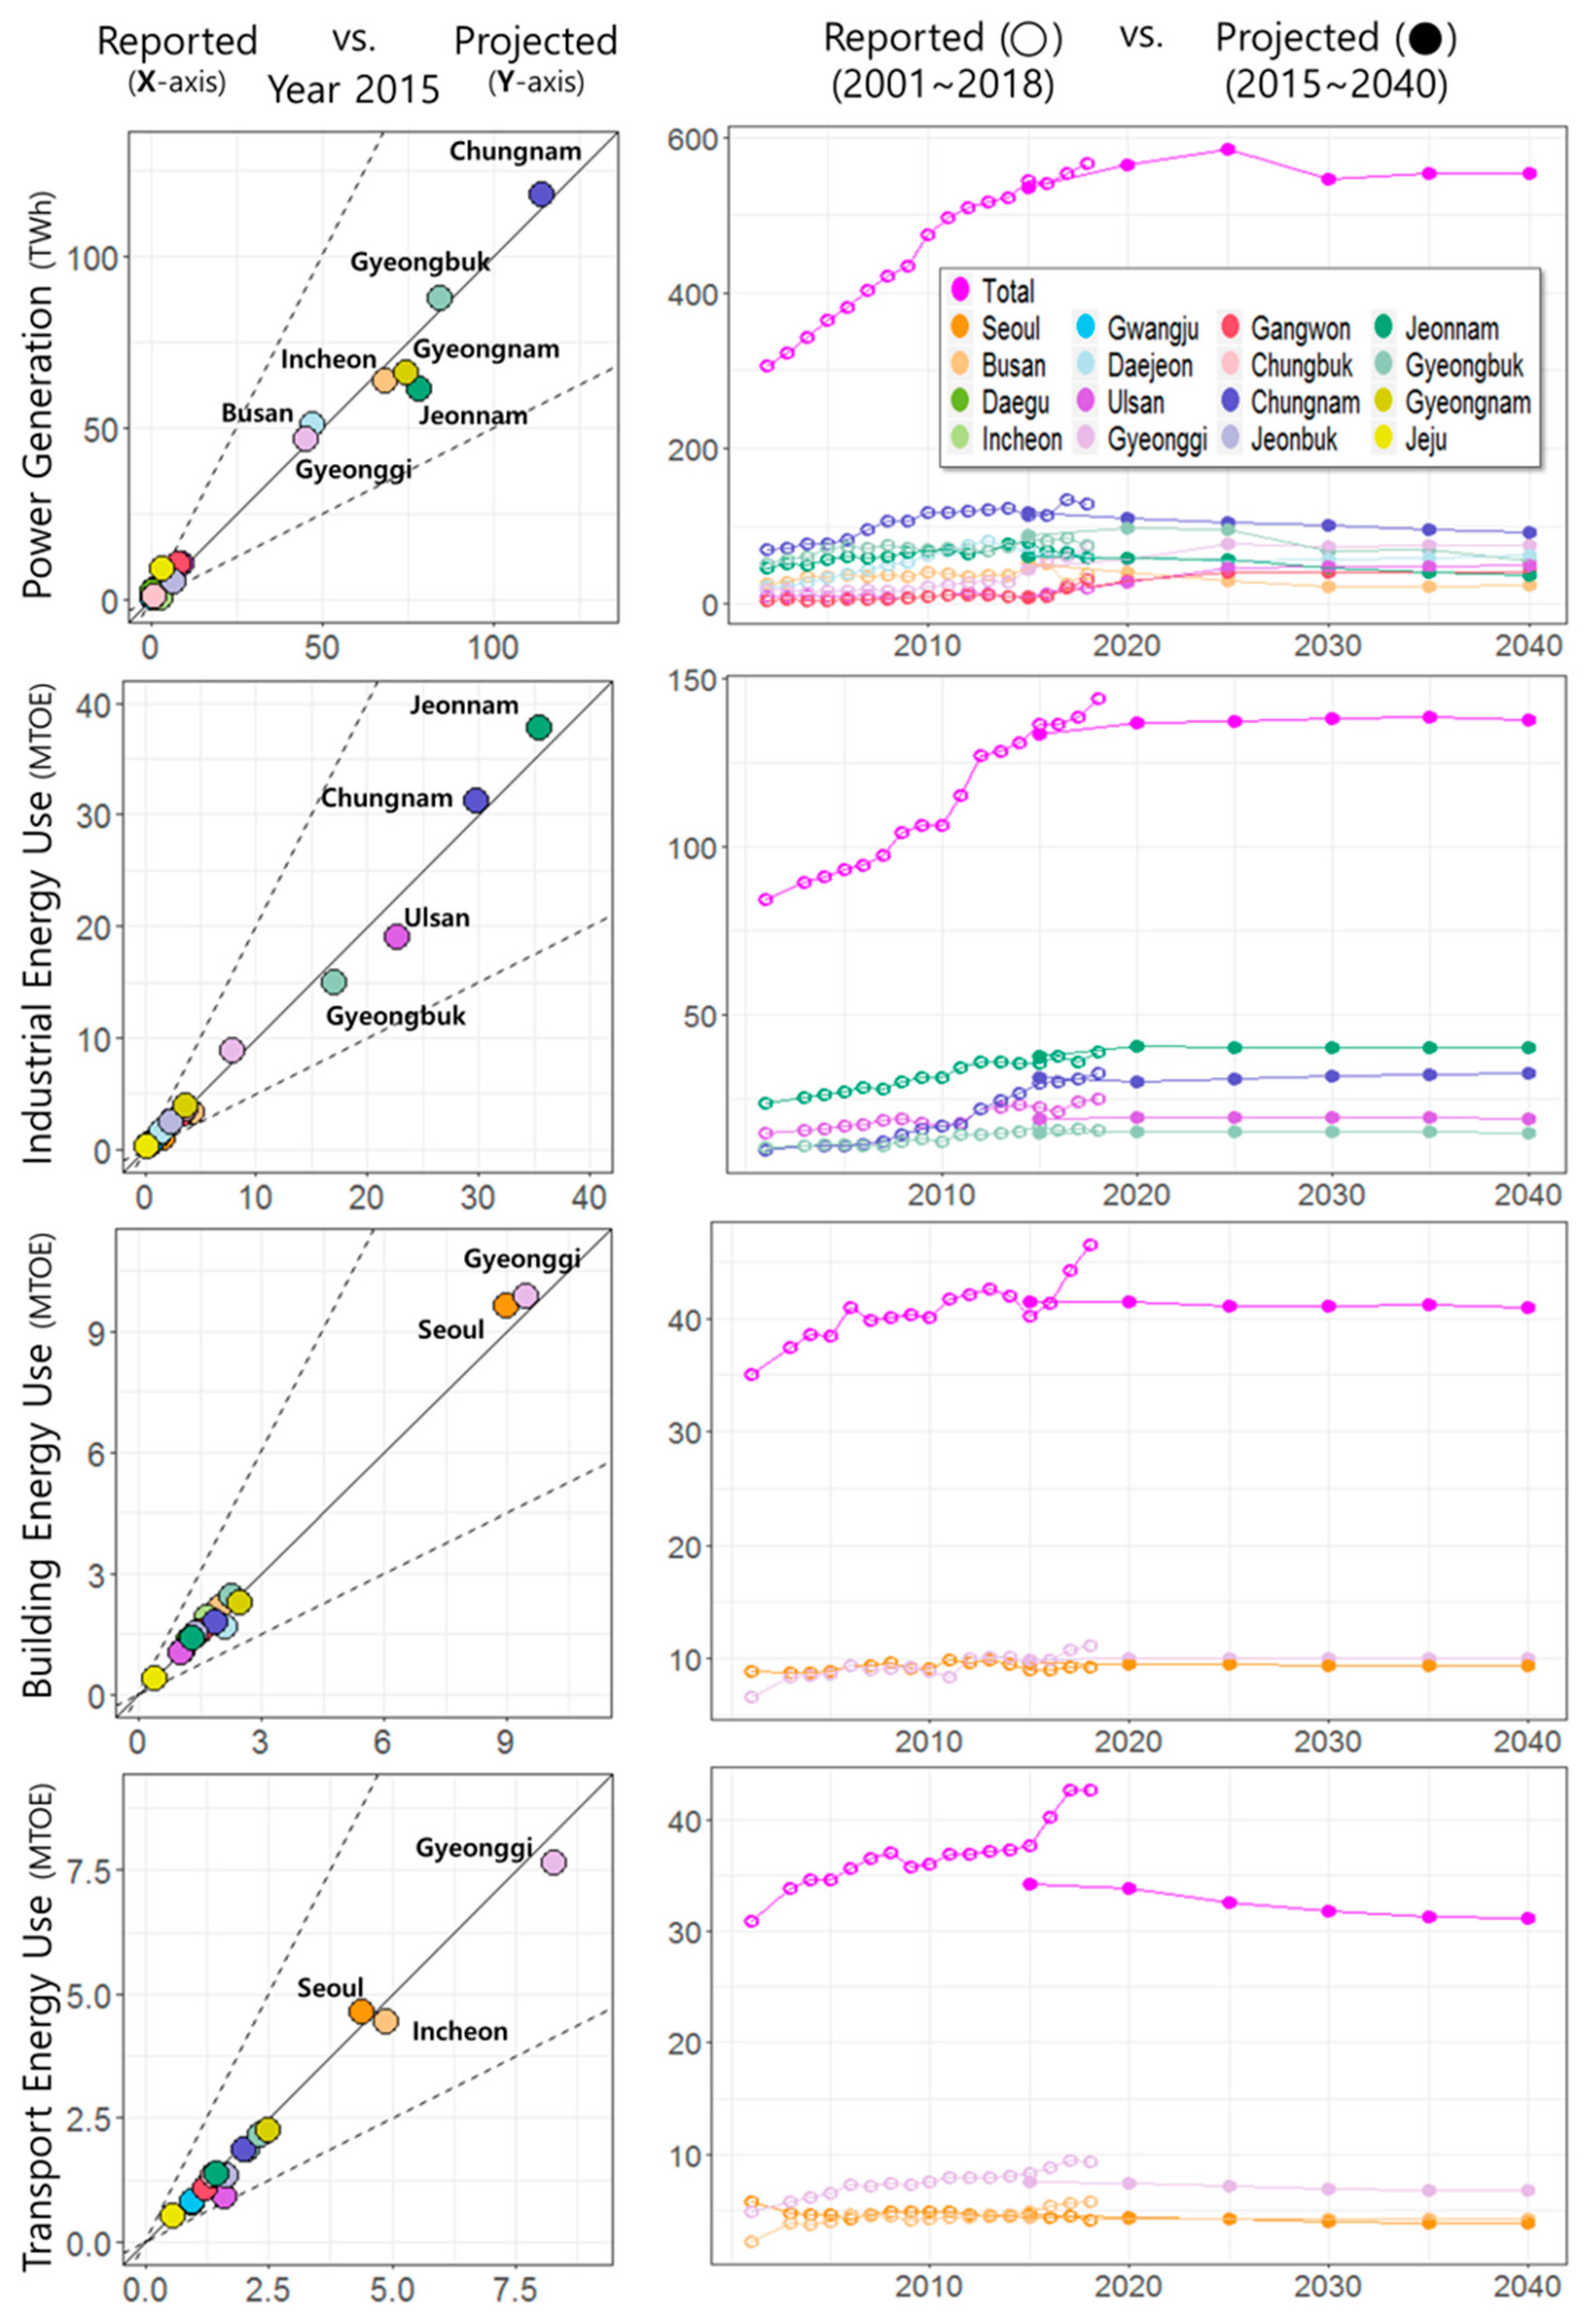
In the building sector, demand for energy service is represented by the multiplication of floorspace and the demand per unit of floorspace. This study uses floorspace data that Ministry of Land, Infrastructure and Transport [60] provides by provincial and building types (see Supplementary Materials). In addition, the demands for cooling and heating depends not only on floorspace but also on heating degree day (HDD), cooling degree day (CDD), shell conductance and internal gains. HDD and CDD are simply calculated based on provincial average temperature (see Supplementary Materials).
In the transportation sector, energy consumption [61], vehicle kilometer [62] and load factor [63] of private vehicles are collected at provincial level. Provincially differentiated modal share is modeled using energy consumption data. On-road fuel efficiency of the vehicle is calculated using energy consumption and vehicle kilometer data. The load factor, defined as transportation service demand per vehicle kilometer, is used as is. To model the fact that compressed natural gas (CNG) consumption in intra-city buses and garbage trucks are provincially different, CNG consumption and number of CNG vehicle data are used [64].
In the industrial sector, VoS (Value of Shipment) data are used at a provincial level to calculate the production of cement and fertilizer. However, these VoS data have limited accuracy because the published VoS data for cement and fertilizer are included in a wide range of industrial classifications. For instance, fertilizer is included in C20 of the KSIC (Korea Standard Industry Code), which denotes that the “Manufacture of chemicals and chemical products; except pharmaceuticals and medicinal chemicals” and fertilizer is a part of C20.

3. Results

In this section, the main focus is checking the reality of the model and assessing its performance in terms of the historical trend. Figure 6 compares the model projection with the historical values for power generation as well as energy usage in the building, transportation and industrial sectors. Figure 7 and Figure 8 maps the model results by sectors, fuels and provinces.
As seen on the left-hand side of Figure 6, our model results turned out to be compatible with the historical performance. Additionally, it is worth noticing in Figure 6 that province-specific socioeconomic and energy features such as population, industrial complexes, power plants and airports are well captured. For example, the provinces for electricity generation and consumption are clearly separated (See also Figure 8). In non-metropolitan areas such as Chungnam, electricity is generated and then transmitted to other metropolitan areas. In the industrial sector, four provinces (Jeonnam, Chungnam, Ulsan and Gyeongbuk) with huge industrial complexes consume 77% of the national industrial energy. The industrial complexes include oil refineries and steel production facilities, which are two leading industries in Korea which are ranked as the world’s fifth and sixth largest, respectively [65,66]. The building energy consumption of provinces depends heavily on the size of population. Seoul (the capital and largest city) and Gyeonggi (the province surrounding Seoul) accounted for 44% of the national building energy consumption, reflecting the fact that 44% of the total population resides in these two jurisdictions. In the transportation sector, energy use among provinces follows a pattern similar to that of the building sector, except for Incheon. Because of Incheon’s nation-leading airport and enormous harbors, for the transportation sector, Incheon is the second most energy-consuming province in Korea. To be specific, even with Incheon’s population being 2.8 times smaller than Seoul’s, the airport and harbors make Incheon consume more energy than Seoul in the transportation sector.
On the right-hand side of Figure 6, the historical trends of energy consumption can be examined (from 2001 to 2018). Especially with electricity generation and the industrial sector, there are relatively apparent and explainable shocks that caused deviations from the historical trends in some provinces. In the provinces with nuclear power plants (Busan, Ulsan, Gyeongbuk and Jeonnam), new construction or shutdown of nuclear power plants caused power generation to increase or decrease. In Incheon, power generation by gas-fired power plants has been continuously decreasing since 2013. In Gyeonggi, new gas-fired power plants have begun to operate since 2015. In Gangwon, electricity generation from existing coal-fired power plants increased, while at the same time new coal-fired power plants started to generate electricity since 2017. In Chungnam, the existing coal-fired power plants increased power generation since 2016. In the industrial sector, especially in Chungnam, Hyundai’s newly constructed, enormous steel manufacturing facility began operations in 2010. The massive industrial production in the area changed the historical trend for industrial energy use. In Gyeongnam, power generation from existing coal-fired power plants decreased due to concerns about air pollution since 2015.
Figure 7 (Power generation sector) and Figure 8 (End-use sectors) show provincial model results on maps that indicate fuel types as well. In Figure 7, it is notable that base-load power plants are coal and nuclear power in Korea. The model result shows that the share of renewable generation is 1% in 2015, which is different from historical value (3.7%) [57]. The difference between the model result and historical value comes from implementation of policy. Since this study sets baseline without any policies, the lower share of renewable generation might prove the effects of some relevant policies such as Renewable Portfolio Standard (RPS) to improve renewable generation.
In end-use sectors, because coal is a main feedstock (raw material) in the iron and steel industry, coal is consumed mostly in the industrial sector (see coal column). Town gas is mainly sourced to supply thermal energy for buildings in Korea (see gas column). Refined liquid is mostly used in both the petrochemical industry and transportation (see refined liquids column). Electricity is consumed mostly by the building and industry sectors (see electricity column).

4. Conclusions

The increased spatial resolution of the model enables an exploration of provincially heterogeneous energy problems and an establishment of province-specific energy policies. This study develops GCAM-Korea, a version of GCAM with Korean province-level resolution. The model results were compared with historical values at the sectoral and provincial levels. It is confirmed through this study that provincial energy plans could potentially be compiled based on GCAM-Korea while ensuring consistency with national energy plans.
In comparison with the GCAM-USA case, Korean energy data is less extensive at the provincial level. For example, in GCAM-USA, renewable technology characteristics are well documented, having both state-specific and technology-specific data.
GCAM-Korea could potentially be applied in research on air quality issues. Especially in Northeast Asia, cross-border air quality issues have become increasingly acute. Many studies have analyzed this issue with air quality models such as Community Multiscale Air Quality (CMAQ), an approach that is based on meteorological and geographical modeling [67,68,69]. However, the air quality issue is a complex problem rooted not only in natural systems but also driven by human activities such as the use of fossil fuels for power generation and vehicles. As Shi et al. [45] pointed out in her research using GCAM-USA, similarly, GCAM-Korea could potentially bridge the gap between the integrated assessment model and air quality model.

Supplementary Materials

The following are available online at https://www.mdpi.com/1996-1073/13/10/2565/s1.

Author Contributions

Conceptualization, S.J., M.R., J.O. and S.K.; methodology, S.J. and M.R.; software, M.R. and S.J.; Data curation, S.J. and M.R.; Visualization, M.R. and S.J.; writing—original draft preparation, S.J.; writing—review and editing, S.K. and J.O.; supervision, S.K. and J.O.; Funding acquisition, S.K. All authors have read and agreed to the published version of the manuscript.

Funding

This work was supported by the Ministry of Education of the Republic of Korea and the National Research Foundation of Korea (NRF-2017S1A5A2A01024270), the Technology Development Program to Solve Climate Changes of the National Research Foundation (NRF) funded by the Ministry of Science, ICT & Future Planning (NRF-2017M1A2A2081253), and Korea Ministry of Environment (MOE) as 「Graduate School specialized in Climate Change」.

Acknowledgments

Authors are indebted to David Kelleher for his valuable comments and advice.

Conflicts of Interest

The authors declare no conflict of interest.

Appendix A

The followings are brief information for gcamkordata software developed in this study.
  • Name of software: gcamkordata
  • Programming language: R
  • Software required: R version 3.1.2 or higher
  • License: MIT License
  • Developers: Minyoung Roh, Seungho Jeon, Jaeick Oh and Suduk Kim
  • Installation in R: devtools::install_github("rohmin9122/gcam-korea-release") gcamkordata::driver()
  • Description: To simulate GCAM-Korea, (i) make XML files according to the above instructions, (ii) download GCAM 5.1.3 (https://github.com/JGCRI/gcam-core/releases), and (iii) copy XML files and folder in <working dir/xml>, and then paste into <gcam-v5.1.3-Windows-Release-Package/gcamdata/xml>. For your convenience, an input configuration file, configuration-gcamkorea.xml, is included in the working directory.

References

  1. Easterling, W.E. Why regional studies are needed in the development of full-scale integrated assessment modelling of global change processes. Glob. Environ. Chang. 1997, 7, 337–356. [Google Scholar] [CrossRef]
  2. Rotmans, J. Methods for IA: The challenges and opportunities ahead. Environ. Model. Assess. 1998, 3, 155–179. [Google Scholar] [CrossRef]
  3. Giupponi, C.; Borsuk, M.E.; De Vries, B.J.; Hasselmann, K. Innovative approaches to integrated global change modelling. Environ. Model. Softw. 2013, 44, 1–9. [Google Scholar] [CrossRef]
  4. Hamilton, S.H.; ElSawah, S.; Guillaume, J.H.; Jakeman, A.J.; Pierce, S.A. Integrated assessment and modelling: Overview and synthesis of salient dimensions. Environ. Model. Softw. 2015, 64, 215–229. [Google Scholar] [CrossRef]
  5. Korean Culture and Information Service, Constitution and Government. Available online: http://www.korea.net/Government/Constitution-and-Government/Local-Governments# (accessed on 14 April 2020).
  6. Seo, J.K. Balanced national development strategies: The construction of Innovation Cities in Korea. Land Use Policy 2009, 26, 649–661. [Google Scholar] [CrossRef]
  7. Organization for Economic Cooperation and Development (OECD). Urban Policy Reviews: Korea. Available online: https://www.oecd.org/cfe/regional-policy/oecdurbanpolicyreviewskorea.htm (accessed on 14 April 2020).
  8. Organization for Economic Cooperation and Development (OECD). National Population Distribution. Available online: https://doi.org/10.1787/7314f74f-en (accessed on 16 May 2020).
  9. Organization for Economic Cooperation and Development (OECD). Share of Population in Metropolitan Area over the National Value. Available online: https://stats.oecd.org/viewhtml.aspx?datasetcode=CITIES&lang=en# (accessed on 14 April 2020).
  10. International Atomic Energy Agency (IAEA). Model for Analysis of Energy Demand (MAED-2). 2006. Available online: https://www-pub.iaea.org/MTCD/publications/PDF/CMS-18_web.pdf (accessed on 14 April 2020).
  11. Kyungpook National University (KNU), Environmental Impact Analysis of the Climate Change and Greenhouse Gas Reduction Projects (In Korean). 2005. Available online: http://www.ndsl.kr/ndsl/search/detail/report/reportSearchResultDetail.do?cn=TRKO200700002915 (accessed on 12 May 2020).
  12. Incheon Development Institute. The 4th Provincial Energy Plan for Incheon Metropolitan City; Incheon Development Institute: Incheon, Korea, 2014. (In Korean) [Google Scholar]
  13. Korea Energy Economics Institute. The 4th Provincial Energy Plan for Gyeonggi-Do; Korea Energy Economics Institute: Gyeonggi-do, Korea, 2015. (In Korean) [Google Scholar]
  14. Mokpo National University. The 4th Provincial Energy Plan for Jeollanam-Do; Mokpo National University: Jeollanam-do, Korea, 2014. (In Korean) [Google Scholar]
  15. Gyeongnam Development Institute. The 5th Provincial Energy Plan for Gyeongsangnam-Do; Gyeongnam Development Institute: Gyeongsangnam-do, Korea, 2015. (In Korean) [Google Scholar]
  16. McFadden, D. Conditional logit analysis of qualitative choice behavior. In Frontiers in Econometrics; Zarembka, P., Ed.; Academic Press: New York, NY, USA, 1973; pp. 105–142. [Google Scholar]
  17. Keepin, B.; Wynne, B. Technical analysis of IIASA energy scenarios. Nature 1984, 312, 691–695. Available online: https://www.nature.com/articles/312691a0 (accessed on 16 May 2020). [CrossRef]
  18. Loulou, R.; Goldstein, G.; Noble, K. Documentation for the MARKAL Family of Models. October 2004, 65–73. Available online: http://iea-etsap.org/MrklDoc-I_StdMARKAL.pdf (accessed on 16 May 2020).
  19. Seoul Institute. The 4th Provincial Energy Plan for Seoul Special City; Seoul Institute: Seoul, Korea, 2015. (In Korean) [Google Scholar]
  20. Busan Development Institute. The 5th Provincial Energy Plan for Busan Metropolitan City; Busan Development Institute: Busan, Korea, 2018. (In Korean) [Google Scholar]
  21. Kyungpook National University. The 4th Provincial Energy Plan for Daegu Metropolitan City; Kyungpook National University: Daegu, Korea, 2015. (In Korean) [Google Scholar]
  22. Ulsan Development Institute. The 5th Provincial Energy Plan for Ulsan Metropolitan City; Ulsan Development Institute: Ulsan, Korea, 2017. (In Korean) [Google Scholar]
  23. Korea Energy Agency. The 5th Provincial Energy Plan for Chungcheongbuk-Do; Korea Energy Agency: Chungcheongbuk-do, Korea, 2017. (In Korean) [Google Scholar]
  24. Gwangju Development Institute. The 4th Provincial Energy Plan for Gwangju Metropolitan City; Gwangju Development Institute: Gwangju, Korea, 2014. (In Korean) [Google Scholar]
  25. Korea Energy Agency. The 1st Provincial Energy Plan for Sejong Special Autonomous City; Korea Energy Agency: Sejong, Korea, 2015. (In Korean) [Google Scholar]
  26. Korea Institute of Energy Research. The 4th Provincial Energy Plan for Gyeongsangbuk-Do; Korea Institute of Energy Research: Gyeongsangbuk-do, Korea, 2015. (In Korean) [Google Scholar]
  27. Daejeon Development Institute. The 4th Provincial Energy Plan for Daejeon Metropolitan City; Daejeon Development Institute: Daejeon, Korea, 2012. (In Korean) [Google Scholar]
  28. Korea Research Institute on Climate Change. The 4th Provincial Energy Plan for Gangwon-Do; Korea Research Institute on Climate Change: Gangwon-do, Korea, 2015. (In Korean) [Google Scholar]
  29. Chungnam Institute. The 5th Provincial Energy Plan for Chungcheongnam-Do; Chungnam Institute: Chungcheongnam-do, Korea, 2016. (In Korean) [Google Scholar]
  30. Energy&Climate Policy Institute. The 3rd Provincial Energy Plan for Jeollabuk-Do; Energy&Climate Policy Institute: Jeollabuk-do, Korea, 2017. (In Korean) [Google Scholar]
  31. Jeju Research Institute. The 5th Provincial Energy Plan for Jeju Special Self-Governing Province; Jeju Institute: Jeju, Korea, 2017. (In Korean) [Google Scholar]
  32. Joint Global Change Research Institute (JGCRI). GCAM v5.1 Documentation: Global Change Assessment Model (GCAM). Available online: http://jgcri.github.io/gcam-doc (accessed on 14 April 2020).
  33. Kim, S.H.; Edmonds, J.; Lurz, J.; Smith, S.J.; Wise, M. The ObjECTS framework for integrated assessment: Hybrid modeling of transportation. Energy J. 2006, 27, 63–91. [Google Scholar] [CrossRef]
  34. Brenkert, A.L.; Smith, A.J.; Kim, S.H.; Pitcher, H.M. Model. Documentation for the MiniCAM.; Pacific Northwest National Laboratory: Richland, WA, USA, 2003. [Google Scholar] [CrossRef] [Green Version]
  35. Calvin, K.; Patel, P.; Clarke, L.; Asrar, G.; Bond-Lamberty, B.; Cui, R.; Vittorio, A.; Dorheim, K.; Edmonds, J.; Hartin, C.; et al. GCAM v5. 1: Representing the linkages between energy, water, land, climate, and economic systems. Geosci. Model. Dev. 2019, 12, 677–698. [Google Scholar] [CrossRef] [Green Version]
  36. Riahi, K.; van Vuuren, D.P.; Kriegler, E.; Edmonds, J.A.; O’Neil, B.C.; Fujimori, S.; Bauer, N.; Calvin, K.; Dellink, R.; Fricko, O.; et al. The Shared Socioeconomic Pathways and their energy, land use, and greenhouse gas emissions implications: An overview. Glob. Environ. Chang. 2017, 42, 153–168. [Google Scholar] [CrossRef] [Green Version]
  37. Calvin, K.; Bond-Lamberty, B.; Clark, L.; Edmonds, J.; Eom, J.; Hartin, C.; Kim, S.; Kyle, P.; Link, R.; Moss, R.; et al. The SSP4: A world of deepening inequality. Glob. Environ. Chang. 2017, 42, 284–296. [Google Scholar] [CrossRef] [Green Version]
  38. Clarke, L.; Edmonds, J.; Jacoby, H.; Pitcher, H.; Reilly, J.; Richard, R. Scenarios of Greenhouse Gas Emissions and Atmospheric Concentrations. US Department of Energy Publications 6 2007. Available online: https://digitalcommons.unl.edu/usdoepub/6/ (accessed on 20 April 2020).
  39. Bond-Lamberty, B.; Dorheim, K.; Cui, R.; Horowitz, R.; Snyder, A.; Calvin, K.; Feng, L.; Hoesly, R.; Horing, J.; Kyle, P.; et al. Gcamdata: An R Package for Preparation, Synthesis, and Tracking of Input Data for the GCAM Integrated Human-Earth Systems Model. J. Open Res. Softw. 2019, 7, 1–6. [Google Scholar] [CrossRef] [Green Version]
  40. Joint Global Change Research Institute (JGCRI). Modifying GCAM via the Data System. Available online: https://github.com/JGCRI/gcamdata/wiki/Modifying-GCAM-via-the-Data-System (accessed on 14 April 2020).
  41. Yurnaidi, Z.; Kim, S. Reducing Biomass Utilization in the Ethiopia Energy System: A National Modeling Analysis. Energies 2018, 11, 1745. [Google Scholar] [CrossRef] [Green Version]
  42. Chaturvedi, V.; Kim, S.; Smith, S.J.; Clarke, L.; Yuyu, Z.; Kyle, P.; Patel, P. Model evaluation and hindcasting: An experiment with an integrated assessment model. Energy 2013, 61, 479–490. [Google Scholar] [CrossRef]
  43. Zhou, Y.; Clarke, L.; Eom, J.; Kyle, P.; Patel, P.; Kim, S.H.; Dirks, J.; Jensen, E.; Liu, Y.; Rice, J.; et al. Modeling the effect of climate change on US state-level buildings energy demands in an integrated assessment framework. Appl. Energy 2014, 113, 1077–1088. [Google Scholar] [CrossRef]
  44. Kyle, P.; Thomson, A.; Wise, M.; Zhang, X. Assessment of the importance of spatial scale in long-term land use modeling of the Midwestern United States. Environ. Model. Softw. 2015, 72, 261–271. [Google Scholar] [CrossRef] [Green Version]
  45. Shi, W.; Ou, Y.; Smith, S.J.; Ledna, C.M.; Nolte, C.G.; Loughlin, D.H. Projecting state-level air pollutant emissions using an integrated assessment model: GCAM-USA. Appl. Energy 2017, 208, 511–521. [Google Scholar] [CrossRef]
  46. Iyer, G.; Ledna, C.; Clarke, L.E.; McJeon, H.; Edmonds, J.; Wise, M. GCAM-USA Analysis of US Electric Power Sector Transitions; Pacific Northwest National Laboratory: Richland, WA, USA, 2017. Available online: https://www.pnnl.gov/main/publications/external/technical_reports/PNNL-26174.pdf (accessed on 14 April 2020).
  47. Yu, S.; Eom, J.; Zhou, Y.; Evans, M.; Clarke, L. Scenarios of building energy demand for China with a detailed regional representation. Energy 2014, 67, 284–297. [Google Scholar] [CrossRef]
  48. Yu, S.; Eom, J.; Evans, M.; Clarke, L. A long-term, integrated impact assessment of alternative building energy code scenarios in China. Energy Policy 2014, 67, 626–639. [Google Scholar] [CrossRef]
  49. Yu, S.; Yarlagadda, B.; Siegel, J.E.; Zhou, S.; Kim, S. The role of nuclear in China’s energy future: Insights from integrated assessment. Energy Policy 2020, 139, 111344. [Google Scholar] [CrossRef]
  50. Yu, S.; Horing, J.; Liu, Q.; Dahowski, R.; Davidson, C.; Edmonds, J.; Liu, B.; Mcjeon, H.; McLeod, J.; Patel, P.; et al. CCUS in China’s mitigation strategy: Insights from integrated assessment modeling. Int. J. Greenh. Gas. Control. 2019, 84, 204–218. [Google Scholar] [CrossRef]
  51. Chen, H.; Yang, L.; Chen, W. Modelling national, provincial and city-level low-carbon energy transformation pathways. Energy Policy 2020, 137, 111096. [Google Scholar] [CrossRef]
  52. Yu, S.; Tan, Q.; Evans, M.; Kyle, P.; Vu, L.; Patel, P.L. Improving building energy efficiency in India: State-level analysis of building energy efficiency policies. Energy Policy 2017, 110, 331–341. [Google Scholar] [CrossRef]
  53. Joint Global Change Research Institute(JGCRI). GCAM-USA Overview. GCAM Community Modeling Meeting Presentation Material. 2018. Available online: http://www.globalchange.umd.edu/data/annual-meetings/2018/Iyer_GCAM-USA_Overview_20181016.pdf (accessed on 14 April 2020).
  54. Joint Global Change Research Institute (JGCRI). GCAM Shared-Socioeconomic Pathways. Available online: http://jgcri.github.io/gcam-doc/ssp.html (accessed on 14 April 2020).
  55. Korean Statistical Information Service (KOSIS). Population Estimation. Available online: http://kosis.kr/statHtml/statHtml.do?orgId=101&tblId=DT_1BPB002&conn_path=I3 (accessed on 14 April 2020).
  56. International Energy Agency (IEA). World Energy Balances for 2010. Available online: https://doi.org/10.1787/data-00512-en. (accessed on 16 May 2020).
  57. Korea Electric Power Corporation (KEPCO). Statistics of Electric Power in Korea in 2015. Available online: https://home.kepco.co.kr/kepco/KO/ntcob/list.do?boardCd=BRD_000099&menuCd=FN05030103 (accessed on 14 April 2020).
  58. Korea New and Renewable Energy Center (KNREC). New & Renewable Energy Supply Statistics in 2017. Available online: http://www.energy.or.kr/web/kem_home_new/energy_issue/mail_vol80/pdf/publish_03_201802.pdf (accessed on 14 April 2020).
  59. Jeon, S.; Kim, S. Subsidy on Battery Electric Vehicle and Its Impact on Greenhouse Gas Emission Reduction. Korean Soc. Transp. 2019, 37, 92–109. [Google Scholar] [CrossRef]
  60. Ministry of Land, Infrastructure and Transport (MOLIT). Open Building Data. Available online: http://open.eais.go.kr/main/main.do (accessed on 14 April 2020).
  61. Korea Energy Economics Institute (KEEI). Energy Consumption Survey in 2010. Available online: http://www.keei.re.kr/keei/download/ECS2011_Revised.pdf (accessed on 14 April 2020).
  62. Korea Transportation Safety Authority (TS). Automobile Mileage Analysis in 2010. Available online: http://www.kotsa.or.kr/tsk/rck/InqDetPTRTrafficSafety.do?bbsSn=5381&bbsCd=110&ctgCd=-1 (accessed on 14 April 2020).
  63. Korea Transport Database (KTDB). Korea Transportation Statistics in 2015. Available online: https://www.ktdb.go.kr/www/selectPblcteWebList.do?key=39&searchLclasCode=PBL03 (accessed on 14 April 2020).
  64. Ministry of Land, Infrastructure and Transport (MOLIT). Statistics Herb. Available online: http://stat.molit.go.kr/portal/main/portalMain.do (accessed on 14 April 2020).
  65. Korea Petroleum Association (KPA). Refining Capacity by Country. Available online: http://www.petroleum.or.kr/ko/meterial/meterial4.php?ca_id=2060&mode=read (accessed on 14 April 2020).
  66. World Steel Association. Crude Steel Production Monthly. Available online: https://www.worldsteel.org/internet-2017/steel-by-topic/statistics/steel-data-viewer/MCSP_crude_steel_monthly/CHN/IND/KOR (accessed on 14 April 2020).
  67. Kim, H.C.; Kim, S.; Son, S.W.; Lee, P.; Jin, C.S.; Kim, E.; Kim, B.U.; Ngan, F.; Bae, C.; Song, C.K.; et al. Synoptic perspectives on pollutant transport patterns observed by satellites over East Asia: Case studies with a conceptual model. Atmos. Chem. Phys. Discuss. September 2016, 1–30. [Google Scholar] [CrossRef] [Green Version]
  68. Kim, B.U.; Bae, C.; Kim, H.C.; Kim, E.; Kim, S. Spatially and chemically resolved source apportionment analysis: Case study of high particulate matter event. Atmos. Environ. 2017, 162, 55–70. [Google Scholar] [CrossRef]
  69. Kim, H.C.; Kim, E.; Bae, C.; Cho, J.H.; Kim, B.U.; Kim, S. Regional contributions to particulate matter concentration in the Seoul metropolitan area, South Korea: Seasonal variation and sensitivity to meteorology and emissions inventory. Atmos. Chem. Phys. 2017, 17, 10315–10332. [Google Scholar] [CrossRef] [Green Version]
Figure 1. Flexible spatial scale of GCAM. GIS:
Energies 13 02565 g001
Figure 2. Spatial representation of GCAM-Korea; 16 provinces without explicit representation of Sejong.
Energies 13 02565 g002
Figure 3. Data pre-processing for the connection with GCAM-Data system.
Energies 13 02565 g003
Figure 4. Socioeconomic assumptions by provinces; (a) population, (b) GDP and (c) GDP per capita.
Energies 13 02565 g004
Figure 5. Nuclear generation and capacity assumption in GCAM-Korea.
Energies 13 02565 g005
Figure 6. Reality check (transport energy use does not include bunkering; the concept of left-hand side figure is referred to Figure 7 in Chaturvedi et al. [42]).
Energies 13 02565 g006
Figure 7. Electricity generation by fuels in 2015. Sejong province is represented as NA. Renewable resources include biomass, solar and wind.
Energies 13 02565 g007
Figure 8. Total final energy consumption by sectors and fuels in 2015. (TFC stands for Total Final Consumption). Sejong province is represented as NA.
Energies 13 02565 g008
Table 1. Comparison Between the Proposed model (Global Change Assessment Model (GCAM)-Korea) and Existing Models Used to Establish the Latest ‘Provincial Energy Plan’ in South Korea.
Model Name (Model Reference)PlatformSector CoverageConsistency between Provincial and National LevelApplicated Provinces
MAED
(IAEA [10])
Excel, Visual BasicInd 1, Trn 2, Hhd 3, Svc 4NoSeoul [19], Busan [20], Daegu [21], Ulsan [22], Chungbuk [23]
RIEEE
(KNU [11])
Excel, Access, Visual BasicInd, Trn, Res 5, Comm 6, Agri 7, Pub 8NoGwangju [24], Sejong 10 [25], Gyeongbuk [26]
Econometrics
(-)
Time series analysis NoDaejeon [27], Sejong 10 [25], Gangwon [28], Chungnam [29], Jeonbuk [30], Jeju [31]
GCAM-Korea
(JGCRI [32])
R, C++, JAVATransformation 9, Ind, Trn, Res, CommYes
End-Use Sectors: 1 Industry; 2 Transportation; 3 Household; 4 Service; 5 Residential; 6 Commercial; 7 Agriculture; 8 Public; 9 Transformation sectors include power generation, hydrogen generation and oil refining sector; 10 Sejong (SJ)’s energy plan is established with two models, Research Institute for Energy, Environment and Economy (RIEEE) and Econometrics.
Table 2. Level of Detail in GCAM-USA (Source: Iyer [53]).
Model ComponentsParameters
SocioeconomicsPopulation, Labor productivity (GDP)
Energy ResourcesOil1, Coal1, Natural gas1, Biomass2, Solar, Wind, Geothermal,
Carbon storage
Energy TransformationRefining, Gas processing1, Hydrogen1, Electricity
Final EnergyBuildings (Commercial/ Residential), Industry,
Transportation (Passenger/ Freight)
Water DemandsElectricity1
1 The parameters are represented at the national level; 2 The parameters are represented at the same level as land-use regions.

