Article

Solar Photovoltaic Panels with Finned Phase Change Material Heat Sinks

1
Simulate Learning Solutions Pvt. Ltd., Indian Institute of Technology Kanpur, Uttar Pradesh 208016, India
2
School of Energy and Electronic Engineering, University of Portsmouth, Portsmouth PO1 3DJ, UK
3
Department of Industrial and Management Engineering, IIT Kanpur, Uttar Pradesh 208016, India
4
Department of Mechanical Engineering, IIT Kanpur, Uttar Pradesh 208016, India
5
Department of Mechanical Engineering, IIT Madras, Chennai 600036, India
6
Environment and Sustainability Institute, University of Exeter, Penryn TR10 9FE, UK
7
School of Mechanical and Design Engineering, University of Portsmouth, Portsmouth PO1 3DJ, UK
8
Faculty of Technology, University of Portsmouth, Portsmouth PO1 3AH, UK
9
School of Computing, University of Portsmouth, Portsmouth PO1 3DJ, UK
*
Author to whom correspondence should be addressed.
First Authors.
Energies 2020, 13(10), 2558; https://doi.org/10.3390/en13102558
Submission received: 11 April 2020 / Revised: 13 May 2020 / Accepted: 15 May 2020 / Published: 18 May 2020

Abstract

:
Phase change material (PCM) based passive cooling of photovoltaics (PV) can be highly productive due to high latent heat capacity. However, the low rate of heat transfer limits its usefulness. Thus, the presented work aims at the improvement in PV cooling by using finned PCM (FPCM) heat sinks. In the present study, PCM heat sink and FPCM heat sinks were investigated numerically for PV cooling and the extracted heat is used for space heating. 4 kWp PV, PV-PCM and PV-FPCM systems were studied under the weather conditions of Southeast of England. It was observed that the PCM heat sinks can drop the peak PV temperature by 13 K, whereas FPCM heat sinks can enhance the PV cooling by 19 K. The PCM heat sinks can increase the PV electrical efficiency from 13% to 14%. Moreover, the daily electricity generation can be boosted by 7% using PCM and 8% by using FPCM heat sinks. In addition, 7 kWh of thermal output was achieved using the FPCM heat sink, and the overall efficiency of system increased from 13% to 19%.

Graphical Abstract

1. Introduction

Power production using photovoltaics (PV) panels is one of the economically feasible renewable technologies [1]. The present study aims at the performance enhancement of the PV panels. The motivation behind this lies in the fact that only small portion of the solar irradiance converts into electricity and major portion becomes heat. The heat generation in the PV cells rises its temperature that reduces the power production efficiency [2]. It has been reported that the PV temperature can reach up to 50 K higher than the ambient and the power production reduces by 0.5%/K [3], which conveys the importance of the PV cooling [4]. Forced ventilation, water circulation and water spray are active methods of PV cooling which can decrease the PV temperature by 30 K but require pumping power [5,6,7,8,9]. There are also passive methods, such as natural ventilation, heat sink and thermoelectric for PV cooling; however, they can cool the PV only by 10–15 K [10,11,12]. Thus, researchers have made efforts to explore a passive cooling method that does not require pumping power and achieve significant PV cooling. It is reported that the phase change material (PCM) can be highly productive in PV cooling because it has the ability to absorb/release large amount of heat within small temperature range [13]. In the present work, the studies that analyze the performance enhancement of PV using PCM have been reviewed.
Huang et al. [14] were the first to investigate the performance of a PV equipped with PCM (melting temperature 26 °C) in details. The height, width and depth of the system were 13.2 cm, 30 cm and 49 cm, respectively. It has been reported that the temperature of the front surface can be reduced from 62 °C to 37 °C under solar irradiance of 750 W/m2 and ambient temperature of 23 °C. In another study, Huang et al. [15] inserted internal fins to PCM container for the abovementioned system in order to enhance the heat transfer. It has been reported that the temperature of the front surface can be reduced further from 37 °C to 35.3 °C. On the other hand, Atkin and Farid [16] explored the influence of external fins. They investigated four cases: (a) PV with no heat sink (i.e., the base case), (b) PV with PCM heat sink (no fins), (c) PV with finned heat sink (no PCM) and (d) PV with PCM heat sink with external fins. It has been reported that the PV efficiency can be increased by 7.32%, 11.70% and 12.97% using systems b, c and d, respectively.
Researchers have also studied the influence of ambient/operating conditions on the performance of PV-PCM system. Khanna et al. [17] have investigated the influence of wind speed on the performance of PV-PCM systems. It has been reported that the PCM based cooling is more effective for low wind speed conditions as compared to high wind speed conditions. For the former case, the electricity generation of PV can be increased by 10.5% using PCM, and for the latter case, the increment is 5.3%. Hasan et al. [18] have investigated the performance of PV-PCM for high and low ambient temperature conditions. It has been reported that the PCM based cooling is more effective for high ambient temperature conditions as compared to low ambient temperature conditions. For the former case, the electricity generation of PV can be increased by 13.0%, and for the latter case, the increment is 5.1%. Hasan et al. [19] have also investigated the performance of various PCMs equipped with PV cells (10 cm × 10 cm). It has been reported that the salt hydrate based PCM (melting temperature 29 °C) can maintain the PV temperature by 10 °C below the reference one for 5 h under a solar irradiance of 1000 W/m2. In the literature, it has also been reported that the operating conditions have significant influence on the duration of PV-PCM cooling [20]. The decrease in wind speed from 6 to 0.2 m/s can decrease the duration of cooling by 3h. The insertion of fins can also decrease the cooling duration by 1.5 h [21].
The influence of the orientation of the system on its performance has also been studied by researchers. Rabie et al. [22] and Siyabi et al. [23] studied the impact of keeping the PCM container slanted or horizontal. The study showed that the slanted PCM heat sink is better in terms of PV cooling. Indartono et al. [24] have studied the influence of installation of the system on the thermal management of the PV. It has been reported that for roof installed systems, PCM can decrease the PV temperature by 6 K and for stand installed systems, PCM can decrease the PV temperature by 3 K. Researchers have also proposed a set of modified Navier–Stokes’ equations [25] and a simplified model to analyze the energy/momentum/mass conservation equations of PCM that can evaluate the results with 94% accuracy [26].
The above studies on PV-PCM have shown that the heat from PV cells can be effectively extracted by PCM. In order to use the extracted heat, water heating application has been investigated by researchers. It has been reported that a thermal efficiency of 10% can be achieved, and an overall efficiency of 20% can be achieved at cold climate of Lisbon [27]. Sardarabadi et al. [28] have reported that the use of extracted heat of PV-PCM as water heating application can increase the overall efficiency of system by 7%. Browne et al. [29] have also investigated the use of extracted heat of PV-PCM system and found that water heating can achieve a thermal efficiency of 20%–25% in the cold climate of Dublin. Preet et al. [30] studied the system at hot climate of Gurdaspur and reported a thermal efficiency of 15.96% and 35.4% for mass flow rate of 0.013 kg/s and 0.031 kg/s, respectively.
In the literature, all the available studies use the extracted heat of PV-PCM for water heating. In the present study, the use of extracted heat for space heating purpose is investigated for a cold country. From the review of studies, it is found that two-dimensional (2D)/three-dimensional (3D) analysis is required to predict the performance of PV-PCM. In literature, the numerical studies that carried out 2D/3D analysis considered very small systems (~10–15 cm height). In the present study, big standard/real size systems (height 1 m) have been used to study the real effect of internal fins inside the PCM and study has been carried out for a 4 kWp system suitable for a UK household.

2. Systems Description

Three polycrystalline silicon-based roof integrated PV systems (4 kWp each) were used for the investigation. Each system consists of 20 PV panels (200 Wp each). The first PV system was the reference one, which consisted of reference PV panels (Figure 1a). In the second PV system, the PCM container was integrated at the back of the panel (Figure 1b). In the third system, PV was integrated with PCM and fins (Figure 1c). The material of fins and PCM container is aluminum having 2 mm thickness and the material of PCM is paraffin wax having melting temperature around 293 K. The specifications of PV panels, PCM and container are given in Table 1. Using a software named ANSYS 17.1, the systems were built in Design Modeler. For the first system, the geometries of all the layers of PV were created by generating separate bodies for Glass, Ethylene Vinyl Acetate (EVA), Silicon, EVA and Tedlar. The thicknesses of the bodies were given as 3 mm, 0.5 mm, 0.3 mm, 0.5 mm and 0.1 mm, respectively. The tilt of all the bodies were given as 45° and the orientation was taken as south facing. After building all the separate bodies, it was necessary to make them a system. Thus, the interfaces of the separate bodies were coupled. In this way, the PV was built consisting of five layers. For the second system, the separate bodies of all layers of PV, aluminum container and PCM were generated in Design Modeler. The thickness of PCM container was given as 2 mm and depth as 6 cm. The tilt of PCM container was given as 45° and the orientation was taken as south facing. After building all the separate bodies, their interfaces were coupled to make them a single system named PV-PCM. For the third system, the same process was repeated as that of second system and, in addition, the bodies for the fins were built. The surface of the first fin was coupled inside the PCM container at a 20 cm distance. Similarly, other fins were coupled inside the PCM container at 40 cm, 60 cm and 80 cm, which are the optimized positions [31]. In this way, a third system was built, named PV-FPCM. After building the systems, the cell zones were created for each body in order to assign the properties of glass, EVA, silicon, Tedlar, container, PCM and fins. In this step, the thermal conductivity, density, specific heat capacity, thermal expansion coefficient and viscosity were assigned for each body as functions of temperature. The temperature of the systems was computed by solving the transient equations (Section 3) in the ‘Solution’ tab of Fluid Flow (Fluent) software. The results for the average temperature of the PV and temperature contours of the complete systems were extracted from the ‘Graphics’ section of Fluent. The results for the power production were extracted from the equation explained in Section 3.4, which takes the temperature of the system as an input.
Since the studied systems are integrated to the roof of a household, the back of the panels were exposed to the indoor environment in order to deliver the heat to the room, as shown in Figure 1d.

3. Methodology

The temperature of the systems, power production, electrical efficiency, daily electricity generation and thermal output can be computed using the following transient equations.

3.1. Thermal Analysis

The energy conservation equation for the ith body of the systems is given in Equation (1), which is applicable for both solid and liquid regions by keeping the velocities (ux and uy) as 0 for solid regions:
ρ i C p , i T i t = G i + k i ( 2 T i x 2 + 2 T i y 2 ) x ( ρ i C p , i u x T i ) y ( ρ i C p , i u y T i )
where ρ is the density, which is 0.88 kg/l for solid PCM and 0.77 kg/l for liquid PCM, i denotes the ith body, Cp is the specific heat capacity, which is 2000 J/kg-K for PCM, T is the temperature, k is the thermal conductivity, which is 0.2 W/m-K for PCM, and G is the heat generation occurring in silicon layer, which is the portion of absorbed solar irradiance not converted into electricity.
Along the length and depth, the modified momentum conservation equation for the phase change material is given in terms of its thermal properties and its velocities [25]:
ρ P ( u x t + u x u x x + u y u x y ) = p x + μ l ( 2 u x x 2 + 2 u x y 2 ) + ρ P g x F x
ρ P ( u y t + u x u y x + u y u y y ) = p y + μ l ( 2 u y x 2 + 2 u y y 2 ) + ρ P g y F y
where the subscript P denotes the PCM, μ is the dynamic viscosity, which is 105 kg/ms for the solid region of PCM and 0.001 kg/ms for liquid region, p is the pressure, g is the acceleration due to gravity and F is the volumetric force.
The mass conservation equation for the phase change material is given in terms of its physical properties as follows:
u x x + u y y = 0

3.2. Boundary Conditions

The heat going out from the front surface of the systems is equated to the convective and radiative losses.
k f T f y = h [ T f T a ] + σ ε [ T f 4 T s 4 ]     a t   f r o n t
where kf is the thermal conductivity of the front surface, which is 1.8 W/mK, f is the subscript used for the front surface, a for ambient and s for sky/surroundings, σ is the Stefan Boltzmann constant, which is 5.68 × 10⁻⁸ W/m2K4, ε is the emissivity of front surface, which is 0.85 and h is the convective heat transfer coefficient, which is calculated using correlations. The latter value is around 5 W/m2K to 13 W/m2K depending on the weather conditions and temperature of surface. The heat loss from the sides of the systems can be equated to 0 because of insulation:
k i T i x = 0     a t   s i d e s
where ki is the thermal conductivity of the ith body. k1 is the thermal conductivity of glass (1.8 W/m-K), k2 is for EVA (0.35 W/m-K), k3 is for silicon (148 W/m-K), k4 is for the second layer of EVA (0.35 W/m-K), k5 is for tedlar (0.2 W/m-K), k6 is for aluminum container (211 W/m-K), k7 is for aluminum fins (211 W/m-K) and k8 is for PCM (0.2 W/m-K).
From the rear of the PV, the heat will be flown to ambient for reference system and towards aluminum container for PCM integrated systems and this equality can be written as follows:
k b T b y = h [ T b T a ] + σ ε [ T b 4 T s 4 ]   a t   P V   b a c k   o f   r e f e r e n c e   s y s t e m
k b T b y = k a l T a l y     a t   P V   b a c k   o f   P C M   s y s t e m s
where kb is the thermal conductivity of the PV back surface (0.2 W/mK), b subscript is for the back, al for aluminum and kal is the thermal conductivity of aluminum (211 W/mK). From the rear of the PCM container, the heat is flown to room which is the thermal output:
k a l T a l , b y = h [ T a l , b T r ] + σ ε [ T a l , b 4 T r 4 ]
where the subscript r is for room, h is the convective heat transfer coefficient, which contains only the natural convection effect and σ is the Stefan Boltzmann constant (5.68 × 10⁻⁸ W/m2K4).

3.3. Initial Conditions

Before exposing the systems to sunshine, the temperature of each ith body of the system was considered to be at ambient temperature, which can be written as follows:
T i = T a   b e f o r e   s u n s h i n e
Before exposing the systems to sunshine, the phase change material was solid, which can be written as follows:
u x = u y = 0   b e f o r e   s u n s h i n e

3.4. Power Production

After calculating the temperature at each point of the system using equations of Section 3.1, the average PV temperature (TPV) can be computed and, consequently, power production can be computed. The power production depends on the solar irradiance (S), surface area of panels (A), average PV temperature (TPV), panel efficiency at standard test conditions (ηSTC = 0.20), coefficient to incorporate the effect of temperature on efficiency (−0.005 /K), coefficient to incorporate the effect of solar intensity on efficiency (0.085) and other losses due to inverter efficiency, PV degradation and wiring losses (ηo,loss = 0.25). Thus, the power production is estimated as follows:
P = ( 1 η O , l o s s ) η S T C [ 1 0.005 ( T P V 25 ) + 0.085 ln ( S / 1000 ) ] S A

4. Validation

The experimental data reported by Huang et al. [32], explaining the performance of the system equipped with PCM-heatsink, was used to validate the model presented in Section 3. The corresponding specifications of the PCM used, the dimensions of the PCM container and the ambient conditions are presented in Table 2. The equations were solved using these specifications. The modeled values of the average temperature of the front surface of the system are compared against the experimental data. The comparison is shown in Table 3. It can be seen that the maximum error in modeled values is −2 °C.

5. Results and Discussion
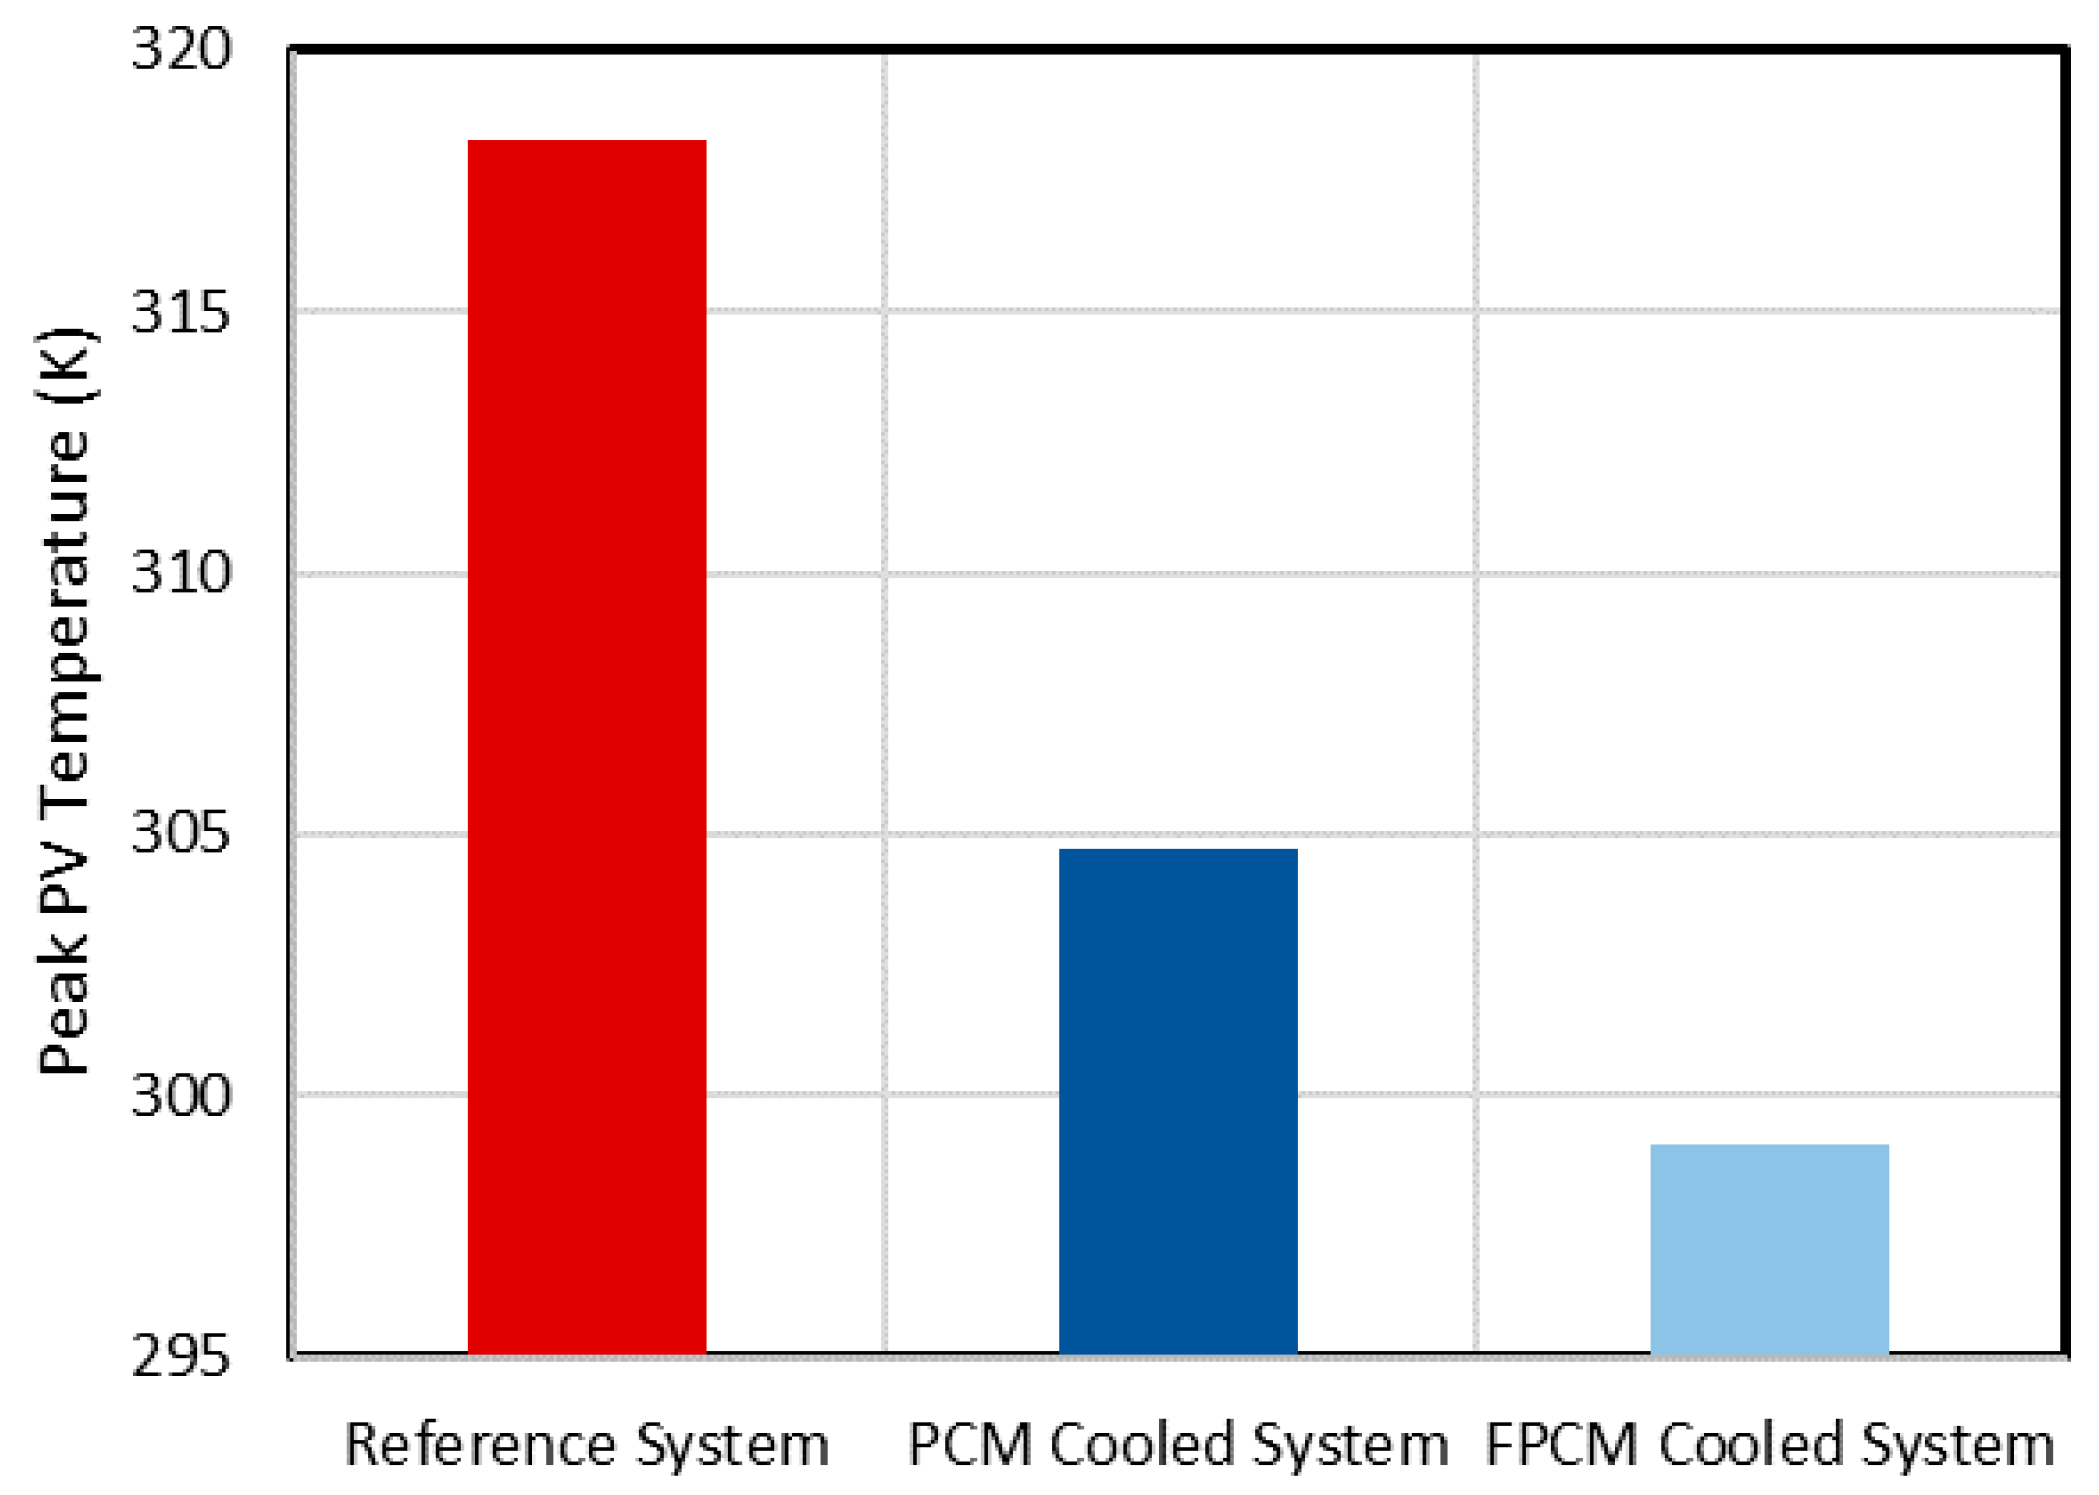
All the systems are studied under the weather conditions of the Southeast of England. The solar irradiance and ambient temperature are given in Appendix A, Figure A1. The performances of all the systems are compared in terms of PV temperature or drop in PV temperature by PV cooling, power production, electrical efficiency and daily electricity generation. In addition, the instantaneous values of thermal output, total thermal energy delivered and total system efficiency are also reported.

5.1. PV Temperature

The variations in the average temperature of the PV panels are shown in Figure 2 for the reference system, PCM cooled system and FPCM cooled system. The corresponding peak PV temperatures attained by the systems (over the day) are presented in Figure 3.
It was observed that the peak temperatures attained by the PCM and FPCM integrated panels were less than that of the reference panel. This is because of the fact that the PCM and FPCM heat sinks absorb the heat of the panel and reduce the temperature of the PV. It is also observed from Figure 3 that the FPCM integrated system achieved higher PV cooling than those of others. This is because of the fact that in this system, there are fins that enhance the heat transfer from PV to PCM and decrease the PV temperature more efficiently.
It can also be observed from Figure 2 that the average temperature of all the panels rises with an increase in solar-irradiance, which reaches maximum value and thereafter drops with a decrease in solar-irradiance. This is because of the fact that the elevation in the solar irradiance increases the heat generation in the cells that increases the cell temperature. Figure 2 also shows that the peak temperature attained by the PCM cooled panels is delayed compared to the peak temperature attained by the reference panel because of the larger thermal mass added by PCM/FPCM heat sinks.

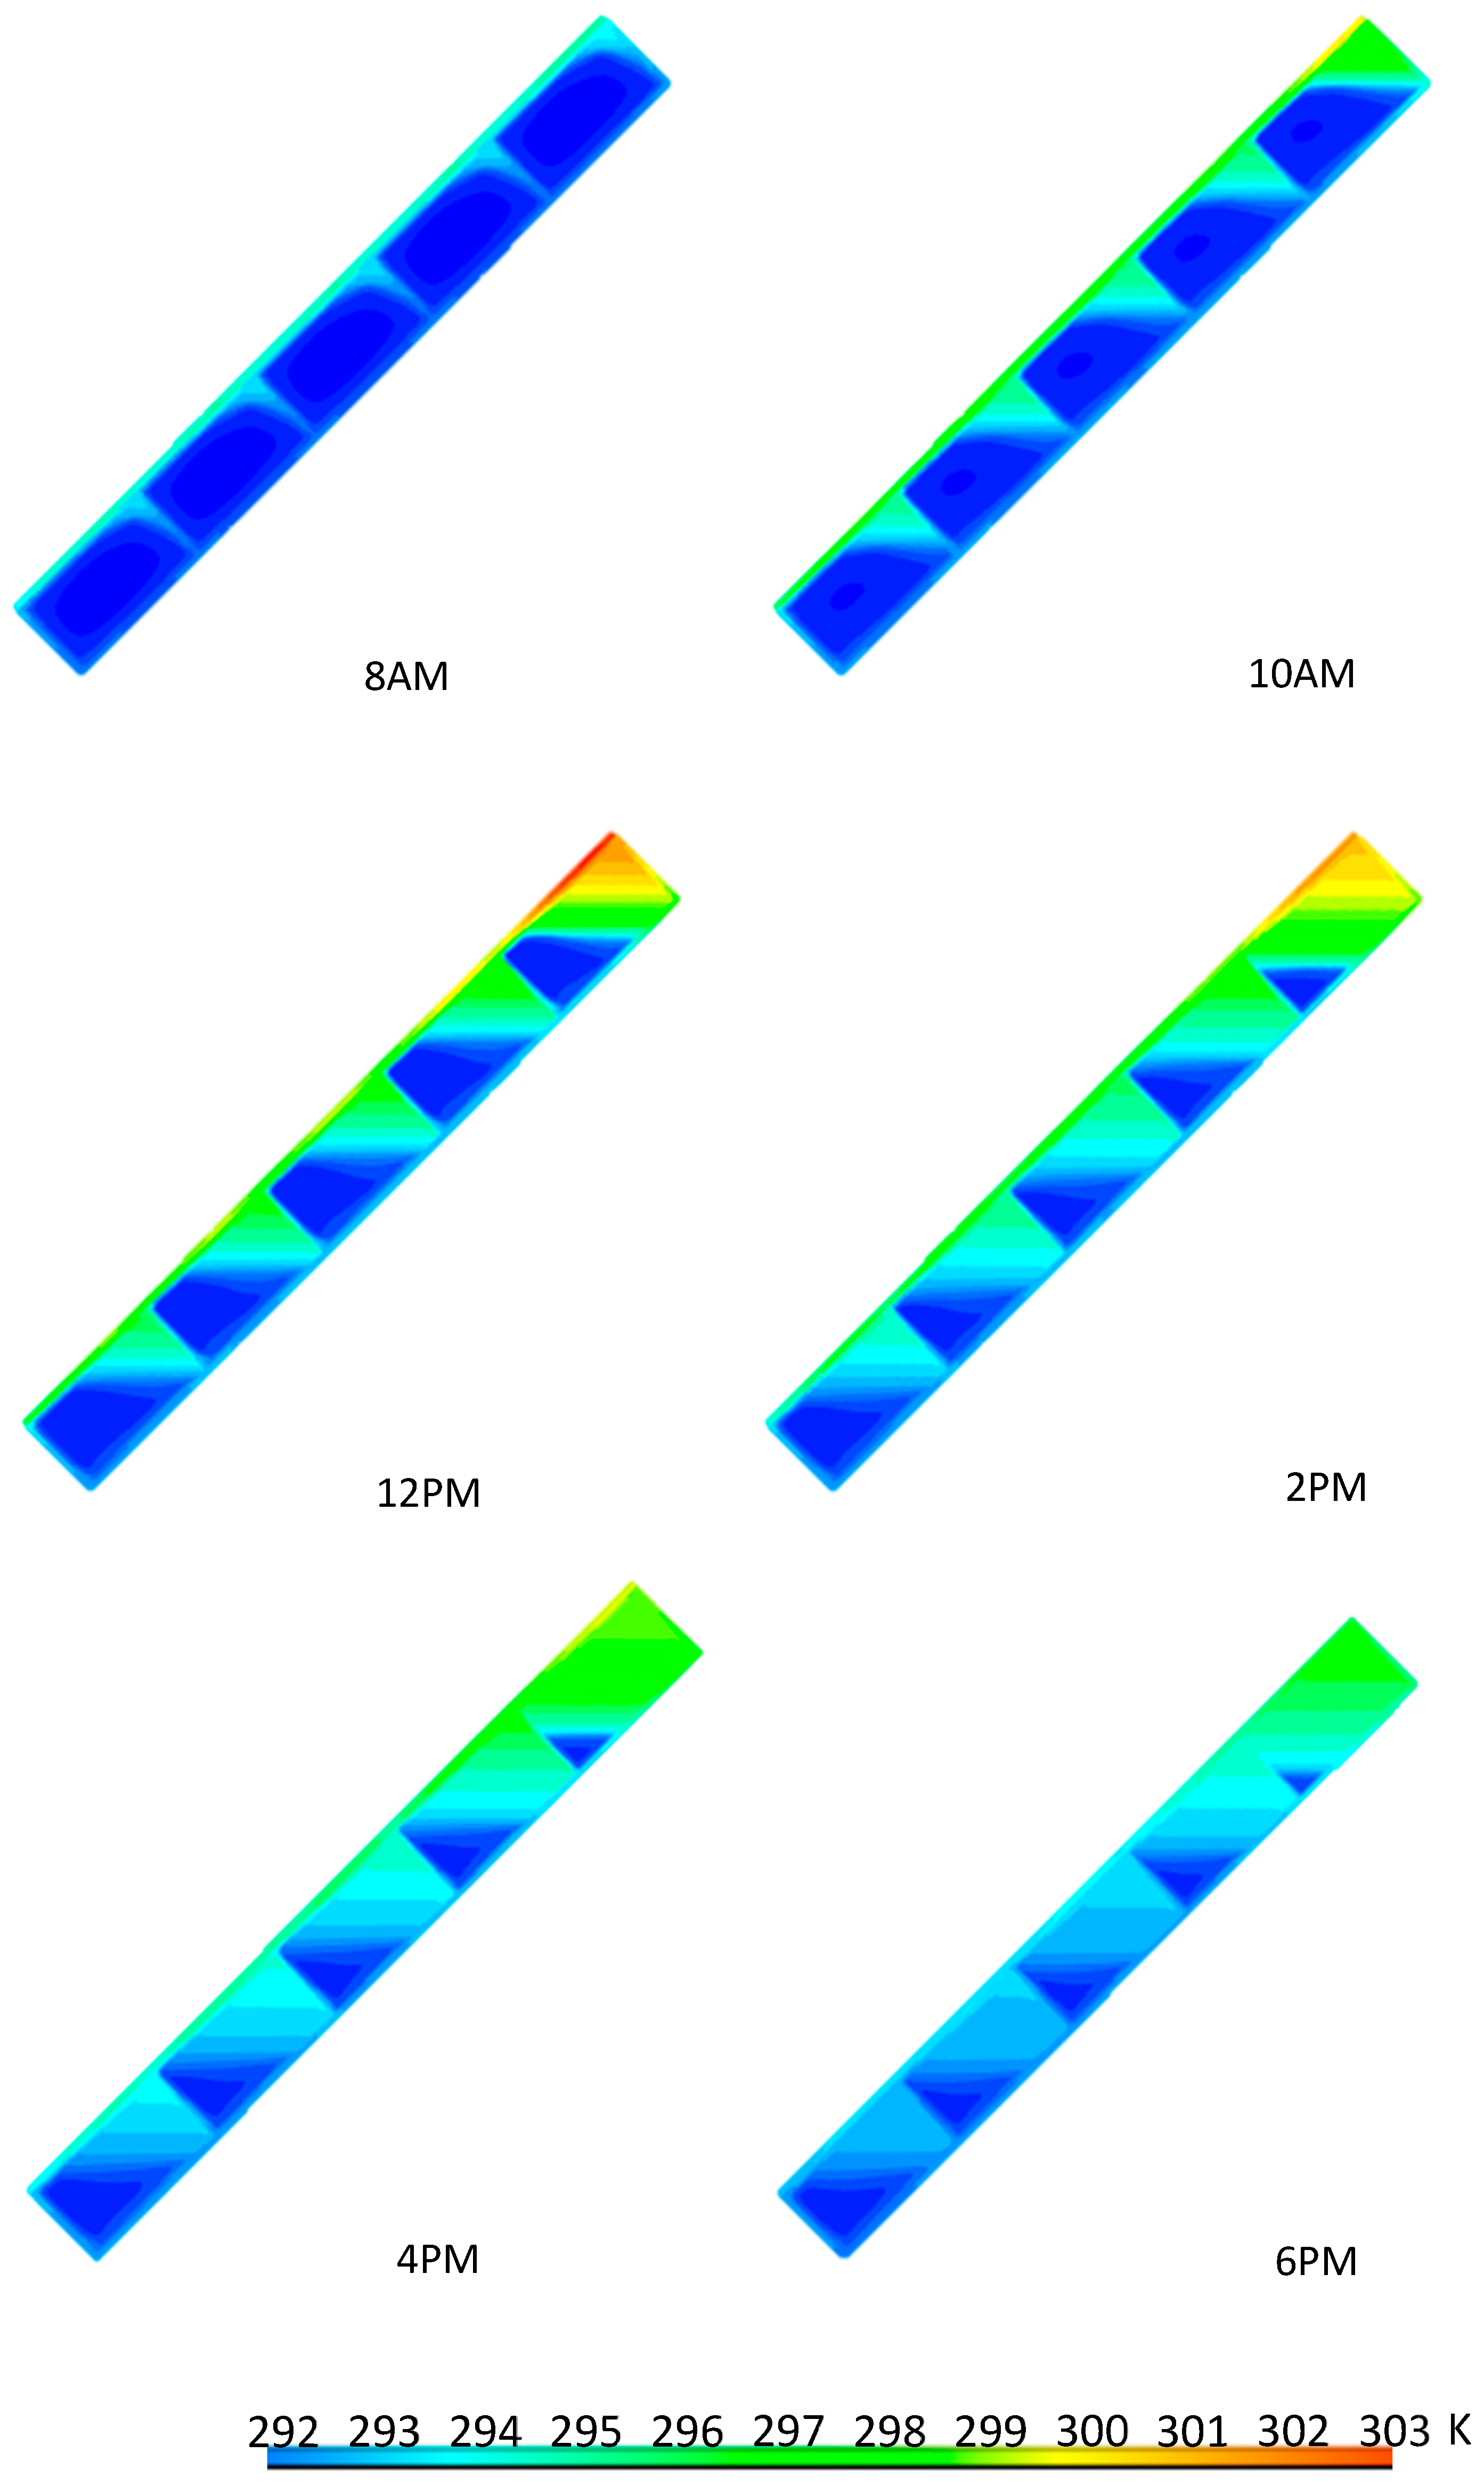
5.2. Temperature Contours

The variations in the temperature of the PV-FPCM system are shown in Figure 4. From this figure, the temperature of the PCM can also be seen in addition to other parts of the system. The melting of the PCM with time can also be explained using these temperature contours. At 8 am, it can be seen that the temperature inside the PCM containers is represented by a dark blue color, which is below the melting point. It shows that at 8 am, the PCM is in a solid phase. It can also be seen that the PCM, which is in contact with the fins and the container upper walls, is represented by a light blue color, which is in a melting phase. Thus, this portion of PCM is changing its phase. At 10 am, it can be seen that some portions of the PCM are dark blue, some portions are light blue and some portions are green. Thus, some portions of the PCM (green) are completely melted, some portions (light blue) are changing its phase and some portions (dark blue) are still in a solid phase. By looking at the contours that correspond to 10 am, 12 pm and 2 pm, it can be seen that the solid portion of PCM (dark blue) decreases with time and melted portion of PCM (green) increases with time. At 6 pm, it can be seen that the dark blue portion (solid phase) of the PCM is increased as compared to 4 pm. This shows that the solidification of the PCM is started.

5.3. Power Production

The variations in the power production by the reference system, PCM cooled system and FPCM cooled system are shown in the Figure 5. It can be observed from the figure that the power production of all the systems rises with increase in solar-irradiance, reach maximum value and thereafter drops with the profile similar to solar intensity. This is because of the fact that the elevation in the solar irradiance increases the current generation in the cells, which increases the power production.
The peak power productions of the systems are presented in Figure 6. It is observed that the PCM and FPCM cooled systems produce higher power than that of the reference system. This is due to the lower PV temperature maintained by extraction of heat through PCM/FPCM heat sinks, which increases the power production of PCM/FPCM systems. It is also observed that the FPCM cooled system achieved larger power production than that of others. This is because of the reason that in this system, a larger surface area of aluminum (in the form of fins) is in contact with the PCM in comparison to other systems, which enhances the heat flow from PV to PCM and reduces the PV temperature more efficiently and enhances the power production.

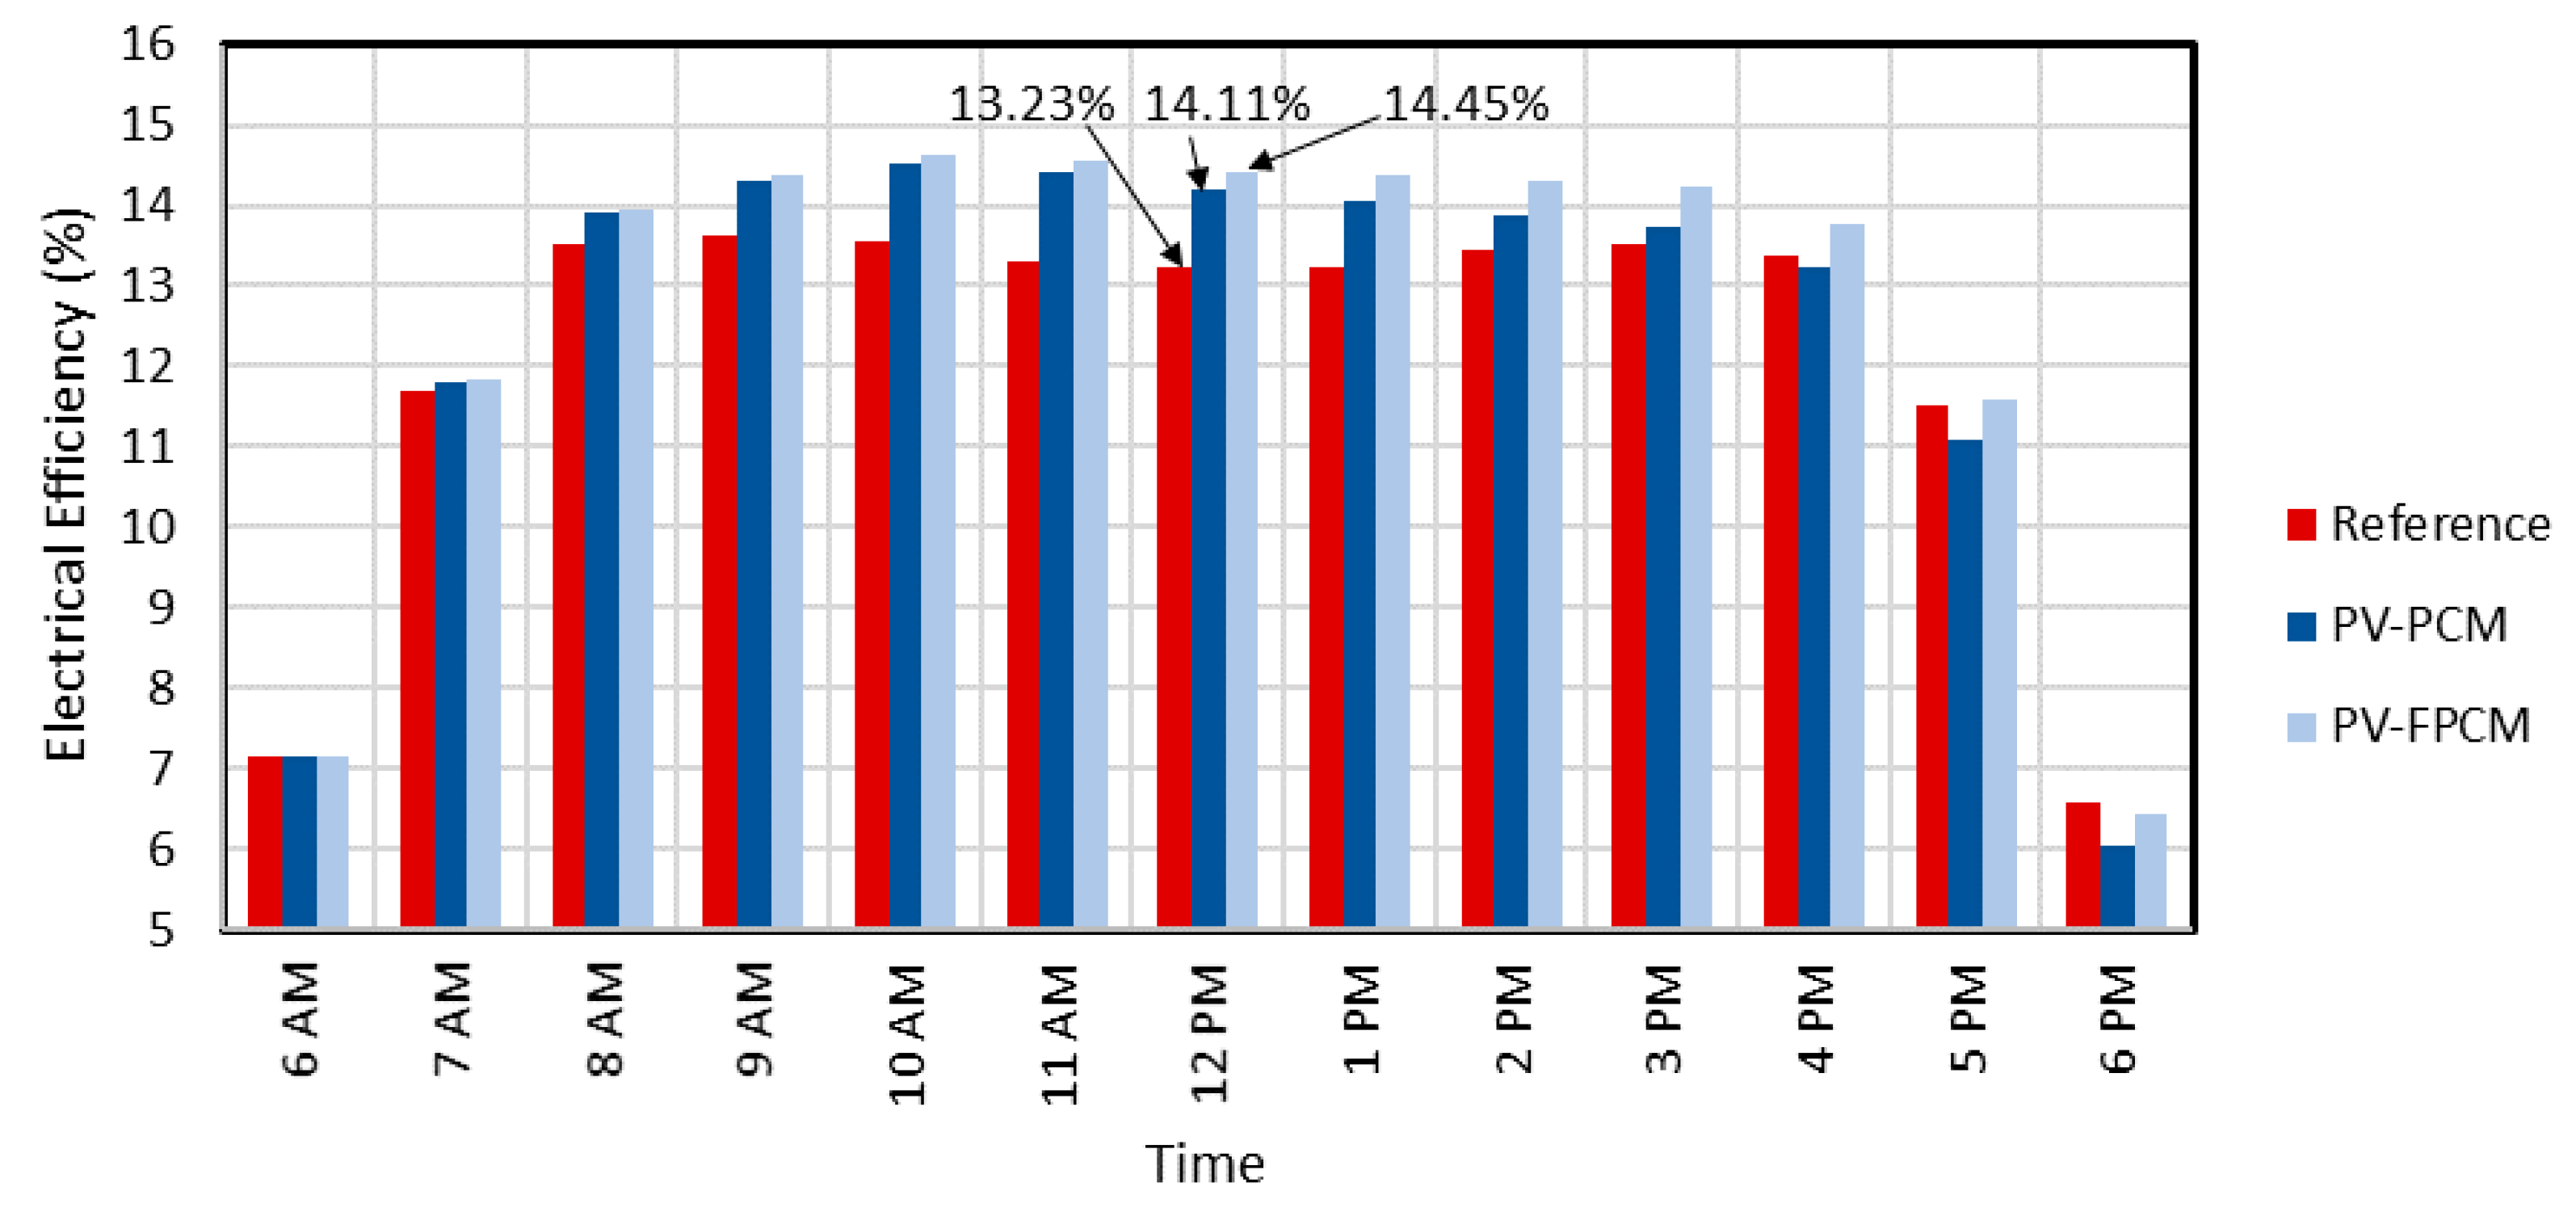
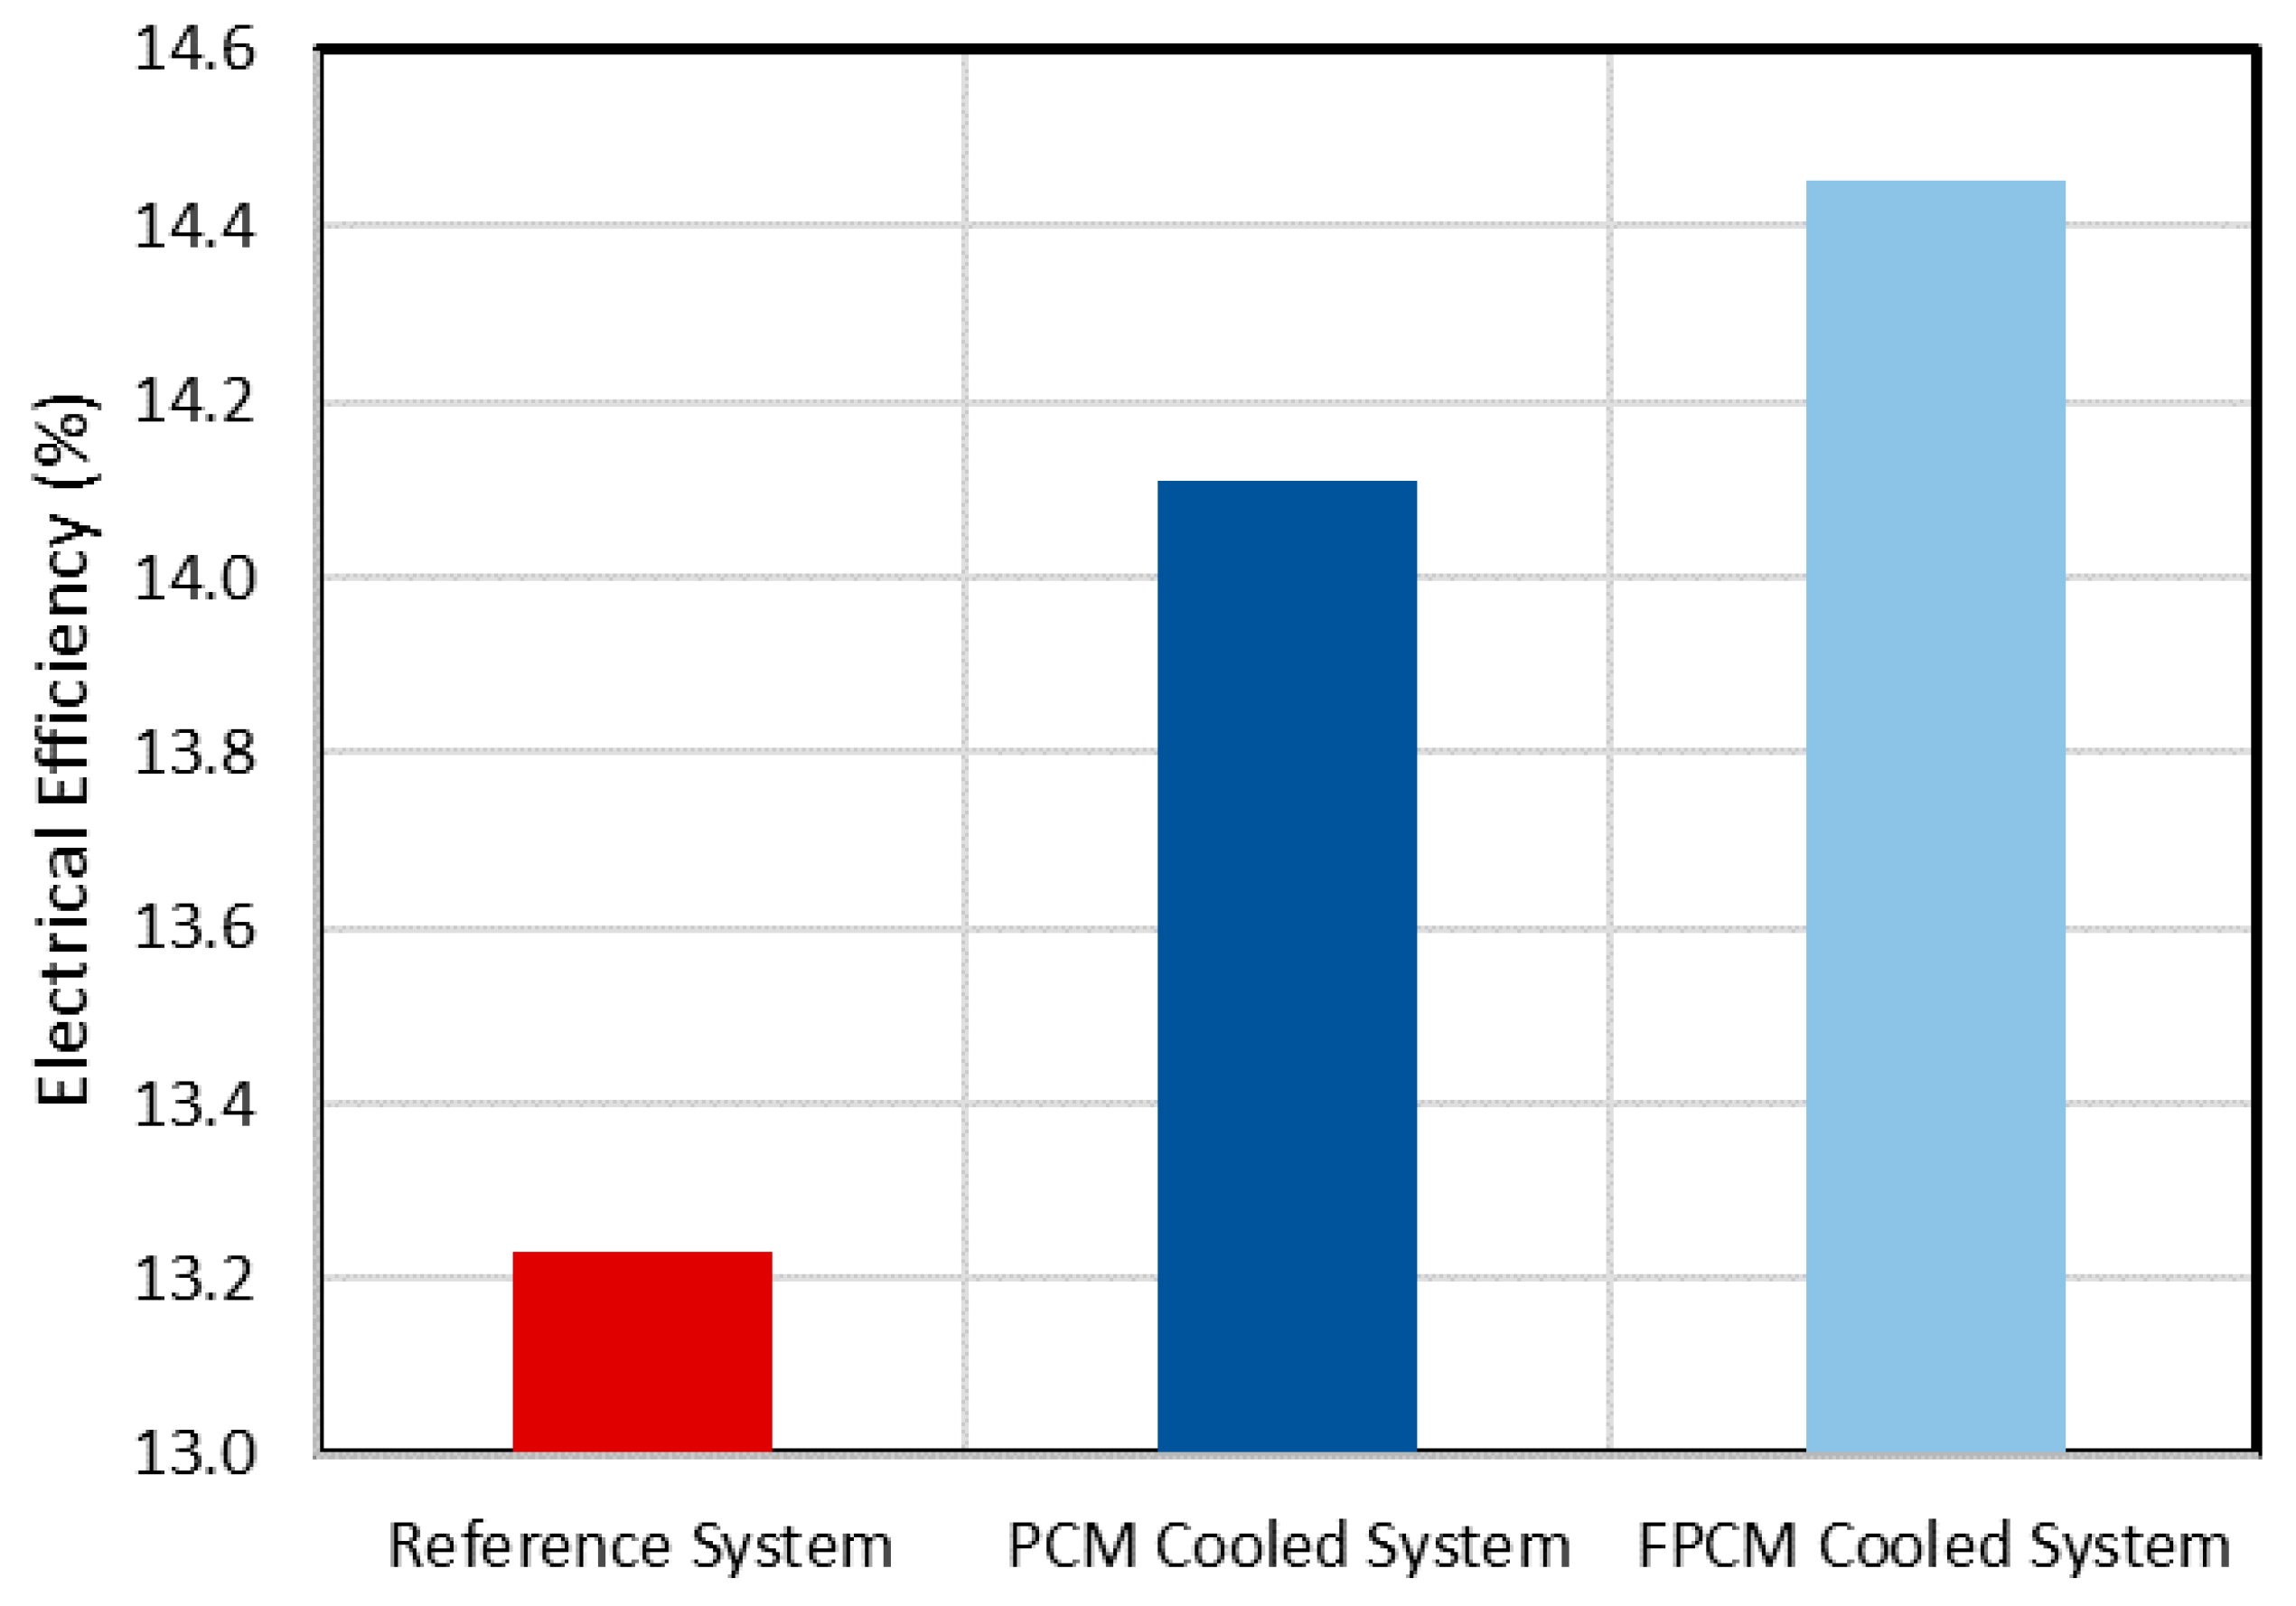
5.4. Electrical Efficiency

The variations in the electrical efficiency of the reference system, PCM cooled system and FPCM cooled system are shown in Figure 7. It is observed that, initially, the electrical efficiency of the systems increases with time. This is because of an increase in irradiance, which has a positive effect on the efficiency. Around noon, the efficiency decreases. This is because of an increase in the PV temperature that negatively affects the efficiency. During the end of the day, the efficiency decreases with time. This is because of a decrease in irradiance.
A trough can be seen around noon in the trend of efficiency of the reference system. This is because of a decrease in efficiency resulting from the rise in PV temperature around noon. However, in other systems, the PCM cools down the PV during noon and the efficiency does not decreases. Thus, a trough around noon is not seen in the trends of other systems.
The electrical efficiency of the systems during noon are presented in Figure 8. It is observed that the efficiency of the PCM/FPCM integrated systems is more than that of the reference system. The higher efficiency of the PCM/FPCM systems is due to the higher power production resulting from the thermal regulation of photovoltaics cells by using finned PCM.

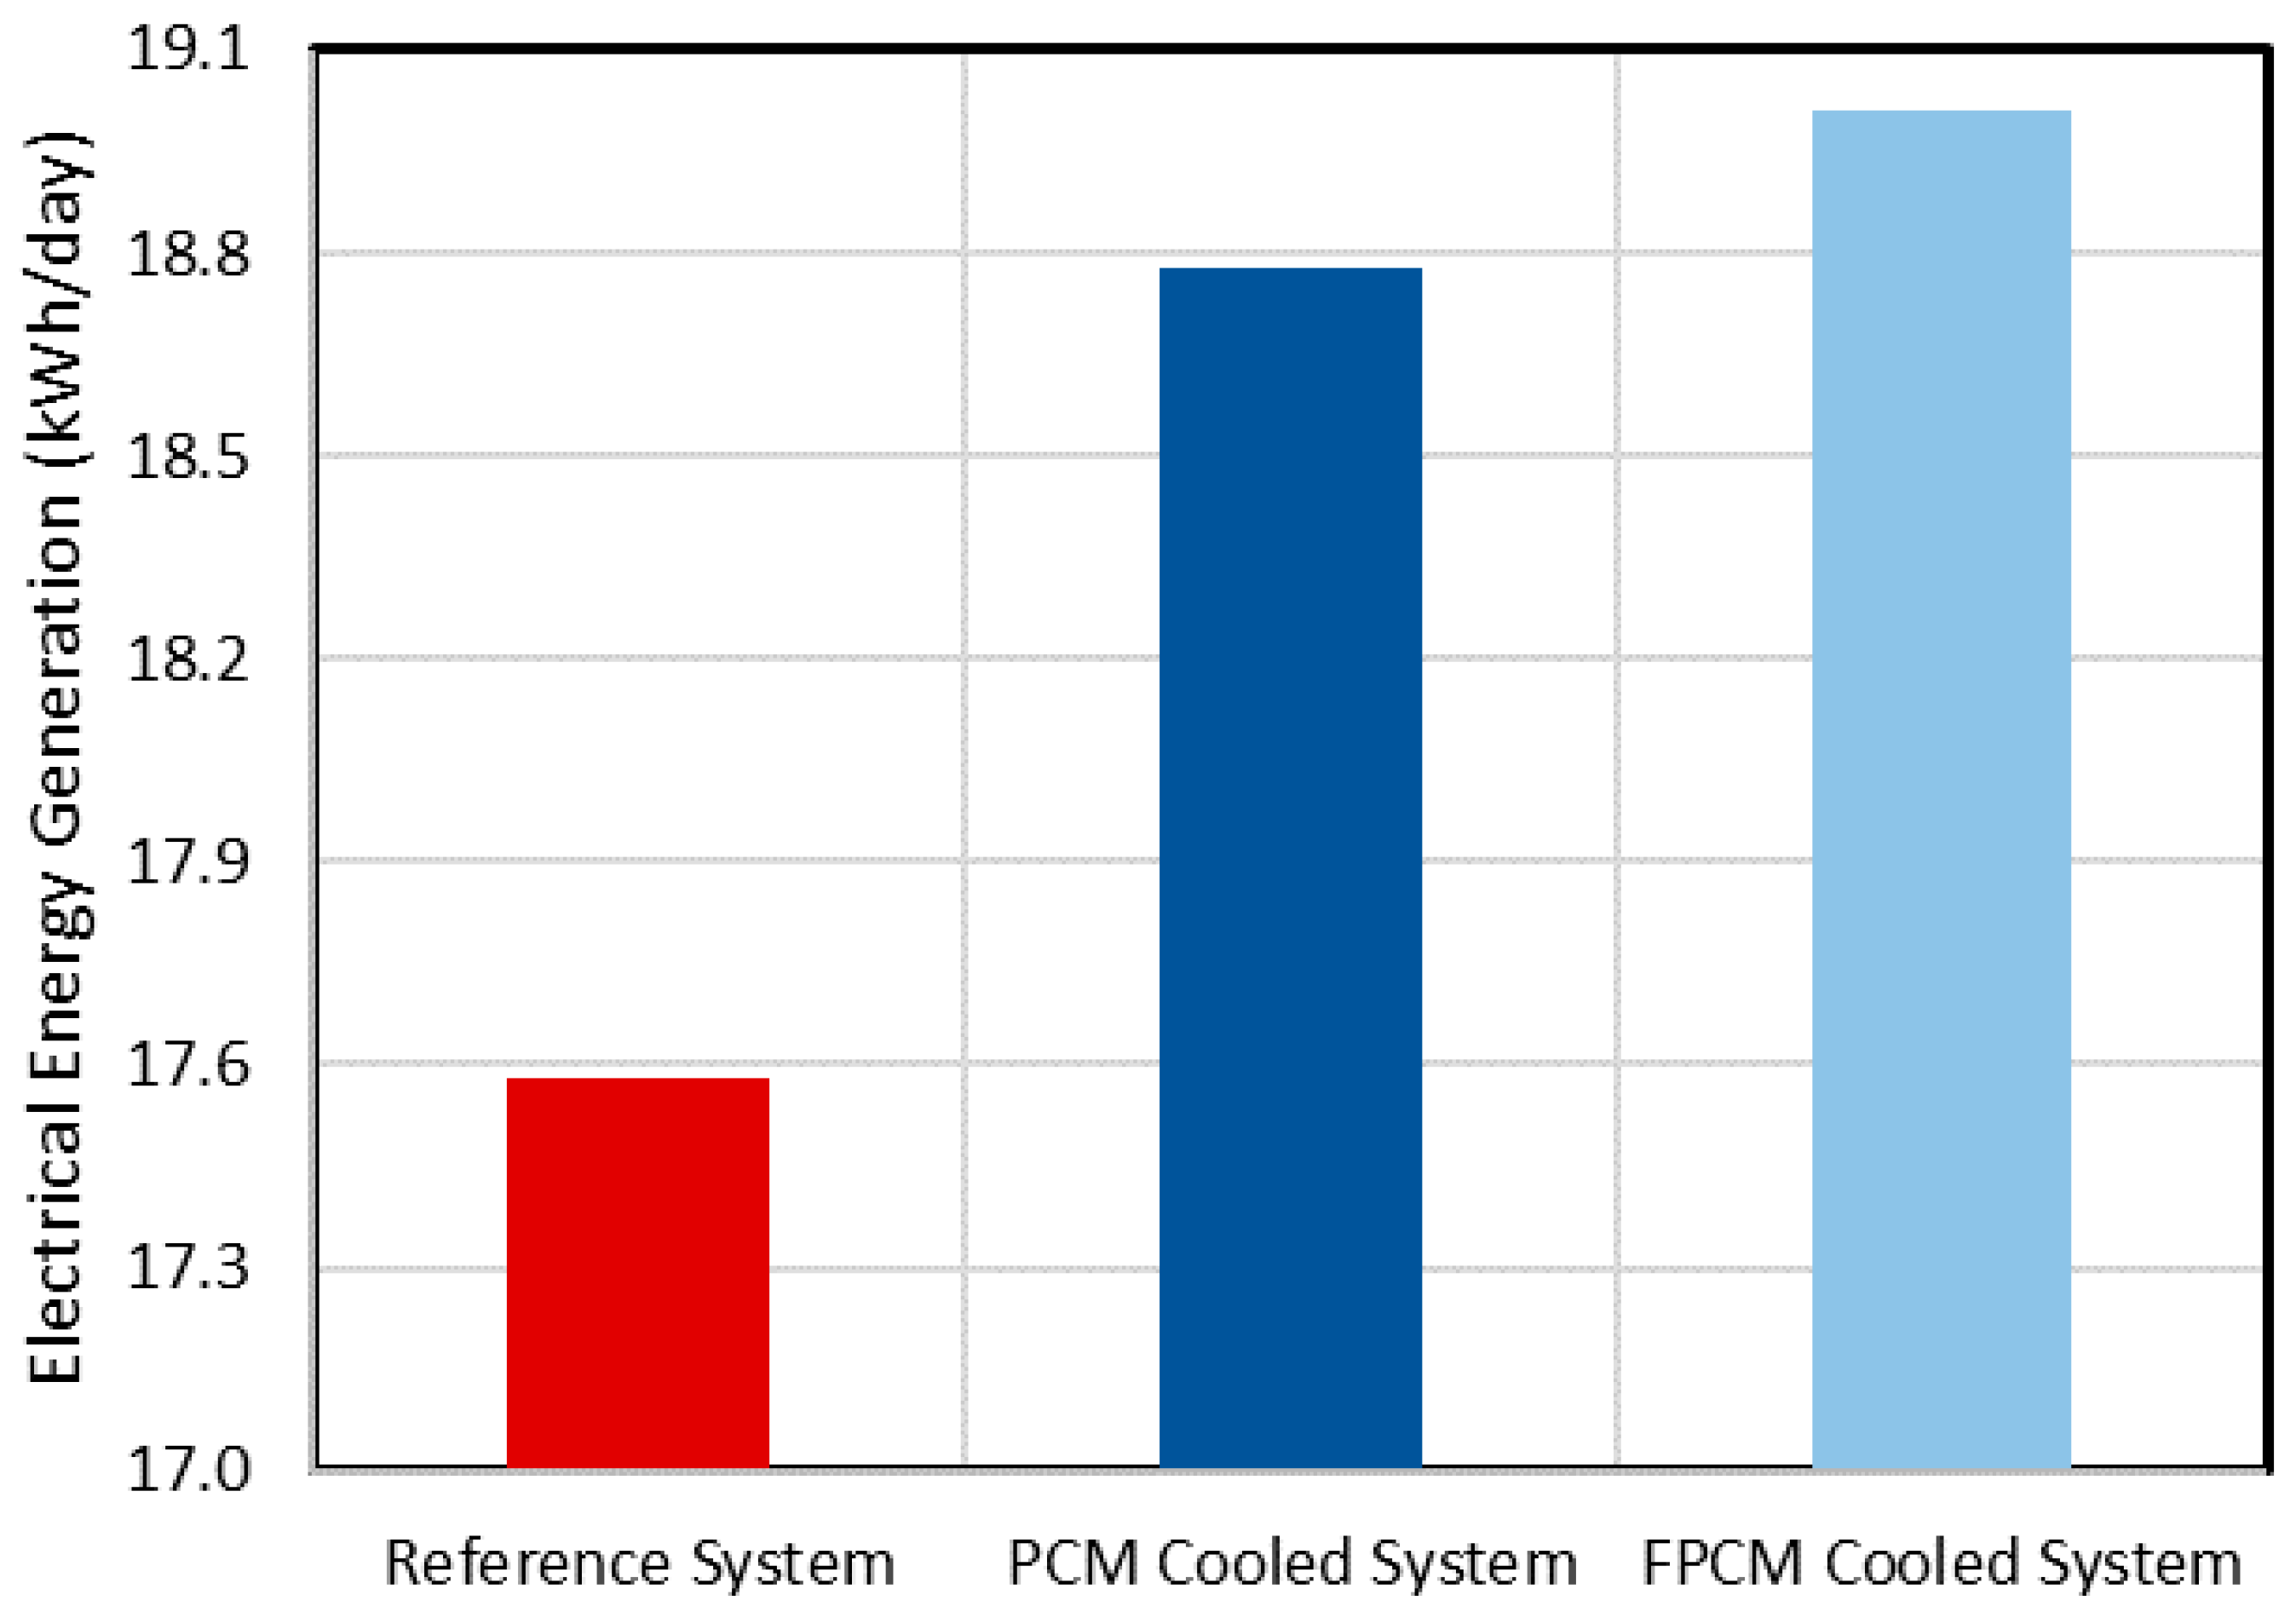
5.5. Daily Electricity Generation

Total electricity generated by reference system, PCM cooled system and FPCM cooled system over the complete day are presented in Figure 9. The results show that the daily electrical energy generation by reference system is 17.6 kWh. The corresponding values for the PCM cooled and FPCM cooled systems are 18.8 and 19.0 kWh, respectively. Thus, the PCM and FPCM heat sinks have increased the electrical energy generation from PV by 7% and 8%, respectively.

5.6. Cost Analysis

For cost analysis, the first step is to calculate the cost of the PV-FPCM system. The cost of 4 kWp PV system is £6000. The cost of paraffin based PCM is £1.5/kg [33]. For 4 kWp system, total volume of PCM used is 1.2 m3 (6 cm depth × 20 m2 aperture area) which is 900 kg (1.2 m3 × 750 kg/m3). Total cost of PCM is £1350. An additional £900 is for aluminum containers and their manufacturing, considering the cost given in [33]. Thus, the total cost of PV-FPCM system is around £8250.
The second step is to calculate the output of the PV and PV-FPCM systems over the lifetime of 20 years. For very simple calculations, it is considered that the values of daily power production given in Figure 9 are the maximum values over the year as the chosen day is a clear sky day of summer and the minimum power production values over the year are 0 kWh/day for fully rainy days of winter. Thus, the average power production values over the year are 8.75 kWh/day for the PV system and 9.51 kWh/day for the PV-FPCM system. Total power production over the lifetime becomes 63,875 kWh for the PV system and 69,423 kWh for the PV-FPCM system. It must be mentioned that the panel degradation efficiency is already incorporated in Section 3.4.
The cost of power production is £0.094/kWh (£6000/63875 kWh) for the PV system and £ 0.119/kWh for the PV-FPCM system. It shows that the PV-FPCM system is not economical. The main reason is that the PV system does not produce significant power during cloudy/rainy days, which left PCM unused for significant time of the year of the studied place and low irradiance values for most of the months. However, it must be noted that in the present study, the depth of the PCM container is taken as 6 cm. Therefore, the analysis must be carried out for various sizes of containers to find cost optimized solution.
It must also be noted that the overall output of the PV-FPCM system can be increased by using the extracted heat.

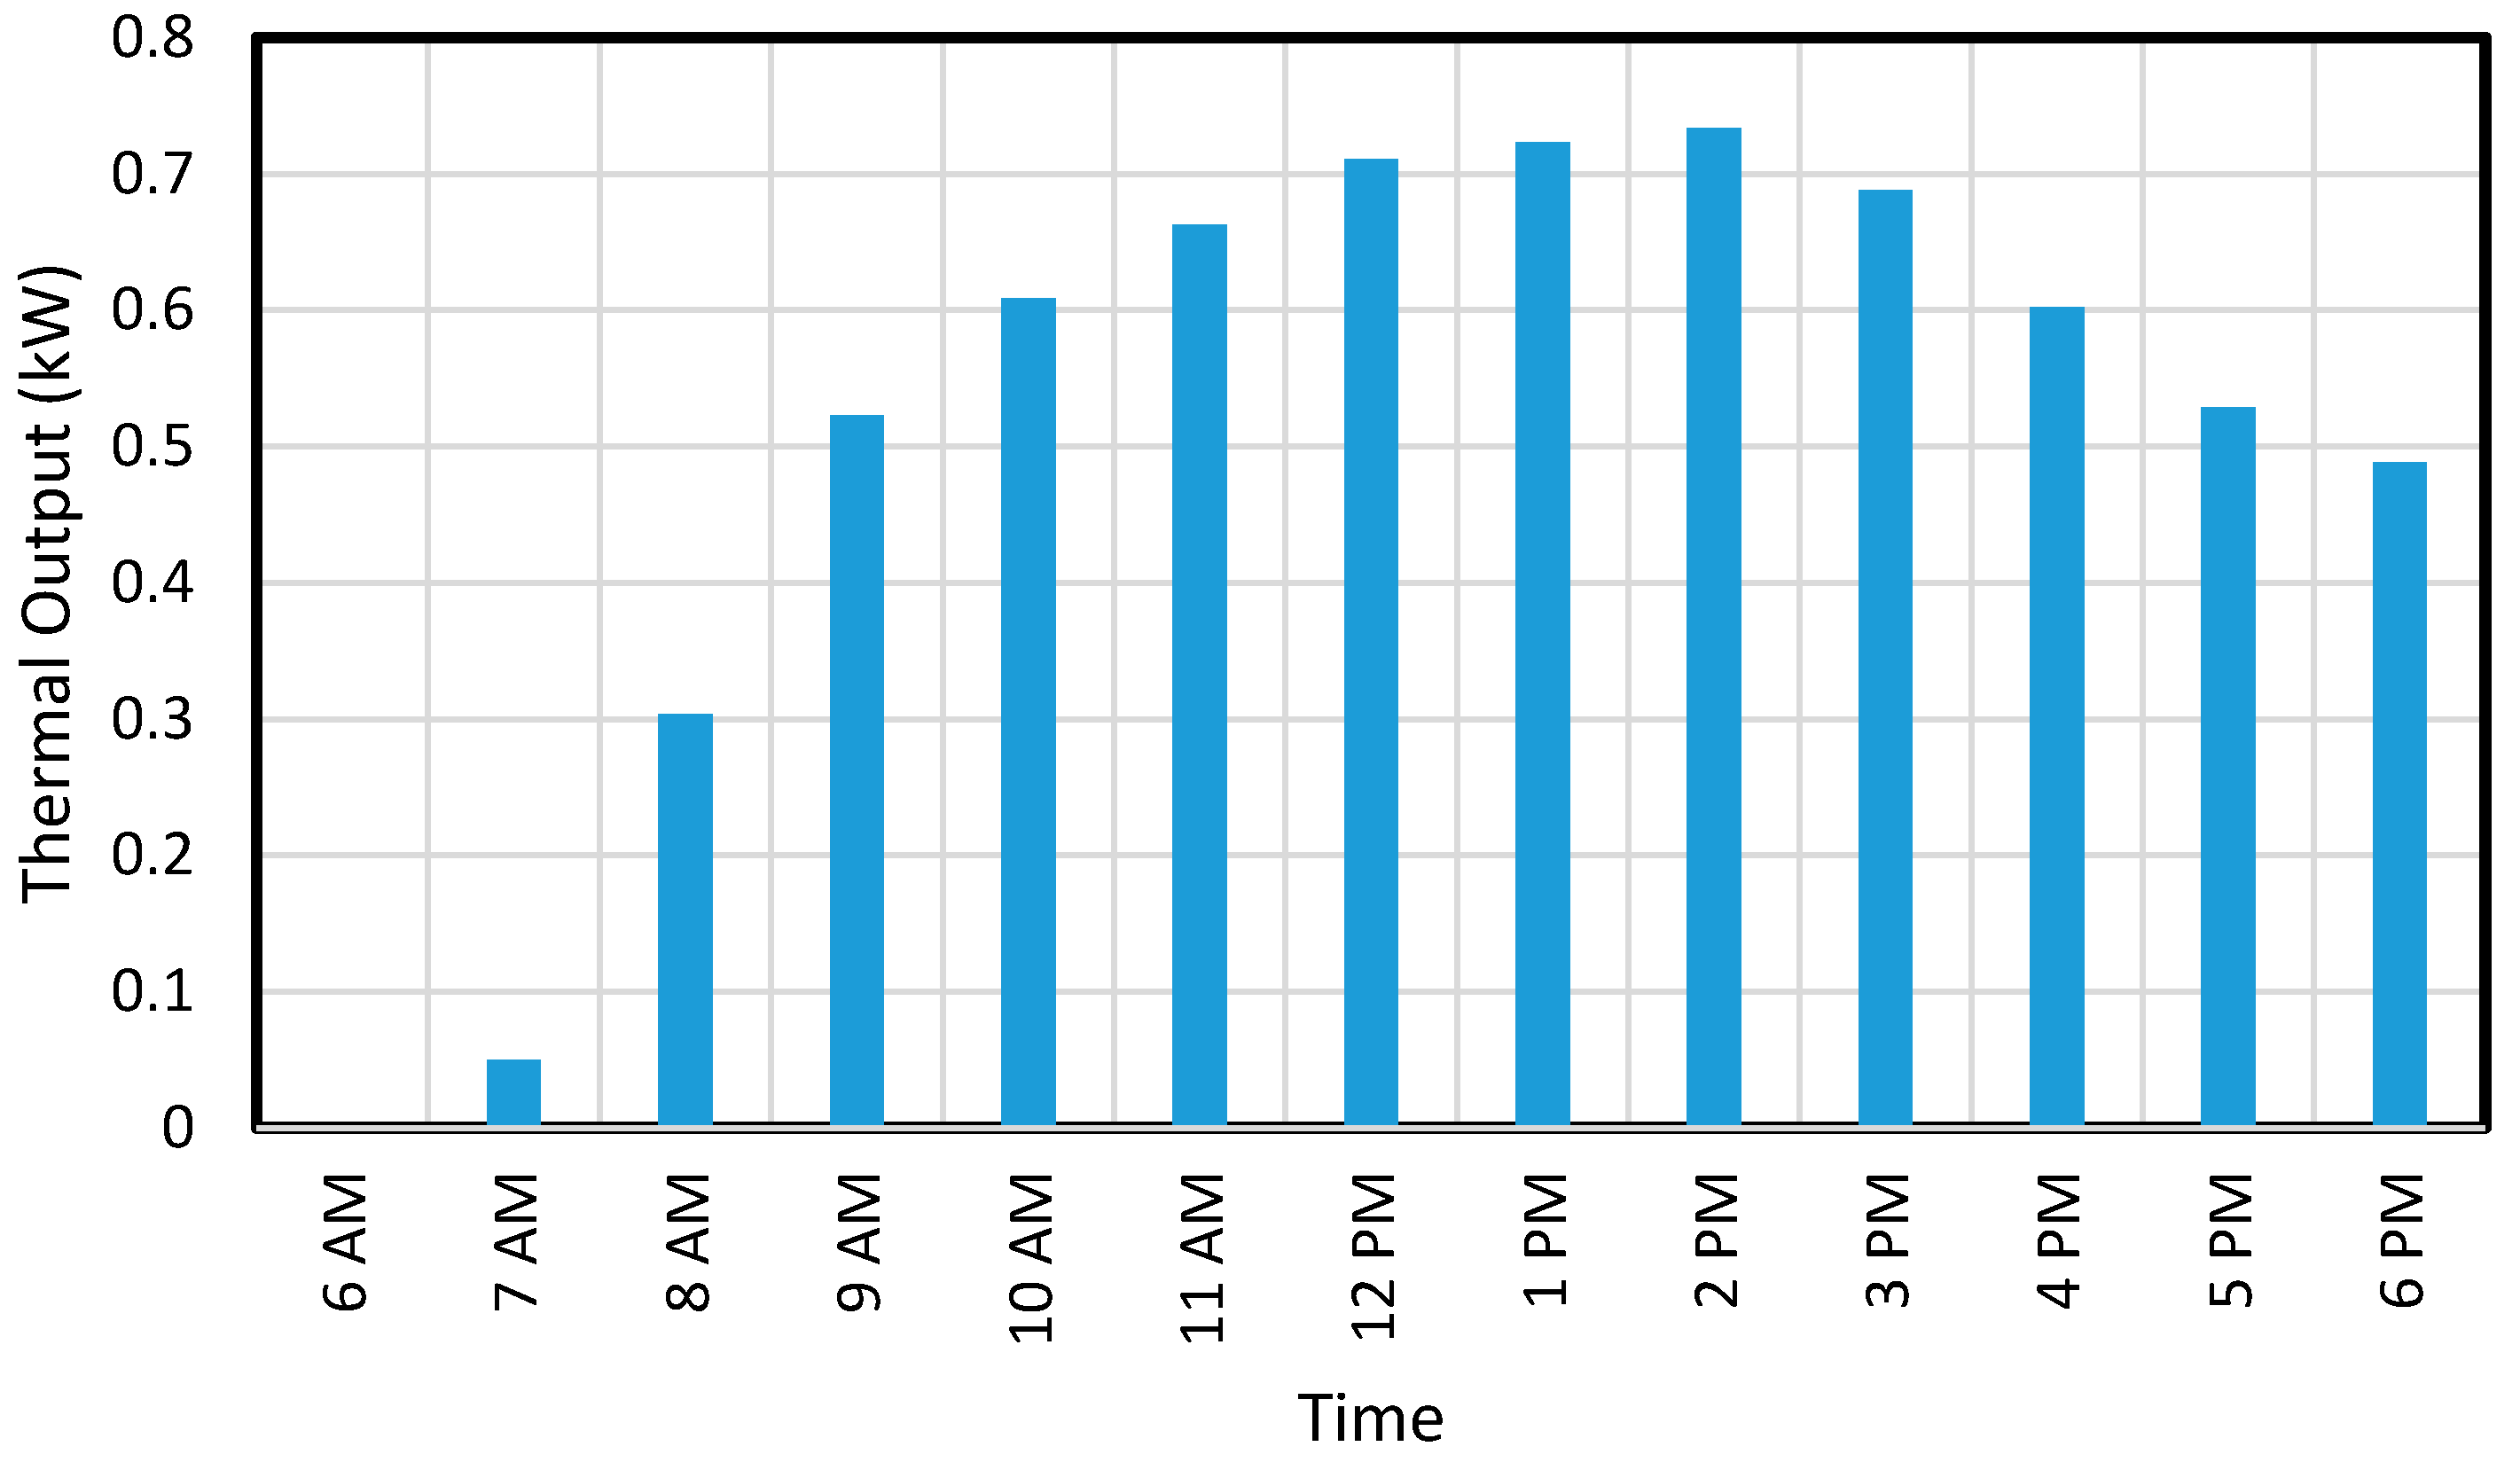
5.7. Use of Extracted Heat

Since the studied systems are integrated to the roof of a household, the back of the panels is exposed to the indoor environment in order to deliver the heat to the room as shown in Figure 1d. The rate of heat flow from the back of the PCM containers through convection and radiation is computed using Equation (9), which is the thermal output of the system, and the results are plotted in Figure 10. It can be seen that as the solar irradiance increases, the thermal output increases. This is due to the fact that the heat generation inside the cells increases with the increase in solar irradiance and the heat directly goes from PV to the back of the PCM containers through the fins, which can be seen from Figure 1c. Similarly, as solar irradiance decreases, the thermal output decreases. However, it is also seen that after 4 pm, the thermal output does not decrease sharply, with a rapid decrease in solar irradiance. This is due to the fact that the heat stored in the PCM majorly contributes towards heating the back of the PCM containers which delivers the heat to the room.
The overall efficiencies of the systems are reported in Figure 11. The results show that the overall efficiency of the PV system is increased from 13% to 19% by using FPCM through enhancement in daily electricity generation and thermal output.
It must also be noted that the heat stored in the PCM will produce thermal output after sunset too, which will be computed/studied in future research.

6. Conclusions

The present study aims at the enhancement of the PV performance and its cooling by using FPCM heat sinks. Three different systems (reference PV system, PCM cooled system and FPCM cooled system) were investigated. The systems were studied under the weather conditions of the Southeast of England; 4 kWp original PV system was compared with the PV-PCM and PV-FPCM systems. The results show that:
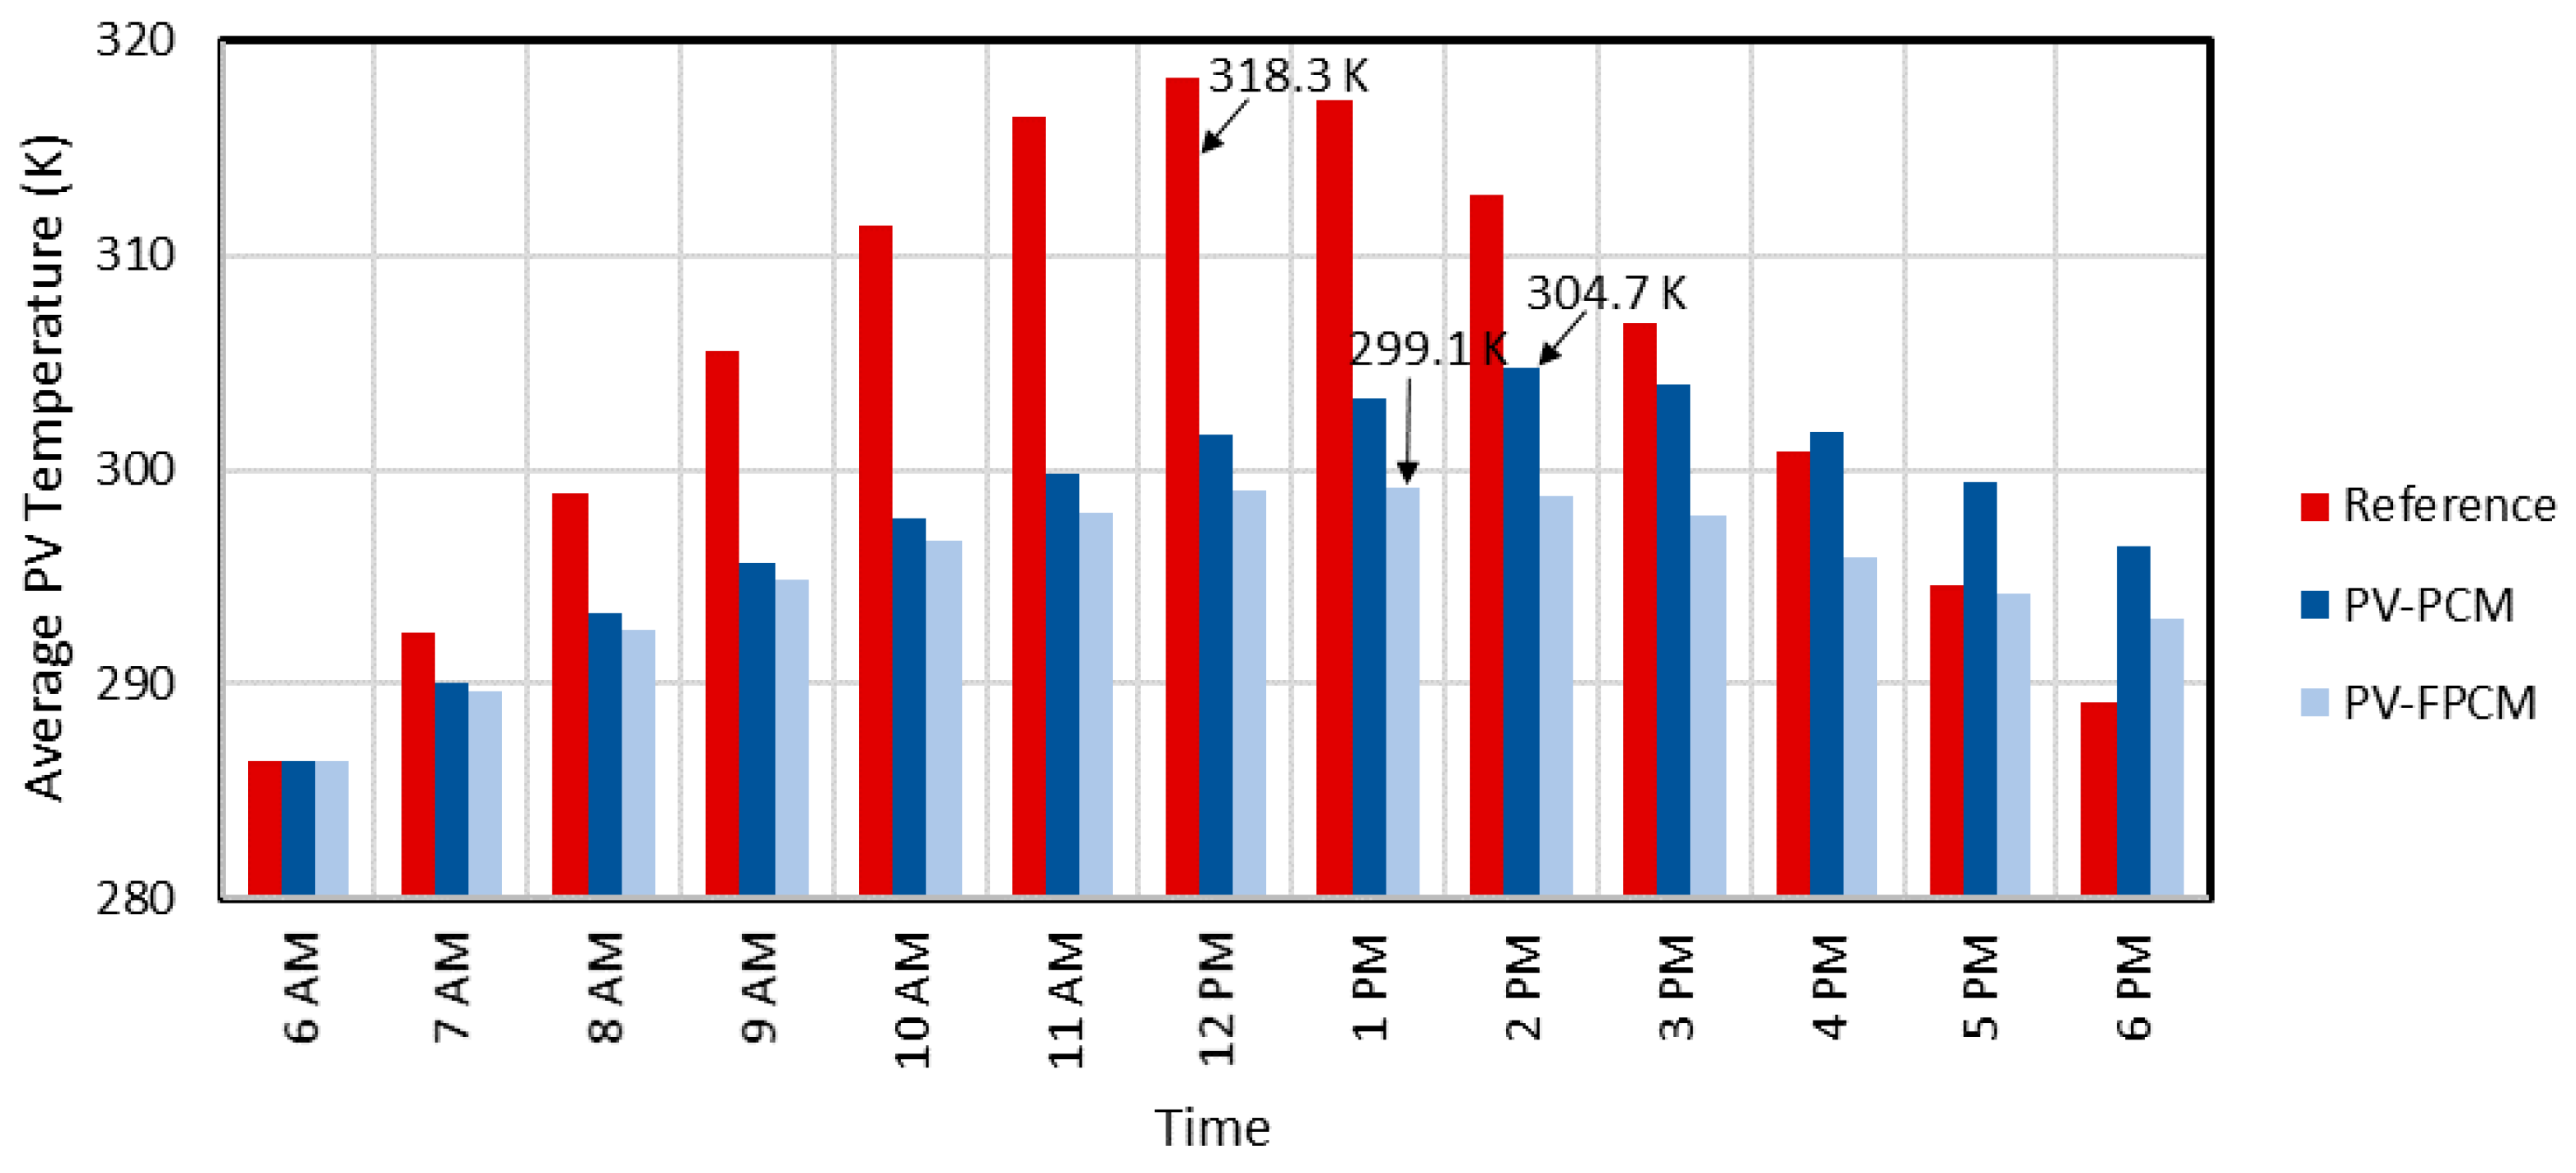
  • The PCM heat sink can reduce the peak PV temperature by 13 K and the FPCM heat sink can reduce the PV temperature to 19 K.
  • The PCM heat sink can increase the peak PV power output by 0.2 kW whereas the FPCM heat sink can enhance the power production by 0.3 kW.
  • Instantaneous PV electrical efficiency during noon increases from 13% to 14% using PCM heat sinks.
  • The daily electricity generation increases by 7% using PCM and 8% by using FPCM.
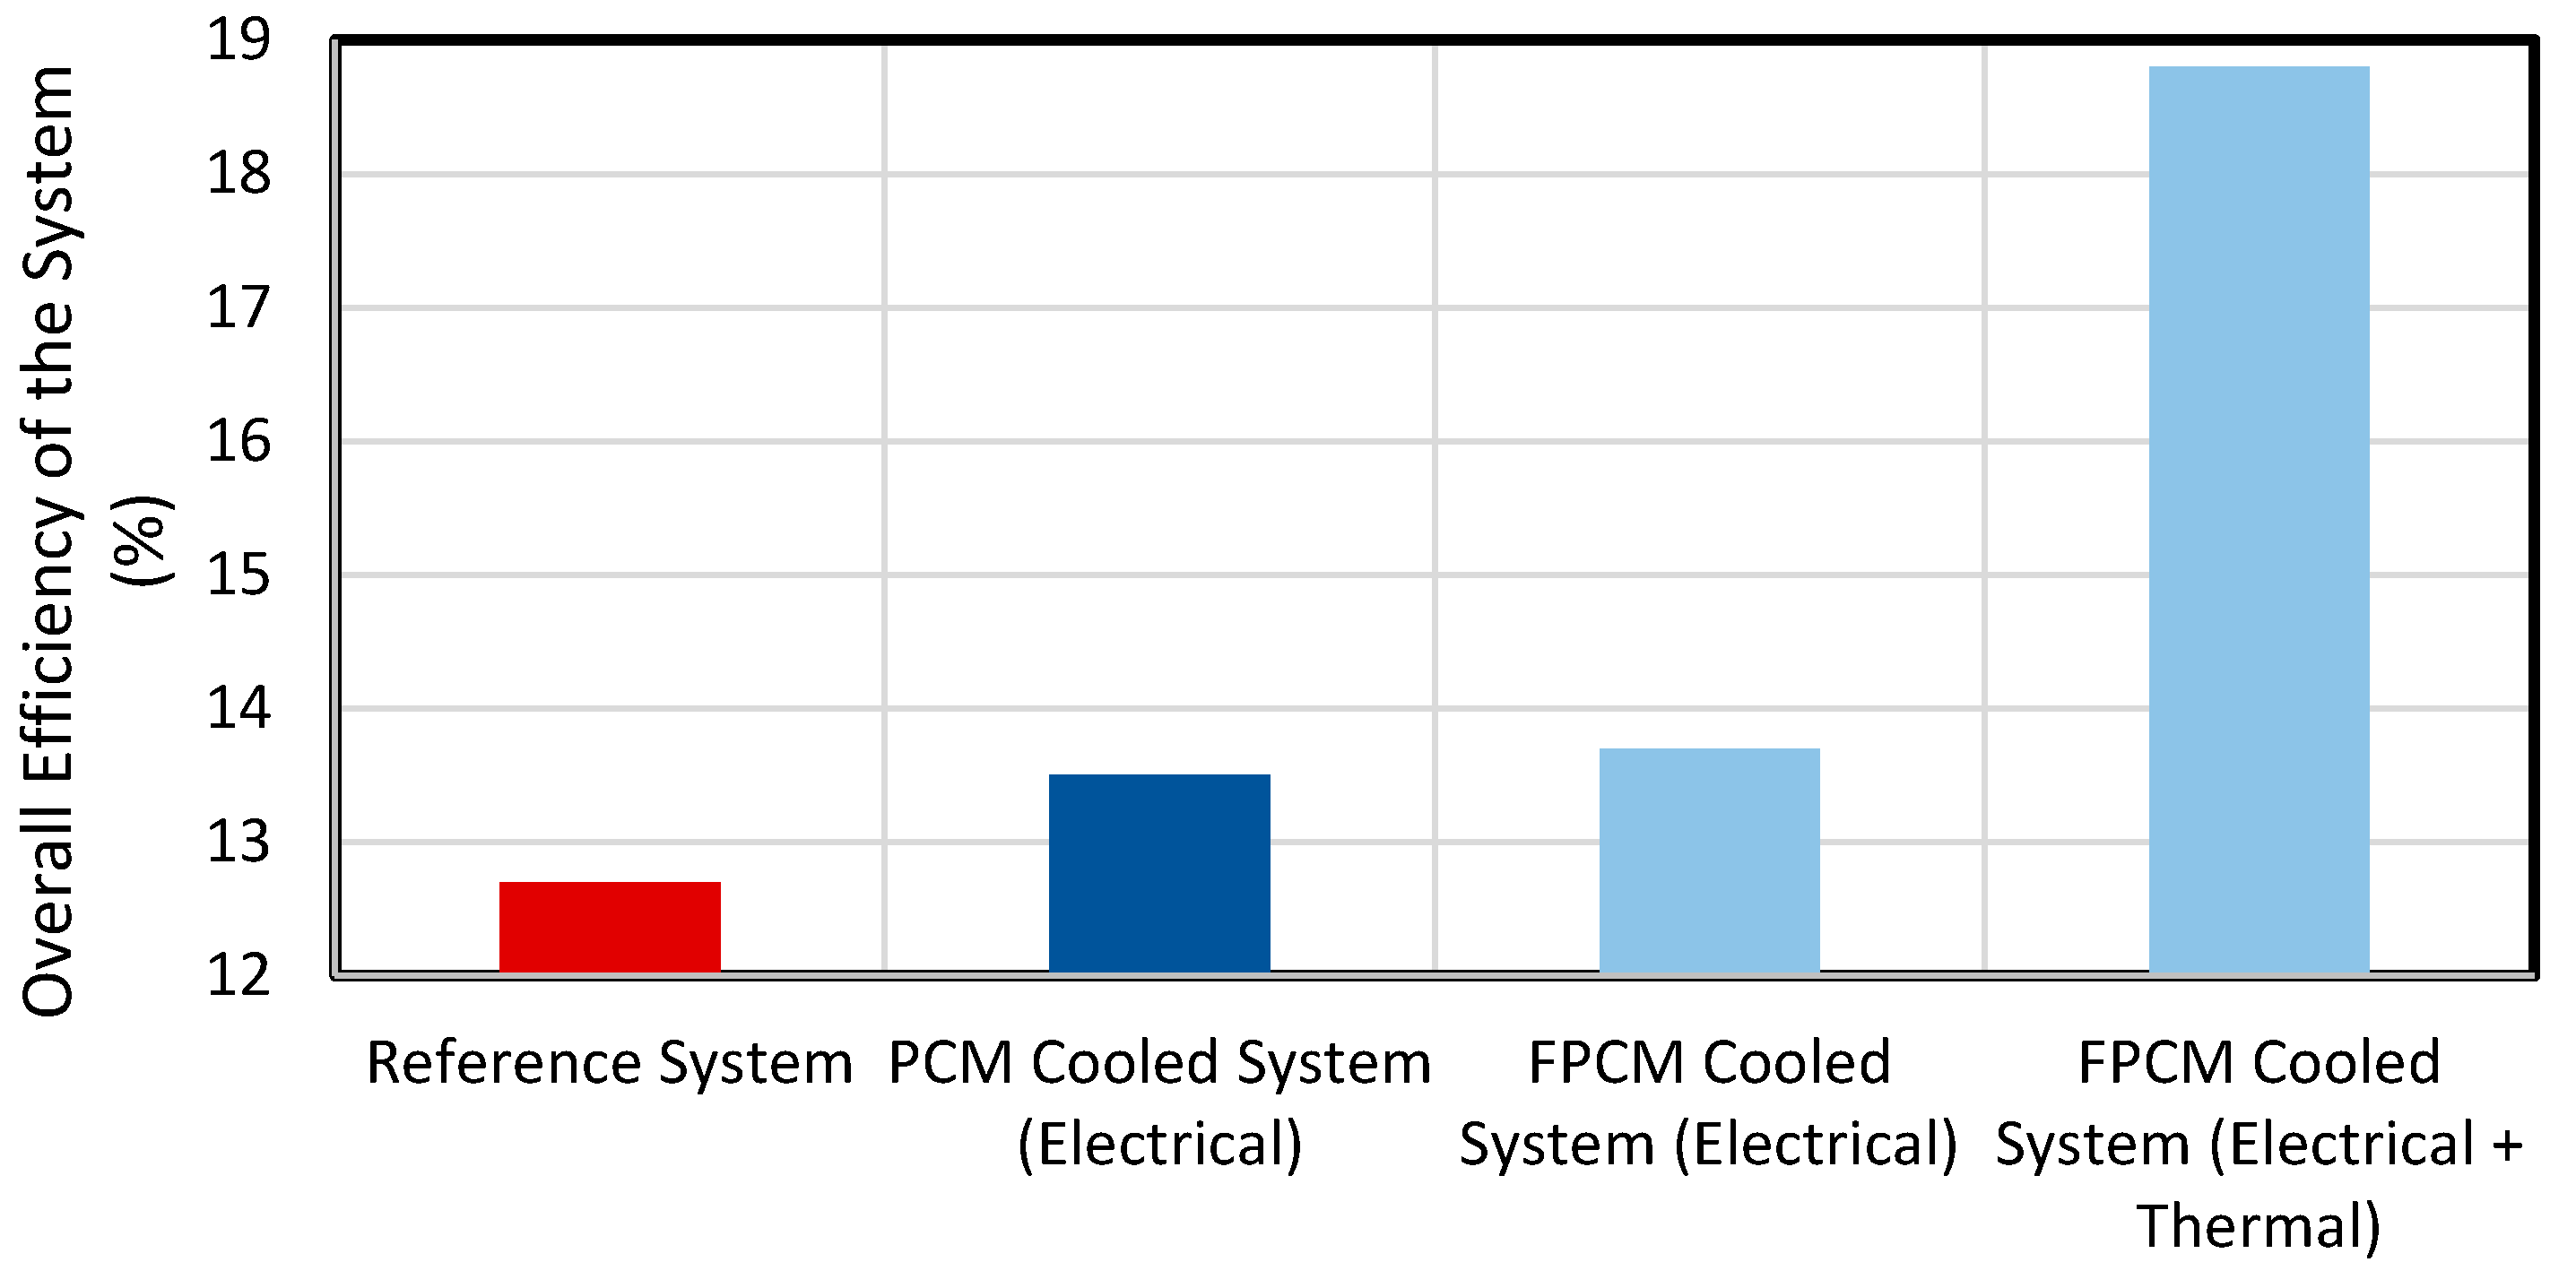
  • Using the FPCM heat sink, 7 kWh of thermal output is achieved, and the overall efficiency of the PV system is increased from 13% to 19%.
The limitation of the studied systems is that the back of the PCM container is a flat surface, which leads to a very low rate of heat transfer from the back of the container to the indoor environment. Thus, the achieved thermal output is very low. A possible future development can be the deployment of fins at the back of the container that can enhance the heat transfer and, consequently, enhance the thermal output.
The other limitation of the studied systems is that the heat stored in PCM is a low grade heat, which limits its utilization.

Author Contributions

Conceptualization, P.S., S.K., S.N. and V.S.; methodology, P.S., S.K., S.N. and V.S.; software, P.S., S.N. and V.S.; validation, P.S., S.K., S.N. and V.S.; formal analysis, P.S., S.K., S.N. and V.S.; investigation, P.S., S.K., S.N. and V.S.; writing—original draft preparation, P.S., S.K., S.N. and V.S.; writing—review and editing, S.K., S.N. and V.S.; supervision, S.K., S.N. and V.S.; project administration, S.K., S.N. and V.S.; funding acquisition, K.S.R., T.K.M., V.B., J.R., D.H. and R.K. All authors have read and agreed to the published version of the manuscript.

Funding

Interreg 2 Seas (contract No 2S04-004) and EPSRC (EP/K03619X/1).

Conflicts of Interest

The authors declare no conflict of interest.

Appendix A

Figure A1. (a) Solar irradiance and (b) ambient temperature.
Energies 13 02558 g0a1aEnergies 13 02558 g0a1b

References

  1. Reddy, K.S.; Mudgal, V.; Mallick, T.K. Thermal performance analysis of multi-phase change material layer-integrated building roofs for energy efficiency in built-environment. Energies 2017, 10, 1367. [Google Scholar] [CrossRef] [Green Version]
  2. Elavarasan, R.M.; Velmurugan, K.; Subramaniam, U.; Kumar, A.R.; Almakhles, D. Experimental investigations conducted for the characteristic study of OM29 phase change material and its incorporation in photovoltaic panel. Energies 2020, 13, 897. [Google Scholar] [CrossRef] [Green Version]
  3. Al Siyabi, I.; Khanna, S.; Sundaram, S.; Mallick, T. Experimental and numerical thermal analysis of multi-layered microchannel heat sink for concentrating photovoltaic application. Energies 2019, 12, 122. [Google Scholar] [CrossRef] [Green Version]
  4. Sajjad, U.; Amer, M.; Ali, M.H.; Dahiya, A.; Abbas, N. Cost effective cooling of photovoltaic modules to improve efficiency. Case Stud. Therm. Eng. 2019, 14, 100420. [Google Scholar] [CrossRef]
  5. Kasaeian, A.; Khanjari, Y.; Golzari, S.; Mahian, O.; Wongwises, S. Effects of forced convection on the performance of a photovoltaic thermal system: An experimental study. Exp. Therm. Fluid Sci. 2017, 85, 13–21. [Google Scholar] [CrossRef]
  6. Barone, G.; Buonomano, A.; Forzano, C.; Palombo, A.; Panagopoulos, O. Photovoltaic thermal collectors: Experimental analysis and simulation model of an innovative low-cost water-based prototype. Energy 2019, 179, 502–516. [Google Scholar] [CrossRef]
  7. Yang, L.H.; Liang, J.D.; Hsu, C.Y.; Yang, T.H.; Chen, S.L. Enhanced efficiency of photovoltaic panels by integrating a spray cooling system with shallow geothermal energy heat exchanger. Renew. Energy 2019, 134, 970–981. [Google Scholar] [CrossRef]
  8. Nizetic, S.; Coko, D.; Yadav, A.; Cabo, F.G. Water spray cooling technique applied on a photovoltaic panel: The performance response. Energy Convers. Manag. 2016, 108, 287–296. [Google Scholar] [CrossRef]
  9. Yuan, W.; Ji, J.; Li, Z.; Zhou, F.; Ren, X.; Zhao, X.; Liu, S. Comparison study of the performance of two kinds of photovoltaic/thermal(PV/T) systems and a PV module at high ambient temperature. Energy 2018, 148, 1153–1161. [Google Scholar] [CrossRef]
  10. Shahsavar, A.; Ameri, M.; Gholampour, M. Energy and exergy analysis of a Photovoltaic-Thermal collector with natural air flow. J. Sol. Energy Eng. 2012, 134, 1–10. [Google Scholar] [CrossRef]
  11. Parkunam, N.; Lakshmanan, P.; Navaneethakrishnan, G.; Arul, S.; Vijayan, V. Experimental analysis on passive cooling of photovoltaic panel with heat sink and wick structure. Energy Sources 2020, 42, 653–663. [Google Scholar]
  12. Wu, S.Y.; Zhang, Y.C.; Xiao, L.; Shen, Z.G. Performance comparison investigation on solar photovoltaic-thermoelectric generation and solar photovoltaic-thermoelectric cooling hybrid systems under different conditions. Int. J. Sustain. Energy 2018, 37, 533–548. [Google Scholar] [CrossRef]
  13. Reddy, K.S.; Mudgal, V.; Mallick, T.K. Review of latent heat thermal energy storage for improved material stability and effective load management. J. Energy Storage 2018, 15, 205–227. [Google Scholar] [CrossRef]
  14. Huang, M.J.; Eames, P.C.; Norton, B. Phase change materials for limiting temperature rise in building integrated photovoltaics. Sol. Energy 2006, 80, 1121–1130. [Google Scholar] [CrossRef]
  15. Huang, M.J.; Eames, P.C.; Norton, B. Thermal regulation of building-integrated photovoltaics using phase change materials. Int. J. Heat Mass Transf. 2004, 47, 2715–2733. [Google Scholar] [CrossRef]
  16. Atkin, P.; Farid, M.M. Improving the efficiency of photovoltaic cells using PCM infused graphite and aluminium fins. Sol. Energy 2015, 114, 217–228. [Google Scholar] [CrossRef]
  17. Khanna, S.; Reddy, K.S.; Mallick, T.K. Effect of climate on electrical performance of finned phase change material integrated solar photovoltaic. Sol. Energy 2018, 174, 593–605. [Google Scholar] [CrossRef]
  18. Hasan, A.; McCormack, S.J.; Huang, M.J.; Sarwar, J.; Norton, B. Increased photovoltaic performance through temperature regulation by phase change materials: Materials comparison in different climates. Sol. Energy 2015, 115, 264–276. [Google Scholar] [CrossRef]
  19. Hasan, A.; McCormack, S.J.; Huang, M.J.; Norton, B. Evaluation of phase change materials for thermal regulation enhancement of building integrated photovoltaics. Sol. Energy 2010, 84, 1601–1612. [Google Scholar] [CrossRef] [Green Version]
  20. Khanna, S.; Newar, S.; Sharma, V.; Reddy, K.S.; Mallick, T.K.; Radulovic, J.; Khusainov, R.; Hutchinson, D.; Becerra, V. Electrical enhancement period of solar photovoltaic using phase change material. J. Clean. Prod. 2019, 221, 878–884. [Google Scholar] [CrossRef] [Green Version]
  21. Singh, P.; Khanna, S.; Becerra, V.; Newar, S.; Sharma, V.; Mallick, T.K.; Hutchinson, D.; Radulovic, J.; Khusainov, R. Power improvement of finned solar photovoltaic phase change material system. Energy 2020, 193, 116735. [Google Scholar] [CrossRef]
  22. Rabie, R.; Emam, M.; Ookawara, S.; Ahmed, M. Thermal management of concentrator photovoltaic systems using new configurations of phase change material heat sinks. Sol. Energy 2019, 183, 632–652. [Google Scholar] [CrossRef]
  23. Siyabi, I.A.; Khanna, S.; Mallick, T.; Sundaram, S. An experimental and numerical study on the effect of inclination angle of phase change materials thermal energy storage system. J. Energy Storage 2019, 23, 57–68. [Google Scholar] [CrossRef]
  24. Indartono, Y.S.; Suwono, A.; Pratama, F.Y. Improving photovoltaics performance by using yellow petroleum jelly as phase change material. Int. J. Low Carbon Technol. 2014. [Google Scholar] [CrossRef] [Green Version]
  25. Biwole, P.H.; Eclache, P.; Kuznik, F. Phase-change materials to improve solar panel’s performance. Energy Build. 2013, 62, 59–67. [Google Scholar] [CrossRef]
  26. Souayfane, F.; Biwole, P.H.; Fardoun, F. Melting of a phase change material in presence of natural convection and radiation: A simplified model. Appl. Therm. Eng. 2018, 130, 660–671. [Google Scholar] [CrossRef]
  27. Aelenei, L.; Pereira, R.; Gonçalves, H.; Athienitis, A. Thermal performance of a hybrid BIPV-PCM: Modeling, design and experimental investigation. Energy Procedia 2014, 48, 474–483. [Google Scholar] [CrossRef] [Green Version]
  28. Sardarabadi, M.; Passandideh-Fard, M.; Maghrebi, M.; Ghazikhani, M. Experimental study of using both ZnO/water nanofluid and phase change material (PCM) in photovoltaic thermal systems. Sol. Energy Mater. Sol. Cells 2017, 161, 62–69. [Google Scholar] [CrossRef]
  29. Browne, M.C.; Lawlor, K.; Kelly, A.; Norton, B.; McCormack, S.J. Indoor characterisation of a photovoltaic/thermal phase change material system. Energy Procedia 2015, 70, 163–171. [Google Scholar] [CrossRef] [Green Version]
  30. Preet, S.; Bhushan, B.; Mahajan, T. Experimental investigation of water based photovoltaic/thermal (PV/T) system with and without phase change material (PCM). Sol. Energy 2017, 155, 1104–1120. [Google Scholar] [CrossRef]
  31. Khanna, S.; Newar, S.; Sharma, V.; Reddy, K.S.; Mallick, T.K. Optimization of fins fitted phase change material equipped solar photovoltaic under various working circumstances. Energy Convers. Manag. 2019, 180, 1185–1195. [Google Scholar] [CrossRef]
  32. Huang, M.J.; Eames, P.C.; Norton, B. Comparison of predictions made using a new 3D phase change material thermal control model with experimental measurements and predictions made using a validated 2D model. Heat Transf. Eng. 2007, 28, 31–37. [Google Scholar] [CrossRef]
  33. US Deparment of Energy. Available online: https://www.google.com/url?q=https://www.nrel.gov/docs/fy13osti/55553.pdf&sa=U&ved=2ahUKEwj34vmV5rbpAhVVilwKHQ0yARUQFjABegQIARAB&usg=AOvVaw0EfJU3M1m-KZdPoNbaJDKA (accessed on 17 May 2020).
Figure 1. Studied systems: (a) photovoltaics (PV) panel of the first system; (b) PV-phase change material (PCM) panel of the second system; (c) PV-finned PCM (FPCM) panel of the third system; (d) schematic showing the integration of the PV-FPCM system to the roof.
Energies 13 02558 g001
Figure 2. Average temperature of PV panel of reference system, PCM cooled system and FPCM cooled system.
Energies 13 02558 g002
Figure 3. Peak temperature attained by PV panel of reference system, PCM cooled system and FPCM cooled system.
Energies 13 02558 g003
Figure 4. Temperature contours of the FPCM cooled system.
Energies 13 02558 g004
Figure 5. Power production by reference system, PCM cooled system and FPCM cooled system.
Energies 13 02558 g005
Figure 6. Peak power production by reference system, PCM cooled and FPCM cooled systems.
Energies 13 02558 g006
Figure 7. Electrical efficiency of reference system, PCM cooled system and FPCM cooled system.
Energies 13 02558 g007
Figure 8. Electrical efficiency of reference system, PCM cooled and FPCM cooled system around noon.
Energies 13 02558 g008
Figure 9. Daily electrical energy generation by reference system, PCM cooled and FPCM cooled systems.
Energies 13 02558 g009
Figure 10. Thermal output of the PV-FPCM system.
Energies 13 02558 g010
Figure 11. Overall efficiencies of the systems.
Energies 13 02558 g011
Table 1. Specifications of PCM, PV panel and PCM container.
PCM ParametersValues
Melting Point~293 K
Latent heat capacity190,000 J/kg
Specific heat capacity~2000 J/kg-K
Density770–880 kg/m3
Thermal Conductivity~0.2 W/m-K
Thermal expansion coefficient0.001 /K
PV ParametersValues
Power rating200 W
Open Circuit Voltage32.9 V
Short Circuit Current8.21 A
Maximum Power Voltage26.3 V
Maximum Power Current7.61 A
Container DimensionsValues
Length1 m
Depth6 cm
Thickness2 mm
Tilt45°
Spacing of fins20 cm
Table 2. Specifications of system for comparison.
PCM ParametersValues
Melting Point299–301 K
Latent heat capacity232,000 J/kg
Specific heat capacity1800–2400 J/kg-K
Density749–785 kg/m3
Thermal Conductivity0.19 W/m-K
Thermal expansion coefficient0.001 /K
Container Length40 mm
Container Depth20 mm
Container Thickness5 mm
Container Tilt90°
Solar Irradiance750 W/m2
Ambient Temperature20 °C
Table 3. Comparison of modeled temperature of the front surface with that of the observed data.
Time (min)Observed (°C)Modeled (°C) Error (°C)
020.020.00.0
1030.830.90.1
2032.433.10.7
3031.932.40.5
4032.632.1−0.5
5033.632.0−1.6
6034.332.4−1.9
7036.034.0−2.0
8038.536.8−1.7

