Article

Optimal Energy Management of Plug-In Hybrid Electric Vehicles Concerning the Entire Lifespan of Lithium-Ion Batteries

School of Mechanical Engineering and Automation, Northeastern University, Shenyang 110819, China
*
Author to whom correspondence should be addressed.
Energies 2020, 13(10), 2543; https://doi.org/10.3390/en13102543
Submission received: 31 March 2020 / Revised: 9 May 2020 / Accepted: 10 May 2020 / Published: 17 May 2020
(This article belongs to the Special Issue Electric Systems for Transportation)

Abstract

:
The performance of lithium-ion batteries will inevitably degrade during the high frequently charging/discharging load applied in electric vehicles. For hybrid electric vehicles, battery aging not only declines the performance and reliability of the battery itself, but it also affects the whole energy efficiency of the vehicle since the engine has to participate more. Therefore, the energy management strategy is required to be adjusted during the entire lifespan of lithium-ion batteries to maintain the optimality of energy economy. In this study, tests of the battery performances under thirteen different aging stages are involved and a parameters-varying battery model that represents the battery degradation is established. The influences of battery aging on energy consumption of a given plug-in hybrid electric vehicle (PHEV) are analyzed quantitatively. The results indicate that the variations of capacity and internal resistance are the main factors while the polarization and open circuit voltage (OCV) have a minor effect on the energy consumption. Based on the above efforts, the optimal energy management strategy is proposed for optimizing the energy efficiency concerning both the fresh and aging batteries in PHEV. The presented strategy is evaluated by a simulation study with different driving cycles, illustrating that it can balance out some of the harmful effects that battery aging can have on energy efficiency. The energy consumption is reduced by up to 2.24% compared with that under the optimal strategy without considering the battery aging.

Graphical Abstract

1. Introduction

With the deepening of environmental deterioration and energy crisis issues, developing high efficient and clean automobiles has been recognized as a matter of global significance [1]. In the recent years, electric vehicles (EVs) are widely recognized as the development tendency of automobile industries all over the world [2,3]. The benefits of EVs highly depend upon the onboard high-capacity battery pack that can be recharged by the power grid. The frequently discharge/charge cycles during the vehicular utilizations will inevitably cause the degradation of the power battery [4]. Battery aging, which implies a complex electrochemical evolution process of the gradually loss of lithium inventory and active material, has been fully discussed in many literatures [5,6]. In order to monitor the battery health condition and improve the battery performance, many efforts have been exerted on estimation of the battery state of health (SOH) or remaining useful life (RUL) [7,8,9]. However, battery aging not only influences the performance of the battery itself, but it also has an impact on the vehicle performance, like reducing maximum power, driving range, energy economy, etc., of the vehicle. Especially in hybrid electric vehicles (HEVs), battery aging will seriously affect the overall energy efficiency since the engine has to contribute more power than expected, resulting in the increased energy consumption and emissions. Therefore, the energy management strategy should be adjusted to maintain the optimality during the entire lifespan of lithium-ion batteries.
Energy management strategy (EMS) is integral part of improving the fuel economy of both the traditional HEVs and plug-in hybrid electric vehicles (PHEVs), which have drawn attentions from many researchers [10,11,12,13]. Nevertheless, the current studies mainly focus on the optimization methods towards how to maximize the hybrid system’s advantages, without enough concerns of the impacts of battery aging. Normally, the existing methods of EMS can be divided into two categories: the rule-based method and the optimization-based method. The rule-based strategies mainly depend upon some predefined control rules, containing deterministic rules and fuzzy logic rules, to operate the power units at high efficiency [14]. For example, Gao et al. [15] proposed a deterministic rule-based energy management strategy for PHEV focused on all electric range and charge depletion range operations, which has been verified by an example passenger car in a typical urban driving cycle; Schouten et al. [16] presented a fuzzy logic-based energy management strategy to improve the fuel economy of the parallel hybrid electric vehicle; Ali et al. [17] proposed a fuzzy logic control for electric vehicles, the presented method can achieve an efficient and fast-charging of the lithium-ion batteries. The rule-based strategies have been widely used in real-time control because they are simple, easy to be online implemented, and have good robustness.
The optimization-based strategies are designed to achieve the optimal control performance by using advanced optimization algorithms, such as dynamic programming (DP) [18,19], genetic algorithm (GA), particle swarm optimization (PSO) [20], etc. These algorithms adopt a common cost function, namely, to minimize the fuel consumption (or maximum the fuel conversion efficiency) of the vehicle during a certain time horizon. For example, Larsson et al. [21] investigated the DP-based energy management strategy to minimize the fuel consumption of a hybrid electric vehicle and discussed how much computational demand can be reduced. The drawback of these global optimization algorithm-based strategies is that they can barely be implemented in real-time control due to their dependence on an a priori known speed profile. Therefore, they are often implemented offline as a reference or a benchmark for other algorithms [22]. In addition, there is another kind of optimization approach, namely, the instantaneous minimization algorithm, which is to minimize the cost function at each time step. Most representative one of this kind is equivalent consumption minimization strategy (ECMS). Although ECMS can only provide a near-optimal solution, it can be implemented online because it does not rely on an a priori known speed profile. The specific descriptions about ECMS can be found in References [23,24,25,26].
The above investigations have achieved a great progress of resolving the energy management issues; however, most of these studies are based on the characteristics of the fresh battery. Although the battery aging induces a significant impact on energy consumption, it is still unknown how much the extra energy consumption can be caused by the battery aging in PHEVs and there are few studies to deal with battery aging from the perspective of energy management. In this study, we expect to reveal the maximum influence that battery aging can produce on the vehicle energy consumption and to present a global optimal control strategy over the entire lifespan of onboard batteries. The main target of the presented strategy is to maintain the optimal energy efficiency even after the serious aging of the battery and partially compensate for the negative impact of battery aging from the system level. The remainder of this paper is organized as follows: the model, energy management scheme and optimization method for PHEVs concerning the impacts of battery aging are described in Section 2; the battery model and the mathematical expression of the aging characteristics are proposed in Section 3; the impacts of the battery aging on energy consumption and the results of the EMS are illustrated in Section 4 while the conclusions are summarized in Section 5.

2. Energy Management Strategy

2.1. Problem Formulation

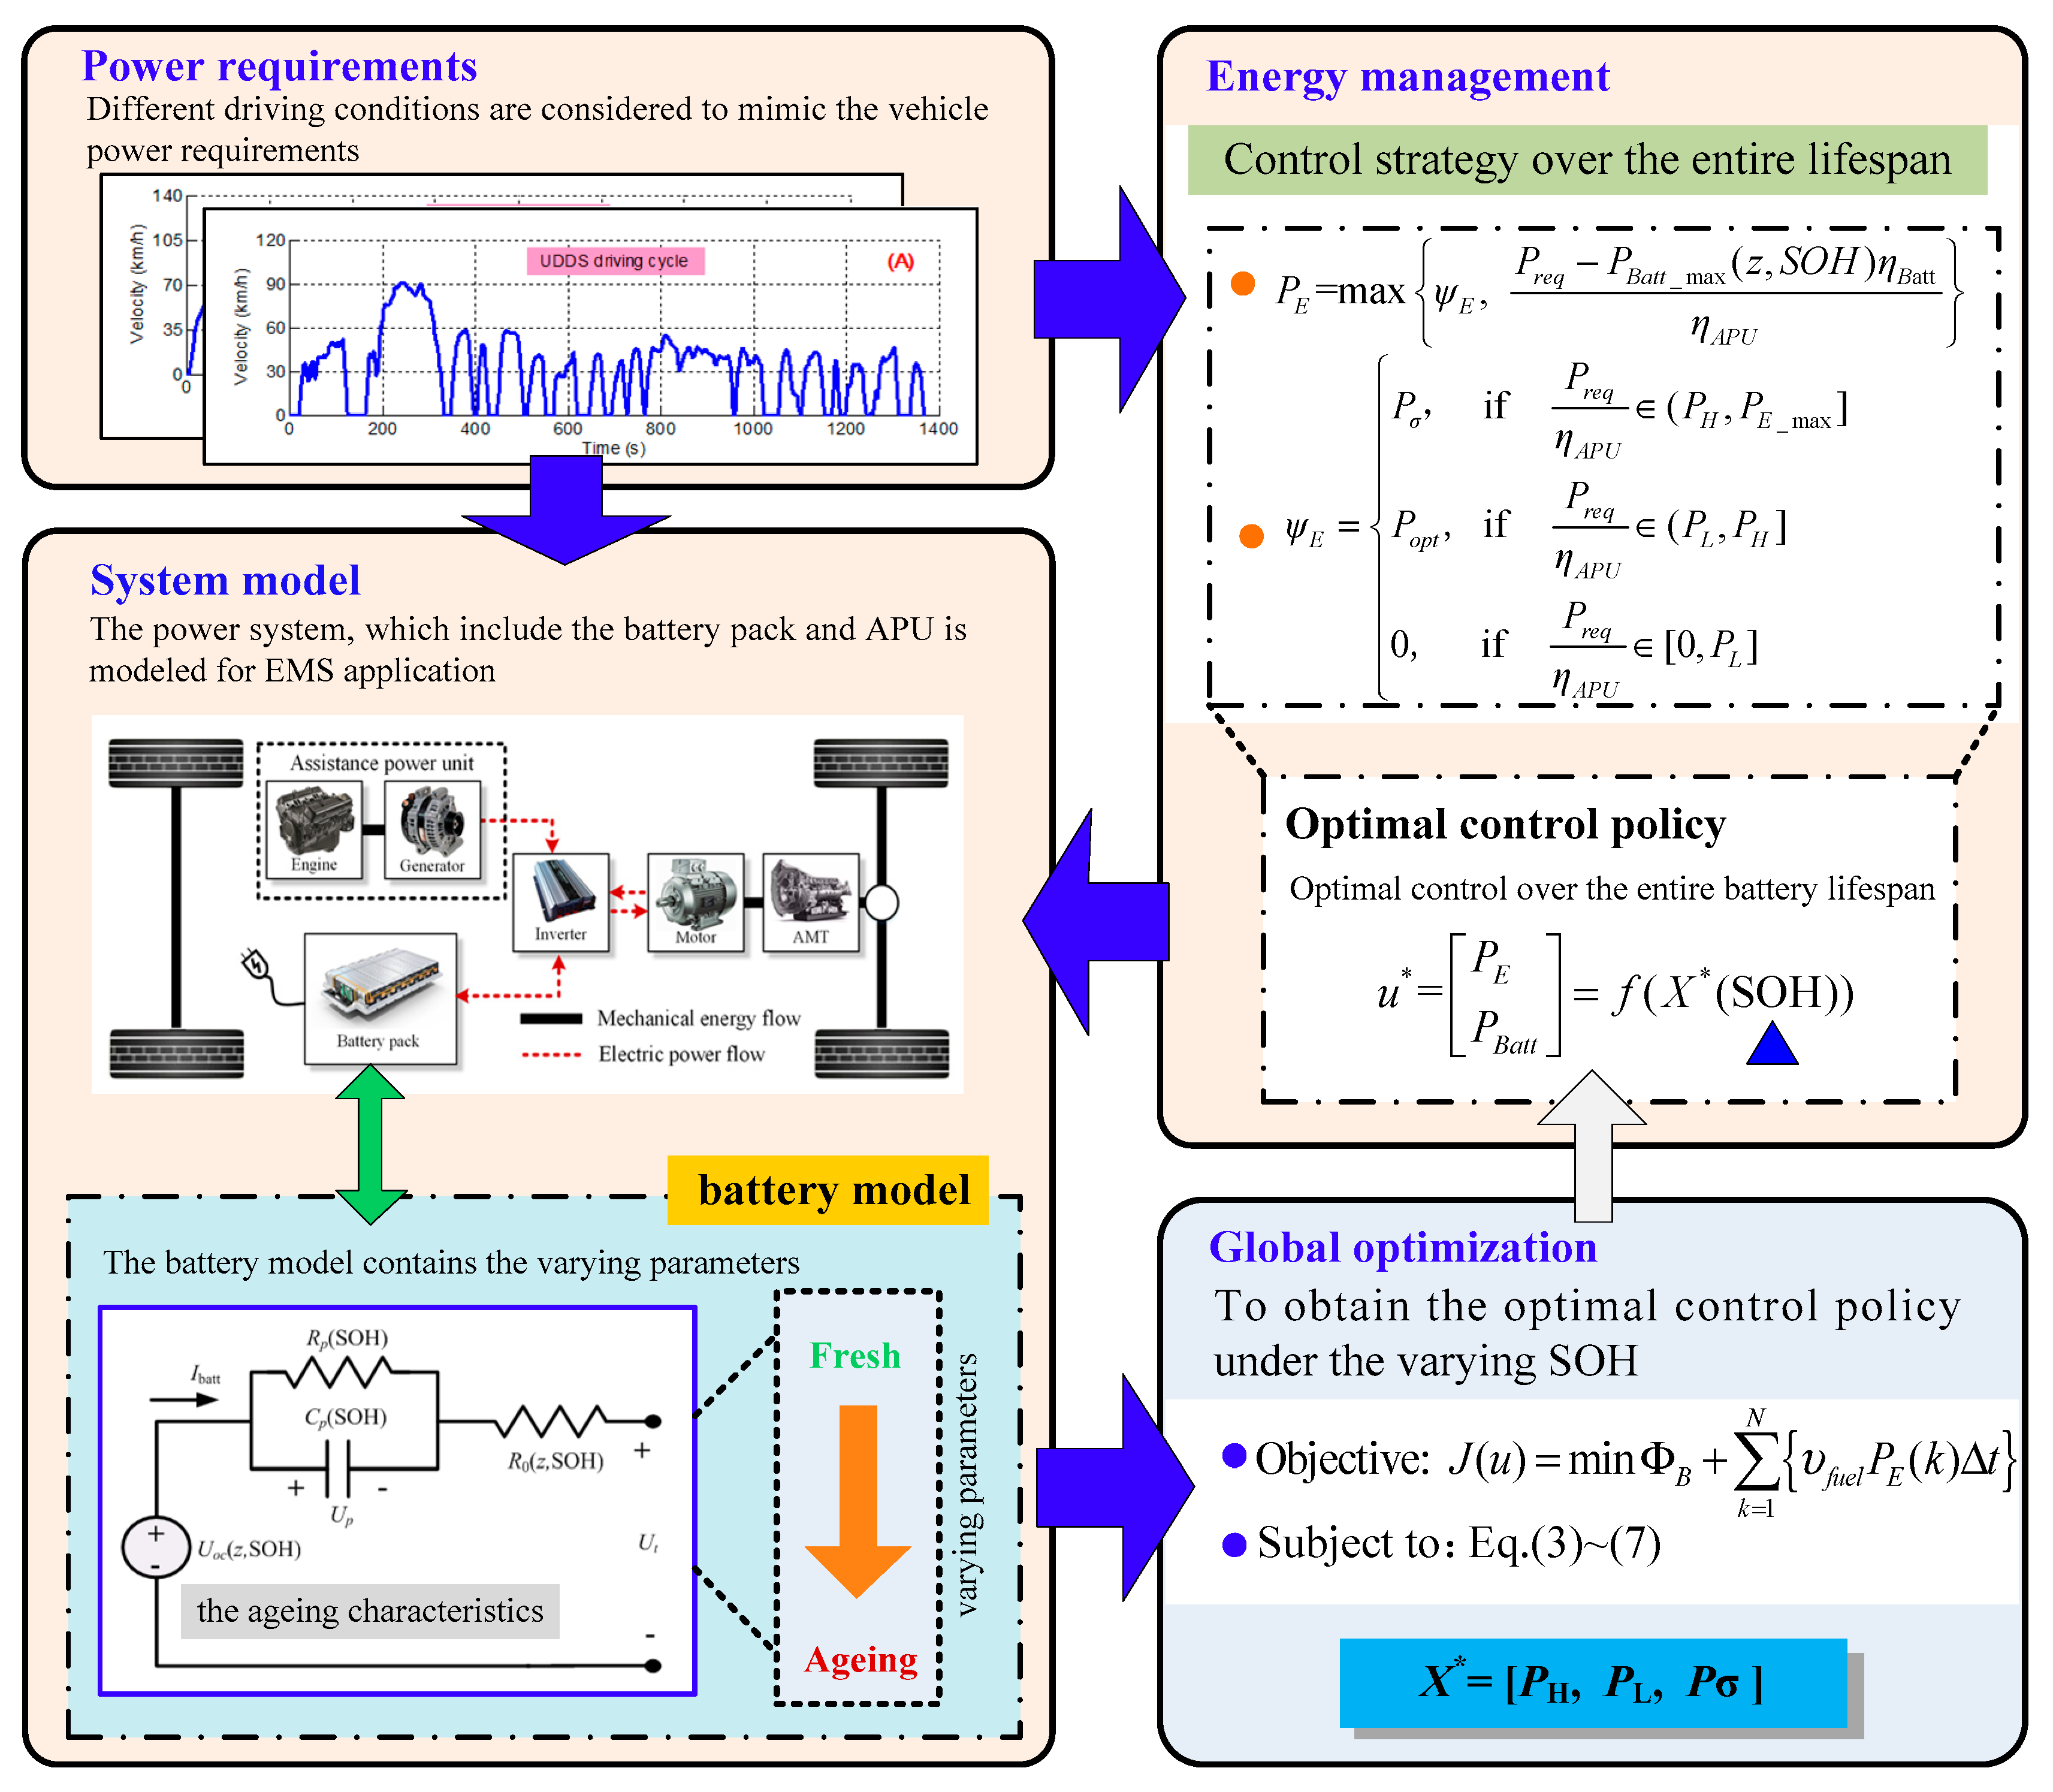
Figure 1 shows the power system of PHEV with a serious topology, in which the battery pack is the main onboard energy storage system (ESS) to provide the power load of the electric motor and an engine generator group is used as the assistance power unit (APU). The electric motor drives the front axle of the vehicle through an automatic mechanical transmission (AMT). The electrical power demand of the motor is split between the ESS and APU, as commanded by the energy management system. The parameters of these main components and the modeling have been described in our previous research presented in Reference [27,28], that is the foundation of this paper.
The energy management issue is described as finding the optimal power allocation for minimizing the cost function while meeting the constraints. The objective function is minimizing the energy consumption during a certain driving cycle, described by
Minimize :   J ( u ) = Φ B + k = 1 N { υ f u e l P E ( k ) Δ t }
where u denotes the control policy, ΦB is the cost of electricity, N is the total number of steps, PE is the engine power, υfuel is the price of fuel (CNY-¥/kWs), t0 and tf denote the time at the beginning and ending the driving cycle, respectively, t denotes the discrete time instant, t = t0 + kΔt, k = 1,2,...,N.
For a certain driving condition, the electricity consumption is directly calculated according to the total battery power consumption, described by
Φ B = υ e l e c Δ E B a t t = υ e l e c k = 1 N { P B a t t ( k ) Δ t } η b ;
in which
η b = { η d i s c h a   at   discharging 1 η c h a           at   charging
where ΔEBatt is the battery electricity consumption, υelec is the price of electricity (CNY-¥/kWs), PBatt is power of the battery, ηb is the efficiency of the battery, ηcha and ηdischa denote the efficiencies at charging and discharging, respectively.
If the battery aging is not considered, the cost function is only impacted by the power allocation. Thus, the control variable can be defined as u = [PE(k) PBatt(k)]T. The optimization problem is to find out the optimal u* to minimize the above cost function. To ensure the optimization results conform to feasible solutions, the control variable is subject to some constraints below.
P B a t t , min ( z ( k ) ) P B a t t ( k ) P B a t t , max ( z ( k ) )
0 P E ( k ) P E , max
φ 1 z ( k ) φ 2
where PBatt,max and PBatt,min are power limitations of the battery pack, PE,max is the maximum power of the engine, φ1 and φ2 are limitations of battery state of charge (SOC).
Based on the power balance relation, equality constraints are given as:
P Req ( k ) = P E ( k ) η A P U + P B a t t ( k ) η B a t t
in which
η B a t t = { η d i s η I n v ,     i f   P B a t t ( k ) 0 1 η c h g η I n v ,       i f   P B a t t ( k ) < 0
where PReq is the power demand of the electric motor, ηAPU and ηBatt are efficiencies of APU and battery system, respectively, ηdis is the discharging efficiency of battery, PBatt is positive while the battery is discharging and negative while the battery is charging.
In addition, the battery SOC at the initial time of the optimization horizon should be pre-set by
z ( t 0 ) = z 0
where z0 is initial SOC of the battery pack.

2.2. Control Strategy

The above model describes the basic mathematical problems of energy management issue, but in practice, we still need to consider the influence of aging on the model. Therefore, in the design of control strategy, battery aging characteristics are taken into account. For convenience of description, here we simply use the SOH (defined as the ratio of the current maximum capacity and the nominal capacity) to describe the different state of battery aging. The more specific parameters variations and the mathematical expression of the battery aging model will be further discussed in Section 3. Figure 2 shows the flow chart of the presented EMS. The blended control strategy [29] is used for power allocation, where the total power demand is split between the lithium battery pack and APU according to the control rules described below. To clearly illustrate the control algorithm, two thresholds are given at first, namely δ1 and δ2, where the δ1 denotes the high SOC level threshold and δ2 denotes the low SOC threshold. If the battery SOC ≥ δ1, the battery will provide as much power to supply the load requirement; in this case, the optimization is not required. When battery SOC drops below the δ1, the control algorithm is given as below.
(1) When battery SOC is higher than the low threshold (SOC ≥ δ2),
P E = max { ψ E ,   P r e q P B a t t _ max ( z , S O H ) η B a t t η A P U }
in which
ψ E = { P σ ,       if   P r e q η A P U ( P H , P E _ max ] P o p t ,   if   P r e q η A P U ( P L , P H ]   0 ,   if   P r e q η A P U [ 0 , P L ]
where Popt denotes the power of engine at its highest efficiency point, PL and PH are two thresholds to define a high efficiency range of the engine. Pσ denotes the power demand of the engine that needs to be optimized.
The maximum output power of the battery pack is treated as a function of battery SOC and SOH, and is calculated by a discrete solving process [30]:
P B a t t _ max , k ( z , S O H ) = n B a t t U t min { O C V ( z k 1 , S O H k 1 ) U p , k U t min Δ t η b a t t Q B a t t ( S O H k 1 ) O C V ( z ) z | z = z k 1 + R 0 ( z k 1 , S O H k 1 ) }
where nBatt is the number of the cells that contained in the lithium battery pack, Utmin is lower cut-off voltage, z denotes the battery SOC.
(2) When SOC is quite low (SOC < δ2), the battery pack stop discharging and the engine provides the power demand:
P E = max { 0 ,   P r e q η A P U }

2.3. Optimization Algorithm

The power demands from the typical driving cycles are used as the input of the program, which are the foundations of the model simulation and the energy management implementation. The optimization is conducted by the PSO algorithm. There are three control coefficients (two thresholds and one power demand) that required to be determined, expressed by
X = [ P H   P L   P σ ]
where X denotes the particle position in PSO algorithm.
The PSO algorithm is offline implemented with varying battery aging condition to do the optimization. The numerical processing of the PSO algorithm is described in Reference [27]. The scale of the particle swarm M = 60, the maximum iteration steps Np = 1000. For each particle i, the velocity and position are updated according to the following expression:
{ V i ( k + 1 ) = w V i ( k ) + c 1 r 1 ( P i ( k ) X i ( k ) ) + c 2 r 2 ( G i ( k ) X i ( k ) ) X i ( k + 1 ) = X i ( k ) + V i ( k )
where w is inertia factor, r1 and r2 denote two random values, r1, r2 ∈ (0, 1), c1 and c2 are weight coefficients, Pi denotes the best position of the particle i amongst the historical iterations, Gi denotes the best position within a certain neighborhood at the current iteration step.
Once the optimal X is obtained, the control policy u = [PE, PBatt]T can be further deduced based on previous blended strategy, denoted as u = f(X). It should be noticed that all these coefficients in X are treated as functions of SOH since the parameters-varying battery aging model has been adopted to replace the conventional battery model.
Thus, the optimal control policy is obtained by
u * = [ P E P B a t t ] = f ( X * ( SOH ) )
It should be noted that the presented algorithm is using PSO to offline optimize the control policy under different aging condition and can be used in online implementation by a look-up table method. However, to implement the presented algorithm in real-time control, we need the battery management system (BMS) hardware to provide the online estimation of the current SOH and SOC information. Accurate estimations [31,32,33,34] are the premise guarantee for this method improving the energy economy improvement.

3. Impacts of Battery Aging

The battery performance parameters will be notably changed after the battery is seriously aged, resulting in the influences of the total hybrid power sources and the optimal control policy. In order to establish a global optimal strategy, it is necessary to dynamically adjust the control parameters as the battery ages. Physical methods like X-ray diffraction and scanning electron microscopy are very useful to analyze the aging mechanism of the battery [35], but they are not suitable for onboard energy management application. In this section, the mathematical expression of the battery aging characteristics is presented and the parameters-varying aging model of lithium battery is used to incorporate the battery aging into the EMS design.

3.1. Modeling

Here an equivalent circuit model, namely the first-order RC model, is employed to mimic the basic electrical behavior of the battery, as shown in Figure 3. The parameters in the model are treated as functions of battery SOC and SOH. In this study, the inconsistency of single cells is neglected and the battery SOC is supposed to be known correctly. SOH is described by
S O H = Q B a t t Q B a t t _ n e w × 100 %
where QBatt is the maximum capacity of the battery at current, QBatt_new is the nominal capacity of the battery.
The parameters in this model are considered as functions of both SOH and SOC, described as
U t ( k ) = U o c ( z , SOH ) φ B ( k ) R 0 ( z , SOH ) U p ( k )
U p ( k ) = U p ( k 1 ) e Δ t τ ( z , SOH ) + φ B ( k 1 ) R p ( z , SOH ) ( 1 e Δ t τ ( z , SOH ) )
φ B ( k ) = P B ( k ) U t ( k )
where Ut is the terminal voltage, Uoc is the open circuit voltage (OCV), Up is the voltage of the RC network, Rp and τ are resistance and time constant of RC network, respectively, PB is the battery output power, φB is the battery current, R0 is the internal resistance.
The maximum output power of the battery pack is treated as a function of battery SOC and SOH, and is calculated by a discrete solving process:
{ I max dis = U o c ( z k ) U p 1 , k + 1 U p 2 , k + 1 U t , min η c Δ t C aged U o c ( z ) z | z = z k + R d i s I min chg = U o c ( z k ) U p 1 , k + 1 U p 2 , k + 1 U t , m a x η c Δ t C aged U o c ( z ) z | z = z k + R c h g S o P dis = n s n p ( I max dis U t , min ) S o P chg = n s n p ( I max chg U t , max )
where np and ns are the parallel number and series number of the cells that contained in the lithium battery pack, Utmin is lower cut-off voltage.

3.2. Exprimental Study

The above model includes parameters that are related to battery SOH. In this study, we totally use thirteen 18650-type LiFePO4 lithium cells to conduct the aging tests, in which each cell is cycled to a different aging stage under room temperature. Then we test the cell characteristics under urban dynamometer driving schedule (UDDS) to provide dataset of the battery behaviors in different aging conditions. The UDDS voltage/current profile is provided in Section 5. In this section, we use the test data of four typical cells (denoted as No.1~4) to illustrate the method and propose the mathematical expression. The capacity and the corresponding SOH of these four cells are summarized in Table 1. The test battery parameters are given in Table 2.

3.3. Mathematical Expression

For better application in EMS, we further establish the mathematical expression of the model parameters. The method contains the following two steps.
  • Step 1: Test data are divided into many small data segments ranging from SOC = 0.1 to SOC = 1.0; GA is implemented to optimize the model parameters at each data segment. The programming of GA has been introduced in Reference [28], so it is not reproduced here for brevity. Optimization objective is to find the best parameters ρ(j)= [Uoc(j), R0(j), Rp(j), τ(j)] to minimize the model error at each segment j. The results are shown in Figure 4.
  • Step 2: Mathematical expression. From the results, we found Uoc and R0 have clear correspondences with SOC under each SOH condition, but Rp and τ show fluctuate with some certain value. Thus, Uoc and R0 at the entire SOC range are further fitted by the following continuous polynomials while Rp and τ are replaced by their mean value
{ U o c ( z ) = a 1 z 3 + a 2 z 2 + a 3 z + a 4 + a 5 exp ( a 6 z ) R 0 ( z ) = b 1 z 4 + b 2 z 3 + b 3 z 2 + b 4 z + b 5 R ¯ p = R p ( j ) n τ ¯ = τ ( j ) n
where a1a6 and b1b5 are coefficients, n is the total number of segments.
Based on the above expressions, GA is carried out once again to perform the identification of parameters on the entire SOC range under each aging condition. The coefficients for GA to optimize are rewritten as
ρ ( S O H ) = [ a 1 , a 2 , , a 6 , b 1 , b 2 , , b 5 , R ¯ p , τ ¯ ]
in which a1,..., a6, b1,..., b5 are subject to
{ a i [ a i , min , a i , max ] ,   i = 1 , 2 , . , 6 b j [ b j , min , b j , max ] ,   j = 1 , 2 , . , 5
where ai,min, ai,max, bj,min, and bj,max are limitations of the coefficients’ boundary.

4. Results and Analysis

4.1. The Impacts of Battery Aging

Figure 5 shows the results of electrical behaviors and the parameter variations of the batteries under thirteen aging stages (from the fresh to deep aged battery). It can be seen that the internal resistance increases significantly with the deep aging of the battery, however, the polarization internal resistance and polarization capacitance do not show obvious change regulations. The varying battery parameters are used to design the control parameters in optimal EMS; therefore, the EMS can be adaptive to the battery aging process according to the current SOH value. The results of the parameters in aging expression are provided in Table 3. The driving cycles of UDDS and Extra Urban Driving Cycle (EUDC) are used to assess the increased energy consumption induced by the battery aging. Compared with the fresh battery, the deep aged battery (SOH = 79.34%) cause extra energy cost of 15.19% and 14.28% under UDDS and EUDC, respectively.
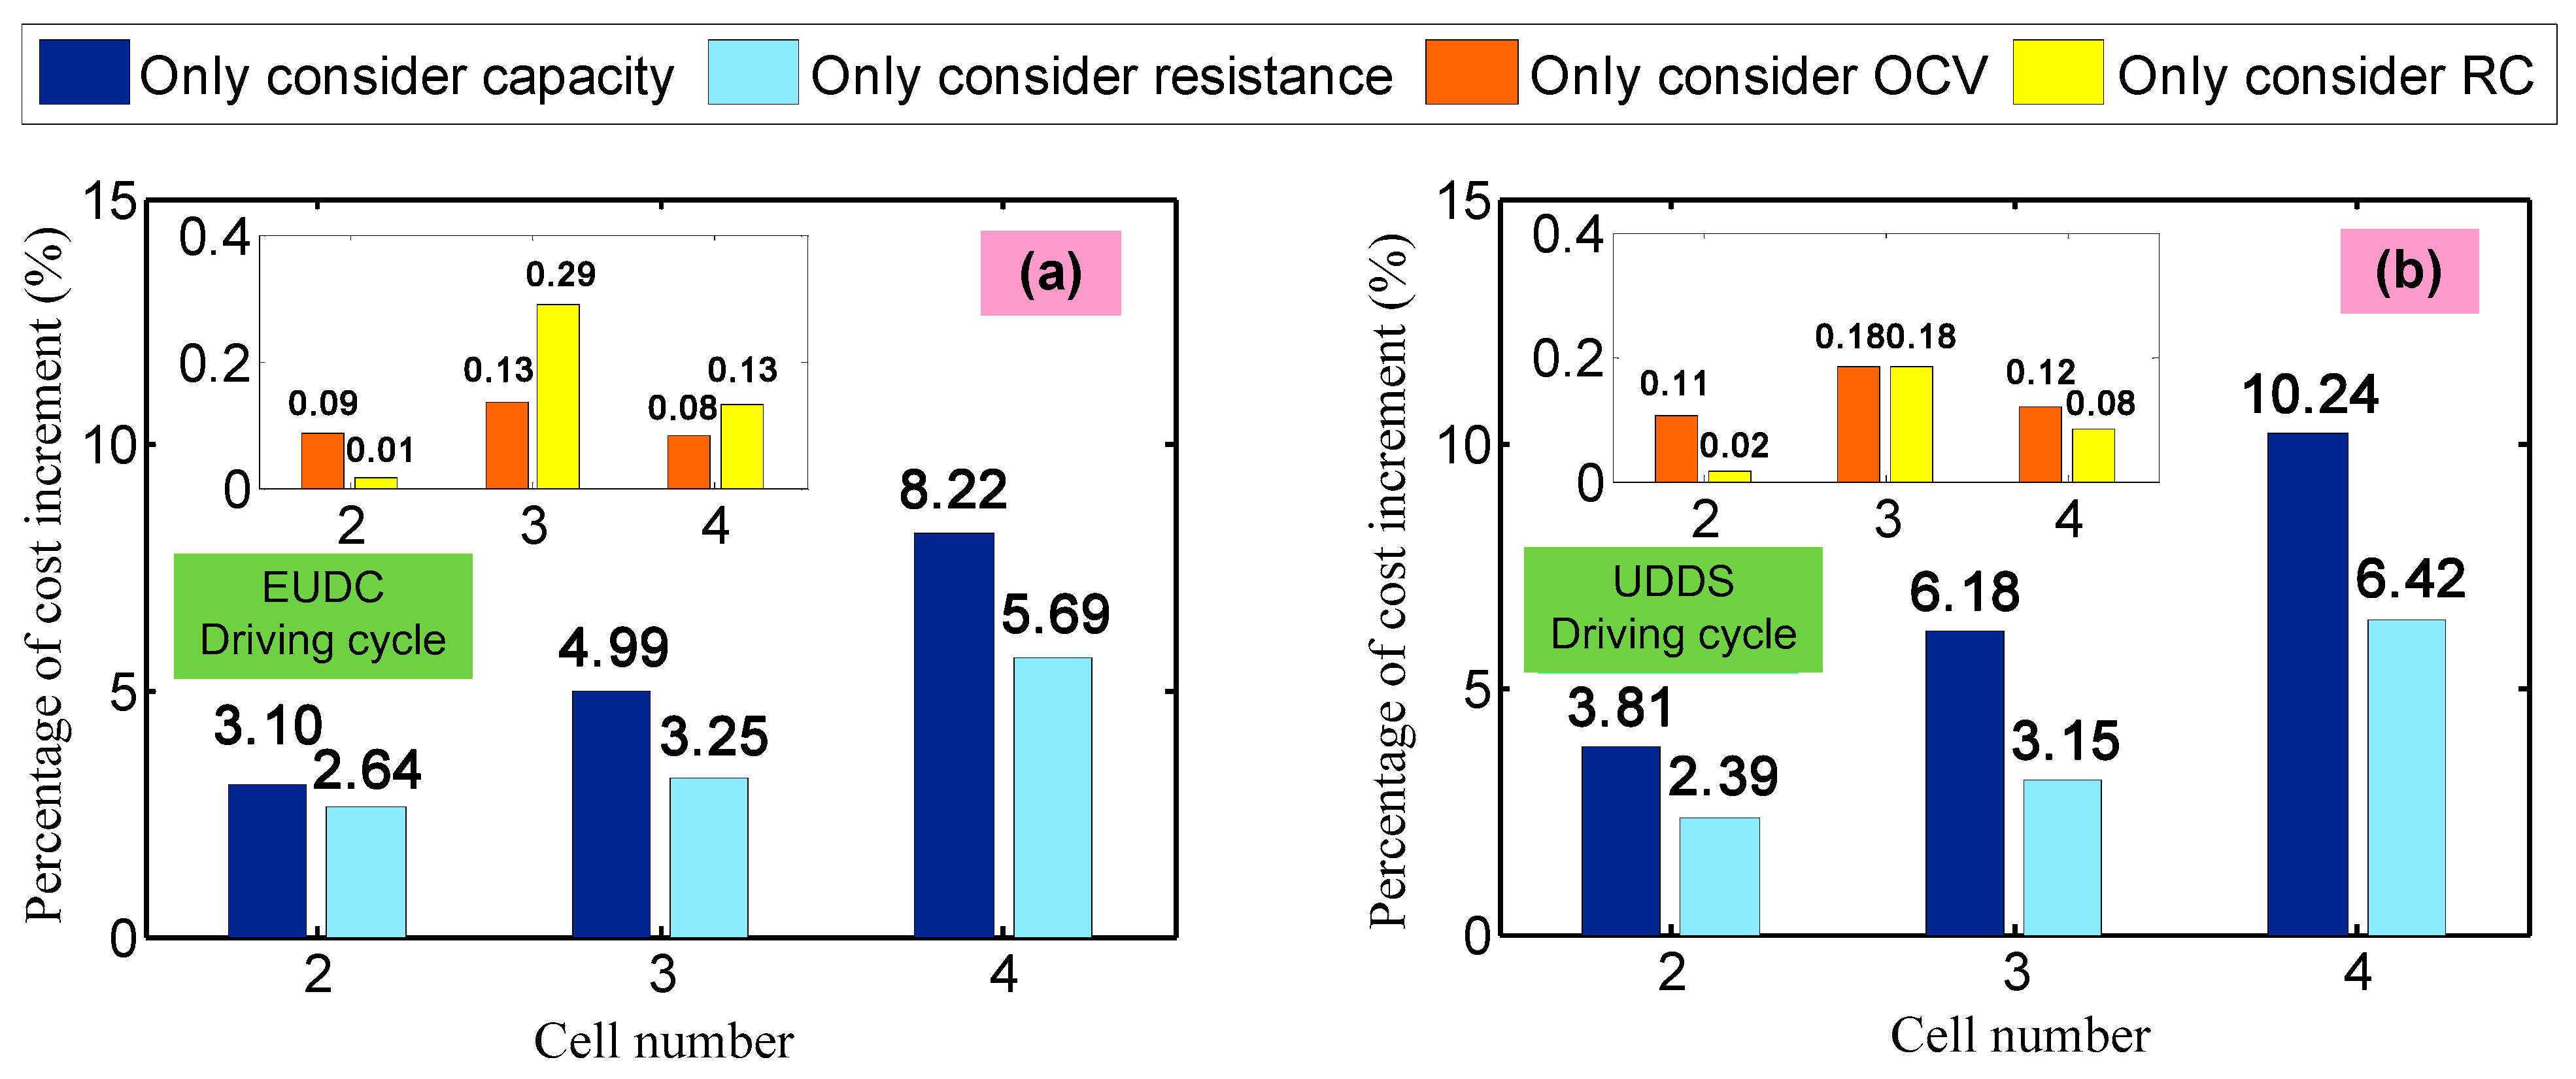
For ease of designing the adaptive control algorithm, we wish to find out the main parameters (among the multiple battery parameters) that contribute the most to energy consumption. Therefore, the specific impacts of each battery aging parameters on increased consumption cost are further analyzed, in which the percentage of cost increment is calculated. The results are shown in Figure 6. The results illustrate that the capacity loss and resistance increase are the main factors leading to the increase of energy consumption. The capacity degradation accounts for up to 10.24% of the aging-caused energy cost while the internal resistance accounts for up to 6.42% of the aging-caused energy cost. On the contrary, the influences of OCV and RC items are minor (less than 0.29%) and can be neglected.

4.2. Energy Consumption

To evaluate the effectiveness of the proposed energy management strategy (denoted as Strategy A), another energy management strategy (denoted as Strategy B) is employed in the following to make a comparison study. Two strategies are implemented with same driving conditions. The two strategies are based on the same control algorithm and optimization process. The only difference is that the impacts of battery aging are not considered in Strategy B while the varying control parameters enable the Strategy A to be adaptive to the battery aging process according to the current SOH value. The simulation conditions are provided as follow. The prices of fuel and electricity are 5.86 CNY-¥/L and 0.82 CNY-¥/kWh, respectively, the thresholds δ1 and δ2 are set as 0.5 and 0.2, respectively. Since the optimization is not implemented when SOC ≥ δ1, the initial SOC in this study is set as 0.5. The impact of temperature is neglected in this simulation.
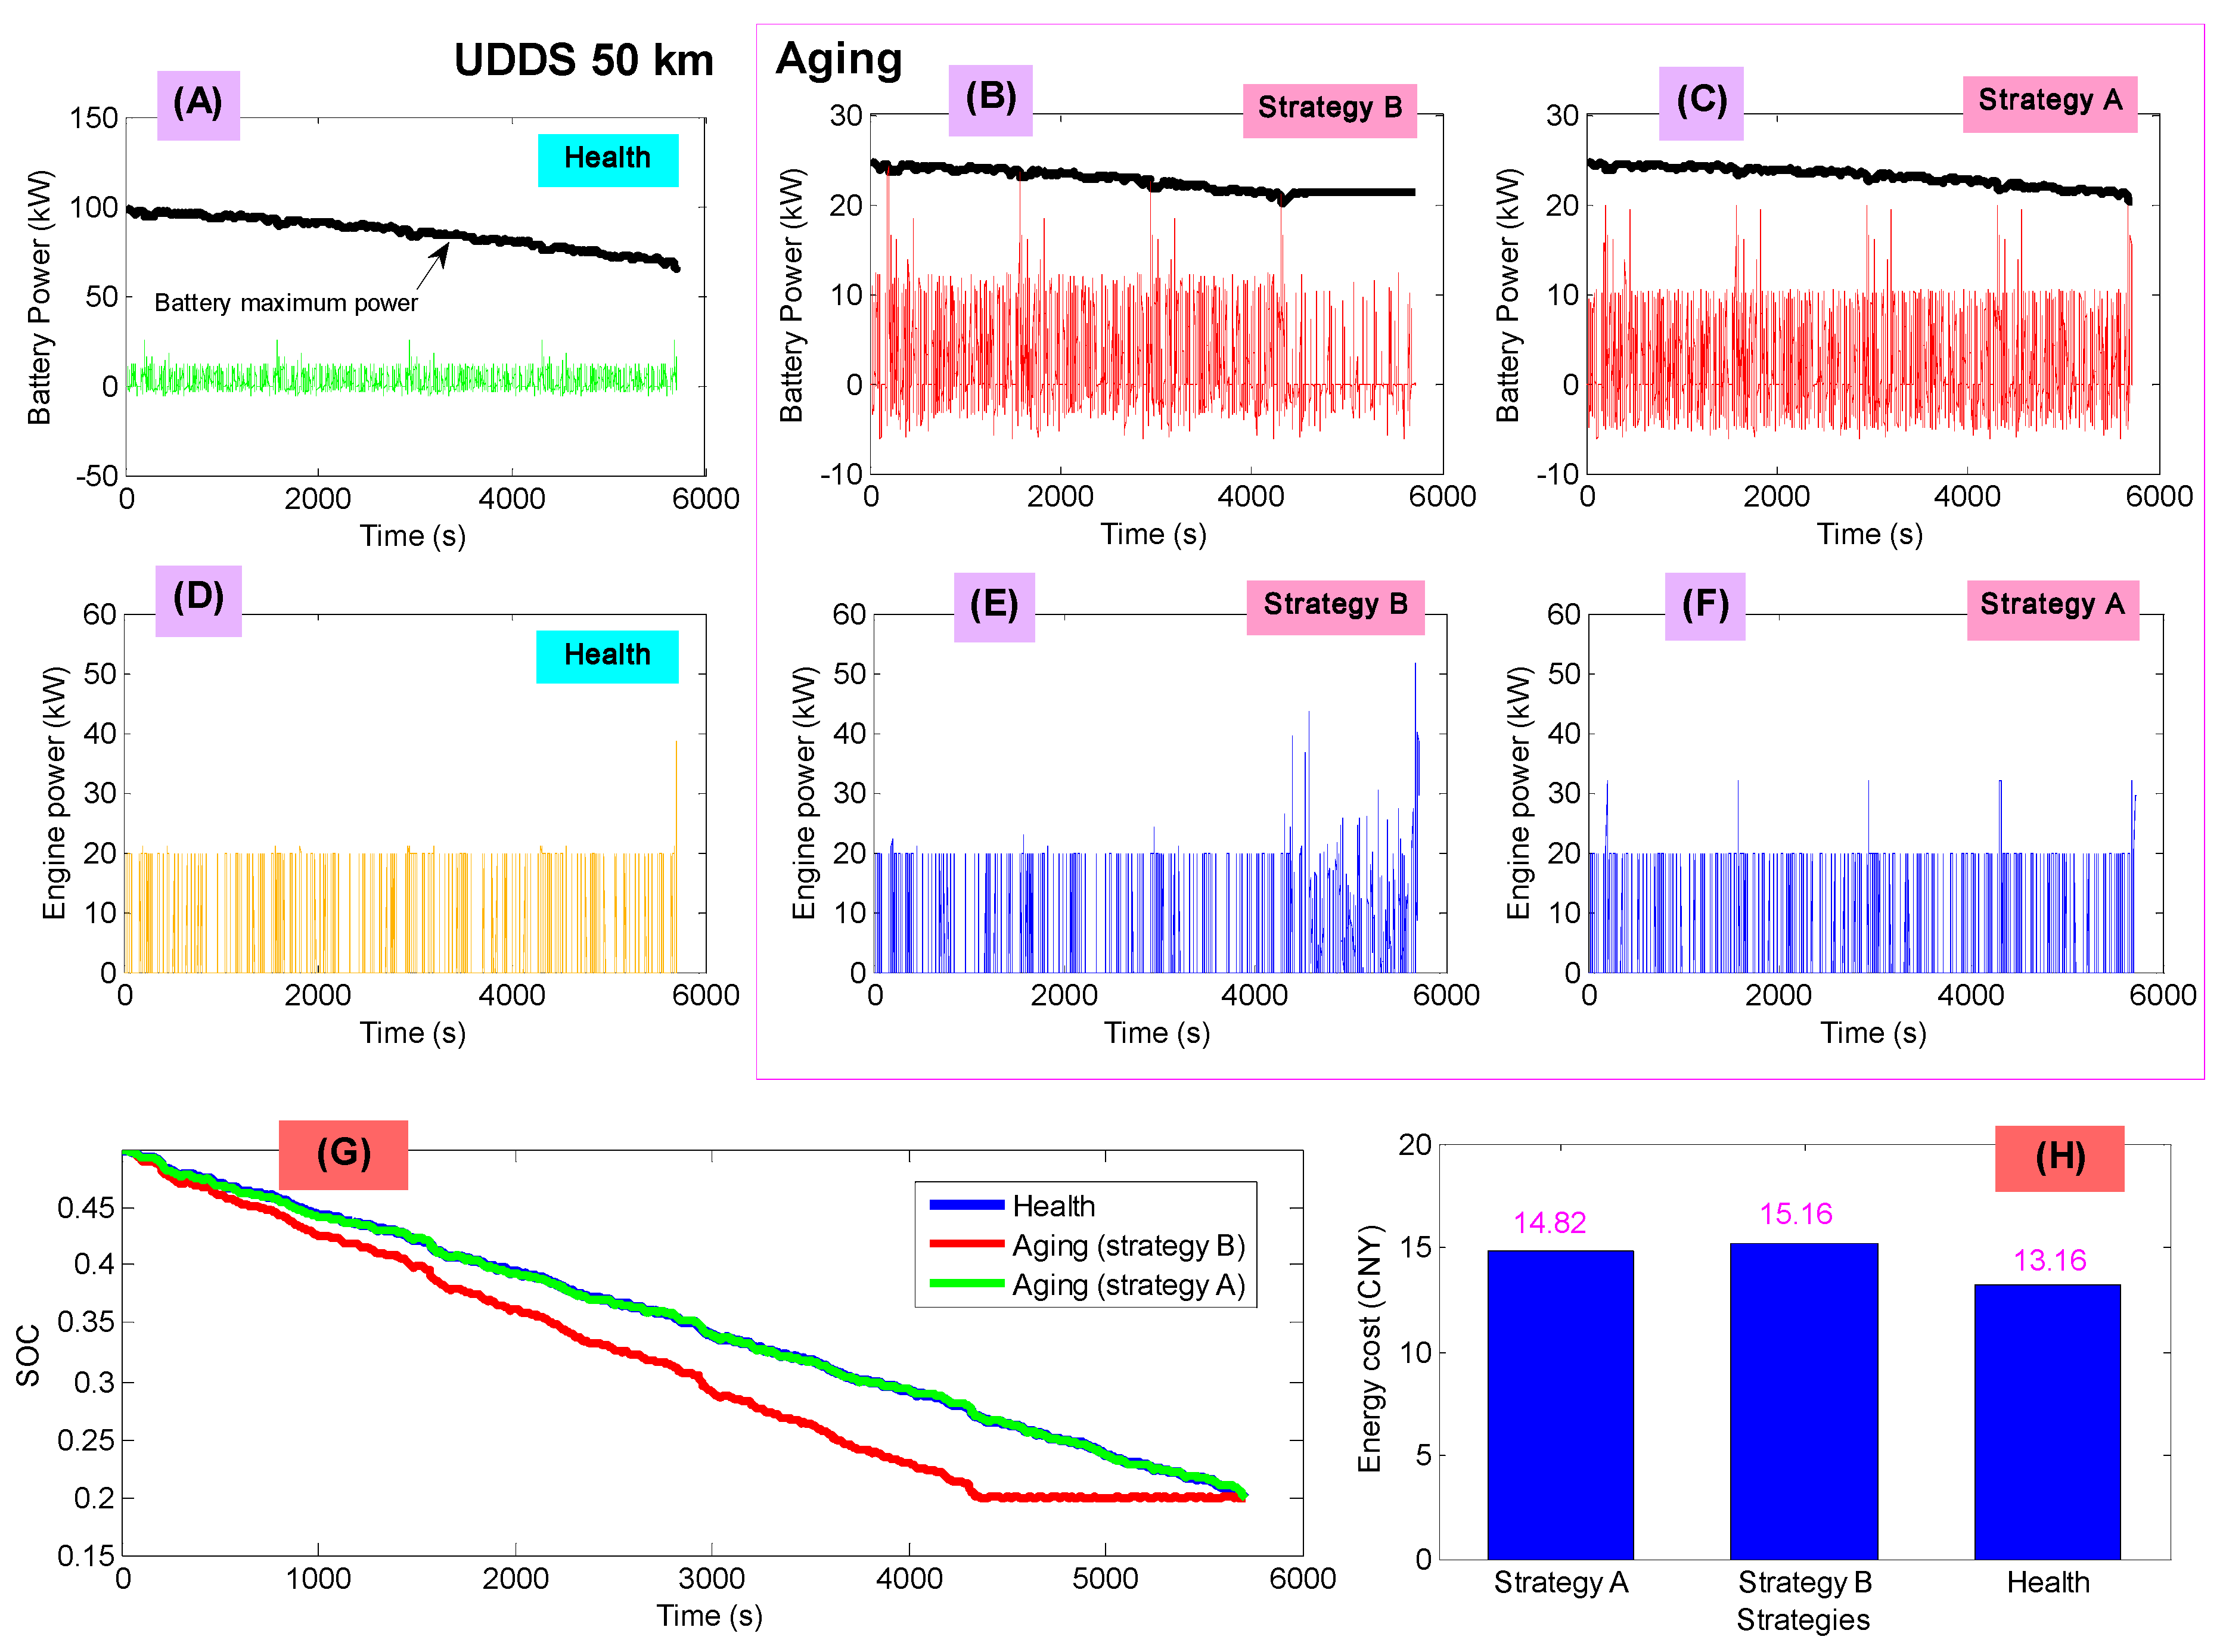
The comparison results of the energy cost from two strategies are summarized in Table 4 and Table 5. The optimal energy cost is enhanced by up to 15.19% in UDDS driving cycle and 14.28% in EUDC driving cycle when SOH changes from 96.21% to 79.34% if the battery aging is not concerned in energy management (Strategy B). Without replacing the aging battery pack, using the presented energy management strategy can reduce the effect of battery aging to some certain extent. The energy cost is decreased by up to 2.24% both in UDDS driving cycle and in EUDC driving cycle compared with the strategy without considering the battery aging. The detailed simulation results of power allocation in UDDS driving cycle are shown in Figure 7.
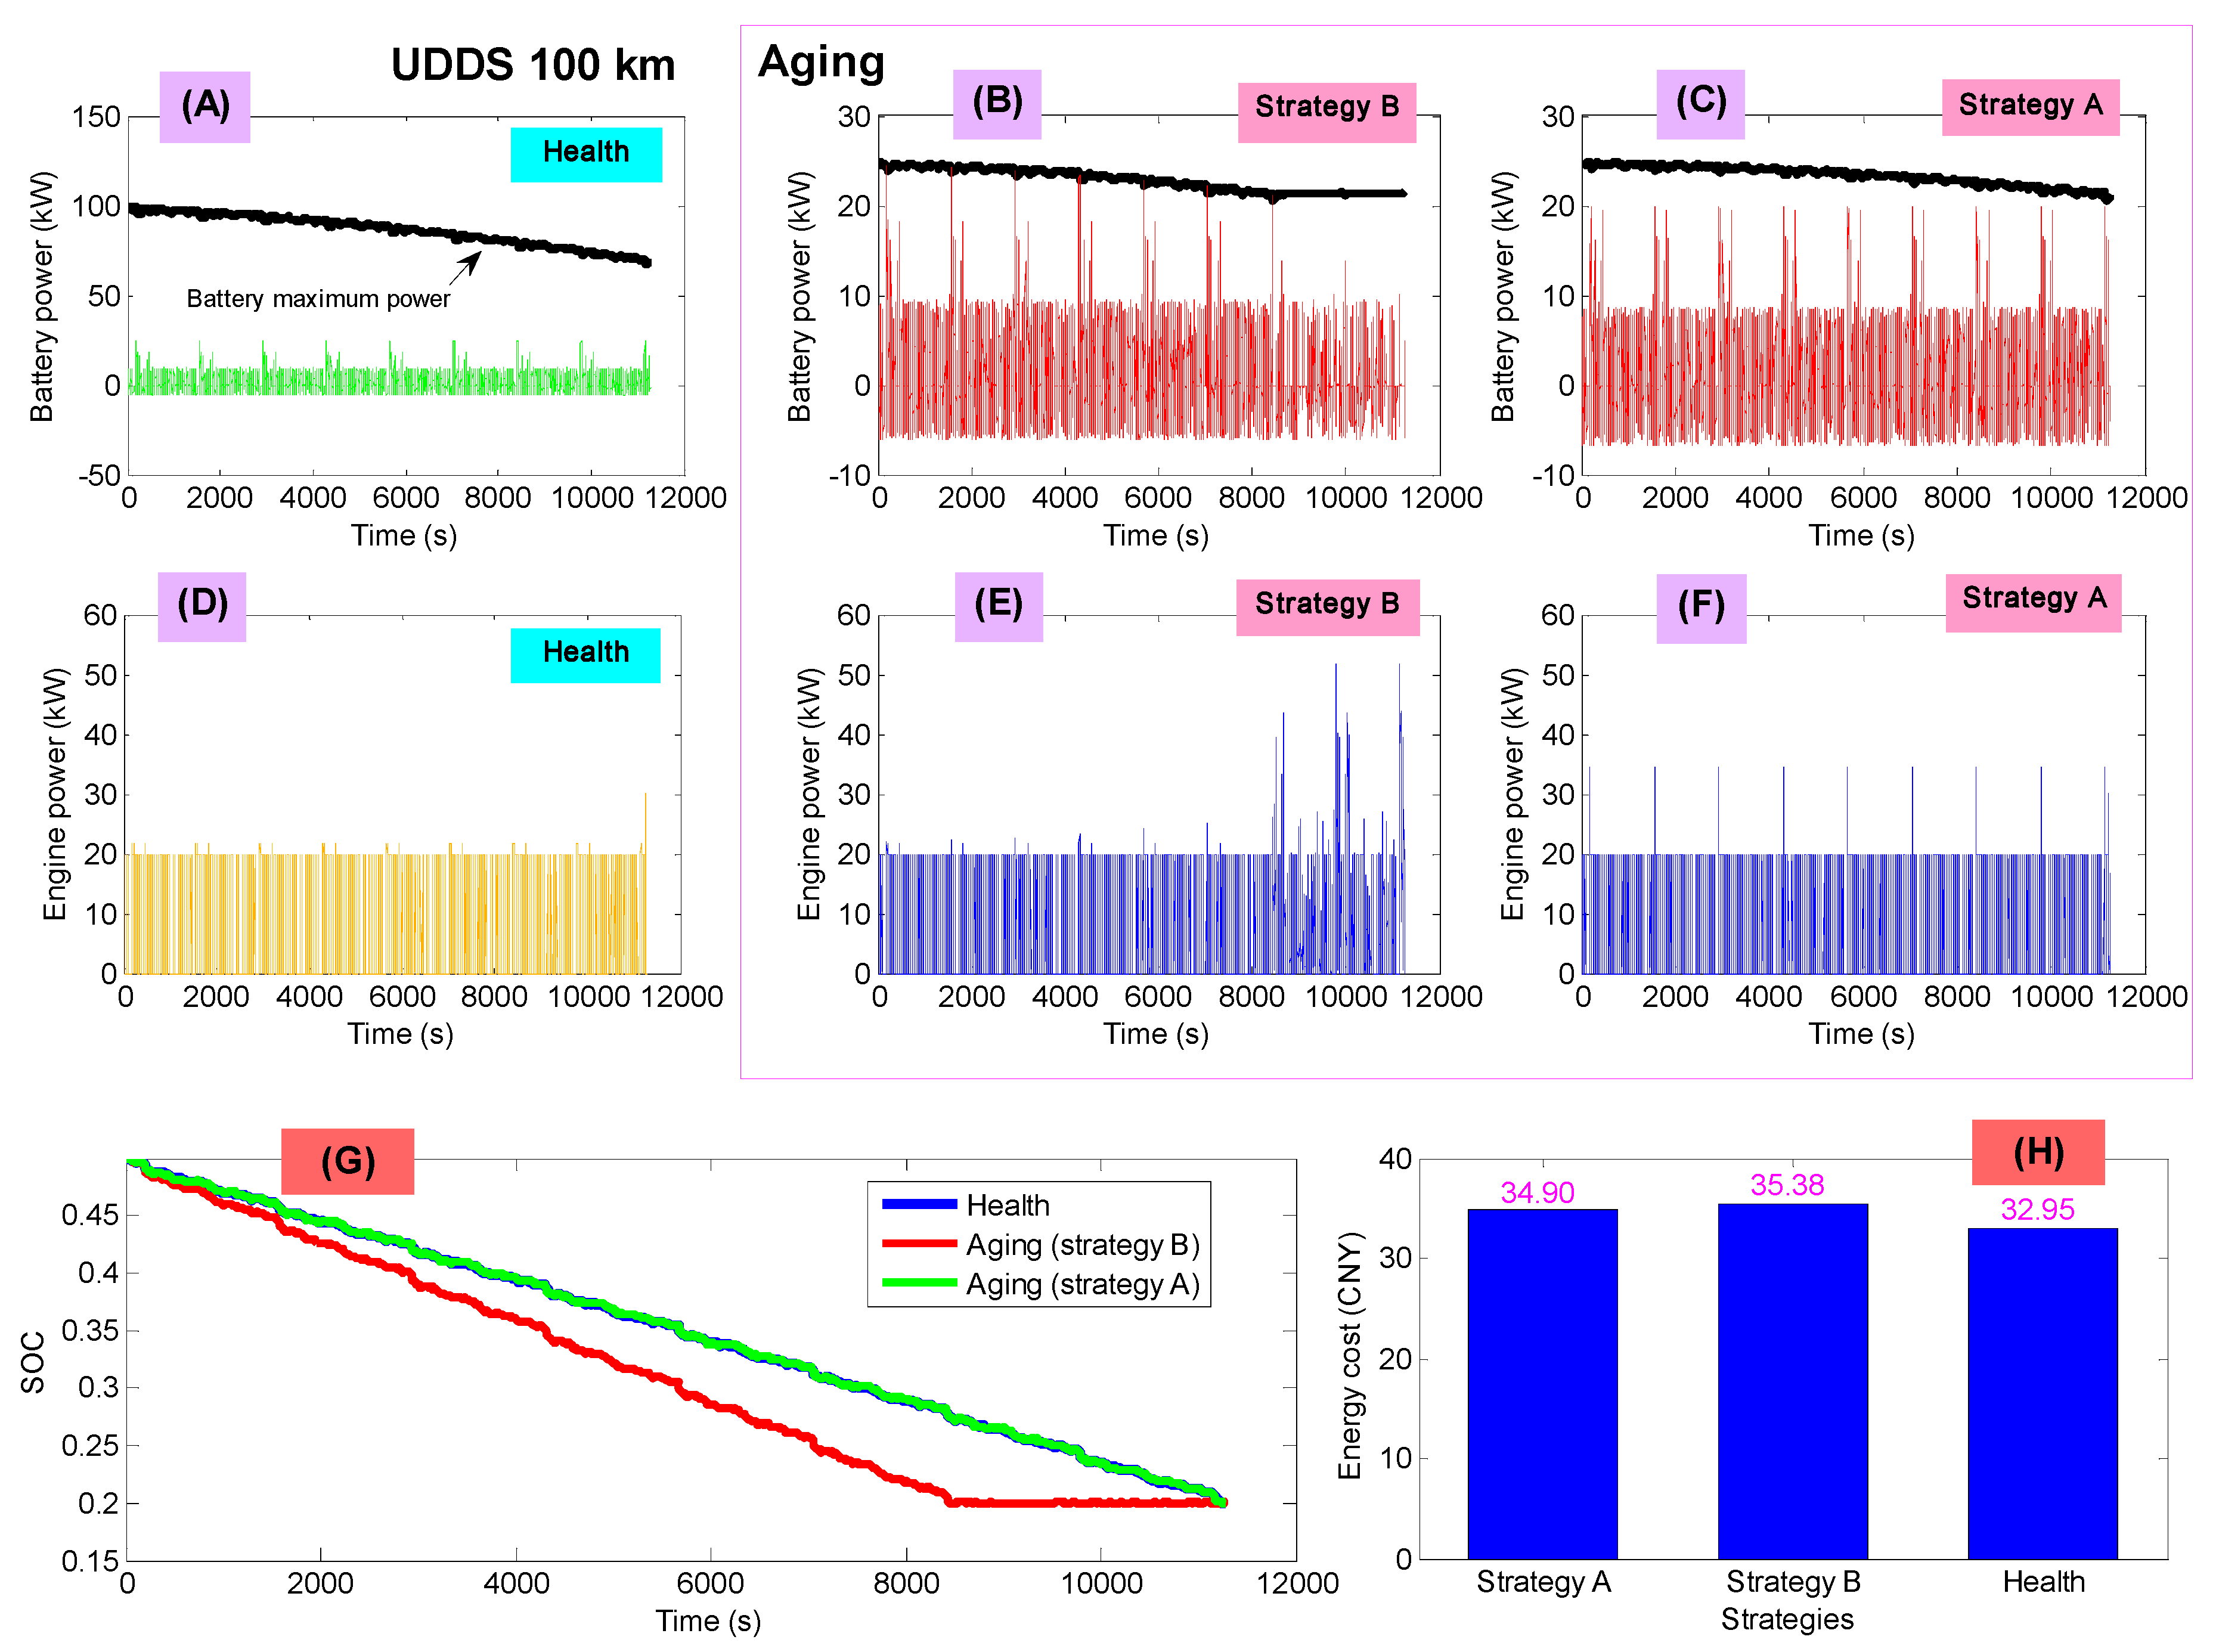
Figure 7A–C show the apparently fade of maximum battery power. When battery is deeply aging, the battery performance is influenced, resulting in an improper energy management result. Therefore, adjusting the energy management parameters at varying battery SOH is necessary. The battery power in Strategy A is properly reduced and well-distributed compared with that in Strategy B. From Figure 7D–F show the engine power distribution. The engine power in Strategy B becomes very large near the terminal of the trip leading in a low efficient performance. This is because the battery energy is insufficient near the end of the trip, see Figure 7G. The battery SOC in Strategy B drops to bottom earlier than that in Strategy A, and then the higher cost power from the engine supply the power demand. On the contrary, the SOC trajectory in Strategy A has a good agreement with that of health battery. The optimal cost of Strategy A at the terminal of trip is decreased effectively in comparison with Strategy B. Similar analysis results can also be found in Figure 8. When trip length is long, the impact of battery aging tends to be minor because the energy cost from engine system (gasoline) occupies a larger proportion than that of short trip length. Although the battery aging cannot be eliminated through the energy management approach, a proper design of energy management strategy can partly reduce its negative impacts on energy cost of the PHEV.

5. Conclusions

In this study, the battery behaviors under 13 different aging conditions are investigated experimentally, based on which, an aging-conscious battery model is proposed for energy management application. The optimal control strategy is then proposed for PHEVs energy management against the impact of battery aging. The presented control strategy can achieve the optimal control performance over the entire battery lifespan based on the PSO algorithm. The quantitative impact of battery aging on the energy consumption has been revealed, indicating that the capacity and internal resistance are the main factors that cause the extra energy cost. The presented energy management strategy is evaluated and analyzed by a simulation study under two typical driving cycles. The results indicate that the energy cost of PHEV can be increased by up to 15.19% due to the battery aging. The aging-conscious energy management can balance out some of the harmful effects that battery aging can have on energy efficiency. Compared with the strategy without considering the battery aging, the presented strategy can reduce the aging-induced energy consumption by up to 2.24% at certain driving condition.

Author Contributions

Conceptualization and methodology are provided by Z.C. and J.L.; software and data analysis are conducted by B.L.; validation is presented by N.Z. and S.L. All authors have read and agreed to the published version of the manuscript.

Funding

This research was funded by “the National Natural Science Foundation of China, grant number 51977029, 51607030” and “the Fundamental Research Funds for the Central Universities, grant number N2003002”.

Conflicts of Interest

The authors declare no conflict of interest. The funders had no role in the design of the study; in the collection, analyses, or interpretation of data; in the writing of the manuscript, or in the decision to publish the results.

References

  1. Khayyam, H. A Bab-Hadiashar. Adaptive intelligent energy management system of plug-in hybrid electric vehicle. Energy 2014, 69, 319–335. [Google Scholar] [CrossRef]
  2. Karplus, V.; Paltsev, S.; Reilly, J. Prospects for plug-in hybrid electric vehicles in the United States and Japan: A general equilibrium analysis. Transp. Res. Part A Policy Pract. 2010, 44, 620–641. [Google Scholar] [CrossRef] [Green Version]
  3. Weiller, C. Plug-in hybrid electric vehicle impacts on hourly electricity demand in the United States. Energy Policy 2011, 39, 3766–3778. [Google Scholar] [CrossRef]
  4. Peterson, S.; Apt, J.; Whitacre, J. Lithium-ion battery aging resulting from realistic vehicle and vehicle-to-grid utilization. J Power Sources. J. Power Sources 2010, 195, 2385–2392. [Google Scholar] [CrossRef]
  5. Dubarry, M.; Liaw, B.; Chen, M. Identifying battery aging mechanisms in large format Li ion cells. J Power Sources 2011, 196, 3420–3425. [Google Scholar] [CrossRef]
  6. Vetter, J.; Novák, P.; Wagner, M.; Veit, C.; Moller, K.; Besenhard, J.; Winter, M.; Wohlfahrt-Mehrens, M.; Vogler, C.; Hammouche, A. Ageing mechanisms in lithium-ion batteries. J Power Sources 2005, 147, 269–281. [Google Scholar] [CrossRef]
  7. Nuhic, A.; Terzimehic, T.; Guth, T.; Buchholz, M.; Dietmayer, K. Health diagnosis and remaining useful life prognostics of lithium-ion batteries using data-driven methods. J. Power Sources 2013, 239, 680–688. [Google Scholar] [CrossRef]
  8. Kim, I. A Technique for Estimating the State of Health of Lithium Batteries Through a Dual-Sliding-Mode Observer. IEEE Trans. Power Electron. 2010, 25, 1013–1022. [Google Scholar]
  9. Zhang, Y.; Xiong, R.; He, H.; Michael, P. Long short-term memory recurrent neural network for remaining useful life prediction of lithium-ion batteries. IEEE Trans. Veh. Technol. 2018, 67, 5695–5705. [Google Scholar] [CrossRef]
  10. Shams-Zahraei, M.; Kouzani, A.; Kutter, S.; Bäker, B. Integrated thermal and energy management of plug-in hybrid electric vehicles. J. Power Sources 2012, 216, 237–248. [Google Scholar] [CrossRef] [Green Version]
  11. Hou, C.; Ouyang, M.; Xu, L.; Wang, H. Approximate Pontryagin’s minimum principle applied to the energy management of plug-in hybrid electric vehicles. Appl. Energy 2015, 115, 174–189. [Google Scholar] [CrossRef]
  12. Li, L.; You, S.; Yang, C.; Yan, B.; Song, J.; Chen, Z. Driving-behavior-aware stochastic model predictive control for plug-in hybrid electric buses. Appl. Energy 2016, 162, 868–879. [Google Scholar] [CrossRef]
  13. Wirasingha, S.; Emadi, A. Classification and review of control strategies for plug-in hybrid electric vehicles. IEEE Trans. Veh. Technol. 2011, 60, 111–122. [Google Scholar] [CrossRef]
  14. Peng, J.; He, H.; Xiong, R. Rule based energy management strategy for a series–parallel plug-in hybrid electric bus optimized by dynamic programming. Appl. Energy 2017, 185, 1633–1643. [Google Scholar] [CrossRef]
  15. Gao, Y.; Ehsani, M. Design and control methodology of plug-in hybrid electric vehicles. IEEE Trans. Ind. Electron. 2010, 57, 633–640. [Google Scholar]
  16. Schouten, N.; Salman, M.; Kheir, N. Energy management strategies for parallel hybrid vehicles using fuzzy logic. Control Eng. Pract. 2003, 11, 171–177. [Google Scholar] [CrossRef]
  17. Li, S.; Sharkh, S.; Walsh, F.; Zhang, C. Energy and battery management of a plug-in series hybrid electric vehicle using fuzzy logic. IEEE Trans. Veh. Technol. 2011, 60, 3571–3585. [Google Scholar] [CrossRef]
  18. Zhang, S.; Xiong, R. Adaptive energy management of a plug-in hybrid electric vehicle based on driving pattern recognition and dynamic programming. Appl. Energy 2015, 155, 68–78. [Google Scholar] [CrossRef]
  19. Patil, R.; Filipi, Z.; Fathy, H. Comparison of supervisory control strategies for series plug-in hybrid electric vehicle powertrains through dynamic programming. IEEE Trans. Control Syst. Technol. 2014, 22, 502–509. [Google Scholar] [CrossRef]
  20. Chen, S.; Hung, Y.; Wu, C.; Huang, S. Optimal energy management of a hybrid electric powertrain system using improved particle swarm optimization. Appl. Energy 2015, 160, 132–145. [Google Scholar] [CrossRef]
  21. Larsson, V.; Johannesson, L.; Egardt, B. Analytic Solutions to the Dynamic Programming sub-problem in Hybrid Vehicle Energy Management. IEEE Trans. Veh. Technol. 2015, 64, 1458–1467. [Google Scholar] [CrossRef]
  22. Chen, B.; Wu, Y.; Tsai, H. Design and analysis of energy management strategy for range extended electric vehicle using dynamic programming. Appl. Energy 2014, 113, 1764–1774. [Google Scholar] [CrossRef]
  23. Nüesch, T.; Cerofolini, A.; Mancini, G.; Cavina, N.; Onder, C.; Guzzella, L. Equivalent consumption minimization strategy for the control of real driving NOx emissions of a diesel hybrid electric vehicle. Energies 2014, 7, 3148–3178. [Google Scholar] [CrossRef] [Green Version]
  24. Geng, B.; Mills, J.; Sun, D. Energy management control of microturbine-powered plug-in hybrid electric vehicles using the telemetry equivalent consumption minimization strategy. IEEE Trans. Veh. Technol. 2011, 60, 4238–4248. [Google Scholar] [CrossRef]
  25. Sezer, V.; Gokasan, M.; Bogosyan, S. A novel ECMS and combined cost map approach for high-efficiency series hybrid electric vehicles. IEEE Trans. Veh. Technol. 2011, 60, 3557–3570. [Google Scholar] [CrossRef]
  26. Chen, C.; Xiong, R.; Shen, W. A lithium-ion battery-in-the-loop approach to test and validate multi-scale dual H infinity filters for state of charge and capacity estimation. IEEE Trans. Power Electron. 2017. [Google Scholar] [CrossRef]
  27. Chen, Z.; Xiong, R.; Cao, J. Particle swarm optimization-based optimal energy management of plug-in hybrid electric vehicles considering uncertain driving conditions. Energy 2016, 96, 197–208. [Google Scholar] [CrossRef]
  28. Lu, J.; Chen, Z.; Yang, Y.; Lv, M. Online estimation of state of power for lithium-ion batteries in electric vehicles using genetic algorithm. IEEE ACCESS. 2018, 6, 20868–20880. [Google Scholar] [CrossRef]
  29. Padmarajan, B.; Mcgordon, A.; Jennings, P. Blended rule based energy management for PHEV: System Structure and Strategy. IEEE Trans. Veh. Technol. 2016, 65, 8757–8762. [Google Scholar] [CrossRef]
  30. Xiong, R.; Sun, F.; He, H.; Nguyen, T. A data-driven adaptive state of charge and power capability joint estimator of lithium-ion polymer battery used in electric vehicles. Energy 2013, 63, 295–308. [Google Scholar] [CrossRef]
  31. Ali, M.; Zafar, A.; Nengroo, S.; Hussain, S.; Hussain, S.; Alvi, M.; Kim, H. Towards a smarter battery management system for electric vehicle applications: A critical review of Lithium-Ion battery State of Charge Estimation. Energies 2019, 12, 446. [Google Scholar] [CrossRef] [Green Version]
  32. Tian, J.; Xiong, R.; Yu, Q. Fractional-Order Model-Based Incremental Capacity Analysis for Degradation State Recognition of Lithium-Ion Batteries. IEEE Trans. Ind. Electron. 2019, 66, 1576–1584. [Google Scholar] [CrossRef]
  33. Andre, D.; Appel, C.; Guth, T.; Sauer, D. Advanced mathematical methods of SOC and SOH estimation for lithium-ion batteries. J. Power Sources. 2013, 224, 20–27. [Google Scholar] [CrossRef]
  34. Zhang, Z.; Zhang, L.; Hu, L.; Huang, C. Active cell balancing of lithium-ion battery pack based on average state of charge. Int. J. Energy Res. 2020, 44, 2535–2548. [Google Scholar] [CrossRef]
  35. Han, X.; Ouyang, M.; Lu, L.; Li, J.; Zheng, Y.; Li, Z. A comparative study of commercial lithium ion battery cycle life in electrical vehicle: Aging mechanism identification. J. Power Sources 2014, 251, 38–54. [Google Scholar] [CrossRef]
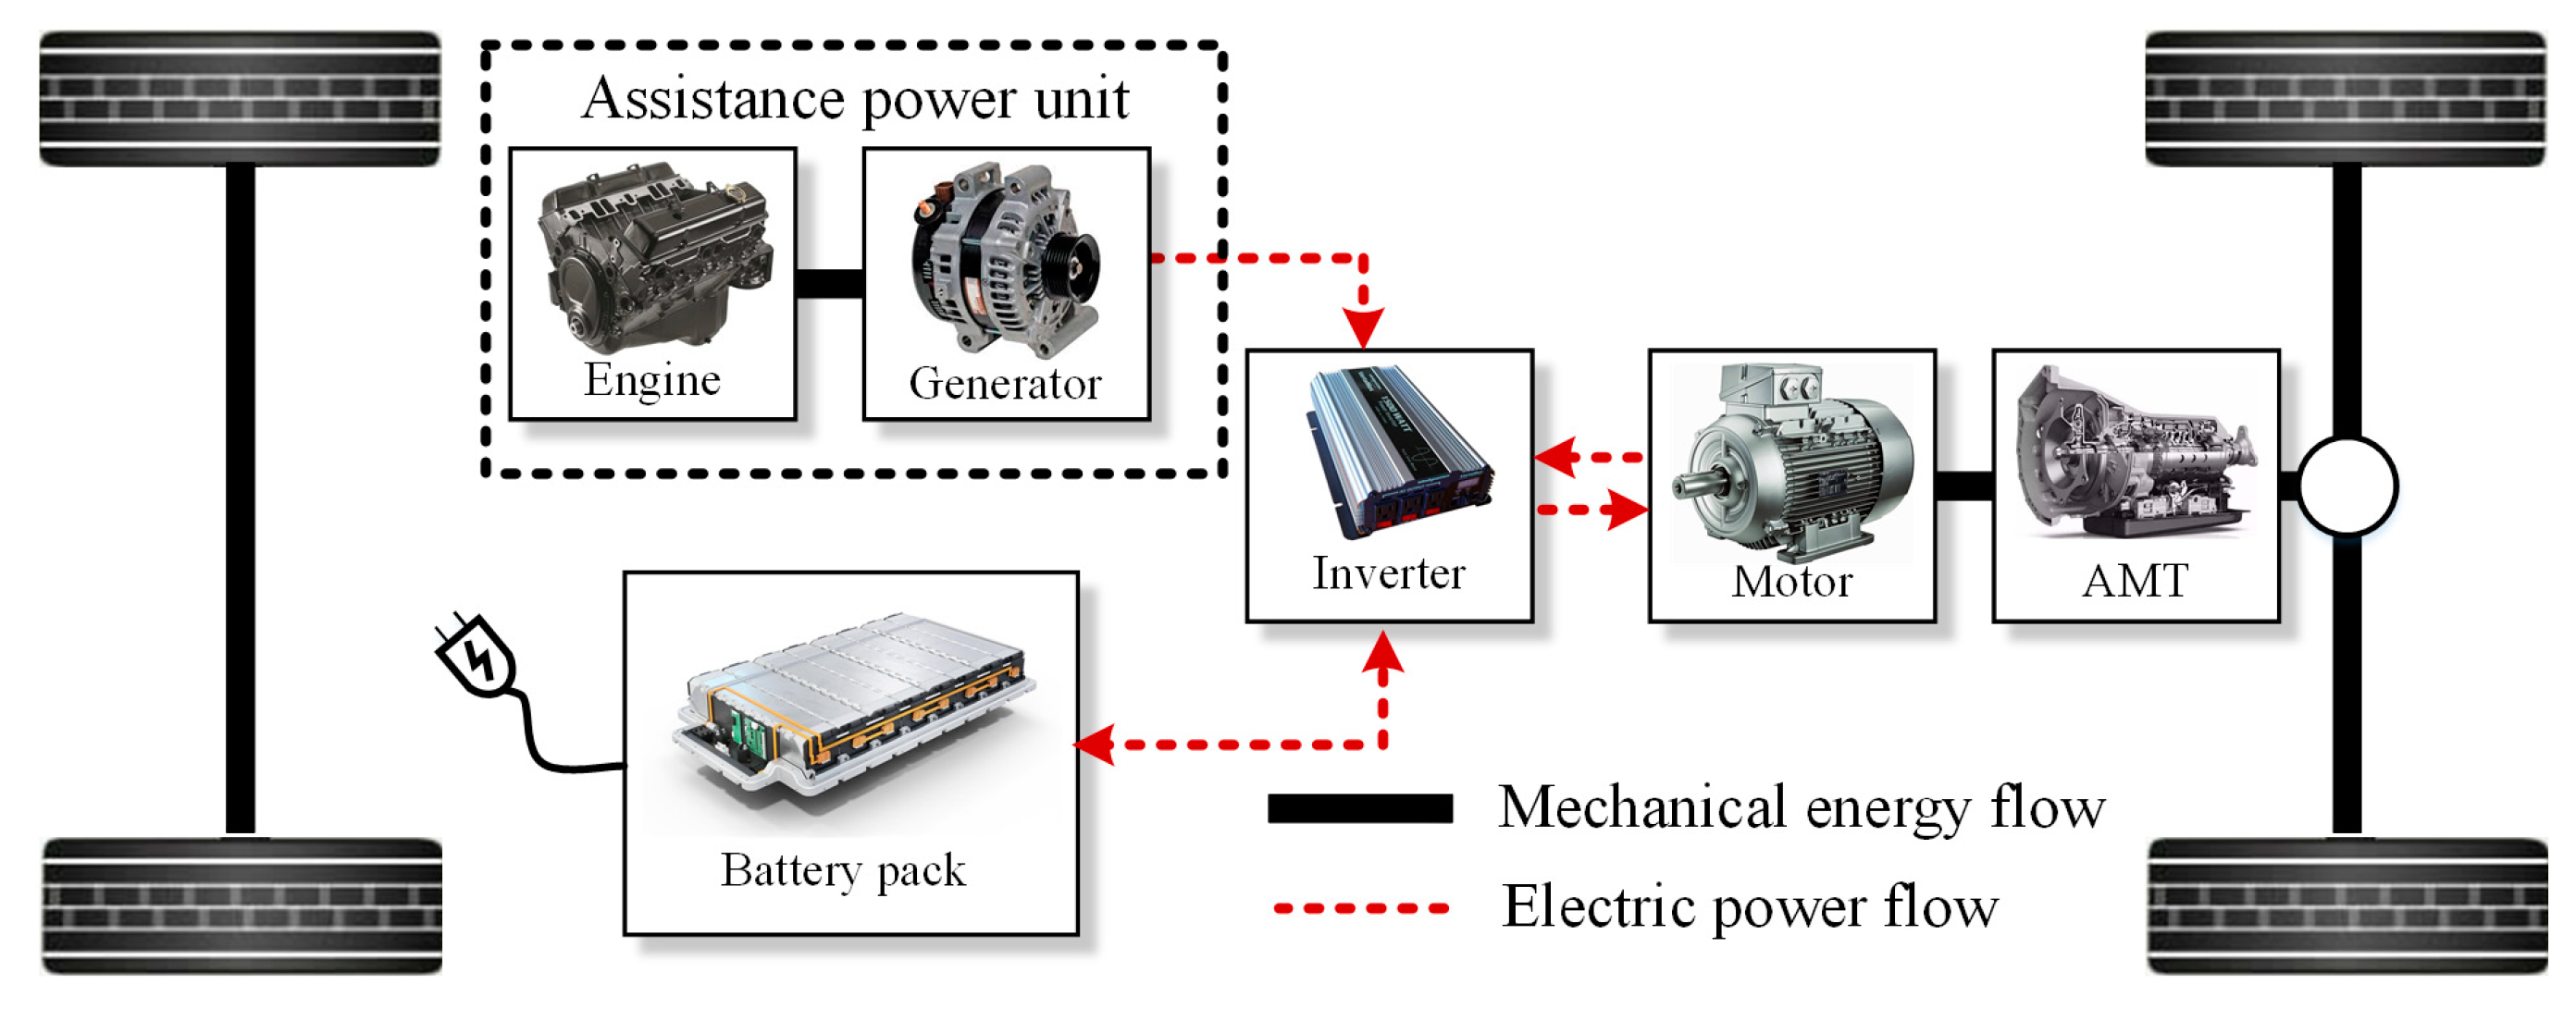
Figure 1. The structure diagram of plug-in hybrid electric vehicles (PHEV) power system.
Energies 13 02543 g001
Figure 2. The schematic diagram of energy management strategy.
Energies 13 02543 g002
Figure 3. Diagram of the first order RC model.
Energies 13 02543 g003
Figure 4. Identification results on data segments of four cells: (A) open circuit voltage (OCV); (B) internal resistance; (C) time constant; (D) resistance of RC network.
Energies 13 02543 g004
Figure 5. Aging characteristics of batteries under thirteen different states of health (SOH) conditions: (A,B): test results of battery voltages and currents under urban dynamometer driving schedule (UDDS) driving cycles; (CF): the varations of the battery parameters caused by the aging.
Energies 13 02543 g005
Figure 6. Specific impacts of battery aging on vehicle energy cost: (a) simulation at Extra Urban Driving Cycle (EUDC); (b) simulation at UDDS driving cycle.
Energies 13 02543 g006
Figure 7. Simulation results in UDDS (50 km): (A) Battery power of healthy battery; (B) battery power of aging battery with Strategy B; (C) battery power of aging battery with Strategy A; (D) engine power of healthy battery; (E) engine power of aging battery with Strategy B; (F) engine power of aging battery with Strategy A; (G) SOC trajectory; (H) energy cost.
Energies 13 02543 g007
Figure 8. Simulation results in UDDS (100 km). (A) Battery power of healthy battery; (B) battery power of deeply aged battery with Strategy B; (C) battery power of deeply aged battery with Strategy A; (D) engine power of healthy battery; (E) engine power of deeply aged battery with Strategy B; (F) engine power of deeply aged battery with Strategy A; (G) results of SOC; (H) energy cost.
Energies 13 02543 g008
Table 1. The aging conditions of the four cells.
Battery Number1234
Capacity1.2991.2171.1581.071
SOH96.21%90.13%85.76%79.34%
Table 2. Specifications of the test cells.
ParametersValue
Nominal capacity/Ah1.35
Nominal voltage/V3.2
Temperature range/°C−20–60
Charge cut-off voltage/V3.65
Discharge cut-off voltage/V2.5
Internal resistance/mΩ33
Table 3. Battery model parameters under the varying SOH phases.
SOHτRp(mΩ)b1b2b3b4b5a1a2a3a4a5a6
96.21%52.169.90.1−0.40.55−0.310.12−3.150.03.140.61−0.840.44
93.28%49.757.01.8−3.92.88−0.890.2226.873.03.120.69−0.990.52
91.60%42.756.31.4−2.81.89−0.560.20−4754753.170.54−0.850.51
90.13%51.270.20.3−0.80.69−0.290.18301.9310.13.120.74−1.090.59
89.40%52.168.20.6−1.51.29−0.510.14−498.0116.73.120.70−1.00.53
88.60%51.778.40.3−0.70.53−0.220.22479.9138.03.130.67−0.990.55
88.05%48.575.50.2−0.60.55−0.270.16−475139.93.130.65−0.940.51
87.38%50.171.50.2−0.60.62−0.310.25483.5145.93.130.64−0.920.49
85.73%49.872.20.2−0.30.14−0.070.1210.572.33.120.69−1.010.55
84.56%49.175.30.4−1.00.90−0.370.174.754.63.10.79−1.180.63
82.61%46.772.70.6−1.41.24−0.490.190.841.53.10.78−1.140.61
81.26%53.669.50.4−0.90.73−0.270.241.251.03.120.69−1.020.55
79.34%55.766.4−0.30.40.07−0.180.29270.3356.83.120.71−1.030.54
Table 4. Comparison on cost functions of two strategies: with the case of UDDS.
SoHDriving Distance: 50 kmDriving Distance: 100 km
Strategy AStrategy BReductionStrategy AStrategy BReduction
96.21%13.1613.16--32.9532.95--
90.13%13.7513.901.08%33.6333.830.59%
85.76%14.1314.341.46%34.0534.380.96%
79.34%14.8215.162.24%34.9035.381.36%
Table 5. Comparison on cost functions of two strategies: with the case of EUDC.
SoHDriving Distance: 50 kmDriving Distance: 100 km
Strategy AStrategy BReductionStrategy AStrategy BReduction
96.21%13.3013.30--33.2633.26--
90.13%13.8614.021.14%33.8434.080.70%
85.76%14.2314.411.25%34.2234.520.89%
79.34%14.8615.202.24%34.9135.401.38%