Article

Shuffled Complex Evolution-Based Performance Enhancement and Analysis of Cascade Liquefaction Process for Large-Scale LNG Production

1
Department of Chemical Engineering, COMSATS University Islamabad (CUI), Lahore Campus, Defense Road, Off Raiwind Road, Lahore 54000, Pakistan
2
School of Chemical Engineering, Yeungnam University, Gyeongsan 712-749, Korea
3
Department of Computer Science, COMSATS University Islamabad (CUI), Lahore Campus, Defense Road, Off Raiwind Road, Lahore 54000, Pakistan
4
Department of Engineering and Chemical Sciences, Karlstad University, 65188 Karlstad, Sweden
5
Department of Gas Engineering, College of Pipeline and Civil Engineering, China University of Petroleum (East China), Qingdao 266580, China
*
Authors to whom correspondence should be addressed.
These authors contributed equally.
Energies 2020, 13(10), 2511; https://doi.org/10.3390/en13102511
Submission received: 7 April 2020 / Revised: 11 May 2020 / Accepted: 11 May 2020 / Published: 15 May 2020
(This article belongs to the Special Issue Energy Resource Potential of Gas Hydrates)

Abstract

:
Among all large-scale natural gas (NG) liquefaction processes, the mixed fluid cascade (MFC) process is recognized as a best-alternative option for the LNG production, mainly due its competitive performance. However, from a thermodynamic point of view, the MFC process is still far from its potential maximum energy efficiency due to non-optimal execution of design variables. Therefore, the energy efficiency enhancement of the MFC process remains an ongoing issue. The design optimization after fixing the main configuration of the process is one of the most economic, but challenging exercises during the design stages. In this study, shuffled complex evolution (SCE) is studied to find the optimal design of the MFC process corresponding to minimal energy consumption in refrigeration cycles. The MFC process is simulated using Aspen Hysys® v10 and then coupled with the SCE approach, which is coded in MATLAB® 2019a. The refrigerant composition and operating pressures for each cycle of the MFC process were optimized considering the approach temperature inside the LNG heat exchanger as a constraint. The resulting optimal MFC process saved 19.76% overall compression power and reduced the exergy destruction up to 28.76%. The thermodynamic efficiency (figure of merit) of the SCE-optimized process was 25% higher than that of the published base case. Furthermore, the optimization results also imply that there is a trade-off between the thermodynamic performance improvement and the computational cost (no. of iterations). In conclusion, SCE exhibited potential to improve the performance of highly nonlinear and complex processes such as LNG processes.

1. Introduction

In recent years, there has been growing interest in the consumption of natural gas [1] as markets continue to expand [2,3]. Global consumption of natural gas increased by 1.7% in 2015, representing 23.8% of primary energy consumption [4]. The origin of this growing interest is the negative environmental effects of oil and coal [5,6], which has resulted in the implementation of the Kyoto Protocol [7], stringent environmental regulations, enhanced energy security and an increase in the proven reserves of natural gas [1]. Global gas reserves are steadily increasing without any immediate threat of depletion. There was an increase in proven reserves from 120 trillion cubic feet (TCF) in 1995 to 186.1 TCF in 2014 [8]. The burning of oil and coal is associated with greenhouse emissions and consequently, climate change and global warming. On the other hand, natural gas has higher energy conversion efficiencies for power generation [9], in addition to lower carbon and oxide emissions compared to oil and coal. However, gas reserves are located remotely, and a significant portion of known reserves is stranded far from market. Moreover, reserves are not distributed globally. All these aforementioned factors play a key role in the introduction and development of liquefied natural gas (LNG) technologies, which have transformed this resource from a regional to international commodity [10]. Therefore, the current trend in terms of LNG production is expected to continue over the next decades.
Liquefaction consumes approximately 30 to 35% of the total required energy for LNG value chain [11]. This high energy consumption makes LNG production an energy-intensive step of LNG value chain [12]. The energy requirement for LNG production depends not only on the liquefaction technology, but also on the site conditions [13] and mixed refrigerant combination with optimal composition [14]. Many liquefaction technologies have been considered for land-based LNG plants that vary in complexity, capacity and efficiency [15,16,17]. These technologies also differ on the basis of their refrigerant type and involved refrigerant cycles [18]. Among mixed refrigerant based processes, propane pre-cooled mixed refrigerant (C3MR), dual mixed refrigerant (DMR), single mixed refrigerant (SMR) and cascade cycles are popular choices [19,20,21,22]. Among all LNG technologies, cascade refrigeration cycles are quite popular for high capacity LNG plants. Generally, two or more refrigeration cycles are used in a cascade system with either a single component (pure) or mixed refrigerant in each loop. It is worth mentioning that increasing the number of refrigeration cycles improves the thermal efficiency of the process and enhances plant performance. However, there is an associated increase in capital cost [23].
Mixed fluid cascade–LNG (MFC–LNG) process consists of three refrigeration cycles and each consists of a different composition and components of refrigerants to formulate a mixed refrigerant. The use of mixed refrigerants with different compositions in pre-cooling, liquefaction and sub-cooling sections renders the MFC process as a potential candidate for low-cost LNG production, mainly due to the relative high exergy efficiency, which ultimately leads to the low energy consumption. In the evidence of pretext, Vatani et al. [23], compared the performance of the MFC process with the SMR, DMR and C3MR processes and found that MFC process has the lowest energy consumption with the maximum exergetic efficiency, i.e., 51.82%. However, from thermodynamic point of view, the MFC process is still far away from its maximum achievable energy efficiency due to complex and highly nonlinear thermodynamic interactions between design variables, constraints (approach temperature inside multistream heat exchangers) and energy efficiency. Therefore, the performance enhancement of the MFC process by searching best optimal design variables is an ongoing issue, so far. Thus the optimization of mixed refrigerant LNG processes in general [24] and MFC process in particular, is one of the challenging tasks during the design stages.
A review of the literature revealed that there have been optimization studies that focus on achieving optimum operating conditions (temperature and pressure) and mixed refrigerant composition for the LNG processes. For instance, Qyyum et al. [16] presented a comprehensive review focusing on the design optimization of LNG processes. However, the design optimization studies of MFC process are not widely reported in the open literature, mainly due to its high dimensionality and complexity. Ding et al. [25], simulated the MFC process using Hysys and optimized through genetic algorithm (GA) to find the operating conditions and refrigerant composition against minimal compression power. Nawaz et al. [26], used Coggins algorithm to optimize the Hysys-simulated MFC process and demonstrated approximately 11% savings in compression power in comparison to the MFC process optimized by Ding et al. [25]. Ghorbani et al. [27] integrated the MFC process with natural gas liquids (NGL) recovery and nitrogen rejection units (NRU). They simulated the integrated process in Aspen Hysys and then optimized using GA to minimize the compression power. Mehrpooya et al. [28] replaced the precooling compression refrigeration cycles with absorption refrigeration cycle and reduced the compression power up to 30%. In a similar study, Ghorbani et al. [29], integrated NGL recovery with LNG process while replacing absorption refrigeration system in lieu of precooling stage of MFC to lower required energy consumption. Lin et al. [30] designed and optimized the two-stage cascade processes for pressurized LNG production. They conducted simulation-based optimization to find the optimal design corresponding to minimal energy consumption. Recently, Brodal et al. [31] modified the MFC process by replacing the Joule–Thomson (JT) valves with liquid expanders same as did by Qyyum et al. [32] for the SMR process. Moreover, Brodal et al. [31] investigated the impact of atmospheric temperature on the performance of MFC process and optimized the process based on temperature difference at the outlet of heat exchangers. Kamalinejad et al. [33] applied mixed integer nonlinear programming model for the synthesis of refrigeration systems and the procedure was applied on a cascade process. The final design depicted 3.3% reduction in compression shaftwork when compared to the base case.
Since the optimization of LNG processes has presented a significant reduction in exergy destruction and enhanced the energy efficiency. Most of the studies used GA and Hysys-built-in optimizers to find the optimal design variables for the MFC process. Notably there is no algorithm that could provide global optimal solution with decisively conclusion. However, a most widely used approach to evaluate optimization algorithms is just to try them with same basis and highlight its potential superiority for the particular problem based on the observation results. In this context, this study evaluates the shuffled complex evolution (SCE) technique to find the optimal design variables corresponding to minimal compression power. The SCE algorithm has hitherto not been employed for the design optimization of any complex LNG process such as MFC. The SCE is built on the synthesis of four basic proven concepts for global optimization problems including the concepts of random and deterministic approach, clustering, evolution of point complex and competitive evolution. Thus, the efficiency of global convergence is improved [34]. To evaluate and enhance the performance of the MFC process, a well-known commercial simulator Aspen Hysys® v10 is used. Hysys-simulated MFC process is linked with MATLAB® 2019a to establish optimization environment. The performance enhancement is analyzed in terms of composite curves, exergy destruction and figure of merit.

2. Methodology: Shuffled Complex Evolution Approach

The Shuffled Complex Evolution (SCE) (originally proposed by Duan et al. [35]) is an efficient approach for obtaining the global optimal solution of high dimensional and complex optimization problems. The SCE is a search methodology that exploits the strengths of controlled random search (CRS) algorithms in combination with the emerging concepts of competitive evolution and complex shuffling. This technique can effectively use the response surface information to guide the search using a deterministic strategy. The inclusion of random elements is helpful in achieving the flexibility and robustness of the algorithm. In the SCE method, the systematic complex evolution technique ensures that a comparatively robust search is performed. The surfaces of rough, non-convex and insensitive objective functions can be readily used in this approach because of its complex structure. The approach is relatively unaltered by the minor local minima that appear in the way to global solution without the requirement of further derivation. Thus, the efficiency of global convergence is improved. The working flowchart of SCE is shown in Figure 1.
The SCE approach achieves the optimal solution in the following steps:
Step 1: Initialize p and m; such as p ≥ 1 and mn + 1 where p and m represent the number of complexes and the number of points in each complex, respectively and n is the number of design variables of the MFC process. Generate a sample size S = p × m
Step 2: A set S of samples x 1 , x 2 , x 3 , , x s in the feasible space Ω n is generated (feasible space means that sample set of decision variables is generated within the constraints). The corresponding value of objective function fi (energy consumption in our case) is computed at each x sample in the absence of prior distribution and by using uniform sampling distribution.
Step 3: All the samples in set S are sorted in ascending order on the basis of their energy consumption. They can be stored in an array D = { x i . f i   w h e r e   i = 1 , , s } such that x1 represents a sample with minimum energy consumption in the MFC process.
Step 4: Array D is portioned in to p complexes A1 to Ap such that each complex contains m samples, as shown in Equation (1). Here complex or community or population is a subset of array D that contains S feasible samples of decision variables of MFC process and their corresponding energy consumption. It means, in the MFC case, all samples of decision variables in array D are divided into p complexes in such a way that each complex will have few samples of decision variables.
A k = { x j k , f j k | x j k = x k + p ( j 1 ) , f j k = f k + p ( j 1 ) , j = 1 , . m } .
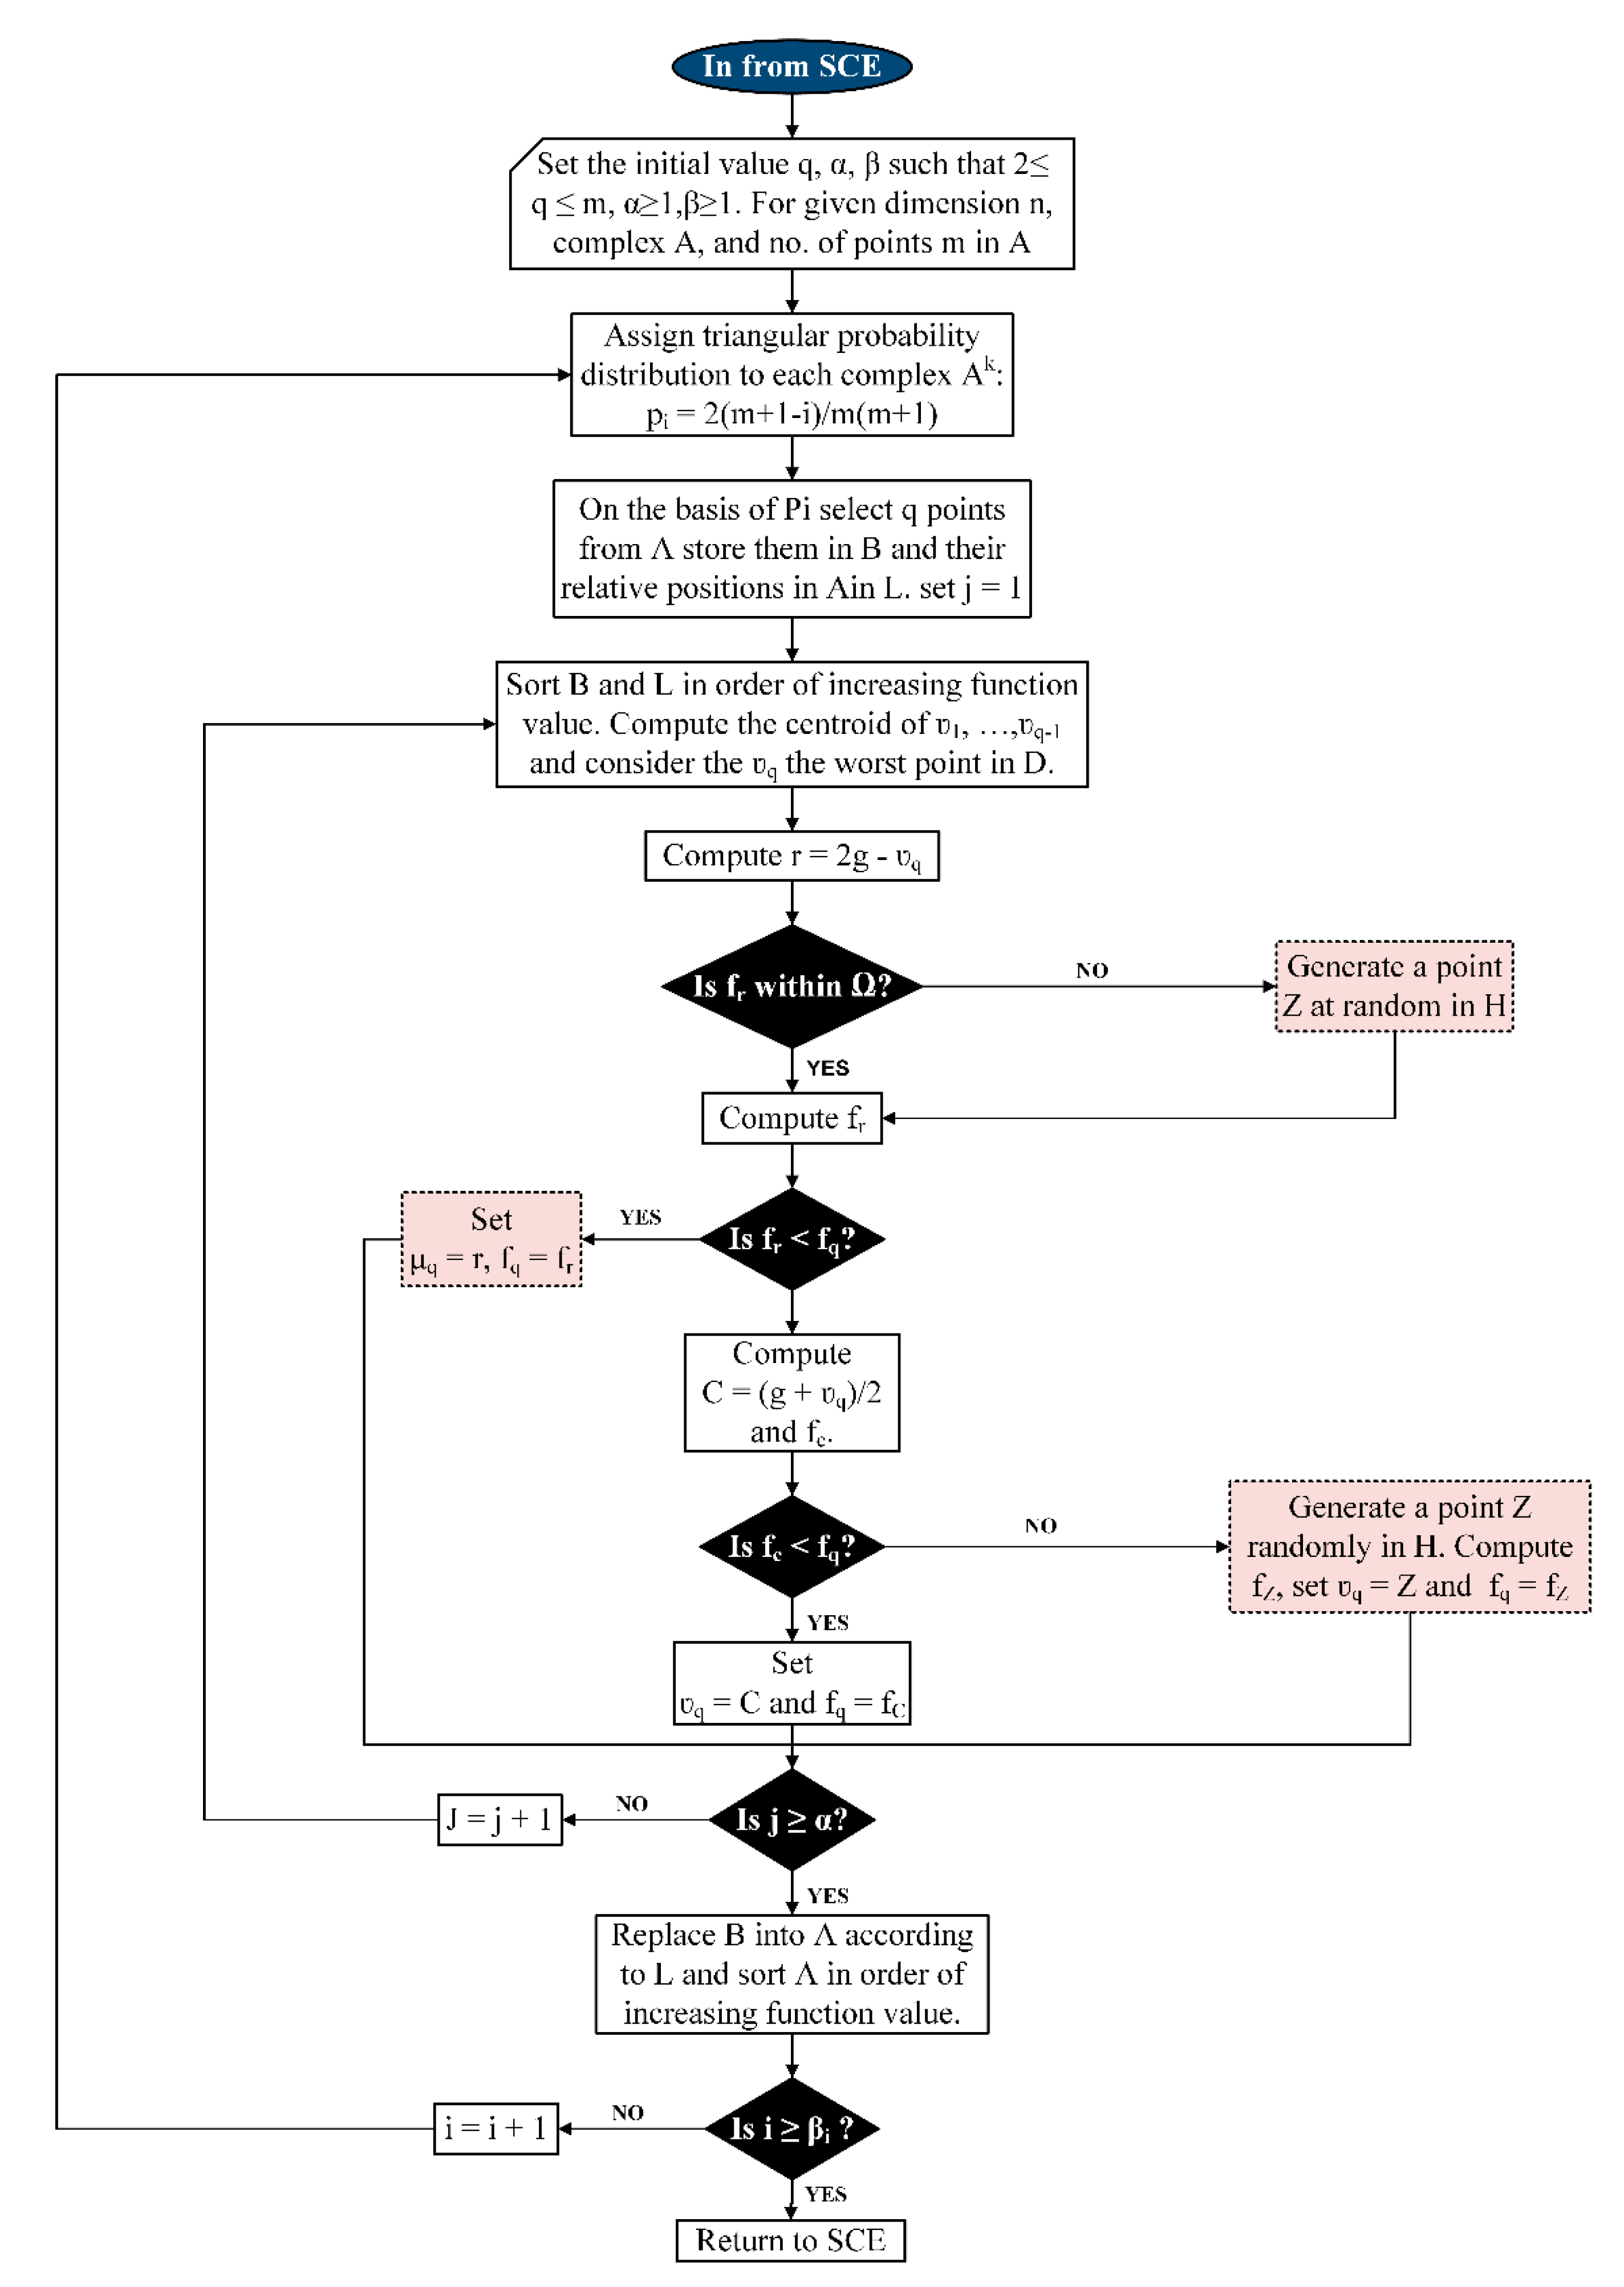
Step 5: Each complex A k   w h e r e   k = 1 , , p evolves according to the competitive complex evolution (CCE) algorithm illustrated separately in Figure 2.
Step 6: All A 1 , , A p complexes are replaced in D such that D = { A k , k = 1 , , p } . This process is called shuffling of complexes. D is subsequently sorted on the basis of higher energy consumption by the MFC process.
Step 7: At the end, a check is performed, and the process is terminated if the criteria set for convergence is satisfied. Otherwise, the algorithm returns to step 4. In our case, the number of iterations is the termination criteria.
For the evolution of each complex in step 5, a competitive complex evolution (CCE) algorithm, as demonstrated in Figure 2, is used. The CCE working procedure can be explained in the steps as follows:
Step 1: The initial values of q, α and β are set such that: 2 q m , α 1 ,   a n d   β 1 .
Step 2: Each complex A k is assigned a weight in terms of a triangular probability distribution, i.e., p i = 2 ( m + 1 i ) / m ( m + 1 ) ,   w h e r e   i = 1 , , m .
The point x 1 k has the highest probability, ρ 1 = 2 / m + 1 . whereas the point x m k has the lowest probability, ρ m = 2 / ( m + 1 i ) .
Step 3: In this step, parents are selected. For this, q distinct points μ 1 , , μ q are randomly chosen from A k according to the probability distribution described in step 1. The q points define sub-complexes and are stored in an array B such that B = { μ i , υ i ,   i = , , q } , where υ i is the function value (specific energy consumption) associated with the point, μ i . The relative locations of the values of decision variables of MFC process in A k are stored in L to construct B.
Step 4: In this step, offspring are generated in the following way:
(i)
B and L are sorted such that q points are arranged in ascending order with respect to their respective function values and centroid g is thereafter computed using the expression given in Equation (2):
g = [ 1 / ( q 1 ) ] j = 1 q 1 μ j  
(ii)
The New point r = 2 g μ q is computed in the so-called reflection step.
(iii)
A mutation is performed in this step such that if r lies within Ω, energy consumption by the MFC process is computed and Step (iv) is performed; else, the smallest hypercube H n containing A k is calculated and fz is computed by randomly generating a point z within H. Finally, we set r = z and f r = f z .
(iv)
A contraction process is performed in this step such that if f r < f q , μ q is replaced by r and Step ( v i ) is performed; else c = ( g + μ q ) / 2 is computed followed by fc.
(v)
If f c < f q , μ q is replaced by c and Step ( v i ) is performed; else, fz is computed by randomly generating a point Z within H. Finally, μ q is replaced by z.
(vi)
Step ( i ) through ( v i ) are repeated α times, where α is a user-defined parameter that has a value of ≥1.0.
Step 5: Decision variables in B are replaced in Ak using the original positions in L. Ak is subsequently sorted in order of the increasing energy consumption value.
Step 6: Step 2 through Step 3 are repeated β times where β is a user-defined parameter that has a value greater than or equal to one and determines the number of offspring that should be generated.

3. Process Simulation and Description

For the specific feed NG (conditions and composition are listed in Table 1), the MFC–LNG process was simulated using Aspen Hysys® V10. The fundamental assumptions considered while simulating the process are as follows:
(i)
Peng–Robinson with EOS enthalpy/entropy calculation option was selected for thermodynamic properties calculations.
(ii)
The adiabatic efficiency for each compressor was fixed at 80%.
(iii)
The minimum temperature approach and pressure drop in LNG exchangers was kept constant at 3 °C and 1 bar, respectively.
(iv)
Interstage cooling medium was water, and the water-cooler outlet temperature was 40 °C.
(v)
The pressure drop of the water coolers was 0.30 bar.
(vi)
Furthermore, it was also assumed that the NG feed composition and conditions remain constant.
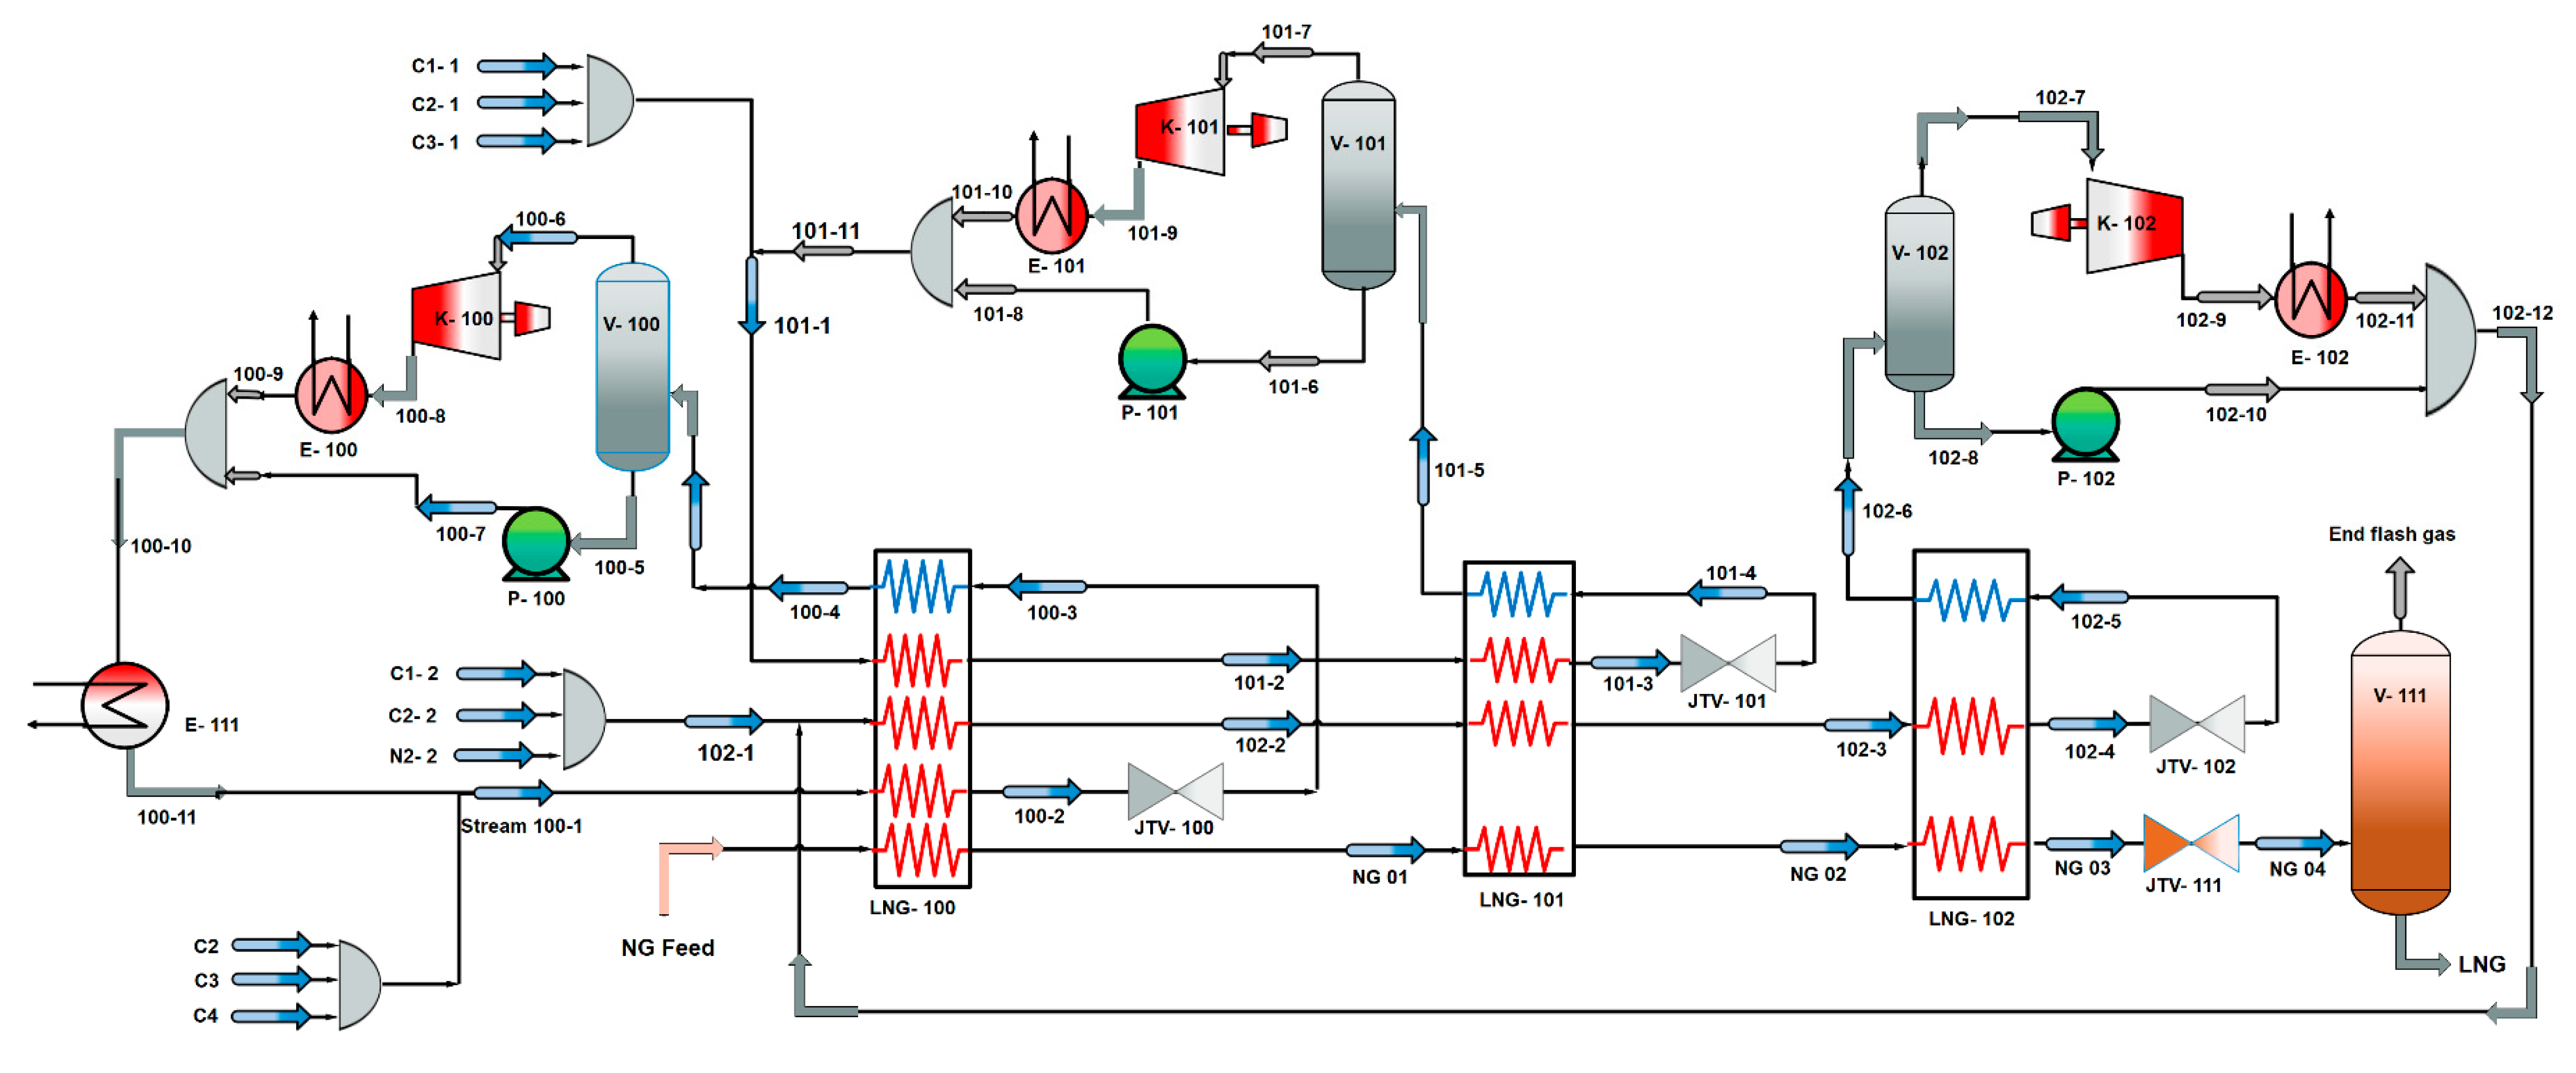
A basic process flow diagram of the MFC–LNG process, which consists of three compression refrigeration loops, namely, pre-cooling, liquefaction and sub-cooling, is shown in Figure 3. Each cycle entails a different composition of refrigerants to formulate a mixed refrigerant (MR) for that particular cycle. Different MR compositions perform different duties by cooling NG to −25, −100 and −155 °C in pre-cooling, liquefaction and sub-cooling cycles, respectively. NG passes through the LNG-exchangers and exchanges its heat with the respective MR. During this exchange of heat, the temperature of the NG drops to −147.1 °C and it condenses. To lower the pressure of this liquefied NG to the storage pressure, a Joule–Thomson valve (JTV-111) is used, whereby its temperature decreases further as spin-off from reduced pressure. The low-pressure LNG is passed through a phase separator (V-111) and flash gas free LNG is obtained as the final product.
Pre-cooling MR (MR-100) comprises of ethylene (ethane), propane and n-butane. The refrigerant is separated into liquid and vapor phases by passing through a phase separator (V-100). The vapor phase MR passes through a single-stage compression (K-100) and is condensed using a water cooler (E-100). The high-pressure condensed refrigerant is mixed with high-pressure liquid refrigerants in a mixer and cooled using a heat exchanger (E-111). The high-pressure pre-cooling MR (MR-100) after exchanging heat in LNG-100 is expanded using a Joule–Thomson valve (JTV-100). Once the MR is expanded, it vaporizes and its pressure (and consequently temperature) decreases to perform its pre-cooling duty. The low-pressure cold refrigerant passes through the LNG-100 again and absorbs heat from the NG, MR-101 and MR-102. The vaporized, hot and low-pressure MR (MR-100) subsequently returns to the phase separator in order to accomplish the cycle.
Liquefaction MR (MR-101) is composed of ethane as the major constituent along with methane and propane. The vapor phase MR is separated from the liquid phase using a phase separator (V-101). It is subsequently compressed, condensed and mixed with the liquid phase and passed through LNG-100 and LNG-101 before being passed through JTV-101. After passing through JTV-101, the low-pressure MR serves as the cold mixed refrigerant in LNG-101 and is ultimately converted to low-pressure and warm mixed refrigerant after an exchange of its cold energy.
The sub-cooling MR (MR-102) consists of low boiling temperature refrigerants, namely methane, ethane and nitrogen with methane as the major and nitrogen as the minor constituent. After the detachment of vapor from a liquid phase in a separator, it is compressed, condensed and mixed again with the liquid phase before passing through all LNG exchangers. Finally, the MR is passed through JTV-102 to lower its pressure (and consequently temperature) to facilitate its sub-cooling duty. The low-pressure, vaporized MR enters LNG-102 to exchange cold energy with NG and liquefies it before moving to the phase separator as a low-pressure super-heated MR to complete the cycle.

4. Simulation–Optimization Environment

The key design variables that govern the performance of MFC process include temperature, flow rate and condensation and evaporation pressure of the MR for the pre-cooling, liquefaction and sub-cooling cycles. Given that these key design variables have an effect on the overall process performance, their optimization to achieve specific energy consumption at lowest level is of utmost importance. Since, objective of this optimization is to minimize energy consumption for natural gas liquefaction, therefore, this task is selected as objective function.
Given that the flow rates of MR, their pressures and temperature significantly affect the rate of energy consumption, are chosen as decision variables for this optimization problem. Lower and upper limits of these variables are tabulated in Table 2. The optimization is further constrained by the cryogenic heat exchanger MITA value to 3.0 °C. In addition, the liquid entry into the compressor inlet stream must be restricted during normal operation of the compressors.

5. Results and Discussion

MFC has several design variables and many constraints. Nonlinear thermodynamic interactions among decision variables cause a notable increase in complexity and thus, rigorous optimization with the objective of selecting optimal values for the variables is required. In this study, an SCE optimization algorithm was used to address the optimization problem. SCE-optimized values of the design variables corresponding to a different number of iterations and their overall impact on the objective function is presented in Table 3. Furthermore, the temperature and pressure corresponding to each stream of base case, SC-optimized with 300 iterations and 700 iterations are listed in Table 4.
As seen in Table 3, the methane, ethane and n-butane have the highest contribution (flowrates) in the MR for subcooling, liquefaction and precooling purposes, respectively, for both the SCE-optimized process and the base case. However, a comparison of the total MR flow rate of the base case with that of the SCE-optimized case corresponding to different iterations in all the three regimes shows that the SCE-optimized flow rates change in an unpredictable manner, which is indicative of the interdependence of multiple variables in a complex manner. In addition, the pressure ratio across the three compressors in three different regimes of the base case MFC–LNG process is much higher than that of the optimized case. A lower compression ratio results in a reduction of the power requirement of a compressor, as confirmed by the specific compression power. The specific compression power for the base case is 0.334 kWh/kg-NG compared to 0.284 and 0.268 kWh/kg-NG corresponding to 300 and 700 iterations, respectively. It is worth mentioning that the SCE-optimized processes corresponding to 700 iterations can reduce the specific compression power by more than 19% compared to the base case. This reduced specific energy consumption creates an opportunity for energy saving and ultimately, the reduction of the operational cost of LNG production. It was also observed that specific compression power decreased with increasing number of iterations, but at computational time expense and consequently, computational cost. The computational cost for 700 iterations is around 3-fold higher than that for 300 iterations. Hence, there is a trade-off between the minimization of objective function (specific compression power) and the computational cost.
The efficiency of heat exchange systems is considered as a key variable in determining operational cost of LNG production due to its effect on the required refrigeration. Composite curve analysis is widely used for this purpose (to describe the efficiency level). There were many studies on the efficiency of heat exchange systems based on the analysis of composite curves [36,37,38]. The gap between the temperature difference composite curves (TDCC) represents the impact of the MR components on the performance of cryogenic heat exchangers in terms of the heat transfer efficiency, while the temperature–heat flow composite curves (THCC) indicates the work lost due to entropy generation. Generally, the area/gap between composite curves is directly related to the irreversibility of the process and any change in irreversibility has an inverse relationship with the heat transfer efficiency level, due to the work lost. The larger the gap, the lower the efficiency and vice versa.
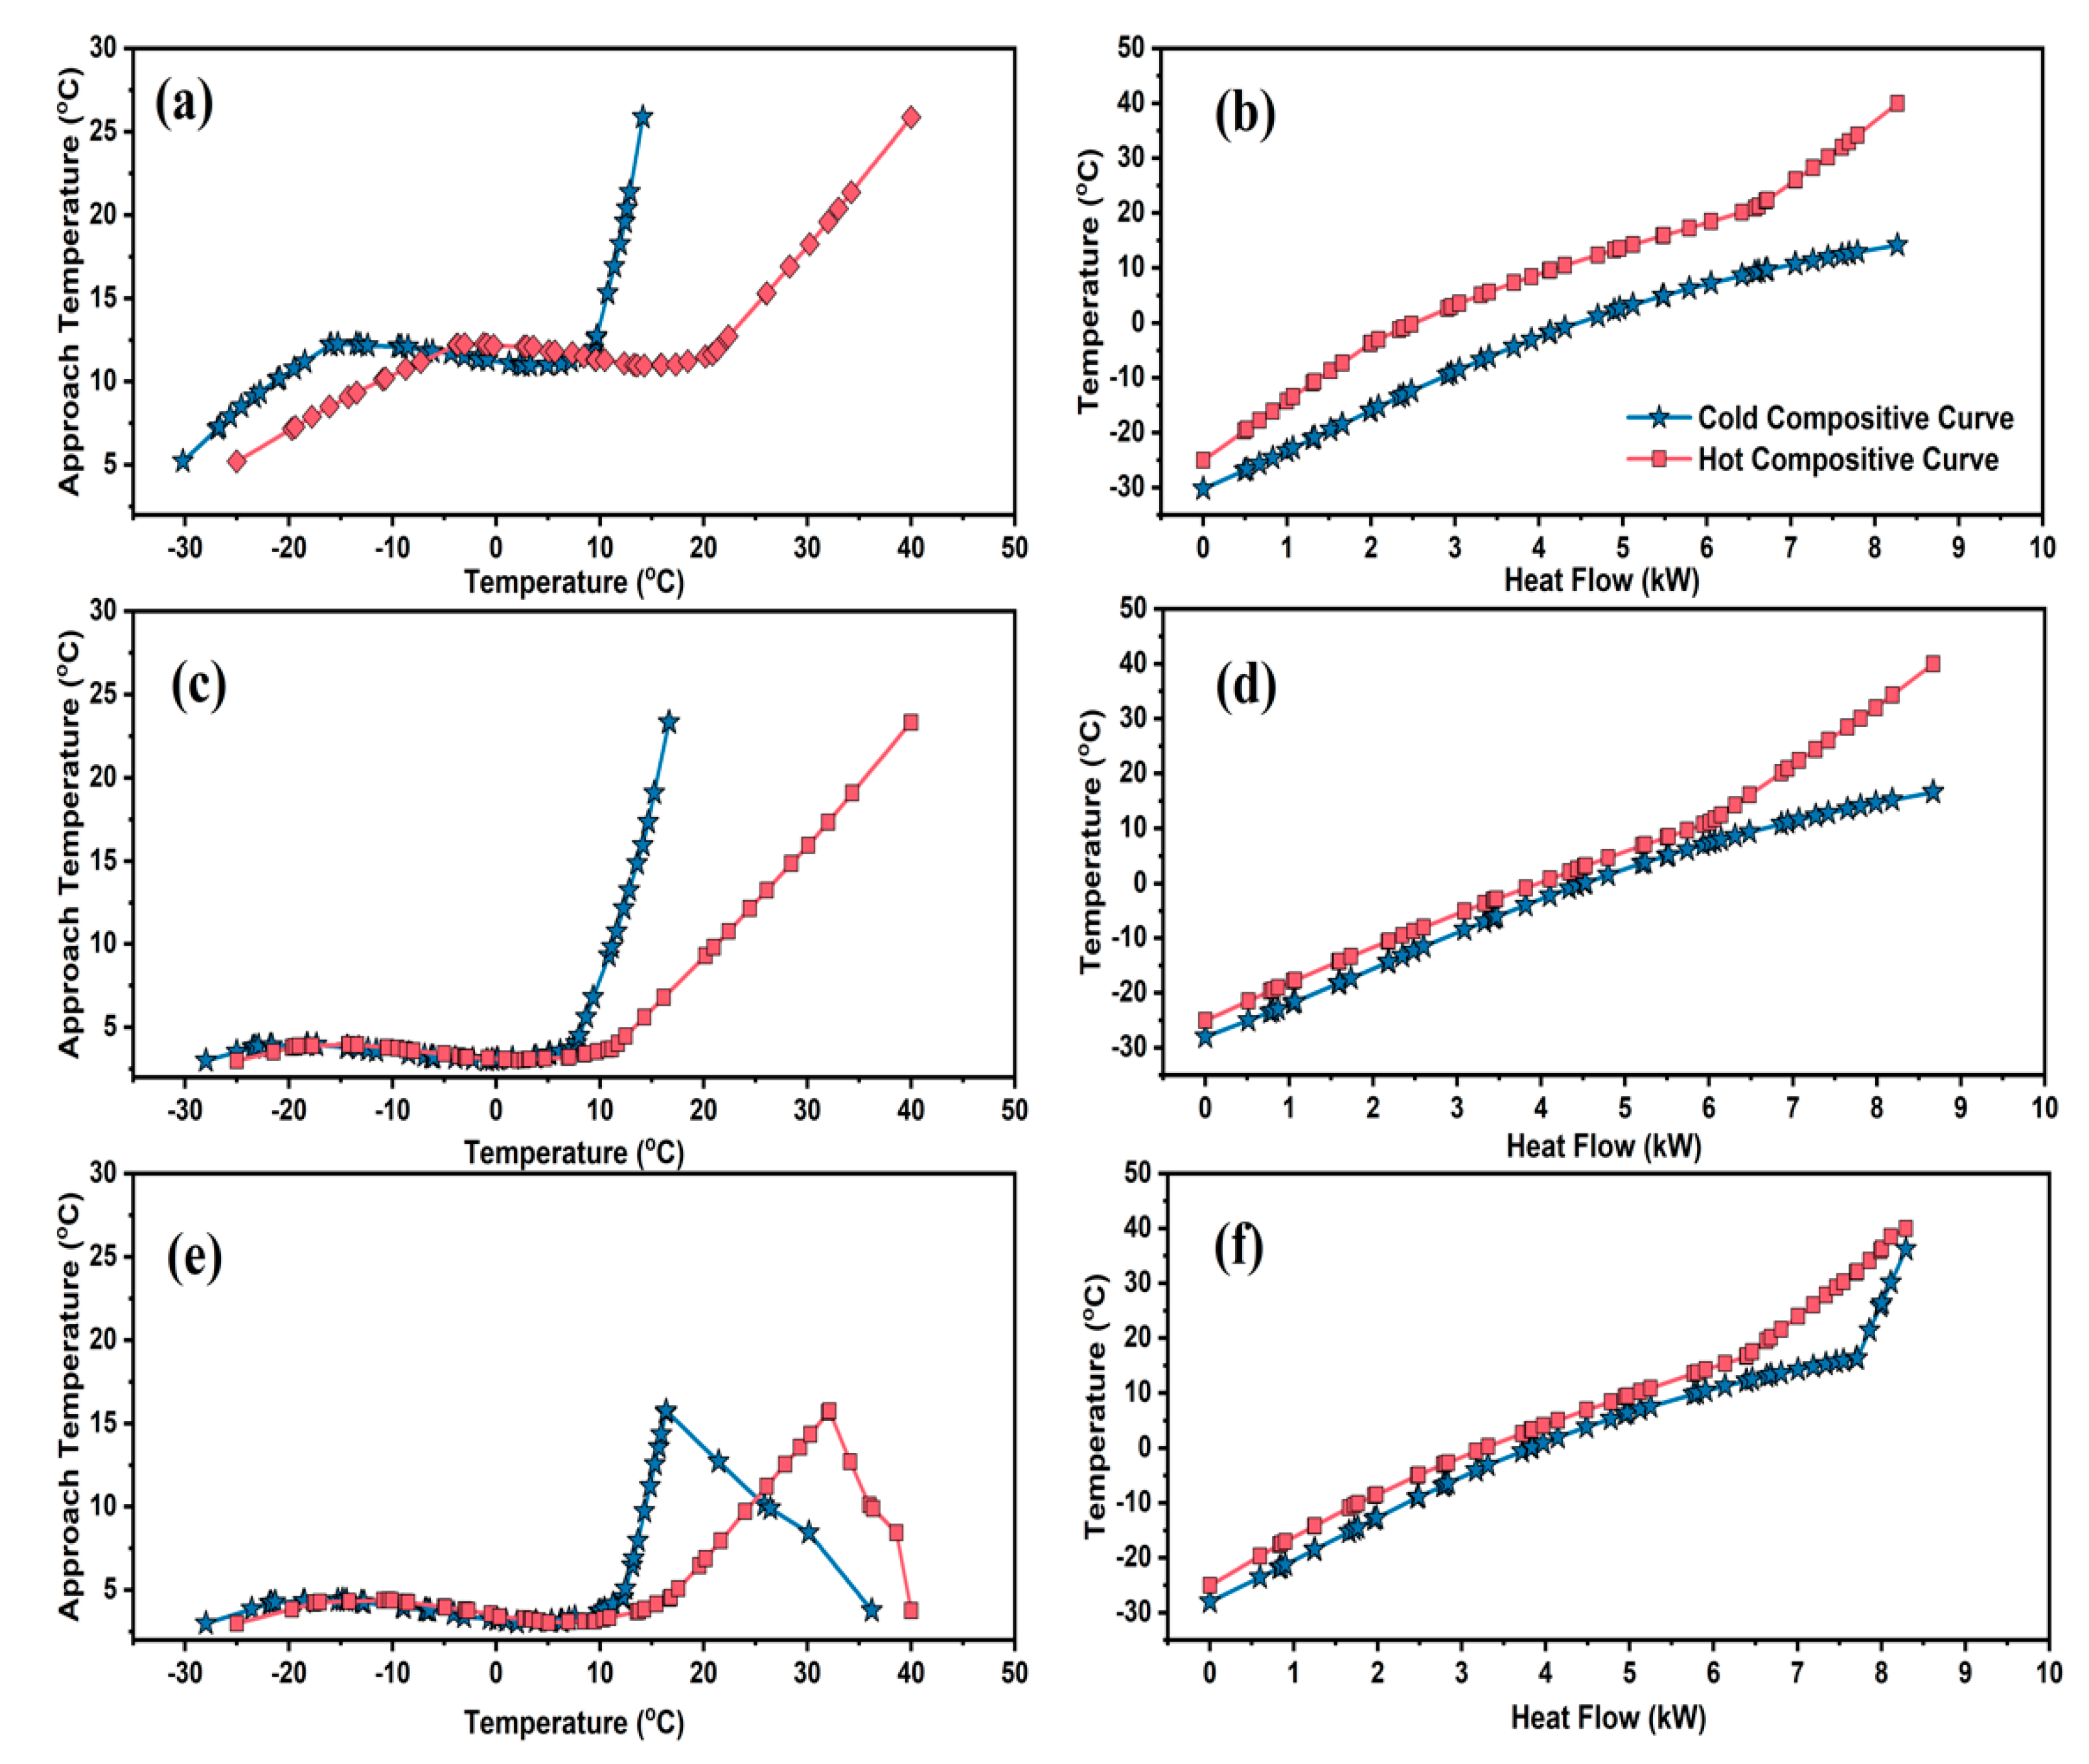
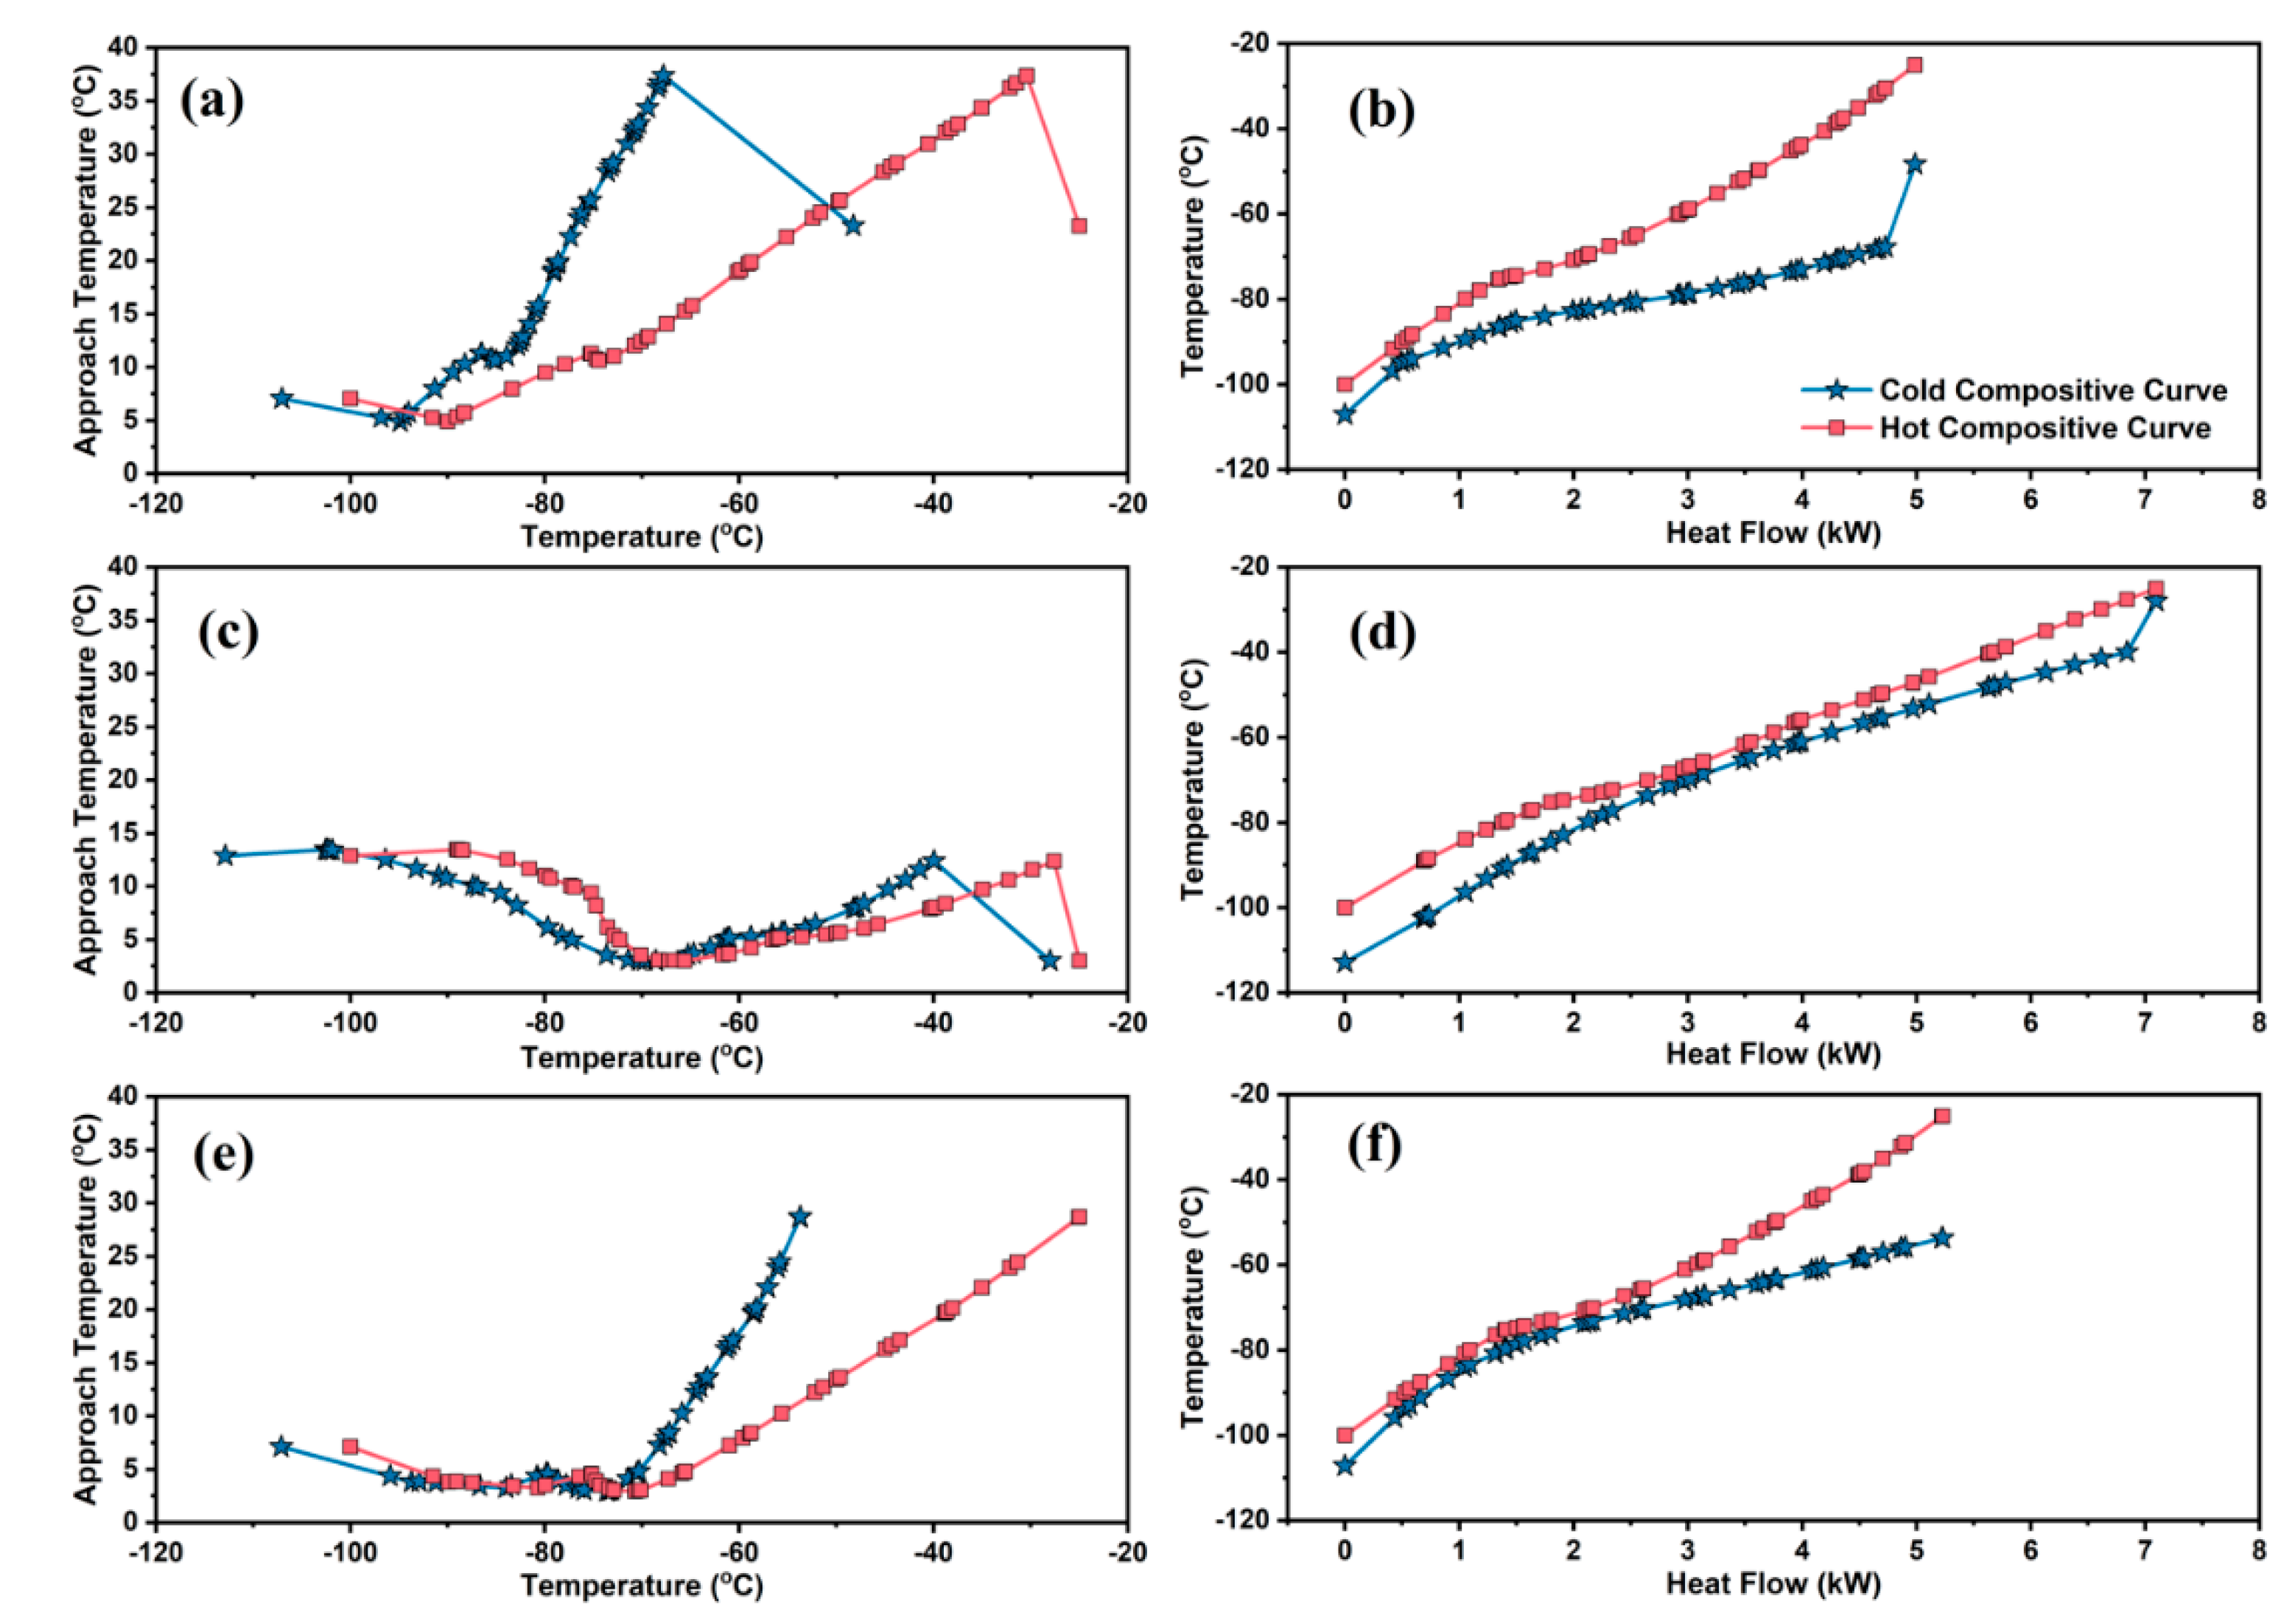
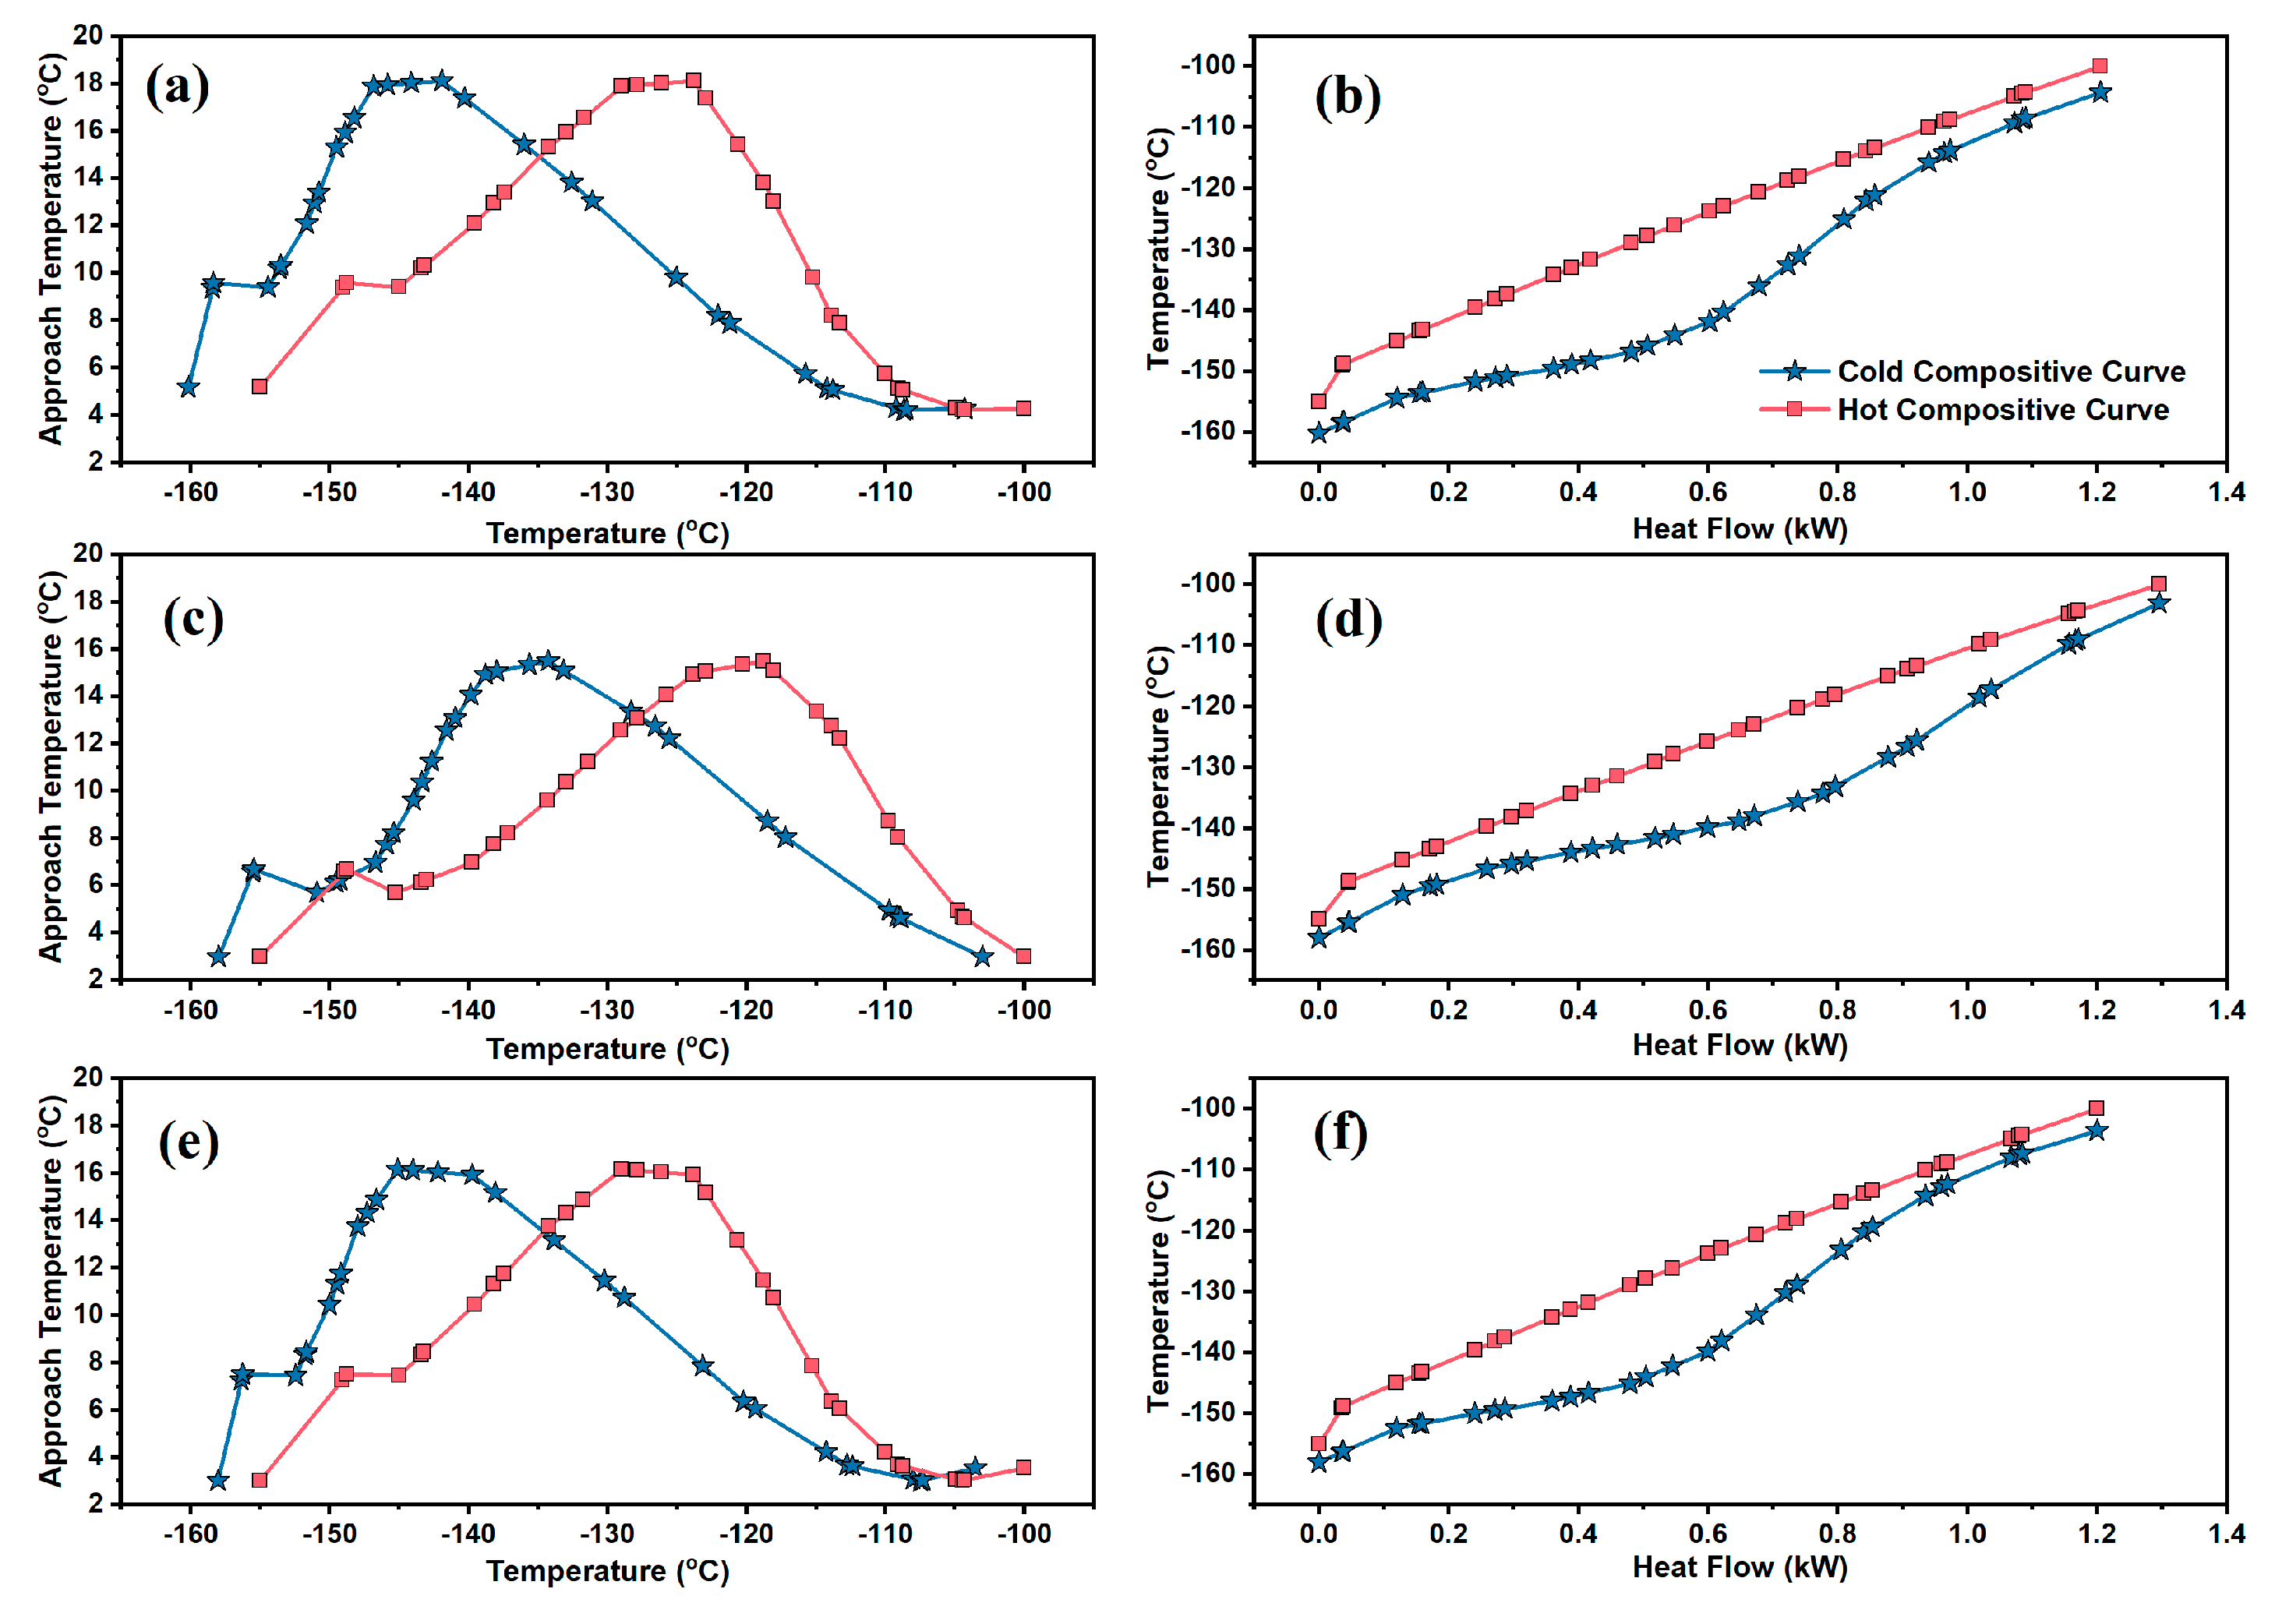
To evaluate the effect of SCE approach on the efficiency of cryogenic heat exchangers, TDCC and THCC of the base case and SCE-optimized processes are shown in Figure 4, Figure 5 and Figure 6 for LNG-100, LNG-101 and LNG-102, respectively.

5.1. Pre-Cooling Cycle Composite Curves

Pre-cooling regime composite curves corresponding to LNG-100 are shown in Figure 4. A larger gap and minimum approach temperature larger than 5 °C are evident from Figure 4a. In addition to the larger gaps between composite curves, the curves started deviating from each other as well, at the hot end. The former represents an optimization opportunity to reduce the gap by tuning the individual refrigerant flow rates using the new constraint of 3 °C MITA. A close approach temperature between the hot and cold streams leads to efficient cooling of NG.
TDCC and THCC for SCE-optimized process corresponding to 300 and 700 iterations are shown in Figure 4c,e and Figure 4d,f, respectively. It is obvious from the comparison of THCC and TDCC that the difference between optimized curves is lesser than that of the base case. In addition to this reduced gap, the curves come close to each other again after some deviation. A comparable gap for TDCC; and the reduced gap in center and re-joining the curves at hot end of THCC suggest that the optimized process has an efficient heat flow, and ultimately improved the thermodynamic performance. Given that the generation of low temperatures costs more energy, a minimum gap between THCC leads to enhanced exergy efficiency especially at low-temperature ends, as confirmed by Figure 4.

5.2. Liquefaction Cycle Composite Curves

Figure 5 depicts the liquefaction regime composite curves corresponding to LNG-101. The regime temperature ranges from −110 °C to −30 °C. In Figure 5a,b, the higher gap between TDCC and THCC; the minimum approach temperature greater than 5 and nonuniform heat flow present an optimization opportunity to reduce the gaps by optimizing the flow rates of the refrigerants and their composition. Non-uniform approach temperature and heat flow over a larger length of the exchanger, in general and non-optimal execution in the temperature range of −85 °C to −50 °C, in particular, suggests that another refrigerant with a boiling point in this temperature range should be incorporated in the MR. Non uniform approach temperature is also an indicator of nonuniform heat flow and poor thermodynamic efficiency. Poor thermodynamic efficiency of base case is evident based on Figure 5b, due to the larger gap between THCC. However, SCE-optimized TDCC and THCC exhibit smaller gaps. This is indicative of higher exergy efficiency as compared to base case, as shown in Figure 5c–f.

5.3. Sub-Cooling Cycle Composite Curves

TDCC and THCC for the base case and SCE process for the sub-cooling regime are shown in Figure 6. The regime temperature ranges from −160 °C to −100 °C with a minimum approach temperature at the hot end. A larger gap between TDCC and THCC of the base case suggest an optimization opportunity for energy saving.
After optimization, the gap between the TDCC and THCC was reduced in comparison to the base case and the curves come closer to each other. In addition, a minimum approach temperature and efficient heat transfer occurred at the ends of the exchanger. For these exceptions with a minimum approach temperature, a major part of the length of the exchanger depicted non-optimal execution. Consequently, THCC exhibits higher gaps in composite curves, which lead to exergy destruction.
It is quite apparent from Figure 4, Figure 5 and Figure 6 that the gap between the optimized process composite curves is smaller than that of the base case, and the curves approach each other after optimization. In addition, the smallest temperature difference is observed for the pre-cooling regime and the largest for the sub-cooling regime. Given that the temperature difference plays a major role in minimizing irreversibility, the pre-cooling regime is the major contributor in minimizing the irreversibility of the entire process, and thus the optimized process becomes more energy efficient than the base case.

6. Thermodynamic Performance: Exergy Analysis and Figure of Merit

Exergy analysis and figure of merit (FOM) are pertinent attributes when describing and comparing the thermodynamic performance of liquefaction and refrigeration systems [39]. Exergy analysis of a system reveals its work potential, considering environmental parameters as the reference state. The analysis provides an opportunity not only to evaluate the thermodynamic performance of a cryogenic system, but also identifies possible improvement in the performance of each inescapable equipment.
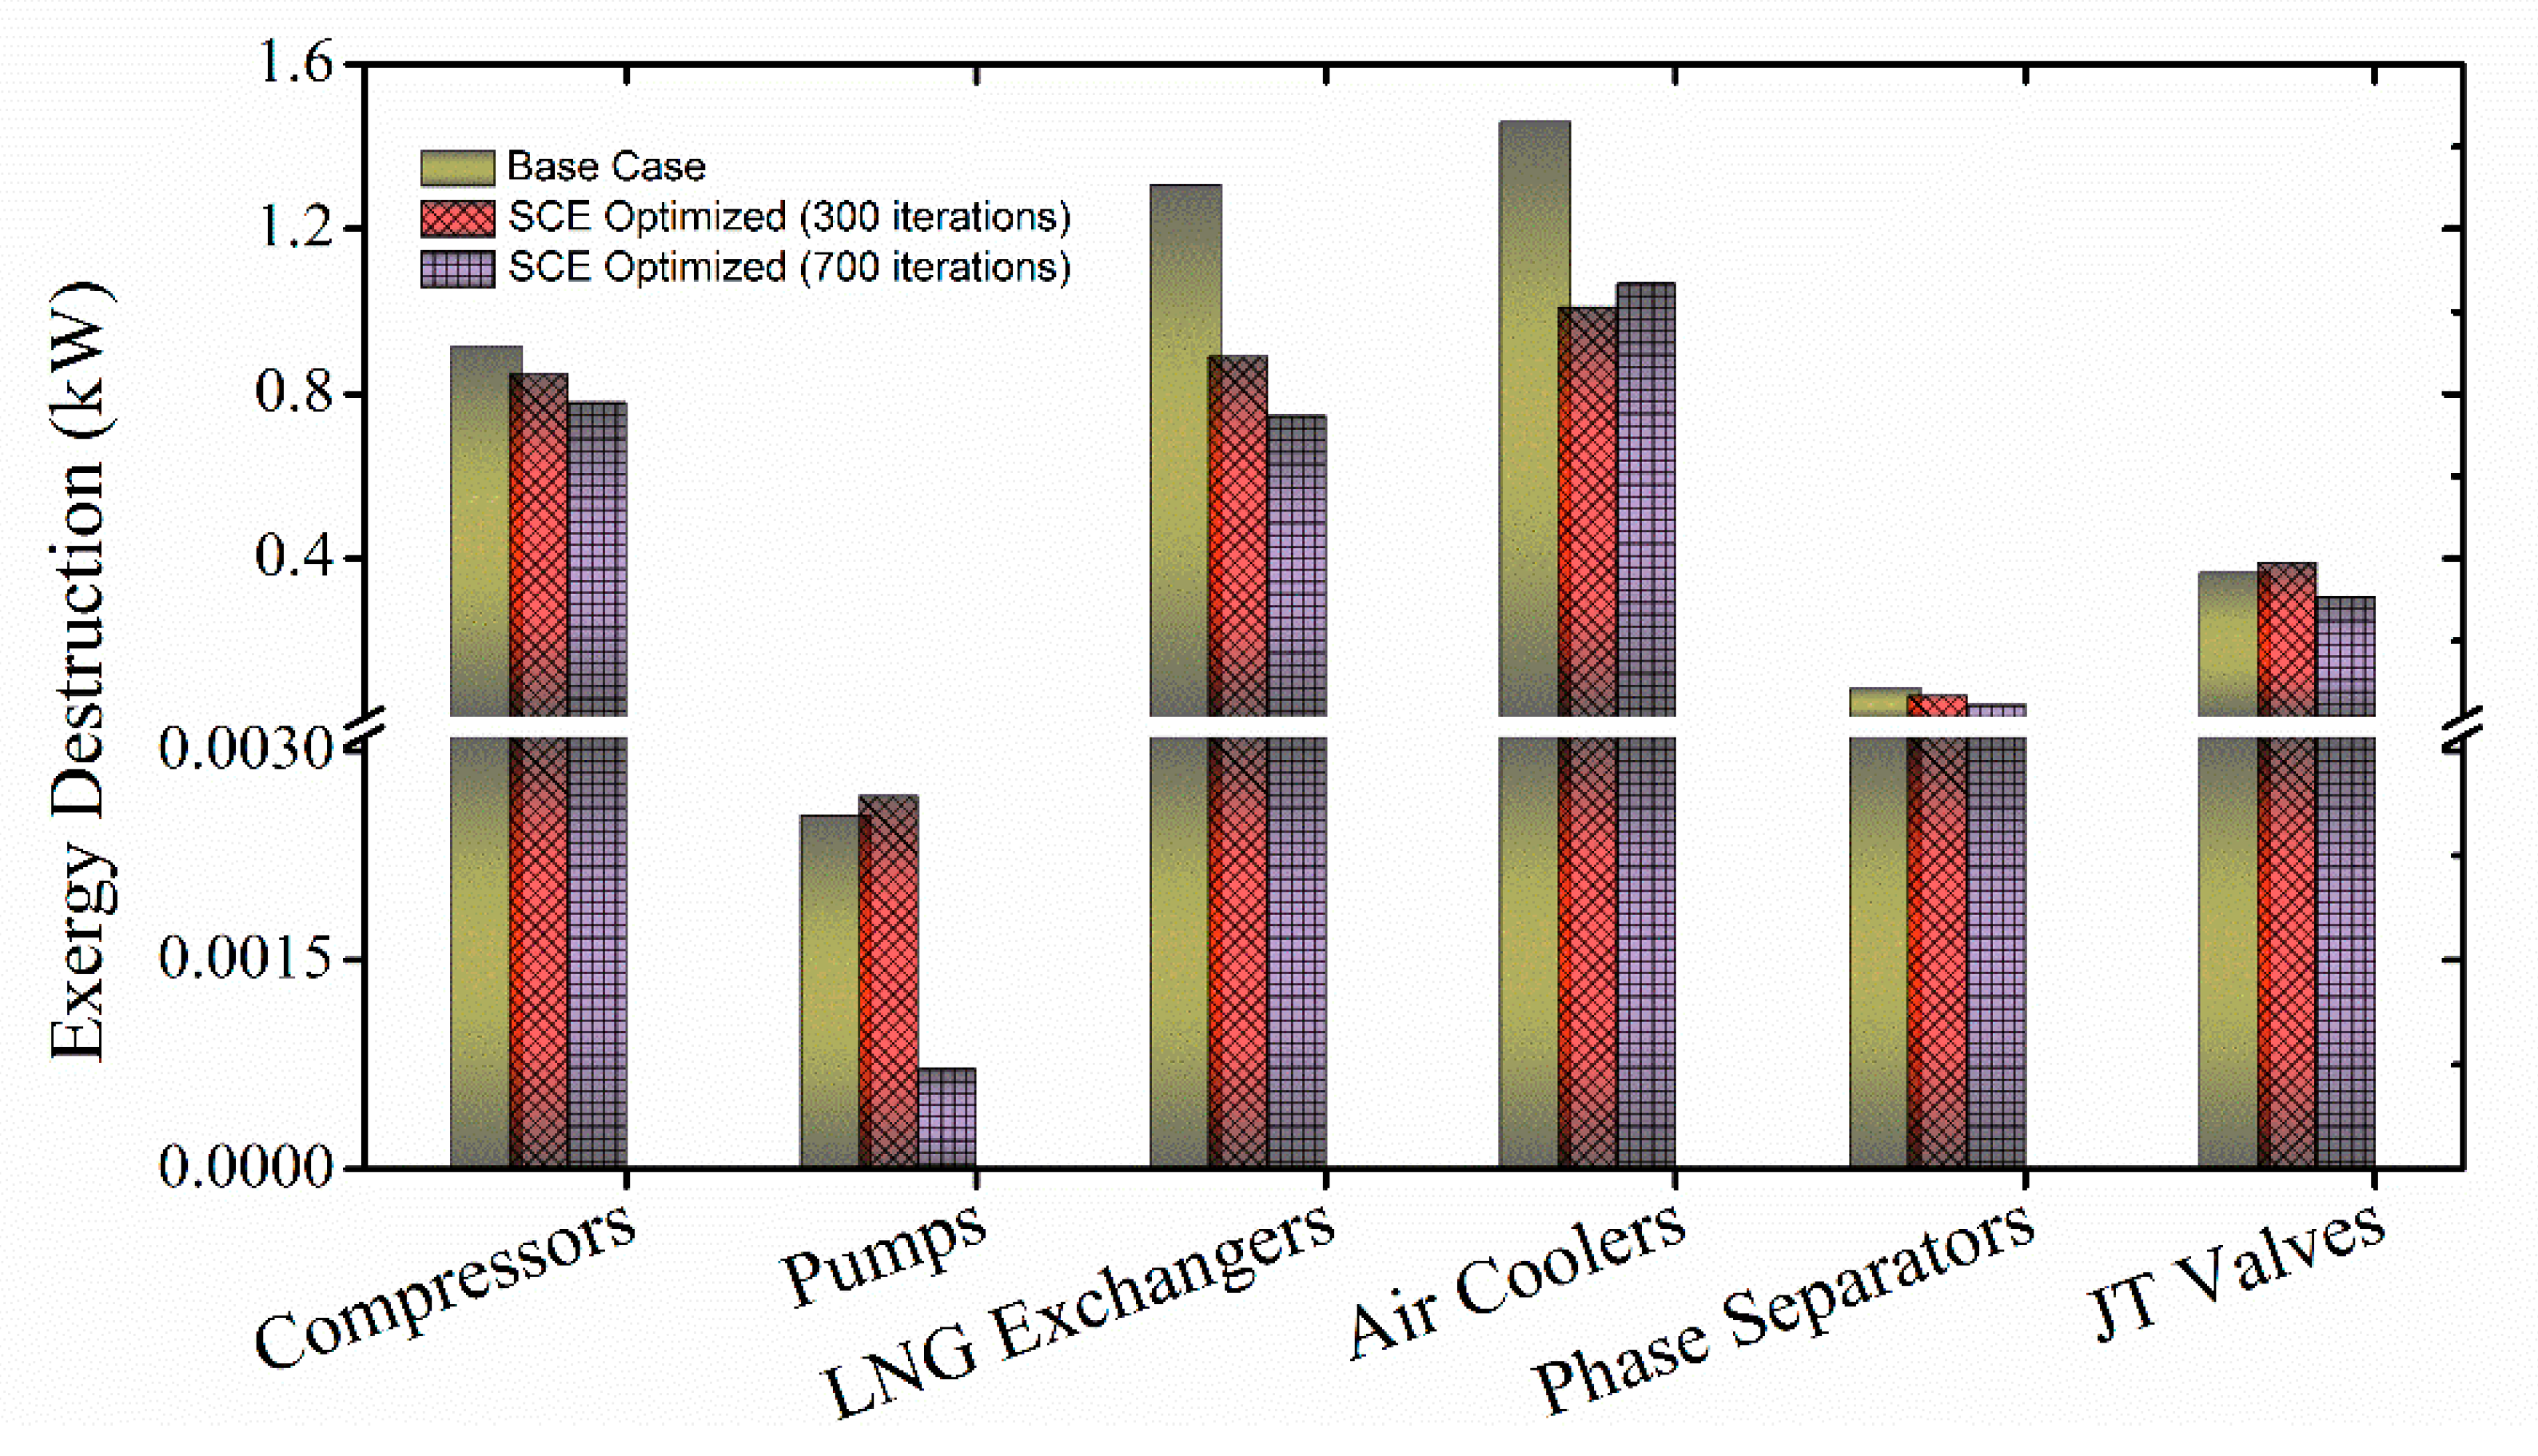
In general, exergy analysis of a system is conducted to highlight the destruction that occur in the entire system and in each inescapable equipment of the process in particular. In this study, the exergy destruction of each amenity that is intrinsic to the MFC–LNG process is calculated based on exergy balance equations adopted from Venkatarathnam and Timmerhaus [21] and are provided in Table 5. The exergy destruction results associated with each of the MFC–LNG equipment are detailed in Table 6. In addition, this integrated exergy destruction for each amenity in the SCE-optimized MFC–LNG process are depicted in Figure 7.
Exergy analysis of the base case and SCE-optimized process corresponding to distinct iterations revealed that the optimized process operates at a higher efficiency in comparison to the base case, as shown in Table 6. In addition, there is an improvement in the exergetic efficiency with an increase of the number of iterations. Overall process exergy destruction was minimized to around 22.4% and 28.8% corresponding to 300 and 700 iterations, respectively, when compared to the base case. The exergy results also revealed that the exergy destruction corresponding to different individual equipment’s intrinsic to the MFC–LNG process are lower for the optimized process. Given that the SCE improvement potential continues to increase with the increasing number of iterations, the SCE-optimized system corresponding to 300 iterations has 22.39% less exergy destruction compared to the base case. Increasing the number of iterations increases the computational time and consequently the overall cost but results in a reduction of the exergy destruction. These findings confirm that there is a trade-off between exergetic efficiency and computational cost.
A percentage wise breakdown of the exergy destruction by each physical equipment associated with the MFC–LNG process is depicted in Figure 7.
The main sources of exergy destruction are air coolers, compressors and LNG-exchangers. During the process of heat exchange, entropy generation could have different origins including heat transfer between hot and cold fluids, the exchanger and its surrounding and fluid movement. The temperature difference between the hot and cold fluid is another source of exergy destruction in the process of heat exchange [40].
The FOM is considered to be an important index in describing the thermodynamic efficiency of a liquefaction process because it provides insight into the overall exergy efficiency [41]. It characterizes the thermodynamic efficiency of a liquefaction process using the Carnot refrigeration cycle (ideal liquefaction process) in terms of the work required to achieve liquefaction. Thus, the FOM of a liquefaction process is defined as the ratio of the ideal work Wi to the actual required work Wr for liquefaction, which can be described by Equation (3):
F O M = W i W r
The thermodynamic efficiency can be described in terms of FOM, exergy efficiency, percent Carnot and thermodynamic limit [21,42,43]. Thermodynamically, an ideal liquefaction process gives rise to ideal work (minimum work), whereas actual work is used in actual and practical liquefaction processes. The minimum work required for liquefaction is the maximum work that can be achieved from a fluid when it follows reversible processes to reach equilibrium with its surroundings and can be expressed as follows:
W ˙ i = m ˙ L N G × ( E ˙ L N G ) m ˙ N G × ( E ˙ N G )
where m ˙ L N G and m ˙ N G are the mass flow rates of the product LNG and feed NG, respectively. In contrast, E ˙ L N G and E ˙ N G are the mass exergy rate of the product LNG and feed NG, respectively.
When the ambient temperature is 32 °C, the ideal work required to convert 17.82 kg/h NG to LNG via the liquefaction process is 1.955 kW. Due to irreversibility in actual (real) liquefaction systems, the actual work needed for liquefaction (conversion of NG to LNG) is always more than the ideal work. The actual required work and FOM (thermodynamic efficiency) for the base case and SCE-optimized MFC–LNG process are given in Table 7.
It is evident from Table 7 that the actual work requirement for the base case is 5.593 kW, including approximately 67% work lost (difference between actual work and ideal work [44]). Given that the minimum reversible work requirement is 1.955 kW, the thermodynamic efficiency of the base case is only 32.8%. Optimization of the refrigerant composition and their flow rates resulted in a significant reduction in the actual work requirement, which also reduced the work destruction and increased the thermodynamic efficiency. MFC_SCE-300 is around 6% thermodynamically efficient compared to the base case with 18% relative improvement in the thermodynamic efficiency. The results also revealed that the thermodynamic efficiency continued to increase with an increase in the number of iterations. The thermodynamic efficiency of MFC_SCE-700 increased to 41%, with 25% relative improvement in energy saving.

7. Conclusions

Highly interacting and nonlinear thermodynamic interactions in the MFC–LNG process are unavoidable due to the use of MR, which poses a challenge with respect to their optimization. To achieve near-optimal solutions, various optimization methods have been proposed and attempted. In this study, an evolutionary approach is adopted to optimize key decision variables that satisfy constraints on the approach temperature. Shuffled complex evolution (SCE) was coupled with Aspen Hysys and applied to the MFC–LNG process to minimize the energy requirements by enhancing its thermodynamic efficiency. The SCE-optimized MFC process corresponding to 700 iterations consumes 19.76% less energy as compared to the base case. The exergy destruction was reduced from 4.1304 to 2.9425 kW, which represented a 28.76% reduction. Overall, thermodynamic analysis (figure of merit) revealed that the SCE-optimized process that corresponded to 700 iterations has a 25% higher thermodynamic efficiency than the base case. Conclusively, the SCE approach has a potential to improve the performance of mixed refrigerant-based LNG as well as other high dimensional and complex processes through sole design optimization.

Author Contributions

Conceptualization, K.M. and M.A.Q.; methodology, A.A.; software, M.A.Q.; formal analysis, A.N.; investigation, K.M. and M.A.Q.; writing—original draft preparation, K.M. and M.A.Q.; project administration, M.N.; writing—review and editing, T.H.; supervision, M.L. All authors have read and agreed to the published version of the manuscript.

Funding

This work was supported by the Priority Research Centers Program through the National Research Foundation (NRF) of Korea funded by the Ministry of Education (2014R1A6A1031189). This work was also supported by the project ZR2019QEE020 supported by the Shandong Provincial Natural Science Foundation, China.

Conflicts of Interest

The authors declare no conflict of interest.

Nomenclature

f Objective function
ExinExergy in
ExoutExergy out
NGNatural gas
TTemperature (°C)
PPressure (bar)
MRMixed refrigerant
MFC_SCE-XSCE-optimized MFC process corresponding to X iterations
Subscripts
SCEShuffled complex evolution
CCECompetitive complex evolution
Iith compressor
veNegative
+vePositive
Abbreviations
N2Nitrogen
C1Methane
C2Ethane
C3Propane
nC4n-butane
MMass flow rate (kg/h)
TCFTrillion cubic feet
MFCMixed fluid cascade
LNGLiquefied natural gas
TDCCTemperature difference composite curves
THCCTemperature-heat flow composite curves
DMRDual mixed refrigerant
JTVJoule–Thomson valve
C3MRPropane precooled mixed refrigerant
Wiith compressor work
DMRDual mixed refrigerant
XiKey design variables
SMRSingle mixed refrigerant
kWKilowatt
MITAMinimum internal temperature approach

References

  1. Perego, C.; Bortolo, R.; Zennaro, R. Gas to liquids technologies for natural gas reserves valorization: The Eni experience. Catal. Today 2009, 142, 9–16. [Google Scholar] [CrossRef]
  2. Lee, I.; Park, J.; Moon, I. Key Issues and Challenges on the Liquefied Natural Gas Value Chain: A Review from the Process Systems Engineering Point of View. Ind. Eng. Chem. Res. 2018, 57, 5805–5818. [Google Scholar] [CrossRef]
  3. Çengel, Y.A. Power generation potential of liquified natural gas regasification terminals. Int. J. Energy Res. 2020, 44, 3241–3252. [Google Scholar] [CrossRef]
  4. Chai, J.; Liang, T.; Lai, K.K.; Zhang, Z.G.; Wang, S. The future natural gas consumption in China: Based on the LMDI-STIRPAT-PLSR framework and scenario analysis. Energy Policy 2018, 119, 215–225. [Google Scholar] [CrossRef]
  5. Wang, J.; Jiang, H.; Zhou, Q.; Wu, J.; Qin, S. China’s natural gas production and consumption analysis based on the multicycle Hubbert model and rolling Grey model. Renew. Sustain. Energy Rev. 2016, 53, 1149–1167. [Google Scholar] [CrossRef]
  6. Vivoda, V. LNG import diversification in Asia. Energy Strateg. Rev. 2014, 2, 289–297. [Google Scholar] [CrossRef]
  7. Böhringer, C. The Kyoto protocol: A review and perspectives. Oxf. Rev. Econ. Policy 2003, 19, 451–466. [Google Scholar] [CrossRef]
  8. Abas, N.; Kalair, A.; Khan, N. Review of fossil fuels and future energy technologies. Futures 2015, 69, 31–49. [Google Scholar] [CrossRef]
  9. Economides, M.J.; Wood, D.A. The state of natural gas. J. Nat. Gas Sci. Eng. 2009, 1, 1–13. [Google Scholar] [CrossRef]
  10. He, T.; Chong, Z.R.; Zheng, J.; Ju, Y.; Linga, P. LNG cold energy utilization: Prospects and challenges. Energy 2019, 557–568. [Google Scholar] [CrossRef]
  11. Van Nguyen, T.; Rothuizen, E.D.; Markussen, W.B.; Elmegaard, B. Thermodynamic comparison of three small-scale gas liquefaction systems. Appl. Therm. Eng. 2018, 128, 712–724. [Google Scholar] [CrossRef] [Green Version]
  12. Mehrpooya, M.; Sadaghiani, M.S.; Hedayat, N. A novel integrated hydrogen and natural gas liquefaction process using two multistage mixed refrigerant refrigeration systems. Int. J. Energy Res. 2019, 44, 1636–1653. [Google Scholar] [CrossRef]
  13. Qyyum, M.A.; Ali, W.; Hussain, A.; Bahadori, A.; Lee, M. Feasibility study of environmental relative humidity through the thermodynamic effects on the performance of natural gas liquefaction process. Appl. Therm. Eng. 2018, 128, 51–63. [Google Scholar] [CrossRef]
  14. He, T.; Mao, N.; Liu, Z.; Qyyum, M.A.; Lee, M.; Pravez, A.M. Impact of mixed refrigerant selection on energy and exergy performance of natural gas liquefaction processes. Energy 2020, 199, 117378. [Google Scholar] [CrossRef]
  15. Khan, M.S.; Lee, S.; Rangaiah, G.P.; Lee, M. Knowledge based decision making method for the selection of mixed refrigerant systems for energy efficient LNG processes. Appl. Energy 2013, 111, 1018–1031. [Google Scholar] [CrossRef]
  16. Qyyum, M.A.; Qadeer, K.; Lee, M. Comprehensive Review of the Design Optimization of Natural Gas Liquefaction Processes: Current Status and Perspectives. Ind. Eng. Chem. Res. 2018, 57, 5819–5844. [Google Scholar] [CrossRef]
  17. Zhang, J.; Meerman, H.; Benders, R.; Faaij, A. Comprehensive review of current natural gas liquefaction processes on technical and economic performance. Appl. Therm. Eng. 2020, 166, 114736. [Google Scholar] [CrossRef]
  18. Qyyum, M.A.; He, T.; Qadeer, K.; Mao, N.; Lee, S.; Lee, M. Dual-effect single-mixed refrigeration cycle: An innovative alternative process for energy-efficient and cost-effective natural gas liquefaction. Appl. Energy 2020, 268, 115022. [Google Scholar] [CrossRef]
  19. He, T.; Liu, Z.; Ju, Y.; Parvez, A.M. A comprehensive optimization and comparison of modified single mixed refrigerant and parallel nitrogen expansion liquefaction process for small-scale mobile LNG plant. Energy 2019, 167, 1–12. [Google Scholar] [CrossRef]
  20. Lim, W.; Choi, K.; Moon, I. Current Status and Perspectives of Liquefied Natural Gas (LNG) Plant Design. Ind. Eng. Chem. Res. 2013, 52, 3065–3088. [Google Scholar] [CrossRef]
  21. Venkatarathnam, G.; Timmerhaus, K.D. Cryogenic Mixed Refrigerant Processes; Springer: New York, NY, USA, 2008. [Google Scholar]
  22. He, T.; Karimi, I.A.; Ju, Y. Review on the design and optimization of natural gas liquefaction processes for onshore and offshore applications. Chem. Eng. Res. Des. 2018, 132, 89–114. [Google Scholar] [CrossRef]
  23. Vatani, A.; Mehrpooya, M.; Palizdar, A. Energy and exergy analyses of five conventional liquefied natural gas processes. Int. J. energy Res. 2014, 38, 1843–1863. [Google Scholar] [CrossRef]
  24. Qyyum, M.A.; Lee, M. Hydrofluoroolefin-based novel mixed refrigerant for energy efficient and ecological LNG production. Energy 2018, 157, 483–492. [Google Scholar] [CrossRef]
  25. Ding, H.; Sun, H.; Sun, S.; Chen, C. Analysis and optimisation of a mixed fluid cascade (MFC) process. Cryogenics 2017, 83, 35–49. [Google Scholar] [CrossRef]
  26. Nawaz, A.; Qyyum, M.A.; Qadeer, K.; Khan, M.S.; Ahmad, A.; Lee, S.; Lee, M. Optimization of mixed fluid cascade LNG process using a multivariate Coggins step-up approach: Overall compression power reduction and exergy loss analysis. Int. J. Refrig. 2019, 104, 189–200. [Google Scholar] [CrossRef]
  27. Ghorbani, B.; Hamedi, M.-H.; Amidpour, M.; Mehrpooya, M. Cascade refrigeration systems in integrated cryogenic natural gas process (natural gas liquids (NGL), liquefied natural gas (LNG) and nitrogen rejection unit (NRU)). Energy 2016, 115, 88–106. [Google Scholar] [CrossRef]
  28. Mehrpooya, M.; Omidi, M.; Vatani, A. Novel mixed fluid cascade natural gas liquefaction process configuration using absorption refrigeration system. Appl. Therm. Eng. 2016, 98, 591–604. [Google Scholar] [CrossRef]
  29. Ghorbani, B.; Shirmohammadi, R.; Mehrpooya, M. A novel energy efficient LNG/NGL recovery process using absorption and mixed refrigerant refrigeration cycles–Economic and exergy analyses. Appl. Therm. Eng. 2018, 132, 283–295. [Google Scholar] [CrossRef]
  30. Lin, W.; Xiong, X.; Spitoni, M.; Gu, A. Design and Optimization of Pressurized Liquefaction Processes for Offshore Natural Gas Using Two-Stage Cascade Refrigeration Cycles. Ind. Eng. Chem. Res. 2018, 57, 5858–5867. [Google Scholar] [CrossRef]
  31. Brodal, E.; Jackson, S.; Eiksund, O. Performance and design study of optimized LNG Mixed Fluid Cascade processes. Energy 2019, 189, 116207. [Google Scholar] [CrossRef]
  32. Qyyum, M.A.; Ali, W.; Long, N.V.D.; Khan, M.S.; Lee, M. Energy efficiency enhancement of a single mixed refrigerant LNG process using a novel hydraulic turbine. Energy 2018, 144, 968–976. [Google Scholar] [CrossRef]
  33. Kamalinejad, M.; Amidpour, M.; Naeynian, S.M.M. Thermodynamic design of a cascade refrigeration system of liquefied natural gas by applying mixed integer non-linear programming. Chin. J. Chem. Eng. 2015, 23, 998–1008. [Google Scholar] [CrossRef]
  34. Holland, J.H. Adaptation in Natural and Artificial Systems: An Introductory Analysis with Applications to Biology, Control, and Artificial Intelligence; MIT Press: Cambridge, MA, USA, 1992; ISBN 0262581116. [Google Scholar]
  35. Duan, Q.; Sorooshian, S.; Gupta, V. Effective and efficient global optimization for conceptual rainfall-runoff models. Water Resour. Res. 1992, 28, 1015–1031. [Google Scholar] [CrossRef]
  36. Hatcher, P.; Khalilpour, R.; Abbas, A. Optimisation of LNG mixed-refrigerant processes considering operation and design objectives. Comput. Chem. Eng. 2012, 41, 123–133. [Google Scholar] [CrossRef]
  37. Qyyum, M.A.; Qadeer, K.; Lee, S.; Lee, M. Innovative propane-nitrogen two-phase expander refrigeration cycle for energy-efficient and low-global warming potential LNG production. Appl. Therm. Eng. 2018, 139, 157–165. [Google Scholar] [CrossRef]
  38. Qadeer, K.; Qyyum, M.A.; Lee, M. Krill-Herd-Based Investigation for Energy Saving Opportunities in Offshore Liquefied Natural Gas Processes. Ind. Eng. Chem. Res. 2018, 57, 14162–14172. [Google Scholar] [CrossRef]
  39. Doohan, R.S.; Kush, P.K.; Maheshwari, G. Exergy based optimization and experimental evaluation of plate fin heat exchanger. Appl. Therm. Eng. 2016, 102, 80–90. [Google Scholar] [CrossRef]
  40. Wang, H.; Peterson, R.; Harada, K.; Miller, E.; Ingram-Goble, R.; Fisher, L.; Yih, J.; Ward, C. Performance of a combined organic Rankine cycle and vapor compression cycle for heat activated cooling. Energy 2011, 36, 447–458. [Google Scholar] [CrossRef]
  41. He, T.; Ju, Y. Optimal synthesis of expansion liquefaction cycle for distributed-scale LNG (liquefied natural gas) plant. Energy 2015, 88, 268–280. [Google Scholar] [CrossRef]
  42. Wood, M.E.; Potter, W.H. General analysis of magnetic refrigeration and its optimization using a new concept: Maximization of refrigerant capacity. Cryogenics 1985, 25, 667–683. [Google Scholar] [CrossRef]
  43. Iwasaki, W. Magnetic refrigeration technology for an international clean energy network using hydrogen energy (WE-NET). Int. J. Hydrogen Energy 2003, 28, 559–567. [Google Scholar] [CrossRef]
  44. Mokarizadeh Haghighi Shirazi, M.; Mowla, D. Energy optimization for liquefaction process of natural gas in peak shaving plant. Energy 2010, 35, 2878–2885. [Google Scholar] [CrossRef]
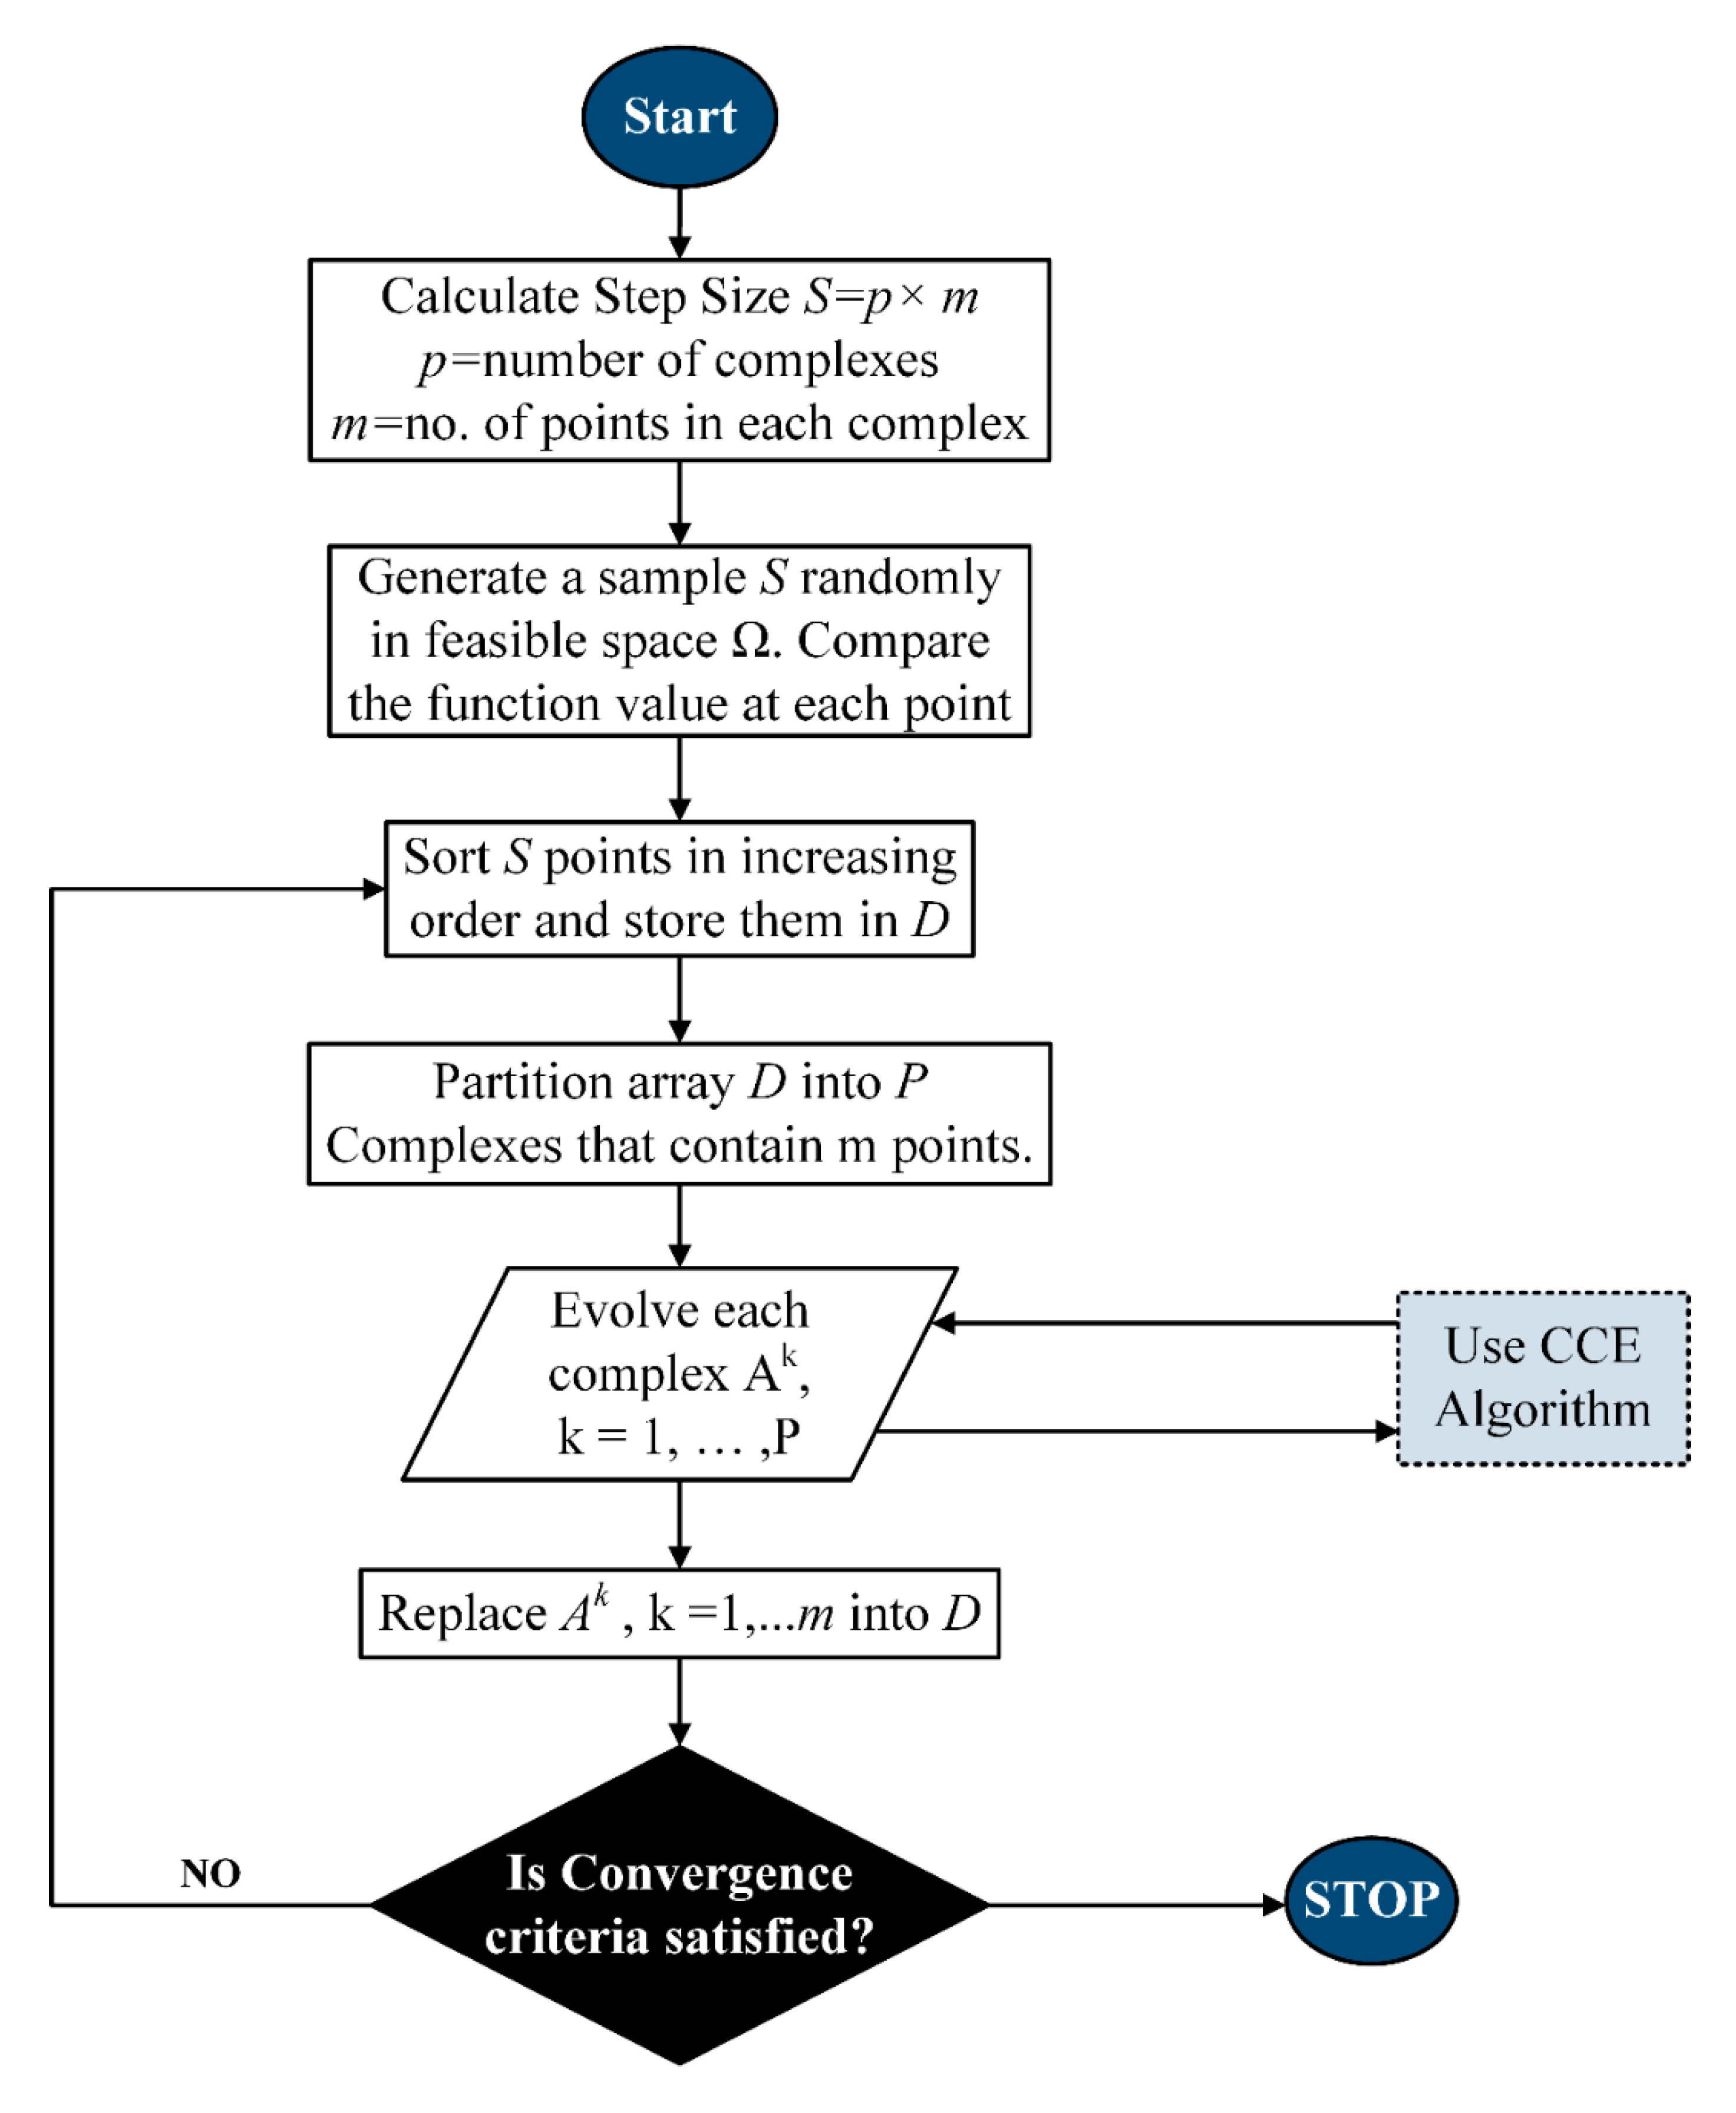
Figure 1. Flow chart of the shuffled complex method.
Energies 13 02511 g001
Figure 2. Flowchart of the competitive complex evolution (CCE) method.
Energies 13 02511 g002
Figure 3. Schematic representation of MFC–LNG process [25,26].
Energies 13 02511 g003
Figure 4. TDCC and THCC of (a) and (b) the base case, (c) and (d) SCE-optimized process corresponding to 300 iterations and (e) and (f) SCE-optimized process corresponding to 700 iterations, for the pre-cooling heat exchanger of MFC–LNG process.
Energies 13 02511 g004
Figure 5. Temperature difference composite curves (TDCC) and temperature–heat flow composite curves (THCC) of (a) and (b) the base case, (c) and (d) SCE optimized process corresponding to 300 iterations and (e) and (f) SCE-optimized process corresponding to 700 iterations, for the liquefaction heat exchanger of MFC–LNG process.
Energies 13 02511 g005
Figure 6. TDCC and THCC of (a) and (b) the base case, (c) and (d) SCE-optimized process corresponding to 300 iterations and (e) and (f) SCE-optimized process corresponding to 700 iterations, for the sub-cooling heat exchanger of MFC–LNG process.
Energies 13 02511 g006
Figure 7. Disintegrated exergy destruction (%) for the base case and SCE-optimized MFC–LNG process.
Energies 13 02511 g007
Table 1. Feed NG conditions.
PropertyValue
T (°C)32
P (bar)50
n ˙ (kmol/hr)1.0 (17.82 kg/h)
Composition (mol·%)
C191.35
C25.36
C32.14
i-C40.46
n-C40.47
i-C50.01
n-C50.01
N20.20
Table 2. Objective function, constraint and decision variables with their limits.
Objective Function:
Specific energy consumption (kWh/kg-NG) M i n i m i z e   f ( X ) = M i n . ( i = 0 n W i m N G )
Constraint:
Minimum internal approach temperature (°C) Δ T min 1 ( X ) 3 ; Δ T min 2 ( X ) 3 ; Δ T min 3 ( X ) 3 ,
where,
X l b < X < X u b , and X is a vector of the design variables
Decision VariablesUnitsLower LimitUpper Limit
Precooling cycle
Evaporation pressure (stream 100-3)bar28
Condensation pressure (stream 100-8)bar1025
Ethane flow rate, m C 2 kg/h6.824.8
Propane flow rate, m C 3 kg/h9.528.0
n-butane flow rate, m n C 4 kg/h12.055.0
Liquefaction cycle
Evaporation pressure (stream 101-4)bar28
Condensation pressure (stream 101-9)bar1035
Methane flow rate, m C 1 kg/h2.27.5
Ethane flow rate, m C 2 kg/h10.035.0
Propane flow rate, m C 3 kg/h5.522.0
Sub-cooling cycle
Evaporation pressure (stream 102-5)bar28
Condensation pressure (stream 102-1)bar3560
Methane flow rate, m C 1 kg/h1.6235.5
Ethane flow rate, m C 2 kg/h1.7717.5
Nitrogen flow rate, m N 2 kg/h0.853.5
Table 3. Optimized values of decision variables and their impact of the objective function.
Decision VariablesUnitsBase CaseSCE-Optimized Process
No. of Iterations
300700
Precooling cycle
Evaporation pressure (stream 100-3)bar3.504.193.80
Condensation pressure (stream 100-8)bar25.0021.0919.10
Pressure ratio 7.145.035.03
Ethane flow rate, m C 2 kg/h15.0016.6912.51
Propane flow rate, m C 3 kg/h12.3616.0514.23
n-butane flow rate, m n c 4 kg/h42.0036.7532.89
Precooling MR flow ratekg/h69.3669.4959.63
Liquefaction cycle
Evaporation pressure (stream 101-4)bar1.425.172.49
Condensation pressure (stream 101-9)bar32.0031.5827.51
Pressure ratio 22.546.1111.05
Methane flow rate, m C 1 kg/h1.7509.993.02
Ethane flow rate, m C 2 kg/h23.9022.4022.87
Propane flow rate, m C 3 kg/h6.4912.149.29
Liquefaction MR flow ratekg/h32.1444.5335.18
Subcooling cycle
Evaporation pressure (stream 102-5)bar2.003.582.02
Condensation pressure (stream 102-9)bar58.0050.5049.90
Pressure ratio 29.0014.1124.70
Methane flow rate, m C 1 kg/h4.575.564.48
Ethane flow rate, m C 2 kg/h2.422.562.66
Nitrogen flow rate, m N 2 kg/h0.751.390.50
Subcooling MR flow ratekg/h7.749.517.64
MITA(X)LNG-100°C5.23.03.0
MITA(X)LNG-101°C4.93.03.0
MITA(X)LNG-102°C4.23.03.0
LNG liquid fraction 0.950.950.95
Total compression powerkW5.9535.0574.773
Specific compression powerkWh/kg0.3340.2840.268
Relative energy saving% 14.9719.76
Elapsed timeSec 17,84049,190
Table 4. Temperature and pressure for all streams of the studied MFC processes.
StreamsBase CaseMFC_300MFC_700
T (°C)P (bar)T (°C)P (bar)T (°C)P (bar)
100−014024.44020.494018.5
100−02−2523.4−2519.49−2517.5
100−03−30.223.5−284.193−283.802
100−0414.133.416.664.09336.223.702
100−0514.133.416.664.09336.223.702
100−0614.133.416.664.09336.223.702
100−0715.72517.9421.0937.5219.1
100−08105.92593.1621.0911019.1
100−094024.74020.794018.8
100−1038.324.740.5220.794018.8
100−114024.44020.494018.5
101−014031.74031.2835.9827.21
101−02−2530.7−2530.28−2526.21
101−03−10029.7−10029.28−10025.21
101−04−1071.42−112.95.167−107.12.492
101−05−48.261.32−28.025.067−53.72.392
101−06−48.451.22−28.164.967−54.562.292
101−07−48.451.22−28.164.967−54.562.292
101−08−46.4732−26.1531.58−52.8827.51
101−09138.83288.8331.5887.3227.51
101−104031.74031.284027.21
101−114031.74031.2835.9827.21
102−014057.712.4850.234.1249.6
102−02−2556.7−2549.2−2548.6
102−03−10055.7−10048.2−10047.6
102−04−15554.7−15547.2−15546.6
101−05−160.22−1583.58−1582.016
102−06−104.31.9−1033.48−103.51.916
102−07−104.31.9−1033.48−103.51.916
102−08−104.31.9−1033.48−103.51.916
102−09137.95886.4350.5123.249.9
102−10−101.558−100.250.5−100.749.9
102−114057.74050.24049.6
102−124057.712.4850.234.1249.6
NG FEED325032503250
NG−01−2549−2549−2549
NG−02−10048−10048−10048
NG−03−148.847−148.847−148.847
NG−04−158.51.209−158.51.209−158.51.209
Table 5. Expressions for exergy destruction calculations in different equipment associated with the MFC–LNG processes [21].
EquipmentExergy Destruction (kW)
Compressor E x d e s t = ( m ˙ ) ( E x i n E x o u t ) W ˙
Pump E x d e s t = ( m ˙ ) ( E x i n E x o u t ) W ˙
Interstage coolers E x d e s t = ( m ˙ ) ( E x i n E x o u t )
Phase separator E x d e s t = ( m ˙ ) E x i n ( m ˙ ) E x L i q ( m ˙ ) E x V a p
JT valve E x d e s t = ( m ˙ ) ( E x i n E x o u t )
LNG heat exchanger E x d e s t = ( m ˙ ) E x i n ( m ˙ ) E x o u t
Table 6. Exergy destruction in terms of destruction/gain compared to base case.
EquipmentExergy Destruction (kW)Exergy Destruction (kW)Exergy Destruction (%)Exergy Destruction (kW)Exergy Destruction (%)
Base CaseSC_300SC_700
Compressors
K−1000.35110.3193−9.050.2920−16.84
K−1010.41650.3927−5.710.3488−16.24
K−1020.14540.1355−6.810.1364−6.19
Net exergy destruction0.91300.8475−7.170.7772−14.87
Pumps
P−1000.00250.00100.0000
P−1010.00000.00000.0004
P−1020.00000.00170.0003
Net exergy destruction0.00250.0027−99.990.0007−100
Cryogenic LNG exchangers
LNG−1000.43560.2620−39.870.2075−52.37
LNG−1010.65020.4378−32.680.3531163.4
LNG−1020.22140.1905−13.970.1850−16.43
Net exergy destruction1.30730.8902−31.90.745661.03
Air Coolers
E−1001.00940.8109−19.660.8792−12.9
E−1020.36200.1683−53.520.1221−66.27
E−1030.08930.0300−66.40.0667−25.26
Net exergy destruction1.46071.0092−30.911.0680−26.88
Phase Separators
V−1000.00000.03100.0048
V−1010.05570.0212−61.880.0388−30.3
V−1020.02690.0150−44.380.0000−100
Net exergy destruction0.08260.0672−18.60.0436−47.18
Joule-Thomson (Flash) Valves
JTV−1000.08050.0605−24.80.0463−42.48
JTV−1010.09250.140451.730.0825−10.8
JTV−1020.05940.0559−5.930.0466−21.57
JTV−1110.13190.131900.13190
Net exergy destruction0.36440.38876.690.3074−15.64
Overall process exergy destruction4.13043.2055−22.392.9425−28.76
ve shows exergy destruction minimization, +ve shows exergy maximization.
Table 7. Actual work, work lost and thermodynamic efficiency of the MFC–LNG process.
MFC ProcessActual Work
kW
Thermodynamic Efficiency (%)Relative Improvement in Thermodynamic Efficiency (%)
Base case5.95332.8
MFC_SCE-3005.05738.718.0
MFC_SCE-7004.77341.025.0