Abstract
After the long-term operation of reservoir facilities, they will become nonoperational due to the material deterioration and the performance degradation. One of crucial decisions is to determine the maintenance or replacement of the facilities in a cost-effective manner. Conventional replacement models seldom consider the maintenance effect. The facilities after maintenance are generally not as good as new, but are relatively restored. The target of this study is to establish a replacement decision model of the reservoir facilities under imperfect maintenance. By combining the theories of reliability analysis, imperfect maintenance, and engineering economics, the best timing of replacement that achieves cost-effectiveness is analyzed and proposed. Lastly, based on the design of experiments (DOE) and simulation, the regression curve chart for the economical replacement decision is established. Once the failure rate, the age of recovery after maintenance, and the ratio of maintenance cost to replacement cost are estimated based on historical data, the cost-effective replacement time of hydraulic machinery facilities will be efficiently determined.
1. Introduction
A reservoir is a comprehensive and complex civil facility, which is composed of a structural dam and the hydraulic machinery facilities. The hydraulic machinery facilities are an important control system and contain the driving mechanism, valve body, hydraulic equipment, sluice gate, hoisting wire rope, water gate rack lift, trash remover, emergency generator, and so on. They must be regularly inspected and maintained to ensure continuous and safe operation during the lifetime of the dam. Furthermore, several methods, such as failure mode effects and criticality analysis (FMECA), fault tree analysis (FTA), reliability, availability, and maintainability (RAM), and so on, are adopted for the further survey of maintenance strategies. Nevertheless, the facilities after maintenance are generally not as good as new, but are relatively restored. This results in imperfect maintenance. Moreover, along with imperfect maintenance progress, the facilities become more and more deteriorated, and the maintenance costs increase incrementally. One of the crucial decisions after the long-term operation of the facilities is to determine maintenance or replacement in a cost-effective manner. As the total maintenance cost approaches the replacement cost, the facilities should be replaced. Because the maintenance and replacement decision is a crucial and challenging task, many studies have been conducted [1,2,3,4,5,6,7,8,9,10,11,12,13]. As stated above, the reservoir facilities are under the process of continuous preventive maintenance and failure repair. However, their performance will generally decline faster, and the maintenance costs will increase over time. Eventually, the economic service life of the reservoir facility under imperfect maintenance will be of importance to the maintenance management. How to make a decision on the economic replacement time is the main focus of this paper. This study will adopt the concepts of the replacement studies stated above, combined with the theories of reliability analysis, imperfect maintenance, and engineering economics, to develop a replacement decision model for the reservoir facilities under imperfect maintenance.
2. Literature Review
The performance of the reservoir facilities is usually affected by internal and external factors, such as material deterioration, maintenance, operation, etc. As time goes by, the facility’s reliability will decrease and will eventually lead to failure. To maintain the reliable operation of the facilities, maintenance programs are generally executed on a regular basis. If necessary, corrective maintenance is conducted for deteriorated facilities. Furthermore, it could become necessary to replace the facility because of several reasons. Firstly, the facility becomes nonoperational due to physical failure. Secondly, the facility’s reliability declines, and this might cause a catastrophic failure. Finally, the total maintenance cost will surpass the replacement cost of a new facility. Because the replacement and maintenance decision is a crucial and challenging task, many studies have been conducted. Lotka (1939) [1] first discussed the concept of facility replacement renewal. Weiss (1956) [2] and Savage (1956) [3] respectively investigated the replacement problem, when the system reaches a certain age. They focused on the cost comparison of replacement and maintenance to estimate the replacement timing decision. Osaki and Nakagawa (1975) [4] developed the best maintenance and maintenance cost model under the maintenance strategies. Several other studies also focused on the replacement decision with the consideration of different factors and maintenance polices [5,6,7,8,9,10,11,12,14]. Nakagawa and Mizutani (2009) [13] constructed the best replacement strategy under periodical replacement modes with minor repair, interval replacement, and simple replacement.
There are several factors that affect the replacement decision, including the reliability performance, the recovery level after maintenance, the maintenance cost, and the replacement cost. In theory, the recovery level after maintenance is generally classified into perfect maintenance, imperfect maintenance, minimal maintenance, worse maintenance, and worst maintenance [15,16]. Imperfect maintenance is frequently applied in real engineering situations. Malik (1979) [17] first proposed the improvement factors considering imperfect maintenance. Kijima et al. (1988) [18] then proposed the concept of virtual age to construct imperfect maintenance. After that, several studies also focused on imperfect maintenance models, such as Lipi et al. (2011) [19] and Zhang et al. (2015) [20]. The American Public Works Association (APWA) offers a practical guideline for replacement. The main factors include the age, operating hours, reliability, cost, and condition of the equipment.
How to make a cost-effective replacement and renewal decision for the reservoir facilities under imperfect maintenance is the focus of this study. The rest of this paper is organized as follows: Section 3 introduces how the replacement decision is formulated. Section 4 describes the proposed imperfect maintenance model for the reservoir facilities. Section 5 illustrates how the rational replacement decision is developed based on engineering economics, system reliability, and imperfect maintenance. Section 6 presents a normalization approach to the replacement decision under imperfect maintenance. Finally, in Section 7, the principal conclusions are given.
3. Replacement Analysis and Decision
This study integrates the theories of system reliability, imperfect maintenance, and engineering economics to develop a cost-effective replacement decision model of the reservoir facilities. By combining system reliability and imperfect maintenance, the recovery level after continuous maintenance is first analyzed. It is believed that the reliabilities of hydraulic mechanical facilities follow a Weibull distribution. Table 1 depicts the hypothesis test of one specific type of mechanical facility at several reservoirs in Taiwan. It has been found that the failure probability function follows a Weibull distribution in a better manner compared with other probability distributions based on the significance test using p-values. Moreover, past research and dam engineering handbooks also indicated that a Weibull distribution was appropriate to depict the reliability of hydraulic machinery facilities [21,22]. Based on the concept of the Weibull distribution of time-dependent failure, the mean time between failures (MTBF) during imperfect maintenance was further explored. During the lifetime of the reservoir facilities, the equivalent uniform annual cost method (EUAC) was then used to seek the break-even point at which the best economic replacement time is reached in terms of cost-effectiveness. The overall replacement analysis process is shown in Figure 1, in which : Weibull shape parameter; : Weibull scale parameter; MTBF: mean time between failures; : imperfect maintenance action in the k period, 0 ≤ ≤ 1, for k ≥ 1; : the virtual age of the system in the k period after imperfect maintenance, = 0; : the lifetime of reservoir mechanical facilities; : the equivalent uniform annual cost (EUAC) of the maintenance cost in the k period; : the equivalent uniform annual cost (EUAC) of the replacement cost in the kperiod; : the best timing of replacement that achieves cost-effectiveness; : the timing of maintenance in the k period, = 0.

Table 1.
Hypothesis test of the Weibull distribution for reservoir hydraulic machinery failure time.
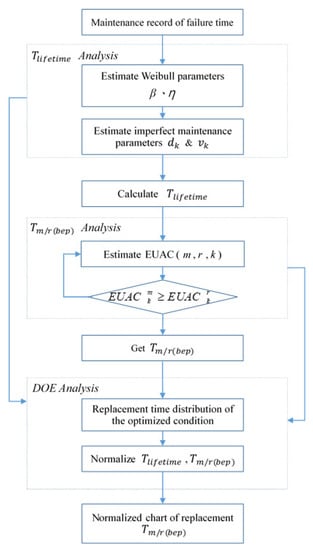
Figure 1.
Economic replacement study process under imperfect maintenance.
4. The Process of Imperfect Maintenance
The reservoir hydraulic mechanical facilities are maintained during their lifetime. Nevertheless, the facilities after maintenance are generally not as good as new, but are relatively restored. This results in imperfect maintenance. As stated above, the functional recovery after maintenance can be divided into perfect maintenance, imperfect maintenance, minimal maintenance, worse maintenance, and worst maintenance. The concept of perfect maintenance is that the facility will return to a status of completely new after maintenance. Minimal maintenance is the status of the facility after maintenance that is as bad as the status before maintenance. However, in fact, the reservoir hydraulic mechanical facility itself has some physical phenomena such as system aging and performance degradation, which lead to imperfect characteristics after maintenance. That means that the facility’s function after maintenance is between perfect maintenance and minimal maintenance. To model imperfect maintenance, there are several theories proposed: virtual age, improvement factor, the shock model, the (, ) rule, the (p, q) rule, and the hybrid model. Among them, the concept of virtual age directly adopts the output from the Weibull distribution. As shown in Equation (1), a main parameter of the virtual age model is the maintenance level (), and it is a function of the shape parameter (). By following Figure 1, two Weibull distribution parameters (shape parameter and scale parameter) and MTBFcan be estimated based on historical maintenance records. Therefore, this study developed a virtual age-based imperfect maintenance model following the virtual age rule proposed by Kijima (1988) [18]. The imperfect maintenance model of Kijima (1988) [18] can be interpreted as the virtual age: = , ≤ t ≤ , k ≥ 0 is a function of maintenance level . The value of is between zero (perfect maintenance) and one (minimum maintenance). The formulae of the maintenance level and virtual age are defined in Equations (1) and (2), respectively. By combining the reliability theory and the virtual age, the reliability function under imperfect maintenance, , is derived as in Equation (3). An example of years and was analyzed, and the result is shown in Figure 2. Its values fell within perfect maintenance and minimal maintenance. Furthermore, MTBF decreased incrementally with time.
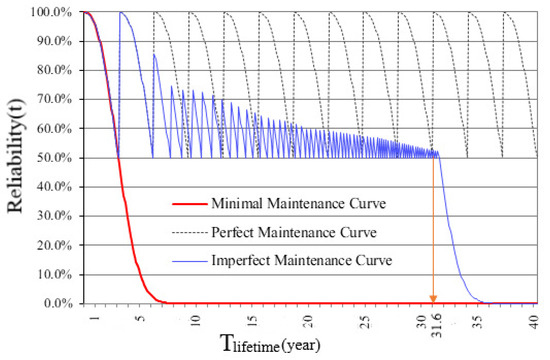
Figure 2.
Imperfect maintenance example of years and .
5. Economic Evaluation of Replacement
It is well recognized that maintenance costs are an important part of the operational cost, both for preventive and for corrective maintenance activities. The maintenance costs are based on the item restoration degree after maintenance actions. It is clear that both reliability parameters and costs are essential to optimize maintenance activities’ management. The hydraulic mechanical facilities at a dam experience material aging and performance degradation. Even if maintenance activities are conducted to restore the function, generally the functioning is not as good as new, but is relatively restored. The accumulated maintenance costs will accordingly increase as time goes by because MTBF declines incrementally as stated above. It will not be cost-effective after several maintenance actions. Based on the theory of engineering economics when the total maintenance cost is equal to or exceeds the replacement cost, the break-even point is reached and the replacement action is requested for more economical operation costs. The cost function based on the equivalent uniform annual cost (EUAC) with reliability parameters is shown in Equation (4), in which : the break-even function of the maintenance’s EUAC and replacement’s EUAC; : EUAC of the maintenance cost in the k period, k ≥ 1; : EUAC of the replacement cost in the k period, k ≥ 1; : the maintenance cost in the k period; : the replacement cost in the k period; : the interest rate; : the mean time between failures .
An explanation case and the corresponding parameters are shown in Table 2. The best practices of maintenance and reliability pointed out that the maintenance cost was around 10–15% of the replacement cost. The interest rate was assumed to be , following the average yield of a 10 year medium- to long-term government yield to maturity. MTBF was assumed to be at the beginning. The EUAC analysis for maintenance and replacement is depicted in Table 3. For example, using Equation (4), at Stage 1 (), the EUAC of the maintenance cost was 1.98 and the EUAC of the replacement cost was 13.19, respectively. Because the EUAC of the replacement cost was much higher than the EUAC of the maintenance cost, this meant that replacement at this moment was not a cost-effective maintenance strategy. This process was repeated consecutively to determine the economic maintenance strategy. When the EUAC of the maintenance cost of the facility was equal or exceeded the EUAC of the cost for replacement ( ≥ 0), the break-even point (around 17.8 years in the case) was reached, and that meant that after that time point, it was recommended that the hydraulic mechanical facility be replaced with the consideration of cost-effectiveness. Ahead of the break-even point, maintenance was more cost-effective.
Table 2.
List of replacement parameters.
Table 3.
Evaluation of , with respect to the mean time between failures.
6. Replacement Time Assessment Under Imperfect Maintenance
By combining the reliability function defined as the Weibull distribution, the virtual age parameters of imperfect maintenance, and the EUAC parameters of engineering economics, an economical replacement time assessment model under imperfect maintenance was developed, and the overall process is depicted in Figure 1. For the convenience of future practical use, a normalization approached was adopted. The design of experiments (DOE) based on the Taguchi method was used to develop the experimental layout. DOE is a statistical tool and involves making a set of experiments representative of a given question (normalization results in our case). DOE can help efficiently build a model of a process by controlling one or more responses. Until now, DOE has been deployed in various types of systems, processes, and product designs, developments, and optimizations. Many DOE methods have also been proposed, including full factorial design, fractional factorial design, and so on. In our study, the Taguchi method was adopted. The Taguchi method is a fractional factor experiment and uses the orthogonal array to study the entire parameter space with fewer experiments conducted. Based on the fractional experiment results, the responses of the hidden combinations can be predicted via approximate regression.
There were two main outputs: total lifetime of the facility and economic replacement time . Significant parameters were summarized as experimental inputs, including the shape parameter , imperfect maintenance action , mean time between failures , and the cost ratio of maintenance-to-replacement . Based on the sensitivity analysis of and , the sensitive factors of were and with the confidence level of 90%. The primary factors of were , d, and with the confidence level of 99%. The total lifetime of the facility based on Taguchi’s orthogonal arrays used , deploying nine random experimental modes. The economic replacement time used , deploying nine random experimental modes.
One aim of this paper was to develop convenient implementation charts on the total lifetime of the facility and the economic replacement time by doing an experiment in one period at three levels. Taguchi’s method was used to run the trials for the total lifetime of the facility. The data gave the complete information to estimate the value of the total lifetime of the facility by using the Weibull distribution and imperfect maintenance given in Table 4. The level ranges were determined based on the reliability study of the reservoir facilities in Taiwan. By running Equation (3) based on Taguchi’s method as shown in Table 5, the simulation data were further explored and interpreted as a regression line chart, as depicted in Figure 3. Furthermore, Taguchi’s method was used to run the trials for the economic replacement time of the reservoir facility. In Taguchi’s method, only nine experiments were used instead of 27, as per the full factorial design (FFD). The data gave the complete information to estimate the value of the economic replacement time by using the Weibull distribution, imperfect maintenance, and EUAC given in Table 4. Finally, the simulation data were further interpreted as a regression line chart, as depicted in Figure 4. Overall, several conclusions could be made: (1) when the maintenance level () was lower, the economic replacement time was generally longer under a constant cost ratio of maintenance-to-replacement ; (2) with the same maintenance level () and cost ratio of maintenance-to-replacement , a larger shape parameter () resulted in a shorter economic replacement time ; (3) generally, a larger cost ratio of maintenance-to-replacement had a shorter economic replacement time ; (4) the total lifetime of the facility was decided by the shape parameter () and MTBF. Generally, a larger MTBF and shape parameter () would result in a longer total lifetime of the facility .
Table 4.
Data for estimating the total lifetime of the facility and the economic replacement time.
Table 5.
Taguchi array of DOE.
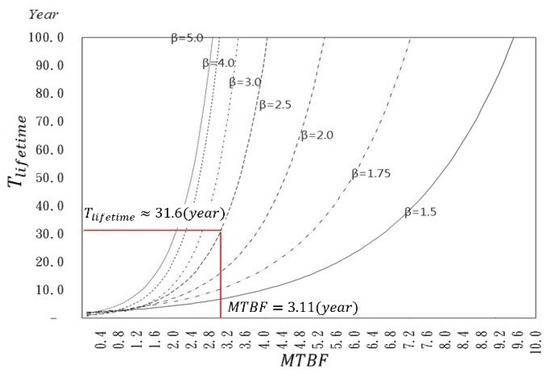
Figure 3.
Total lifetime of the facility versus .
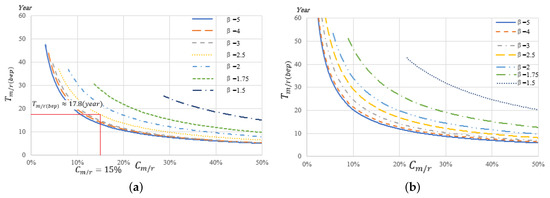
Figure 4.
Economic replacement time versus the cost ratio of maintenance-to-replacement (a) d = 0.5; (b) d = 0.45.
One of the purposes of this study was to support decision making on the efficient replacement of the reservoir facility. In practice, the shape parameter () and MTBF are calculated based on the Weibull distribution using historical maintenance data. The cost ratio of maintenance-to-replacement is further decided based on real practice. The lifetime and the economical replacement time of the facility will be conveniently determined through Figure 3 and Figure 4. A demonstration example is illustrated as follows. As shown in Figure 2, the lifetime was 31.6 years when and years. This value can be quickly determined in Figure 3. Furthermore, the economical replacement time could be conveniently found through by looking at Figure 4. The economical replacement time was 17.8 years as shown in Table 3. This result is easily found in Figure 4a once , and are defined.
7. Conclusions
This paper addressed a decision model for the optimal economic replacement time of reservoir hydraulic facilities under imperfect maintenance. There were several research outcomes in this study. First, convenient implementation charts of the total lifetime of the facility and economic replacement time were generated for real practice. These charts could effectively support the trade-off survey of maintenance and replacement for the reservoir facilities. Secondly, the reliability function under imperfect maintenance and the break-even function considering the reliability were studied and depicted in Equations (3) and (4), respectively. These equations may provide fundamental support for further maintenance strategy studies, when other decision making considerations are required. In the course of future research, a decision support system, in which the decision modules are developed based on this study, will be required for practical use of the reservoir facilities’ maintenance. Moreover, surveys of other conditions and constraints in the imperfect maintenance models, such as the consideration of the dependent components or multicomponent systems, may be important to researchers and practitioners.
Author Contributions
S.-S.L. designed and supervised the research; T.-M.Y. ran the simulation and wrote the paper draft. All authors read and agreed to the published version of the manuscript.
Funding
This research was partially supported by the Ministry of Science and Technology in Taiwan Grant MOST 104-2221-E-011 -135 -MY2.
Conflicts of Interest
The authors declare no conflict of interest.
References
- Lotka, A.J. A Contribution to the Theory of Self-Renewing Aggregates with Special Reference to Industrial Replacement. Ann. Math. Stat. 1939, 10, 1–25. [Google Scholar] [CrossRef]
- Weiss, G.H. On the theory of replacement of machinery with a random failure time. Naval Res. Logist. 1956, 3, 279–293. [Google Scholar] [CrossRef]
- Savage, I.R. Cycling. Naval Res. Logist. 1956, 3, 163–175. [Google Scholar] [CrossRef]
- Osaki, S.; Nakagawa, T. A note on age replacement. IEEE Trans. Reliab. 1975, 24, 192–194. [Google Scholar] [CrossRef]
- Beichelt, F. A Replacement Policy Based on Limits for the Repair Cost Rate. IEEE Trans. Reliab. 1982, 31, 401–403. [Google Scholar] [CrossRef]
- Jayabalan, V.; Chaudhuri, D. Optimal maintenance and replacement policy for a deteriorating system with increased mean downtime. Naval Res. Logist. 1992, 39, 67–78. [Google Scholar] [CrossRef]
- Aven, T.; Dekker, R. Useful framework for optimal replacement models. Reliab. Eng. Syst. Saf. 1997, 58, 61–67. [Google Scholar] [CrossRef]
- Sheu, S.H. Extended block replacement policy of system subject to shocks. IEEE Trans. Reliab. 1997, 46, 375–382. [Google Scholar] [CrossRef]
- Michel, O.; Labeau, P.E.; Mercier, S. Monte Carlo optimization of the replacement strategy of components subject to technological obsolescence. Probab. Saf. Assess. Manag. 2004, 6, 3098–3103. [Google Scholar] [CrossRef]
- Mercier, S. Optimal replacement policy for obsolete components with general failure rates submitted to obsolescence. Appl. Stoch. Models Bus. Ind. 2008, 24, 221–235. [Google Scholar] [CrossRef]
- Nguyen Thi, P.K.; Castanier, B.; Yeung, T. Optimal Maintenance and Replacement Decisions under Technological Change. European Safety and Reliability; Greece, 2010; pp. 1430–1437. Available online: http://hal.univ-nantes.fr/hal-00538529v1 (accessed on 7 May 2020).
- Berrade, M.D.; Scarf, P.A.; Cavalcante, C.A.V.; Dwight, R.A. Imperfect inspection and replacement of a system with a defective state: A cost and reliability analysis. Reliab. Eng. Syst. Saf. 2013, 120, 80–87. [Google Scholar] [CrossRef]
- Nakagawa, T.; Mizutani, S. A summary of maintenance policies for a finite interval. Reliab. Eng. Syst. Saf. 2009, 94, 89–96. [Google Scholar] [CrossRef]
- Badía, F.G.; Berrade, M.D. Optimum Maintenance Policy of a Periodically Inspected System under Imperfect Repair. Adv. Oper. Res. 2009, 2009, 13. [Google Scholar] [CrossRef]
- Gage, M.W. Equipment Maintenance and Replacement Decision Making Processes; California Polytechnic State University: San Luis Obispo, CA, USA, 2013. [Google Scholar]
- Vorster, M. Equipment Replacement Decisions; C.E.M.P.Central Inc.: Blacksburg, VA, USA, 2017. [Google Scholar]
- Malik, M.A.K. Reliable Preventive Maintenance Scheduling. AIIE Trans. 1979, 11, 221–228. [Google Scholar] [CrossRef]
- Kijima, M.; Morimura, H.; Suzuki, Y. Periodic replacement problem without assuming minimal repair. Eur. J. Oper. Res. 1988, 37, 194–203. [Google Scholar] [CrossRef]
- Lipi, T.F.; Lim, J.-H.; Zuo, M.J. A condition- and age-based replacement model using delay time modelling. J. Risk Reliab. 2011, 14, 221–233. [Google Scholar] [CrossRef]
- Zhang, Y.; Qiu, J.; Liu, G.; Zhao, Z. Fault sample generation for virtual testability demonstration test subject to minimal maintenance and scheduled replacement. Math. Probl. Eng. 2015, 2015, 8. [Google Scholar] [CrossRef]
- Beranek, D.A. Engineering and Design: Reliability Analysis of Navigation Lock and Dam Mechanical and Electrical Equipment (No. ETL-1110-2-560); Corps of Engineers Washington DC: Washington, DC, USA, 2001.
- Kalantarnia, M. Reliability Analysis of Spillway Gate Systems; Department of Civil Engineering and Applied Mechanics, McGill University: Montreal, QC, Canada, 2013. [Google Scholar]


© 2020 by the authors. Licensee MDPI, Basel, Switzerland. This article is an open access article distributed under the terms and conditions of the Creative Commons Attribution (CC BY) license (http://creativecommons.org/licenses/by/4.0/).