Article

Optimal Configuration with Capacity Analysis of a Hybrid Renewable Energy and Storage System for an Island Application

Department of Electrical Engineering, National Taiwan University of Science and Technology 43, Sec. 4, Keelung Rd., Taipei 10607, Taiwan
*
Author to whom correspondence should be addressed.
Energies 2020, 13(1), 8; https://doi.org/10.3390/en13010008
Submission received: 26 October 2019 / Revised: 14 December 2019 / Accepted: 16 December 2019 / Published: 18 December 2019
(This article belongs to the Special Issue Selected Papers from IEEE ICKII 2019)

Abstract

:
The Philippines consists of 7100 islands, many of which still use fossil fuel diesel generators as the main source of electricity. This supply can be complemented by the use of renewable energy sources. This study uses a Philippine offshore island to optimize the capacity configuration of a hybrid energy system (HES). A thorough investigation was performed to understand the operating status of existing diesel generator sets, load power consumption, and collect the statistics of meteorological data and economic data. Using the Hybrid Optimization Models for Energy Resources (HOMER) software we simulate and analyze the techno-economics of different power supply systems containing stand-alone diesel systems, photovoltaic (PV)-diesel HES, wind-diesel HES, PV-wind-diesel HES, PV-diesel-storage HES, wind-diesel-storage HES, PV-wind-diesel-storage HES. In addition to the lowest cost of energy (COE), capital cost, fuel saving and occupied area, the study also uses entropy weight and the Technique for Order Preference by Similarity to an Ideal Solution (TOPSIS) method to evaluate the optimal capacity configuration. The proposed method can also be applied to design hybrid renewable energy systems for other off-grid areas.

Graphical Abstract

1. Introduction

To achieve good economic life and growth, off-grid communities require an affordable and reliable energy supply. Besides, the growing concern about climate change and environmental pollution, especially since fossil fuels are the main source of energy on Earth, has pushed the power generation systems towards the use of renewable energy [1,2]. In addition to high transportation and fuel cost, energy delivered to isolated areas frequently used fossil fuel-based generators which threaten the anthropogenic and natural ecosystems [3,4,5]. The main factors pushing increased energy access are regular power interruptions, limited power grid accessibility, availability of renewable resources, increasing concern about the need to decrease fossil fuel dependency and high oil prices, and also the significance of escalating energy access to development and availability of climate- related financial support for low-carbon and climate-resilient development that prioritizes renewables [6,7,8].
Nowadays, the main challenges facing hybrid systems is to design an energy management strategy to meet the demand for loads, despite the intermittent nature of renewables [9,10], in addition to cost savings and total versatility and multi-faceted goals that can be accomplished [11,12,13].
PV and wind turbine (WT) have been considered the most promising renewable energy options for off-grid areas or islands to fulfill the energy demand [14,15,16]. Even stand-alone wind and solar energy may fulfill the low load requirements, while these systems need a significant energy storage for higher loads, resulting in high COE [17,18,19]. The other option to alleviate this problem is autonomous hybrid renewable energy systems (HRES) which combine two or more energy resources, to fulfill higher energy requirements of off-grid areas and resolve the inherent problem of single renewable energy (RE) resource [1,20,21,22,23,24]. Furthermore, hybridization of energy sources increases the reliability of the system as the shortcomings of any component are compensated for by the selection of other but appropriate components and their sizing is essential during design of such systems [25,26,27]. Some of the hybrid energy systems with different storage technologies and performance measure criteria found in literatures are presented in Table 1 [12,28,29].
In most of the literature on hybridizing energy systems, cost reduction and CO2 emission reduction are the focal points of the research work. However, the number of scenarios considered to pinpoint the best trade-off configuration among system reliability, cost of energy and environmental sustainability; the magnitude of excess electricity and the way it is managed; the percentage RF, still needs further investigation, depending on where the HES is going to be installed.
The Batanes Islands are the northernmost provinces of the Philippines. They are composed of 10 islands including Batan, Sabtang, Itbayat and so on. They have a typical volcanic island hilly terrain and a rich natural ecology. The largest island is Batan Island with a longitude of 120.968° and a latitude of 20.445°, as shown in Figure 1, about 161 km from Luzon, Philippines, and only about 190 km from Taiwan [30]. The fuel and other large resources needed on the islands are transported by ship from Luzon. At present, the population of Batan Island is about 12,000 and the main economic activities are sightseeing, agriculture and fishery.
The power on Batan Island is offered 24 h a day by the Basco diesel power plant of the Philippine National Power Corporation (NPC), as shown in Figure 2. A total of five generators are mainly usied, of which four generators are 600 kW and the one is 450 kW. Because of the problems such as the difficulty of diesel transportation, high pollution and high power generation cost, the NPC is actively seeking to use renewable energy to solve these issues. With a subsidy of the Asian Productivity Organization (APO), the APO Center of Excellence on Green Productivity (APO COE GP) and NPC have conducted renewable energy research, and analyzed hybrid renewable energy systems based on the load demand and climatic conditions on Batan. The proposed capacity allocation scheme in different power supply systems can be as a reference of investment construction for NPC or private power plants.
The rest of this paper is arranged in the following way: In Section 2, the materials and methods followed are discussed. Hybrid energy system descriptions are discussed in Section 3. In Section 4 and Section 5 component cost and financial assumptions, results and discussions are described, respectively. Conclusions are discussed in Section 6.

2. Materials and Methods

The study cases in the research contain seven kinds of power systems. Using entropy weight and TOPSIS method to analyze the techno-economic and evaluate optimal capacity configuration for hybrid energy system (HES). The discussions are as follows:
  • Case 1: Stand-alone diesel system
  • Case 2: PV-diesel HES
  • Case 3: Wind-diesel HES
  • Case 4: PV-wind-diesel HES
  • Case 5: PV-diesel-storage HES
  • Case 6: Wind-diesel-storage HES
  • Case 7: PV-wind-diesel-storage HES
The required information for our simulation analysis include the status of the diesel generators, the load power consumption, the statistics of the oil prices, interest rates and inflation rates in the Philippines in recent years. In addition, the weather data on the island can be obtained on the NASA website, and e market surveys for equipment costs are also needed.
  • Based on the load conditions and the specifications of existing diesel generator, the electrical and economic results of the stand-alone diesel system (Case 1) can be analyzed by HOMER (Pro.3.7.6.0, HOMER Energy, CO, USA)) and the result is considered as a reference for discussing different hybrid energy systems.
  • According to the load conditions and climatic conditions, the electrical and the economic conditions in different capacity configuration are analyzed. The simulation of HES model without energy storage that is, PV-diesel HES (Case 2), wind-diesel HES (Case 3), PV-wind-diesel HES (Case 4) are analyzed. The optimal capacity configuration in the lowest COE for each case needs to be calculated.
  • The HES with energy storage analyzed include PV-diesel-storage HES (Case 5), wind-diesel-storage HES (Case 6), PV-wind-diesel-storage HES (Case 7). The RF is in the range of 25–50% and each step is 5%. Finding a capacity configuration with an excess electricity fraction below 5% and a minimum COE for each case are the main points to be considered.
  • From Cases 5–7, we select the one has a relatively low COE and use the entropy weight and TOPSIS method to analyze the optimal capacity configuration when the RF is in 25–50%, considering the capital cost, COE, fuel saving, and occupied area.
  • The sensitivity analysis of parameters such as global horizontal irradiation data (GHI), wind speed, diesel fuel price, and load consumption. The parameters are used to discuss the economy and electricity of the system.

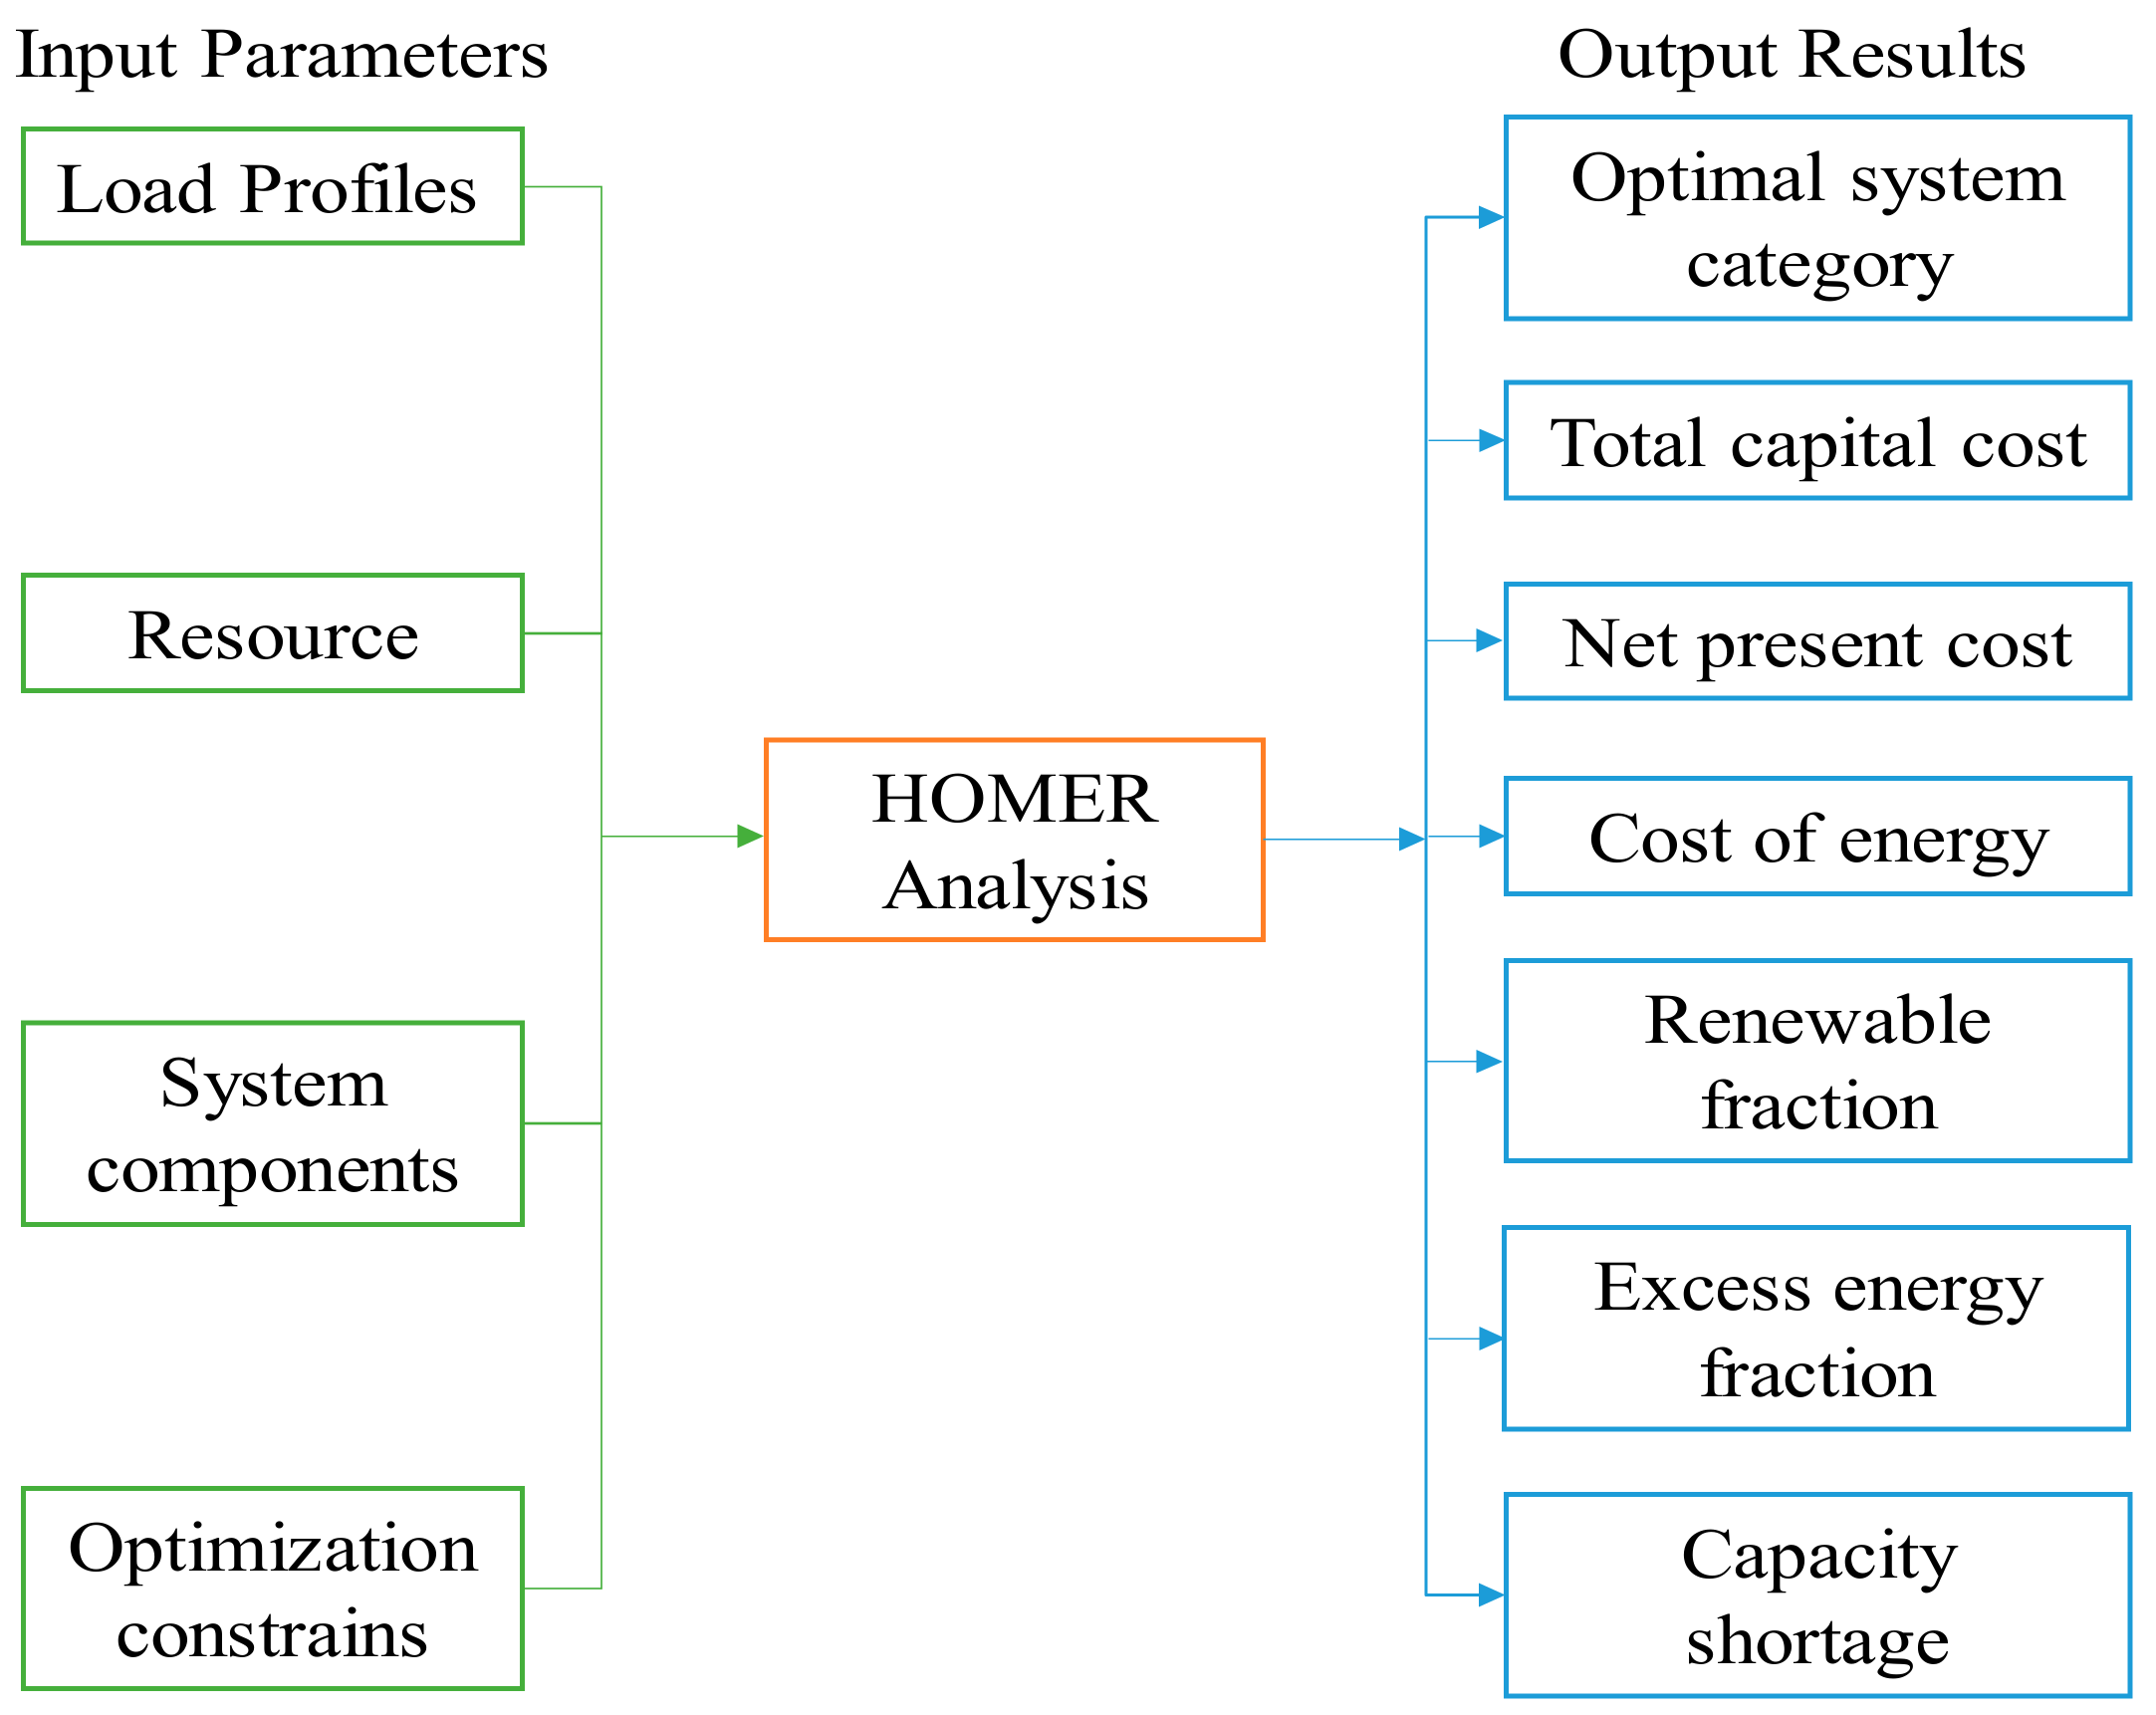
2.1. Simulation Software Description

The HOMER software was developed by the U.S. National Renewable Energy Laboratory (NREL). The software is helpful in analyzing the power system’s electricity and economy to model the optimal power grid. Furthermore, the user can define the input parameters and the constraints as a reference for modeling profitable power system [31]. The architecture diagram of the simulation analysis procedure of the HOMER software is as shown in Figure 3.

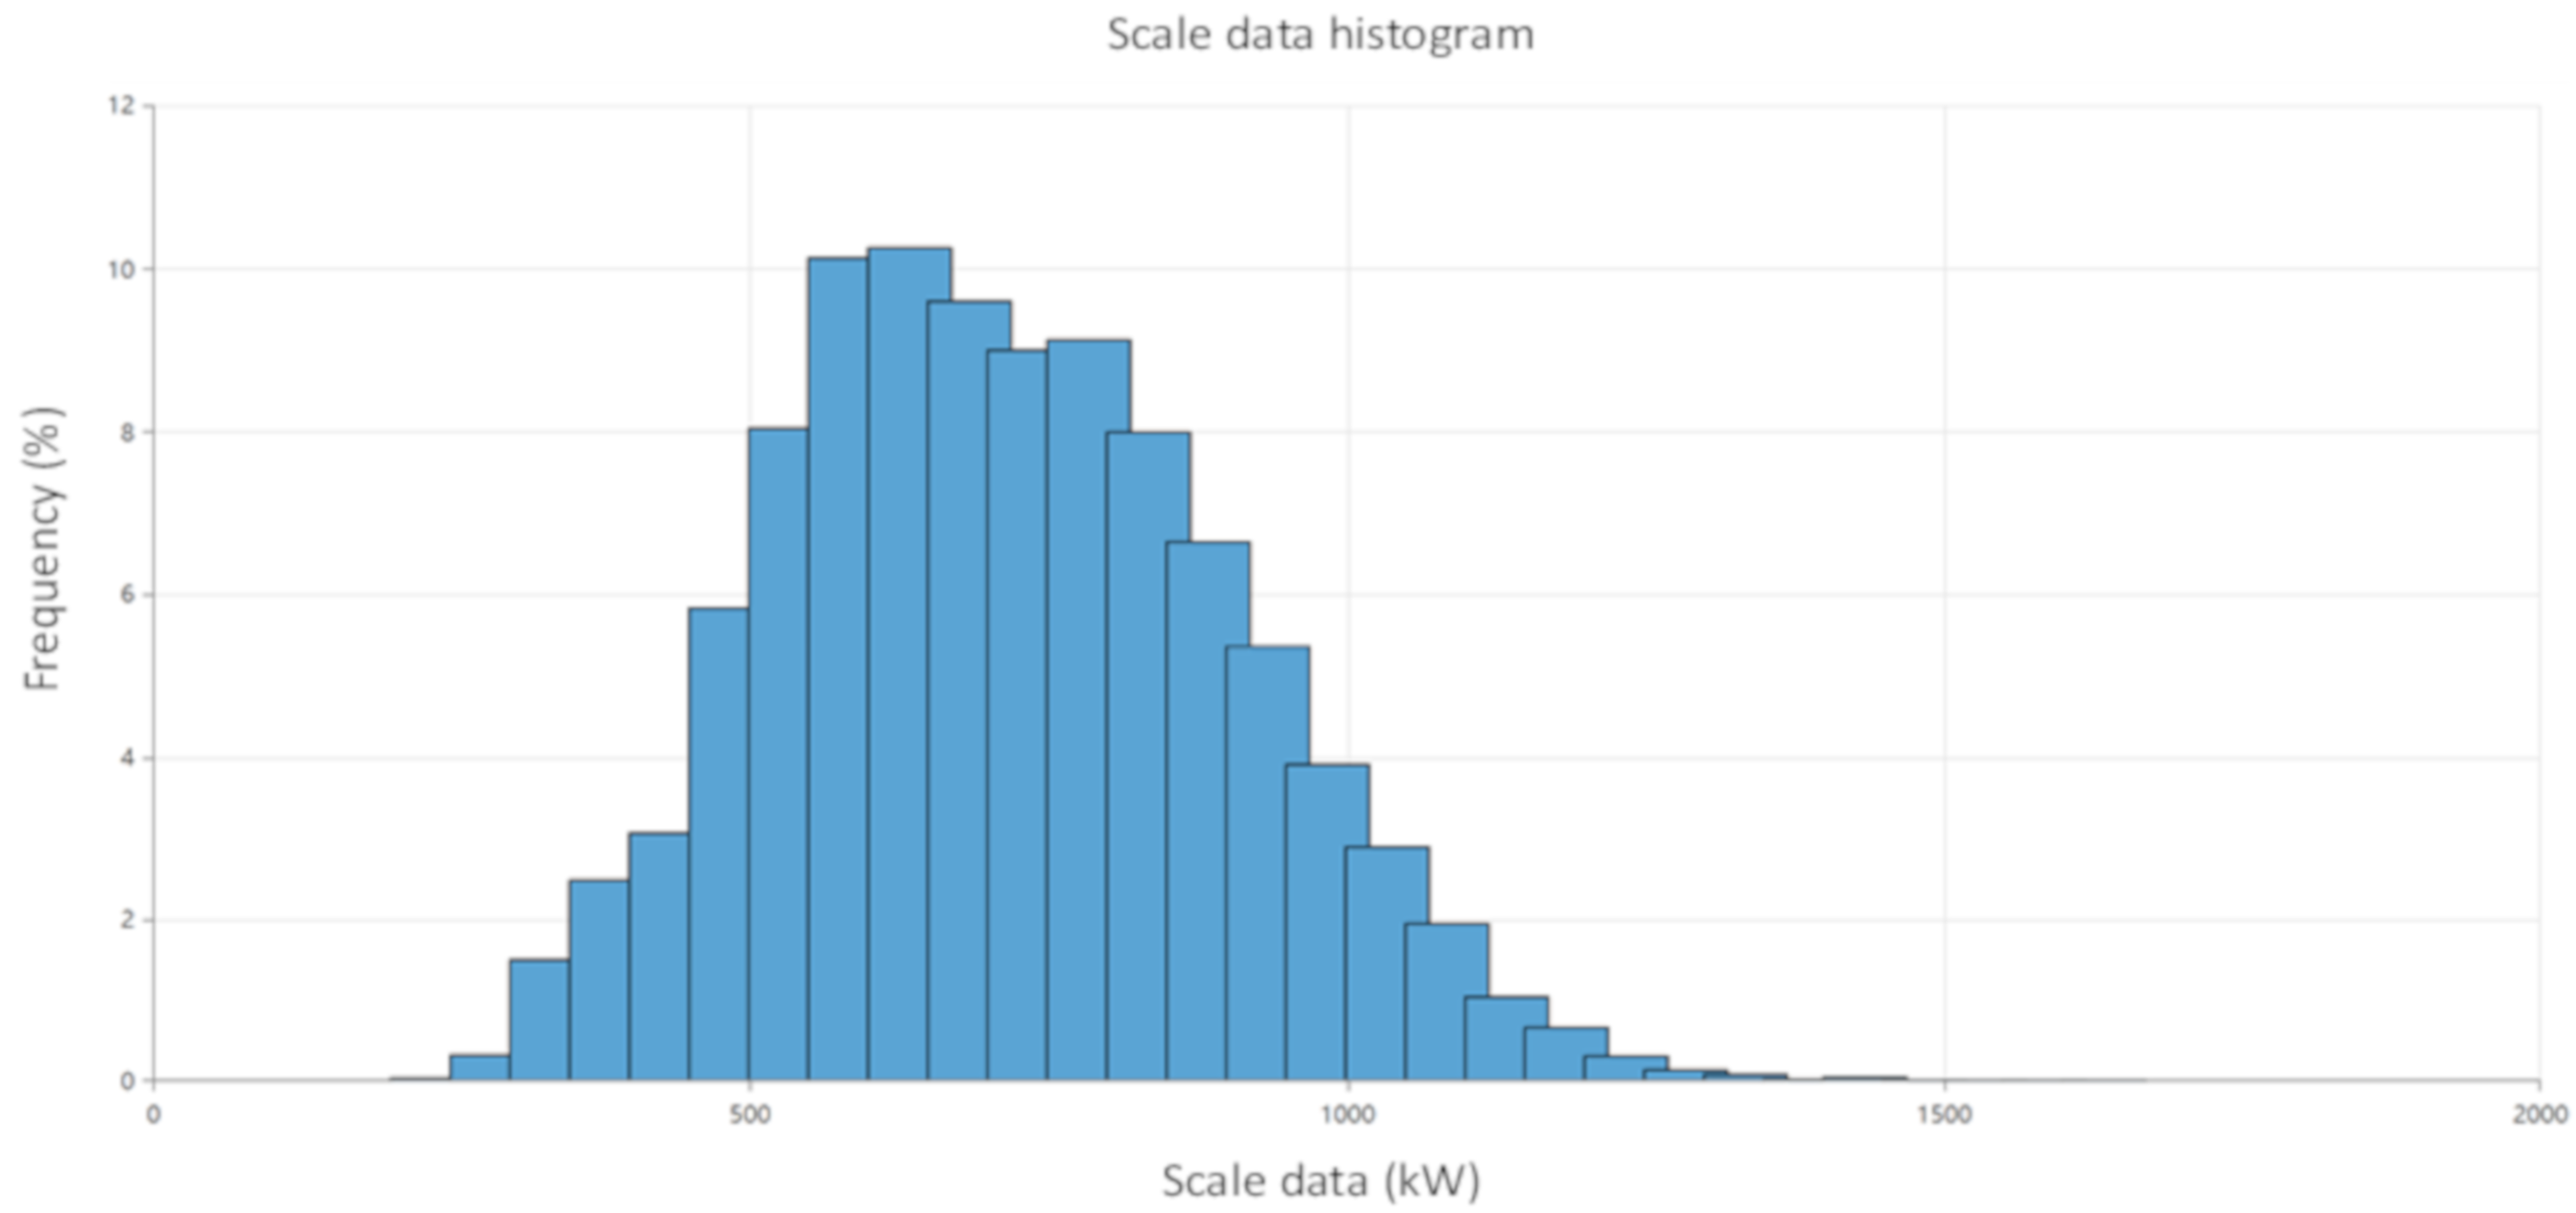
2.2. Global Horizontal Irradiation and Wind Speed

Entering the latitude and longitude of Batan into the HOMER software, NASA’s global horizontal irradiation data (GHI) and wind speed statistics can be obtained through the Internet connection. The obtained information contains the annual GHI is 1876 kWh/m2/yr, and the daily average GHI is about 5.14 kWh/m2/d. The sunshine is abundant and suitable for the development of solar photovoltaic applications. As shown in Figure 4, the varies for the daily average GHI of each month from 3.31 kWh/m2/d to 6.41 kWh/m2/d, and the highest and lowest average GHI are in April and December, respectively.
According to the NASA anemometer data measured 50 m above the surface of the Earth, the annual average wind speed is 7.22 m/s. As shown in Figure 5, the variation of average wind speed is from 4.95 m/s to 10.04 m/s in each month. The highest and lowest average wind speeds are in December and May, respectively. The monthly trend of the whole year is opposite to that of GHI. The solar energy and wind energy can be supplied power in turn and effectively use natural resources.

2.3. Load Profile

Through the data collection of the frequency distribution of the load power consumption, the average of daily electricity consumption is 16,974 kWh/d, July is the month with higher electricity consumption, and January is the lower month for electricity consumption. The load profile for each month is as shown in Figure 6.
Figure 7 shows load power consumption frequency distribution. In the sampling period of hourly, the frequency of in 550 kW–599 kW and 600 kW–649 kW is more than 10%, the total is 20.35%; the frequency exceeding 1000 kW is only 7.02%, and the maximum 1442 kW.

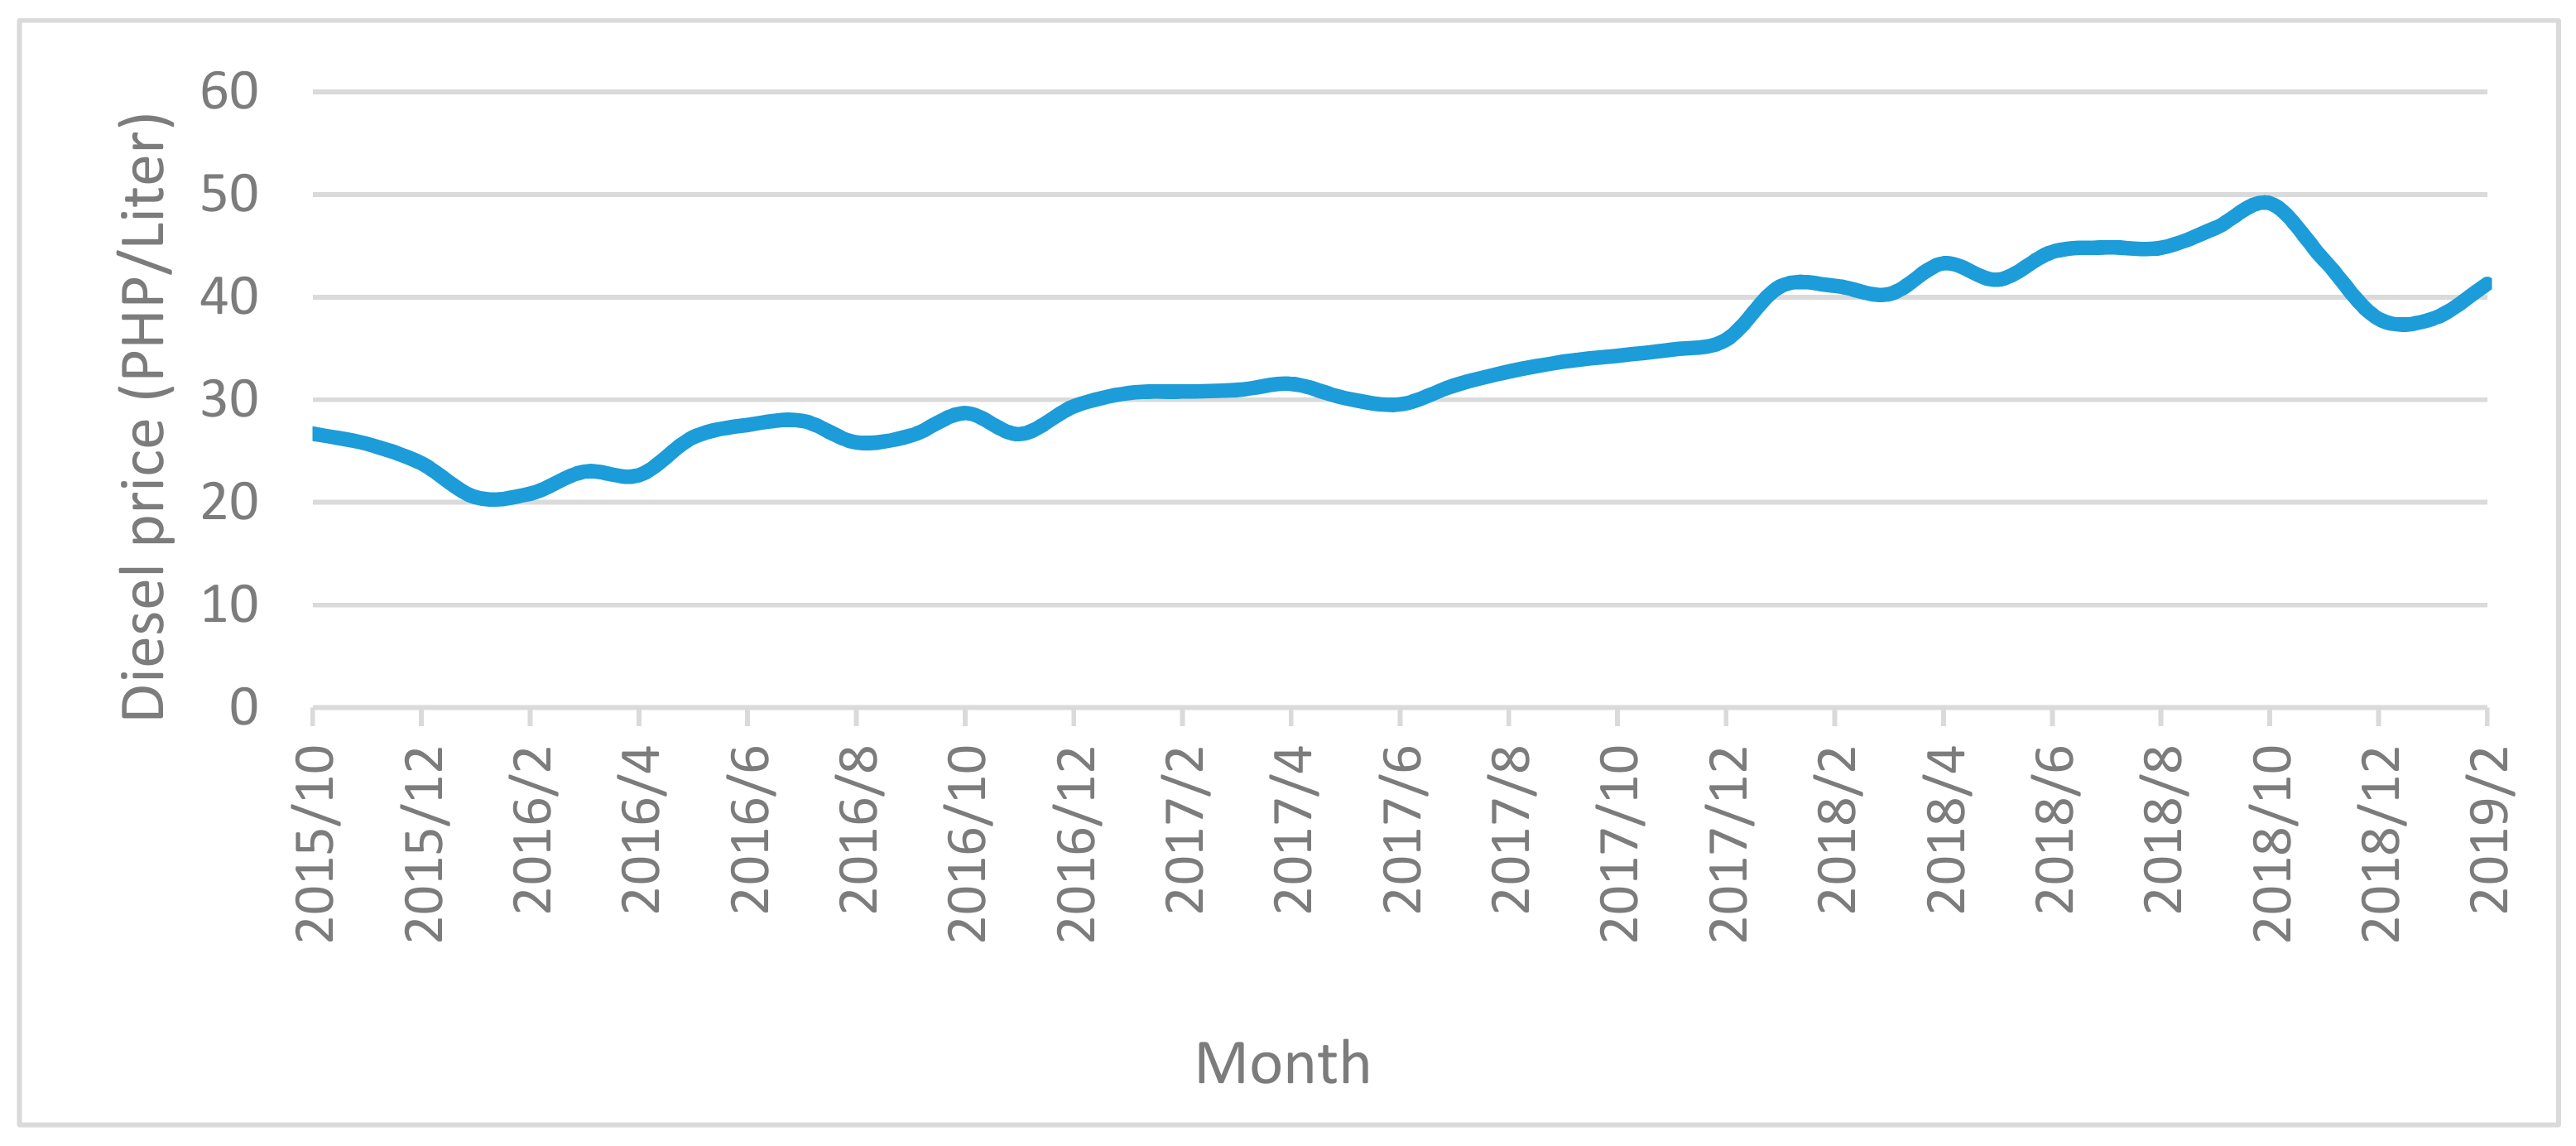
2.4. Diesel Price Data

As shown in Figure 8, the oil price information regularly announced by the Philippines’ Department of Energy in recent years, the Philippines is affected by fluctuations in international oil prices. From October 2015 to February 2019, domestic oil prices have risen sharply. The retail common price has reached 49.15 PHP/L in 15 October 2018 [32], converted to $ is 0.91 $/L (1 & = 52.26 PHP). The lowest oil price during the statistical period is 20.5 PHP/L, the maximum is 49.15 PHP/L, and average is 33.335 PHP/L. In the offshore islands, the transportation cost must be added to the oil price. Therefore, the actual oil price is according to the geographic location. In more remote areas, the oil price will be affected by the transportation cost. The actual oil price may be 1–1.5 times the estimated oil price [33], in this paper, the average price of the statistical period is 1.25 times the oil price (0.8 $/L), which is used as the basic parameter of the simulation.

2.5. Assignment Indexes

The evaluation indicators used in this paper include economic indicators (Section 2.5.1, Section 2.5.2, Section 2.5.3 and Section 2.5.4), electrical indicators (Section 2.5.5 and Section 2.5.6), and occupied area (Section 2.5.7). The calculation formulas and descriptions are as follows [3,34]:

2.5.1. Annual Real Interest Rate

Annual real interest rate (i) is used to adjust between one-time cost and annualized costs. HOMER uses annual real interest rate to compute discount factor and to determine annualized costs from present costs:
i = i f 1 + f
where i is annual real interest rate (%); i is nominal interest rate (bank board rate) (%); f is expected inflation rate (%).

2.5.2. Net Present Cost

The total of NPC value denotes the cost of system life cycle in HOMER. Equation (2) displays the amount of cash flow of t-year over the factor and initial capital cost. Costs include capital cost, operation cost, replacement cost, maintenance cost, fuel cost and etc. The income includes the selling of electricity and the residual price after the life cycle:
i = i f 1 + f NPC = C F 0 + C F 1 1 + i 1 + C F 2 1 + i 2 + C F 3 1 + i 3 + + C F N 1 + i N = C F 0 + t = 1 N C F t 1 + i t
where CFt is cash flow of t-year (according to HOMER software: expenditure is positive and income is negative.) ($), i is the annual real interest rate (%), N is project life time (yr), t is number of year (yr), CF0 is initial capital cost ($).

2.5.3. Capital Recovery Factor (CRF)

CRF is ratio used to determine present value of the annuity during the project lifetime:
C R F ( i , t ) = i ( 1 + i ) t ( 1 + i ) t 1
where t is the number of years, i is the annual real interest rate (%).

2.5.4. Cost of Energy

HOMER defines levelized COE as average cost per kWh of useful electric energy generated by the system and computed by dividing total annualized cost (TAC) by total annualized useful electric energy generation. The unit of COE is $/kWh. TAC is annualized value of NPC, and its unit is $/yr. The relation is as follows:
T A C = NPC × C R F ( i , N )
COE = T A C E p r i m
where Eprim is annualized primary served load (kWh/yr), N is project life time (yr).

2.5.5. Renewable Fraction (RF)

RF is the fraction of energy delivered to the load that originated from renewable power sources. The equation is as follows:
RF = ( 1 E n o n r e n + H n o n r e n E s e r v e d + H s e r v e d ) × 100 %
where Enon-ren is the nonrenewable electrical production (kWh/yr), Hnon-ren is the nonrenewable thermal production (kWh/yr), Eserved is the total electrical load served (kWh/yr), Hserved is the total thermal load served (kWh/yr).

2.5.6. Excess Electricity Fraction

The excess electricity fraction is the ratio of total excess electricity to total electrical production. The equation is as follows:
excess   electricity   fraction = E e x c e s s E p r o d × 100 %
where Eexcess is the total excess electricity (kWh/yr), Eprod is the total electrical production (kWh/yr).

2.5.7. Occupied Area

In the calculation of the occupied area, the main considerations are PV array, wind turbine and energy storage [3]. The equation is as follows:
Occupied   area = ( A P V × N P V ) + ( A W T × N W T ) + ( A B a t × N B a t )
where A P V is the PV array area per kWp (m2), N P V is the capacity of PV system (kWp), A W T is the occupied area of one wind turbine (m2), N W T is the number of wind turbines, A B a t is occupied area of one energy storage rack (m2), N B a t is the number of energy storage racks.

2.6. Entropy Weight and TOPSIS Method

Entropy weight method is derived from Shannon entropy, that was suggested by Shannon for the numerical measurement of uncertainty in information systems [35]. The weighting factor of this evaluation method depends entirely on the value of the indicator, not on the subjective evaluation. Therefore, it has been considered as an objective method of calculating weights and has been widely applied [3].
TOPSIS is a method for relatively evaluation in limited alternative. This method is evaluated by computing relative closeness of the alternative and the ideal solution, and sorting according to the relative closeness. The higher closeness means the solution is close to the positive ideal solution, that is, the farther away from negative ideal solution, which is the best solution [36].
This study combines these two methods, first using the entropy weight method to calculate the objective weight value of each indicator, and using the TOPSIS method to calculate the relative closeness with the positive ideal solution for the weighted alternative. The calculated results are sorted so that the best solution can be found [37]. The main calculation steps and formulas in this paper are as follows:
Step 1: Initialize matrix
Construct m alternatives, the initial data matrix V of n index, and the eigenvalue of the jth index of the ith alternatives is expressed as vij, so matrix V can be defined as follows:
V = ( v i j ) m × n   =   [ v 11 v 1 n v m 1 v m n ]      
Step 2: Normalize indexes
The min-max normalization formula is used to normalize the index. If the index is positive, it is used for the benefit type. The higher value is the better. The formula is as follows:
r i j = v i j min j ( v i j ) max j ( v i j ) min j ( v i j )
If the index is negative, it is used for cost type. The lower the value the better. The formula is:
r i j = max j ( v i j ) v i j max j ( v i j ) min j ( v i j )
The matrix after normalizing can be defined as:
R = ( r i j ) m × n
Step 3: Calculate proportion and information entropy for each index
Equation (13) is used to calculate the proportion of each j index in each i alternative:
P i j = r i j i = 1 m r i j   , j = 1 , 2 , n  
Then calculate the j-index information entropy e j by using Equation (14), and use the value of e j to judge the discrete degree of the index. When e j is smaller, the discrete degree is greater, and the weight as well:
e j = K × i = 1 m P i j × l n P i j   , j = 1 , 2 , n
where the constant K = 1 l n m    
Step 4: Calculate weight for each index
Equation (15) is used to calculate the weight ω j of the jth index:
ω j = 1 e j n j = 1 n e j   , j = 1 , 2 , n
where j n ω j = 1 and 0 ω j 1 . The larger ω j means the higher importance of the objective response of the j indicator.
Step 5: Calculate the weight of normalized matrix R
Multiply the j index corresponding to each i alternatives by ω j   . The matrix Y can be calculated by Equation (16):
Y = ( r i j ) m × n × ω j = [ r 11 ω 1 r 1 n ω n r m 1 ω 1 r m n ω n ]
Step 6: Compute distance between each i alternatives and positive ideal solution D i + and negative ideal solution D i     .
The Euclidean Distance can be calculated as follows:
D i + = j = 1 n ( y i j y j + ) 2     , i = 1 , 2 , m
      D i = j = 1 n ( y i j y j ) 2     , i = 1 , 2 , m
where y j + = { max 1 j n y i j | i = 1 , 2 m } and y j = { min 1 j n y i j | i = 1 , 2 m }     .
Step 7: Calculate relative closeness for each alternative
Through the calculation of the relative closeness ( C i ), it can be judged that alternative is close to ideal solution. If the C i is close to 1, the ith alternative is close to the ideal solution:
C i = D i D i + + D i   , i = 1 , 2 , m
Step 8: Sorting the C i calculated by each i alternative, the alternative has the maximum C i is the optimization alternative in this study.

3. Hybrid Energy System Description

3.1. Hybrid Energy System Schematic Diagram

The schematic diagram of the hybrid energy system shown in Figure 9 consists of diesel generators, PV system (PVS), wind-power generation system (WGS), storage system, power conversion system (PCS) and load. PVS and WGS are operated in parallel with diesel generators and AC coupled. Electricity generated by PVS and WGS can be delivered to AC load to decline the output of diesel generator and to minimize fuel consumption [38,39].

3.2. PV System

The way of electricity generation by PV module is through the conversion of solar energy into DC power. Identification, adoption and utilization of dependable interconnection technology to assembly crystalline silicon solar cells in PV module are very important to guarantee the device functions persistently up to 20 years of design life span [33]. For this study, the PV module selected is the GTEC-G6S6A model mono-crystalline silicon solar cell type which specifications are presented in Table A1 of Appendix A. South installation direction, 10° incline, 5.42 m2 per kWp, 25 years of serving life and 80% derating factor are considered. Equation (20) is used by HOMER to calculate the power output of PV system [40,41]:
P p v = P p v , S T C f p v G T G T , S T C [ 1 + K P ( T C T S T C ) ]
where Ppv,STC is PV system rated power (kWp), fpv is PV derating factor (%), GT is solar irradiance on the surface of the PV module (kW/m2), GT,STC is standard solar irradiance (1 kW/m2), KP is the PV module temperature coefficient (−0.4003%/°C), TC is temperature of the PV module (°C), TSTC is temperature of PV module under the standard test conditions (25 °C).

3.3. WG System

The WGs converts wind kinetic energy into electricity using wind turbine blades. The architecture of WG system in the study is AC coupled hybrid. The wind turbine used for simulation is the Bergey XL 10 Wind Turbine complete set [42] with AC output, rated power 10 kW at 12 m/s, minimum wind speed 2.5 m/s and swept area 38.5 m2. The hub height is 30m, power curve of wind turbine is displayed in Figure 10, and the lifetime is set to 20 years [43].
The calculation of the power law profile in HOMER is based on Equation (21) to estimate the wind speed of different hub heights [44]:
U h u b = U r e f × ( H h u b H r e f ) α
where Uref is the reference wind speed (m/s), the value is provided by NASA measures at a height of 50 m from the surface. Hhub is the hub height (m). Href is the measured height of the reference wind speed (m). α is surface roughness, the value is set to 0.14 [44,45].

3.4. Storage System

A storage system will be used to regulate the power and minimize the influence the quality of energy on intermittent renewable energy sources in the proposed HES. It accumulates and transfers energy from PVs, WGs and diesel to a rechargeable Li-ion thin film during excess electricity generation. In this paper a high energy density Samsung SDI M2-R084 model lithium-ion battery [46] was selected as storage system with the following specifications: The lowest expected lifespan of each rack is five years and each rack holds 11 modules. Each module has 22 series-connected cells. The capacity is 94 Ah and the rated capacity of each storage rack is 84 kWh. The area occupied by one rack is 0.31 m2. The voltage rating is 774–1004 V and the lowest state of charge (SOC) is 20%. The C rate is 1 C and lifetime throughout is 337,123 kWh with 4000 cycles.

3.5. Power Conversion System

A dual-direction DC-AC converter is used for power conversion. In HES, when excess electricity is produced by diesel, PV and WG, the excess AC power will be changed into DC and stored in battery to supply it back to AC load when required. Conversion performance of 95% and 10 years of lifespan is assumed in the simulation.

3.6. Diesel Generators

The power supply system of the island discussed in this study uses diesel generators (DGs) to supply power 24 h a day. The main power supply, with a total capacity of 2850 kW, contains five DGs and the supply schedule is accordingly to meet the load demand.
To simplify the process of simulation analysis, set operation time of DG1 and DG2 to 0–11 a.m., operation time of DG3 and DG4 to 12–23 p.m., DG5 to backup, minimum load to 25%, and lifetime to 131,400 h. The simulation parameters of diesel generators are as shown in Table 2.

3.7. System Dispatch Strategy

System dispatch approach in HOMER is primarily for managing the operational rules of the power generation equipment and energy storage. The simulation software has two options: cycle charging strategy and load following strategy and [34]. HES operation in this case study is based on a DG power supply. PV and WG are used as auxiliary power supplies. Increasing the penetration of the PVs and WGs reduces fuel consumption. The DGs only generate sufficient power to fulfill load demand. DG has the limited base load output, so when PVs and WGs have excess power, the storage will charge, but if the energy storage is full and there is still excess energy that cannot be stored or used, the software will consider that to be excess electricity, as shown in (7). As in the actual operation of the HES, in the above scenario, the output of the PVs or WGs power converter must be controlled to reduce their output to maintain balance and/or damping load is required. Based on the operation mode, the dispatch mode of the power supply system must select the load following strategy and so as to calculate various costs such as fuel, operation and maintenance, and replacement.

4. Component Cost and Financial Assumption

4.1. System Component Cost

The summary of component costs used in this study is from the Taiwan System Integration Company, and is presented in Table 3. The cost consists of capital cost, replacement cost, operation and maintenance (O&M). In order to simplify the analysis, the capital and replacement cost is the same.
Capital cost of PVs is 4000 $/kW, including PV module, PV inverter, transportation, installation engineering. Capital cost of WGs is 5800 $/kW, including wind turbine, wind inverter, 30 m tower and cement foundation, transportation, installation engineering and so on. PVs, WGs and storage operate in parallel with the existing five DGs. To simplify the analysis, the capital cost of DG is not included in the calculation. The estimates of the cost of remaining components include transportation, and installation engineering.

4.2. Interest Rate and Inflation Rate

Figure 11 and Figure 12 depict the interest rate and inflation rates of Bangko Sentral NG Pilipina (BSP) in recent years. Interest rates have been adjusted to 4.75% in 7 February2019 [47]. Refering to the BSP announcement in February 2019, the inflation rate is 4.4% [48]. Since January 2013 to February 2019, the highest interest rate was 4.75%, the lowest was 3%, so the average was 3.579%. The highest inflation rate was 6.7%, the lowest was −2%, and the average was 2.716% [48,49]. In this paper, the real discount rate is the average value in the statistical period, and the value calculated by (1) is 0.84%. The lifetime is set to 20 years.

5. Simulation Results and Discussion

The flowchart of systems operation for cases 1 to 7 are presented in Figure A1 of Appendix A.

5.1. Case 1: Stand-Alone Diesel System

Simulation results are as shown in Table 4. Total annual fuel intake of the five DGs is 1,623,100 L/y (4447 L/d), the total annual power supply is 6,195,877 kWh/y, average fuel intake per kWh is 0.26 L/kWh, and annual total carbon dioxide (CO2) emission is 4,274,156 kg/y.
No capacity shortage problem throughout the year and it meets the annual load requirements. DG5 is an auxiliary generator, which starts when the load demand reaches 90% of the rated capacity of two DGs to avoid any power supply shortage. The load ratio of DG5 is lower than that of other diesel generator sets, so the fuel consumption required per kWh (liter/kWh) is also relatively higher than that of other diesel generator sets. As indicated in Table 5, total NPC of the five DGs is $29,650,884 and the total COE is 0.2609 $/kWh. Among costs, the cost of oil is the largest and it takes 80% of the total NPC.

5.2. Hybrid Energy System without Storage

5.2.1. Case 2: PV-Diesel HES

The PV capacity configuration scheme for minimum COE of a PV-diesel HES is analyzed and the change of PV capacity is set from 50 to 2000 kWp and the step interval is 50 kWp in the simulation. The simulation results are shown in Figure 13. Because the analyzed system does not include an energy storage system, as the PV capacity rises, the percentage of renewable fraction (RF) and fuel saving will improve. The increment will reduce in accordance with the increase of PV capacity and the excess electricity fraction will increase relatively.
The varying PV capacity on COE and RF are as shown in Figure 14. When the capacity of PVs is 550 kWp and PV operates with the DG in parallel, the lowest COE is 0.2583 $/kWh, which is slightly lower than the COE (0.2609 $/kWh) in the DG-only case. As shown in Table 6, the RF is 12.4%, the excess electricity fraction is 0.2% and the fuel saving is −11.17%. When the PV capacity continuously increases, the investment cost will also increase. Because the power generated by PVs is not entirely used by loads to minimize the DG fuel consumption, the COE will increase relatively. Table 7 shows economic characteristics of the lowest COE PV-diesel HES. Cost of oil is still the largest proportion, which is 72% of the total NPC. The value of NPC of PVs with 550 kWp total capacity is only 8% of the total NPC. Figure 15 shows the annual PVS power production by the lowest COE PV-diesel HES. The output power of quarter 2 (April to June) and quarter 3 (July to September) can be observed, which is higher than quarter 1 (January to March) and quarter 4 (October to December).

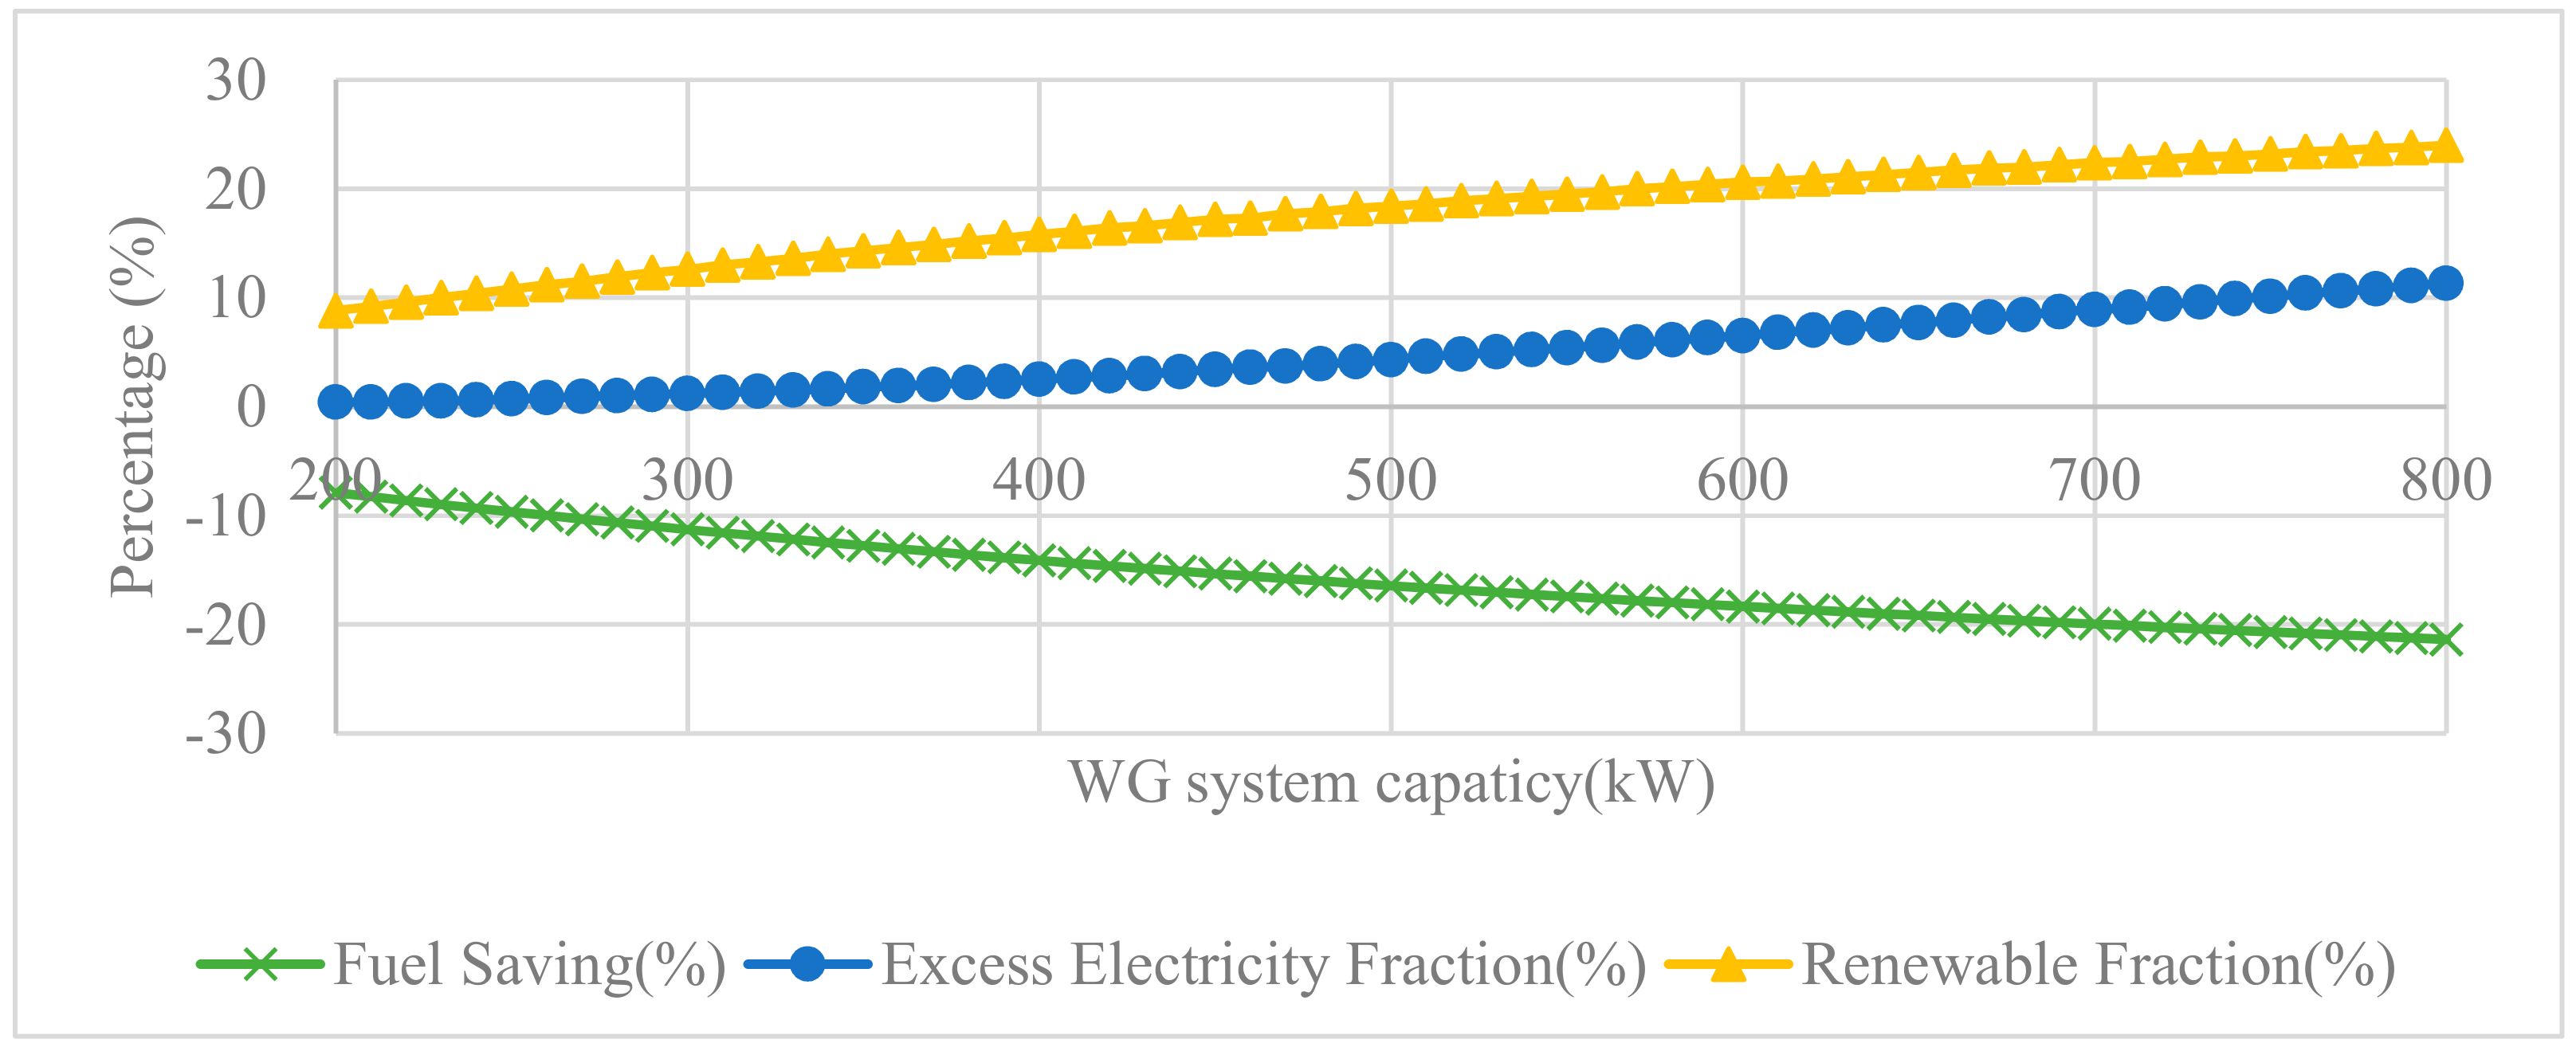
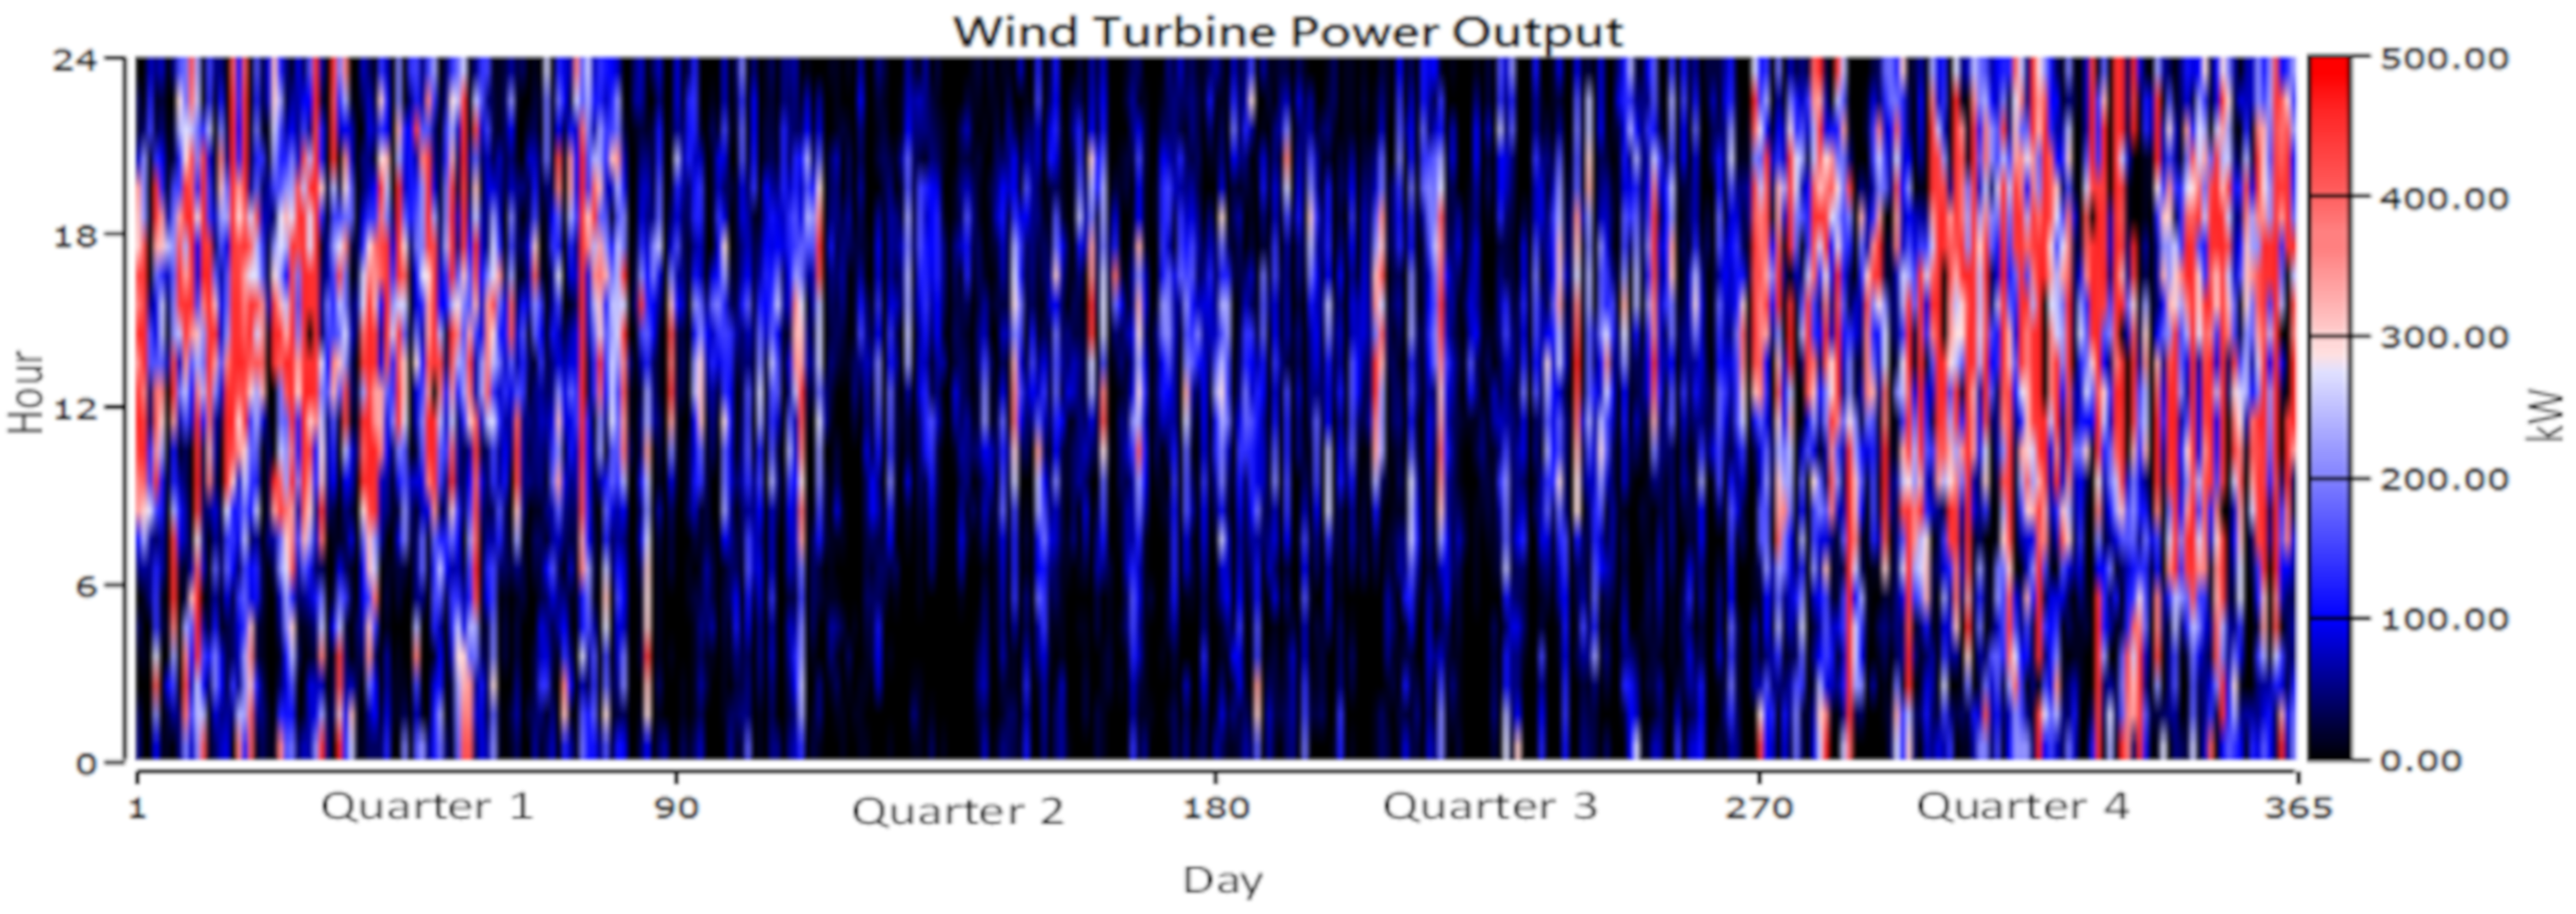
5.2.2. Case 3: Wind-Diesel HES

Using the analysis method mentioned in Section 5.2.1, we set the change of WG capacity between 200–800 kW and the interval at 10 kW to find the configuration with the lowest COE. As presented in Figure 16, trend of the curve is like the PV-diesel HES one. When the capacity of WGs is 380 kWp and with DG in parallel operation, the minimum COE calculated is 0.2541 $/kWh and this result is slightly less than COE in Case 1 and Case 2, as shown in Figure 17.
As shown in Table 8, the capacity factor of WGs is 32.28%, which is higher than 16.32% of PVs. Therefore, the installation capacity of WG is lower than PV but the system still has lower COE and higher RF: RF is 13.59%, the excess electricity fraction is 2.2%, and the fuel saving is −13.59%.
Table 9 shows the cost simulation of the lowest COE wind-diesel HES in 380 kW total of capacity. The COE is lower than the COE of DG 1–5 and that of PVs. Figure 18 shows the distribution of annual WGs output power and displays that output power of quarter 1 and 4 is higher than that of quarter 2 and 3. The trend is opposite to the result of the curve of quarter output power of PVs.

5.2.3. Case 4: PV-Wind-Diesel HES

As shown in Figure 15 and Figure 18, PVs and WGs have different seasonal power generation characteristics, so the hybrid power supply can be complementary to improve RF. After simulation analysis, the hybrid power system has PVs of 200 kWp and WGs of 340 kW, which is the lowest capacity configuration. As depicted in Table 10 the analysis of electrical characteristics, RF is 18.1%, fuel saving is −16.18%, which is better than Case 1 and 2. In Table 11, the economic characteristics analysis indicates that COE is 0.2539 $/kWh and result is slightly lower than Case 3. In the comparison, the result of Case 4 has the lowest COE in all of capacity configuration without the energy storage HES.

5.3. Hybrid Energy System with Storage

5.3.1. Case 5: PV/Diesel/Storage HES

As the capacity of PV or WG increases, the RF will increase, but the excess electricity fraction will also increase. Although it will waste the energy, the problem could be enhanced by installing an energy storage. Capacity configuration for PV-diesel-storage HES of the lowest COE in each RF level addressed in this section. The setting parameters are as follows: RF is 25%–50%, the interval is 5% and the excess electricity fraction must be less than 5% considering the utilization rate of the energy.
Table 12 lists the electrical characteristics of PV-diesel-storage HES. The result displays that higher RF can let the effect of fuel saving better.
Table 13 presents the economic characteristics of PV-diesel-storage HES. In RF 25% hybrid system configuration: PVs capacity is 1200 kWp, energy storage capacity is 1260 kWh and operates in parallel with DG. Above all, the minimum COE can be obtained is 0.2864 $/kWh. The cost and storage capacity have the significant difference in RF 45% and 50% because the simulation constraint should be satisfied: The capital cost difference is 1.35 times and the COE difference is 1.13 times.

5.3.2. Case 6: Wind-Diesel-Storage HES

Simulation analysis shows that WG power gen ration was concentrated in quarters 1 and 4, and the load power consumption during this period is lower than that of quarters 3 and 4. When the installed capacity of WGs and storage is more than RF 35%, the excess electric fraction has exceeded 5% and there is no system capacity configuration meets the set simulation conditions.
Table 14 and Table 15 are the simulation results of the electrical and economic characteristics, respectively. In RF 25% hybrid system configuration: The capacity of WGs is 680 kW, storage capacity is 2520 kWh and operates in parallel with DG. Above all, the lowest COE can be obtained is 0.2874 $/kWh. The cost and storage capacity have the significant difference in RF 30% and 35% because the simulation constraint should be satisfied. The cost of the system configuration has increased significantly in RF 35%.

5.3.3. Case 7: PV-Wind-Diesel-Storage HES

The simulation results of the electrical and economic characteristics of the PV-wind-diesel-storage HES are shown in Table 15 and Table 16, respectively. The capital cost, NPC and COE in case 7 are lower than in cases 5 and 6 when RF is 25–50%.
In RF 25% hybrid system configuration: The minimum capital cost is $5,317,506, the NPC is $31,100,367 and the COE is 0.2737 $/kWh. Because solar energy and wind energy have characteristics of seasonal power complementary, the required capacity of PVs, WGs and storage are lower than that of Cases 5 and 6, are 400 kWp, 440 kW and 168 kWh, respectively.

5.3.4. Optimal Capacity Configuration Analysis of the PV-Wind-Diesel-Storage HES

As mentioned in Section 5.3.3, if the cost is the main indicator, Case 7 has the lowest COE HES. This section uses the entropy weight and TOPSIS method and regards the fuel saving, capital cost, and COE as the indicators. Because the available space on the island is limited, the area occupied by the equipment is also considered. Above all, we evaluate the optimal hybrid system configuration for Case 7 at RF 25%−50%. Substituting the values from Table 17 into Equations (9)–(15), the information entropy and weighting of each index can be obtained. The weight of fuel saving is the highest, as shown in Table 18. Through the Equations (16)–(19), the relative closeness value and sorting result of each alternative can be obtained, as shown in Table 19. Therefore, the best system capacity configuration for this stud: The maximum relative closeness is the system capacity configuration in RF 35%, the PVs capacity is 950 kWp, the WGs capacity is 410 kW, and the energy storage capacity is 1680 kWh.

5.4. Sensitivity Analysis

According to the analysis result in Section 5.3.4, the GHI, wind speed, diesel fuel price, and load consumption for RF 35% PV-wind-diesel-storage HES are used to discuss the economic and electrical of the system.

5.4.1. Global Horizontal Irradiation and Wind Speed

We set the value of GHI and wind speed 5.14 kW/m2/d and 7.22 m/s in ±20% changes, respectively, i.e., GHI from 4.09 to 6.17 kW/m2/d, and wind speed from 5.78 m/s to 8.66 m/s. According to Figure 19 and Figure 20, when GHI or wind speed increases, the RF will continue to increase and this will let the DG fuel consumption and COE reduce. When GHI is 6.17 kW/m2/d and wind speed is 8.66 m/s, RF can rise to 40.7% and COE can be reduced to 0.2747 $/kWh.

5.4.2. Diesel Fuel Price

We set the diesel fuel price change from 0.49–1.18 $/L, which is 1.25 times the maximum and minimum values during the statistics period of oil price, as the change range of the oil price. Figure 21 show the impact on NPC and COE under different fuel price scenarios. When oil price is 1 $/L, NPC and COE are as high as $36,434,464 and 0.3207 $/kWh, respectively.

5.4.3. Load Consumption

We set the load consumption to vary from 16,974 to 20,000 kWh/d. As depicted in Figure 22, when the load consumption rises and the capacity configuration of PVs, WGs and storage do not change, the DGs will increase their power generation to meet the load demand, so the RF will decrease and the fuel usage will increase. As shown in Figure 23, when the load consumption increases, the fuel consumption, the fuel cost and the NPC rise because the power generation of DG increases. It can also be observed from (5) that the load consumption increases so the COE decreases.

6. Conclusions

Promoting the infrastructure of renewable energy is a global trend, especially in areas with insufficient power supply and low electrification. Renewable energy is regarded as a key to improving economic and development. This paper uses the Philippine islands, and a renewable energy and hybrid power supply to supplement existing diesel generators, to be the study case.
We use HOMER to simulate and investigate the techno-economic of different power supply systems’ containing stand-alone diesel, PV-diesel HES, wind-diesel HES, PV-wind-diesel HES, PV-diesel-storage HES, wind-diesel-storage HES, PV-wind-diesel-storage HES. The study also uses entropy weight and TOPSIS method to evaluate optimal capacity configuration. The conclusions of the analysis are as follows:
  • Based on the climate and load demand on the island, we simulate HES without an installing energy storage system such as PV-diesel HES, wind-diesel HES and PV-wind-diesel HES. Because solar energy and wind energy have characteristics of complementary seasonal power, the lowest COE obtained is 0.2539 $/kWh in PV-wind-diesel HES. The result is lower than the COE in the DG-only case. The capacity of PVs and WGs are 200 kWp and 340 kW, respectively. In addition, RF is 18.1% and fuel saving is −16.18%.
  • As the capacity of PVs or WGs increases, the RF will increase, but the excess electricity fraction will also increase. Although this will waste energy, the problem is mitigated by installing an energy storage system. In the three kinds of HES with the energy storage, discussing the capacity configuration of the lowest COE in each RF stage for PV-diesel-storage HES and the constraints are as follows: RF is 25%–50%, the interval is 5% and the excess electricity fraction must be less than 5% considering the utilization rate of the energy. In RF 25% hybrid system configuration: the minimum COE obtained is 0.2737 $/kWh. Required capacity of PVs, WGs and storage are 400 kWp, 440 kW and 168 kWh, respectively. The fuel savings is −22.38%.
  • For the system with energy storage, the result of RF 35% is the best capacity configuration in this research: PVs capacity is 950 kWp, WGs capacity is 410 kW, and energy storage capacity is 1680 kWh.
  • RF 35% PV-wind-diesel-storage HES is used to analyze the sensitivity. When GHI and wind speed increase, RF will continuously increase, so the fuel consumption of the DGs will also decrease. Since the cost of fuel intake is the maximum percentage of all costs, oil price increase has a significant influence on COE. As electricity demand rises, DG will increase the power generation to fulfill the demand. This causes the RF to decline, the fuel consumption and NPC the rise, and COE conversely.

Author Contributions

Conceptualization, C.-C.K.; Data curation, W.-B.W.; Formal analysis, C.-T.T. and T.M.B.; Investigation, W.-B.W. and C.-C.K.; Methodology, C.-T.T. and T.M.B.; Resources, C.-T.T.; Supervision, C.-C.K.; Writing—original draft, W.-B.W.; Writing—review & editing, T.M.B. All authors have read and agreed to the published version of the manuscript.

Funding

Supported of this research by the Asian Productivity Organization Center of Excellence on Green Productivity (APO COE GP) Project and Ministry of Science and Technology of the Republic of China (Grant No. MOST108-3116-F-042A-004-CC2) are gratefully acknowledged.

Conflicts of Interest

The authors declare no conflicts of interest.

Appendix A

Table A1. Electrical parameters of the PV modules.
Electrical Parameters
Rated power @ standard test conditions300 Wp
Open circuit voltage, Voc39.24 V
Maximum power point voltage, Vmp31.51 V
Short circuit current, Isc9.93 A
Maximum power point current, Imp9.52 A
Temperature coefficient of maximum power−0.4003%/°C
Temperature coefficient of open circuit voltage−0.2906%/°C
Temperature coefficient of short circuit current0.0530%/°C
Module efficiency18.44%
Figure A1. Flowchart of system operation in various cases 1–7.
Energies 13 00008 g0a1

References

  1. Ma, T.; Javed, M.S. Integrated sizing of hybrid PV-wind-battery system for remote island considering the saturation of each renewable energy resource. Energy Convers. Manag. 2019, 182, 178–190. [Google Scholar] [CrossRef]
  2. Krishan, O.; Suhag, S. Techno-economic analysis of a hybrid renewable energy system for an energy poor rural community. J. Energy Storage 2019, 23, 305–319. [Google Scholar] [CrossRef]
  3. Lu, J.; Wang, W.; Zhang, Y.; Cheng, S. Multi-Objective Optimal Design of Stand-Alone Hybrid Energy System Using Entropy Weight Method Based on HOMER. Energies 2017, 10, 1664. [Google Scholar] [CrossRef] [Green Version]
  4. Kartite, J.; Cherkaoui, M. Study of the different structures of hybrid systems in renewable energies: Cooling different structures of on hybrid systems renewable energies: A review Cherkaoui Assessing the Jihane feasibility using the heat demand-outdoor Cherkaoui temperature function for a long-term district heat demand forecast. Energy Procedia 2019, 157, 323–330. [Google Scholar]
  5. Padrón, I.; Avila, D.; Marichal, G.N.; Rodríguez, J.A. Assessment of Hybrid Renewable Energy Systems to supplied energy to Autonomous Desalination Systems in two islands of the Canary Archipelago. Renew. Sustain. Energy Rev. 2019, 101, 221–230. [Google Scholar] [CrossRef]
  6. Solar Vision 2025; Canadian Solar Industries Association: Ottawa, ON, Canada, 2010; Available online: http://www.pvinnovation.ca/files/CANSIA_Solar_Vision_2025_FINAL[1].pdf (accessed on 25 February 2019).
  7. Brenna, M.; Longo, M.; Yaici, W.; Abegaz, T.D. Simulation and Optimization of Integration of Hybrid Renewable Energy Sources and Storages for Remote Communities Electrification. In Proceedings of the 2017 IEEE PES Innovative Smart Grid Technologies Conference Europe (ISGT-Europe), Torino, Italy, 26–29 September 2017; pp. 1–6. [Google Scholar]
  8. Delucchi, M.A.; Jacobson, M.Z. Providing all global energy with wind, water, and solar power, Part II: Reliability, system and transmission costs, and policies. Energy Policy 2011, 39, 1170–1190. [Google Scholar] [CrossRef]
  9. Valenciaga, F.; Puleston, P.F. Supervisor Control for a Stand-Alone Hybrid Generation System Using Wind and Photovoltaic Energy. IEEE Trans. Energy Convers. 2005, 20, 398–405. [Google Scholar] [CrossRef]
  10. Wang, L.; Singh, C. Compromise between Cost and Reliability In Optimum Design of An Autonomous Hybrid Power System Using Mixed-Integer PSO Algorithm. In Proceedings of the IEEE 2007 International Conference on Clean Electrical Power, Capri, Italy, 21–23 May 2007. [Google Scholar]
  11. Kadda, F.Z.; Zouggar, S.; el Hafyani, M.; Rabhi, A. Contribution to the Optimization of the Electrical Energy Production from a Hybrid Renewable Energy System. In Proceedings of the IEEE 2014 5th International Renewable Energy Congress (IREC), Hammamet, Tunisia, 25–27 March 2014; pp. 1–6. [Google Scholar]
  12. Das, B.K.; Zaman, F. Performance analysis of a PV/Diesel hybrid system for a remote area in Bangladesh: Effects of dispatch strategies, batteries, and generator selection. Energy 2019, 169, 263–276. [Google Scholar] [CrossRef]
  13. Halabi, L.M.; Mekhilef, S. Flexible hybrid renewable energy system design for a typical remote village located in Tropical climate. J. Clean. Prod. 2018, 177, 908–924. [Google Scholar] [CrossRef]
  14. Yazici, M.S.; Yavasoglu, H.A.; Eroglu, M. A mobile off-grid platform powered with photovoltaic / wind / battery / fuel cell hybrid power systems. Int. J. Hydrogen Energy 2013, 38, 11639–11645. [Google Scholar] [CrossRef]
  15. Zhou, X.; Feng, C. The impact of environmental regulation on fossil energy consumption in China: Direct and indirect effects. J. Clean. Prod. 2017, 142, 3174–3183. [Google Scholar] [CrossRef]
  16. Ma, W.; Xue, X.; Liu, G. Techno-economic evaluation for hybrid renewable energy system: Application and merits. Energy 2018, 159, 385–409. [Google Scholar] [CrossRef]
  17. Rehman, S.; Al-Hadhrami, L.M. Study of a solar PV-diesel-battery hybrid power system for a remotely located population near Rafha, Saudi Arabia. Energy 2010, 35, 4986–4995. [Google Scholar] [CrossRef]
  18. Nayak, A.; Kasturi, K.; Nayak, M.R. Cycle-charging dispatch strategy based performance analysis for standalone PV system with DG & BESS. In Proceedings of the IEEE 2018 Technologies for Smart-City Energy Security and Power (ICSESP), Bhubaneswar, India, 28–30 March 2018; pp. 1–5. [Google Scholar]
  19. Das, B.K.; Hoque, N.; Mandal, S.; Pal, T.K.; Raihan, M.A. A techno-economic feasibility of a stand-alone hybrid power generation for remote area application in Bangladesh. Energy 2017, 134, 775–788. [Google Scholar] [CrossRef]
  20. Ghasemi, A.; Enayatzare, M. Optimal energy management of a renewable-based isolated microgrid with pumped-storage unit and demand response. Renew. Energy 2018, 123, 460–474. [Google Scholar] [CrossRef]
  21. Ma, T.; Yang, H.; Lu, L. Electrical Power and Energy Systems Study on stand-alone power supply options for an isolated community. Int. J. Electr. Power Energy Syst. 2015, 65, 1–11. [Google Scholar] [CrossRef]
  22. Ismail, M.S.; Moghavvemi, M.; Mahlia, T.M.I. Techno-economic analysis of an optimized photovoltaic and diesel generator hybrid power system for remote houses in a tropical climate. Energy Convers. Manag. 2013, 69, 163–173. [Google Scholar] [CrossRef]
  23. Chauhan, A.; Saini, R.P. A review on Integrated Renewable Energy System based power generation for stand-alone applications: Con fi gurations, storage options, sizing methodologies and control. Renew. Sustain. Energy Rev. 2014, 38, 99–120. [Google Scholar] [CrossRef]
  24. Guangqian, D.; Bekhrad, K.; Azarikhah, P.; Maleki, A. A hybrid algorithm based optimization on modeling of grid independent biodiesel-based hybrid solar/wind systems. Renew. Energy 2018, 122, 551–560. [Google Scholar] [CrossRef]
  25. Akiki, H.; Eng, C.; Avenue, T. A decision support technique for the design of hybrid solar-wind power system. IEEE Trans. Energy Convers. 1998, 13, 76–83. [Google Scholar]
  26. Venkataramanan, G.; Marnay, C.; Siddiqui, A.S.; Stadler, M.; Chandran, B.; Firestone, R. Optimal Technology Selection and Operation of Commercial-Building Microgrids. IEEE Trans. Power Syst. 2008, 23, 975–982. [Google Scholar]
  27. Giraud, F.; Member, I.S.; Salameh, Z.M.; Member, S. Steady-State Performance of a Grid-Connected Rooftop Hybrid Power System with Battery Storage of Massachusetts, Lowell. IEEE Power Eng. Rev. 2001, 21, 54. [Google Scholar] [CrossRef]
  28. Baneshi, M.; Hadianfard, F. Techno-economic feasibility of hybrid diesel/PV/wind/battery electricity generation systems for non-residential large electricity consumers under southern Iran climate conditions. Energy Convers. Manag. 2016, 127, 233–244. [Google Scholar] [CrossRef]
  29. Murugaperumal, K.; Vimal, P.A.D. Feasibility design and techno-economic analysis of hybrid renewable energy system for rural electrification. Sol. Energy 2019, 188, 1068–1083. [Google Scholar] [CrossRef]
  30. Batanes—Wikipedia. Available online: https://en.wikipedia.org/wiki/Batanes (accessed on 16 February 2019).
  31. Welcome to HOMER. Available online: https://www.homerenergy.com/ (accessed on 25 February 2019).
  32. Oil Monitor as of 16 October 2018 DOE Department of Energy Portal. Available online: https://www.doe.gov.ph/oil-monitor-16-october-2018 (accessed on 19 March 2019).
  33. Halabi, L.M.; Mekhilef, S.; Olatomiwa, L.; Hazelton, J. Performance analysis of hybrid PV/diesel/battery system using HOMER: A case study Sabah, Malaysia. Energy Convers. Manag. 2017, 144, 322–339. [Google Scholar] [CrossRef]
  34. Homer Energy, Welcome to HOMER. 2017. Available online: https://www.homerenergy.com/products/pro/docs/3.11/index.html (accessed on 16 February 2019).
  35. Shannon, C.; Weaver, W. The Mathematical Theory of Communication; The University of Illinois Press: Champaign, IL, USA, 1964. [Google Scholar]
  36. Shi, G.; Buffen, A.M.; Ma, H.; Hu, Z.; Sun, B.; Li, C.; Li, Y. Science Direct Distinguishing summertime atmospheric production of nitrate across the East Antarctic Ice Sheet. Geochim. Cosmochim. Acta 2018, 231, 1–14. [Google Scholar] [CrossRef]
  37. Huang, J. Combining Entropy Weight and TOPSIS Method for Information System Selection. In Proceedings of the 2008 IEEE Conference on Cybernetics and Intelligent Systems, Chengdu, China, 21–24 September 2008; pp. 1281–1284. [Google Scholar]
  38. Abusara, M.; Mallick, T.; al Badwawi, R.; Abusara, M.; Mallick, T. A Review of Hybrid Solar PV and Wind Energy System. Smart Sci. 2016, 3, 127–138. [Google Scholar]
  39. Kolhe, M.L.; Ranaweera, K.M.I.U.; Gunawardana, A.G.B.S. Techno-economic sizing of off-grid hybrid renewable energy system for rural electrification in Sri Lanka. Sustain. Energy Technol. Assess. 2020, 11, 53–64. [Google Scholar] [CrossRef]
  40. Li, C.; Ge, X.; Zheng, Y.; Xu, C.; Ren, Y.; Song, C. Techno-economic feasibility study of autonomous hybrid wind/PV/battery power system for a household in Urumqi, China. Energy 2013, 55, 263–272. [Google Scholar] [CrossRef]
  41. Rohani, G.; Nour, M. Techno-economical analysis of stand-alone hybrid renewable power system for Ras Musherib in United Arab Emirates. Energy 2014, 64, 828–841. [Google Scholar] [CrossRef]
  42. Sansone, G.; Hills, O.; Bohl, R. Power Your Dream with the Wind. 2001. Available online: www.bergey.com (accessed on 19 March 2019).
  43. Nasser, Y.; Oumarou, H.; Lucien, M.; Benoit, N.; Jean, N. Analyzing of a Photovoltaic/Wind/Biogas/Pumped- Hydro Off-Grid Hybrid System for Rural Electrification in Sub-Saharan Africa—Case Study of Djoundé in Northern Cameroon. Energies 2018, 11, 2644. [Google Scholar]
  44. Adaramola, M.S.; Agelin-chaab, M.; Paul, S.S. Analysis of hybrid energy systems for application in southern Ghana. Energy Convers. Manag. 2015, 88, 284–295. [Google Scholar] [CrossRef]
  45. Adaramola, M.S.; Agelin-chaab, M.; Paul, S.S. Assessment of wind power generation along the coast of Ghana. Energy Convers. Manag. 2015, 77, 61–69. [Google Scholar] [CrossRef]
  46. ESS Batteries by Samsung SDI Top Safety & Reliability Solutions. Available online: http://www.samsungsdi.com/upload/ess_brochure/201803_SamsungSDI%20ESS_EN.pdf (accessed on 16 February 2019).
  47. Bangko Sentral ng Pilipinas—Publications & Research. Available online: http://www.bsp.gov.ph/publications/media.asp?id=4935 (accessed on 25 February 2019).
  48. Philippines inflation Rates. Available online: http://www.bsp.gov.ph/statistics/spei_new/tab34_inf.htm (accessed on 25 February 2019).
  49. Philippines Interest Rate 2019 Data Chart Calendar Forecast News. Available online: https://tradingeconomics.com/philippines/interest-rate (accessed on 25 February 2019).
Figure 1. Geographic location of Batan Island.
Energies 13 00008 g001
Figure 2. The Basco diesel power plant.
Energies 13 00008 g002
Figure 3. HOMER software simulation analysis process architecture diagram.
Energies 13 00008 g003
Figure 4. Global horizontal irradiation-monthly data.
Energies 13 00008 g004
Figure 5. Wind speed monthly data.
Energies 13 00008 g005
Figure 6. Daily load profile for each 12 months.
Energies 13 00008 g006
Figure 7. Load power consumption frequency distribution.
Energies 13 00008 g007
Figure 8. Diesel fuel price data.
Energies 13 00008 g008
Figure 9. Schematic diagram of the hybrid energy system.
Energies 13 00008 g009
Figure 10. Wind turbine power curve.
Energies 13 00008 g010
Figure 11. Interest rate information for Taiwan since January 2013 to February 2019.
Energies 13 00008 g011
Figure 12. Inflation rate information for Taiwan since January 2013 to February 2019.
Energies 13 00008 g012
Figure 13. Effect of varying PVS capacity on fuel saving, RF and excess electricity fraction.
Energies 13 00008 g013
Figure 14. Effect of varying PVS capacity on COE and RF.
Energies 13 00008 g014
Figure 15. Annual PVS power production by lowest COE PV-diesel HES.
Energies 13 00008 g015
Figure 16. Effect of varying WGS capacity on fuel saving, RF and excess electricity fraction.
Energies 13 00008 g016
Figure 17. Effect of varying WGS capacity on COE and RF.
Energies 13 00008 g017
Figure 18. Annual WGS power production by the lowest COE wind-diesel HES.
Energies 13 00008 g018
Figure 19. Effect of varying GHI and wind speed on RF generated by optimal PV-wind-diesel-storage HES.
Energies 13 00008 g019
Figure 20. Effect of varying GHI and wind speed on COE generated by PV-wind-diesel-storage HES.
Energies 13 00008 g020
Figure 21. Effect of varying diesel fuel price on NPC and COE.
Energies 13 00008 g021
Figure 22. Effect of varying load consumption on fuel consumption and RF.
Energies 13 00008 g022
Figure 23. Effect of varying load consumption on NPC and COE.
Energies 13 00008 g023
Table 1. Hybrid power systems with various storage technologies.
Hybrid Energy SystemsStorageOperating StrategyGrid ConnectionMethodologyPerformance Measures
PV/Diesel/Batt [12]LA, Li-ionLF, CC, CDOff-gridHOMERNPC, COE, EE, RF, DF, CO2 emissions
PV/Diesel/Batt [13]LALFOff-grid/grid connectedHOMERNPC, COE, RF, CO2 emissions
PV/Diesel/Batt [17]LALFOff-gridHOMERNPC, COE, EE, CO2 emissions
PV/Diesel/Batt [18]Li-ionCCOff-gridMATLABNPC
PV/Wind/Biogas/Diesel/Batt [19]LA-Off-gridHOMERNPC, COE, RF, O&M cost
PV/Wind/Diesel/Batt [28]CELLCUBELFOff-grid/grid connectedHOMERNPC, COE, RF, CO2 emissions
PV/Wind/Biogas/Batt [29]LALF, CCOff-gridHOMERNPC, COE, RF, CO2 emissions
Key: CC: Cyclic Charging; CD: Combined Dispatch; DF: Duty Factor; EE: Excess Energy; COE: Cost of Energy; HOGA: Hybrid Optimization by Genetic Algorithms; LA: Lead Acid; Li-ion: Lithium-ion; RF: Renewable Friction.
Table 2. Simulation parameters of the diesel generators.
NumberPrime PowerTypeFuel Consumption Slope (Liter/kWh)Operation Schedule
DG1600 kWCummins QSK23-G30.2376AM 00–11
DG2600 kWCummins QSK23-G30.2376AM 00–11
DG3600 kWCummins KTA38-G10.2273PM 12–23
DG4600 kWDenyo DCA series0.2351PM 12–23
DG5450 kWMAN B & W-8L20/270.2440Backup
Table 3. Summary of component costs.
DescriptionData Description
PV system
  Capital cost ($/kW)4000
  Replacement cost ($/kW)4000
  Operation and maintenance cost ($/kW/yr)20
WG system
  Capital cost ($/kW)5800
  Replacement cost ($/kW)5800
  Operation and maintenance cost ($/kW/yr)40
Storage system
  Capital cost ($/kWh)690
  Replacement cost ($/kWh)690
  Operation and maintenance cost ($/kWh/yr)5
Power converter
  Capital cost ($/kW)700
  Replacement cost ($/kW)700
  Operation and maintenance cost ($/kW/yr)1
Diesel generator
  Capital cost ($/kW)0
  Replacement cost ($/kW)400
  Operation and maintenance ($/h)0.03
Table 4. Electrical characteristics of stand-alone diesel system.
ComponentOperation ScheduleHours of Operation (H/yr)Electrical Production (kWh/yr)Fuel Consumption (L/yr)Specific Fuel Consumption (L/kWh)
DG1AM 0–1143802,002,495511,2300.26
DG2AM 0–114380783,942221,7140.28
DG3PM 12–2343802,373,373606,7950.26
DG4PM 12–2343801,010,918275,6410.27
DG5Backup21925,15977200.31
System6,195,8871,623,1000.26
Table 5. Economic characteristics of stand-alone diesel system.
ComponentCapitalReplacementO&MFuelSalvageNPCCOE
($)($)($)($)($)($)($/kWh)
DG1001,445,8697,500,47008,946,3390.2436
DG2001,445,8693,252,85504,698,7240.3268
DG3001,445,8698,902,549010,348,4180.2377
DG4001,445,8694,044,04705,489,9160.2961
DG50054,220113,2670167,4870.3630
System005,837,69623,813,188029,650,8840.2609
Table 6. Electrical characteristics of lowest COE PV-diesel HES.
GensetPVSElectrical ProductionExcess ElectricityPVS Capacity FactorRenewable FractionFuel ConsumptionFuel Saving
(kW)(kWp)(kWh/yr)(kWh/yr)(%)(%)(liter/yr)(%)
2850 (5 sets)5506,214,61219,231.4 (0.3%)16.3212.41,441,803−11.17
Table 7. Economic characteristics of the lowest COE PV-diesel HES.
ComponentCapitalReplacementO&MFuelSalvageNPCCOE
($)($)($)($)($)($)($/kWh)
DG1001,445,8696,504,55307,950,4220.2525
DG2001,445,8692,892,35304,338,2220.3476
DG3001,445,8698,170,16609,616,0350.2434
DG4001,445,8693,552,18804,998,0570.3133
DG50016,09334,043050,1350.3603
PVS2,200,0000201,732002,401,7320.1666
System2,200,00006,001,30121,153,303029,354,6040.2583
Table 8. Electrical characteristics of the lowest COE wind-diesel HES.
GensetWGSElectrical ProductionExcess ElectricityCapacity FactorRenewable FractionFuel ConsumptionFuel Saving
(kW)(kW)(kWh/yr)(kWh/yr)(%)(%)(liter/yr)(%)
2850 (5 sets)3806,333,993138,612.4 (2.2%)32.4815.21,402,500−13.59
Table 9. Economic characteristics of the lowest COE wind-diesel HES.
ComponentCapitalReplacementO&MFuelSalvageNPCCOE
($)($)($)($)($)($)($/kWh)
DG1001,445,8696,455,53607,901,4050.2530
DG2001,445,8693,077,75004,523,6190.3362
DG3001,445,8697,497,76408,943,6330.2498
DG4001,445,8693,491,62404,937,4930.3158
DG50025,74854,001079,7500.3621
WGS2,204,0000278,757002,482,7570.1252
System2,204,00006,087,98220,576,675028,868,6560.2541
Table 10. Electrical characteristics of the lowest COE PV-wind-diesel HES.
GensetPVSWGSElectrical ProductionExcess ElectricityRenewable FractionFuel ConsumptionFuel Saving
(kW)(kWp)(kW)(kWh/yr)(kWh/yr)(%)(liter/yr)(%)
2850 (5 sets)2003406,330,194134,813.6 (2.1%)18.11,360,550−16.18
Table 11. Economic characteristics of the lowest COE PV-wind-diesel HES.
ComponentCapitalReplacementO&MFuelSalvageNPCCOE
($)($)($)($)($)($)($/kWh)
DG1001,445,8696,225,21207,671,0810.2556
DG2001,445,8692,951,93604,397,8050.3437
DG3001,445,8697,395,58908,841,4580.2509
DG4001,445,8693,365,35104,811,2200.3214
DG50010,89423,121034,0140.3597
PVS800,000073,35700873,3570.1666
WGS1,972,0000249,414002,221,4140.1252
System2,772,00006,117,14119,961,209028,850,3500.2539
Table 12. Electrical characteristics of PV-diesel-storage HES.
Renewable FractionGensetPVSStorageElectrical ProductionExcess ElectricityFuel ConsumptionFuel Saving
(%)(kW)(kWp)(kWh)(kWh)(kWh/yr)(kWh/yr)(liter/yr)
252850 (five sets)120012606,359,813122,652.0 (1.9)1,259,864−22.38
30150021006,478,906200,845.9 (3.1)1,188,383−26.78
35175034446,528,063196,732.8 (3.0)1,117,409−31.16
40205048726,630,449239,512.0 (3.6)1,041,868−35.81
45230068046,691,938243,681.9 (3.6)972,643−40.07
50260012,6006,813,660308,601.5 (4.5)900,837−44.50
Table 13. Economic characteristics of PV-diesel-storage HES.
Renewable FractionCapitalReplacementO&MFuelSalvageNPCCOE
(%)($)($)($)($)($)($)($/kWh)
256,716,295965,7246,379,54018,484,004032,545,5630.2864
308,493,825965,7246,562,88717,435,266033,457,7020.2945
3510,417,873965,7246,775,84216,393,978034,553,4180.3041
4012,599,674965,7247,013,35415,285,686035,864,4380.3157
4514,927,993965,7247,280,97014,270,060037,444,7470.3296
5020,112,950965,7247,921,98313,216,565042,217,2220.3716
Table 14. Electrical characteristics of wind-diesel-storage HES.
Renewable FractionGensetWGSStorageElectrical ProductionExcess ElectricityFuel ConsumptionFuel Saving
(%)(kW)(kW)(kWh)(kWh)(kWh/yr)(kWh/yr)(liter/yr)
252850 (five sets)67025206,541,615299,274.0 (4.6)1,258,831−22.44
3080020,2446,609,215326,952.9 (4.9)1,188,672−26.77
35106067,2007,034,297727,785.1 (10.3)1,115,342−31.28
Table 15. Economic characteristics of wind-diesel-storage HES.
Renewable FractionCapitalReplacementO&MFuelSalvageNPCCOE
(%)($)($)($)($)($)($)($/kWh)
256,668,590965,7246,552,36918,468,839032,655,5220.2874
3019,608,473965,7248,271,47517,439,515046,285,1870.4074
3553,400,400965,72412,765,42416,363,651083,495,1990.7349
Table 16. Electrical characteristics of PV-wind-diesel-storage HES.
Renewable FractionGensetPVSWGSStorageElectrical ProductionExcess ElectricityFuel ConsumptionFuel Saving
(%)(kW)(kWp)(kW)(kWh)(kWh/yr)(kWh/yr)(liter/yr)(%)
252850 (five sets)4004401686,468,587264,437.6 (4.1)1,259,850−22.38
307004205046,528,221311,155.0 (4.8)1,187,107−26.86
3595041016806,548,999297,053.1 (4.5)1,115,897−31.25
40130037031086,623,216322,638.7 (4.9)1,043,925−35.68
45175028052926,702,660331,642.6 (4.9)972,740−40.07
50240010011,5086,810,636336101.2 (4.9)900,511−44.52
Table 17. Economic characteristics of the PV-wind-diesel-storage HES.
Renewable FractionCapitalReplacementO&MFuelSalvageNPCCOE
(%)($)($)($)($)($)($)($/kWh)
255,317,5061,066,9346,303,79818,483,799−71,67031,100,3670.2737
306,632,5181,261,3866,429,23017,416,549−277,21631,462,4670.2769
358,383,060965,7246,620,93016,371,799032,341,5130.2846
4010,532,861965,7246,849,41915,315,875033,663,8800.2963
4513,312,439965,7247,147,23114,271,476035,696,8710.3142
5019,142,161965,7247,821,60313,211,782041,141,2710.3621
Table 18. Information entropy and weighting factors of each index.
IndicesCapitalCOEFuel SavingOccupied Area
Information entropy0.875770.886140.832100.85829
Weighting factors (%)22.68%20.79%30.66%25.87%
Table 19. The relative closeness and ranking results.
RF-25%RF-30%RF-35%RF-40%RF-45%RF-50%
D+0.306560.249110.207300.201750.251120.40201
D−0.402010.364880.335070.309440.296270.30656
C0.567360.594280.617790.605330.541240.43264
Ranking431256

