Abstract
Thermoelectric power generation is an energy conversion technology from heat to electric energy, which can be applied to waste heat power conversion. Among thermoelectric materials (TE), PbTe-PbSe-PbS quaternary alloys and composites are promising candidates for thermoelectric power generation applications in the mid-temperature operating range from 500 to ~850 K. Besides, the thermoelectric performance of quaternary alloys and composites is not fully optimized regarding its composition and synthesis process. In the quaternary system, PbTe-PbSe-PbS, it was found that PbS will form nanoprecipitation in the matrix of quaternary alloy for a small content of PbS (≤0.07), which reduces the lattice thermal conductivity. The power factor of PbTe-PbSe-PbS quaternary alloys can be significantly enhanced by using a band convergence in PbTe1−xSex. The band structure modifications, with the result of simultaneous PbS nanoprecipitation, give rise to a high value of 2.3 at 800 K for (PbTe)0.95−x(PbSe)x(PbS)0.05. The chemical potential tuning by effective K-doping ( = 0.02) and PbS substitution reveals a high power factor and low thermal conductivity, resulting in a comparatively high value of 1.72 at 800 K. The combination of a high Seebeck coefficient and low thermal conductivity results in a very high value of 1.52 at 700 K as n-type materials for low Cl-doped ( = 0.0005) (PbTe0.93−xSe0.07Clx)0.93(PbS)0.07 composites. Therefore, this review presents the simultaneous emergence of effective chemical potential tuning, band convergence, and nanoprecipitation, giving rise to a significant enhancement of the thermoelectric performance of both - and -type PbTe-PbSe-PbS quaternary alloy and composite TE materials.
1. Introduction
Recently, much effort has been devoted to searching for materials that can convert waste heat into electricity owing to the growing global demand for green energy. Thermoelectric power generation is a direct heat to electric energy conversion technology and can be applied to waste heat power conversion as well. Effective thermoelectric materials are expected to have low thermal conductivity, , and electrical resistivity, ρ, and a high Seebeck coefficient, , which is defined by the dimensionless thermoelectric figure-of-merit, . The trade-off relationship among the parameters, , ρ and , makes it difficult to have a high value. During the decade, the development of thermoelectric materials has progressed significantly in terms of nanostructure and new material design. Employing a nanostructure reduces the lattice thermal conductivity by scattering the acoustic phonons [1]. It has been suggested that the low-dimensional nanostructure can give rise to the quantum confinement effect, resulting in a high power factor [1], but the experimental realization in bulk compounds is elusive. In addition, the phonon-glass-electron-crystal (PGEC) concept has long been sought out for the scattering of phonons while preserving electrical transport [2].
Among thermoelectric materials, PbTe is one of the most promising and efficient thermoelectric material for mid-temperature range applications. The thermoelectric performance of PbTe-based materials has been improved significantly through electronic structure modifications [3,4,5,6]. Semiconductor PbTe of p-type can be produced by doping with Tl, Na, and K on Pb sites [5,7,8,9,10]. On the other hand, n-type PbTe can be produced by Cl doping on the Te site [11]. In addition, its low content in the Earth’s crust and the high cost of tellurium inhibit the usage of PbTe in large-scale production. A lot of efforts have been made to replace Te by Se, and S to form PbSe [12,13], PbS [14], or the ternary alloys, PbTe-PbSe [3,15,16] and PbSe-PbS [17,18]. In the PbTe-PbSe system, high thermoelectric performance is mainly attributed to band structure engineering. Band structure engineering in PbTe1−xSex is beneficial to gain a high Seebeck coefficient while maintaining high electrical conductivity by doping [3]. It is believed that a low lattice thermal conductivity, , in ternary PbTe1−xSex alloys is explained mainly by the formation of point defects, created by Te/Se’s mixed occupation in the rock salt structure [3]. In addition, the thermoelectric performance in PbTe1−xSex ternary alloys can be increased by nanostructuring, resulting in low lattice thermal conductivity. Nanostructuring in the PbTe-PbS system can be achieved using bulk phase separation either by nucleation or spinodal decomposition depending on the relative phase fraction [19].
Recent advances report that the lattice thermal conductivity in the quaternary system of (PbTe)1−x−y(PbSe)x(PbSe)y can be reduced by point defect, which is produced by triple disorder in the rock salt structure [20,21,22]. High ≈ 2.2 at 800 K was obtained in p-type (PbTe)1−2x(PbSe)x(PbS)x quaternary alloys due to band engineering and phonon scattering from point defects [20,23,24]. Quaternary alloys PbTe-PbSe-PbS manifest themselves as effective n-type materials as well. For example, n-type (PbTe)0.75(PbSe)0.1(PbS)0.15 exhibited a high value of 1.1 at 800 K [22]. Therefore, the quaternary alloy system, PbTe-PbSe-PbS, is a promising candidate for use in thermometric power generation devices because alloy materials exhibit both n- and p-type properties with high thermoelectric performance [25]. The PbS precipitates in the matrix, resulting in reduction of the lattice thermal conductivity. The size, shape, and distribution of the nanoparticles contribute to the thermoelectric properties [26]. Here, this review briefly introduces the simultaneous emergence of band convergence, nanostructuring, and chemical potential tuning in PbTe-PbSe-PbS quaternary alloys and composites, which provides an extremely high thermoelectric figure-of-merit in p- and n-type materials.
2. Nanostructure in PbTe-PbSe-PbS Quaternary Alloys
In spite of high values for Pb-based quaternary alloys, the thermoelectric performances of reported alloys are partially optimized in terms of the content of binary compounds and synthesis process [27,28,29]. In the systematic investigation of (PbTe)0.95−x(PbSe)x(PbS)0.05 ( = 0.0, 0.05, 0.10, 0.15, 0.20, 0.35, and 0.95) quaternary alloys with 1 at. % Na-doping, PbS content is fixed as 5 at. %, which is enough for nanoprecipitation while maintaining nanoprecipitation and without changing the electronic band structure. The electronic band structure modification was associated with content of PbSe in (PbTe)0.95−x(PbSe)x(PbS)0.05. Figure 1 shows the X-ray diffraction (XRD) pattern of (PbTe)0.95−x(PbSe)x(PbS)0.05 having a single phase with a cubic structure. The lattice parameters are decreased with increasing Se content, which follows the Vegard’s law, indicating a solid solution of PbSe and PbTe, as shown in Figure 1b. The decrease of the lattice parameter with increasing Se content is due to the fact that the atomic radius of Se is smaller compared to Te.
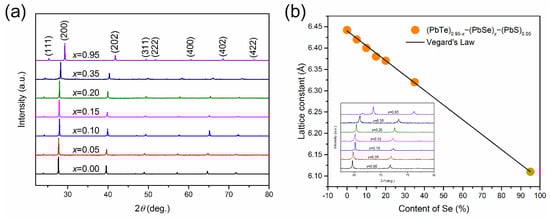
Figure 1.
(a) XRD data of (PbTe)0.95−x(PbSe)x(PbS)0.05 powder, (b) lattice parameter against the content of Se and the line of K (line). The inset shows the pattern, shifted to high angle. Reproduced with permission from [8], copyright 2017 Elsevier.
Figure 2a,b show high-resolution transmission electron microscope (HR TEM) images of (PbTe)0.75−x(PbSe)0.2(PbS)0.05 samples. It reveals numerous nanoprecipitates with a size of 10 to 20 nm, which is comparable to that previously reported for PbTe-based nanocomposites [9,30]. The nanoprecipitates form a regular square lattice in the magnified image of the same area of Figure 2b, as shown in Figure 2c. The electron diffraction pattern (Figure 2d) reports that the nanoprecipitates have a cubic structure.
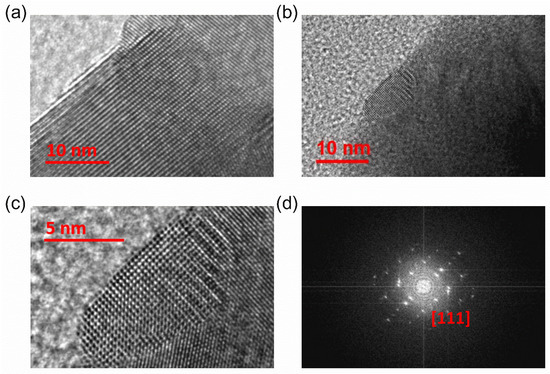
Figure 2.
(a,b) HR TEM images of (PbTe)0.75−x(PbSe)0.2(PbS)0.05 at different locations, (b,c) different magnification scales, (d) selected area electron diffraction (SAED) pattern with [111] zone axis direction of the (PbTe)0.75−x(PbSe)0.2(PbS)0.05 sample. Reproduced with permission from [8], copyright 2017 Elsevier.
The lattice parameters of PbTe, PbSe, and PbS are 3.22, 3.07, and 2.965 Å, respectively, along the (200) plane [31,32]. Numerous nanoprecipitates are also found in K-doped (Pb0.98K0.02Te)0.7(PbSe)0.25(PbS)0.05 [7] and Cl-doped (PbTe0.93−xSe0.07Clx)0.93(PbS)0.07 ( = 0.0005) [11], which are synthesized by same process with (PbTe)0.75(PbSe)0.2(PbS)0.05, as shown Figure 3a,b and Figure 4a,b. Inverse fast Fourier transform (IFFT) images (Figure 3c and Figure 4d) along the (200) plane show the disordering or dislocations of the precipitates, as depicted in Figure 3d and Figure 4f, respectively. IFFT images along the plane show that there are many line dislocations at coherent interfaces between nanoprecipitates within the PbTe matrix. In order to identify the lattice dislocation more clearly, geometric phase analysis (GPA) of TEM images is reported. The strain field map profile around the dislocation area shows clearly the lattice strain due to lattice parameter misfit between the matrix and the precipitates. It indicates that the lattice dislocation may generate a strain field between the matrix and nanoprecipitates, as shown in Figure 4f. A positive high strain filed is observed at the edge dislocation, where there are interfaces between the matrix and peripheral precipitates.
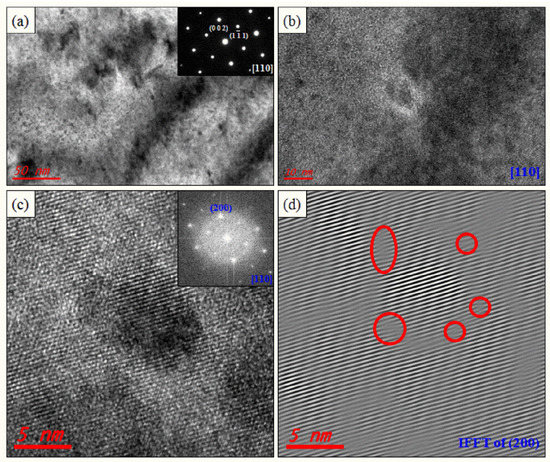
Figure 3.
TEM images of the (Pb0.98K0.02Te)0.7(PbSe)0.25(PbS)0.05 sample for a low magnified image showing numerous nanoprecipitations and the spinodal decomposition region (a), and its enlarged image (b). Inset on (a) is the electron diffraction pattern. HR TEM image of nanoprecipitation with a semi-coherent interface (c) and electron diffraction (inset on (c)). Inverse fast Fourier transform (IFFT) image of nanoprecipitates along the (200) plane (d). Reproduced with permission from [7], copyright 2016 the Royal Society of Chemistry.
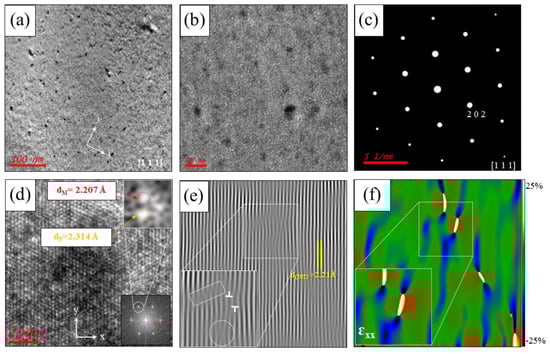
Figure 4.
TEM images of the (PbTe0.93−xSe0.07Clx)0.93(PbS)0.07 ( = 0.0005) sample along the [111] zone axis for (a) low and (b) medium magnification with numerous and homogeneously distributed nanoprecipitates. (c) Electron diffraction pattern of a selected area in the bulk matrix. (d) HR-TEM image with lattice fringes in the nanoprecipitate region. Lower right inset is the electron diffraction pattern of the precipitate. Top right inset is IFFT analysis of an enlarged view of a peak in the electron diffraction, as indicated. (e) IFFT image of the lattice fringes in (d). Lower left inset is an enlarged view of the line dislocation region, as indicated. (f) Strain field distribution along the -axis () around the precipitate (color scale indicates −25% to 25% strain distribution). Reproduced with permission from [11], copyright 2017 the Royal Society of Chemistry.
Several key questions arise when considering the nanoprecipitates in complex PbTe-PbSe-PbS quaternary alloys. The substitution of multiple elements in the PbTe matrix with the rapid quenching process results in lower free energy for the creation of nanoprecipitates in the matrix of PbTe [8]. A similar phenomenon is also found in the ternary system, PbTe-SrTe. Nanoprecipitates are formed in PbTe-SrTe due to the difference in lattice parameters between PbTe and SrTe. The limited SrTe doping is segregated in the PbTe matrix, resulting in nanoprecipitations [32]. In PbTe-PbSe-PbS quaternary alloys, the miscibility gap between the PbTe and PbS phase is expected in the thermodynamic phase diagram, implying phase separation via metastable nucleation during grain growth or spinodal decomposition of nanoprecipitates [33] because the thermodynamic nanoscale precipitation of PbS in the PbTe-PbSe matrix is likely [7,31,34].
In order to identify the phase of the nanoprecipitates, elemental analysis is reported by energy dispersive X-ray spectroscopy (EDS) in (Pb0.98K0.02Te)0.7(PbSe)0.25(PbS)0.05 [7], as shown in Figure 5. Figure 5a,b show the nanoprecipitates and phase boundary due to spinodal decomposition, displayed as the dark region. The form of nanoprecipitates of (Pb0.98K0.02Te)0.7(PbSe)0.25(PbS)0.05 exhibits two different morphologies: (1) Nanodot and (2) stripe phase due to spinodal decomposition, as shown in Figure 5b. The nanoprecipitates (region 1 and region 3) are a PbS-rich phase within the PbTe matrix (region 1), as shown in Figure 5d, from the EDS spectrum.
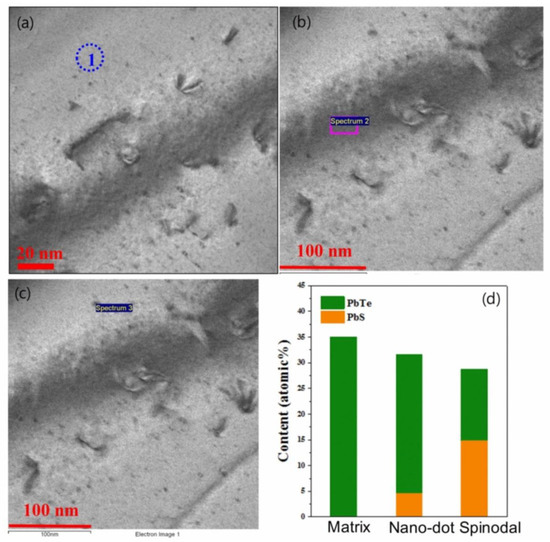
Figure 5.
(a) Low magnified image of bright-field HR-TEM micrograph for the (Pb0.98K0.02Te)0.7(PbSe)0.25(PbS)0.05 sample. (b) Enlarged view of an HR-TEM image of a selected area of (Pb0.98K0.02Te)0.7(PbSe)0.25(PbS)0.05: indicating the (1) matrix, (2) nanodot, and (3) spinodal decomposition region. (c) X-ray energy dispersive spectroscopy (EDS) images at each different regions of matrix (region 1), nanodot (region 2), and spinodal decomposition (region 3). (d) Expected compositional concentration of PbTe and PbS for different regions. Reproduced with permission from [7], copyright 2016 the Royal Society of Chemistry.
3. Thermoelectric Performances of PbTe-PbSe-PbS Quaternary Alloys
3.1. Simultaneous Occurrence of Nanostructuring and Band Convergence in p-Type (PbTe)0.95−x(PbSe)x(PbS)0.05
Earlier reports show high thermoelectric performance in p-type (PbTe)0.95−x(PbSe)x(PbS)0.05 alloys by adopting simultaneous occurrence of band structure engineering and nanostructuring due to nanoprecipitation [8]. Band convergence is effective in increasing the power factor while maximizing the power factor in both high electrical conductivity and the Seebeck coefficient by highly dispersive and degenerated energy bands, respectively [35]. According to theoretical band structure calculation of PbTe, PbSe, and PbS, those compounds are known to have two valence bands, which are light hole, , and heavy hole, , bands. Experimental realization of band convergence in PbTe-PbSe alloy enhances the power factor by high valley degeneracy with dispersive energy bands [36]. The energy difference between the conduction band minimum and valence, , band maximum, , and band maximum, , changes with the temperature, , and content, , as follows [37]:
The total Seebeck coefficient is defined by coefficients and electric conductivity provided by two valence bands as follows [8,36]:
where , , , and are the Seebeck coefficients and electric conductivity due to the light hole, , and heavy hole, , valence bands, respectively. The light hole, , band has a dispersive energy band, resulting in the high mobility of charge carriers, while the heavy hole, , band is a flat band with a heavy effective mass of charge carriers. When we align the light, , and heavy, , hole bands, highly dispersive and degenerated energy bands give rise to a high Seebeck coefficient while maintaining the high mobility of charge carriers.
Previous reports demonstrate that the effect of band alignment of and bands in 1% Na-doped (PbTe)0.95−x(PbSe)x(PbS)0.05 gives rise to the increase in the value of the Seebeck coefficient and power factor. Figure 6 shows the temperature-dependences of the Seebeck coefficient and electrical conductivity of (PbTe)0.95−x(PbSe)x(PbS)0.05. S(T) of the compounds increases with increasing the temperature, indicating metallic or degenerated semiconducting behavior, as presented in Figure 6a. Figure 6a shows a broad shoulder in S(T) near 700 K for alloys with < 0.2. The plateau around 700 K is caused by band alignment of and bands in (PbTe)0.95−x(PbSe)x(PbS)0.05 due to hole transfer from the to the band [8]. However, the plateau disappears in the alloys (PbTe)0.95−x(PbSe)x(PbS)0.05 with ≥ 0.2 due to a increase in the band gap with growth of the Se content, implying that hole excitation from the to the band may occur at temperatures higher than 800 K [8]. Electrical resistivity, , shows behavior similar to the Seebeck coefficient, as shown in Figure 6b, where broad shoulders of are observed near 700 K for alloys with < 0.2 [8].
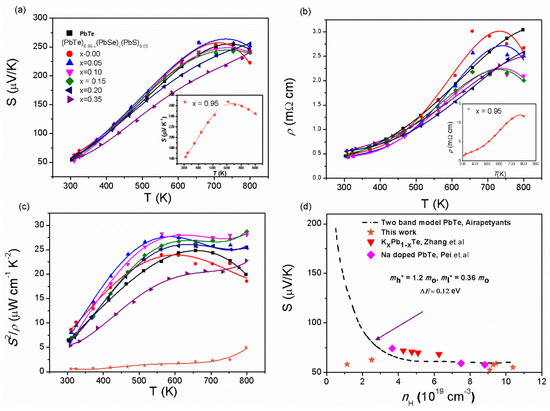
Figure 6.
(a) Temperature-dependent Seebeck coefficient, S(T), (b) electrical resistivity, ρ(T), (c) and power factor, S2/ρ, of PbTe and (PbTe)0.95−x(PbSe)x(PbS)0.05 samples. (d) Room temperature Pisaranko plot based on two band models of PbTe (dashed line) with the experimental data of alloy samples. Reproduced with permission from [8], copyright 2017 Elsevier.
Figure 6c shows the temperature-dependent power factor for series of ternary alloys (PbTe)0.95−x(PbSe)x(PbS)0.05. The maximum power factor of 28.7 µW m−1 K−2 at 800 K is achieved in alloy samples with = 0.15, which is higher than those of pristine PbTe and PbTe-based alloys [31,36,37,38,39,40,41,42]. So, a high power factor is due to the contribution of band convergence of and bands. The lowest power factor is observed in alloy samples with = 0.35 because an increase in the Se content results in a decrease in the mobility of charge carriers due to the scattering of charge carriers by impurities, which is not beneficial to the increase in the power factor [36]. In order to confirm the contribution of and bands’ convergence to thermoelectric properties, the Pisarenko plot is shown based on two valence bands’ model compared with PbTe [20,43,44], Pb1−xKxTe [10], and Na-doped PbTe [43], as shown in Figure 6d. Instead of the single parabolic band model, the Pisarenko plot corresponds to the two valence bands’ model with effective masses of light, , and heavy, , bands equal to 0.36 and 1.6 , respectively, which means that the Fermi levels lie deep within the valence band and the two valance bands contribute significantly to the Seebeck coefficient [8].
The temperature-dependent total thermal conductivity, , (Figure 7a) of (PbTe)0.95−x(PbSe)x(PbS)0.05 alloys is reduced with increasing Se content.
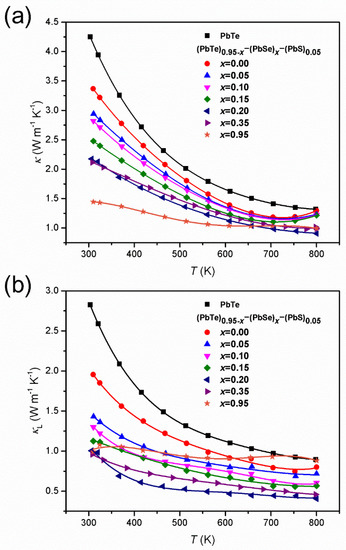
Figure 7.
(a) Temperature-dependent total thermal conductivity, , and (b) lattice thermal conductivity, , of (PbTe)0.95−x(PbSe)x(PbS)0.05 series of alloys. Reproduced with permission from [8], copyright 2017 Elsevier.
The lowest is obtained at = 0.95. The significant decrease in due to Se incorporation is reported to arise from the phonon scattering caused by alloying. Figure 7b shows the lattice thermal conductivity, , of alloys having the lowest ~ 0.40 W m−1 K−1 at 800 K that is measured in the alloy with = 0.20. Values of in the alloy with = 0.20 are lower on 60% at 300 K and 55% at 800 K compared to the pristine PbTe compound, and at 800 K, this approaches the glass limit for the bulk PbTe compound [45].
In order to clarify the mechanism of thermal conductivity in (PbTe)0.95−x(PbSe)x(PbS)0.05 alloys, the investigation is based on the Debye–Callaway model using the expression [32,46]:
where , , , , θ, and are the Boltzmann constant, reduced Plank constant, absolute temperature, sound velocity, Debye temperature, and , respectively. and are the relaxation times due to normal phonon-phonon scattering and the combined relaxation time. From Matthiessen’s rule, the combined relaxation time is obtained by accounting for the relaxation times from various scattering processes. In this case, the combined relaxation time given as:
where , , , , , and are the relaxation times corresponding to scattering from the Umklapp process, normal process, boundaries, strain, dislocations, and precipitates [14,47,48,49,50,51]. In the previous reports, the authors consider four different scattering mechanisms, such as point defect scattering, phonon-phonon scattering, grain boundary scattering, and nanoprecipitates scattering with the radius, , and volume fraction, . Therefore, the phonon relaxation time can be expressed as:
where Lgr is the grain’s average size, and coefficients and are constant prefactors. The value of depends only on the crystal structure. Thus, the authors obtain the value of by fitting the above equation to the lattice thermal conductivity of undoped (PbTe)0.95−x(PbSe)x(PbS)0.05 alloy. The grain boundaries’ scattering is not distinguished, as it is convenient to define an effective mean free path [14]:
Based on TEM observation, the average size of nanoparticles is about 10 nm as shown in Figure 2 and other appropriate parameters of the Debye temperature and sound velocity are obtained from [14]. The calculated theoretical, , is fitted with the experimental data. Figure 8 shows two pairs of temperature dependences of : Experimental and theoretical of PbTe and (PbTe)0.75(PbSe)0.2(PbS)0.05 alloy. In the case of PbTe, the theoretical model of is solely determined by normal model process scattering while for (PbTe)0.75(PbSe)0.2(PbS)0.05, the model is based on alloy scattering as well as on precipitates. Figure 8 clearly shows that the theoretical calculation fits very well with the experimental data of PbTe and (PbTe)0.75(PbSe)0.2(PbS)0.05 alloys over a wide range of temperatures, indicating that the strong phonon scattering in alloys comes from nanoprecipitates because of the shorter relaxation time as compared with other processes.
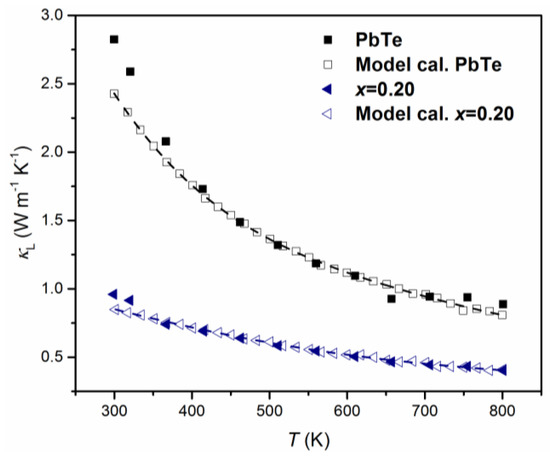
Figure 8.
Experimental (closed symbols) and theoretical (open symbols) lattice thermal conductivities, , of PbTe (black square) and (PbTe)0.75(PbSe)0.2(PbS)0.05 (blue triangle). The data of PbTe and (PbTe)0.75(PbSe)0.2(PbS)0.05 were calculated based on phenomenological effective medium theory (described in the text). Reproduced with permission from [8], copyright 2017 Elsevier.
Low thermal conductivity due to nanoprecipitates and a high power factor caused by band engineering directly affects the thermoelectric performance of (PbTe)0.95−x(PbSe)x(PbS)0.05 alloys, which is displayed clearly in the dimensionless figure-of-merit, . Figure 9a shows the temperature dependences of for (PbTe)0.95−x(PbSe)x(PbS)0.05 alloys. The alloy with = 0.20 shows the highest value 2.3 at 800 K. Biswas et al. [32] reported high value of 2.0 at 800 K in hierarchical architecture of the atomic and mesoscale in PbTe alloyed with 2% SrTe. In order to achieve a hierarchical architecture, additional processing is needed to produce fine powder and a mesoscale microstructure. On the other hand, the direct synthesis of (PbTe)0.95−x(PbSe)x(PbS)0.05 alloys realizes high without a multiple sintering process.
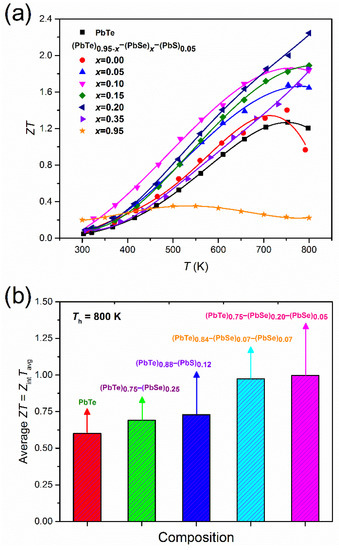
Figure 9.
(a) Temperature-dependent for (PbTe)0.95−x(PbSe)x(PbS)0.05 and (b) average ZTavg for various Pb-based chalcogenides at Th = 800 K and Tc = 300 K comparing with references. Reproduced with permission from [8], copyright 2017 Elsevier.
For practical applications, we also estimated the average ZTavg value as defined by [52]:
where is the figure-of-merit, Tc is the cold side temperature, Th is the hot side temperature, Tavg is the average temperature (Th + Tc)/2, and ΔT is the temperature difference between hot and cold sides . The calculated ZTavg values of PbTe, (PbTe)0.75(PbS)0.25 [34], (PbTe)0.88(PbS)0.12 [36], and (PbTe)0.84(PbSe)0.07(PbS)0.07 doped with 2% Na [20] is shown in Figure 9b. It shows the highest average ZTavg of the (PbTe)0.75(PbSe)0.2(PbS)0.05 alloy compared to the other compounds quoted in the previous reports [20,34,36].
3.2. Chemical Potential Tuning and Nanostructuring in p-Type Pb1−xKxTe0.7Se0.25S0.05
Ahmad et al. suggested that the power factor of the PbTe compound can be enhanced by resonant-like density of state (DOS) distortions in p-type Pb1−xAxTe ( = K, Rb, and Cs but not Na) [53]. However, Androulakis et al. showed that K doping does not form resonance states but can control the energy difference of the maxima of two primary valence sub-bands in PbTe [54]. The role of K in PbTe has been extensively analyzed and values of 1.3 at 673 K [10] were obtained, which is comparable with that of Na-doped PbTe at the same temperature [43]. Furthermore, a high thermoelectric performance ( ≈ 1.6 at 773 K) was obtained in K-doped PbTe1−xSex ternary alloys due to an increase in the DOS around the Fermi levels, resulting in a higher Seebeck coefficient for the two valence bands of PbTe1−xSex [10]. Given the valence bands’ convergence in PbTe-PbSe [10] and the presence of a nanostructure in PbTe-PbS [33,34], these are effective for increasing the power factor and decreasing thermal conductivity, respectively. Therefore, the role of K is examined in enhancing of quaternary alloys PbTe-PbSe-PbS with the combination of band converge and nanostructure.
The room temperature Hall effect measurements show the p-type conductivity of Pb1−xKxTe0.7Se0.25S0.05 alloys. Figure 10 shows the Hall concentration, nH, and Hall mobility, μH, of charge carriers at room temperature in Pb1−xKxTe0.7Se0.25S0.05 alloys depending on the K-doping level. The Hall concentration of charge carriers is reduced until = 0.02 and then increased significantly at higher doping levels > 0.02 from 4.33 × 1019 cm−3 ( = 0.02) to 7.08 × 1019 cm−3 ( = 0.03), which indicates that K doping effectively tunes charge carriers’ concentration in Pb1−xKxTe0.7Se0.25S0.05 alloys. Hall mobility is monotonically decreased with an increasing K-doping level from 350.2 cm2 ( = 0.01) to 120 cm2 V−1 s−1 ( = 0.03). The reduction of mobility can be understood in terms of the defect and alloy scattering due to K doping.
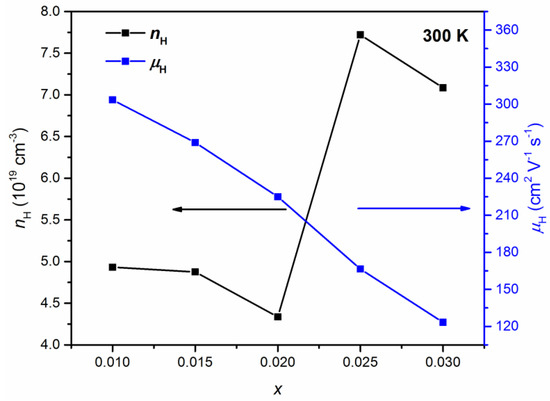
Figure 10.
Hall concentration, nH (black, left axis), and mobility, μH (blue, right axis), of charge carriers in Pb1−xKxTe0.7Se0.25S0.05 alloys depending on the K-doping level. Reproduced with permission from [7], copyright 2016 the Royal Society of Chemistry.
The thermoelectric properties are measured and reported on Pb1−xKxTe0.7Se0.25S0.05 alloys. The temperature-dependent Seebeck coefficient, S(T), and electrical resistivity, ρ(T), exhibited typical behavior of a degenerate semiconductor. Figure 11a shows the temperature-dependent Seebeck coefficient, S(T), of Pb1−xKxTe0.7Se0.25S0.05 and Pb0.98K0.02Te alloys. S(T) increased with temperature and showed a broad maximum near 700 K. The maximum Seebeck coefficient reached 313 μV/K at 750 K for doping = 0.02, which is much higher even than that previously reported for Na-doped PbTe (≈260 μV/K at 775 K), which may be associated with the high effective mass, m*.
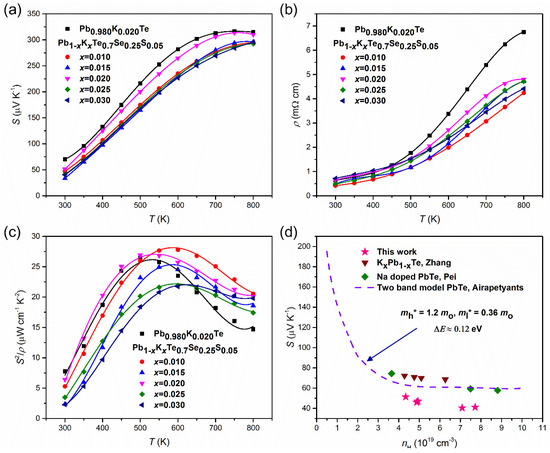
Figure 11.
(a) Temperature dependences of the Seebeck coefficient, (b) resistivity, and (c) power factor of Pb1−xKxTe0.7Se0.25S0.05 and Pb0.98K0.02Te alloys. (d) Room temperature two band model Pisaranko plot of Pb1−xKxTe0.7Se0.25S0.05 based on the second band. Reproduced with permission from [7], copyright 2016 the Royal Society of Chemistry.
Here, the estimated effective masses in terms of a single parabolic band model are [55]:
where F1/2(η) is the Fermi integral, η is the reduced Fermi energy, ~ 1 is the Hall factor, and kB is the Boltzmann constant.
The effective masses of charge carriers in Pb1−xKxTe0.7Se0.25S0.05 alloys are presented in Table 1.

Table 1.
The lattice parameter, , Hall concentration, nH, and Hall mobility, μH, of charge carriers, the Seebeck coefficient, S, and effective mass, m*, for Pb1−xKxTe0.7Se0.25S0.05 alloys.
The effective masses increased with an increase in the K-doping level over ≥ 0.015. The effective masses of charge carriers in alloys are higher than in the parent compound, PbTe m* ~ (0.25–0.27)me [21]. The larger effective masses are related to two valence bands [3,10]. Because and Σ bands come closer to each other with increasing temperature, holes are transferred from the to the Σ band, which is the cause of the broad maximum near 700 K.
The electrical resistivity, ρ(T), of Pb1−xKxTe0.7Se0.25S0.05 and Pb0.98K0.02Te alloys increases with temperature and then reaches a broad maximum, as shown in Figure 11b; variation of ρ(T) with the K-doping level is attributed to the changing concentration of the charge carriers (Table 1). Another reason is impurity or alloy scattering due to K-doping, which is confirmed by the decrease in Hall mobility (Table 1). The power factor of Pb1−xKxTe0.7Se0.25S0.05 and Pb0.98K0.02Te alloys displays the maximum value equal to 27.78 µW m−1 K−2 at 600 K when = 0.01, which is attributed to the significant reduction in electrical resistivity. The Pisarenko plot made on two valence bands’ model for Pb1−xKxTe0.7Se0.25S0.05 alloys, Na-doped PbTe, and Pb1−xKxTe is shown in Figure 11d [10,20,43,44] and the values of effective masses of the heavy hole = 1.2 me (Σ band) and light hole = 0.36 me ( band) with an energy band gap ΔE ≈ 0.12 eV is shown. The experimental data points of Pb1−xKxTe0.7Se0.25S0.05 alloys lie below the theoretical curve plotted using the two valence bands’ model, indicating a lower effective mass of the charge carriers in the alloys. Based on the Pisaranko plot made on the two valence bands’ model (Figure 11d), it is clear that the second valence band contributes to the Seebeck coefficient and there is no effect of the resonance level.
The temperature-dependent thermal conductivity, κ(T), of Pb1−xKxTe0.7Se0.25S0.05 alloys decreases with an increase in temperature as shown in Figure 12a. κ(T) decreased with an increase of the K-doping level until ≤ 0.02 and then increased again for > 0.02 as a result of decreased electric resistivity. The thermal conductivity, κ(T), for the alloy with ≤ 0.02 showed a weak increase at the high temperature region (T ≥ 700 K), implying bipolar diffusion of charge carriers. This small upturn of κ(T) was also found in 3% Na-doped (PbTe)1−x(PbS)x alloy [31]. The lowest thermal conductivity reached 1.96 W m−1 K−1 at room temperature and 0.95 W m−1 K−1 at the high temperature for (PbTe)1−x(PbS)x ( = 0.02). The extracted lattice thermal conductivity, , was found by subtracting the electronic thermal conductivity, , determined by the Wiedemann–Franz law as , where is the Lorenz number, is the absolute temperature, and ρ is the electrical resistivity. Figure 12b shows very low in Pb1−xKxTe0.7Se0.25S0.05 alloys of 0.91 W m−1 K−1 at room temperature and 0.69 W m−1 K−1 at high temperature.
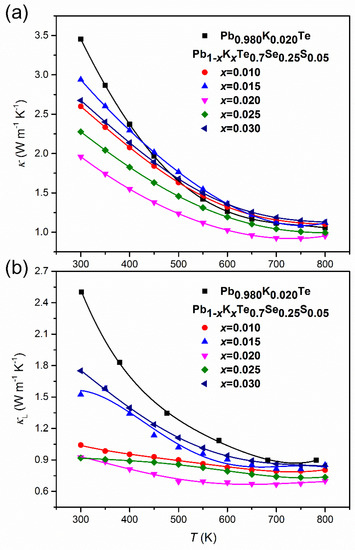
Figure 12.
(a) Temperature-dependent thermal conductivity, κ, and (b) lattice thermal conductivity, , of Pb0.98K0.02Te and Pb1−xKxTe0.7Se0.25S0.05 alloys. Reproduced with permission from [7], copyright 2016 the Royal Society of Chemistry.
The theoretical calculation mentions the lattice thermal conductivity, , of PbTe-PbSe alloy based on Klemens model [20,56]:
where ΘD is Debye temperature, Ω is the molar volume, is the velocity of sound, and Γ is the disorder scaling parameter that depends on mass and strain field fluctuations (Δm/m and Δa/a). Figure 13 shows the theoretical dependence for (PbTe)1−x(PbSe)x alloys, including the experimental data of Pb1−xKxTe0.7Se0.25S0.05, Pb0.98K0.02Te, and (Pb0.98K0.02Te)1−x(PbSe)x [10]. The experimental data of (Pb0.98K0.02Te)1−x(PbSe)x roughly followed the theoretical values. It means that a strong phonon scattering in (Pb0.98K0.02Te)1−x(PbSe)x contributes significantly to from point defect scattering created by Te/Se’s mixed occupation in the rock-salt structure. On the other hand, the lowest of Pb1−xKxTe0.7Se0.25S0.05 alloys lies below the theoretical of (PbTe)1−x(PbSe)x, corresponding to a 38% reduction. It shows that the low of Pb1−xKxTe0.7Se0.25S0.05 is due to another scattering mechanism beyond the alloy scattering. A possible reason for the low of Pb1−xKxTe0.7Se0.25S0.05 alloys is the nanostructuring effect, which causes strong phonon scattering. The nanostructuring effect in Pb1−xKxTe0.7Se0.25S0.05 is mentioned clearly in earlier reports to understand the Debye–Callaway analysis for various scattering mechanisms.
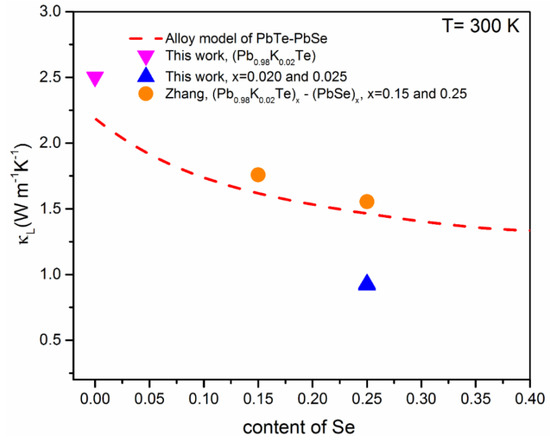
Figure 13.
Theoretical calculation of the lattice thermal conductivity, , in terms of Callaway’s alloy model (red dashed line) and experimental of Pb0.98K0.02Te, Pb1−xKxTe0.7Se0.25S0.05 ( = 0.02 and 0.25) and (Pb0.98K0.02Te)1−x(PbSe)x [10] depending on the Se content. Reproduced with permission from [7], copyright 2016 the Royal Society of Chemistry.
Figure 14 shows both the theoretical calculation data of by Callaway’s model [32,43] and the experimental data for Pb0.98K0.02Te and Pb1−xKxTe0.7Se0.25S0.05 alloys. The experimental of alloys follows the theoretical calculation well. However, the experimental of Pb0.98K0.02Te0.7Se0.25S0.05 is a little bit higher than those of the theoretical calculation at high temperatures. The possible reasons of deviation from Callaway’s model in Pb0.98K0.02Te0.7Se0.25S0.05 alloy are: (1) Increased contribution of thermally excited charge carriers can make the Lorenz number be different from the classic value [57,58], (2) the existence of inharmonic phonon excitation, and (3) partial local collapse of tthee nanostructure at high temperatures [59,60]. The calculation proves that the strong phonon scattering is attributed to the nanostructure, resulting in the reduction of .
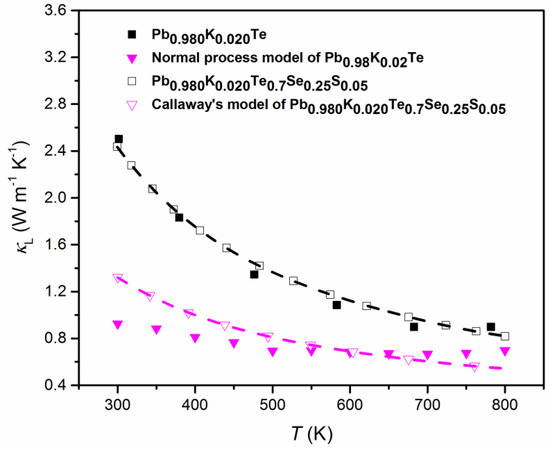
Figure 14.
Experimental and theoretical lattice thermal conductivity, , of Pb0.98K0.02Te (closed black squares and pink triangles) and and Pb0.98K0.02Te0.7Se0.25S0.05 (open black squares and pink triangles). Reproduced with permission from [7], copyright 2016 the Royal Society of Chemistry.
Owing to the very low thermal conductivity and high power factor, and Pb1−xKxTe0.7Se0.25S0.05 alloys showed improved thermoelectric performance as shown in Figure 15a. Alloy and Pb0.98K0.02Te0.7Se0.25S0.05 showed the highest value of 1.72 at 750 K. The calculated one is compared (Figure 15b [20]) with the average values of ZTavg of and Pb0.98K0.02Te0.7Se0.25S0.05, Pb0.98Na0.02Te, Pb0.98K0.02Te, Pb0.98Na0.02Te0.88S0.12 [34], Pb0.98Na0.02Te0.75S0.22 [3], Pb0.98K0.02Te0.75S0.25 [10], and Pb0.98Na0.02Te0.84Se0.07S0.07. Figure 15b shows that the Pb0.98K0.02Te0.7Se0.25S0.05 alloy has the highest ZTavg compared to the other related alloys [3,10,20,34].
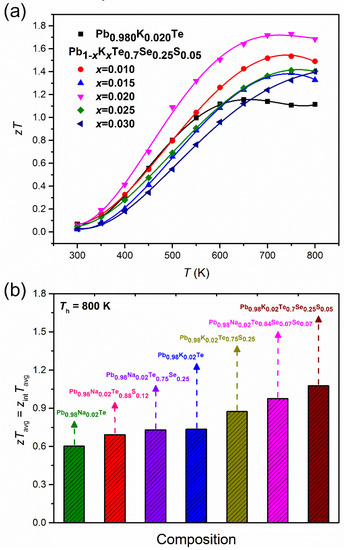
Figure 15.
(a) Temperature-dependent of Pb0.98K0.02Te, and Pb1−xKxTe0.7Se0.25S0.05, (b) the average value of ZTavg of various Pb-based chalcogenides at Th = 800 K and Tc = 300 K. Reproduced with permission from [7], copyright 2016 the Royal Society of Chemistry.
3.3. High Thermoelectric Performance due to Nanoinclusions and Randomly Distributed Interface Potential in n-Type (PbTe0.93−xSe0.07Clx)0.93(PbS)0.07
While there are many reports on the high thermoelectric performance of p-type PbTe-based thermoelectric materials [8,34,37,58], it is still a big challenge to find n-type PbTe-based materials that can provide high thermoelectric performance over a wide temperature range. The state-of-the-art values for n-type Pb chalcogenide binary compounds and alloys are 0.8 for n-type PbS [14], 1.1 for n-type nanostructured PbS by introducing a secondary phase [55], 1.2 for n-type PbSe [55,60,61], ternary alloys PbSe-PbS [17], PbTe-PbS [62] and PbTe-PbSe [63], and 1.1 for quaternary alloy (PbTe)0.75(PbSe)0.1(PbS)0.15 [22]. It was reported that the Seebeck coefficient in bulk PbTe can be enhanced significantly by participating a fine distribution of Pb nanoinclusions [64]. The increase in the Seebeck coefficient is thought to originate from an energy-filtering effect due to strongly energy-dependent electron scattering. In addition, nanoinclusions reduce the lattice thermal conductivity, resulting in the enhancement of the value of InGaAs [65]. These experimental evidences give a general understanding of the role of nanoinclusions in enhancing thermoelectric properties, particularly, to assess the relative importance of electronic and phonon scattering.
In a composite of two semiconductors with different energy band gaps or metal/semiconductor composites, a band bending effect exists at the interfaces. The band bending (energy barrier) induced by different Fermi levels of two materials can selectively scatter charge carriers due to the energy-dependent scattering time, resulting in enhancement of the Seebeck coefficient. In addition, nanoinclusions in a matrix will scatter effectively on phonons. Therefore, the reports demonstrate the effects of electron and phonon scattering by nanoinclusions in n- type (PbTe0.93-xSe0.07Clx)0.93(PbS)0.07 ( = 0.0005, 0.01, 0.1, and 0.2) composites. In the matrix, nanoinclusions provide an increase in the Seebeck coefficient while reducing the lattice thermal conductivity in (PbTe0.93−xSe0.07Clx)0.93(PbS)0.07. Doping by Cl lifts the Fermi level towards the bottom of the conduction band, resulting in an increased electron concentration. The simultaneous emergence of a high Seebeck coefficient and low thermal conductivity resulted in a high value of 1.52 at 700 K for a low Cl-doping level ( = 0.0005), which is a very high value in n-type thermoelectric materials. The randomly distributed interface potential induced by Fermi level tuning with nanoinclusions is a new technique for investigating thermoelectric properties [11]. The nanoprecipitates (Figure 4) show a strong lattice strain near precipitates in (PbTe0.93−xSe0.07Clx)0.93(PbS)0.07 alloys from TEM images, and their electron diffraction and strain field map from IFFT mapping of TEM are also shown. In view of the band gap difference between PbTe matrix and PbS nanoprecipitates the considered chemical potential is tuned to the conduction band side by Cl doping. Figure 16 shows schematic image of inclusion in matrix (left panel) and induced band bending effect on interface between matrix and nanoinclusion (right panel).
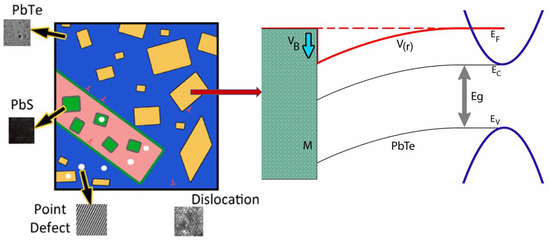
Figure 16.
Schematic image of PbS nanoinclusion in the PbTe matrix and the band bending (energy barrier) effect near the interface. Reproduced with permission from [11], copyright 2017 the Royal Society of Chemistry.
The PbTe1−xSex matrix has intrinsic point defects and dislocations. Additional PbS nanoprecipitation further decreases the lattice thermal conductivity by scattering phonons. Cl doping aims to lift the chemical potential of the conduction band bottom for n-type materials showing metallic behavior in electrical transport. Because PbS has a sizable energy band gap, there should be a band bending effect near the interface between the matrix and PbS nanoprecipitates. In that case, filtering of charge carriers with energy lower than the appropriate barrier height near the interface is possible [66]. Figure 17a shows the Hall concentration, nH, and Hall mobility, μH, of charge carriers in (PbTe0.93−xSe0.07Clx)0.93(PbS)0.07 ( = 0.0005, 0.01, 0.1, 0.2).
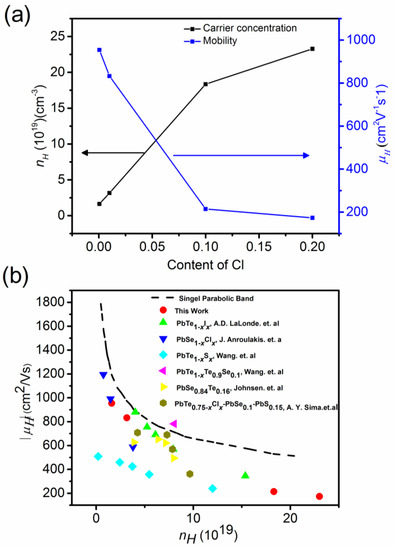
Figure 17.
(a) Hall mobility, μH (right axis), and Hall concentration, nH (left axis), of charge carriers at 300 K versus Cl-doping. (b) Hall mobility versus Hall concentration, single parabolic band model compared with this work, Pb1−xIxTe [68], PbSe1−xClx [69], PbS1−xClx [14], PbTe0.9Se0.1 [63], PbSe0.84Se0.16 [29], and PbTe0.75−xClxSe0.1S0.15 [22]. Reproduced with permission from [11], copyright 2017 the Royal Society of Chemistry.
A negative Hall coefficient is indicates n-type conductivity. The electron concentration, nH, increased systematically with an increasing Cl-doping level. The Hall mobility, μH, decreased with increased Cl doping from 954 to lower than 200 cm2 V−1 s−1 with increasing Cl doping, which is due to enhanced charge carrier scattering. Using a single parabolic band model, Hall mobility can be expressed as [67]:
where m* is the effective mass of charge carriers, and Fn(η) is the Fermi integral defined as follows:
where η is the reduced electrochemical potential, is the longitudinal elastic constant, is the valley degeneracy, and Edef is the deformation potential.
Figure 17b shows the Pisarenko plot of the Hall mobility versus the Hall concentration of charge carriers in terms of the single parabolic band model for Pb1−xIxTe [68], PbSe1−xClx [69], PbS1−xClx [14], PbTe0.9Se0.1 [63], PbSe0.84Se0.16 [29], and PbTe0.75−xClxSe0.1S0.15 [22]. The Pisarenko plot of (PbTe0.93−xSe0.07Clx)0.93(PbS)0.07 lies below the value expected from the single parabolic model. It can be understood by the scattering of charge carriers by microscopic cracks, grain boundaries, disorder, and defect, leading to high residual resistivity and low Hall mobility.
Figure 18 shows the temperature-dependent thermoelectric properties of composites (PbTe0.93−xSe0.07Clx)0.93(PbS)0.07 ( = 0.0005, 0.01, 0.1, 0.2). Figure 18a displays the electric conductivity, σ(T), in the temperature range from 300 to 800 K.
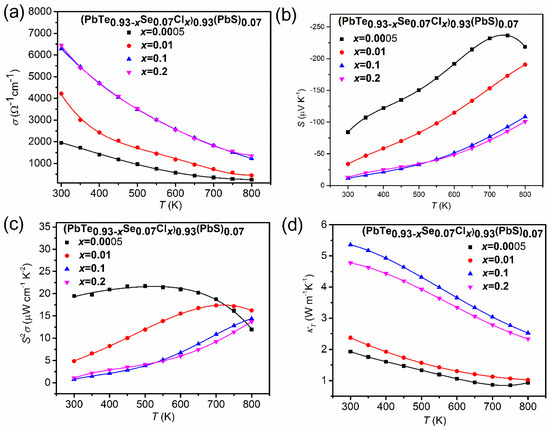
Figure 18.
(a) Temperature-dependent thermoelectric properties of (PbTe0.93−xSe0.07Clx)0.93(PbS)0.07 ( = 0.0005, 0.01, 0.1, 0.2) composites: (a) electric conductivity, σ(T), (b) Seebeck coefficient, S(T), (c) power factor, , and (d) total thermal conductivity, κ(T). Reproduced with permission from [11], copyright 2017 the Royal Society of Chemistry.
The monotonic decrease in electric conductivity with temperature indicates typical degenerated semiconducting or metallic behavior in all the concentrations. The electric conductivity increases with an increase in the Cl-doping content due to higher concentration of charge carriers. The temperature-dependent Seebeck coefficients, S(T) (Figure 18b), show negative values, indicating n-type conductivity. Because the Seebeck coefficient follows the Mott relation [70], in which a higher concentration of charge carriers leads to a lower Seebeck coefficient, the behavior of electrical conductivity showed a trade-off relationship with the Seebeck coefficient. The most negative value of the Seebeck coefficient drops to −84.12 μV/K at 300 K for = 0.0005, which corresponds to an electron concentration of 1.62 × 1019 cm−3, while the smallest negative value of the Seebeck coefficient is observed as −11.14 μV/K at 300 K for = 0.1, which corresponds to an electron concentration of 1.83 × 1020 cm−3. The Seebeck coefficient of the composite with = 0.0005 is higher than those of n- type PbTe, PbSe, and PbS binary compounds over an entire temperature range. The peak Seebeck coefficient equals −236.63 μV/K for = 0.0005, which is higher than PbTe, PbS, and PbSe by as much as 7.57%, 15.77%, and 4.60%, respectively. There is a broad shoulder in the Seebeck coefficient at ≥ 750 K for = 0.0005, which could be mainly ascribed to the thermal excitation of the bipolar diffusion effect. The Seebeck coefficient for bipolar transport effect is given by [71]:
where the subscript , , , and denotes the partial properties of the electron, hole, electron density, and hole density, respectively. The is the mobility ratio defined by . The Seebeck coefficient at high temperatures, ≥ 750 K for = 0.0005, come from the thermal activation of minority charge carriers. Figure 18c shows the temperature-dependent power factor, . The maximum power factor is about 21.72 μW cm−1 K−2 at 500 K for = 0.0005 owing to the high absolute value of the Seebeck coefficient. Even though the room temperature power factor decreased with an increasing Cl-doping content, attributed to the decrease in the Seebeck coefficient, the power factor at high temperatures is not sensitive to the Cl-doping level. Temperature-dependent thermal conductivity decreased when increasing the temperature, which is a typical behavior of acoustic phonon scattering as presented in Figure 18d. The lowest thermal conductivity, κ, is found at = 0.0005 (κ ≈ 0.84 W m−1 K−1 at 750 K). The increase in κ over a wide temperature range with an increase in the Cl-doping level is due to the significant electron contribution to the thermal conductivity.
The low thermal conductivity and high Seebeck coefficient of (PbTe0.93−xSe0.07Clx)0.93(PbS)0.07 ( = 0.0005, 0.01, 0.1, 0.2) composites give rise to an exceptionally high value of 1.52 at 700 K for = 0.0005 (Figure 19), which is higher than previously reported of n- type PbS [55], PbSe [60], and PbTe [68] binary compounds, and (PbTe)0.75(PbS)0.15(PbSe)0.1 alloy [22] by as much as 27.36%, 21.52%, 7.89%, and 27.63%, respectively.
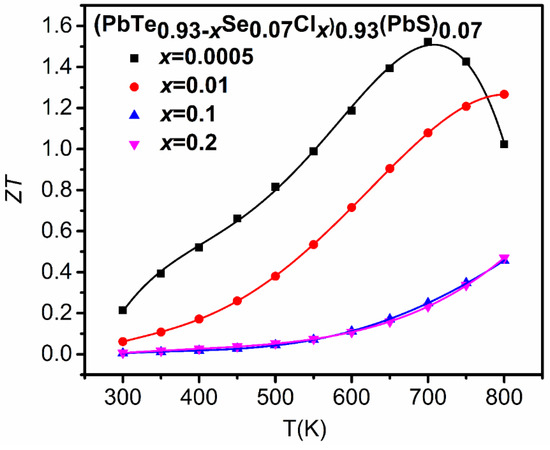
Figure 19.
Temperature-dependent values of (PbTe0.93−xSe0.07Clx)0.93(PbS)0.07 ( = 0.0005, 0.01, 0.1, 0.2) composites. Reproduced with permission from [11], copyright 2017 the Royal Society of Chemistry.
Here, the literature argues that the interface energy barrier between the matrix and nanoprecipitates gives rise to charge carriers’ energy filtering effect, resulting in the enhancement of the Seebeck coefficient. Few authors employed the theoretical Boltzmann transport calculation with relaxation time approximation as the following relations of the electrical conductivity, σ, Seebeck coefficient, , and electron thermal conductivity, κel [72]:
where z = E/kBT (dimensionless) and zf = E/kBT are the reduced energy and reduced Fermi energy, respectively, is the effective conductivity mass, and τ is the relaxation time of carriers. The total relaxation time of carriers is given by:
where , , , and are the relaxation times of carriers due to polar optical phonon scattering, acoustic phonon scattering, optical phonon scattering, and scattering on the short-range potential of vacancies, respectively.
Figure 20 shows the experimental data (this work for = 0.0005 and n-type PbTe [73]) and theoretical calculation (red line) of the temperature-dependent electric conductivity, σ(T), Seebeck coefficient, S(T), power factor, S2σ(T), and total thermal conductivity, . Figure 20a shows clearly that the theoretical calculation of σ(T) fits well with the experimental data for the = 0.0005 composite.
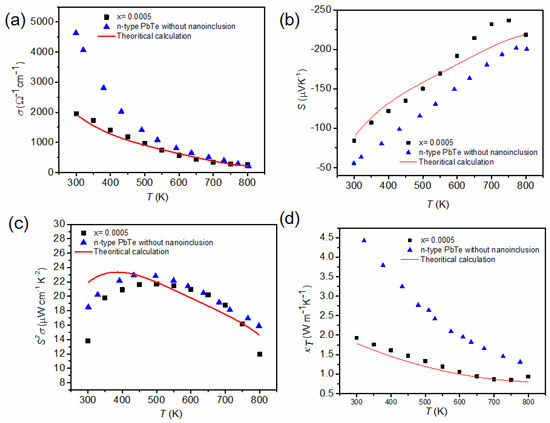
Figure 20.
Experimental data (this work for = 0.0005 and n-type PbTe) and theoretical calculation (red line) of (a) the electric conductivity, σ(T), (b) Seebeck coefficient, S(T), (c) power factor, S2σ(T), and (d) total thermal conductivity, , versus temperature. Reproduced with permission from [11], copyright 2017 the Royal Society of Chemistry.
The measured σ(T) of composite with = 0.0005 and theoretical calculation values are lower than those of PbTe over the entire temperature range. Such a reduction in σ(T) is caused by a decrease in the electron mobility. The electron mobility of PbTe and PbSe at room temperature equals to 1730 cm2 V−1 s−1 ( = 1.08 × 1019 cm−3) and 1045 cm2 V−1 s−1 ( = 2.38 × 1019 cm−3), respectively [25]. Compared with the pristine binary compound, the scattering produced by Se and Cl substitution in the PbTe matrix scatters charge carriers additionally [22]. In addition, the interfaces and defects resulting from the distribution of PbS nanoinclusions increase the scattering of charge carriers near the interfaces [74], resulting in a decrease in the charge carriers’ mobility to 954 cm2 V−1 s−1 for = 0.0005 ( = 1.63 × 1019 cm−3). As shown in Figure 20b, the theoretical calculation of S(T) is in good agreement with the experimental data ( = 0.0005) for ≥ 750 K, where the deviation for > 750 K originates from the bipolar diffusion effect. The power factor, S2σ(T), of the composite with nanoinclusions ( = 0.0005) is also comparable to that of n-type PbTe, as presented in Figure 20c.
Figure 20d shows of the composite with = 0.0005 and the n-type PbTe compound and theoretical calculation of the Boltzmann transport. The theoretical calculation (red line) for the = 0.0005 composite fits relatively well with the experimental data. The small deviation for the high temperature ( ≥ 750 K) also comes from the bipolar effect. In the calculation, the phonon thermal conductivity as well as the electronic thermal conductivity are calculated as follows [72]:
where is the speed of sound in PbTe, is the phonon energy, is the scattering time of the phonon by the Umklapp process, is the scattering time of the phonon by nanoinclusion within the geometric limit, nincl is the concentration of inclusions, is the radius of nanoinclusion, is the mole fraction of nanoinclusions, and C is determined from using the experimental value of = 2.0 W m−1 K−1 for PbTe at = 300 K. Equation (18) is only valid at the high temperature region (T > ΘD). The value of is reduced significantly in the composite with = 0.0005 compared to nanoinclusion-free n-type PbTe.
In order to understand in detail the role of nanoinclusions in enhancing the thermoelectric properties, reports shows the calculated values versus the interface potential, Vb, as shown in Figure 21a. Figure 16 shows a schematic energy band diagram of the band bending effect near the interfaces. The zero-point interface potential, Vb (0 eV), indicates that there is no phonon scattering by nanoinclusions. Theoretical values with accounting electron and electron + phonon scattering processes produced by nanoinclusions were calculated from the energy-dependent relaxation time and Born approximation. The electrostatic potential, V(r), for a single nanoinclusion can be solved by Poisson’s equation, as follows [72]:
where the assumed spherical nanoinclusion with a radius = 2.4 nm is = 2.5 × 1019 cm−3, and a 7% volume fraction of nanoinclusions. The total relaxation time of the phonon due to nanoinclusions, τ, is expressed by:
where the relaxation time of the phonon for bulk is given by Equation (17) and is the relaxation time of the phonon due the to scattering by V(r) at randomly distributed nanoinclusions. The relaxation time of the phonon due the scattering can be expressed as:
where is the concentration of inclusions, is the electron transport scattering cross-section, and is the electron velocity with the p-quantum number. The electric conductivity and (electronic and lattice) thermal conductivity decreased with an increasing mole fraction of nanoinclusions, , in the composite. The Seebeck coefficient is more sensitive to the interface potential height rather than the nanoinclusion content. In order to get the maximum thermoelectric figure-of-merit, , electrical transport should be retained while the thermal conductivity should be minimized. In many cases, the decrease in electrical conductivity more significantly affects the reduction of than the decrease in thermal conductivity. Therefore, the content of nanoinclusions should not be a source of charge carriers’ scattering as much as possible. In other words, the mean distance between nanoinclusions should be longer than the mean electron-free path. In this sense, the optimal mole fraction of nanoinclusions, , depends on the mean electron-free path of the material.
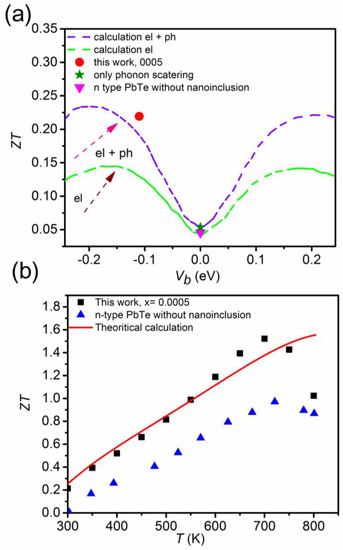
Figure 21.
Calculated values considering electron (green dashed line) and electron + phonon scatterings by nanoinclusions (purple dashed line) and experimental data (this work for = 0.0005 and n-type PbTe) with respect to the interface potential, Vb (a), and temperature-dependent values of the experimental values and theoretical calculation (b). Reproduced with permission from [11], copyright 2017 the Royal Society of Chemistry.
From the ab-initio band structure calculation, the electron–phonon interaction has a very important role in the enhancement of thermoelectric properties [75,76,77]. The electron–phonon interaction with long-range and short-range contributions, and the intravalley and intervalley transitions contribute to the electronic and thermal conductivity. The deformation-potential scattering for electron scattering by acoustic phonons makes a significant contribution to the carrier mobility due to electron–phonon interaction even at room temperature [76].
The value of n-type PbTe without nanoinclusions corresponds to the zero point of the interface potential. On the other hand, the value of the composite with = 0.0005 corresponds to the value that takes into account the electron + phonon scattering produced by nanoinclusions with a negative interface potential of Vb = −0.11 eV. In addition, theoretical values, which consider electron and phonon scatterings by nanoinclusions, are significantly higher than values, which consider electron scattering (15% or higher) only.
Therefore, the significant enhancement in the value (as much as 80.4%) for the composite with = 0.0005 is attributed to electron and phonon scattering by PbS nanoinclusions. The theoretical calculation of the value for the composite with = 0.0005 is the same as the experimental data except the high temperature range ≥ 700 K, due to the bipolar diffusion effect (Figure 21b).
4. Conclusions
Combining the emergence of nanoprecipitation and band engineering in bulk materials is an effective way to enhance thermoelectric performance. In p-type (PbTe)0.95−x(PbSe)x(PbS)0.5 quaternary alloys, PbS forms nanoprecipitates. The effective alloy scattering and phonon scattering by lattice dislocation and lattice distortion in the nanostructured phase produces very low lattice thermal conductivity. The observed band convergence of the two valence heavy hole, Σ, and light hole, , bands can increase the power factor (28.7 µW cm−1 K−2 at 800 K for = 0.15). The high ZT value of 2.3 at 800 K for = 0.20 comes from the high power factor and low thermal conductivity. The alloys also have the highest average ZTavg value, which is important for many practical applications.
As the n-type counterpart of p-type (PbTe)0.95−x(PbSe)x(PbS)0.5 quaternary alloys, composites with nanoinclusion with chemical potential tuning by Cl-doping in n-type (PbTe0.93−xSe0.07Clx)0.93(PbS)0.07 composites showed high Seebeck coefficients due to the randomly distributed interface potential and energy-dependent scattering by the interface potential. The reports have shown that nanoinclusions reduce thermal conductivity due to both electron and phonon scatterings by nanoinclusions. Due to a high Seebeck coefficient and extremely low thermal conductivity, the figure-of-merit, , reaches 1.52 at 700 K for a very low Cl-doped ( = 0.0005) composite in n-type (PbTe0.93−xSe0.07Clx)0.93(PbS)0.07. The results showed that the randomly distributed interface potential, driven by the random distribution of nanoprecipitates, is an effective way to enhance thermoelectric performances. Therefore, combining strategies among band convergence, nanoprecipitation, and chemical potential tuning will be beneficiary to the enhancement of thermoelectric performance. Fine tuning and property optimization may enhance the ZT value further.
Author Contributions
Original works on PbTe based nano composites such as sample synthesis, characterization, physical properties measurements, D.G. and C.-C.L.; Data analysis, manuscript preparation, and supervision on the work, J.-S.R. All authors have read and agreed to the published version of the manuscript.
Funding
This work was supported by the Materials and Components Technology Development Program of MOTIE/KEIT (10063286).
Conflicts of Interest
The authors declare no conflict of interest.
References
- Dresselhaus, M.S.; Chen, G.; Tang, M.Y.; Yang, R.; Lee, H.; Wang, D.; Ren, Z.; Fleurial, J.-P.; Gogna, P. New Directions for Low-Dimensional Thermoelectric Materials. Adv. Mater. 2007, 19, 1043–1053. [Google Scholar] [CrossRef]
- Snyder, G.J.; Toberer, E.S. Complex thermoelectric materials. Nat. Mater. 2008, 7, 105–114. [Google Scholar] [CrossRef]
- Pei, Y.; Shi, X.; LaLonde, A.; Wang, H.; Chen, L.; Snyder, G.J. Convergence of electronic bands for high performance bulk thermoelectrics. Nature 2011, 473, 66–69. [Google Scholar] [CrossRef]
- Pei, Y.; LaLonde, A.D.; Heinz, N.A.; Shi, X.; Iwanaga, S.; Wang, H.; Chen, L.; Snyder, G.J. Stabilizing the optimal carrier concentration for high thermoelectric efficiency. Adv. Mater. 2011, 23, 5674–5678. [Google Scholar] [CrossRef]
- Heremans, J.P.; Jovovic, V.; Toberer, E.S.; Saramat, A.; Kurosaki, K.; Charoenphakdee, A.; Yamanaka, S.; Snyder, G.J. Enhancement of thermoelectric efficiency in PbTe by distortion of the electronic density of states. Science 2008, 321, 554–557. [Google Scholar] [CrossRef]
- Androulakis, J.; Lee, Y.; Todorov, I.; Chung, D.-Y.; Kanatzidis, M. High-temperature thermoelectric properties ofn-type PbSe doped with Ga, In, and Pb. Phys. Rev. B 2011, 83, 195209. [Google Scholar] [CrossRef]
- Ginting, D.; Lin, C.-C.; Rathnam, L.; Yu, B.-K.; Kim, S.-J.; Al Rahal Al Orabi, R.; Rhyee, J.-S. Enhancement of thermoelectric properties by effective K-doping and nanoprecipitation in quaternary compounds of (Pb1−xKxTe)0.70(PbSe)0.25(PbS)0.05. RSC Adv. 2016, 6, 62958–62967. [Google Scholar] [CrossRef]
- Ginting, D.; Lin, C.-C.; Lydia, R.; So, H.S.; Lee, H.; Hwang, J.; Kim, W.; Al Rahal Al Orabi, R.; Rhyee, J.-S. High thermoelectric performance in pseudo quaternary compounds of (PbTe)0.95−x(PbSe)x(PbS)0.05 by simultaneous band convergence and nanoprecipitation. Acta Mater. 2017, 131, 98–109. [Google Scholar] [CrossRef]
- He, J.; Zhao, L.-D.; Zheng, J.-C.; Doak, J.W.; Wu, H.; Wang, H.-Q.; Lee, Y.; Wolverton, C.; Kanatzidis, M.G.; Dravid, V.P. Role of Sodium Doping in Lead Chalcogenide Thermoelectrics. J. Am. Chem. Soc. 2013, 135, 4624–4627. [Google Scholar] [CrossRef]
- Zhang, Q.; Cao, F.; Liu, W.; Lukas, K.; Yu, B.; Chen, S.; Opeil, C.; Broido, D.; Chen, G.; Ren, Z. Heavy Doping and Band Engineering by Potassium to Improve the Thermoelectric Figure of Merit in p-Type PbTe, PbSe, and PbTe1−ySey. J. Am. Chem. Soc. 2012, 134, 10031–10038. [Google Scholar] [CrossRef]
- Ginting, D.; Lin, C.-C.; Yun, J.H.; Yu, B.-K.; Kim, S.-J.; Rhyee, J.-S. High Thermoelectric Performance by Nanoinclusion and Randomly Distributed Interface Potential in N-type (PbTe0.93−xSe0.07Clx)0.93(PbS)0.07 Composites. J. Mater. Chem. A 2017, 5, 13535–13543. [Google Scholar] [CrossRef]
- Wang, H.; Pei, Y.; LaLonde, A.D.; Snyder, G.J. Heavily doped p-type PbSe with high thermoelectric performance: An alternative for PbTe. Adv. Mater. 2011, 23, 1366–1370. [Google Scholar] [CrossRef] [PubMed]
- Wang, H.; Gibbs, Z.M.; Takagiwa, Y.; Snyder, G.J. Tuning bands of PbSe for better thermoelectric efficiency. Energy Environ. Sci. 2014, 7, 804–811. [Google Scholar] [CrossRef]
- Wang, H.; Schechtel, E.; Pei, Y.; Snyder, G.J. High Thermoelectric Efficiency of n-type PbS. Adv. Energy Mater. 2013, 3, 488–495. [Google Scholar] [CrossRef]
- Wang, Z.; Ma, Y.; Vartak, P.B.; Wang, R.Y. Precursors for PbTe, PbSe, SnTe and SnSe synthesized using diphenyl dichalcogenides. Chem. Commun. 2018, 54, 9055. [Google Scholar] [CrossRef] [PubMed]
- Su, T.; Li, S.; Zheng, Y.; Li, H.; Hu, M.; Ma, H.; Jia, X. Thermoelectric properties of PbTe1−xSex alloys prepared by high pressure. J. Phys. Chem. Solids 2013, 74, 913–916. [Google Scholar] [CrossRef]
- Androulakis, J.; Todorov, I.; He, J.; Chung, D.-Y.; Dravid, V.; Kanatzidis, M. Thermoelectrics from Abundant Chemical Elements: High-Performance Nanostructured PbSe–PbS. J. Am. Chem. Soc. 2011, 133, 10920–10927. [Google Scholar] [CrossRef]
- Wang, H.; Wang, J.; Cao, X.; Snyder, G.J. Thermoelectric alloys between PbSe and PbS with effective thermal conductivity reduction and high figure of merit. J. Mater. Chem. A 2014, 2, 3169–3174. [Google Scholar] [CrossRef]
- Zhang, Q.; Chere, E.K.; Wang, Y.; Kim, H.S.; He, R.; Cao, F.; Dahal, K.; Broido, D.; Chen, G.; Ren, Z. High thermoelectric performance of n-type PbTe1− ySy due to deep lying states induced by indium doping and spinodal decomposition. Nano Energy 2016, 22, 572–582. [Google Scholar] [CrossRef]
- Qin, B.; Hu, X.; Zhang, Y.; Wu, H.; Pennycook, S.J.; Zhao, L.D. Comprehensive Investigation on the Thermoelectric Properties of p-type PbTe—PbSe-PbS Alloys. Adv. Electron. Mater. 2019, 5, 1900609. [Google Scholar] [CrossRef]
- Yamini, S.A.; Wang, H.; Gibbs, Z.M.; Pei, Y.; Dou, S.X.; Snyder, G.J. Chemical composition tuning in quaternary p-type Pb-chalcogenides—A promising strategy for enhanced thermoelectric performance. Phys. Chem. Chem. Phys. 2014, 16, 1835–1840. [Google Scholar] [CrossRef] [PubMed]
- Yamini, S.A.; Wang, H.; Ginting, D.; Mitchell, D.R.G.; Dou, S.X.; Snyder, G.J. Thermoelectric performance of n-type (PbTe)0.75(PbS)0.15(PbSe)0.1 composites. ACS Appl. Mater. Interface 2014, 6, 11476–11483. [Google Scholar] [CrossRef] [PubMed]
- Korkosz, R.J.; Chasapis, T.C.; Lo, S.-H.; Doak, J.W.; Kim, Y.J.; Wu, C.-I.; Hatzikraniotis, E.; Hogan, T.P.; Seidman, D.N.; Wolverton, C.; et al. High ZT in p-Type (PbTe)1−2x(PbSe)x(PbS)x Thermoelectric Materials. J. Am. Chem. Soc. 2014, 136, 3225–3237. [Google Scholar] [CrossRef] [PubMed]
- Yamini, S.A.; Patterson, V.; Santos, R. Band-Gap Nonlinearity in Lead Chalcogenide (PbQ, Q = Te, Se, S) Alloys. ACS Omega 2017, 2, 3417–3423. [Google Scholar] [CrossRef]
- He, J.; Kanatzidis, M.G.; Dravid, V.P. High performance bulk thermoelectrics via a panoscopic approach. Mater. Today 2013, 16, 166–176. [Google Scholar] [CrossRef]
- Xu, B.; Feng, T.; Li, Z.; Pantelides, S.T.; Wu, Y. Constructing Highly Porous Thermoelectric Monoliths with High-Performance and Improved Portability from Solution-Synthesized Shape-Controlled Nanocrystals. NanoLett. 2018, 18, 4034–4039. [Google Scholar] [CrossRef]
- Biswas, K.; He, J.; Blum, I.D.; Wu, C.I.; Hogan, T.P.; Seidman, D.N.; Dravid, V.P.; Kanatzidis, M.G. High-performance bulk thermoelectrics with all-scale hierarchical architectures. Nature 2012, 489, 414–418. [Google Scholar] [CrossRef]
- Blum, I.D.; Isheim, D.; Seidman, D.N.; He, J.; Androulakis, J.; Biswas, K.; Dravid, V.P.; Kanatzidis, M.G. Dopant distributions in PbTe-based thermoelectric materials. J. Electr. Mater. 2012, 41, 1583–1588. [Google Scholar] [CrossRef]
- Johnsen, S.; He, J.; Androulakis, J.; Dravid, V.P.; Todorov, I.; Chung, D.Y.; Kanatzidis, M.G. Nanostructures boost the thermoelectric performance of PbS. J. Am. Chem. Soc. 2011, 133, 3460–3670. [Google Scholar] [CrossRef]
- Wang, H.; Hwang, J.; Snedaker, M.L.; Kim, I.-H.; Kang, C.; Kim, J.; Stucky, G.D.; Bowers, J.; Kim, W. High Thermoelectric performance of a heterogeneous PbTe nanocomposite. Chem. Mater. 2015, 27, 944–949. [Google Scholar] [CrossRef]
- Wu, D.; Zhao, L.-D.; Tong, X.; Li, W.; Wu, L.; Tan, Q.; Pei, Y.; Huang, L.; Li, J.-F.; Zhu, Y.; et al. Superior thermoelectric performance in PbTe-PbS pseudo-binary: Extremely low thermal conductivity and modulated carrier concentration. Energy Environ. Sci. 2015, 8, 2056–2068. [Google Scholar] [CrossRef]
- Biswas, K.; He, J.; Zhang, Q.; Wang, G.; Uher, C.; Dravid, V.P.; Kanatzidis, M.G. Strained endotaxial nanostructures with high thermoelectric figure of merit. Nat. Chem. 2011, 3, 160–166. [Google Scholar] [CrossRef] [PubMed]
- Girard, S.N.; Schmidt-Rohr, K.; Chasapis, T.C.; Hatzikraniotis, E.; Njegic, B.; Levin, E.M.; Rawal, A.; Paraskevopoulos, K.M.; Kanatzidis, M.G. Analysis of phase separation in high performance PbTe–PbS thermoelectric materials. Adv. Funct. Mater. 2013, 23, 747–757. [Google Scholar] [CrossRef]
- Girard, S.N.; He, J.; Zhou, X.; Shoemaker, D.; Jaworski, C.M.; Uher, C.; Dravid, V.P.; Heremans, J.P.; Kanatzidis, M.G. High performance Na-doped PbTe-PbS thermoelectric materials: Electronic density of states modification and shape-controlled nanostructures. J. Am. Chem. Soc. 2011, 133, 16588–16597. [Google Scholar] [CrossRef]
- Zhao, L.D.; Wu, H.J.; Hao, S.Q.; Wu, C.I.; Zhou, X.Y.; Biswas, K.; He, J.Q.; Hogan, T.P.; Uher, C.; Wolverton, C.; et al. All-scale hierarchical thermoelectrics: MgTe in PbTe facilitates valence band convergence and suppresses bipolar thermal transport for high performance. Energy Environ. Sci. 2013, 6, 3346–3355. [Google Scholar] [CrossRef]
- Paul, B.; Rawat, P.K.; Banerji, P. Dramatic enhancement of thermoelectric power factor in PbTe:Cr co-doped with iodine. Appl. Phys. Lett. 2011, 98, 262101. [Google Scholar] [CrossRef]
- Chasapis, T.C.; Lee, Y.; Hatzikraniotis, E.; Paraskevopoulos, K.M.; Chi, H.; Uher, C.; Kanatzidis, M.G. Understanding the role and interplay of heavy-hole and light-hole valence bands in the thermoelectric properties of PbSe. Phys. Rev. B 2015, 91, 085207–0852211. [Google Scholar] [CrossRef]
- Wang, H.; Bahk, J.-H.; Kang, C.; Hwang, J.; Kim, K.; Kim, J.; Burke, P.; Bowers, J.E.; Gossard, A.C.; Shakouri, A.; et al. Right sizes of nanoand microstructures for high-performance and rigid bulk thermoelectrics. Proc. Nat. Acd. Sci. USA 2014, 111, 10949–10954. [Google Scholar] [CrossRef]
- Pei, Y.; Wang, H.; Gibbs, Z.M.; LaLonde, A.D.; Snyder, G.J. Thermopower enhancement in Pb1−xMnxTe alloys and its effect on thermoelectric efficiency. NPG Asia Mater. 2012, 4, e28. [Google Scholar] [CrossRef]
- He, J.; Girard, S.N.; Kanatzidis, M.G.; Dravid, V.P. Microstructure-lattice thermal conductivity correlation in nanostructured PbTe0.7S0.3 thermoelectric materials. Adv. Funct. Mater. 2010, 20, 764–772. [Google Scholar] [CrossRef]
- Dow, H.S.; Oh, M.S.; Kim, B.S.; Park, S.D.; Min, B.K.; Lee, H.W.; Wee, D.M. Effect of Ag or Sb addition on the thermoelectric properties of PbTe. J. Appl. Phys. 2010, 108, 113709. [Google Scholar] [CrossRef]
- Wu, H.J.; Zhao, L.D.; Zheng, F.S.; Wu, D.; Pei, Y.L.; Tong, X.; Kanatzidis, M.G.; He, J.Q. Broad temperature plateau for thermoelectric figure of merit ZT>2 in phase-separated PbTe0.7S0.3. Nat. Commun. 2014, 5, 4515. [Google Scholar] [CrossRef] [PubMed]
- Pei, Y.; LaLonde, A.; Iwanaga, S.; Snyder, G.J. High thermoelectric figure of merit in heavy hole dominated PbTe. Energy Environ. Sci. 2011, 4, 2085–2089. [Google Scholar] [CrossRef]
- Airapetyants, S.V.; Vinograd, N.M.; Dubrovsk, I.N.; Kolomet, N.V. Solid State USSR. Soviet Phys. 1966, 8, 1069–1072. [Google Scholar]
- Koh, Y.K.; Vineis, C.J.; Calawa, S.D.; Walsh, M.P.; Cahill, D.G. Lattice thermal conductivity of nanostructured thermoelectric materials based on PbTe. Appl. Phys. Lett. 2009, 94, 153101. [Google Scholar] [CrossRef]
- Callaway, J.; von Baeyer, H.C. Effect of point imperfections on lattice thermal conductivity. Phys. Rev. 1960, 120, 1149–1154. [Google Scholar] [CrossRef]
- Kim, W.; Majumdar, A. Phonon scattering cross section of polydispersed spherical nanoparticles. J. Appl. Phys. 2006, 99, 084306. [Google Scholar] [CrossRef]
- Kim, W.; Singer, S.L.; Majumdar, A.; Zide, J.M.O.; Klenov, D.; Gossard, A.C.; Stemmer, S. Reducing thermal conductivity of crystalline solids at high temperature using embedded nanostructures. NanoLett. 2008, 8, 2097–2099. [Google Scholar] [CrossRef]
- Mingo, N.; Hauser, D.; Kobayashi, N.P.; Plissonnier, M.; Shakouri, A. Nanoparticle-in-alloy approach to efficient thermoelectrics: Silicides in SiGe. NanoLett. 2009, 9, 711–715. [Google Scholar] [CrossRef]
- Minnich, A.J.; Lee, H.; Wang, X.W.; Joshi, G.; Dresselhaus, M.S.; Ren, Z.F.; Chen, G.; Vashaee, D. Modeling study of thermoelectric SiGe nanocomposites. Phys. Rev. B 2009, 80, 155327. [Google Scholar] [CrossRef]
- Prasher, R. Thermal transport due to phonons in random nanoparticulate media in the multiple and dependent (correlated) elastic scattering regime. J. Heat Trans. 2006, 128, 627–637. [Google Scholar] [CrossRef]
- Kim, H.S.; Liu, W.; Chen, G.; Chu, C.W.; Ren, Z. Relationship between thermoelectric figure of merit and energy conversion efficiency. Proc. Nat. Acad. Sci. USA 2015, 112, 8205–8210. [Google Scholar] [CrossRef] [PubMed]
- Ahmad, S.; Mahanti, S.D.; Hoang, K.; Kanatzidis, M.G. Ab initiostudies of the electronic structure of defects in PbTe. Phys. Rev. B 2006, 74, 155205. [Google Scholar] [CrossRef]
- Androulakis, J.; Todorov, I.; Chung, D.-Y.; Ballikaya, S.; Wang, G.; Uher, C.; Kanatzidis, M. Thermoelectric enhancement in PbTe with K or Na codoping from tuning the interaction of the light- and heavy-hole valence bands. Phys. Rev. B 2010, 82, 115209. [Google Scholar] [CrossRef]
- Zhao, L.-D.; Lo, S.-H.; He, J.; Li, H.; Biswas, K.; Androulakis, J.; Wu, C.-I.; Hogan, T.P.; Chung, D.-Y.; Dravid, V.P.; et al. High performance thermoelectrics from earth-abundant materials: Enhanced figure of merit in PbS by second phase nanostructures. J. Am. Chem. Soc. 2011, 133, 20476–20487. [Google Scholar] [CrossRef]
- Klemens, P.G. Thermal resistance due to point defects at high temperatures. Phys. Rev. 1960, 119, 507–509. [Google Scholar] [CrossRef]
- Liu, W.; Yan, X.; Chen, G.; Ren, Z. Recent advances in thermoelectric nanocomposites. NanoEnergy 2012, 1, 42–56. [Google Scholar] [CrossRef]
- Wang, H.; Bahk, J.-H.; Kang, C.; Hwang, J.; Kim, K.; Shakouri, A.; Kim, W. Large enhancement in the thermoelectric properties of Pb0.98Na0.02Te by optimizing the synthesis conditions. J. Mater. Chem. A 2013, 1, 11269–11278. [Google Scholar] [CrossRef]
- Li, X.X.; Li, J.Q.; Liu, F.S.; Ao, W.Q.; Li, H.T.; Pan, L.C. Enhanced thermoelectric properties of (PbTe)0.88(PbS)0.12 composites by Bi doping. J. Alloys Compd. 2013, 547, 86–90. [Google Scholar] [CrossRef]
- Androulakis, J.; Lin, C.-H.; Kong, H.-J.; Uher, C.; Wu, C.-I.; Hogan, T.; Cook, B.A.; Caillat, T.; Paraskevopoulos, K.M.; Kanatzidis, M.G. Spinodal decomposition and nucleation and growth as a means to bulk nanostructured thermoelectrics: Enhanced performance in Pb1−xSnxTe−PbS. J. Am. Chem. Soc. 2007, 129, 9780–9788. [Google Scholar] [CrossRef]
- Wang, H.; Pei, Y.; LaLonde, A.D.; Snyder, G.J. Weak electron-phonon coupling contributing to high thermoelectric performance in n-type PbSe. Proc. Nat. Acad. Sci. USA 2012, 109, 9705–9709. [Google Scholar] [CrossRef] [PubMed]
- Jaworski, C.M.; Nielsen, M.D.; Wang, H.; Girard, S.N.; Cai, W.; Porter, W.D.; Kanatzidis, M.G.; Heremans, J.P. Valence-band structure of highly efficient P-type thermoelectric PbTe-PbS alloys. Phys. Rev. B 2013, 87, 045203. [Google Scholar] [CrossRef]
- Wang, H.; LaLonde, A.D.; Pei, Y.; Snyder, G.J. The criteria for beneficial disorder in thermoelectric solid solutions. Adv. Funct. Mater. 2013, 23, 1586–1596. [Google Scholar] [CrossRef]
- Heremans, J.P.; Thrush, C.M.; Morelli, D.T. Thermopower enhancement in PbTe with Pb precipitates. J. Appl. Phys. 2005, 98, 063703. [Google Scholar] [CrossRef]
- Kim, W.; Zide, J.; Gossard, A.; Klenov, D.; Stemmer, S.; Shakouri, A.; Majumdar, A. Thermal conductivity reduction and thermoelectric figure of merit increase by embedding nanoparticles in crystalline semiconductors. Phys. Rev. Lett. 2006, 96, 045901. [Google Scholar] [CrossRef] [PubMed]
- Liu, J.; Hsieh, T.H.; Wei, P.; Duan, W.; Moodera, J.; Fu, L. Spin-filtered edge states with an electrically tunable gap in a two-dimensional topological crystalline insulator. Nat. Mater. 2014, 13, 178–183. [Google Scholar] [CrossRef] [PubMed]
- Chen, C.-L.; Wang, H.; Chen, Y.-Y.; Day, T.; Snyder, G.J. Thermoelectric properties of p-type polycrystalline SnSe doped with Ag. J. Mater. Chem. A 2014, 2, 11171–11176. [Google Scholar] [CrossRef]
- LaLonde, A.D.; Pei, Y.; Snyder, G.J. Reevaluation of PbTe1−xIx as high performance n-type thermoelectric material. Energy Environ. Sci. 2011, 4, 2090–2096. [Google Scholar] [CrossRef]
- Androulakis, J.; Chung, D.-Y.; Su, X.; Zhang, L.; Uher, C.; Hasapis, T.C.; Hatzikraniotis, E.; Paraskevopoulos, K.M.; Kanatzidis, M.G. High-temperature charge and thermal transport properties of then-type thermoelectric material PbSe. Phys. Rev. B 2011, 84, 155207. [Google Scholar] [CrossRef]
- Cutler, M.; Mott, N.F. Observation of Anderson localization in an electron gas. Phys. Rev. 1969, 181, 1336–1340. [Google Scholar] [CrossRef]
- Rowe, D.M. Thermoelectrics Handbook: Marco to Nano; CRC Press: Boca Raton, FL, USA, 2005. [Google Scholar]
- Faleev, S.V.; Léonard, F. Theory of enhancement of thermoelectric properties of materials with nanoinclusions. Phys. Rev. B 2008, 77, 214304. [Google Scholar] [CrossRef]
- Kishimoto, K.; Koyanagi, T. Preparation of sintered degenerate n-type PbTe with a small grain size and its thermoelectric properties. J. Appl. Phys. 2002, 92, 2544. [Google Scholar] [CrossRef]
- Ravich, Y.I.; Efimova, B.A.; Smirnov, I.A. Semiconducting Lead Chalcogenides; Pleanum: New York, NY, USA, 1970. [Google Scholar]
- Song, Q.; Liu, T.H.; Zhou, J.; Ding, Z.; Chen, G. Ab initio study of electron mean free paths and thermoelectric properties of lead telluride. Mater. Today Phys. 2017, 2, 69–77. [Google Scholar] [CrossRef]
- Liu, T.H.; Zhou, J.; Liao, B.; Singh, D.J.; Chen, G. First-principles mode-by-mode analysis for electron-phonon scattering channels and mean free path spectra in GaAs. Phys. Rev. B 2017, 95, 075206. [Google Scholar] [CrossRef]
- Wang, Y.; Lu, Z.; Ruan, X. First principles calculation of lattice thermal conductivity of metals considering phonon-phonon and phonon-electron scattering. J. Appl. Phys. 2016, 119, 225109. [Google Scholar] [CrossRef]


© 2019 by the authors. Licensee MDPI, Basel, Switzerland. This article is an open access article distributed under the terms and conditions of the Creative Commons Attribution (CC BY) license (http://creativecommons.org/licenses/by/4.0/).