Abstract
Found in some specific scenarios, drinking water is hard for people to get, such as during expeditions and scientific investigations. First, a novel water generator with only two thermoelectric coolers (Model A) is designed for extracting water from atmospheric vapor and then experimentally studied under a small inlet air flow rate. The impact of operating conditions on surface temperatures of cold/hot sides and water yield are investigated, including the air flow rate and humidity. Alternately, to determine the super performance of Model A, a comparative experiment between Model A and a reference model (Model B) is carried out. The results suggest that both the cold/hot temperature and water yield in Model A increases with the humidity and air flow rate rising. Seen in comparisons of Model A and Model B, it is found that, at an air humidity of 90% and air flow rate of 30 m3/h, the total water yield was increased by 43.4% and the corresponding value reached the maximum increment of 66.7% at an air humidity of 60% and air flow rate of 30 m3/h. These features demonstrate the advantage of Model A especially in low air humidity compared to Model B.
1. Introduction
Water is indispensable for human life and the development of industry and civilization. Water resources, however, are rapidly declining due to the gradually increasing human population, industrial pollution and inappropriate agricultural policies [1,2,3]. Mesfin et al. [2] found that two-thirds of the global population (4.0 billion people) live under conditions of severe water scarcity at least one month per year. Half a billion people in the world face severe water scarcity all year round. Even though in other rich water resource areas it is still difficult for hikers, expeditions and scientific investigation teams to find clean freshwater in remote outdoor areas. Great efforts have been made to solve the afore-mentioned problems.
Figure 1 summarizes several water generating methods [4,5,6,7]. Among such available ways, extracted water from atmospheric vapor is an alternate potential solution to relieve water resource shortages. The atmosphere is estimated to contain over 12.9 × 10¹² m3 of renewable water, which is more than the total amount of available fresh water in marshes, wetlands and rivers on Earth [8]. During past decades, thermoelectric cooling (TEC) technology has drawn great attention around the world, using the Peltier effect to create a heat flux between the junctions of two different types of materials. A typical TEC device has two sides, and when a DC electric current flows through the device, it brings heat from one side to the other so that one side gets cooler (cold side) while the other gets hotter (hot side). Without any moving parts, refrigerant or emission gases, TEC devices can work quietly, reliably and be environmental-friendly [9,10]. Additionally, TEC devices also possess the advantages of small size, light weight and direct-current (DC) driven by photovoltaic (PV) panels. Due to these merits, TEC devices have been widely used to provide cooling in several situations, such as water machines, car refrigerators, chip cooling, air conditioners of outdoor telecommunication cabinets, dehumidifiers, and water generators. Many researches focused on improving the performance of TEC devices include Liu et al. [11] who invested the coefficient of performance (COP) of the thermoelectric module, Muhammad et al. [12] who reviewed the materials, modeling approaches, and strategies to improve the cooling performance and practical application of TECs, and Cheng et al. [13] who used genetic algorithms to optimize thermoelectric coolers in a confined volume. Additionally, Chowdhury et al. [14] used metal-organic chemical vapor deposition (MOCVD) to form p-type Bi2Te3/Sb2Te3 and n-type Bi2Te3/Bi2Te2.83Se0.17 superlattices on GaAs, and the total thickness of the TECs were reduced to 100 μm while Russel and his coworkers [15] used experimental ways to validate a thermal resistance network model and found it can weigh the extent of off peak heat fluxes and ambient temperatures to make the system operate at a low power penalty region. The higher temperature of the hot side will cause more heat to be moved from the hot side to the cold side, which has an adverse impact on the cooling effect of TECs. Due to this problem, a number of researchers have made efforts to solve the heat dissipation of the hot side. Udomsakdigool et al. [16] designed a heat sink with rectangular fins and investigated the impact of different operational parameters, including the distance of the heat sink with/without fans, and the voltage of fans and heat applied to the heat sink. Astrain et al. [17] used the thermosyphon with phase change to increase the coefficient of performance (COP) of thermoelectric coolers. Chein et al. [18] designed a microchannel heat sink using water or air as the coolant to dissipate heat.
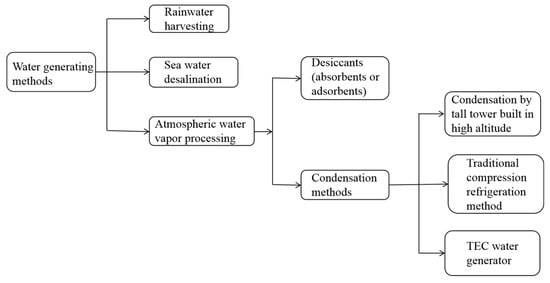
Figure 1.
Classification of water generating methods.
Integrating TECs into harvested atmospheric water vapor makes full use of the merits of TECs and the size of a water generator can be reduced at the same time. TEC devices cool the water vapor temperature to the air dew point and makes it condense into droplets on the cold-side surface. The condensed droplets can be removed for dehumidification or collected for water production. Temperature, humidity and flow rate of inlet air, input current, and heat dissipation of TECs affect the vapor condensation process on the cold-side surface. Several literatures have reported on the performance of the water generated from the atmospheric water vapor via TECs. Milani et al. [19] used psychrometric analysis to investigate the influence of relative humidity variation on saturation temperature, power consumption, water production rate and the economy of generated water in maximal thermal conditions. Vian et al. [20] used theoretical and experimental methods to investigate the performance of thermoelectric dehumidifiers with different input power, inlet temperature and humidity, and concluded that the water productivity could reach 0.969 L/day. Tan et al. [21] experimentally studied parameters affecting the amount of extracted water and obtained 50 mL of water over a 3-h period. Suryaningsih et al. [22] studied the influence of inlet flow rate (>129 m3/h). V. P. Joshi et al. [23] investigated the small flow rate of a water generator with 10 TEC modules. Bortolini et al. [24] conducted a similar experiment with flow rates ranging from 57 m3/h to 127 m3/h and the system included 20 TEC modules.
As mentioned in the above literature surveys, an number of research papers are available regarding the large size TEC water generator including many TEC modules (10–20 modules) or working at large air flow rates. However, the large size TEC water generator is not suitable for some special groups (such as cyclists, hikers, expedition and scientific investigation teams), in practice when the drinking water is needed, due to the inconvenience of carrying the large systems. Conversely, the air temperature discharged from the cold side of the TEC is reduced. The effect of using the discharged air from the cold side of the TEC to cool the hot side has been rarely discussed in open literature. Additionally, it has been demonstrated that the heat transfer rate between the cold side and near air in the condition of drop-wise condensation is 10 times larger than that in the condition of film condensation [19], therefore, the wetting property of cold side surface was an important factor influencing the amount of water generated and it is worthy to be studied further. Either the utilization of discharged air or the hydrophobic material theoretically can reduce the energy requirement of a TEC device.
A novel portable water generator prototype using two TEC modules has been designed (Model A), which possesses a simple structure and small space occupation. Few investigations have reported on the performance of a water generator with one or two TEC modules operating at small inlet flow rates, making results unclear up to now, thus the idea of using the low temperature air discharged from the cold side of the TEC device to cool the hot side in Model A was introduced. Additionally, a hydrophobic material is employed on the extended surfaces attached to the cold side of the TEC device module to form the drop-wise condensation. The impacts of relative humidity and air flow rate on the temperatures of the cold/hot sides and the water yield rate for Model A are investigated experimentally. Further, to determine the performances of Model A and reference Model B, without using discharged air and hydrophobic material, is simultaneously measured and analyzed in detail.
2. Methodology
2.1. Experimental Setup
Seen in Figure 2a, the experimental system of Model A consisted of a humidifier, a mixing chamber, an air channel and a TEC (thermoelectric cooling) water generator. The air channel was made of 1.2 mm-thick stainless steel and insulated by 20 mm-thick polystyrene foam. The TEC water generator was connected to the mixing chamber via the air channel. The humidifier linked to the mixing chamber was used to control the relative humidity of air in the mixing chamber. Room air was drawn into the mixing chamber and was humidified by the humidifier. The humidified air in the mixing chamber flowed through the insulated air channel and contacted the cold-side fin of the TEC modules. The temperature of air near the cold side was reduced to its dew point, subsequently, and some condensed droplets on the TEC cold-side fin occurred. The condensed droplets grew and, finally, dropped into a rectangular vessel. Extended surfaces (fins) were added to both sides of the TECs to increase the surface area, leading to an increase in the heat transfer and water generation rates. Viewing the air channel, the air flow rate was controlled by a cross flow fan. Additionally, a fan was installed on the hot side of the TEC to suck the room air flowing across the hot-side fin. Cool air from the cold-side surface was not discharged directly but returned to the TEC hot side to aid with the heat dissipation. Additionally, hydrophobic material (Nano SiO2 gel) was employed on the cold-side fin surface. Return cool air effectively reduced the hot-side surface temperature, simultaneously, hydrophobic material increased the condensation rate of wet air near the cold-side fin [25].
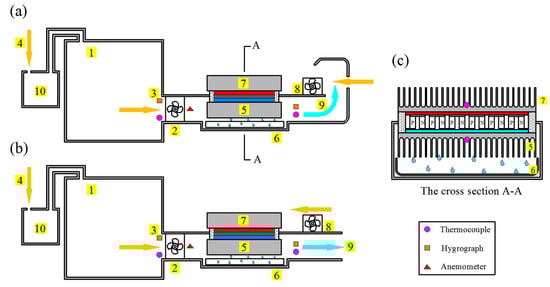
Figure 2.
The diagram of structure (a) Model A (b) Model B (c) cross section A–A. Note: 1-Humidified chamber 2-Fan 3-Hygrographs (inlet and outlet) 4-Room air 5-Thermal slug of TEC cold side 6-Water pan 7-Thermal slug of TEC hot side 8-Cooling fan of hot side 9-Outlet air 10-Humidifier.
Model B, of the same size, was constructed, as illustrated in Figure 2b. Unlike Model A, the air flowing across the cold side was directly discharged outside and the cold-side fins were not coated with hydrophobic material. The cross section of the equipment is shown in the Figure 2c. Figure 3 shows the photo of the experimental system setup of Model A. The detail parameters of the different system components are listed in Table 1.
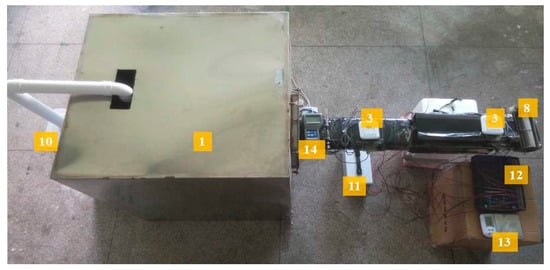
Figure 3.
The photo of experimental setup. Notes: 11-DC stabilized power supply 12-Data acquisition instrument 13-Electronic balance 14-Hot wire anemometer.

Table 1.
Detail parameters of the system components.
2.2. Test Procedure
The tests were carried out during the period of 20th March–15th April 2018. The current and voltage of input power source were controlled at 3.4 A, 15.4 V (52.3 W), respectively, during the whole experiment. Three different inlet air flow rates (30 m3/h, 50 m3/h and 70 m3/h) adjusted by a fan, and air relative humidity (60%, 70%, 80% and 90%) controlled by a humidifier, were experimentally investigated under the constant dry-bulb temperature of 24 °C. A hot wire anemometer, located in the center of the outlet of the fan, was used to monitor the air flow rates with an accuracy of ±0.015 m/s. The humidity of air in the chamber was controlled by a humidifier and relative humidity was measured with a hygrograph (accuracy of ±3%). Several T-type thermocouples were used to measure temperatures of air and fin surfaces. The testing positions of temperatures, air flow rate and relative humidity are shown in Figure 2. Measured data were recorded using HOIOKI (LR8402-21) data acquisition every 5 min. Additionally, the generated water was weighed manually once an hour by an electronic analytical balance (accuracy of ±0.3 g). The specifications of experimental apparatuses used are described in Table 2.
Table 2.
The specifications of experimental apparatuses used.
2.3. Water Yield Prediction
The mass of water generated by a TEC (thermoelectric cooling) module () was directly calculated by the moisture content of the air near the TEC surface. To obtain the moisture content, the air temperature and humidity of the inlet and outlet of the air channel were respectively measured. Detailed calculations [26,27] on the water yield are as follows:
where and represent the mass of water vapor of the inlet and outlet air, respectively, in kg; represents the air moisture content, in g/kg; represents temperatures of either the inlet or outlet air, in °C; represents the partial pressure of water vapor, in Pa; represents the water vapor saturated pressure in the air temperature of T.
3. Results and Discussion
3.1. Comparison of Measured and Calculated Water Yield
Combing Equations (1)–(6), the condensed water from air on the fin surface can be calculated. During this section, taking the operating case 1 of Model A for an example (see Table 3), comparison between the measured and the calculated water yield rate evolution within the tested 10 h was carried out to validate the accuracy of experimental testing results. Figure 4 describes the calculated and the measured results:
Table 3.
The operating conditions in this study.
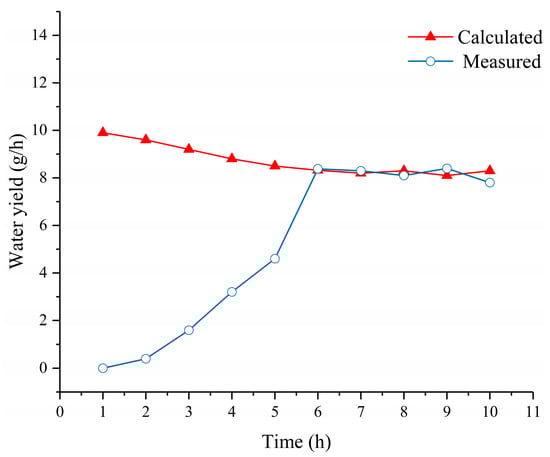
Figure 4.
Comparison between the measured and calculated water yield rates.
It can be observed from the measured data that the water yield rate rose slowly in the early first hour, then increased rapidly from the second to fifth hour, then ascended more sharply from the 5th to 6th h, and after 6 h the water yield rate changed within a narrow range. The above-mentioned change trends can be explained as follows. During the first h, the inlet air passing the cold fin surface was condensed and adhered to the fin surface, so the amount of water dropped into the pan was slight. Subsequently, the cold side fin surface was covered with more and more condensed water droplets, thus, the condensed water rate increased from the second to the fifth hours. After 5 h, almost the entire fin surface was covered with condensed water film. When the combined effects of inlet air perturbation and water gravity were enhanced to some extent, the drop rate from the 5th–6th h increased more sharply. Conversely, the calculated water yield rate presented a slightly decreasing trend in the early 6th h due to the condensed water film weakened the convection heat transfer between inlet air and the fin surface. During the course of time, both the calculated and measured water yield rate tended to be constant, also the corresponding difference between the calculation and actual measurement was decreased. Due to the findings of the afore-mentioned analysis, it indicates the significance of making the droplets adhered to the extended surfaces (fins) drop quickly. Thus, in the present study, a hydrophobic material was added on the cold-side fin surface to enable the condensed water to drop quickly which, simultaneously, had a positive effect on the enhancement of the heat transfer between the inlet air and the cold-side fin. The deviation phenomenon mentioned above could be resolved though the weight of the total experimental platform and, in the following study, that operational method is used. Considering the following studies, the comparative experiments on Model A and Model B under different operating conditions (see Table 3) are presented and analyzed.
3.2. Comparisons of Model A and Model B
There are two stages of comparative study here. The first stage compares the performance of Model A under different operating conditions, including inlet air relative humidity (RH) and inlet air flow rate on the water yield rate. The second stage is to compare Model A and Model B. Table 3 shows the six operating cases investigated during the test procedure. It is noteworthy that the investigation on small air flow rates under different levels of air humidity was the emphasis in this study.
3.2.1. The Impact of Relative Humidity
Referring to Table 3, to investigate the influence of inlet air relative humidity (RH) on the performance of the TEC (Thermoelectric cooling) system, the inlet air flow rate was set at 30 m3/h and the air flow rate was varied from 60 to 90% in 10% increments.
Figure 5 shows the transient temperatures of hot and cold sides under different inlet air relative humidity (RH). It can be observed that, under constant RH, the temperature of the hot-side surface ascended sharply early during the first hour and then changed at a narrow range. Similarly, the temperature of the cold-side surface initially dropped rapidly in a few minutes and then reached a steady value. Conversely, it was found that the temperatures of the hot or cold side increased with the increase of the RH for both Model A and Model B. These obtained results can be explained as follows: the cold-side surface temperature was reduced to below the dew point temperature of the inlet moist air and then water film formed on the surface of the cold side. Consequently, both heat and mass transfer coexisted simultaneously near the cold-side surface and, also, the two transfer processes were mutually beneficial. The increasing relative humidity of the inlet moist air contributed to the mass transfer due to the increasing moisture content difference between the inlet air and the air near the cold surface. The more efficient mass transfer accelerated the heat transfer from the inlet air to the cold-side surface, thus, the surface temperature of the cold side rose with the increasing of the inlet air relative humidity. Additionally, a similar tendency occurred on the hot-side surface temperature and was mainly attributed to more heat being transferred from the cold surface to the hot surface. Comparing Model A and Model B, the following results were obtained: the cold surface temperatures of both Model A and B showed a very similar evolution with time. The temperature of Model A was slightly lower than that of Model B, while the hot-side temperature of Model A was significantly lower than that of Model B, especially at the low air RH. The temperature difference was 1.2 °C for an air humidity of 60%, 0.9 °C for an air humidity of 70%, and 0.5 °C for an air humidity of 90%. The results demonstrate the positive effect of using the discharged air in Model A.
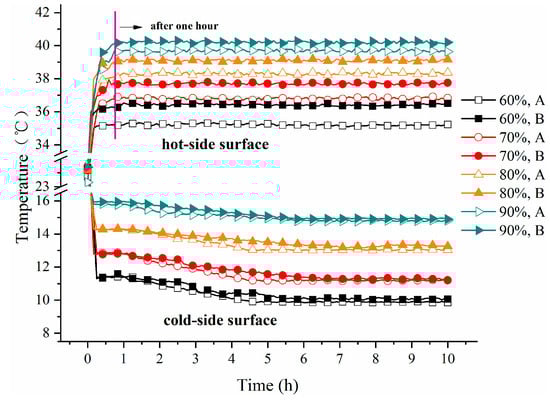
Figure 5.
Time-dependent temperatures of hot and cold side surfaces for different inlet air humidity.
Figure 6 shows the transient temperature of air coming out of the cold-side surface under different RH. It can be seen from Figure 6 that the outlet air temperature variations with time were similar to those of the cold-side surface at a constant RH; the outlet air temperatures of Models A and B ascended with the inlet air RH increasing. Conversely, the outlet air temperature of Model A was generally lower than that of Model B, especially at the lower inlet air RH. Those results were rationally consistent with the findings in Figure 5.
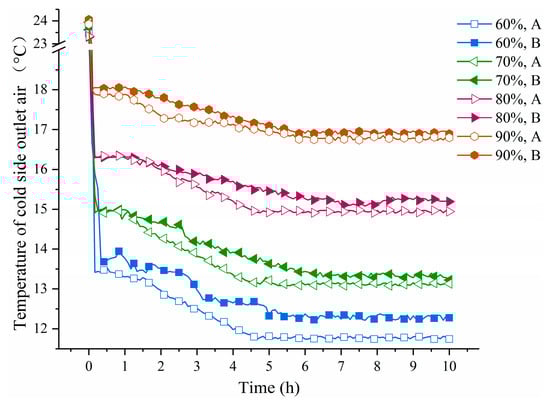
Figure 6.
Time dependent outlet air temperature for different inlet air humidity.
Figure 7 gives the measured results of the hourly water yield rate with inlet air RH while other operating conditions remained constant—the inlet air temperature stayed at 24 °C and the air flow rates at 30 m3/h. It was obvious that, for all cases, the water yield per hour collected from either Model A or Model B increased rapidly in the first 6 h and the increase rate was larger for the higher air humidity, then the water yield changed to a narrower range. Additionally, the water yield rate increased with the increase in the RH. This is due to the dew point temperature of the moist air increasing as the RH increased under a constant dry-bulb temperature. Consequently, when contacted with the cold-side fins, the inlet air with a higher RH reaches its dew point temperature more easily. Accordingly, the condensation process was faster.
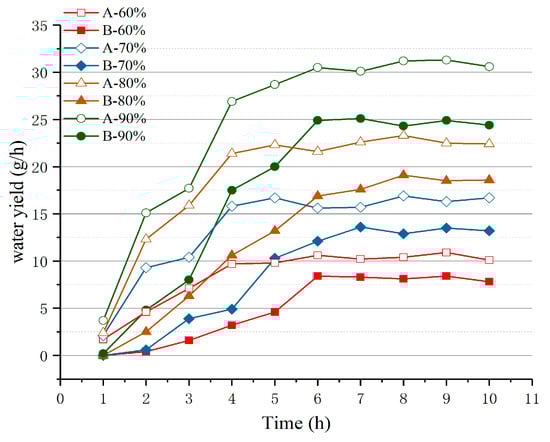
Figure 7.
Time-dependent water yield rate for different inlet air relative humidity.
Alternately, it can be observed that the harvested water from Model A exceeded that from Model B for the same RH, for example, the steady water yield rate for Model A was about 31 g/h at an RH of 90%, while the corresponding value for Model B was about 25 g/h. Moreover, the water yield from Model A reached a steady value over 5 h, while, correspondingly, it was over 6 h for Model B. Thus, it took less time to achieve the largest water yield for Model A, which would be beneficial for those in urgent need of water. The reason is two fold: first, the use of hydrophobic material achieved a better heat transfer between the inlet air and the cold-side fins; second, the cooling effect on the hot-side fin was more efficient due to the use of discharged air from the cold side.
3.2.2. The Impact of Inlet Air Flow Rate
The influence of the inlet air flow rate was analyzed, which was set at 0.3 m/s, 0.45 m/s and 0.6 m/ at a constant inlet air temperature of 24 °C and an air RH (relative humidity) of 60%, referring to Table 3.
Figure 8 shows the temperature variations at the cold and hot sides with different air flow rates for both Model A and Model B, respectively. Similar to Figure 5, the hot-side surface temperatures of Model A and Model B were increased rapidly during the early operating stage where the temperatures were kept nearly constant within the time tested for the three air flow rates. Conversely, it was suggested that the temperatures of the cold/hot sides of Model A rose with the increase of the inlet air flow rate. The hot-side surface temperatures of Model A were 35.9 °C at 30 m3/s, 36.7 °C at 50 m3/s and 37.5 °C at 70 m3/s, for example. This was due to the larger air flow rate and the more efficient convection heat transfer between the air and the cold-side surface. Figure 8 shows that the increase in the air flow rate had a more significant effect on the rise in temperature of the cold side compared to that on the hot side. Comparing Model A and Model B, it was concluded that the temperatures of Model A, whether on the cold-side surface or on the hot-side surface, were lower than those of Model B for all cases, especially in the case of a large air flow rate. Additionally, the cold-side temperature of Model A was significantly lower than that of Model B, especially at the high air flow rate, and the temperature difference was 0.2 °C for an air mass flow rate of 30 m3/h, 0.6 °C for an air mass flow rate of 50 m3/h, and 0.9 °C for an air mass flow rate of 70 m3/h. This was due to the lager air flow rate contributing to more discharged air from the cold side then more heat being removed from the hot-side of Model A, which led to the clearly lower cold side surface temperature of Model A compared to Model B.
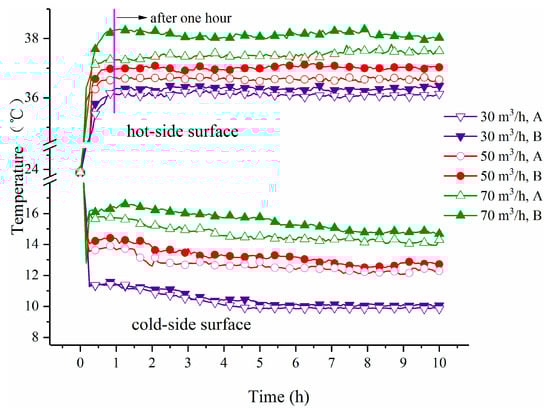
Figure 8.
Time dependent temperatures of hot and cold side surfaces for different air flow rates.
Figure 9 shows the outlet air temperature variations with air flow rate. It was indicated that, at a constant air flow rate, the air temperature of the outlet reduced abruptly at first, then decreased a slowly and changed within a narrow range after 4.5 h. Conversely, the increase in the air flow rate enabled the outlet temperature to rise for both Model A and Model B. Additionally, at the same air flow rate, the outlet air temperature of Model A was lower than that of Model B, which contributed to the water condensation on the cold-side surface.
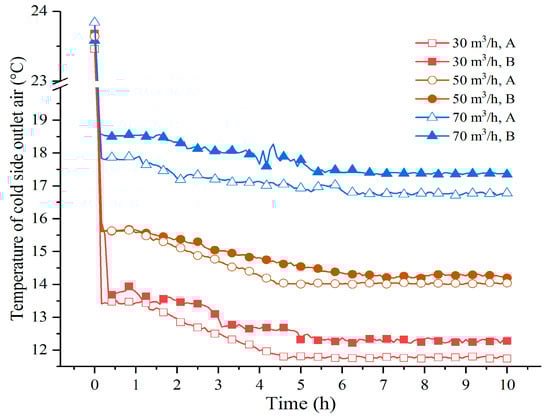
Figure 9.
Time- dependent outlet air temperature for different air flow rates.
Figure 10 shows the hourly water yield variations at an inlet air flow rate of 30 m3/h, 50 m3/h and 70 m3/h, while keeping the other operating conditions constant—an inlet air relative humidity of 60% and an air temperature of 24 °C. Figure 10 shows that, at a constant air flow rate, the hourly water yield was increased at first and tended to be steady afterward (over about 6 h). Additionally, the water yield from Model A or Model B increased with the increase of inlet air flow rates. The reason was the larger air velocity enhanced the heat transfer coefficient and, simultaneously, increased the droplet falling rate from the cold-side surface. It is noted that, unlike Model B, the water yield from Model A increased a little with the air flow rates increasing in the first 3 h. This phenomenon was due to the hydrophobic material used in Model A: during the first 3 h, the droplets were too small to creep down from the cold-side fin of Model B and the water yield depended on the air flow rate, while Model A adopted hydrophobic material to offset the adhesion between the droplets and cold-side surface. Comparing Model A and Model B, it was evident that the hourly water yield from Model A was larger than that from Model B for the three air flow rates.
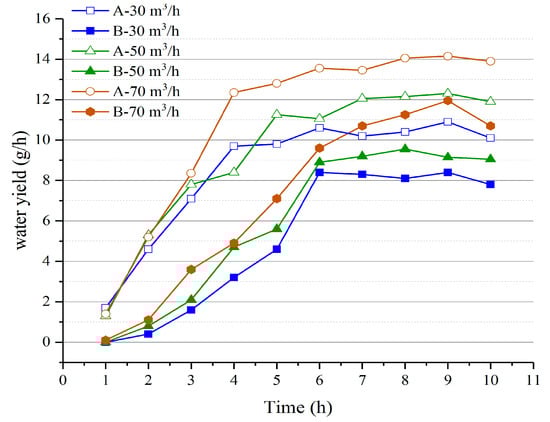
Figure 10.
Time-dependent water yield for different air flow rates.
The total water yield at different air RH and air flow rates is illustrated in Figure 11a,b, respectively. Figure 11a shows that the total water yields of Model A within the tested 10 h were 85.5 g, 135.5 g, 186.7 g, and 245.8 g when the inlet air RHs were equal to 60%, 70%, 80% and 90%, respectively. Moreover, it was deduced that an increase rate of 58% was the largest yield when the air RH was varied from 60 to 70%. Similarly, the water yields for Model B were 51.3 g, 85.1 g, 123.3 g, and 171.4 g. Comparing Model A and Model B, it was suggested that, at the constant air RH, the total water yields were about 66.7%, 59.2%, 51.4%, and 43.4% higher than those of Model B. Indicated in Figure 11b, the total water yields within the tested 10 h for Model A were 85.5 g, 94.4 g, and 109.6 g while only 51.3 g, 59.7 g, and 71.5 g for Model B, at the inlet air flow rate of 30 m3/h, 50 m3/h and 70 m3/h, respectively. Thus, the water yields of Model A were about 66.7%, 58.1% and 53.3% higher compared to Model B. Overall, the water yield improved with the increase of the air RH and air flow rate. Additionally, it can be concluded that, combining the hydrophobic materials on the cold-side surface with the discharging air is an efficient alternate solution to improve the condensed water from air on extended surfaces. This is especially pertinent during a lower air RH and velocity.
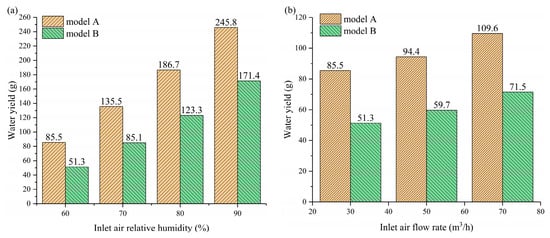
Figure 11.
Total water yield within the tested 10 h (a) at different RH (relative humidity) and (b) at different air flow rates.
4. Conclusions
Condensed water from air on the extended surfaces is a convenient method to “create” water in remote regions, coastal areas and other water-deficient but high-humidity areas. Based on thermoelectric cooling (TEC) technology, a portable water generator (Model A) was designed to maximize water yield. The portable water generator would be greatly useful for cyclists, hikers, expedition and scientific investigation teams due to its simple structure and small size. Few investigations have reported on the performance of a water generator with one or two TEC modules. Furthermore, we designed a cold-side surface using hydrophobic material and using heat dissipation from the hot side redirecting discharged air. The hydrophobic material increased the condensation rate of wet air near the cold-side fin, and the reusing of cooling energy to remove more heat energy from hot side maximized the water yield theoretically with minimal energy consumption. Thus, this experimental study was worthy to be implemented to determine the super performance of Model A operated in practical conditions. Through investing the impact of operating conditions, we found that the water yield rate increased with the air RH and air flow rates increasing. Additionally, to determine the feasibility of Model A, a comparative experimental test between Model A and Model B (reference model) was carried out. The findings showed that proposed Model A displayed the larger advantage compared to the reference Model B, especially at a relatively low air humidity, therefore, Model A may be more useful in practice. It is noteworthy that the results described in this study can be referenced to design a prototype if the operating conditions in the practical application are similar to that in this study.
Author Contributions
Conceptualization, W.H. and Z.H.; formal analysis, Z.H.; investigation, P.Y.; writing—original draft preparation, P.Y.; writing—review and editing, S.L., M.Q. and C.Y. All authors have read and agreed to the published version of the manuscript.
Funding
This research was funded by Science and technology cooperation project of Qinghai Province, grant number 2017-HZ-807; Fundamental Research Funds for the Central Universities, grant number JZ2018HGBZ0121; Natural Science Foundation of Anhui Province, grant number JZ2019AKZR024; Beijing advanced innovation center for future urban design, grant number UDC2016040200” and “The APC was funded by Science and technology cooperation project of Qinghai Province.
Conflicts of Interest
The authors declare no conflict of interest. And The funders had no role in the design of the study; in the collection, analyses, or interpretation of data; in the writing of the manuscript, or in the decision to publish the results.
Nomenclature
| A | area, m2 |
| d | specific humidity, kg/kg dry air |
| D | width of adjacent two fins, m |
| D | thickness, m |
| H | height of fins, m |
| L | length, m |
| m | air flow rate, m3/h |
| n | numbers of P–N junctions |
| p | air pressure, pa |
| T | temperature, °C |
| TEC | thermoelectric cooling |
| V | air volume, m3 |
| W | width, m |
| Subscripts | |
| a | air channel |
| f | fin |
| i | air inlet |
| g | glazing cover |
| r | radiation heat transfer |
| s | water vapor partial pressure |
| tec | thermal electric cooler |
| o | air outlet |
| v | water vapor |
| w | water |
References
- Scott, C.; Sugg, Z. Global energy development and climate-induced water scarcity—Physical limits, sectoral constraints, and policy imperatives. Energies 2015, 8, 8211–8225. [Google Scholar] [CrossRef]
- Mekonnen, M.M.; Hoekstra, A.Y. Four billion people facing severe water scarcity. Sci. Adv. 2016, 2, e1500323. [Google Scholar] [CrossRef]
- Wang, S.; Wang, S. Implications of improving energy efficiency for water resources. Energy 2017, 140, 922–928. [Google Scholar] [CrossRef]
- Narayan, G.P.; Sharqawy, M.H.; Summers, E.K.; Lienhard, J.H.; Zubair, S.M.; Antar, M.A. The potential of solar-driven humidification-dehumidification desalination for small-scale decentralized water production. Renew. Sustain. Energy Rev. 2010, 14, 1187–1201. [Google Scholar] [CrossRef]
- Zhao, D.; Tan, G. A review of thermoelectric cooling: Materials, modeling and applications. Appl. Therm. Eng. 2014, 66, 15–24. [Google Scholar] [CrossRef]
- Goosen, M.; Mahmoudi, H.; Ghaffour, N. Water desalination using geothermal energy. Energies 2010, 3, 1423–1442. [Google Scholar] [CrossRef]
- Jun, Y.J.; Song, Y.H.; Park, K.S. A Study on the Prediction of the Optimum Performance of a Small-Scale Desalination System Using Solar Heat Energy. Energies 2017, 10, 1274. [Google Scholar] [CrossRef]
- Milani, D.; Qadir, A.; Vassallo, A.; Chiesa, M.; Abbas, A. Experimentally validated model for atmospheric water generation using a solar assisted desiccant dehumidification system. Energy Build. 2014, 77, 236–246. [Google Scholar] [CrossRef]
- Lv, S.; He, W.; Wang, L.; Li, G.; Ji, J.; Chen, H.; Zhang, G. Design, fabrication and feasibility analysis of a thermo-electric wearable helmet. Appl. Therm. Eng. 2016, 109, 138–146. [Google Scholar] [CrossRef]
- Vasant, P.; Kose, U.; Watada, J. Metaheuristic Techniques in Enhancing the Efficiency and Performance of Thermo-Electric Cooling Devices. Energies 2017, 10, 50. [Google Scholar] [CrossRef]
- Liu, Y.; Su, Y. Experimental investigations on COPs of thermoelectric module frosting systems with various hot side cooling methods. Appl. Therm. Eng. 2018, 144, 747–756. [Google Scholar] [CrossRef]
- Sajid, M.; Hassan, I.; Rahman, A. An overview of cooling of thermoelectric devices. Renew. Sustain. Energy Rev. 2017, 78, 15–22. [Google Scholar] [CrossRef]
- Cheng, Y.H.; Lin, W.K. Geometric optimization of thermoelectric coolers in a confined volume using genetic algorithms. Appl. Therm. Eng. 2005, 25, 2983–2997. [Google Scholar] [CrossRef]
- Chowdhury, I.; Prasher, R.; Lofgreen, K.; Chrysler, G.; Narasimhan, S.; Mahajan, R.; Koester, D.; Alley, R.; Venkatasubramanian, R. On-chip cooling by superlattice-based thin-film thermoelectrics. Nat. Nanotechnol. 2009, 4, 235–238. [Google Scholar] [CrossRef] [PubMed]
- Russel, M.; Ewing, D.; Ching, C. Characterization of a thermoelectric cooler based thermal management system under different operating conditions. Appl. Therm. Eng. 2013, 50, 652–659. [Google Scholar] [CrossRef]
- Udomsakdigool, C.; Hirunlabh, J.; Khedari, J.; Zeghmati, B. Design Optimization of a New Hot Heat Sink with a Rectangular Fin Array for Thermoelectric Dehumidifiers. Heat Transf. Eng. 2007, 28, 645–655. [Google Scholar] [CrossRef]
- Astrain, D.; Vián, J.G.; Domínguez, M. Increase of COP in the thermoelectric refrigeration by the optimization of heat dissipation. Appl. Therm. Eng. 2003, 23, 2183–2200. [Google Scholar] [CrossRef]
- Chein, R.; Huang, G. Thermoelectric cooler application in electronic cooling. Appl. Therm. Eng. 2004, 24, 2207–2217. [Google Scholar] [CrossRef]
- Milani, D.; Abbas, A.; Vassallo, A.; Chiesa, M.; Al Bakri, D. Evaluation of using thermoelectric coolers in a dehumidification system to generate freshwater from ambient air. Chem. Eng. Sci. 2011, 66, 2491–2501. [Google Scholar] [CrossRef]
- Vián, J.G.; Astrain, D.; Domınguez, M. Numerical modelling and a design of a thermoelectric dehumidifier. Appl. Therm. Eng. 2002, 22, 407–422. [Google Scholar] [CrossRef]
- Tan, F.; Fok, S. Experimental testing and evaluation of parameters on the extraction of water from air using thermoelectric coolers. J. Test. Eval. 2012, 41, 1–8. [Google Scholar] [CrossRef]
- Suryaningsih, S.; Nurhilal, O.; Joni, I.M.; Panatarani, C. Optimal Design of An Atmospheric Water Generator (AWG) Based on Thermo-Electric Cooler (TEC) for Drought in Rural Area. In AIP Conference Proceedings; AIP Publishing: Melville, NY, USA, 2016; p. 030009. [Google Scholar]
- Joshi, V.; Joshi, V.; Kothari, H.; Mahajan, M.; Chaudhari, M.; Sant, K. Experimental Investigations on a Portable Fresh Water Generator Using a Thermoelectric Cooler. Energy Procedia 2017, 109, 161–166. [Google Scholar] [CrossRef]
- Bortolini, M.; Gamberi, M.; Graziani, A.; Persona, A.; Pilati, F.; Regattieri, A. Air flow optimization for drinking water production through air dehumidification. In Progress in Clean Energy, Volume 1; Springer: Berlin/Heidelberg, Germany, 2015; pp. 259–280. [Google Scholar]
- Smitha, S.; Shajesh, P.; Mukundan, P.; Nair, T.D.R.; Warrier, K.G.K. Synthesis of biocompatible hydrophobic silica-gelatin nano-hybrid by sol-gel process. Colloids Surf. B Biointerfaces 2007, 55, 38–43. [Google Scholar] [CrossRef] [PubMed]
- Weidao Shen, J.T. EngineeringThermodynamics; Higher Education Press: Beijing, China, 2007. [Google Scholar]
- Chai, S.; Sun, X.; Zhao, Y.; Dai, Y. Experimental investigation on a fresh air dehumidification system using heat pump with desiccant coated heat exchanger. Energy 2019, 171, 306–314. [Google Scholar] [CrossRef]


© 2019 by the authors. Licensee MDPI, Basel, Switzerland. This article is an open access article distributed under the terms and conditions of the Creative Commons Attribution (CC BY) license (http://creativecommons.org/licenses/by/4.0/).