Abstract
Thermoelectric (TE) material is a class of materials that can convert heat to electrical energy directly in a solid-state-device without any moving parts and that is environmentally friendly. The study and development of TE materials have grown quickly in the past decade. However, their development goes slowly by the lack of cheap TE materials with high Seebeck coefficient and good electrical conductivity. Carbon nanotubes (CNTs) are particularly attractive as TE materials because of at least three reasons: (1) CNTs possess various band gaps depending on their structure, (2) CNTs represent unique one-dimensional carbon materials which naturally satisfies the conditions of quantum confinement effect to enhance the TE efficiency and (3) CNTs provide us with a platform for developing lightweight and flexible TE devices due to their mechanical properties. The TE power factor is reported to reach 700–1000 μ for both p-type and n-type CNTs when purified to contain only doped semiconducting CNT species. Therefore, CNTs are promising for a variety of TE applications in which the heat source is unlimited, such as waste heat or solar heat although their figure of merit is still modest (0.05 at 300 K). In this paper, we review in detail from the basic concept of TE field to the fundamental TE properties of CNTs, as well as their applications. Furthermore, the strategies are discussed to improve the TE properties of CNTs. Finally, we give our perspectives on the tremendous potential of CNTs-based TE materials and composites.
1. Introduction
According to a report by Lawrence Livermore National Laboratory [1], it is said that only about 1/3 of the world primary energy consumption (oil, coal, gas, etc.) is effectively utilized, while most of the remainder is lost as waste heat. A solid-state thermoelectric (TE) device, which converts waste heat directly to electrical energy by utilizing the Seebeck effect, is expected as a solution for this problem [2]. However, TE device has still not achieved widespread-practical applications [3] due to two main reasons: (1) TE performance of existing TE materials is not good enough and (2) commercial TE materials are based on the scarce and/or toxic elements. In order to solve these issues, many strategies have been proposed in recent years.
To understand the possible strategies for improving the TE performance, we need to control the basic parameters in thermoelectrics. The TE performance is determined by how much the electricity can be obtained for a given input heat. Power factor (PF) and figure-of-merit , which depend on the Seebeck coefficient S, electrical conductivity and thermal conductivity for of the materials, are usually considered for assessing the performance of the TE materials [2,4]. If the source of heat is “free”, such as waste-heat recovery from cars and solar heat, a maximum PF corresponds to the minimum cost of generating power. On the other hand, in the case that heat source is costly such as fossil fuel combustion, the cost of generating power is reduced by a large value [5,6,7].
The fundamental problem of physics that has hindered the search for TE materials is a conventional trade-off relationship between S and [8]. In addition, the situation in which electricity (heat) is well (poorly) conducted is paradoxical due to the Wiedemann-Franz law [8] for metal. In 1993, Hicks and Dresselhaus published two theoretical papers [9,10] to overcome the trade-off relationship between S and by using low-dimensional materials. In the one-dimensional (1D) or two-dimensional (2D) materials, the density of states (DOS) per unit volume is enhanced at bottom (or top) of the valence (or conduction) band, which would lead to increase the power factor, , over the bulk (3D) values. However, some previous experiments showed that the PF is not always enhanced with reducing the dimensional size of materials [11,12]. Hung et al. [13,14] have proposed a theory suggesting that the discrepancy between theory and exceptions in experiments comes from a competition between the confinement length L (i.e., diameter or thickness of the 1D or 2D materials) and the thermal de Broglie wavelength . They showed that the PF is only enhanced when . This condition gives a challenge for experimentalists to obtain the enhancement PF of the 1D materials, while the L values of many 2D materials such as InSe [15], GaN [16] and SrTiO [17,18] are early reduced to satisfy . For 1D nanowires, their diameters can be reduced to several tens of nanometers, but most of them are still much larger than their thermal de Broglie wavelengths, which are about few nanometers [13]. Carbon nanotubes (CNTs), on the other hand, with a wide range of diameters (0.4∼40 nm) [19], are reasonable candidates for 1D TE materials that can satisfy the condition .
Other challenge in TE materials is to find a good TE material with low cost, nontoxic and natural abundance. The commercial TE materials are PbTe or BiTe and their alloys which has a property of 0.5–1 and 1500–4500 μ at room temperature [20,21]. The scarcity of Te and the toxicity of Pb make newly emerging organic materials such as polymers as promising TE materials that do not contain these elements, despite their lower efficiencies. Due to their intrinsic low thermal conductivity (∼1.5 ), a semiconducting polymer showed decent ZT values about 0.1–0.42 at room temperature, while the PF (∼78–500 μ) is much smaller than that of BiTe [22,23,24]. Individual CNTs are not so promising as a TE material with high ZT values because of their intrinsic high thermal conductivity (∼2000–3000 ) [25]. However, by controlling of the doping level of the semiconducting CNT, their PF can reach 700–1000 μ [26,27]. The higher PF of CNTs compared with the polymer makes that CNTs can apply for a variety of TE applications, in which the heat source is unlimited such as waste heat or solar heat. Furthermore, like the polymers, the CNTs can allow a low cost manufacturing method [28], which can reduce the total cost of the TE device.
In this review, we focus to explain fundamental TE properties of CNTs, in particular the semiconducting single-wall carbon nanotubes (s-SWNTs). Because many experimentalists are working on CNTs but not all are working with thermoelectrics, the backgrounds about the basic parameters of CNTs and the performance metric of CNTs-based TE materials and devices might be useful. Thus, we will discuss how diameter, electronic structure, doping level and temperature influence the TE properties of CNTs. After discussing the TE properties from a theoretical point of view, a series of recent experimental results is reviewed, where we show the potential to enable flexible, lightweight and low-cost TE devices. Finally, we give our perspectives on the the strategies to improve the TE properties of CNTs and the niche applications for CNT-based TEs as sensors, solar TE conversion, or bio-devices.
2. Basic Parameters for Thermoelectric Materials
In this section, we review important factors in thermoelectrics that are useful to evaluate the TE performance of CNTs. First, we examine a fundamental effect in thermoelectrics, the so-called Seebeck effect. Then, we show two general parameters for TE performance assessment, namely the power factor PF and the figure-of-merit . The reason why we choose the 1D CNT as a TE material will also be discussed in the final part of this section.
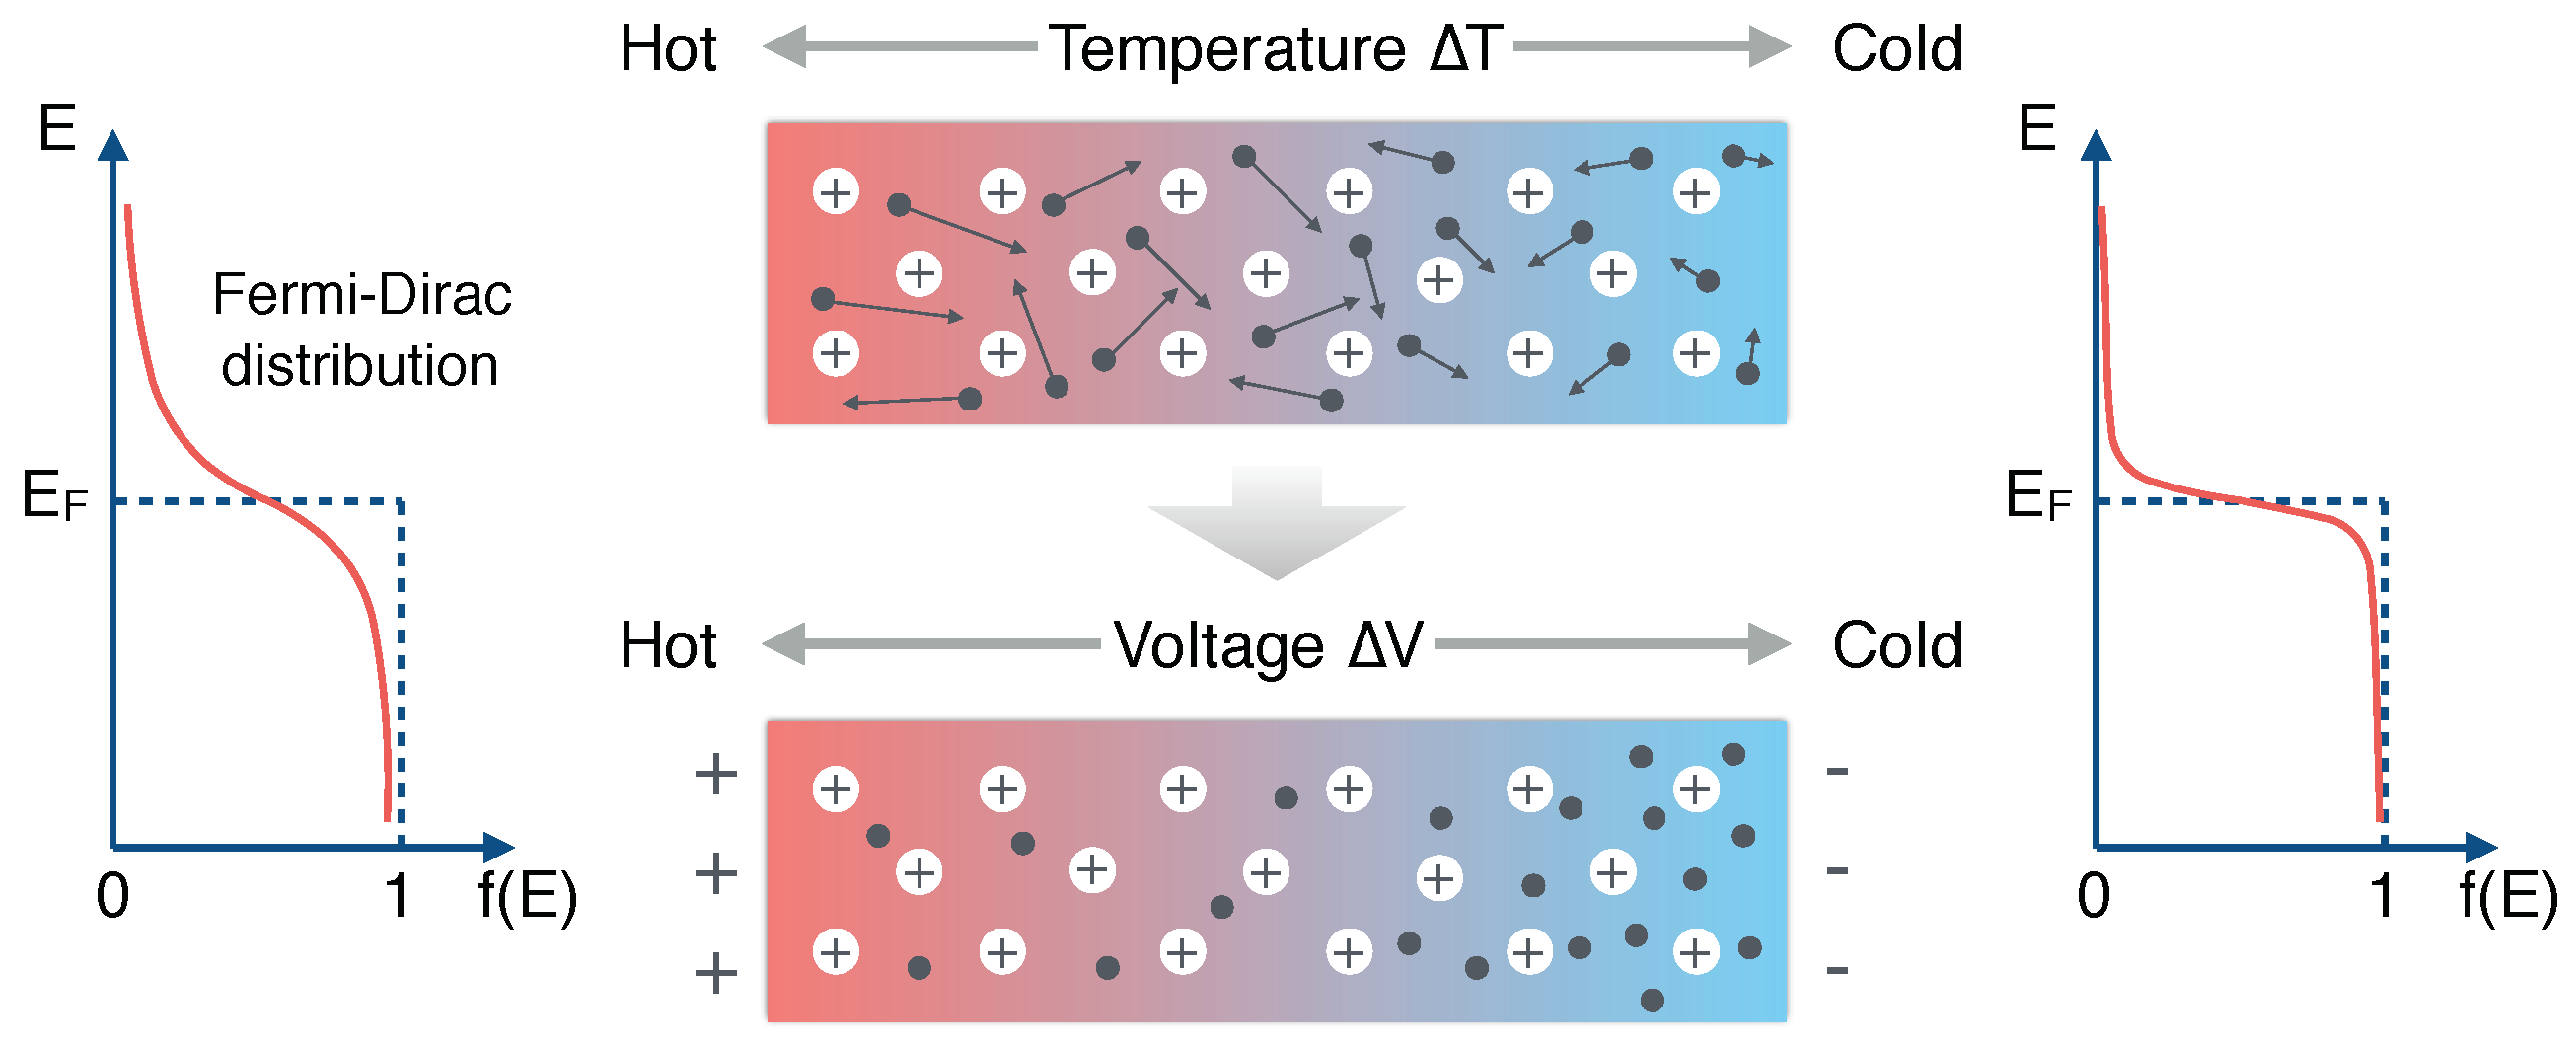
2.1. Seebeck’s Effect
In 1821, Thomas J. Seebeck, a German physicist made an important observation related to thermoelectrics. Connecting a bismuth wire to an antimony wire, he found a voltage generated between two free ends of a pair of wires by heating the junction region between the two wires. This was the first TE device and the phenomenon is known as Seebeck’s effect, in which the Seebeck coefficient (or thermopower), S, is defined by how much the voltage, , can be obtained from an applied temperature difference, . The expression for the Seebeck coefficient is
with the units V/K (volts per kelvin) in the SI unit.
One can understand the origin of the Seebeck effect from the illustration shown in Figure 1. Let us consider a material, in which one side is touched to a cold source while the other side to a hot source. There is a large distribution of electrons above the Fermi energy at the hot region according to Fermi-Dirac’s distribution function (Figure 1 left), while there is small distribution of electrons above at the cold region (Figure 1 right). In addition, the carriers have the higher kinetic energy (KE) at the hot region because the average KE value is about for an ideal gas, where is the Boltzmann constant and T is the absolute temperature. From this fact, carriers in the hot region are more agile than those at the cold region. As a result, the carriers (either electrons above or holes below ) will diffuse from the hot region to the cold region, which may generate in the material. However, if the electrons and holes move in the same direction, we do not get a net electronic current because they will cancel charges each other. Thus a useful TE device should consists of p-type and n-type semiconductors. Since CNTs allow us to have both p-type and n-type semiconductors [27,29,30], a TE device with a single chirality CNT [31] used for both legs is feasible.
Figure 1.
Illustration of the Seebeck effect. By moving electron from left to right, voltage appears.
2.2. Power Factor PF and Figure of Merit ZT
Performance metrics of a TE device should be evaluated at maximum power and/or maximum efficiency. For maximizing the output power, it is required that one has to optimize the electrical power density Q in , which is defined as [6]
where PF is the power factor that is defined by in , h in m is the leg length of TE devices, (in K) is the temperature of the cold region and (in K) is the temperature of the hot region. A high Q value requires a high PF value because the term is given by the boundary condition.
The maximum efficiency of the TE device, on the other hand, is determined by the Carnot efficiency as follows [2]:
where is the dimensionless figure-of-merit of the material and is given by [2]
where is the thermal conductivity and is the average temperature. Equation (3) shows that a larger leads to a higher efficiency. To achieve the large ZT values, both low and high PF are required for a given . An efficient way to reduce is using the low-dimensional structures, in which the is dominated by phonon heat transport. For example, two independent studies [11,12] reported that Si nanowires have the values below the theoretical limit of bulk Si (0.99 W/mK). Therefore, at room temperature is obtained for a 1D silicon nanowire, which is much higher than bulk silicon () [11,12]. Another way to reduce is using the phonon glass system [32,33]. Glassy materials have a lower compared with crystalline materials because phonons are scattered in the amorphous structure with mean-free paths in atomic dimensions. The phonon-glass characteristic also can be found in a perfectly crystalline solid such as semiconducting clathrates [34] or filled skutterudites [32]. For example, the filled skutterudites with AgSbTe showed a glassy thermal conductivity W/mK at 300 K with the mean-free path about 3.2–6.5 nm [35,36,37]. Recently, Mukhopadhyay et al. [38] showed that TiVSe has ultralow W/mK at 300 K, in which the mean-free path is approaching the Ioffe-Regel limit (i.e., the average atomic distance in TiVSe). Because of the success in reducing , the next challenge of the TE is how to enhance the PF.
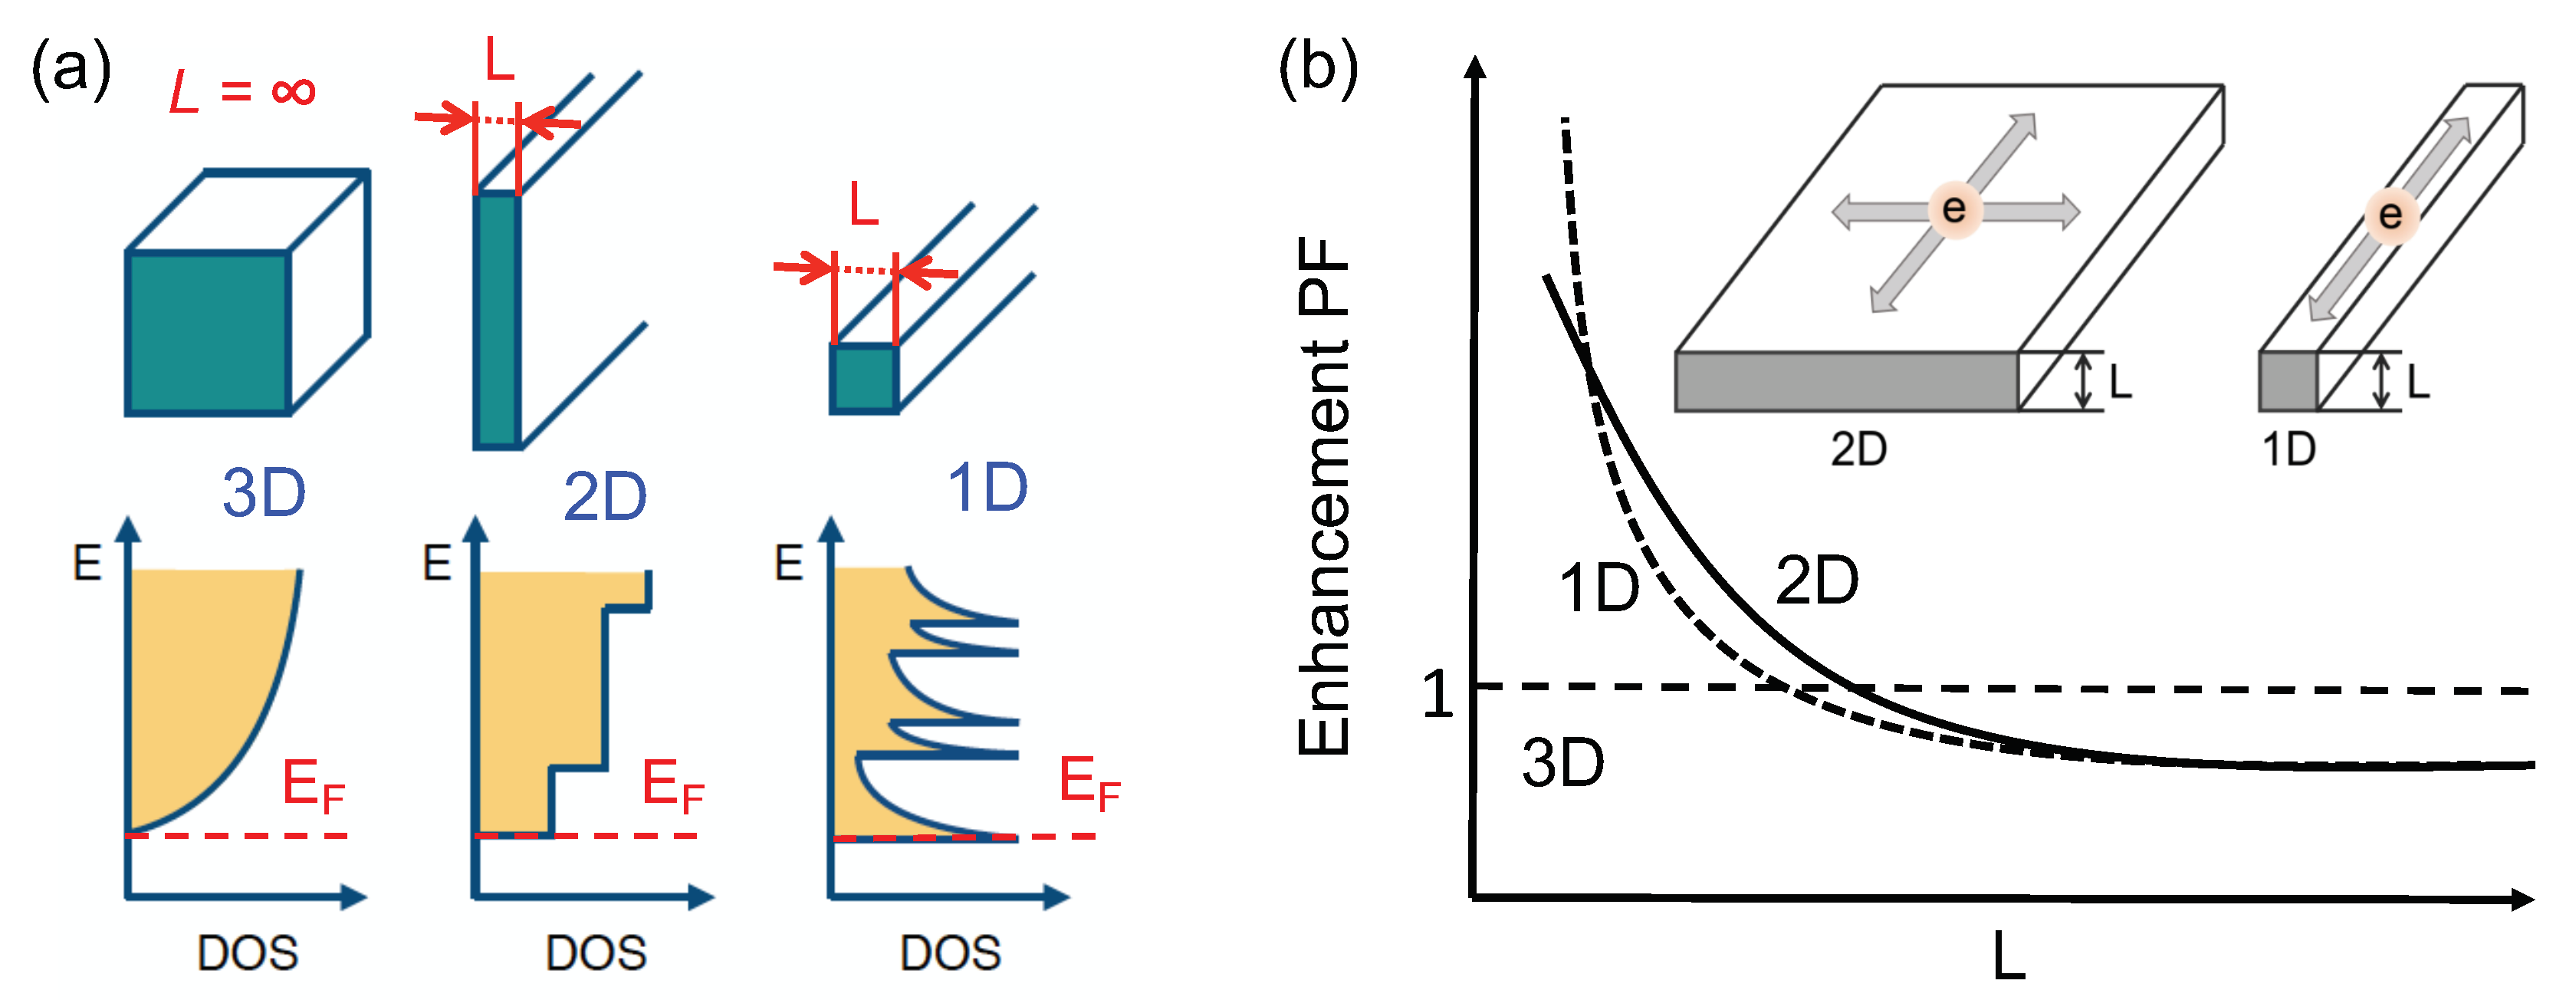
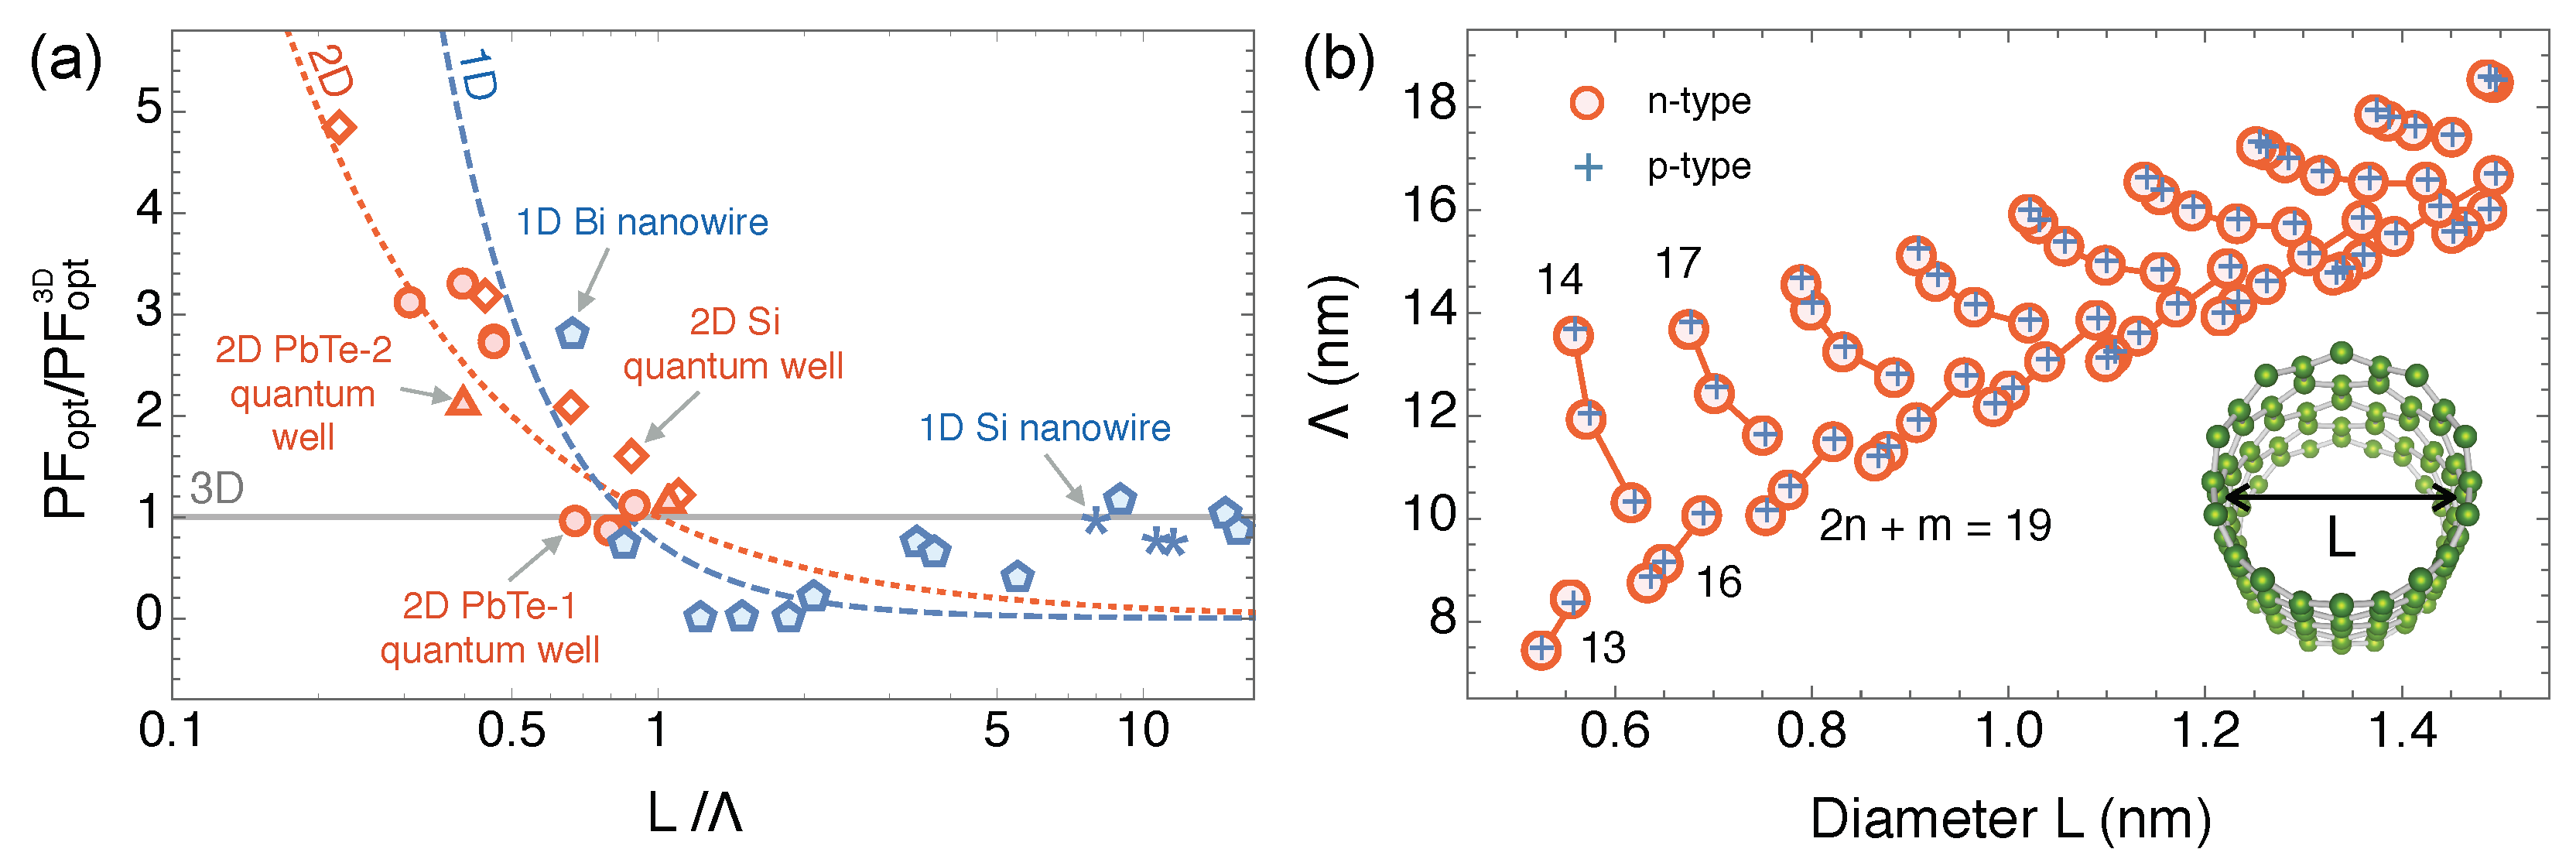
2.3. Low-Dimensional Thermoelectric Energy Conversion
A fundamental aspect in the PF is a trade-off relationship between S and [8]. In early 1990s, Hicks and Dresselhaus [9,10] pointed out that the low-dimensional (1D & 2D) materials provide a way to solve the trade-off relationship between S and based on the quantum mechanics. In low-dimensional materials, the motion of electrons is limited in certain direction, in other words, electrons are confined in a potential in infinitely tall walls. In this case, it is possible to change the DOS of systems as shown in Figure 2a when the dimension of the systems, L, reduces to nanometre scale and this is the so-called “the confinement effect”. The origin for the enhancement of the PF comes from the improved energy-dependent electrical conductivity due to the enhanced DOS at the Fermi energy at the bottom (or top) of conduction (or valence) band (see Figure 2a). According to the Drude model, can be expressed by , where q, m and are the unit charge, the effective mass and the relaxation time of carrier, respectively, and is the carrier density, which is given as , where is the Fermi-Dirac distribution function and is the DOS per unit volume and per unit energy. For 1D and 2D materials, is inversely proportional to and L, respectively. Therefore, the is inversely proportional to and L for the 1D and 2D materials, respectively, as shown in Figure 2b. This prediction has made a lot of progresses on low-dimensional nanostructure and their applications in thermoelectrics [39,40,41,42,43]. However, they also noticed that some common materials such as Si nanowires did not show enhancement of the PF although their confinement length L is sufficiently small (∼50 nm) [11,12]. By re-evaluating the Hick-Dresselhaus theory, we show that the discrepancy between theory and experiments comes from an interplay between L and the thermal de Broglie wavelength [13,14], in which is defined by
where ℏ is the Planck constant.
Figure 2.
(a) Electronic density of states for a bulk (3D), two-dimensional (2D) and one-dimensional (1D) materials. (b) Enhancement power factor PF is potted as a function of confinement length L for low-dimensional materials.
In Figure 3a, we show the optimized power factor, , as a function of the ratio for the 1D, 2D and 3D materials. The values are scaled by the of a 3D material (). The enhancement factor () is inversely proportional to and for the 1D and 2D materials, respectively [13,14]. By considering , theoretical prediction is consistent with most of the experimental results as show by symbols in Figure 3a. Furthermore, recent experimental data of the 2D materials such as InSe [15] and GaN [18] showed that the PF is enhanced about several times compared with bulk case when the condition is satisfied. However, this condition make a challenge for experimentalists to obtain the enhancement PF of the 1D materials since reducing the diameter of the 1D materials to sub-10 nanometer is still challenging even for the current technology. In this sense, carbon nanotube (CNTs) with a wide range of natural diameters (0.4∼40 nm) [19] show a potential to achieve the enhancement PF. The diameter of CNTs can be well controlled by using the metallic nanoparticles to grow CNTs [44,45]. In Figure 3b, of semiconducting single wall carbon nanotubes (s-SWNTs) is plotted as a function of diameter L for nm [46]. It shows that is much larger than L. Thus, if s-SWNTs is well separated, single s-SWNTs with a small diameter should behave as a good TE material.
Figure 3.
(a) Enhancement of power factor PF scaled by that for 3D materials is plotted as a function of , where L and are the confinement length and the thermal de Broglie length, respectively. The lines and dots, respectively, denote theory and experiments for several materials. It is clear that enhancement PF occurs when (or ) for the 1D and 2D materials. Adapted with permission from Reference [13]. Copyright 2016, American Physical Society. (b) Thermal de Broglie wavelength of many s-SWNTs is plotted as a function of s-SWNT diameter L. Adapted with permission from Reference [46]. Copyright 2019, Springer Publishing.
3. Thermoelectric Properties of SWNTs
In Table 1 and Table 2, we list the observed TE properties of p-type and n-type SWNTs at room temperature including the Seebeck coefficient S, the electrical conductivity , the power factor PF, the thermal conductivity and the figure of merit . In general, the TE properties of CNTs are considered for SWNTs. Before 2014, most of the SWNTs samples contain only metallic SWNTs (m-SWNTs) or the SWNTs with both m- and s-SWNTs, in the measured Seebeeck coefficients reported in the range of for both p-type and n-type, respectively. These magnitude of the Seebeeck coefficients depend on the form of samples (bundles, individual or films), processing method, and dopants. In the case of m-SWNTs, the DOS suggests a low S since m-SWNTs have a nearly constant DOS around the Fermi energy, while semiconducting SWNTs (s-SWNTs) with a van Hove singularity near the Fermi energy can show a high S. These properties of m-SWNTs and s-SWNTs are observed by experiment for individual SWNTs [47], in which S values of m-SWNTs and s-SWNTs are 35 μ and 260 μ, respectively. Therefore, after 2014, most of the studies have focused on the TE properties of the purified s-SWNTs films. The TE power factors of s-SWNTs are reported over 1000 μ for both n-type and p-type at room temperature, which can compete with traditional telluride-based TE materials as BiTe and PbTe. In this section, we will focus to explain the TE properties of s-SWNT. First, we will show a brief electronic properties of SWNTs, which depends on a specific structure that determines the diameter of SWNTs. Then, the TE properties such as S, , PF and are given as a function of the diameter of SWNTs.
Table 1.
Thermoelectric properties of p-type single wall carbon nanotubes (SWNTs) at room temperature including the Seebeck coefficient S, the electrical conductivity , the power factor PF, the thermal conductivity and the figure of merit .
Table 2.
Thermoelectric properties of n-type single wall carbon nanotubes (SWNTs) at room temperature including the Seebeck coefficient S, the electrical conductivity , the power factor PF, the thermal conductivity and the figure of merit .
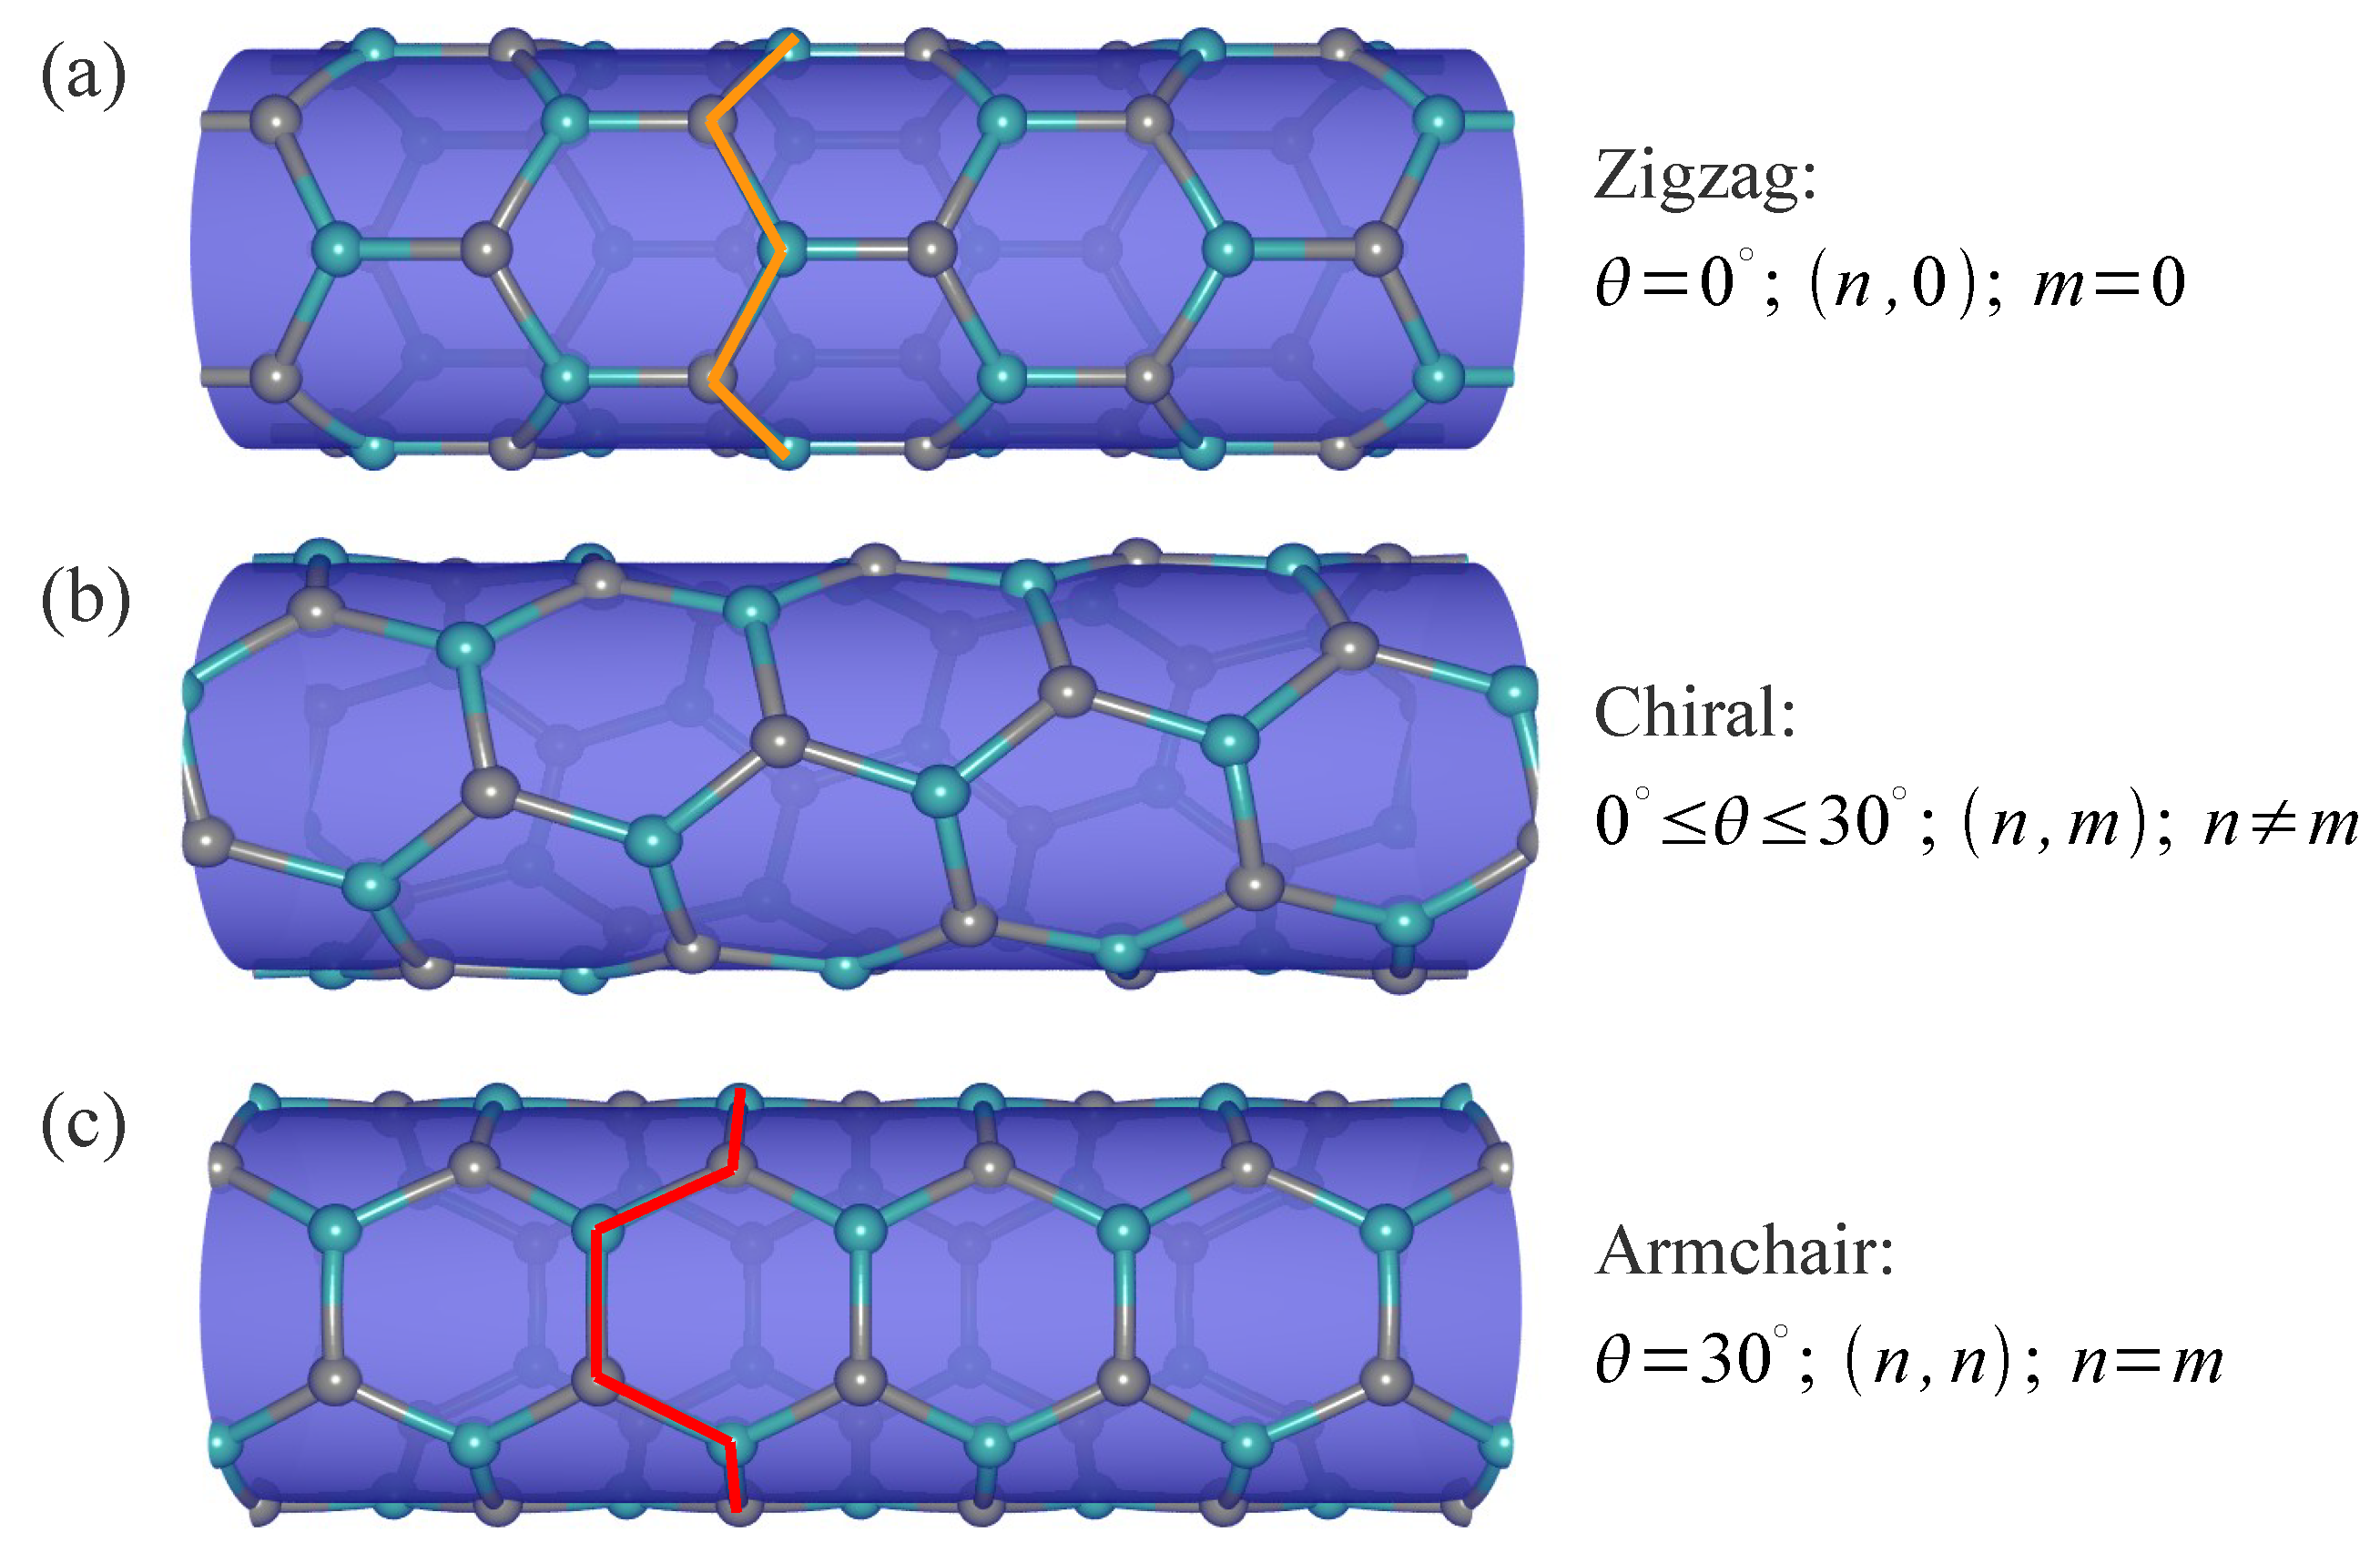
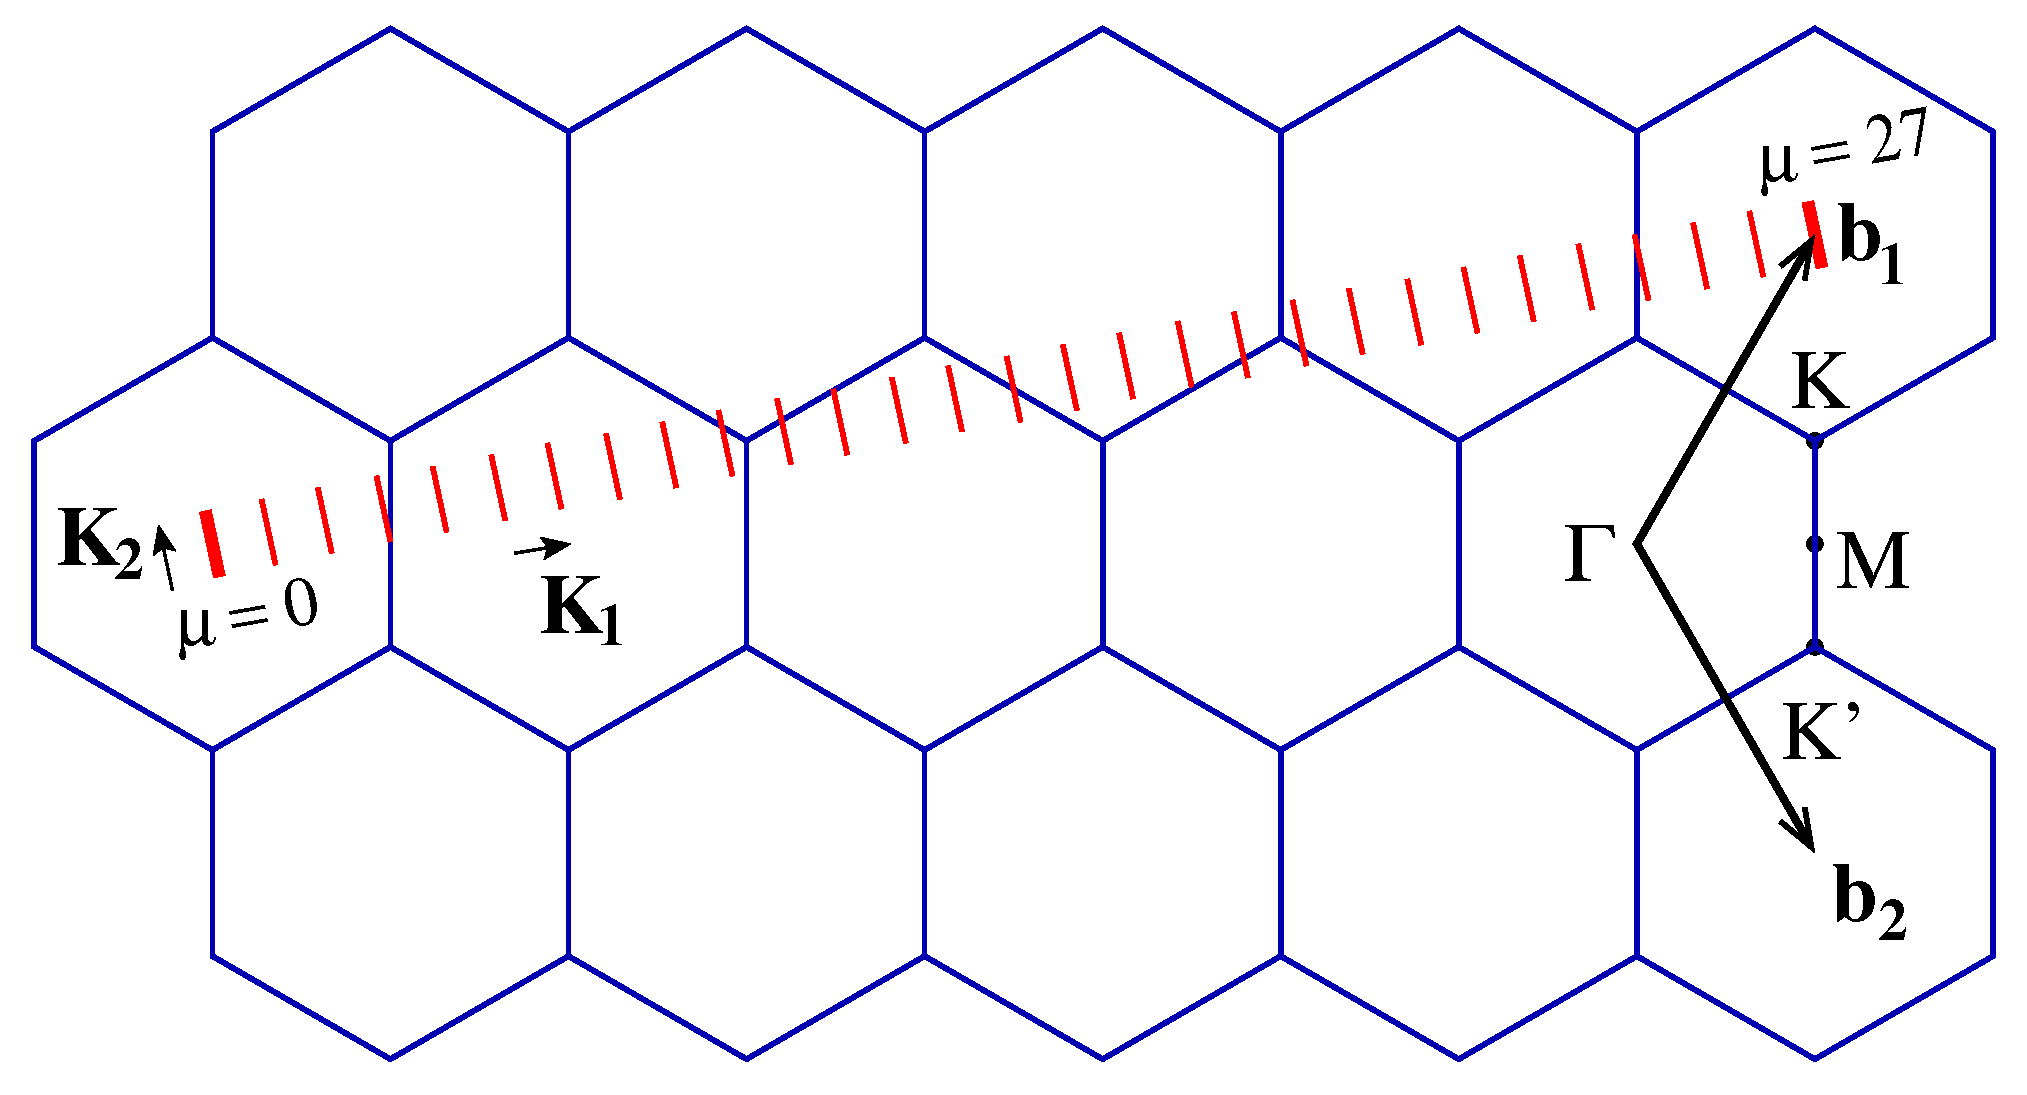
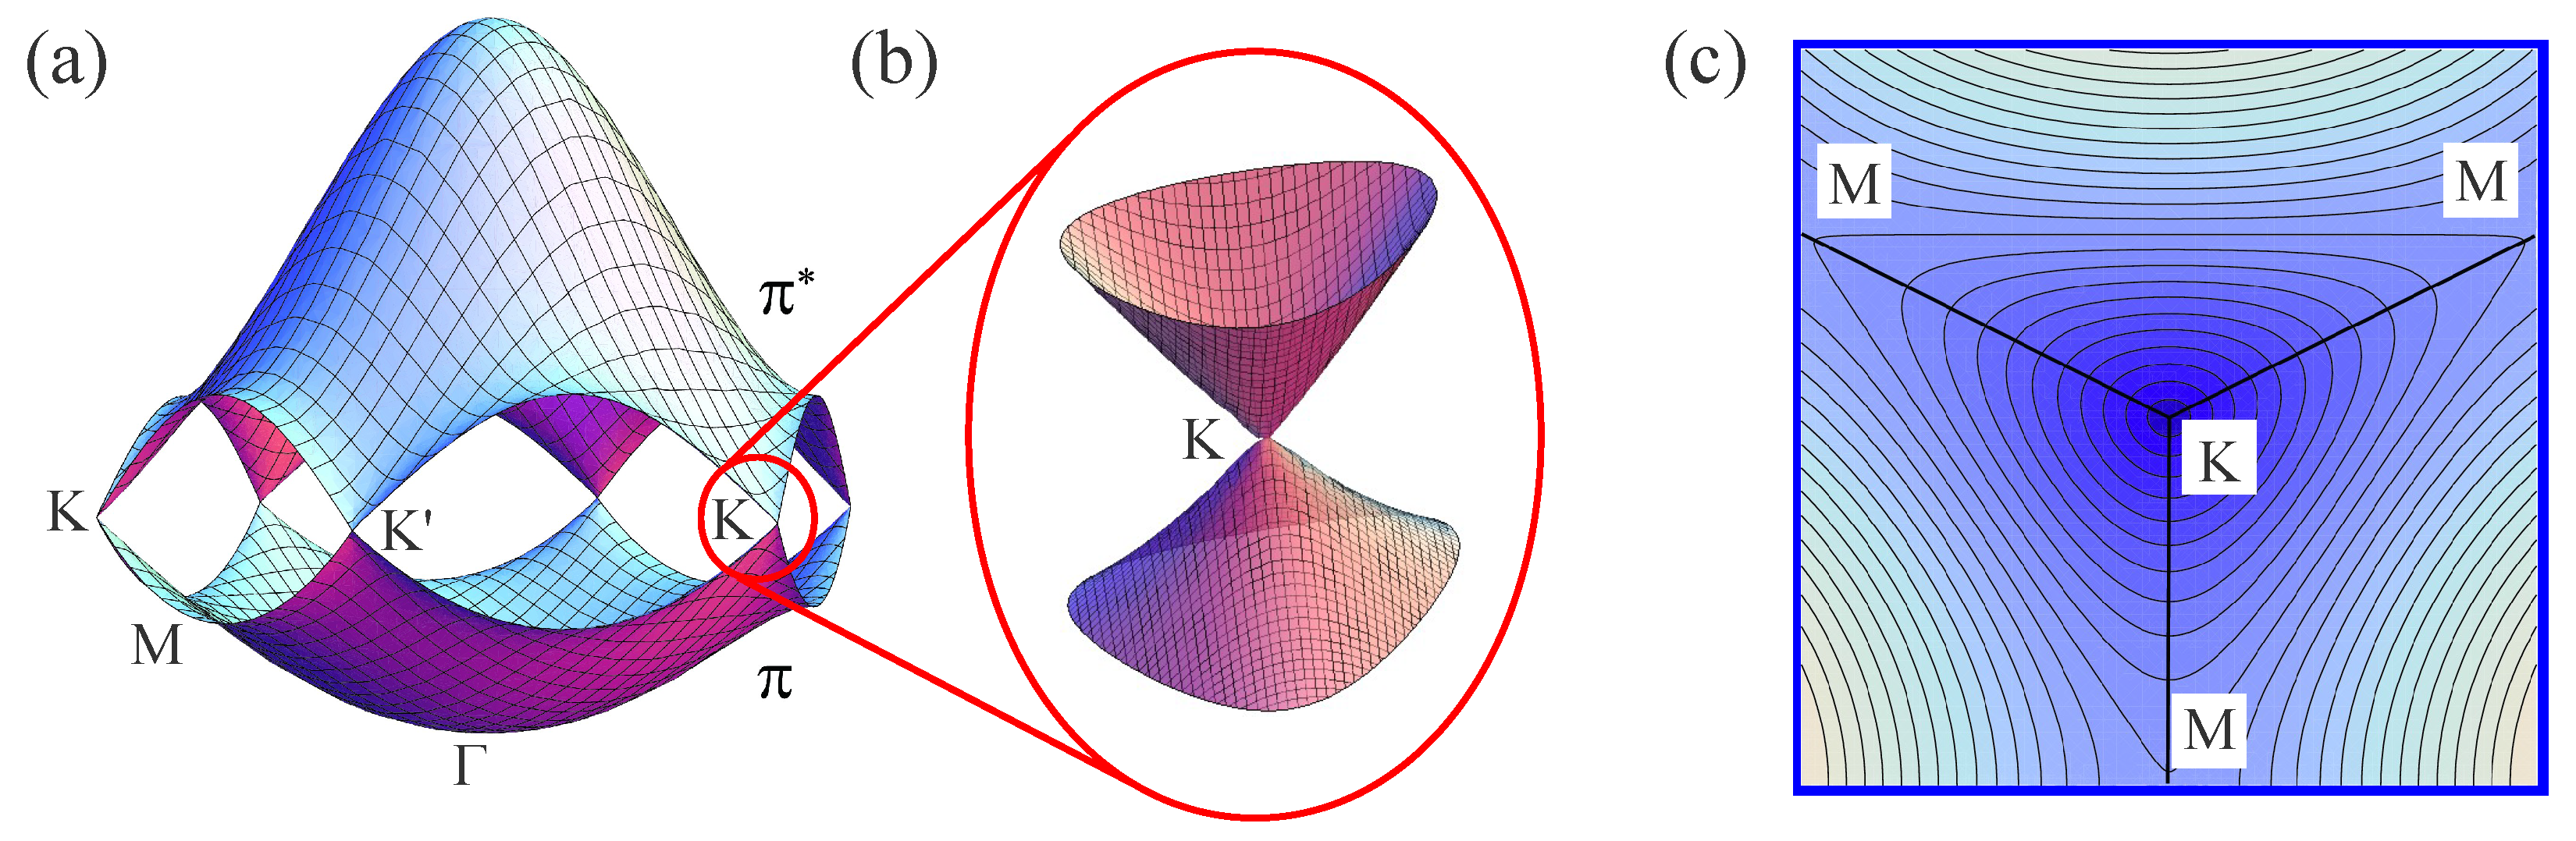
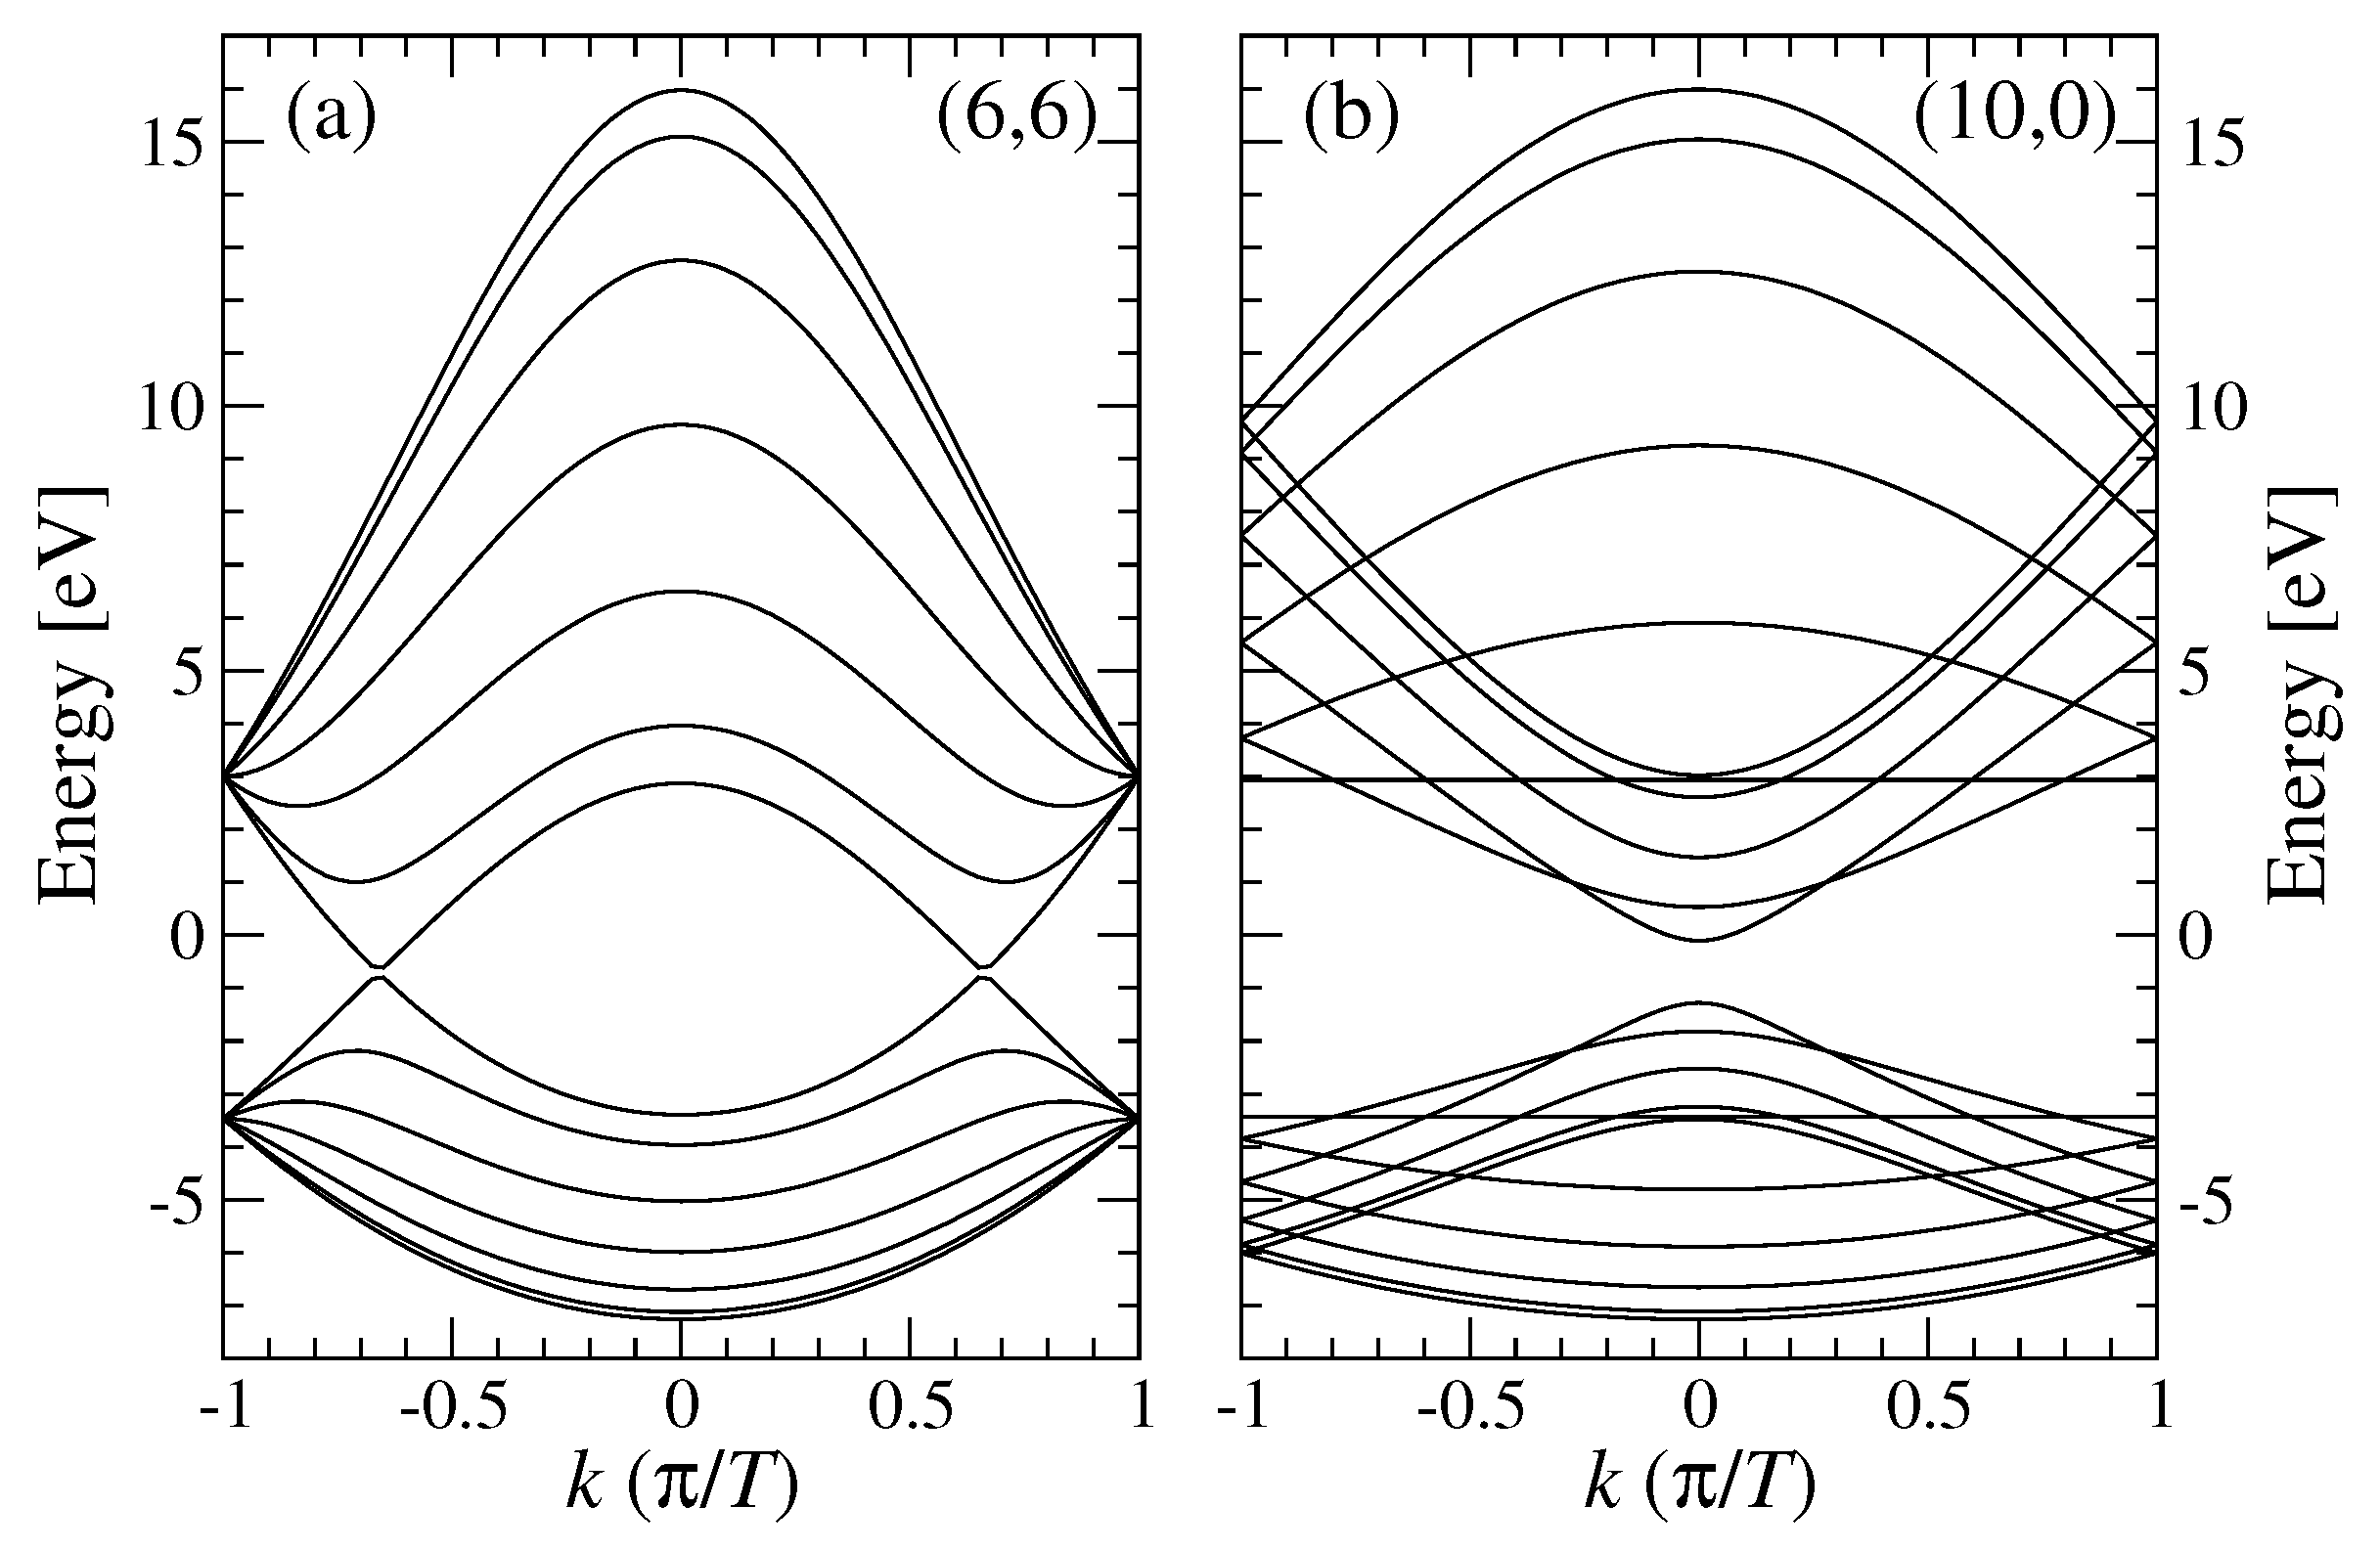
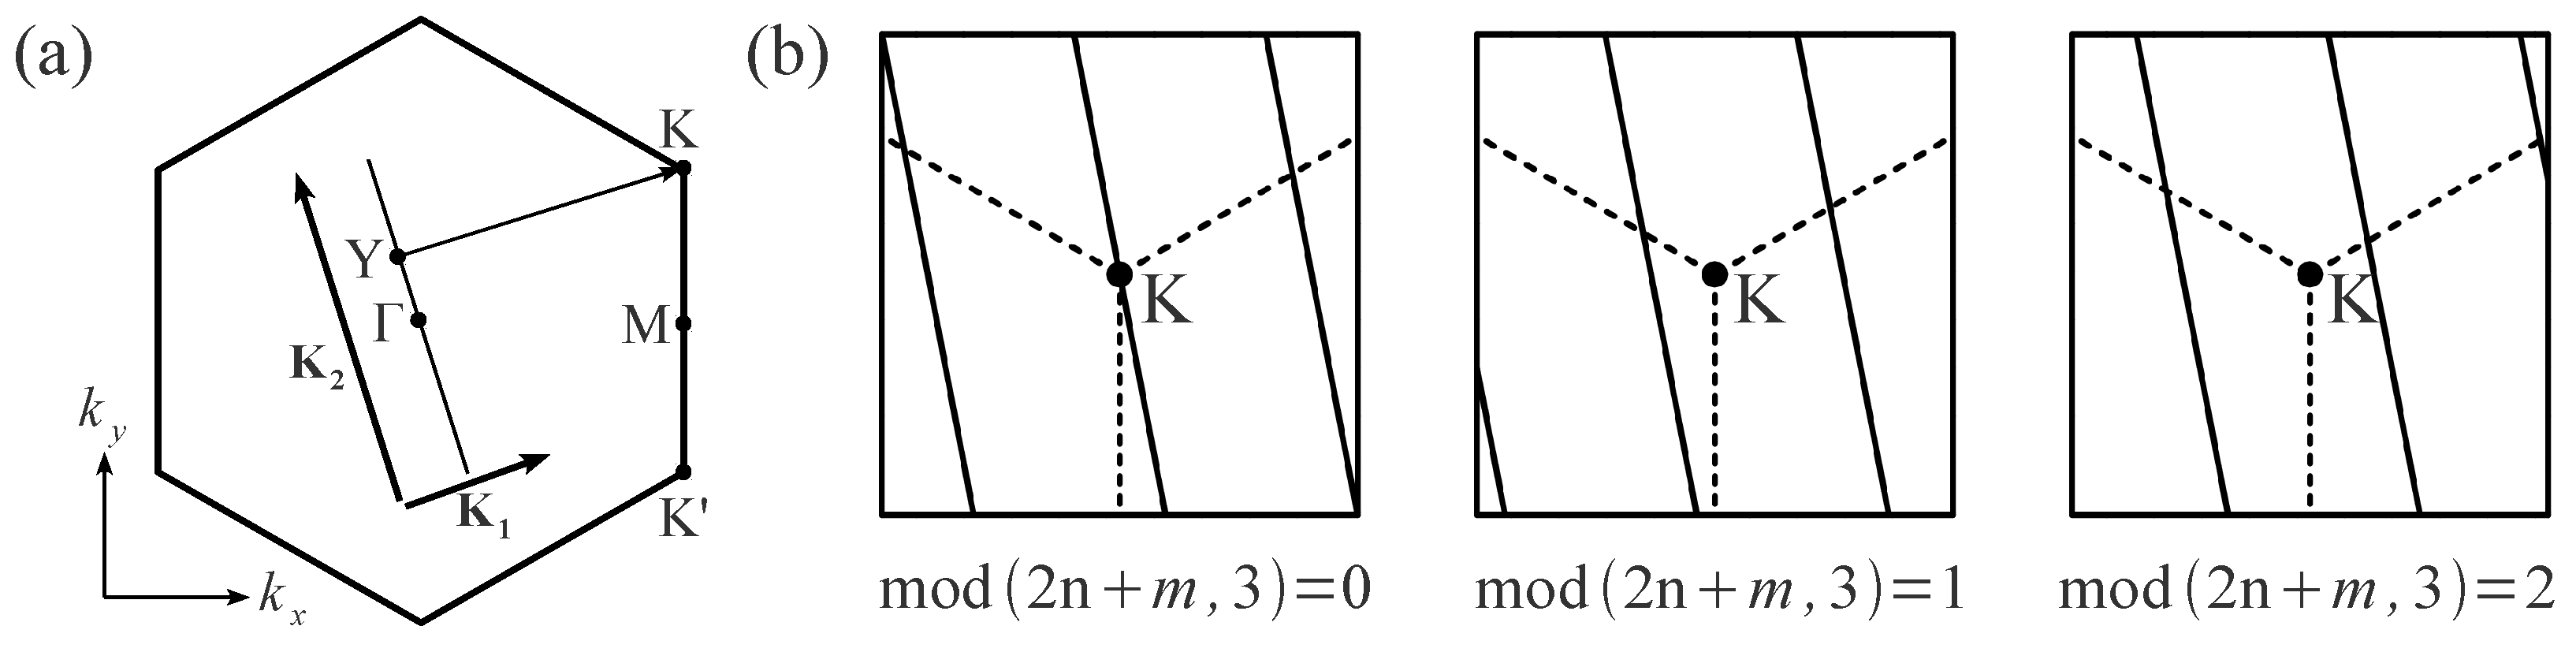
3.1. Electronic Properties of SWNTs
One can imagine a SWNT as a single sheet of graphene which is rolled up into a cylinder [19]. Graphene itself is a an atomic layer of carbon atoms arranged in a 2D honeycomb lattice. Since graphene is a building block of other graphitic materials in different dimensions, the electronic properties of SWNTs can be derived from those of graphene. First we start with the geometrical structure of the SWNT according to the graphene geometry. The SWNT circumference can be calculated from the chiral vector , which is written in terms of graphene’s lattice vectors and [19],
where is an integer pair requiring , and . The formulas for the circumferential length and diameter L are given by:
where . The chiral angle is defined as the angle between and with . One can classify the according to its value that follows a certain symmetry as shown in Figure 4, from which three types of SWNTs emerge: (a) zigzag, (b) chiral and (c) armchair SWNTs. Various geometries will give rich physical properties of SWNTs.
Figure 4.
Types of SWNTs according to their symmetry: (a) zigzag, (b) chiral, (c) armchair . From top to bottom, the chiral index is , , . Thick solid lines in (a) and (c) are to stress the definition of “zigzag” and “armchair” structures, respectively. Redrawn with different style by the authors adapting from Reference [62].
The 1D unit cell of a is expressed by and (a translational vector in the direction of tube axis [19]), while the corresponding vectors in reciprocal space are along the tube circumference and along the tube axis. Note that only is a 1D reciprocal lattice vector, while gives discrete wave vector values in the direction of . The formulas for and can be obtained from their relations with and :
It follows,
where and are graphene’s reciprocal lattice vectors. The vectors and are shown in Figure 5 for the . The 1D Brillouin zone (BZ) of the SWNT is then constructed by the line segments with length of . These lines are often referred to as the “cutting lines” [63]. Due to the presence of cutting lines, the wave vectors allowed in a are given by
where is the index of each cutting line and the 1D k value is within .
Figure 5.
Vectors and in reciprocal space and the BZ of a , which is represented by parallel cutting lines. Reproduced from the Ph.D. thesis of one of the authors [64].
Before showing the SWNT dispersion relation, we first show the electronic structure of graphene in Figure 6a. We can see that graphene exhibits linear energy dispersions around the and points in the 2D BZ of graphene [Figure 6b]. In Figure 6c, we show the contour of graphene’s energy dispersion near the point. We can see that the energy surface changes from circle to triangle by increasing distance from the point. This behavior is known as the trigonal warping effect [65], an important feature in the electronic structure of .
Figure 6.
Graphene’s energy dispersion in its first BZ. The energy dispersion is shown for the whole region of the 2D BZ in panel (a), while in panel (b) the energy dispersion is shown near the point. Panel (c) gives the contour plot of the dispersion around the point. Reproduced from the Ph.D. thesis of one of the authors [64].
In SWNTs, the allowed wave vectors around the circumference is quantized. Therefore, the energy dispersions can be obtained from the corresponding graphene’s energy dispersions along the cutting lines. When we superimpose the 1D cutting lines of a , that is, in Equation (11), on the 2D energy dispersion surface of graphene, we can obtain pairs of energy dispersions the :
where denotes 2D energy dispersion of the bonds of graphene.
For a specific , if a cutting line passes through the or point of the 2D BZ of graphene, where the valence and conduction bands touch each other, the 1D energy bands of the will have a zero gap, therefore, it is classified as a metallic SWNT. On the other hand, if the cutting line does not pass through the or point, the SWNT is semiconducting with a finite energy gap. Figure 7 shows two examples of the dispersion relations. In Figure 7a the armchair SWNT is metallic, while in Figure 7b, the zigzag SWNT is metallic,
Figure 7.
Examples of 1D dispersion relations for : (a) armchair SWNT with chirality , and (b) zigzag with chirality . There are no bandgaps can in the case (a), thus the is metallic, while the in (b) is semiconducting due to the appearance of a gap. Redrawn with different style by the authors adapting from Reference [62].
Beside their structure, we can further classify SWNTs based on their metallicity. To obtain this classification, let us first see Figure 8a. If we project the vector pointing toward the point onto the direction perpendicular to the cutting lines, that can be denoted by , we can find:
Figure 8.
(a) Condition for metallic energy bands is related to the ratio of the length of vector to that of . If the ratio is an integer, metallic energy bands are obtained [19]. (b) Three possible configurations of the cutting lines in the vicinity of the point depending on the value of . From left to right, the nanotube type is - (metallic), - (type-I semiconducting) and - (type-II semiconducting) , respectively. The solid lines represent the cutting lines and the dashed lines indicate the directions, which are the boundaries of the first BZ of the . Redrawn with different style by the authors adapting from Reference [62].
Note that, if is an integer, has an integer number of components, thus one of the cutting lines will pass through the point, giving rise to a metallic . On the other hand, if is not an integer, i.e, the remainder of the division is either 1 or 2, the point will lie at one third or two third of the spacing between two adjacent cutting lines near the point, thus giving rise to a semiconducting , as shown in Figure 8b. Therefore, three types of are obtained based on their metallicity. They are often referred to as -, - and -, which are given by the following conditions:
respectively. The - and - are also often written as type-I and type-II semiconducting .
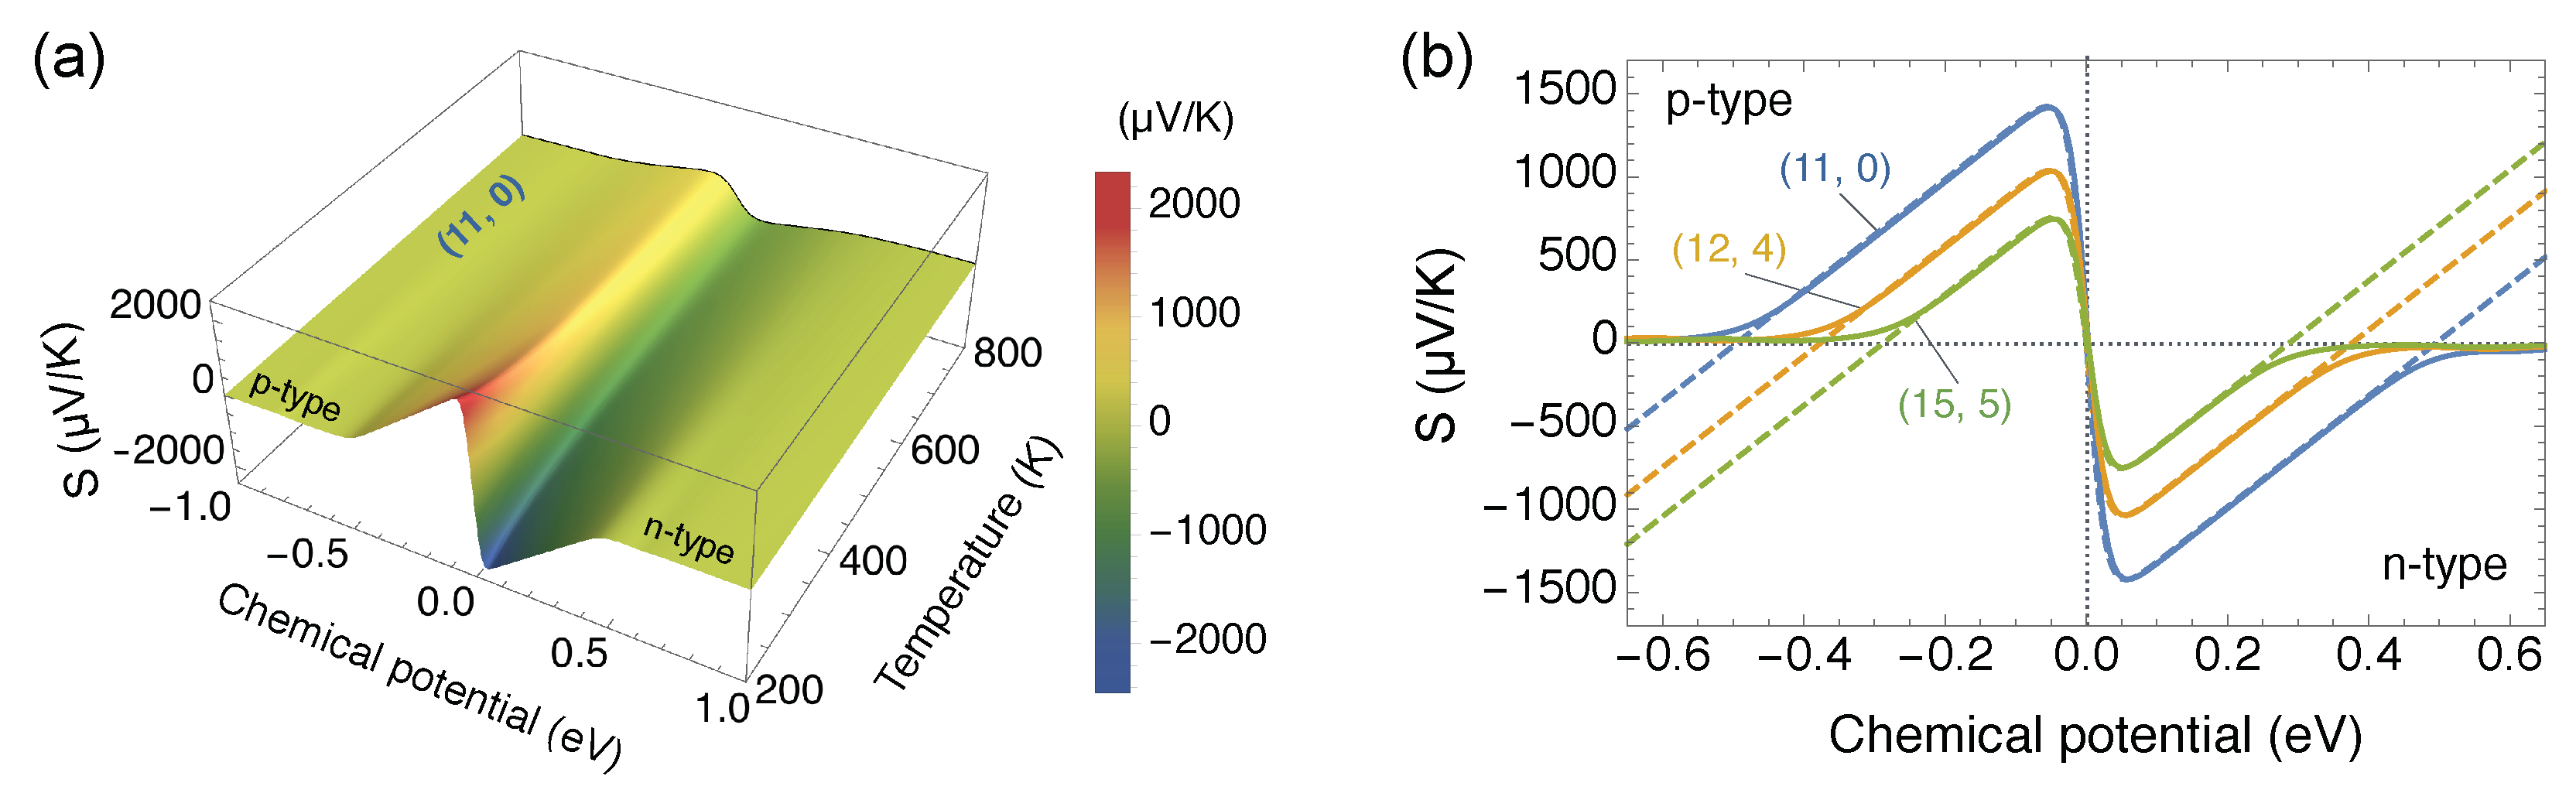
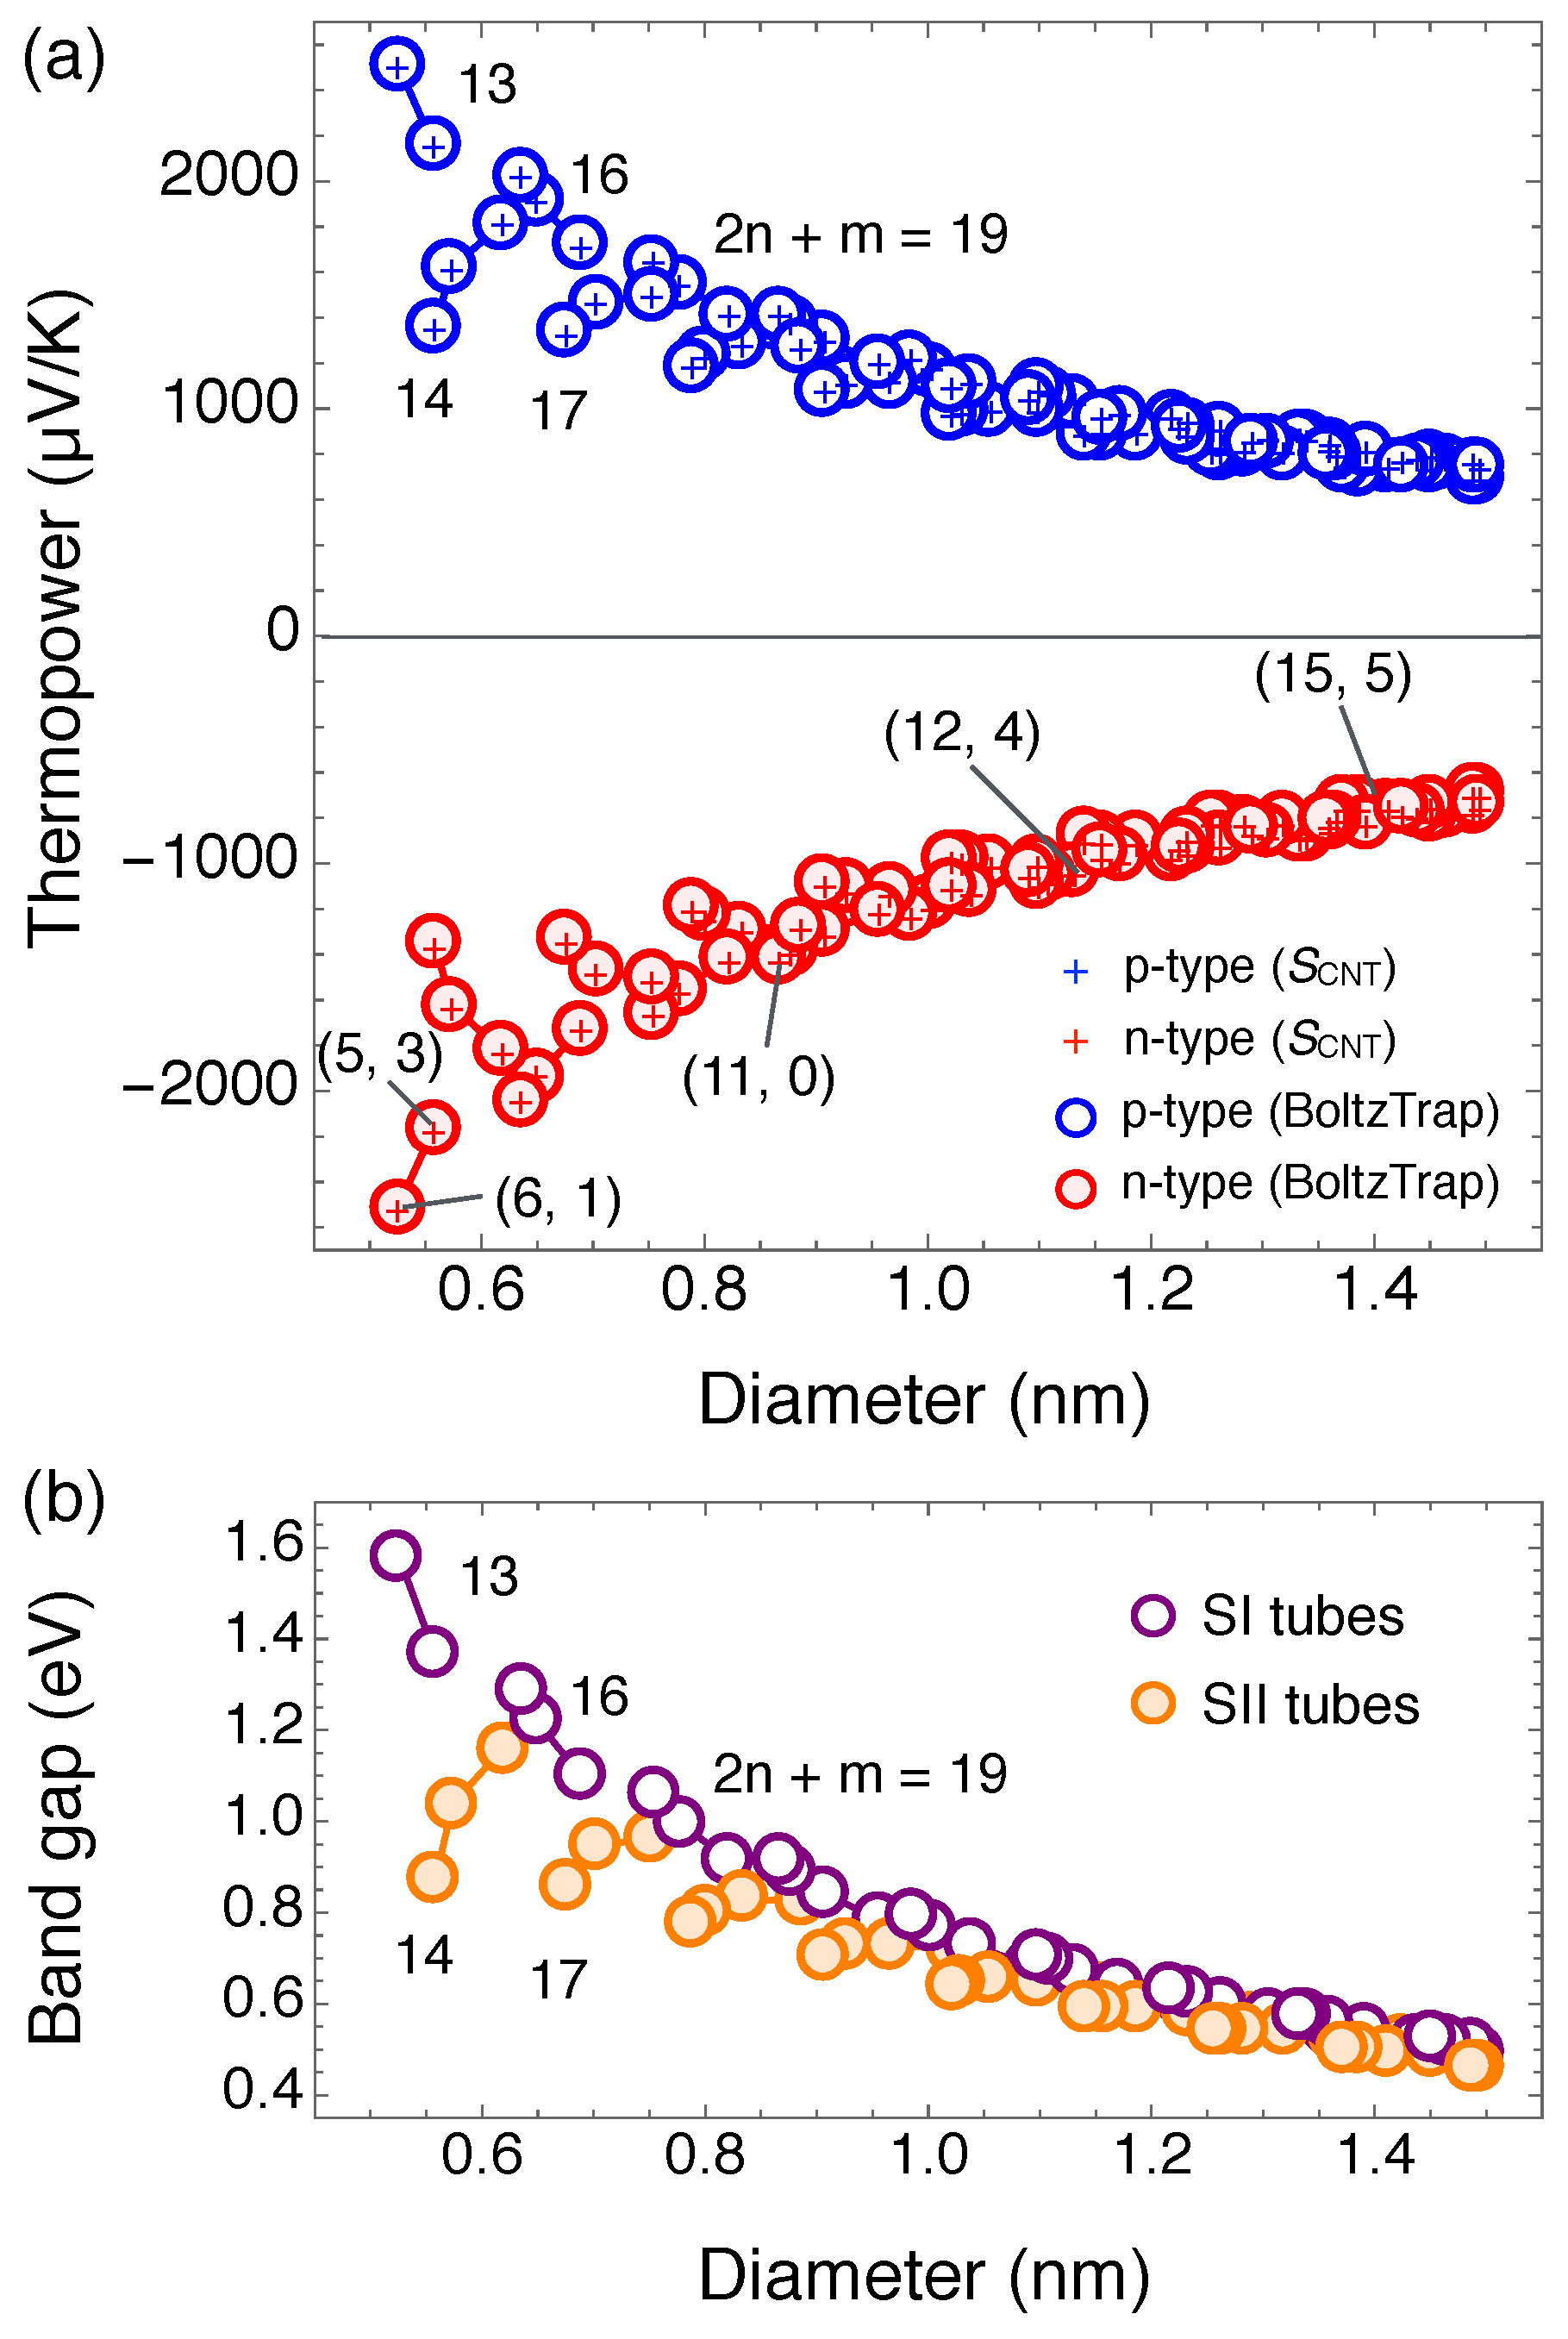
3.2. Seebeck Coefficient of SWNTs
The Seebeck coefficient S of SWNTs are obtained by solving the linearized Boltzmann equations as [66]
where T is the average absolute temperature and is the transport integral that is defined by
where E is the energy of electron. In Equation (18), is the group velocity of electron in the x direction, is the relaxation time of electron and is the DOS. is the Fermi-Dirac distribution function, where is the chemical potential, which is referred to the Fermi energy. From Equations (17) and (18), S depend on three parameters including the energy band structure , the chemical potential and the temperature T, in which depend on a specific structure (or diameter) of SWNTs as shown in Section 3.1.
In Figure 9a, we show the calculated results of S for (11, 0) s-SWNT, as a function of and T. The Seebeck coefficient increases when temperature decreases because as shown in Equation (17). The maximum S of (11, 0) s-SWNT is about 1420 μ at eV and K, which is much larger than that of bundled SWNTs (S∼100–200 μ [48,67]). In Figure 9b, we plot S at K as a function of for the (11, 0), (12, 4) and (15, 5) SWNTs. For all chiralities, the maximum values at the negative and positive sign of arise due to the p-type and n-type s-SWNTs, respectively, which is consistent with an experimental observation by Yanagi et al. [67]. Since the Seebeck coefficient depends on the chemical potential, it is possible to control the Seebeck coefficient of s-SWNTs by applying a gate voltage [47].
Figure 9.
(a) Seebeck coefficient of (11, 0) s-SWNT is plotted as a function of temperature and chemical potential. (b) Seebeck coefficients of (11, 0), (12, 4) and (15, 5) s-SWNTs are plotted as a function of chemical potential at K, in which the solid and dashed lines are obtained from the numerical calculation [Equation (17)] and analytical formula [Equation (20)], respectively. Adapted with permission from Reference [31]. Copyright 2015, American Physical Society.
In order to analyze the numerical results of the Seebeck coefficient (see Equation (17) and Figure 9), we have derived an analytical formula for the Seebeck coefficient by a two-band model [4,68]. It is noted that the contribution of two bands is required to get the optimum of S for s-SWNTs since S is a linear function with a large value within the one-band model [13],. By using the two-band model, S of s-SWNTs is given as [31]
where is the band gap of s-SWNT and r is a characteristic exponent of the scattering mechanism [8]. By using the constant-relaxation-time approximation (CRTA) [69] with , the Seebeck coefficient of s-SWNT is given by
In Figure 9b, the solid and dashed lines represent the numerical and analytical results of the Seebeck coefficient using Equation (17) and Equation (20), respectively, for the (11, 0), (12, 4) and (15, 5) s-SWNTs. As shown in Figure 9b, the analytical results from Equation (20) reproduce the numerical results near , in which S for the p-type and n-type s-SWNTs can be well-reproduced at near (i.e., the Fermi energy is located at the middle of band gap). At larger values, the two-band model is no longer valid for S at a higher doping level. Therefore, the analytical results deviate from the numerical results at larger values, as shown in Figure 9b. However, if we focus on the optimum values of S, the two-band model is sufficient to calculate S of the s-SWNTs.
In Figure 10a,b, we plot, respectively, the optimum S values and the band gaps of many s-SWNTs as the functions of diameter L for nm. In Figure 10a, S increases when the diameter L decreases. For the s-SWNTs with nm, such as s-SWNTs with (or the (5, 3) and (6, 1) s-SWNTs), S can reach the values more than 2000 μ [31]. These values are about times larger than the Seebeck coefficient of the common thermoelectric materials [11,12,20,70]. By using the density function theory, Avery et al. [26] showed that μ for (7, 5) s-SWNT and μ for (16, 0) s-SWNT, in which the diameter of (7, 5) s-SWNT ( nm) is smaller than that of (16, 0) s-SWNT ( nm). The larger S of s-SWNTs with the smaller diameter can be explained by the relation of to as shown in Equation (20) and by the fact that [65]. The 1D character of DOS of a SWNT enhances the Seebeck coefficient [9,10]. Here, it is pointed out that S of s-SWNTs depends on not only the diameter but also the family pattern, in which and represent the nanotube SI and SII families, respectively [65]. The family pattern dependence of S is very similar to that found in Figure 10b, which is often referred to as the Kataura plot [65,71,72]. Since the band gap is directly connected to the Seebeck coefficient as can be seen in the formula of Equation (20), it suggests that the measurement of the Seebeck coefficient of a single s-SWNT sample might be able to predict their band gap value.
Figure 10.
(a) Optimum thermopower (or Seebeck coefficient) values of many s-SWNTs are plotted as a function of SWNT diameter at K. Numerical and analytical results [Equation (20)] are denoted by circles and plus symbols, respectively. (b) Band gap of many s-SWNTs are plotted as a function of SWNT diameter that shows the family pattern of s-SWNTs, in which the solid lines connect the s-SWNTs with the same family number . The SI and SII tubes correspond to the s-SWNTs with and 2, respectively. Adapted with permission from Reference [31]. Copyright 2015, American Physical Society.
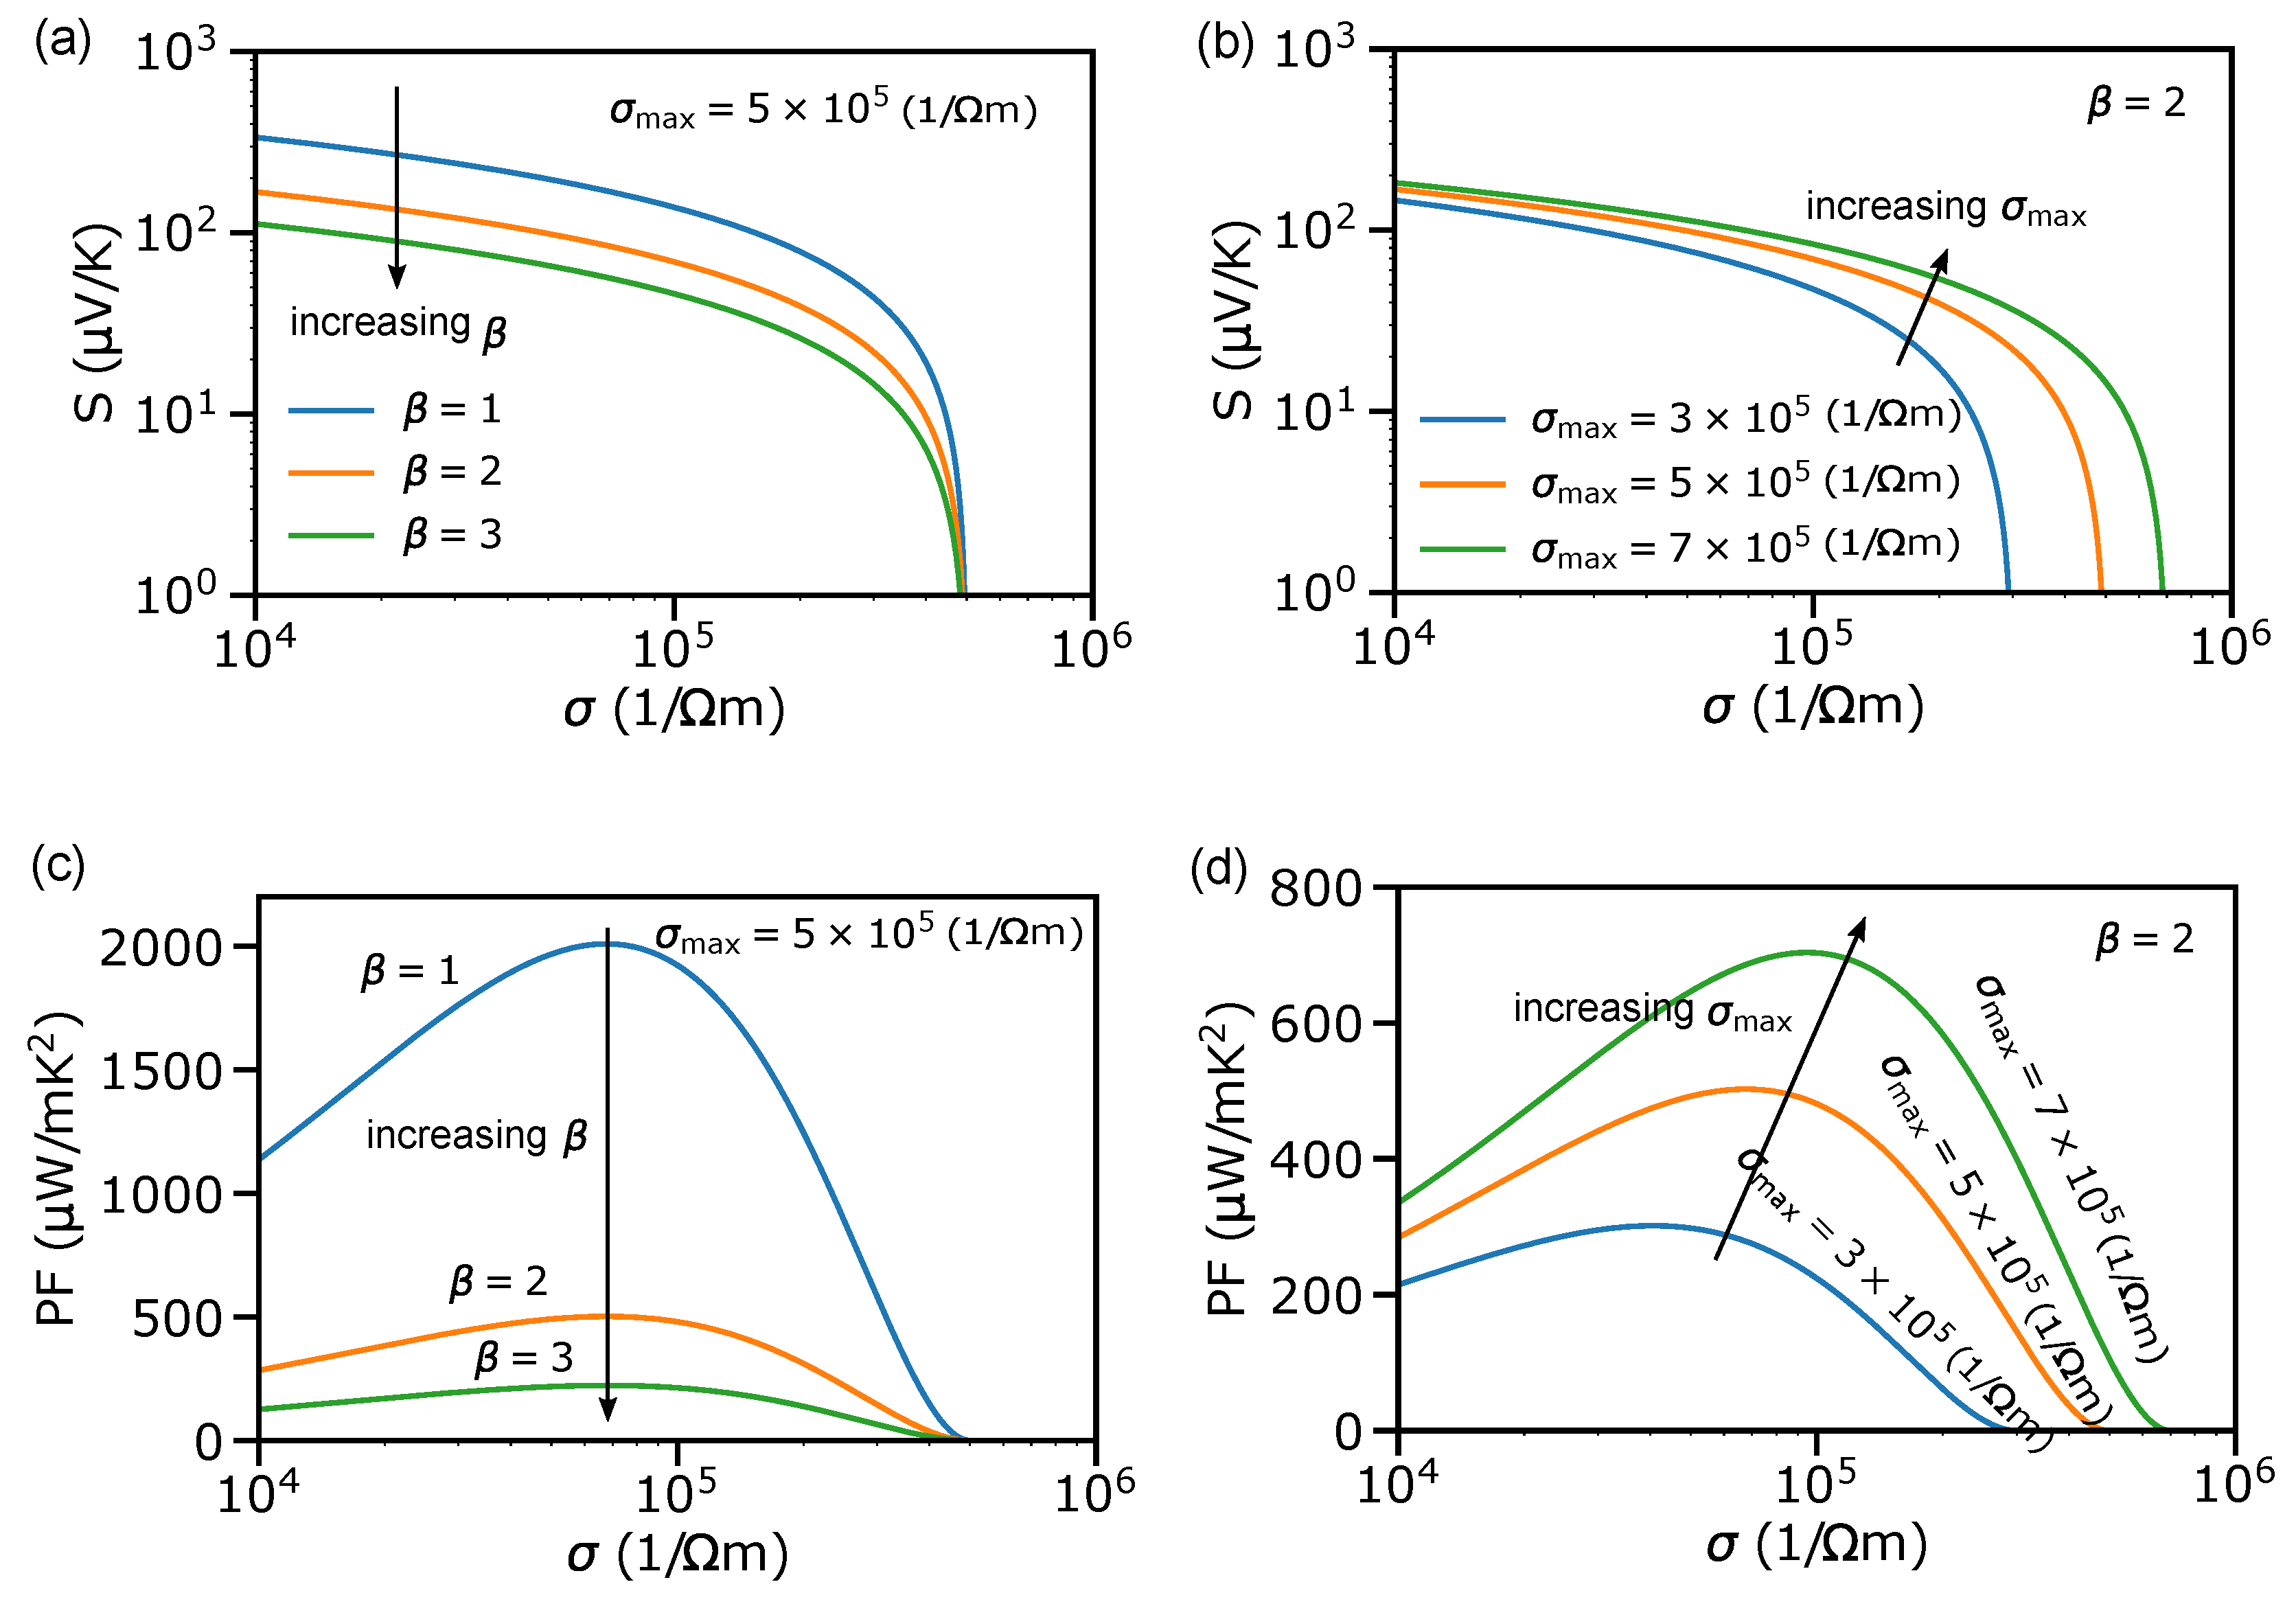
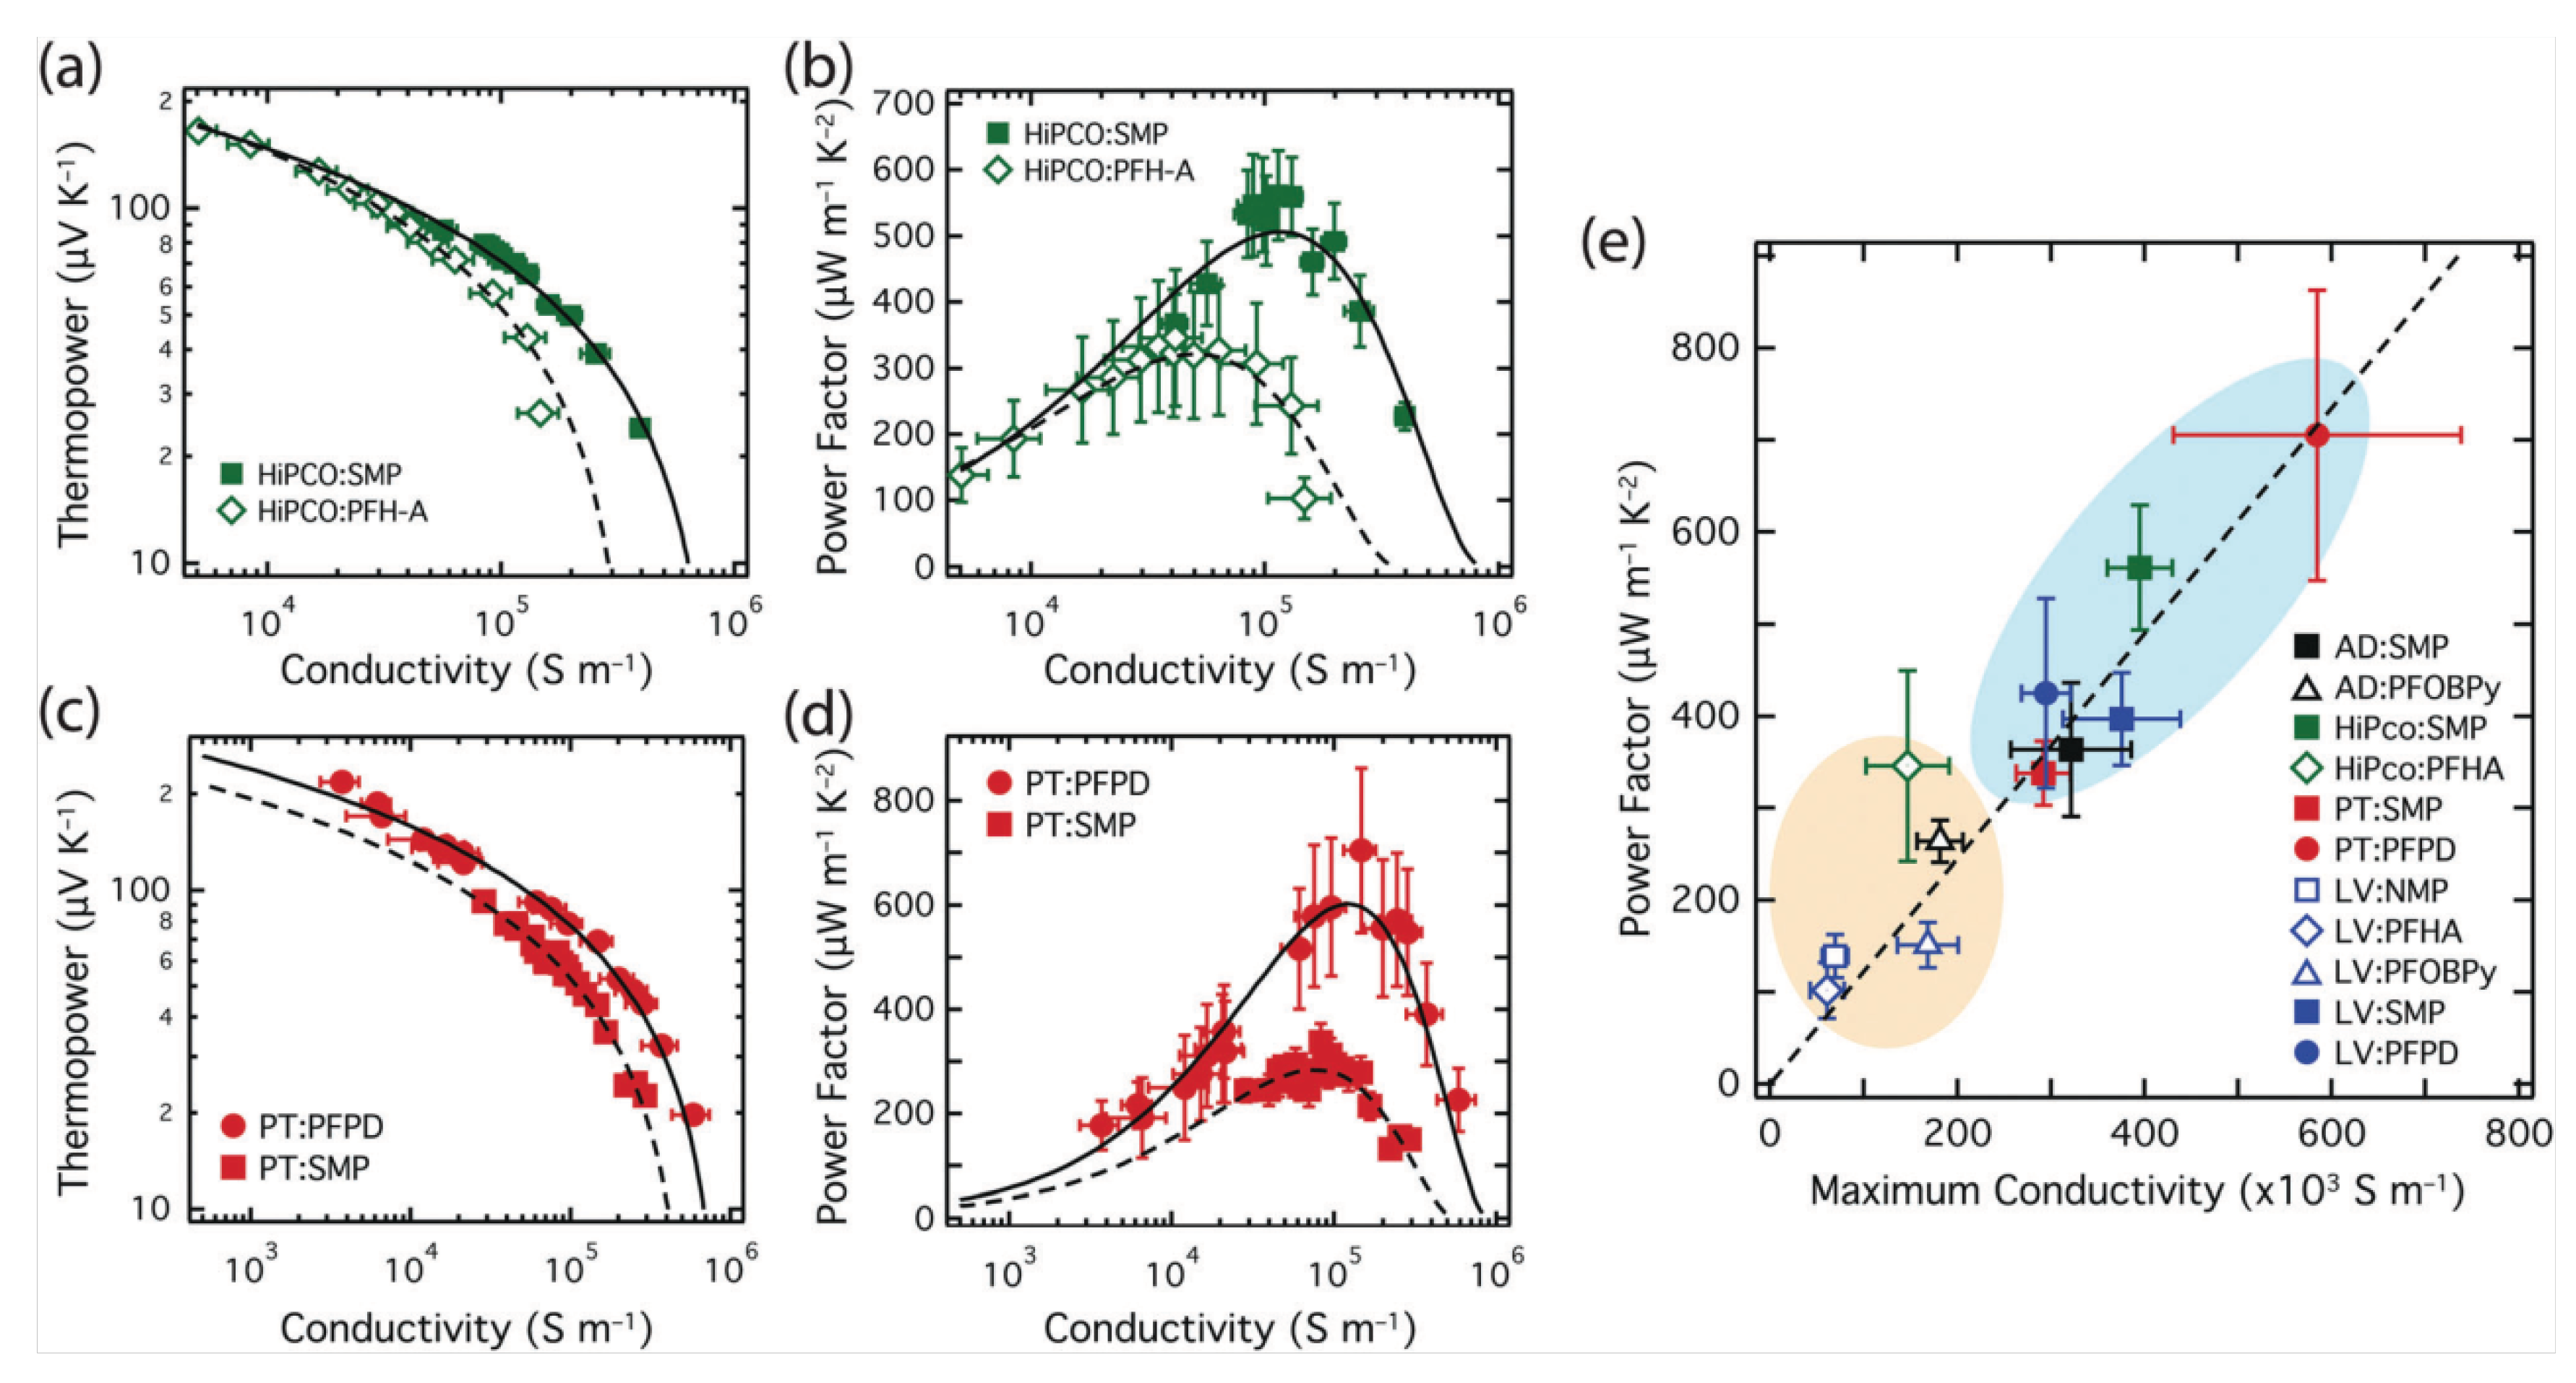
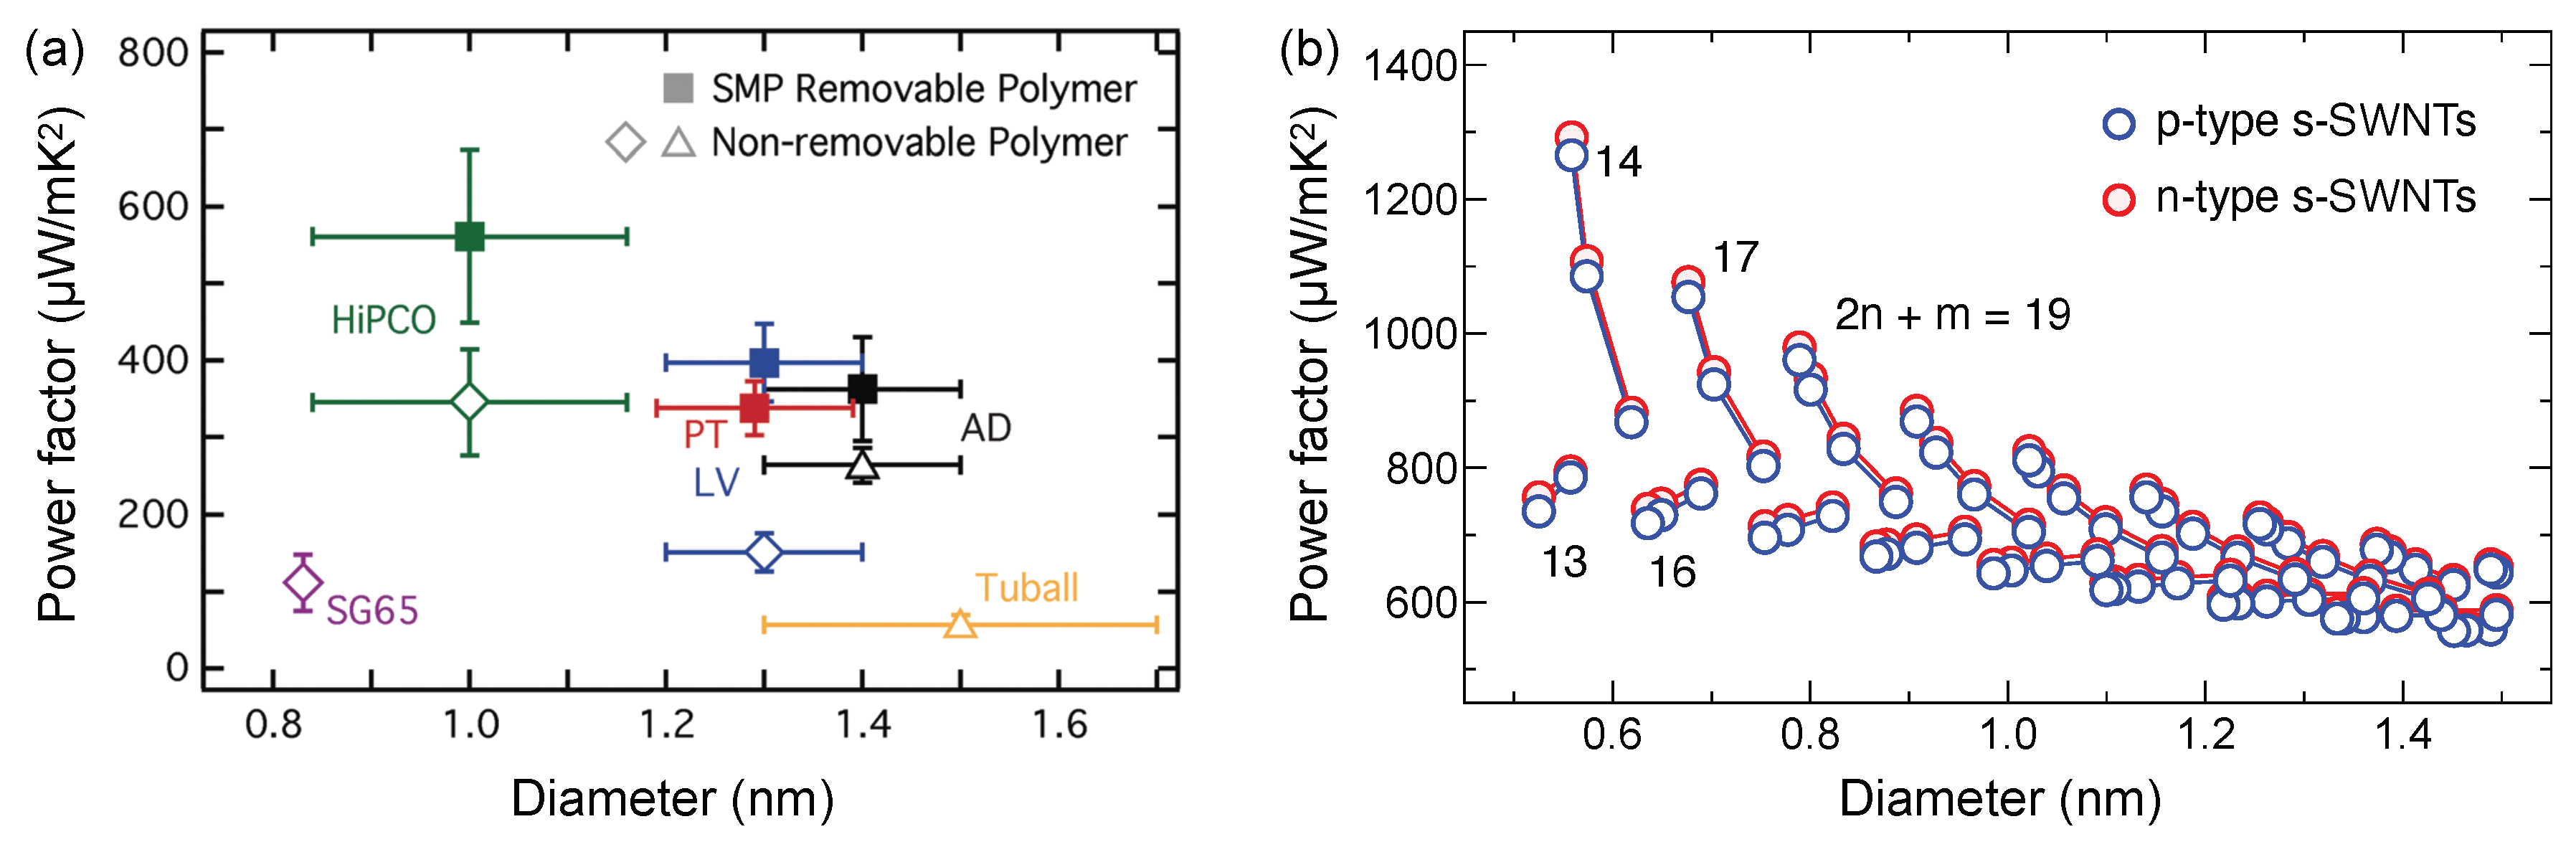
3.3. Thermoelectric Power Factor of SWNTs
The power factor is defined by (see Section 2.2), in which S is given by Equation (17) and the electrical conductivity is expressed by . The problem to optimize the PF is a trade-off between maximizing S and maximizing . This because a maximum value of S in a semiconductor usually corresponds to a minimum values of . The relationship between S and of a semiconductor could be qualitatively understood using the modified Mott-Keike formula: [73]
where and are fitting parameters. Note that can be derived from Mott-Keike formula [74] as follows:
where is the fraction of carriers available in the energy bands. might be interpreted as an possible maximum conductivity at . However, is inherently not achievable from Equation (22).
In Figure 11a,b, we show the curves for several and values, respectively. By increasing and values, curve decreases and increases, respectively. Therefore, the PF decreases by increasing as shown in Figure 11c, while the PF increases by increasing as shown in Figure 11d. Equation (21) thus tells us that a smaller value and higher value will give a larger PF value. For the SWNTs, the values of and can be controlled by the preparation of samples or the dopants. In Figure 12a, the curves are plotted for thin films of high-pressure disproportionation of carbon monoxide (HiPCO) s-SWNTs extracted with supramolecular polymer (SMP) or poly[(9,9-dihexylfluorenyl-2,7-diyl)-co-(9,10-anthracene)] (PFH-A) [27], in which s-SWNTs are treated with increasing levels of triethyloxonium hexachloroantimonate (OA) as a p-type semiconductor [75]. The solid and dashed trend lines are plotted using Equation (21). The maximum achievable of of the s-SWNTs films with the SMP is about , which is much larger than that of the s-SWNTs films with the PFH-A (). Since the curve of s-SWNT films from the SMP shifts to the right compared with that from the PFH-A, the value of s-SWNT films from the SMP is higher than that from the PFH-A. Therefore, the maximum PF for the s-SWNTs film from SMP (560 μ) is improved relative to the film from PFH-A (340 μ), as shown in Figure 12b. In Figure 12c,d, we show a similar OA doping series to Figure 12a,b, but comparing two plasma-torch (PT) s-SWNTs films dispersed with the SMP and poly[(9,9-di-n-dodecyl-2,7-fluorendiyl-dimethine)-(1,4-phenylene-dinitrilomethine)] (PFPD) [27]. In Figure 12c, the maximum for the PFPD-based film reaches , doubling that of the SMP-based film ( ). Therefore, the PF increases from 300 μ in the case of SMP film to 705 μ in the case of PFPD film.
Figure 11.
Effect of the fitting parameters (a) and (b) on the Seebeck coefficient S – electrical conductivity curves described by the modified Mott-Heike relationship in Equation (21). Effect of the fitting parameters (c) and (d) on the power factor PF – electrical conductivity curves.
Figure 12.
(a) Seebeck coefficient (or thermopower) and (b) power factor are plotted as functions of electrical conductivity for high-pressure disproportionation of carbon monoxide (HiPCO) s-SWNT networks. (c) Thermopower and (d) power factor are plotted as functions of electrical conductivity for plasma-torch (PT) s-SWNT networks. (e) Relationship between the maximum power factor and the maximum conductivity for several s-SWNT networks. Adapted with permission from Reference [27], Copyright 2017, The Royal Society of Chemistry.
In Figure 12e, we show the relationship between the maximum PF and the maximum that are obtained at the optimal and maximum doping, respectively. Since, the maximum PF a linear function of the maximum , it suggests that the maximum can be used as a quickly metric for screening the TE potential of s-SWNT samples [27]. It notes that in order to obtain the maximum PF, both and S for a wide range of chemical potential are needed that requires a significant time and effort. In contrast, the maximum can be easily obtained by a heavy doping, that can be achieved by long exposure ( min) of the s-SWNT to a concentrated dopant solution [27].
In Figure 13a, the maximum PF value is plotted as a function of the diameter of the s-SWNTs films, in which these films are extracted by the cleavable SMP and non-removable polymers (PFO-BPy or PFH-A) [27]. Both cleavable and non-cleavable s-SWNTs films show a similar diameter dependence of the PF, and it suggests that the maximum PF increases when s-SWNT diameter decreases. Since s-SWNT diameter is an important parameter for optimizing PF, the next question is which specific chiral-vector will give a highest PF. In order to analyze the dependence of s-SWNTs diameter and chiral vector on the maximum PF, we have derived an analytical formula for the PF by a one-band model as [13,14]
where is the Beta function, or 3 denotes the dimension of the material and is the carrier mobility is defined by [13]
where is the Gamma function. For 1D s-SWNTs (), r and are set to 0 and 1 ps, respectively, in the CRTA case for the sake of simplicity.
Figure 13.
(a) Power factor is plotted as a function of diameter for several s-SWNTs films. Adapted with permission from Reference [27]. Copyright 2017, The Royal Society of Chemistry. (b) Optimum of the power factor is plotted as a function of diameter for many s-SWNTs at room temperature ( K), in which the solid lines connect the s-SWNTs with the same family number .
In Figure 13b, we show the optimum PF values of many s-SWNTs as a function of diameter L for nm. The PF is found to increase as the diameter L decreases. Diameter-dependent trends in the PF is consistent with the observed experiment results in Figure 13a. More importantly, it is pointed out that the PF of the s-SWNTs shows the family pattern, which is very similar to that found in S as a function of diameter in Figure 10a. For the s-SWNTs with nm and , that is, the (6, 2) and (7, 0) s-SWNTs, the PF can reach a value more than 1100 μ for both n-type and p-type s-SWNTS. We note that the s-SWNTs with show the highest S values, while the s-SWNTs with show the highest PF values because of the correlation between S and of the s-SWNTs. Therefore, not only the nanotube diameter but also the selection of the chiralty may be an important rule for optimizing the power factor of the s-SWNTs.
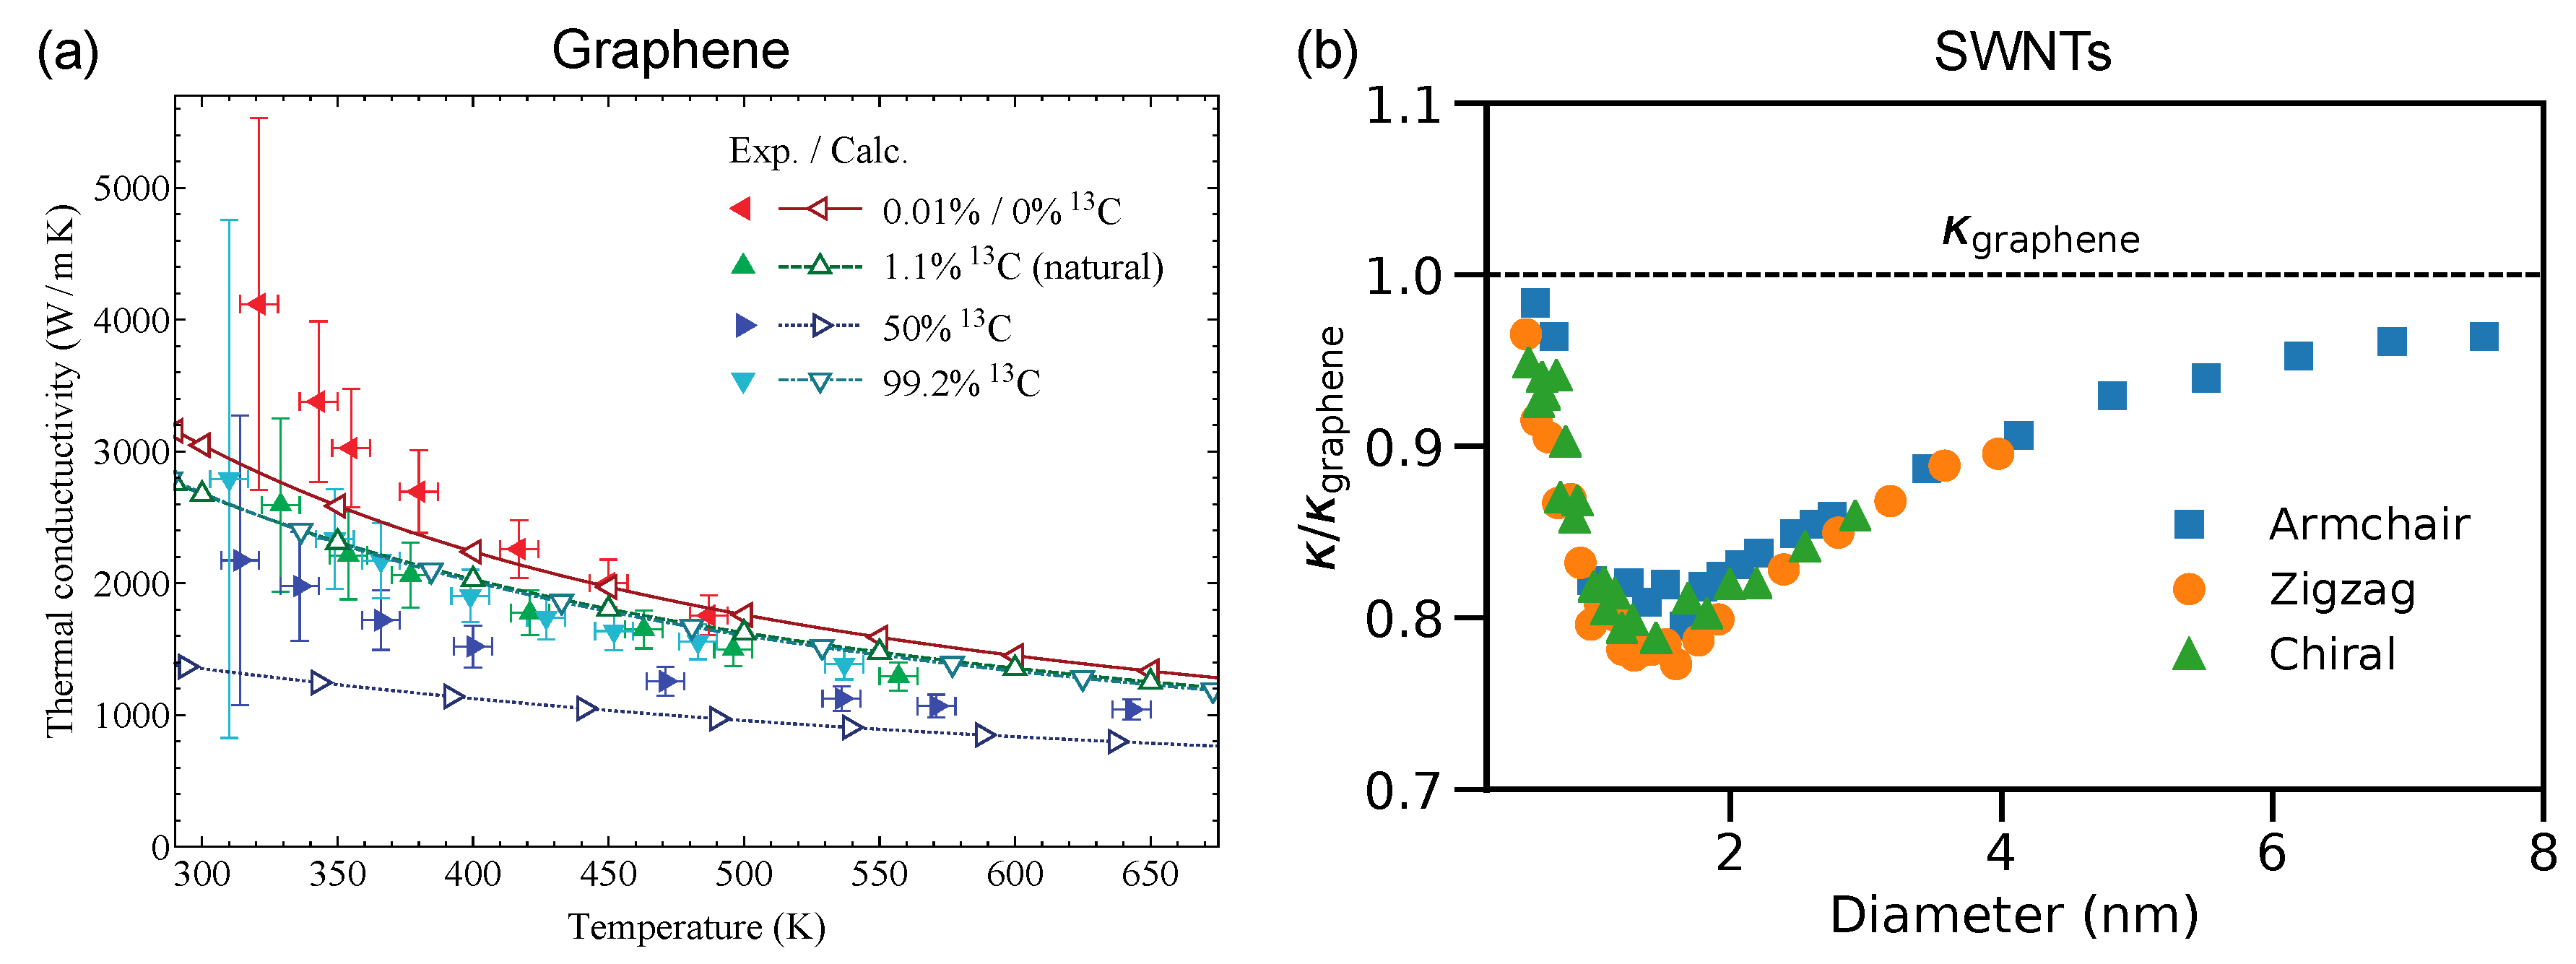
3.4. Thermal Conductivity and Figure of Merits of SWNTs
The figure of merit is determined by both the PF and the total thermal conductivity as , where and are the electronic and phonon contribution to total thermal conductivity, respectively. The Wiedemann-Franz law is commonly used to calculate the magnitude of at temperature T, which is defined by [76]
where , known as the Lorenz number. In Equation (25), is proportional to . Since of the s-SWNTs (see Table 1 and Table 2) is much smaller than that of copper ( [77]), of the SWNTs might be a small value. Hone et al. [78] showed that the total thermal conductivity of the SWNTs are orders of magnitude higher than expected from Equation (25), implying that the thermal transport in the SWNT is dominated by phonons. Zhao et al. [79] also showed that is measured to be less than 1.1 for the SWNT films.
The thermal conductivity of a phonon mode in the SWNTs is given by [80], where C is the heat capacity, v is the group velocity of the phonon and l is the mean free path (MFP) of the phonon. Pop et al. [81] showed that the thermal conductivity is nearly 3500 at room temperature ( K) for the SWNT with length about 2.6 and diameter about 1.7 nm. This value is close to the thermal conductivity of graphene about 4000 at K [82]. is large in the SWNTs and graphene for the following two reasons: (1) the carbon atoms in the SWNTs have a small mass and the covalent bonds have large force constants of their vibration, which leads to large value of v; and (2) the structure has high value of MFP since many ahharmonic terms are suppressed or give small values.
In Figure 14a, we show the thermal conductivity of graphene as a function of temperature T. Since is proportional to at near the room temperature, may be limited by the three-phonon processes [83]. In graphene, the three-phonon processes must follow the selection rule. Therefore, all three-phonon processes having an odd number (1 or 3) of out-of-plane phonon modes (ZA and ZO) are excluded [84]. In particular, the three-phonon processes such as , , , , and do not occur. The selection rule show that about 60% of the three-phonon scattering of the ZA phonon is forbidden. Therefore, the dominant contribution % to comes from the ZA phonon, which is higher than other acoustic phonon (TA and LA) [84,85].
Figure 14.
(a) Thermal conductivity is plotted as a function of temperature for graphene with several concentrations of C. The lines and dots, respectively, denote theory and experiments. Adapted with permission from Reference [85]. Copyright 2018, American Physical Society. (b) Thermal conductivity of the SWNTs is plotted as a function of the nanotube diameter. Blue squares, yellow circles and green triangles denote the armchair, zigzag and chiral SWNTs, respectively. Length of the SWNTs is set to 3 and temperature T is set to 300 K for all cases. All values are scaled by thermal conductivity of graphene . Adapted with permission from Reference [86]. Copyright 2010, American Physical Society.
In Figure 14b, the thermal conductivity of SWNTs is plotted as a function of nanotube diameter at K. For very small diameter of the SWNTs, the optic phonons has sufficiently high frequencies where the optic phonon modes contribute little to the scattering processes with acoustic phonons. By increasing the diameter, the optic phonons shift to lower frequencies and they significantly scatter acoustic phonons, which leads to reduce of the SWNTs. The thermal conductivity is found to reach a minimum for the (20, 0) SWNT with the diameter about 1.6 nm, as shown in Figure 14b. As the diameters continue to increase, the optic phonons not only scatter the acoustic phonons, but also begin to contribute to due to higher phonon populations. In addition, the graphene selection rule begins to play a role for ZA phonon contribution in large diameter. In the limit that diameter , the thermal transport properties of the SWNTs should approach that of graphene.
The high thermal conductivity leads to a small values of the SWNTs in the range of to [87]. In order to enhance the value, we need to reduce the thermal conductivity of the SWNTs, while the electronic properties are still maintained to obtain the good power factor. Since the commercial thermoelectric materials have a thermal conductivity about 1–10 , a significant reduction in the thermal conductivity of the SWNTs is to be done and it is still a challenge in the TE field. In the next section, we will show some strategies to improve the TE properties of the SWNTs.
4. Strategies to Improve the TE Properties of SWNTs
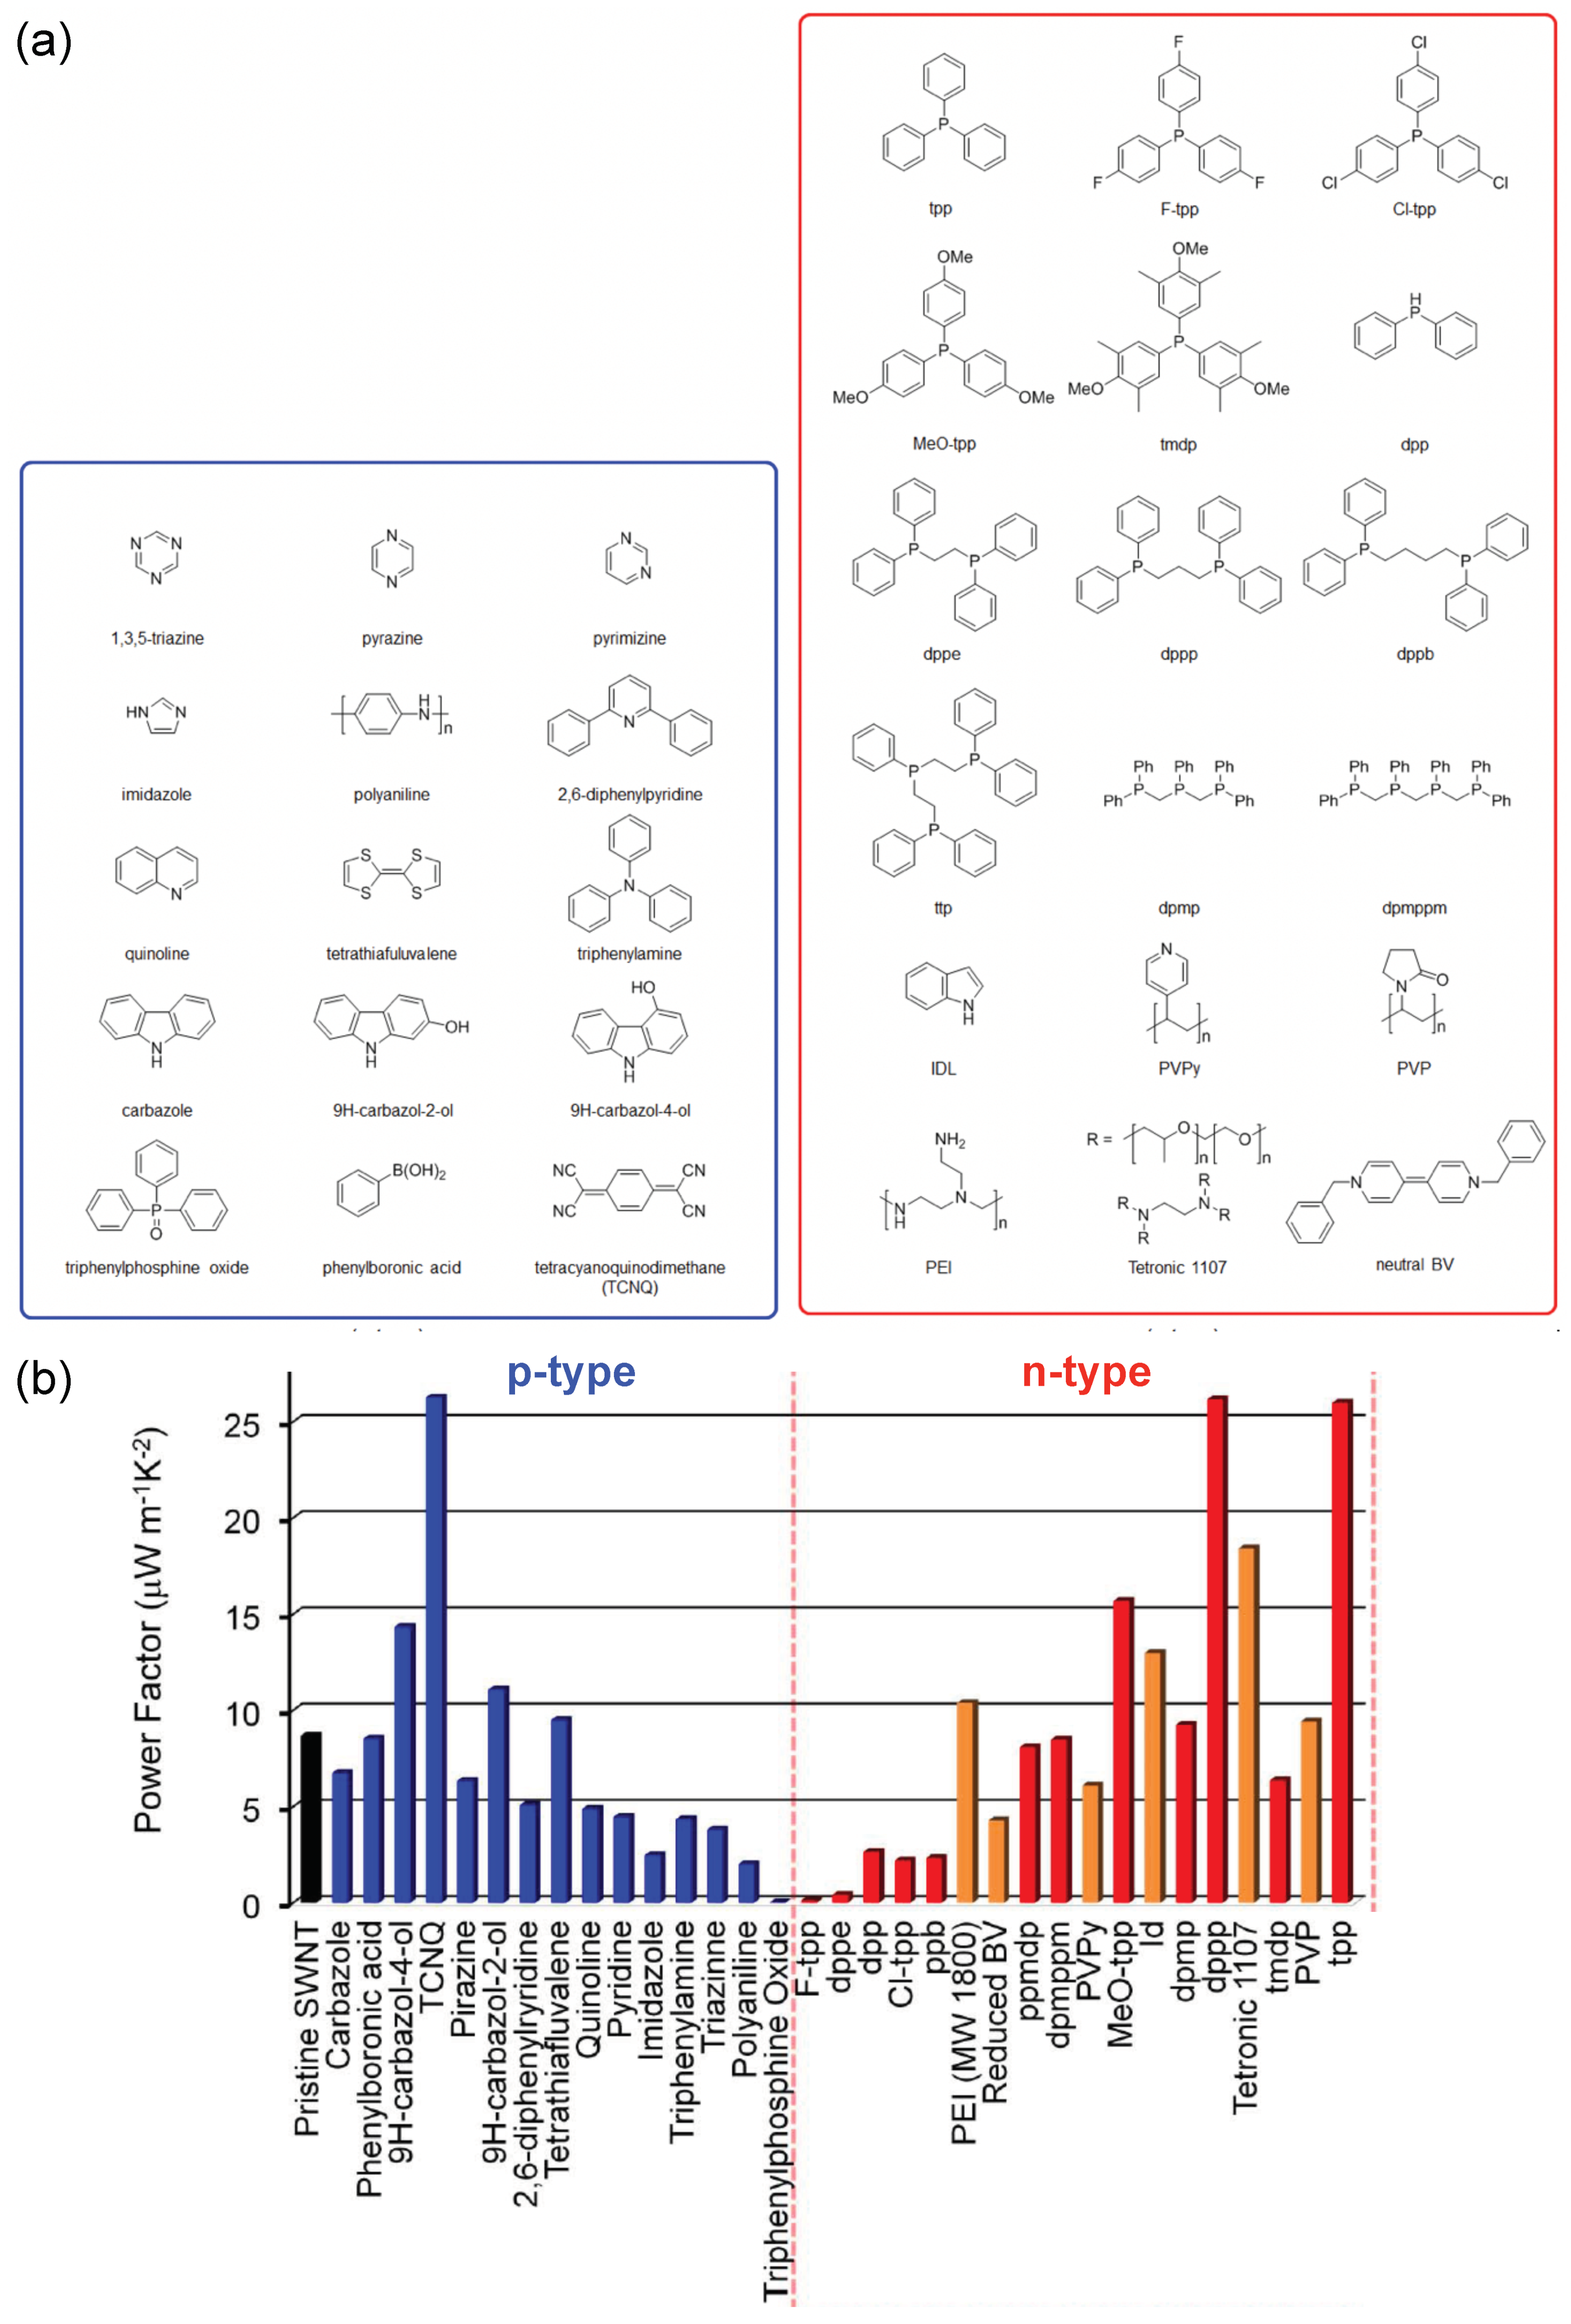
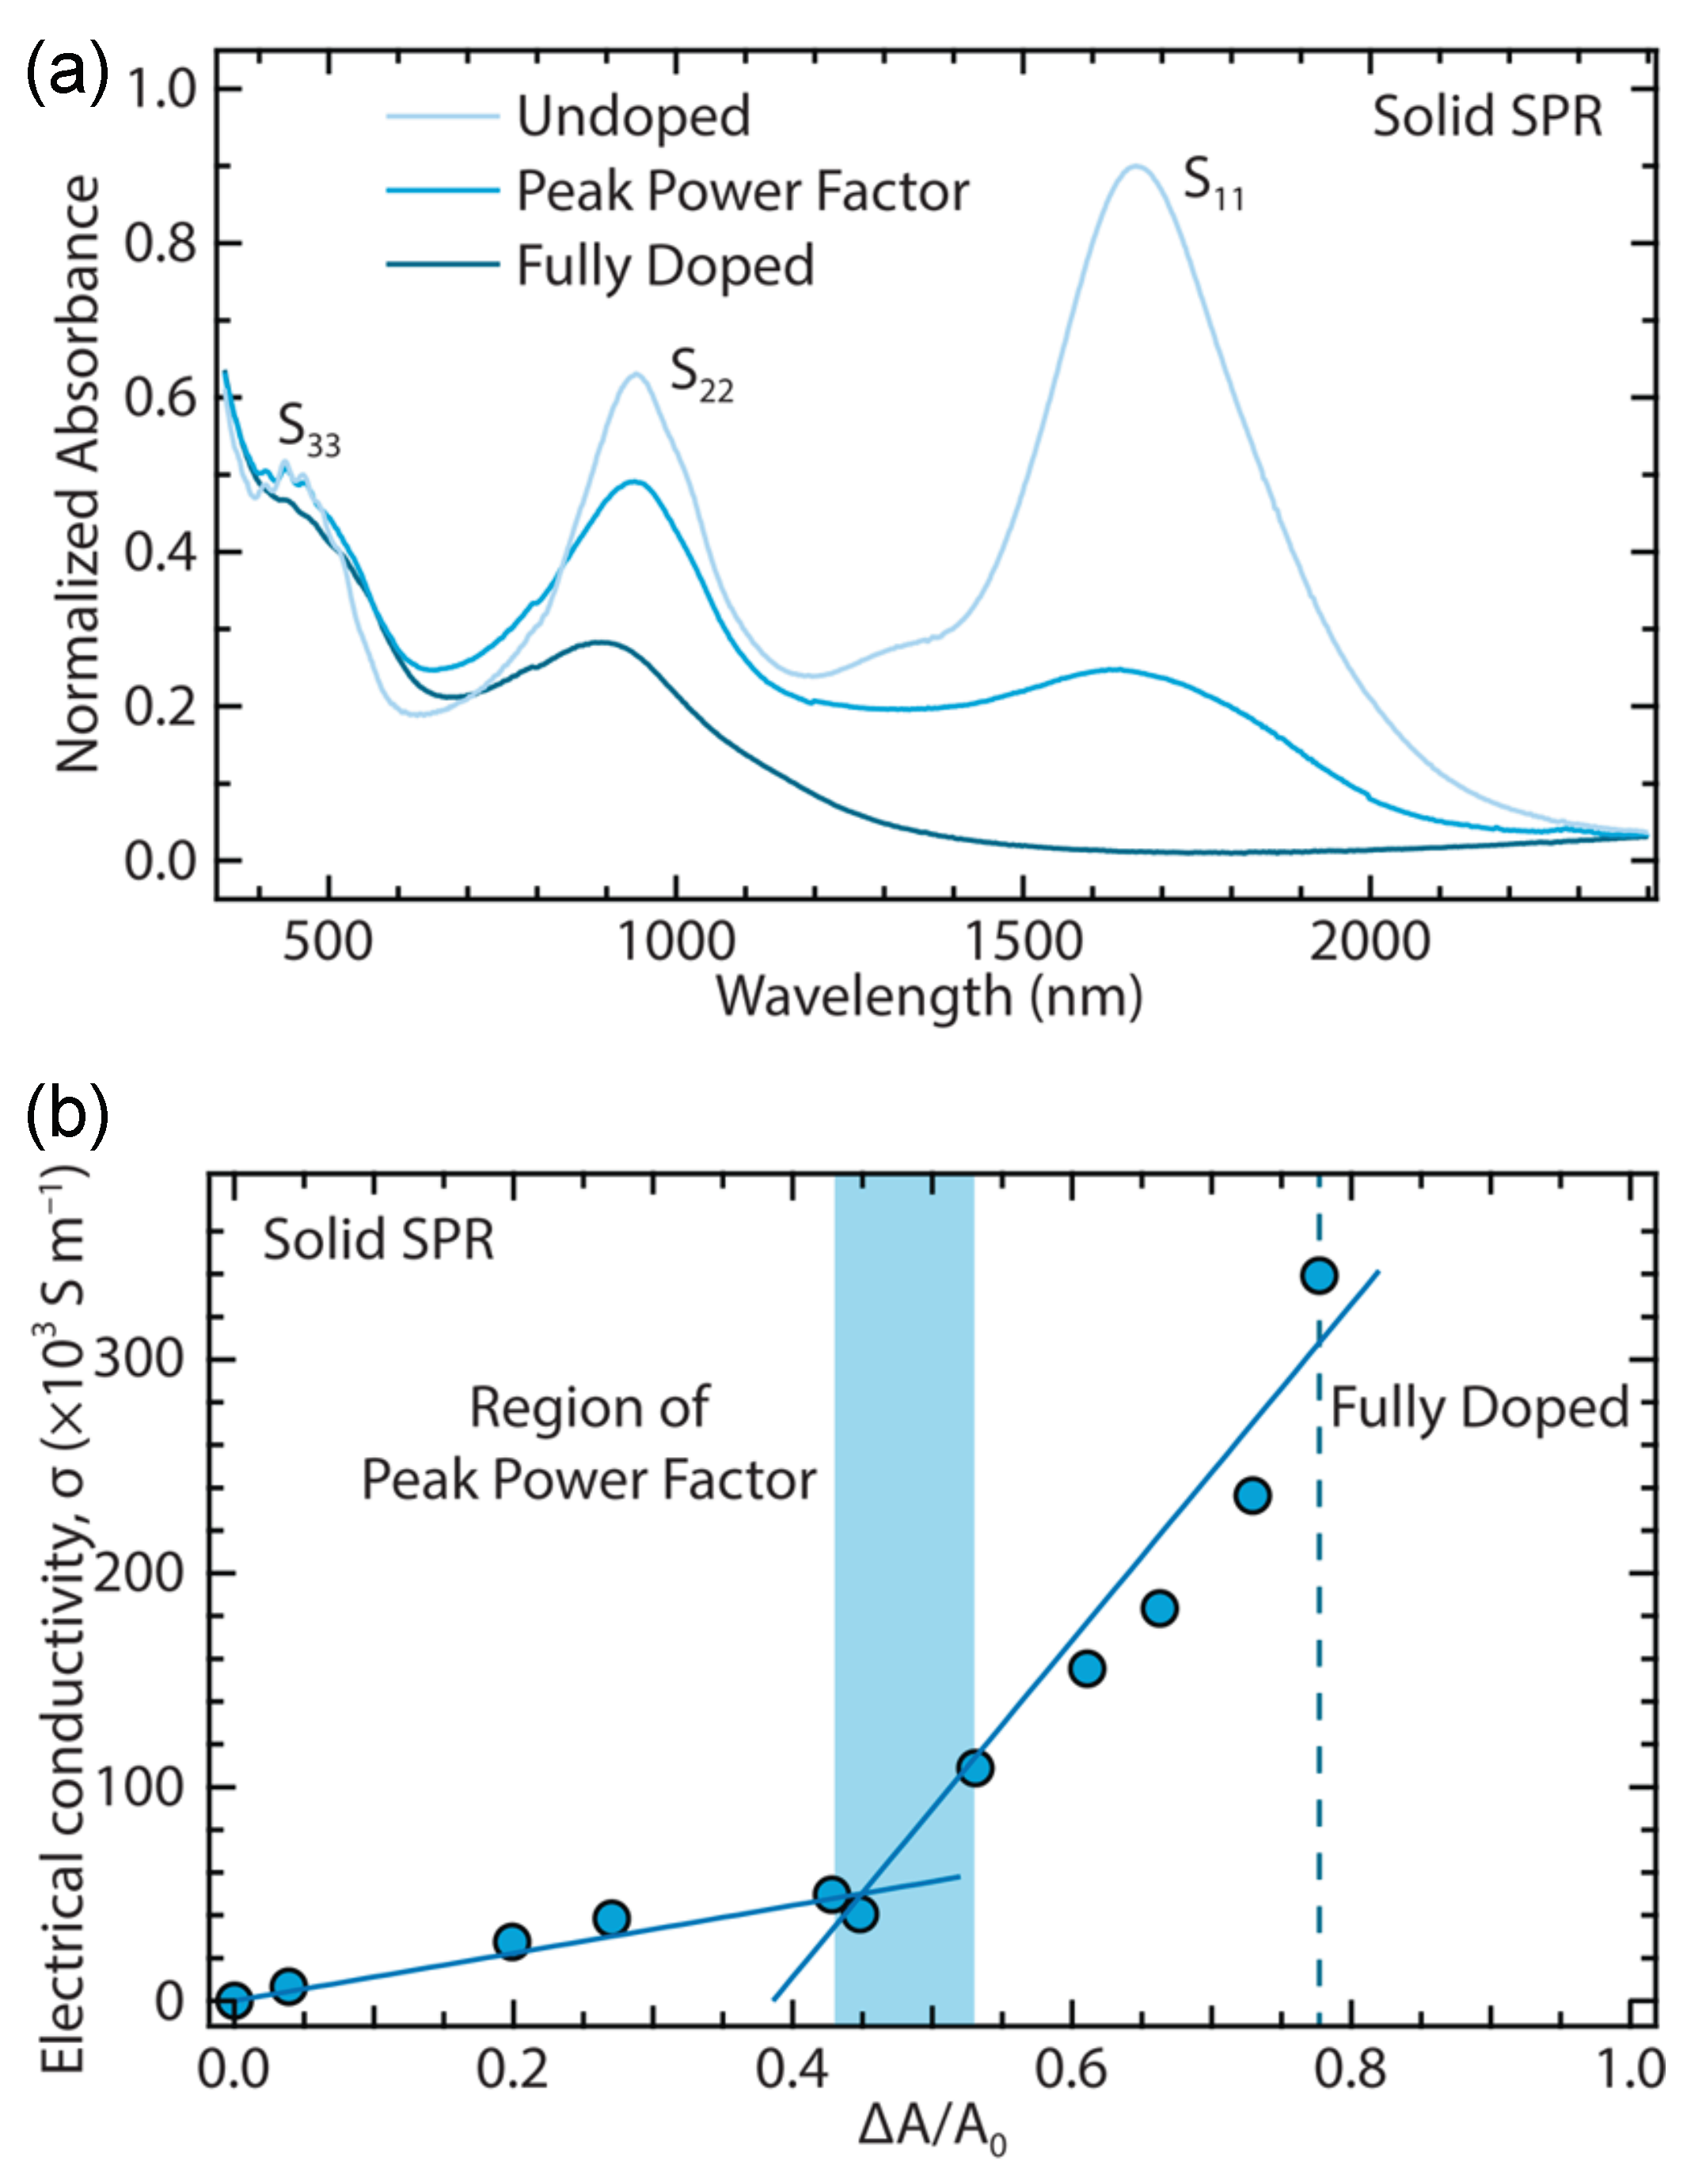
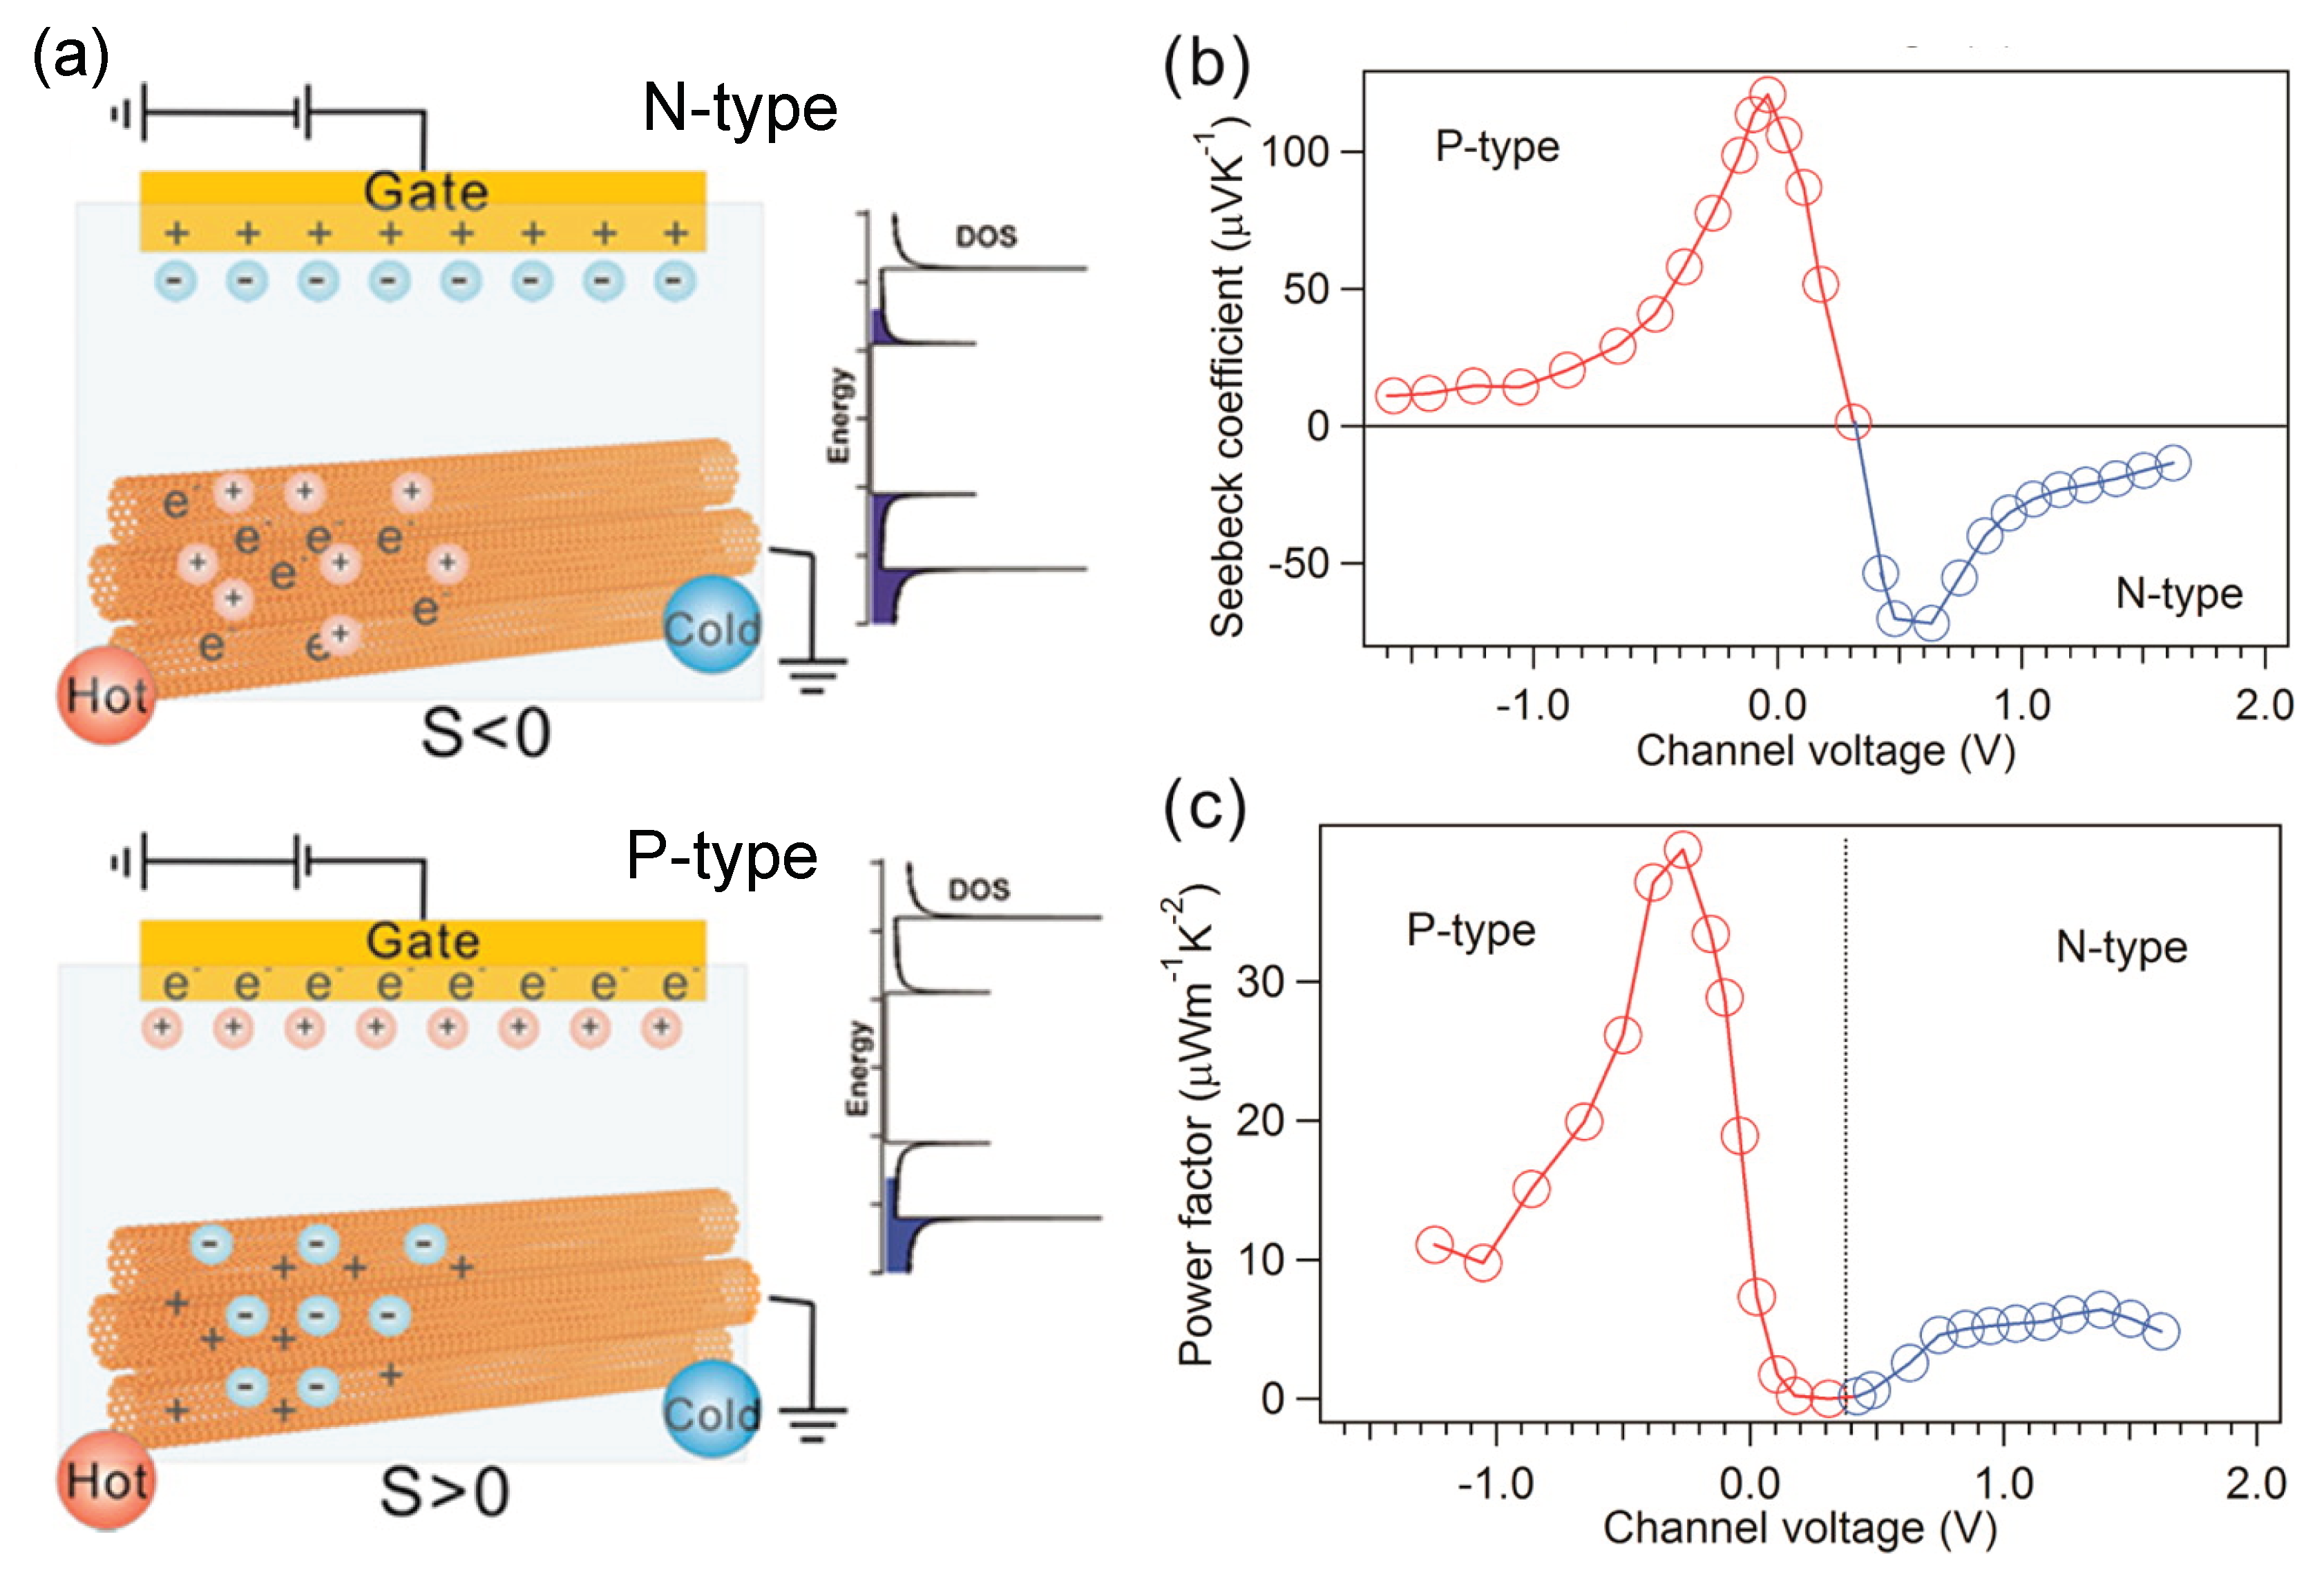
4.1. Optimizing Power Factor by Controlling Doping
As discussed in Section 3.3, the thermoelectric power factor depends on S and , in which both S and are functions of the chemical potential, temperature and energy dispersion. Since the energy dispersion depends on the chirality (or diameter) of the SWNTs and the temperature depends on the specific application, changing the chemical potential is an easy way to optimize the PF. For the SWNTs, the molecular dopants can be used to tune the chemical potential by ground state charge transfer interactions that inject holes (p-type) or electrons (n-type) into the SWNTs [75,88]. Furthermore, the SWNTs have some advantages for using charge transfer dopants. First, the SWNTs with their 1D structure have very high surface areas, where the adsorption molecules can easy access on the tube surface. Second, the SWNTs have the strongly of the covalent bonds between C atoms in-plane and the sensitivity of the bonds out-of-plane, so the SWNTs can interact with the molecular dopants without modification of structure or electronic structure. Therefore, the SWNT can be doped simply be soaking in solutions of the molecular dopants, which is in marked contrast to most conventional TE materials that often create defects by atom substitution [21].
In Figure 15a, we show many molecular dopants, which are available for p-type or n-type doping for the s-SWNT films. In general, Lewis acids are used for the p-type SWNTs, while Lewis bases are used for the n-type SWNT [53,75,88]. In Figure 15b, the power factor are obtained for many p-type and n-type molecular dopants in Figure 15a. The power factor can reach about 26 μ for both p-type and n-type SWNTs with TCNQ and dpmp dopants, respectively. We note that the pristine SWNT film has the positive value of μ, indicating that pristine SWNT exhibit a p-type characteristic [89].
Figure 15.
(a) Chemical structures of p-type and n-type molecular dopants. (b) Power factors of pristine and doped SWNT films at 310 K. Adapted with permission from Reference [53]. Copyright 2013, Nature Publishing Group.
The power factor can be improved by selecting a specific molecular dopant, but it might not be the optimized value. In order to optimize the power factor, a wide range of chemical doping is needed to find the optimum chemical potential. Baker et al. [26] used a doping strategy with the triethyloxonium hexachloroantimonate (OA) for the s-SWNT films. In this case, the chemical potential (or the Fermi energy) is controlled by the varying concentrations of the OA, in which the Fermi-energy shift is measured by the bleaching of the first and second exciton in the normalized absorption spectrum, as shown in Figure 16a,b. This strategy shows a large value of the Fermi-energy shift, resulting in optimization value of the power factor up to 705 μ in the s-SWNT films, as shown in Figure 12d.
Figure 16.
(a) Normalized absorbance spectra is plotted as a function of wavelength for the laser vaporization (LV) SWNT films. (b) Electrical conductivity is plotted as a function of the doping-induced bleach of the and peaks enveloped for the s-SWNT films. Adapted with permission from Reference [57]. Copyright 2016, American Chemical Society.
Another strategy toward to control the Fermi energy is using an electric field. In particular, the ionic gating has been used to control of the Fermi energy over a wide range of carrier densities [67]. As shown in Figure 17a, the gate voltage of a electric-double-layer transistors is used to tune the carrier density within the s-SWNT films [67] for both n-type and p-type cases. This device has also been applied for a single s-SWNT sample [47]. In Figure 17b,c, the Seebeck coefficient and power factor are showed as a function of the applied gate voltage. Shimizu et al. [90] showed that the optimum power factor can be obtained when the Fermi energy is located within the second sub-band of the s-SWNTs. The chemical doping also show that the optimum power factor is observed at heavy doping (or high carrier concentration), as shown in Figure 16. Therefore, both strategies suggest that control of the Fermi energy around the second sub-band of the s-SWNTs is important to optimize the power factor.
Figure 17.
(a) Schematic structure of ion-gated transistor devices for the n-type and p-type SWNTs films. (b) Seebeck coefficient and (c) power factor are plotted as functions of channel voltage, in which the dotted lines are inserted to identify the regions of the p-type and n-type SWNTs films. Adapted with permission from Reference [67]. Copyright 2014, American Chemical Society.
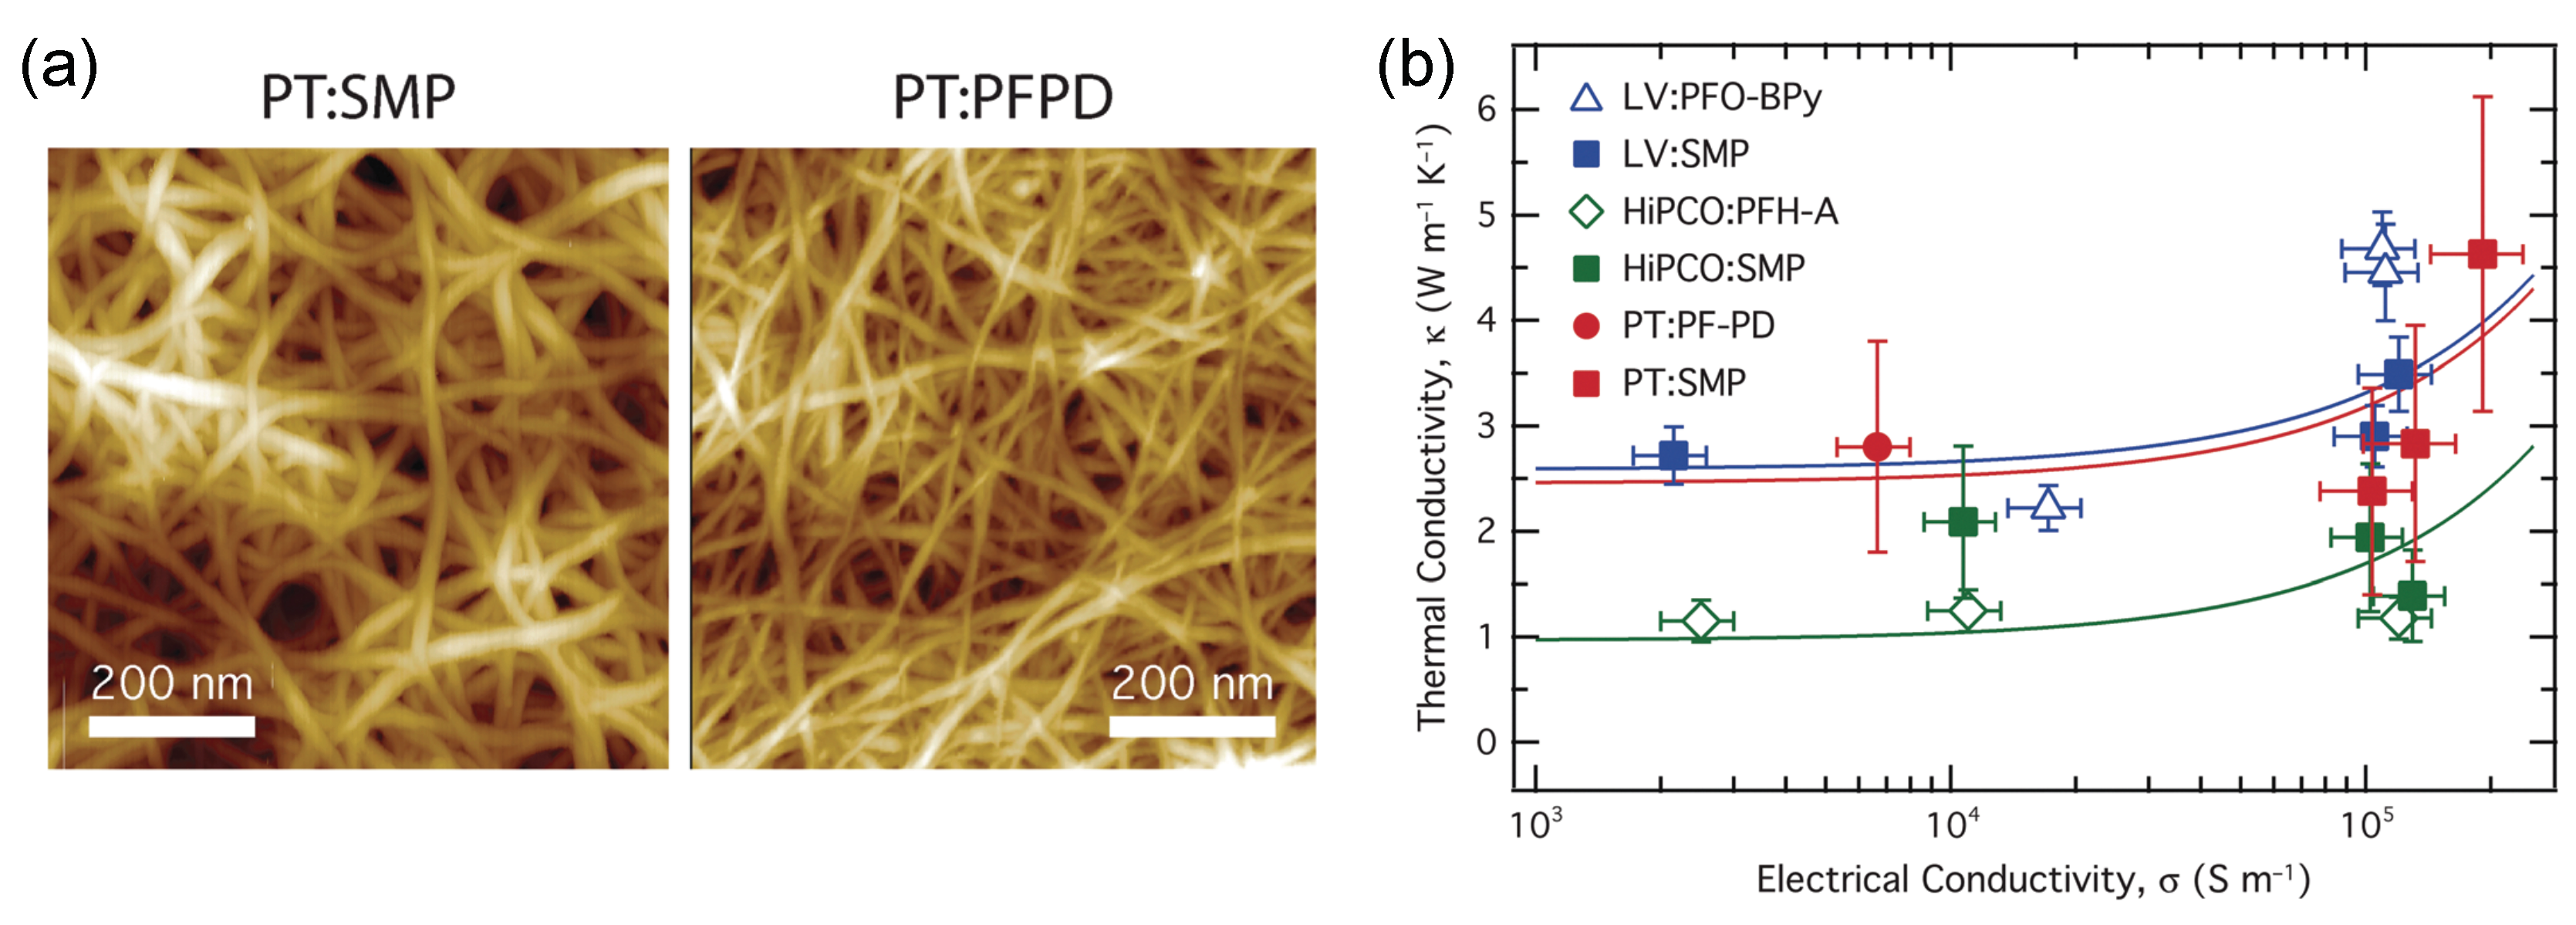
4.2. Reducing Thermal Conductivity by Using SWNT Networks
As discussed in Section 3.3, an individual s-SWNT has high thermal conductivity (3500 ) due to the very long MFP (∼0.5–1.5 μ [78]) of the phonons. In contrast, the s-SWNT film with a random network, as shown in Figure 18a, has very low thermal conductivity about 1–5 [27] compared with the individual s-SWNT. We note that the thermal conductivity of the s-SWNT film with aligned sample ( [91]) is higher than that with a random network. Therefore, the crossed SWNT junctions of the network play a important role for low thermal conductivity. Chalopin et al. [92] derived the thermal conductivity of a s-SWNT network as
where h is the length of the SWNT, d is the average distance between junctions and G is tube-tube contact conductance that is estimated about 5 pW/K [93].
Figure 18.
(a) Atomic force microscope (AFM) images of the s-SWNT networks, which are prepared from PT:SMP and PT:PFPD. (b) Thermal conductivity of various s-SWNT networks is plotted as a function of the electrical conductivity. Adapted with permission from Reference [27]. Copyright 2017, The Royal Society of Chemistry.
Since d can not be smaller than the nanotube diameter, Equation (26) shows an upper bound by a given h. By considering a typical nanotube length of 1 μ, Chalopin et al. [92] showed that all of many SWNT networks for different nanotube chiralities are of the same order and smaller than . This is also consistent with the experimental data for various s-SWNT networks, as shown in Figure 18b. The very low upper bound for of the SWNT networks is abour 700 times smaller than that of the individual SWNT, which leads to in the SWNT networks [27].
An important fact from Equation (26) is the relationship between of the SWNT network and the diameter of the individual SWNTs making up the network. To see this, it is enough to realize that G is roughly proportional to the contact area. Therefore, G is proportional to the square of the diameter [92] of the SWNTs, which leads to reduce by decreasing the diameter. MacLeod et al. [27] found that for a s-SWNT network with average diameter of 1.1 nm, while for a s-SWNT network with average diameter of 1.3 nm, which is consistent with the above story. This behavior may look the opposite to the behavior of the thermal conductivity as discussed in Figure 14b for the individual s-SWNTs with the diameter nm. However, in the case of Figure 14b, they theoretically obtain the thermal conductivity as a function of diameter, while the thermal conductivity is discussed as a function of the contact area between two SWNTs in the case of the SWNTs networks. Therefore, for the s-SWNTs networks, the phonon scattering at the contact area might be more important than the intrinsic phonon scattering in the each individual s-SWNT.
4.3. Figure of Merit of BiTe-SWNT Hybrid
Although the SWNT networks with low thermal conductivity ( ) can show a promising value of about 0.12 [27], it is still far for industrial application. On the other hand, the traditional thermoelectric materials such as BiTe show a best performance at near room temperature with [94]. However, intrinsic brittleness and hardness of BiTe limit their use as flexible TE device. Recently, Jin et al. [95] show that sputtering bismuth telluride onto the SWNTs makes a high-performing and flexible TE composite. By using the transmission electron microscopy (TEM) analyses, they showed that the BiTe grows on the SWNT surfaces with the direction of BiTe aligning with the length of the SWNTs. Interestingly, the BiTe-SWNT hybrid material shows no significant changes in the Seebeck coefficient and the electrical conductivity due to the presence of the SWNT framework, while the thermal conductivity is about half that of bulk BiTe due to more phonon scattering effect. Therefore, this hybrid material has the PF of μ and of 0.9 at room temperature [95], which is comparable to that of a commercial bulk BiTe, and is much higher than other flexible TE materials [96]. Furthermore, the BiTe-SWNT hybrid material can maintain the TE performance after 100 bending cycles with a bending radius about 4 mm and no obvious fractures or microcracks [95].
5. Summary and Perspective
In summary, many experiments and theories have demonstrated the high TE power factor for both p-type and n-type carbon nanotubes. When the sample contains only doped semiconducting SWNT species, the power factor is reported to reach 700–1000 μ. The higher PF of the SWNTs compared with the polymer allows the SWNTs to be applied for a variety of TE applications, in which the heat source is unlimited such as solar heat. The power factor can also be further improved by using a small diameter and selected chirality of the s-SWNT. At present, most of the TE devices is using the s-SWNT films with a 2D or 3D structure. Hopefully, the TE devices based on a single 1D s-SWNT can be made in the near future.
Furthermore, like the polymers, the SWNT shows a low cost manufacturing method that can replicate hundreds of thermocouples in a TE device. A simple comparison with solar cells shows the importance of material costs. Currently, a TE device has the efficiency five times lower than solar cells, but it requires fifty times more active material. Therefore, enhancement the power factor is an important step towards the widespread use of the TE.
Another point to overcome is that the SWNTs show a small value about 0.12 at K compared with the traditional TE materials such as BiTe ( at K). At present, this problem has not yet been solved, mainly due to the high thermal conductivity of the SWNTs. However, one can foresee many applications to take advantages of both the SWNTs and the traditional TE materials. For example, BiTe-SWNT hybrid material showed a high-performing and highly flexible TE composite with the power factor and of about 1600 μ and 0.9, respectively [95]. A flexible TE device can be used for many applications such as clothes capable of powering various devices from body heat.
Author Contributions
All authors discussed and edited the manuscript. The authors contribute to the manuscript equally.
Funding
This research was funded by Frontier Research Institute for Interdisciplinary Sciences, Tohoku University, and JSPS KAKENHI with grant number No. JP18H01810.
Acknowledgments
N.T.H. acknowledges the financial support from the Frontier Research Institute for Interdisciplinary Sciences, Tohoku University. A.R.T.N. acknowledges computing facilities provided by Research Center for Physics and Research Center for Informatics, LIPI. R.S. acknowledges JSPS KAKENHI (Grant No. JP18H01810).
Conflicts of Interest
The authors declare no conflict of interest.
Abbreviations
The following abbreviations are used in this manuscript:
| CNT | carbon nanotube |
| SWNT | single wall carbon nanotube |
| s-SWNT | semiconducting single wall carbon nanotube |
| TE | thermoelectric |
| PF | power factor |
| optimized power factor | |
| optimized power factor of 3D system | |
| DOS | density of states |
| 1D | one-dimensional |
| 2D | two-dimensional |
| 3D | three-dimensional |
| KE | kinetic energy |
| CRTA | constant-relaxation-time approximation |
| STB | simple tight binding |
| ETB | extended tight binding |
| TW | twisting phonon mode |
| OA | triethyloxonium hexachloroantimonate |
| SMP | supramolecular polymer |
| HiPCO | high-pressure disproportionation of carbon monoxide |
| PT | plasma-torch |
| LV | laser vaporization |
| MFP | mean free path |
References
- Estimated U.S. Energy Consumption in 2018. Available online: https://flowcharts.llnl.gov/commodities/energy (accessed on 11 November 2019).
- Rowe, D.M. Thermoelectrics Handbook: Macro to Nano; CRC Press: Boca Ratcon, FL, USA, 2005. [Google Scholar]
- Vining, C.B. Semiconductors are cool. Nature 2001, 413, 577–578. [Google Scholar] [CrossRef] [PubMed]
- Goldsmid, H.J. Introduction to Thermoelectricity; Springer: Berlin/Heidelberg, Germany, 2010. [Google Scholar]
- Liu, W.; Kim, H.S.; Chen, S.; Jie, Q.; Lv, B.; Yao, M.; Ren, Z.; Opeil, C.P.; Wilson, S.; Chu, C.W.; et al. n-type thermoelectric material Mg2Sn0.75Ge0.25 for high power generation. Proc. Natl. Acad. Sci. USA 2015, 112, 3269–3274. [Google Scholar] [CrossRef] [PubMed]
- Liu, W.; Kim, H.S.; Jie, Q.; Ren, Z. Importance of high power factor in thermoelectric materials for power generation application: A perspective. Scr. Mater. 2016, 111, 3–9. [Google Scholar] [CrossRef]
- Yee, S.K.; LeBlanc, S.; Goodson, K.E.; Dames, C. $ per W metrics for thermoelectric power generation: beyond ZT. Energy Environ. Sci. 2013, 6, 2561–2571. [Google Scholar] [CrossRef]
- Ziman, J.M. Electrons and Phonons; Oxford University Press: Oxford, UK, 1960. [Google Scholar]
- Hicks, L.D.; Dresselhaus, M.S. Effect of quantum-well structures on the thermoelectric figure of merit. Phys. Rev. B 1993, 47, 12727. [Google Scholar] [CrossRef]
- Hicks, L.D.; Dresselhaus, M.S. Thermoelectric figure of merit of a one-dimensional conductor. Phys. Rev. B 1993, 47, 16631. [Google Scholar] [CrossRef]
- Boukai, A.I.; Bunimovich, Y.; Tahir-Kheli, J.; Yu, J.K.; Goddard Iii, W.A.; Heath, J.R. Silicon nanowires as efficient thermoelectric materials. Nature 2008, 451, 168–171. [Google Scholar] [CrossRef]
- Hochbaum, A.I.; Chen, R.; Delgado, R.D.; Liang, W.; Garnett, E.C.; Najarian, M.; Majumdar, A.; Yang, P. Enhanced thermoelectric performance of rough silicon nanowires. Nature 2008, 451, 163–167. [Google Scholar] [CrossRef]
- Hung, N.T.; Hasdeo, E.H.; Nugraha, A.R.T.; Dresselhaus, M.S.; Saito, R. Quantum Effects in the Thermoelectric Power Factor of Low-Dimensional Semiconductors. Phys. Rev. Lett. 2016, 117, 036602. [Google Scholar] [CrossRef]
- Hung, N.T.; Nugraha, A.R.T.; Saito, R. Size effect in thermoelectric power factor of nondegenerate and degenerate low-dimensional semiconductors. Mater. Today Proc. 2017, 4, 12368–12373. [Google Scholar] [CrossRef]
- Zeng, J.; He, X.; Liang, S.J.; Liu, E.; Sun, Y.; Pan, C.; Wang, Y.; Cao, T.; Liu, X.; Wang, C.; et al. Experimental identification of critical condition for drastically enhancing thermoelectric power factor of two-dimensional layered materials. Nano Lett. 2018, 18, 7538–7545. [Google Scholar] [CrossRef] [PubMed]
- Zhang, Y.; Feng, B.; Hayashi, H.; Chang, C.P.; Sheu, Y.M.; Tanaka, I.; Ikuhara, Y.; Ohta, H. Double thermoelectric power factor of a 2D electron system. Nat. Commun. 2018, 9, 2224. [Google Scholar] [CrossRef] [PubMed]
- Ohta, H.; Kim, S.; Mune, Y.; Mizoguchi, T.; Nomura, K.; Ohta, S.; Nomura, T.; Nakanishi, Y.; Ikuhara, Y.; Hirano, M.; et al. Giant thermoelectric Seebeck coefficient of a two-dimensional electron gas in SrTiO 3. Nat. Mater. 2007, 6, 129. [Google Scholar] [CrossRef] [PubMed]
- Ohta, H.; Kim, S.W.; Kaneki, S.; Yamamoto, A.; Hashizume, T. High Thermoelectric Power Factor of High-Mobility 2D Electron Gas. Adv. Sci. 2018, 5, 1700696. [Google Scholar] [CrossRef]
- Saito, R.; Dresselhaus, G.; Dresselhaus, M.S. Physical Properties of Carbon Nanotubes; World Scientific: London, UK, 1998. [Google Scholar]
- Poudel, B.; Hao, Q.; Ma, Y.; Lan, Y.; Minnich, A.; Yu, B.; Yan, X.; Wang, D.; Muto, A.; Vashaee, D.; et al. High-thermoelectric performance of nanostructured bismuth antimony telluride bulk alloys. Science 2008, 320, 634–638. [Google Scholar] [CrossRef]
- Heremans, J.P.; Jovovic, V.; Toberer, E.S.; Saramat, A.; Kurosaki, K.; Charoenphakdee, A.; Yamanaka, S.; Snyder, G.J. Enhancement of thermoelectric efficiency in PbTe by distortion of the electronic density of states. Science 2008, 321, 554–557. [Google Scholar] [CrossRef]
- Bubnova, O.; Khan, Z.U.; Malti, A.; Braun, S.; Fahlman, M.; Berggren, M.; Crispin, X. Optimization of the thermoelectric figure of merit in the conducting polymer poly (3, 4-ethylenedioxythiophene). Nat. Mater. 2011, 10, 429. [Google Scholar] [CrossRef]
- Lee, S.H.; Park, H.; Kim, S.; Son, W.; Cheong, I.W.; Kim, J.H. Transparent and flexible organic semiconductor nanofilms with enhanced thermoelectric efficiency. J. Mater. Chem. A 2014, 2, 7288–7294. [Google Scholar] [CrossRef]
- Kim, G.H.; Shao, L.; Zhang, K.; Pipe, K.P. Engineered doping of organic semiconductors for enhanced thermoelectric efficiency. Nat. Mater. 2013, 12, 719. [Google Scholar] [CrossRef]
- Berber, S.; Kwon, Y.K.; Tománek, D. Unusually high thermal conductivity of carbon nanotubes. Phys. Rev. Lett. 2000, 84, 4613. [Google Scholar] [CrossRef]
- Avery, A.D.; Zhou, B.H.; Lee, J.; Lee, E.S.; Miller, E.M.; Ihly, R.; Wesenberg, D.; Mistry, K.S.; Guillot, S.L.; Zink, B.L.; et al. Tailored semiconducting carbon nanotube networks with enhanced thermoelectric properties. Nat. Energy 2016, 1, 16033. [Google Scholar] [CrossRef]
- MacLeod, B.A.; Stanton, N.J.; Gould, I.E.; Wesenberg, D.; Ihly, R.; Owczarczyk, Z.R.; Hurst, K.E.; Fewox, C.S.; Folmar, C.N.; Hughes, K.H.; et al. Large n-and p-type thermoelectric power factors from doped semiconducting single-walled carbon nanotube thin films. Energy Environ. Sci. 2017, 10, 2168–2179. [Google Scholar] [CrossRef]
- Tortorich, R.P.; Choi, J.W. Inkjet printing of carbon nanotubes. Nanomaterials 2013, 3, 453–468. [Google Scholar] [CrossRef] [PubMed]
- Brownlie, L.; Shapter, J. Advances in carbon nanotube n-type doping: Methods, analysis and applications. Carbon 2018, 126, 257–270. [Google Scholar] [CrossRef]
- Derycke, V.; Martel, R.; Appenzeller, J.; Avouris, P. Controlling doping and carrier injection in carbon nanotube transistors. Appl. Phys. Lett. 2002, 80, 2773–2775. [Google Scholar] [CrossRef]
- Hung, N.T.; Nugraha, A.R.T.; Hasdeo, E.H.; Dresselhaus, M.S.; Saito, R. Diameter dependence of thermoelectric power of semiconducting carbon nanotubes. Phys. Rev. B 2015, 92, 165426. [Google Scholar] [CrossRef]
- Snyder, G.J.; Christensen, M.; Nishibori, E.; Caillat, T.; Iversen, B.B. Disordered zinc in Zn 4 Sb 3 with phonon-glass and electron-crystal thermoelectric properties. Nat. Mater. 2004, 3, 458. [Google Scholar] [CrossRef]
- Beekman, M.; Morelli, D.T.; Nolas, G.S. Better thermoelectrics through glass-like crystals. Nat. Mater. 2015, 14, 1182. [Google Scholar] [CrossRef]
- Takabatake, T.; Suekuni, K.; Nakayama, T.; Kaneshita, E. Phonon-glass electron-crystal thermoelectric clathrates: Experiments and theory. Rev. Mod. Phys. 2014, 86, 669. [Google Scholar] [CrossRef]
- Ma, J.; Delaire, O.; May, A.F.; Carlton, C.E.; McGuire, M.A.; VanBebber, L.H.; Abernathy, D.L.; Ehlers, G.; Hong, T.; Huq, A.; et al. Glass-like phonon scattering from a spontaneous nanostructure in AgSbTe 2. Nat. Nanotechnol. 2013, 8, 445. [Google Scholar] [CrossRef]
- Nielsen, M.D.; Ozolins, V.; Heremans, J.P. Lone pair electrons minimize lattice thermal conductivity. Energy Environ. Sci. 2013, 6, 570–578. [Google Scholar] [CrossRef]
- Hockings, E. The thermal conductivity of silver antimony telluride. J. Phys. Chem. Solids 1959, 10, 341–342. [Google Scholar] [CrossRef]
- Mukhopadhyay, S.; Parker, D.S.; Sales, B.C.; Puretzky, A.A.; McGuire, M.A.; Lindsay, L. Two-channel model for ultralow thermal conductivity of crystalline Tl3VSe4. Science 2018, 360, 1455–1458. [Google Scholar] [CrossRef] [PubMed]
- Hicks, L.D.; Harman, T.C.; Sun, X.; Dresselhaus, M.S. Experimental study of the effect of quantum-well structures on the thermoelectric figure of merit. Phys. Rev. B 1996, 53, R10493. [Google Scholar] [CrossRef]
- Majumdar, A. Thermoelectricity in semiconductor nanostructures. Science 2004, 303, 777–778. [Google Scholar] [CrossRef]
- Harman, T.C.; Spears, D.L.; Manfra, M.J. High thermoelectric figures of merit in PbTe quantum wells. J. Electron. Mater. 1996, 25, 1121–1127. [Google Scholar] [CrossRef]
- Sun, X.; Cronin, S.B.; Liu, J.; Wang, K.L.; Koga, T.; Dresselhaus, M.S.; Chen, G. Experimental study of the effect of the quantum well structures on the thermoelectric figure of merit in Si/Si1-xGex system. In Proceedings of the IEEE 18th International Conference Thermoelectrics, Baltimore, MD, USA, 29 August–2 September 1999; pp. 652–655. [Google Scholar]
- Kim, J.; Lee, S.; Brovman, Y.M.; Kim, P.; Lee, W. Diameter-dependent thermoelectric figure of merit in single-crystalline Bi nanowires. Nanoscale 2015, 7, 5053–5059. [Google Scholar] [CrossRef]
- Cheung, C.L.; Kurtz, A.; Park, H.; Lieber, C.M. Diameter-controlled synthesis of carbon nanotubes. J. Phys. Chem. B 2002, 106, 2429–2433. [Google Scholar] [CrossRef]
- Thurakitseree, T.; Kramberger, C.; Zhao, P.; Aikawa, S.; Harish, S.; Chiashi, S.; Einarsson, E.; Maruyama, S. Diameter-controlled and nitrogen-doped vertically aligned single-walled carbon nanotubes. Carbon 2012, 50, 2635–2640. [Google Scholar] [CrossRef]
- Saito, R.; Nugraha, A.R.T.; Hasdeo, E.H.; Hung, N.T.; Izumida, W. Electronic and optical properties of single wall carbon nanotubes. In Single-Walled Carbon Nanotubes; Springer: Berlin, Germany, 2019; pp. 165–188. [Google Scholar]
- Small, J.P.; Perez, K.M.; Kim, P. Modulation of thermoelectric power of individual carbon nanotubes. Phys. Rev. Lett. 2003, 91, 256801. [Google Scholar] [CrossRef]
- Hone, J.; Ellwood, I.; Muno, M.; Mizel, A.; Cohen, M.L.; Zettl, A.; Rinzler, A.G.; Smalley, R.E. Thermoelectric power of single-walled carbon nanotubes. Phys. Rev. Lett. 1998, 80, 1042. [Google Scholar] [CrossRef]
- Sumanasekera, G.U.; Adu, C.K.W.; Fang, S.; Eklund, P.C. Effects of gas adsorption and collisions on electrical transport in single-walled carbon nanotubes. Phys. Rev. Lett. 2000, 85, 1096. [Google Scholar] [CrossRef] [PubMed]
- Vavro, J.; Llaguno, M.C.; Satishkumar, B.C.; Luzzi, D.E.; Fischer, J.E. Electrical and thermal properties of C 60-filled single-wall carbon nanotubes. Appl. Phys. Lett. 2002, 80, 1450–1452. [Google Scholar] [CrossRef]
- Zhou, W.; Vavro, J.; Nemes, N.M.; Fischer, J.E.; Borondics, F.; Kamaras, K.; Tanner, D.B. Charge transfer and Fermi level shift in p-doped single-walled carbon nanotubes. Phys. Rev. B 2005, 71, 205423. [Google Scholar] [CrossRef]
- Yu, C.; Shi, L.; Yao, Z.; Li, D.; Majumdar, A. Thermal conductance and thermopower of an individual single-wall carbon nanotube. Nano Lett. 2005, 5, 1842–1846. [Google Scholar] [CrossRef] [PubMed]
- Nonoguchi, Y.; Ohashi, K.; Kanazawa, R.; Ashiba, K.; Hata, K.; Nakagawa, T.; Adachi, C.; Tanase, T.; Kawai, T. Systematic conversion of single walled carbon nanotubes into n-type thermoelectric materials by molecular dopants. Sci. Rep. 2013, 3, 3344. [Google Scholar] [CrossRef]
- Nakai, Y.; Honda, K.; Yanagi, K.; Kataura, H.; Kato, T.; Yamamoto, T.; Maniwa, Y. Giant Seebeck coefficient in semiconducting single-wall carbon nanotube film. Appl. Phys. Express 2014, 7, 025103. [Google Scholar] [CrossRef]
- Piao, M.; Joo, M.K.; Na, J.; Kim, Y.J.; Mouis, M.; Ghibaudo, G.; Roth, S.; Kim, W.Y.; Jang, H.K.; Kennedy, G.P.; et al. Effect of intertube junctions on the thermoelectric power of monodispersed single walled carbon nanotube networks. J. Phys. Chem. C 2014, 118, 26454–26461. [Google Scholar] [CrossRef]
- Zhou, W.; Fan, Q.; Zhang, Q.; Li, K.; Cai, L.; Gu, X.; Yang, F.; Zhang, N.; Xiao, Z.; Chen, H.; et al. Ultrahigh-power-factor carbon nanotubes and an ingenious strategy for thermoelectric performance evaluation. Small 2016, 12, 3407–3414. [Google Scholar] [CrossRef]
- Norton-Baker, B.; Ihly, R.; Gould, I.E.; Avery, A.D.; Owczarczyk, Z.R.; Ferguson, A.J.; Blackburn, J.L. Polymer-free carbon nanotube thermoelectrics with improved charge carrier transport and power factor. ACS Energy Lett. 2016, 1, 1212–1220. [Google Scholar] [CrossRef]
- Nonoguchi, Y.; Nakano, M.; Murayama, T.; Hagino, H.; Hama, S.; Miyazaki, K.; Matsubara, R.; Nakamura, M.; Kawai, T. Simple salt-coordinated n-type nanocarbon materials stable in air. Adv. Funct. Mater. 2016, 26, 3021–3028. [Google Scholar] [CrossRef]
- Zhou, W.; Fan, Q.; Zhang, Q.; Cai, L.; Li, K.; Gu, X.; Yang, F.; Zhang, N.; Wang, Y.; Liu, H.; et al. High-performance and compact-designed flexible thermoelectric modules enabled by a reticulate carbon nanotube architecture. Nat. Commun. 2017, 8, 14886. [Google Scholar] [CrossRef] [PubMed]
- Blackburn, J.L.; Kang, S.D.; Roos, M.J.; Norton-Baker, B.; Miller, E.M.; Ferguson, A.J. Intrinsic and extrinsically limited thermoelectric transport within semiconducting single-walled carbon nanotube networks. Adv. Electron. Mater. 2019, 28, 1800910. [Google Scholar] [CrossRef]
- Nakashima, Y.; Nakashima, N.; Fujigaya, T. Development of air-stable n-type single-walled carbon nanotubes by doping with 2-(2-methoxyphenyl)-1, 3-dimethyl-2, 3-dihydro-1H-benzo[d] imidazole and their thermoelectric properties. Synth. Met. 2017, 225, 76–80. [Google Scholar] [CrossRef]
- Samsonidze, G.G. Photophysics of Carbon Nanotubes. Ph.D. Thesis, MIT, Cambridge, MA, USA, 2006. [Google Scholar]
- Saito, R.; Sato, K.; Oyama, Y.; Jiang, J.; Samsonidze, G.G.; Dresselhaus, G.; Dresselhaus, M.S. Cutting lines near the Fermi energy of single-wall carbon nanotubes. Phys. Rev. B 2005, 72, 153413. [Google Scholar] [CrossRef]
- Nugraha, A.R.T. Coherent Phonon Spectroscopy of Carbon Nanotubes and Graphene. Ph.D. Thesis, Tohoku University, Sendai, Miyagi, Japan, 2013. [Google Scholar]
- Saito, R.; Dresselhaus, G.; Dresselhaus, M.S. Trigonal warping effect of carbon nanotubes. Phys. Rev. B 2000, 61, 2981. [Google Scholar] [CrossRef]
- Hung, N.T.; Nugraha, A.R.T.; Saito, R. Universal curve of optimum thermoelectric figures of merit for bulk and low-dimensional semiconductors. Phys. Rev. Appl. 2018, 9, 024019. [Google Scholar] [CrossRef]
- Yanagi, K.; Kanda, S.; Oshima, Y.; Kitamura, Y.; Kawai, H.; Yamamoto, T.; Takenobu, T.; Nakai, Y.; Maniwa, Y. Tuning of the thermoelectric properties of one-dimensional material networks by electric double layer techniques using ionic liquids. Nano Lett. 2014, 14, 6437–6442. [Google Scholar] [CrossRef]
- Goldsmid, H.J.; Sharp, J.W. Estimation of the thermal band gap of a semiconductor from Seebeck measurements. J. Electron. Mater. 1999, 28, 869–872. [Google Scholar] [CrossRef]
- Stradling, R.A.; Wood, R.A. The temperature dependence of the band-edge effective masses of InSb, InAs and GaAs as deduced from magnetophonon magnetoresistance measurements. J. Phys. C Solid State Phys. 1970, 3, L94. [Google Scholar] [CrossRef]
- Pei, Y.; Shi, X.; LaLonde, A.; Wang, H.; Chen, L.; Snyder, G.J. Convergence of electronic bands for high performance bulk thermoelectrics. Nature 2011, 473, 66–69. [Google Scholar] [CrossRef] [PubMed]
- Kataura, H.; Kumazawa, Y.; Maniwa, Y.; Umezu, I.; Suzuki, S.; Ohtsuka, Y.; Achiba, Y. Optical properties of single-wall carbon nanotubes. Synth. Met. 1999, 103, 2555–2558. [Google Scholar] [CrossRef]
- Weisman, R.B.; Bachilo, S.M. Dependence of optical transition energies on structure for single-walled carbon nanotubes in aqueous suspension: an empirical Kataura plot. Nano Lett. 2003, 3, 1235–1238. [Google Scholar] [CrossRef]
- Mateeva, N.; Niculescu, H.; Schlenoff, J.; Testardi, L.R. Correlation of Seebeck coefficient and electric conductivity in polyaniline and polypyrrole. J. Appl. Phys. 1998, 83, 3111–3117. [Google Scholar] [CrossRef]
- Heikes, R.R.; Ure, R.W. Thermoelectricity: Science and Engineering; Interscience Publishers: New York, NY, USA, 1961. [Google Scholar]
- Chandra, B.; Afzali, A.; Khare, N.; El-Ashry, M.M.; Tulevski, G.S. Stable charge-transfer doping of transparent single-walled carbon nanotube films. Chem. Mater. 2010, 22, 5179–5183. [Google Scholar] [CrossRef]
- Jones, W.; March, N.H. Theoretical Solid State Physics; Courier Corporation: North Chelmsford, MA, USA, 1985; Volume 35. [Google Scholar]
- Matula, R.A. Electrical resistivity of copper, gold, palladium, and silver. J. Phys. Chem. Ref. Data 1979, 8, 1147–1298. [Google Scholar] [CrossRef]
- Hone, J.; Whitney, M.; Piskoti, C.; Zettl, A. Thermal conductivity of single-walled carbon nanotubes. Phys. Rev. B 1999, 59, R2514. [Google Scholar] [CrossRef]
- Zhao, X.; Huang, C.; Liu, Q.; Smalyukh, I.I.; Yang, R. Thermal conductivity model for nanofiber networks. J. Appl. Phys. 2018, 123, 085103. [Google Scholar] [CrossRef]
- Kittel, C. Introduction to Solid State Physics; Wiley: New York, NY, USA, 1976; Volume 8. [Google Scholar]
- Pop, E.; Mann, D.; Wang, Q.; Goodson, K.; Dai, H. Thermal conductance of an individual single-wall carbon nanotube above room temperature. Nano Lett. 2006, 6, 96–100. [Google Scholar] [CrossRef]
- Chen, S.; Wu, Q.; Mishra, C.; Kang, J.; Zhang, H.; Cho, K.; Cai, W.; Balandin, A.A.; Ruoff, R.S. Thermal conductivity of isotopically modified graphene. Nat. Mater. 2012, 11, 203. [Google Scholar] [CrossRef]
- Klemens, P.G. Thermal conductivity and lattice vibrational modes. Sol. Stat. Phys. 1958, 7, 1–98. [Google Scholar]
- Lindsay, L.; Broido, D.A.; Mingo, N. Flexural phonons and thermal transport in graphene. Phys. Rev. B 2010, 82, 115427. [Google Scholar] [CrossRef]
- Saito, R.; Mizuno, M.; Dresselhaus, M.S. Ballistic and diffusive thermal conductivity of graphene. Phys. Rev. Appl. 2018, 9, 024017. [Google Scholar] [CrossRef]
- Lindsay, L.; Broido, D.A.; Mingo, N. Diameter dependence of carbon nanotube thermal conductivity and extension to the graphene limit. Phys. Rev. B 2010, 82, 161402. [Google Scholar] [CrossRef]
- Zhang, H.L.; Li, J.F.; Zhang, B.P.; Yao, K.F.; Liu, W.S.; Wang, H. Electrical and thermal properties of carbon nanotube bulk materials: experimental studies for the 328–958 K temperature range. Phys. Rev. B 2007, 75, 205407. [Google Scholar] [CrossRef]
- Mistry, K.S.; Larsen, B.A.; Bergeson, J.D.; Barnes, T.M.; Teeter, G.; Engtrakul, C.; Blackburn, J.L. n-Type transparent conducting films of small molecule and polymer amine doped single-walled carbon nanotubes. ACS Nano 2011, 5, 3714–3723. [Google Scholar] [CrossRef]
- Cheng, X.; Wang, X.; Chen, G. A convenient and highly tunable way to n-type carbon nanotube thermoelectric composite film using common alkylammonium cationic surfactant. J. Mater. Chem. A 2018, 6, 19030–19037. [Google Scholar] [CrossRef]
- Shimizu, S.; Iizuka, T.; Kanahashi, K.; Pu, J.; Yanagi, K.; Takenobu, T.; Iwasa, Y. Thermoelectric detection of multi-subband density of states in semiconducting and metallic single-walled carbon nanotubes. Small 2016, 12, 3388–3392. [Google Scholar] [CrossRef]
- Hone, J.; Llaguno, M.C.; Nemes, N.M.; Johnson, A.T.; Fischer, J.E.; Walters, D.A.; Casavant, M.J.; Schmidt, J.; Smalley, R.E. Electrical and thermal transport properties of magnetically aligned single wall carbon nanotube films. Appl. Phys. Lett. 2000, 77, 666–668. [Google Scholar] [CrossRef]
- Chalopin, Y.; Volz, S.; Mingo, N. Upper bound to the thermal conductivity of carbon nanotube pellets. J. Appl. Phys. 2009, 105, 084301. [Google Scholar] [CrossRef]
- Prasher, R.S.; Hu, X.J.; Chalopin, Y.; Mingo, N.; Lofgreen, K.; Volz, S.; Cleri, F.; Keblinski, P. Turning carbon nanotubes from exceptional heat conductors into insulators. Phys. Rev. Lett. 2009, 102, 105901. [Google Scholar] [CrossRef] [PubMed]
- Kulbachinskii, V.A.; Kytin, V.G.; Kudryashov, A.A.; Tarasov, P.M. Thermoelectric properties of Bi2Te3, Sb2Te3 and Bi2Se3 single crystals with magnetic impurities. J. Solid State Chem. 2012, 193, 47–52. [Google Scholar] [CrossRef]
- Jin, Q.; Jiang, S.; Zhao, Y.; Wang, D.; Qiu, J.; Tang, D.M.; Tan, J.; Sun, D.M.; Hou, P.X.; Chen, X.Q.; et al. Flexible layer-structured Bi2Te3 thermoelectric on a carbon nanotube scaffold. Nat. Mater. 2019, 18, 62. [Google Scholar] [CrossRef] [PubMed]
- Wang, H.; Hsu, J.H.; Yi, S.I.; Kim, S.L.; Choi, K.; Yang, G.; Yu, C. Thermally driven large n-type voltage responses from hybrids of carbon nanotubes and poly (3, 4-ethylenedioxythiophene) with tetrakis (dimethylamino) ethylene. Adv. Mater. 2015, 27, 6855–6861. [Google Scholar] [CrossRef] [PubMed]
© 2019 by the authors. Licensee MDPI, Basel, Switzerland. This article is an open access article distributed under the terms and conditions of the Creative Commons Attribution (CC BY) license (http://creativecommons.org/licenses/by/4.0/).