Article

Investigating the Impact of E-Mobility on the Electrical Power Grid Using a Simplified Grid Modelling Approach

1
Chair of Energy Network Technology, Montanuniversitaet Leoben, Franz-Josef Straße 18, A-8700 Leoben, Austria
2
Institute of Physics, Montanuniversitaet Leoben, Franz-Josef Straße 18, A-8700 Leoben, Austria
*
Author to whom correspondence should be addressed.
Energies 2020, 13(1), 39; https://doi.org/10.3390/en13010039
Submission received: 25 November 2019 / Revised: 11 December 2019 / Accepted: 18 December 2019 / Published: 19 December 2019

Abstract

:
To achieve climate goals, it is necessary to decarbonise the transport sector, which requires an immediate changeover to alternative power sources (e.g., battery powered vehicles). This change will lead to an increase in the demand for electrical energy, which will cause additional stress on power grids. It is therefore necessary to evaluate energy and power requirements of a future society using e-mobility. Therefore, we present a new approach to investigate the influence of increasing e-mobility on a distribution grid level. This includes the development of a power grid model based on a cellular approach, reducing computation efforts, and allowing time and spatially resolved grid stress analysis based on different load and renewable energy source scenarios. The results show that by using the simplified grid model at least seven times, more scenarios can be calculated in the same time. In addition, we demonstrate the capability of this novel approach by analysing the influence of different penetrations of e-mobility on the grid load using a case study, which is calculated using synthetic charging load profiles based on a real-life mobility data. The results from this case study show an increase on line utilisations with increasing e-mobility and the influence of producers at the same connection point as e-mobility.

1. Introduction

In order to reduce the impact of climate change, it is necessary to drastically reduce the emission of greenhouse gases. Recent studies have shown that to keep the chance of global warming exceeding a 2 °C threshold below 25%, the cumulative globally emitted CO2 equivalent has to stay below 1000 gigatons (from 2000 to 2050) [1,2]. To achieve this goal, it is essential to decarbonise various aspects of daily life. The transportation sector for example is responsible for a large share of the total energy consumption. In Austria, for instance, its share is as high as 25% of the gross inland consumption (~400 TWh per year) [3]. The decarbonisation of the transport sector, which requires an immediate changeover to alternative power sources (e.g., battery or hydrogen powered vehicles) is a necessary step in the right direction. Although, the traffic related new registrations of private vehicles show an increasing share of alternative drive systems, around 90% are still using technology based on fossil fuels [4]. The change to alternative drive systems will be accompanied by an increasing demand of electrical energy, which must be satisfied by renewable sources in order to achieve the decarbonisation targets. The additional energy demand of electric vehicles (EVs) in combination with the decentralised energy production from renewable energy source (RES) can have challenging effects on the power grid (e.g., a reduction of grid stability and reduced security of supply) [5,6,7,8]. The analysis of the impact of a large amount of EVs as well as effects caused by an increasing amount of (decentralised) RES on the power grid is necessary in order to optimise grid expansion projects and to avoid grid instability.
To estimate future charging demands, a variety of different modelling approaches have been published [9,10,11]. Most of these established approaches depend on representative data or an accurate model describing the behaviour of EV drivers. The available models are mainly based on two different data sets: data measured directly at available charging stations (energy demand per charging process, power measurements at charging station level, etc. [12,13]) or statistical data representing todays driving behaviour. Gnann et al. [14], for example, used real driving data from fast charging stations from Norway and Sweden to analyse the variation of charging behaviour throughout the day of different EV users. While Fischer et al. [9] and Godde et al. [15] used statistical data based on the German study “Mobilität in Deutschland 2008” [16]. Another common data set [17,18,19,20] is the National Household Travel Survey (NHTS) [21]. While charging stations are usually not available nationwide, and thus determine the charging behaviour of EV drivers selectively, the statistical mobility pattern includes a large number of drivers with combustion engines. Both data sets have obvious drawbacks, which should be kept in mind when interpreting the modelled charge load profiles and their further use. Because of the unevenly distributed charging stations (accumulation in metropolitan areas or along main traffic routes) the data measured there might not be representative for an increased share of EVs [22,23]. The statistical data on the other hand mostly refers to today’s driving behaviour and thus also includes mostly vehicles with combustion engines. This implicitly means that those modules consider the e-mobility driver behaviour [16,24] equal to the behaviour of internal combustion engine (ICE) driver. [4] To analyse the impact of an increasing share of EVs on the power grid, modelling the driver behaviour alone is not sufficient. Only by taking into account the user behaviour as well as the charging process, a detailed forecast of the grid load is possible [25]. A common method is the use of trip chains to model the charging profiles based on statistical data [17,18,26].
Modelling the charging process itself is a complicated task and is influenced by different variables such as battery type, charging power, single- or multi-phase charging, and user behaviour. A variety of different stochastic approaches and techniques have been published: probabilistic approaches [27,28,29,30], Monte-Carlo [11,31,32], and Markov Chain [11,33,34].
By estimating the future charging demand for a defined area, the influence of EVs and decentralized energy production on the guarantee of security of supply can be examined, based on load flow calculations for a given power grid. Load flow calculations are based on an iterative solution procedure and scale with the size and complexity of the investigated power grid. As a result, the time resolved analysis (e.g., 15-min values) of a representative grid for a long simulation period is time-consuming. Therefore, usually only two specific weeks (summer and winter)—each with minimum and maximum load—are used in order to be able to make statements about possible grid constrains [35]. In previous studies, representative weeks or months are considered in order to keep the required simulation effort as manageable as possible [5,36,37]. In addition, Ul-Haq et al. [31], for example, observe the seasonal effects for three different months respectively for weekdays and weekends. In contrast, Luo et al. [25] observed the seasonal effects by simulation and analysis of eight typical days representing the planning year. For a more precise analysis of seasonal effects, longer observation periods—ideally one year—are necessary. In order to investigate the guarantee of security of supply, the charging processes and their accumulation at grid connection points must be analysed regarding the temporal and local occurrence of charging peaks, followed by the determination of grid loads caused by this. This information is used for the investigation subsequent implementation scenarios.
In this paper, we present a new approach for an efficient and rapid development of a simplified power grid model, based on a cellular approach. The cellular approach described in this manuscript is based on a method for load flow calculations (gas, heat, electricity) of a multi-energy system published in Vopava et al. [35] and Böckl et al. [38]. In this cellular approach, the grid infrastructure is structured in cells to simplify the complex grid structure and to reduce the calculation time. In the work by Vopava et al. [35], an existing cell classification was assumed for the development of a grid model. This cell classification focused mainly on the geographic topology of the area to be investigated. The methodology for the development of a grid model presented in this paper focuses on a cell division that considers the grid topology in order to increase accuracy. In a case study, we also show the use of such a model for a simple spatial and temporal power grid analysis. For demonstration purposes, a distribution grid based on a medium-sized city in Austria is used, consisting of an inner-city area with meshed and ring topology as well as a rural area with stubs. The reduced simulation times by using this model allows load flow calculations with annual load profiles and thus easily identify and analyse seasonal effects. Due to the integration of complex consumers (e.g., e-mobility) and producers (RES), advanced stress analysis is necessary. Calculation of annual load profiles will therefore become more and more important, since the analysis of specific weeks or worst-case scenarios will no longer be sufficient. The approach presented in this paper is one example for the implementation of annual load profiles by a combination of an improved cellular approach and state of the art load flow calculations. In addition, due to the reduced simulation times, a large number of different scenarios (different penetration of e-mobility, variation of charging power or charging strategy, etc.) can be rapidly analysed and compared. To illustrate the impact of an increasing grid load of future e-mobility, this paper also includes, among others, the modelling of charging curves in combination with the cellular approach under consideration of the user behaviour of EV-drivers. Finally, the results of the reduction of the calculation time that can be achieved by using the simplified grid model and the results of the load flow calculations of the case study are presented.

2. Methods

The focus of this paper is the development and evaluation of simplified distribution grid models based on a cellular approach. Therefore, this section presents the necessary methodology and discusses the accuracy of the model. Furthermore, the determination of load and production profiles and the determination of synthetic charging load profiles required in the case study are explained.

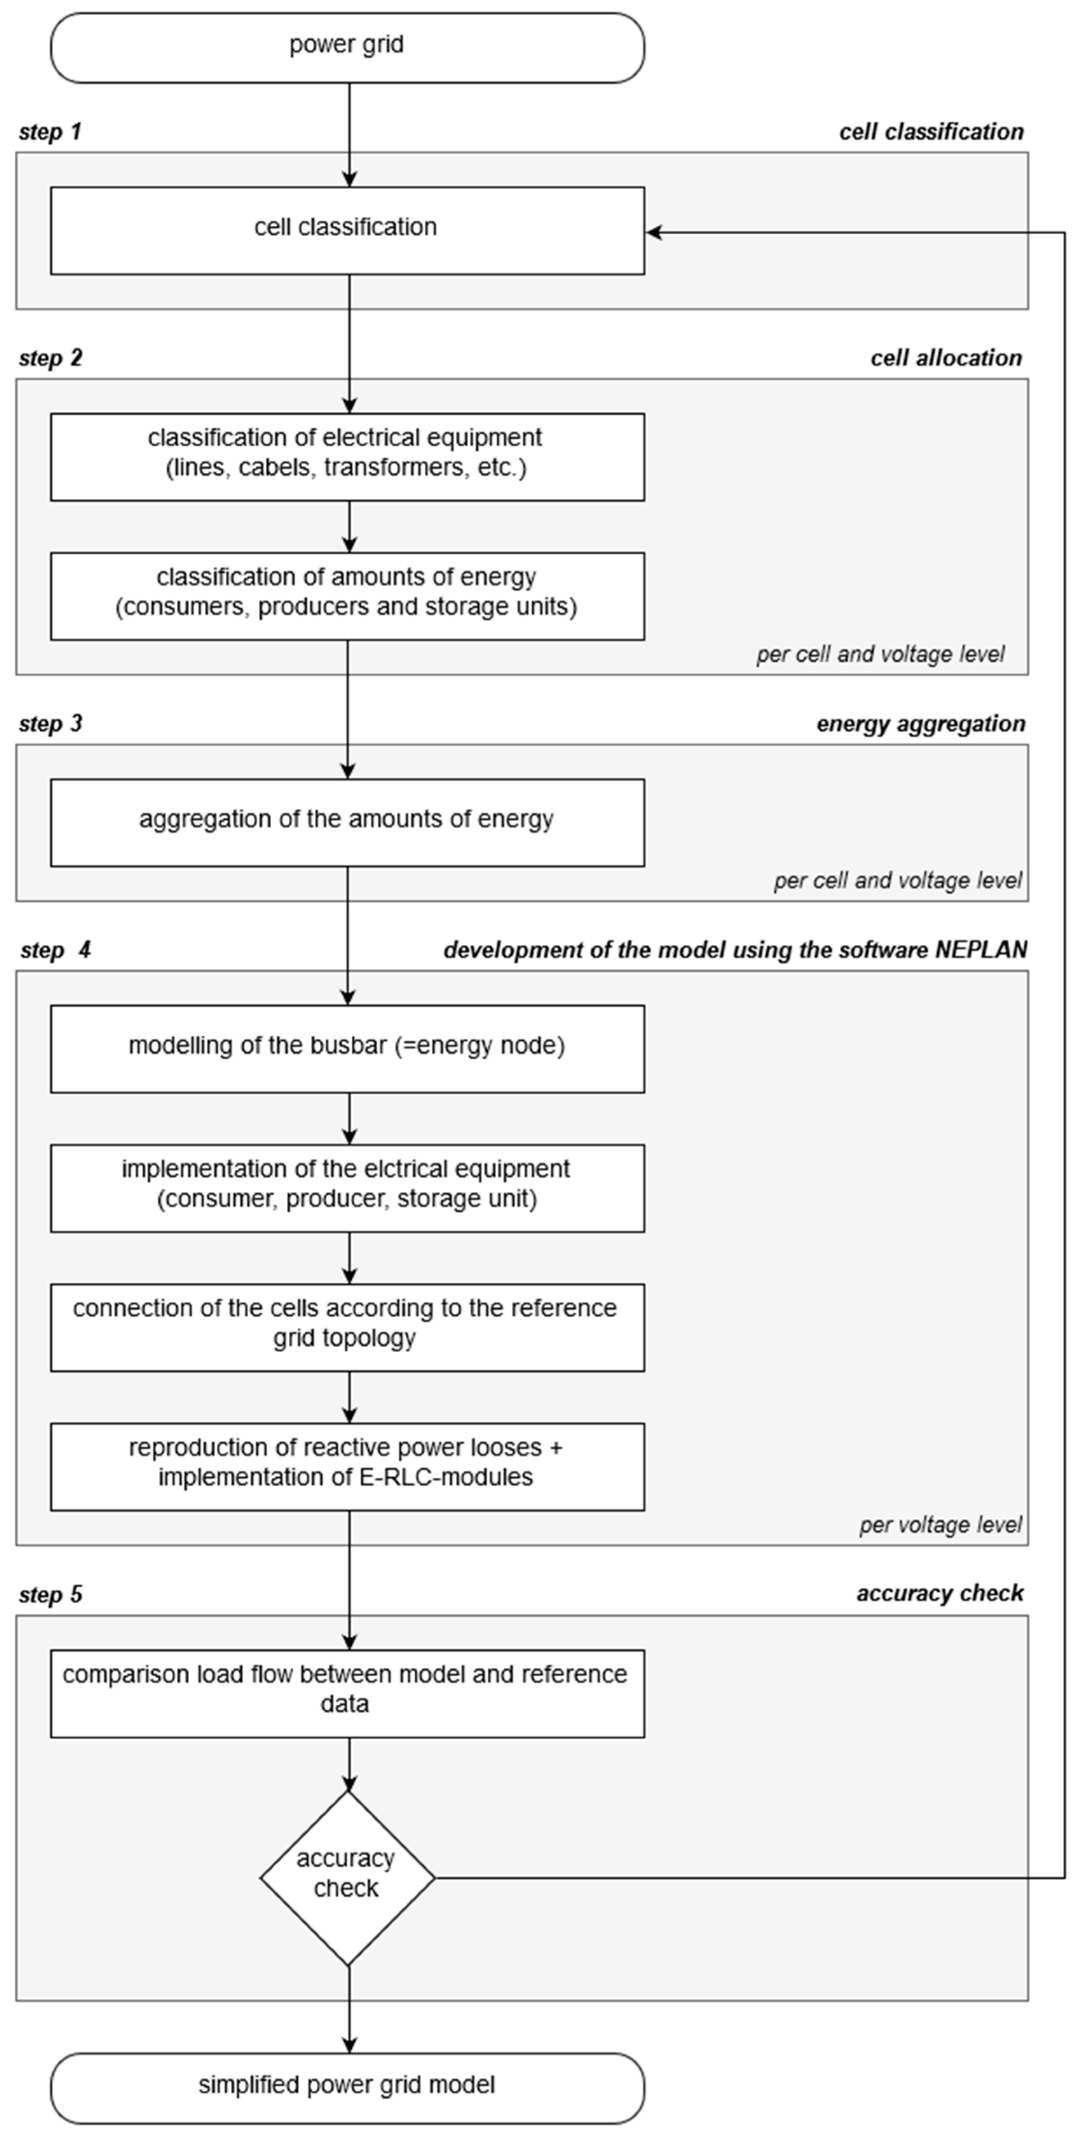
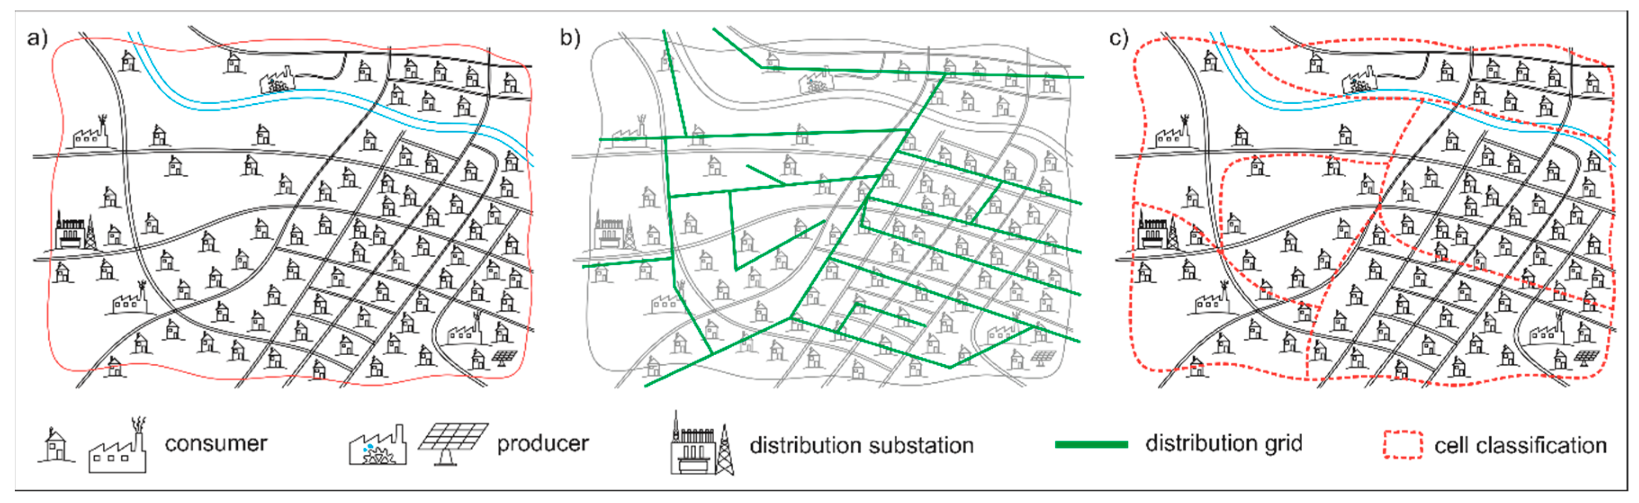
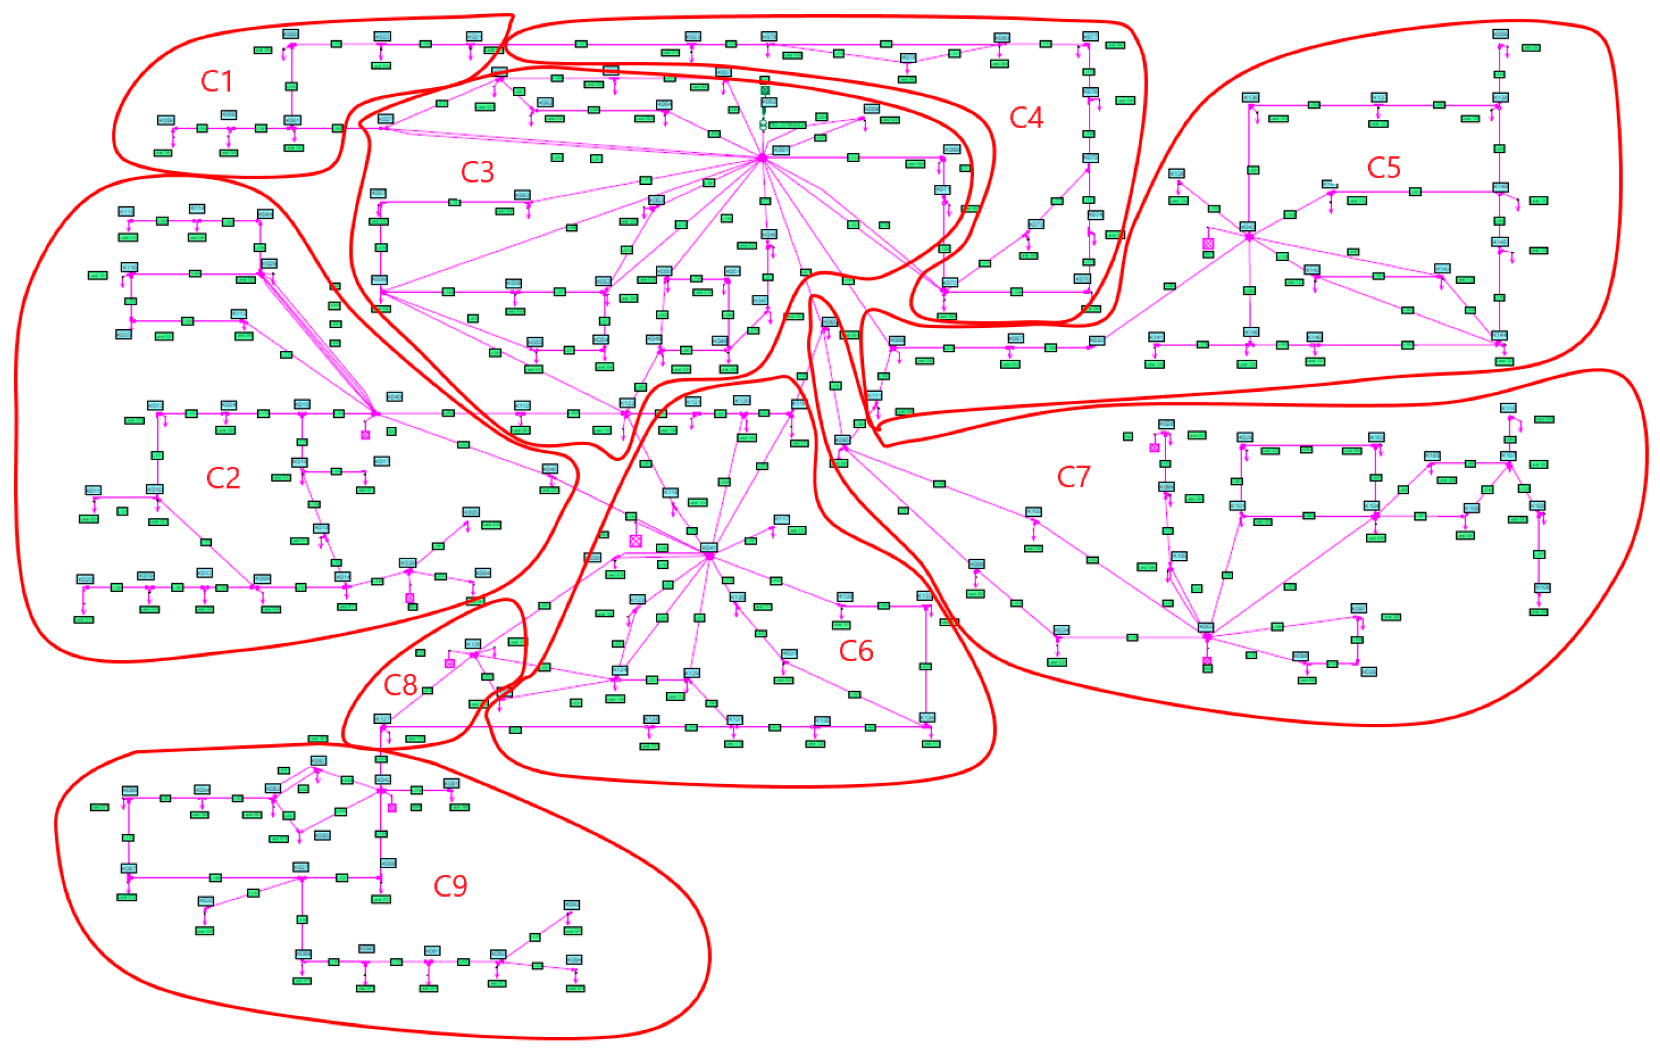
2.1. Development of Simplified Distribution Grid Models Based on a Cellular Approach

The applied cellular approach described in this manuscript is based on a method designed for multi energy system load flow calculation (gas, heat, electricity) [35,38]. A major advantage of the method shown here is the possibility of grid simplifications, decreasing the computation time and therefore allowing an increased time resolution and/or simulation time frames for load flow calculations. Nevertheless, it has to be mentioned, that simplifications always represent a compromise between accuracy and calculation time [38,39,40].
The development of simplified distribution grid models with the cellular approach consists of five steps. Figure 1 schematically shows this development using one voltage level, which can be easily expanded to multiple voltage levels by repeating steps 2 to 4 separately for each voltage level.
In step 1, the cell classification is done according to the grid topology and the topography of the investigated area. This will be explained in more detail using an artificial sample area (Figure 2a) with Figure 2b showing the original distribution grid (in the following called reference grid). The cell classification is done by using a geographic information system (GIS) software, QGIS [41], with focus on the grid topology of the reference grid. In addition to the grid topology, topographic conditions are used to draw the cell boundaries: a river separating an area into different parts is just one example for such “natural” cell boundaries. Concerning the accuracy of the simplified grid model, the grid topology has a way bigger influence than the geographic topology related cell size. Therefore, the size of the cells or the aggregated amounts of energy per cell is not taken into account during this classification step. In order to achieve the highest possible accuracy of the model, the following guidelines have been proven advantageous:
  • Consideration of grid topology before geographic topology.
  • Resulting grid model should correspond to a radial grid.
  • Prevention of closed ring structure (use of lines with normally open points to connect two cells with each other).
  • Existing rings in the reference grid should be combined in one cell.
The resulting cell classification of the artificial sample area is shown in Figure 2c.
In step 2, the cell allocation is done for each cell and voltage level in the power grid. This means that the electrical equipment (transformers, lines, grid nodes, busbars etc.) is allocated to the cells, based on cell classification performed in step 1. In addition, the amount of energy, available measurement (e.g., the load profiles of the individual consumers), and producers or storage units are identified and assigned to the cells.
In step 3, the assigned consumer, producers, and storage units within a cell are separately aggregated into an energy node (Figure 3). This means, for example, that the amounts of energy of the consumers within a cell are added up to a total energy amount. Available measurement data (e.g., load profile for a hydropower plant), which have already been measured in advance or are provided by energy suppliers, companies etc., or time resolved load profiles are also aggregated into these energy nodes. The energy nodes are located in the geographical cell centre and correspond to virtual busbars for the grid model.
In step 4, the cell-based power grid model is designed using the commercially available software NEPLAN 5.5.6 [42]. The software NEPLAN is a high end-power system analysis tool for electricity, gas, water, and district heating networks. It is used in transmission, distribution, generation, industry, renewable energy systems and smart grid applications. If this grid model contains more than one voltage level, the following sub-steps must be repeated for each voltage level. First, for each energy node a busbar is inserted into the grid model. Second, the electrical equipment (transformers, consumers, generators, storage units, etc.) and their corresponding time-resolved profile of each cell is integrated into the grid model and connected to the associated busbars. Third, the busbars are connected according to the grid topology of the reference grid. As a result, the cells are connected with each other, allowing power export or import across their cell boundaries. Such corresponding lines are called “interconnectors”. Lines within a cell in the reference grid structure are not part of the simplified grid model and are therefore not inserted in the model as lines. These elements are called “missing elements”. “Interconnectors” and “missing elements” of a schematic distribution grid are shown in Figure 4a. Figure 4b illustrates the energy nodes of the geographically located power grid model and their connection according to the reference grid.
As a result of the procedure of the interconnector implementation, connections may occur in the simplified grid model that are not existent in the reference grid (see Figure 5). The development of the simplified grid model based on the cell division of the reference grid of Figure 5a shows that lines L1 and L2 are connected in the grid model by the energy node (see Figure 5b). Since these are not interconnected in the reference grid, load flow shifts would occur between the reference grid and the grid model, resulting in inaccuracies. To counteract these inaccuracies, Figure 5c suggests choosing a new cell boundary to prevent these connections from developing. As shown in Figure 5d, the new cell boundary divides the original cell into two cells and the lines L1 and L2 are no longer connected.
Figure 6 shows the reference grid used as a basis for demonstrating the capability of this approach to investigate the influence of increasing e-mobility on a simplified cell-based grid model. This grid is based on an actual 5 kV power grid of a medium sized Austrian city. The 148 nodes of the reference grid are aggregated into nine energy nodes following the previously described procedure. The resulting simplified grid model is shown in Figure 7. Due to the reduced number of nodes in the model, the duration of the load flow calculations can be reduced by at least a factor seven compared to the reference grid.
In addition to the best possible choice of cell division (Figure 5), the effects of the “missing elements” must also be discussed. Neglecting the “missing elements” can lead to high deviations between the load flows of the reference grid and those of the simplified grid model. These deviations are mainly caused by losses in “missing elements”. The active power to be transmitted in the line leads to ohmic losses due to the line resistance. These ohmic losses account for less than 1% of the active power to be transmitted. As a result, the active power losses of the “missing elements” have a very small influence on the accuracy of the load flows in the “interconnectors”. Therefore, the accuracy of the active power flows can be regarded as sufficiently accurate, even without consideration of the ohmic losses in the “missing elements”. The reactive power losses caused by the line inductance and capacitance usually correspond to the reactive power to be transmitted in the line. Therefore, neglecting the reactive power losses of the “missing elements” leads to significant errors in the load flows of the “interconnectors”. To reduce these errors, the capacitive and inductive losses generated in the “missing elements” have to be considered in the model.
The losses occurring in a line are defined by the line parameters (active and reactive resistances) and depend on the power (voltage and current) to be transmitted. Therefore, for the consideration of the reactive power losses of the “missing elements”, it is necessary to use elements that are also load dependent. In addition, it must be an element that can be attached to the respective energy node of the cell, since the compensation of load flows can only be affected via parameters of the nodes. This is based on the fact that the abort criterion of a load flow calculation according to the Newton-Raphson method represents the drop below an error limit for the deviations between the previously known node powers and the node powers calculated in the iteration. This means that by adding additional loads in the energy nodes, the reactive power losses of the “missing elements” can be combined independent of their topology and considered for further load flow calculations in a substitution element. For these reasons, E-RLC modules were implemented in the grid model.
To determine the parameters of the E-RLC module, the reactive power losses of the “missing elements” are determined by a load flow calculation of the reference grid and aggregated at cell level:
Q C e l l = i = 1 n Q l o s s e s , i .
The aggregated reactive power losses of the “missing elements” ( Q C e l l ) is used to determine the capacitive or inductive reactance ( X ) by:
Q C e l l = U _ 2 X ,
Q C e l l , c a p = U _ 2 X c a p ,
Q C e l l , i n d = U _ 2 X i n d ,
where U _ is the nominal voltage of the busbar. The capacitance ( C C o m p ) or inductivity ( L C o m p ) of each cell is calculated by:
C C o m p = Q C e l l , c a p j ω · U _ 2 ,
and
L C o m p = U _ 2 j ω · Q C e l l , i n d .
Then, E-RLC modules for each cell are inserted into the grid model and connected to the corresponding busbar. Each module consists of a resistance (R), an inductivity ( L C o m p ), and a capacitance ( C C o m p ) against ground (E) in series (Figure 8), with C C o m p and L C o m p being the determined capacitance and inductivity of the corresponding cell, respectively. Since the active power losses of the missing elements are not taken into account, the resistance values in the E-RLC module are set to 0.
Although the inductance of the E-RLC module is integrated into the grid model as a parallel parameter instead of a series parameter (substitute circuit: line), the increase in the accuracy of the model can be explained by the lower influence of the inductance on the line losses compared to the capacitance. This lower influence can be explained by the relationship between reactive power and inductance or capacitance. As can be seen from Equations (5) and (6), the inductance is directly proportional to the voltage, while the capacitance is indirectly proportional to the voltage.
By considering the capacitive or inductive losses of the “missing elements” within the cells, the accuracy of the reactive power in the “interconnectors” as well as the accuracy of the utilisation on these lines is increased. The accuracy improvement of the reactive power flows for selected “interconnectors” shown in Figure 9 was achieved by integrating the E-RLC modules. These results are based on load flow calculations for maximum load.
Comparing the deviation of the reactive power load flow for different lines with and without consideration of the reactive power losses of the “missing elements” (Table 1) shows that the implementation of E-RLC modules significantly reduces most deviations (Figure 9 and Table 1). Although all errors can be reduced, this model is not suitable for analyses of voltage drops at the grid nodes due to the remaining deviations of the reactive power load flows in some lines, and based on the fact that the reactive power has influence on the node voltage. Furthermore, the energy node is an aggregated grid node that contains the sum of all consumers and producers within a cell and has nothing in common with a real node from the reference grid. It has to be mentioned that the amount of “faulty lines” scales with the complexity and size of the power grid.
In step 5, the accuracy of the simplified model is analysed in two sub-steps. At first, the software NEPLAN is used to perform load flow calculations using the Newton-Raphson method for the highest possible load in the reference grid as well as for the cell-based grid model. In this first sub-step, the accuracy of the overall system is checked by comparing the slack bus of the grid model with the reference grid. Table 2 shows this comparison for the imported active power and reactive power as well as the active power and reactive power generated in the grid for the slack bus, based on data for the operating point of the maximum load. It can be seen that the relative deviations for imported and generated power is less than 2%. The deviations of the imported active and reactive power is mainly attributed to the deviations of the load flows in the lines. In total, these deviations influence the imported active and reactive power and lead to relative deviations of 0.89% and 1.60%.
In the second sub-step, the active and reactive power flow deviations between the grid model and the reference grid for the “interconnectors” and the transformers are compared. As already mentioned, the E-RCL modules can be used to reduce the deviations of the reactive power flows between the grid model and the reference grid, but these are still very high in individual cases (relative deviations of up to 200%). Figure 10 shows the absolute and relative deviations of the active power flows between grid model and reference grid. It can be seen that two lines have relative deviations of >50%, while the remaining lines have relative deviations of <15%. The four lines with the highest absolute deviations are L35_1, L37_1, L62_1, and L63_1.
To analyse the high deviations seen in lines L62_1 and L63_1, their position in the grid model and the reference grid must first be localised. As shown in Figure 7, the affected lines form a closed ring with the L23_1 line. This is the only closed ring in the grid model. While the active power load flow of line L62_1 in the grid model is smaller to the corresponding line in the reference grid, the active power load flow in line L63_1 is larger. Therefore, a load shift occurs due to the ring topology in the grid model. Although, the relative deviation is high in lines L62_1 and L63_1, absolute errors are in the same order of magnitude as other lines (see Table 3). While the active power flows for lines L35_1 and L37_1 are between 750 and 1500 kW, those of lines L62_1 and L63_1 are below 100 kW. This difference in the active power flow results in high relative deviations of 56% and 54% for the lines L62_1 and L63_1, respectively. For the lines, L35_1 and L37_1 the relative deviations are only 2% and 3%, respectively. For this reason, care should be taken during cell division to avoid ring structures in the grid model. The highest accuracy of the load flows in the grid model is achieved if the topology corresponds to a radial grid.
The deviation in lines L62_1 and L63_1 should be kept in mind when using the model to determine the increasing grid load with the integration of future e-mobility. As the simplified model always represents a compromise between accuracy and calculation time, no clear limits can be set to the accuracy of the model. Therefore, the accuracy of the model depends strongly on the desired application. If the defined accuracy of the model cannot be achieved, a detailed check is carried out and possible reasons for the deviations are investigated. The optimisation potential is examined with regard to changes in cell boundaries. However, this accuracy check is repeated until the desired accuracy is achieved.
Following steps 1 to 5 results in a simplified cell-based grid model representing the actual power grid and allows for time-resolved load flow calculations with annual load profiles in a short time. Once the model has been developed, it is possible to integrate electrical production potentials, charging stations for e-mobility and other elements that allow flexible use (heat pumps, power to heat systems, etc.). In addition to energy analysis (e.g., self-coverage), this approach also allows the determination of cells that are susceptible for grid instabilities. These cells can be analysed for the grid-related impact of a specific technology.

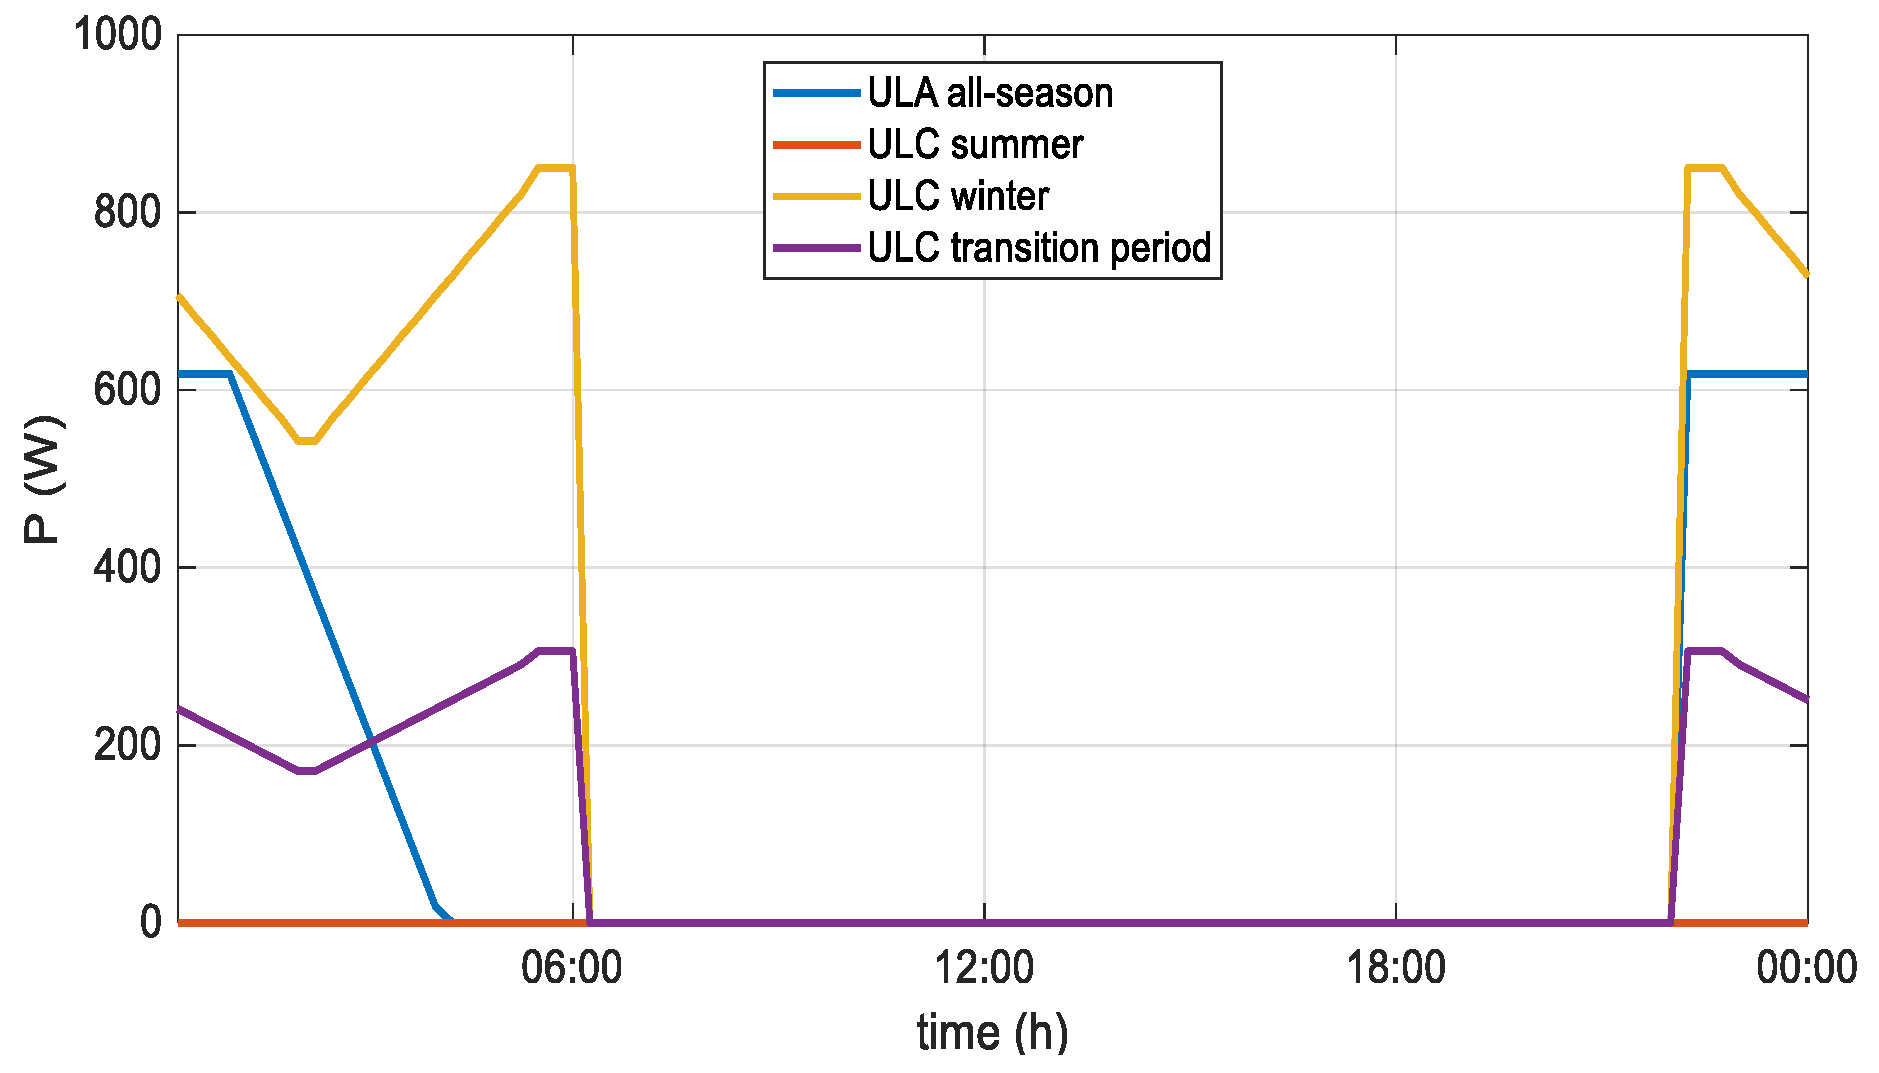
2.2. Determination of Load and Production Profiles

The load and production profiles used in this paper are either based on measured data or on the application of standard load profiles from the “Federal Association of the German Energy and Water Industries” (BDEW) [43] and synthetic load profiles from the Austrian regulation agency (e-control) [44].
Both types of profiles apply to consumers/producers with an annual consumption/production < 100,000 kWh or an installed load < 50 kW. These profiles are normalised to an annual consumption/production of 1000 kWh and are given as 15 min average power values over a day. The standard load profiles from the BDEW classify household, commercial and agricultural loads, with further subcategories being introduced for commercial and agricultural applications. All standard load profiles from the BDEW differ between nine characteristic days (three seasons and three days of the week). It has to be mentioned that these standard load profiles are only valid for a minimum number of households, because they do not take additional factors (job, people living in each household, etc.) into account, which can strongly influence the load profile of an individual household [45]. In case of a limited number of households (down to a single one), the “LoadProfileGenerator” according to Pflughardt [46,47] can be used to overcome this issue.
The synthetic load profiles provided by e-control can be used to model load profiles for intermittent power supplies (e.g., hot water storage and night storage heating systems) or public lighting, as well as production profiles for small producers (e.g., hydropower plant within the energy and power constraints mentioned above). It has to be mentioned that depending on the type of consumer and producer, the load profile shows different behaviour depending on the day and season. Figure 11 shows two synthetic load profiles provided by e-control, one for a hot water tank (ULA) and one for a night heat storage tank (ULC), both without day recharging. The ULA is only defined by one characteristic day. As a result, no distinction is made between season and day of the week. The ULC is defined by three characteristic days, which differ between seasons.
As previously mentioned, all consumers and producers are classified into cells and aggregated into energy nodes. The aggregation of the annual energy consumption and the annual energy production is carried out separately for the respective categories of the standard load profiles provided by BDEW [43] and the synthetic load profiles provided by e-control [44]. Based on the aggregated annual energy consumption/production, load and production profiles are determined for a selected simulation period. This simulation period can be selected individually and is used for all further modelling, calculations, and analyses. Following the modelling of the load and production profiles for the individual categories, all profiles of a cell are aggregated to form a sum load profile. This sum load profile is then implemented into the model via the energy nodes.

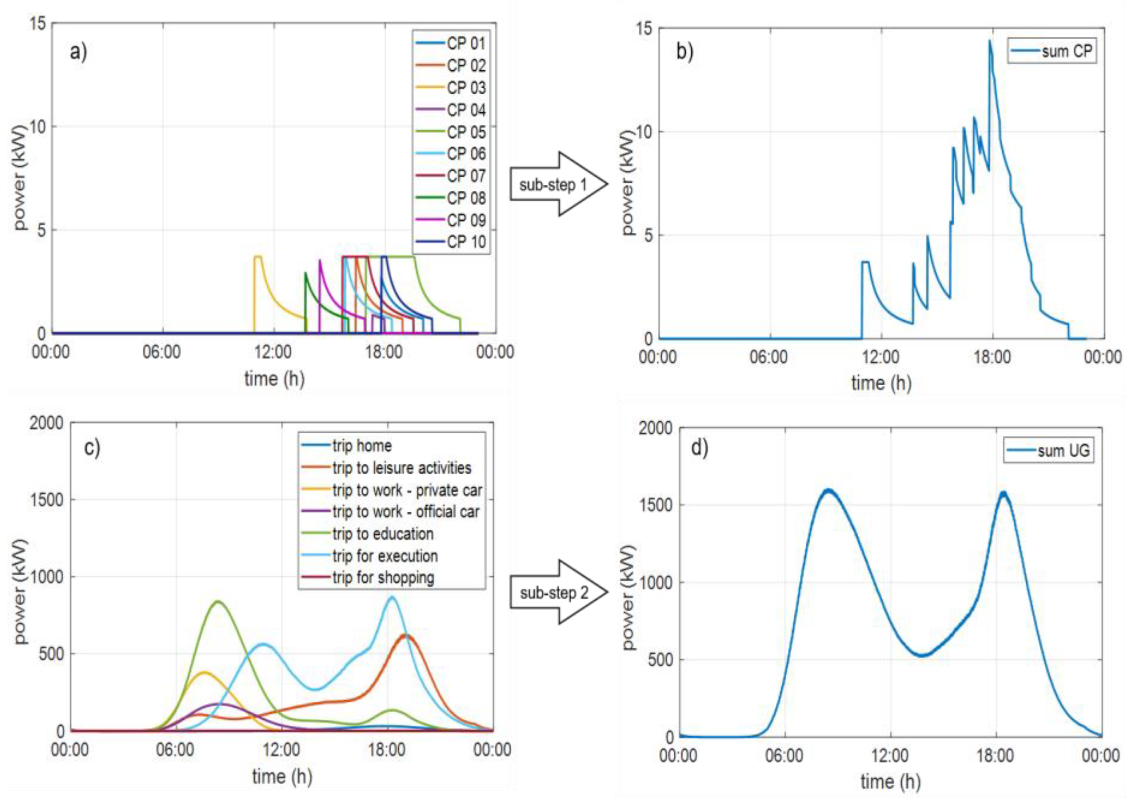
2.3. Determination of Synthetic Charging Load Profiles of Electric Vehicles

To analyse the impact of a large amount of EVs, the development of synthetic charging load profiles is necessary. The presented methodology for the development of this charging load profiles essentially consists of four steps Figure 12: (1) data preparation, (2) determination of cell and user group specific charging steps, (3) modelling of the charging curve, and (4) aggregation of the load profile.
In step 1, the database for the determination of synthetic load profiles is created based on registration statistics, traffic analysis and mobility patterns. From electric vehicle types registered in Germany [48], a distribution function of the EV type is derived. Each EV type is allocated by a battery capacity and an average EV energy consumption (kWh/100 km) depending on the season. The required definition of the seasons corresponds to that of the standard load profiles provided by BDEW [43].
The statistical data from traffic analysis being used to calculate load profiles in the presented approach contain a wide range of different parameters (average duration of stay, distance travelled, number of trips, etc.), which depend on the topography of the investigated area (suburbs, city centre). Additionally, each trip can be associated with one of seven pre-defined trip purposes, referred to as user groups. A distinction is made between a trip home, a trip to work with private or official car, a trip for shopping, trip for execution (e.g., doctor’s visit), trip to leisure activities, and a trip to education. For further use, a distribution function over the distance travelled and the number of trips per weekday is determined for each cell and user group.
The mobility pattern contains empirical factors that are used based on the number of trips per weekday to determine the number of trips for Saturday and Sunday for each cell and user group. The number of trips per day corresponds to today’s mobility behaviour, meaning that in a scenario with an EV penetration of 100%, each distance travelled represents a trip with an electric vehicle without taking into account any change in mobility behaviour. Furthermore, the mobility pattern includes original destination matrices according to Bosserhoff [48]. These matrices are based on the statistical evaluation of traffic behaviour and are available as daily distributions for 15 various trip purposes. These distributions describe the relative share of arriving and departing vehicles in the total vehicle volume of a day per day hour. While for the purpose “trip home”, a daily distribution for arrival and departure exists and can be assigned directly to the user group “trip home” from the traffic analyses, which is not possible for the user group “trip to work”, for example. The user group “trip to work”, regardless of whether it is a private car or an official car, is strongly dependent on the workplaces available in the cell, more precisely on the start and end of the respective work. This means that a “new” daily distribution is aggregated for this user group on the basis of different Bosserhoff daily distributions and using a distribution of existing workplaces within the respective cell. As a result, an individual daily distribution of arriving and departing vehicles will be obtained for each cell for the user group “trip to work”. For these daily distributions and those Bosserhoff daily distributions that can be directly assigned to a user group, cumulative distribution functions of arriving and departing vehicles are finally generated for each cell. This cumulative distribution functions are used in the probabilistic approach in step 2. Figure 13 shows two examples of original destination matrices according to Bosserhoff for the purpose “trip home” and “trip to work-shift operation” as well as the cumulative distributions determined.
Following the preparation of the traffic analysis and the mobility behaviour, the EV penetration and the simulation period is determined in step 2. Furthermore, the arrival and departure time, the distance travelled, the EV type, and the charging strategy are determined for each charging process within a cell and user group. Due to the stochastic nature of the mobility behaviour, the determination of the distance travelled, arrival time (=start charging process), departure time, and EV type is performed via a probabilistic approach using a random number generator, similar to references [31,50,51]. Another important parameter is the charging strategy. To study the impact of different charging strategies, we define three different options, which can be selected separately for each user group.
  • In charging strategy 1, the charging power is selected separately for each user group. All charging processes within a user group thus charge with the same charging power. For example, as is quite common with today’s charging stations, charging powers can vary between 3.7 and 50 kW.
  • For charging strategy 2, the charging power is determined for each charging process based on a probability distribution function. This distribution function can, for example, be determined from the data of charging stations and therefore describes how many users have charged with which charging power.
  • Charging strategy 3 simulates the possibility of reduced charging power under consideration of the available charging time, corresponding to the duration of stay. The determination of the reduced charging power takes place in step 3. Since each loading process is simulated independently of the previous or subsequent one, it is not possible at this point to shift the charging process within the duration of stay as part of this strategy. The influence on the time shift would have to be taken into account when preparing the distributions for arrival and departure times.
After the parameters have been determined, they are written to a log file, which is used in step 3. This process is repeated for each day in the selected simulation period based on the number of trips per day and the selected EV penetration within a cell and user group. After the last repetition, this log is saved for each cell and user group.
In step 3, the charging curve is modelled for each charging process of each cell and user. For this, the duration of stay is calculated using the arrival and departure time, to establish whether the battery can be fully charged. Additionally, the necessary charging energy is determined based on the distance travelled and the average EV consumption (kWh/100 km). The battery capacity and the necessary energy to charge the battery are used to determine the state of charge at the end of the trip, i.e., at the beginning of the charging process. Next, the duration of the charging process can be determined according to the charging strategy and the respective charging power. In case of charging strategy 3, the corresponding charging process is first defined by a constant charging power. Based on this charging power, the duration of the charging process is determined. Afterwards, a comparison is made between the duration of stay and the duration of the corresponding charging process, see Figure 14. If the duration of the stay is shorter than the duration of the charging process, the charging curve is calculated by using the constant charging power. If the duration of the stay is longer than the duration of the charging process, the charging power is adjusted to the lowest possible value at which the consumed energy of the last trip can be recharged for the corresponding duration of stay.
The state of charge at the end of the trip and the charging power are the basis for modelling the charging curve. As described in references [52,53], constant current (CC)—constant voltage (CV) charging is applied. This means the battery is first charged with a constant current (i.e., constant power (Pconst)). At the changeover point (s = 80% SOC) constant voltage charging follows. In this charging phase, the charging current decreases automatically. The charging power as a function of the state of charge (SOC) is therefore calculated by Equation (7): [52]
P = { P c o n s t ,                                     f o r   S O C 80 % P c o n s t · e s S O C k L ,         f o r   S O C > 80 % ,
where, kL is the correction factor, which considers the nominal battery capacity and the switch off of the charging power. It has to be mentioned that Equation (7) is only valid for lithium-ion batteries, which are widely used in EVs.
In step 4, all charging curves within a cell and user group are aggregated to one synthetic load profile for the respective cell. In a first stub-step, all charging processes within a user group are added up to a sum load profile resulting in charging curves for each user group and cell. Figure 15b shows an aggregated charging curve for one user group, which are illustrated in Figure 15a (for illustration purposes, only 10 charging processes are shown). In a second sub-step, the aggregation of all charging curves at user group level within a cell are aggregated to a synthetic load profile. In Figure 16c, the aggregated charging curves of all charging processes within a cell for each user group from sub-step 1 are used for a selected cell to represent sub-step 2. Depending on the user group, these aggregated charging curves contain between 100 and 500 charging processes per day, and therefore the characteristic from Figure 16b is no longer recognisable. Figure 15d shows the example of the aggregation of all charging curves at user group level from Figure 15c.

3. Results and Discussion

In this chapter we first discuss the reduction of the calculation time for the load flow calculations by using the simplified grid model. This is followed by a detailed discussion on the results of the case study described in Section 1.

3.1. Calculation Times

In the case study shown here, a total of 752 consumers and eight producers are connected to the 148 nodes of the reference grid. As described in Section 2.1, the reference grid is divided into nine cells, which means that the 148 nodes are aggregated into nine energy nodes. The cell-based power grid model has a total of 126 consumers (without EV) and five producers, see Table 4. As shown in Figure 6, only one consumer per node is illustrated in the reference grid of the NEPLAN model. This symbolic consumer represents all existing standard and individual load profiles of the respective node. This symbolic consumer is divided into two consumers in the grid model, see Figure 7. Those consumers with the name Load (represent all standard load profiles) and those with the name LPZ (represent individual load profiles). The existing load profiles per node are added up to a sum load profile. Therefore, for example, the simplified grid model contains only 24 consumers instead of 126 (without EV). As can be seen in Table 4, the advantage of reducing the calculation time by developing a grid model can already be demonstrated by modelling the annual load profiles for consumers and producers. Instead of the 752 consumers and eight producers of the reference grid, the calculation time for modelling the annual load profiles can be reduced from almost 17 to 3 h by aggregating the grid model to 126 consumers and five producers.
Following the determination of the annual load profiles, load flow calculations for different simulation periods are performed (see Figure 16). Figure 16a shows, that the calculation time for the load flow calculations can be reduced approximately by a factor of seven. Therefore, more scenarios (e.g., different penetration of e-mobility or different charging powers) or longer simulation periods can be calculated, analysed, and finally compared—with the same expenditure of time. Figure 16b illustrates a linearized increase in the calculation time per day with an increase in the number of days to be simulated.

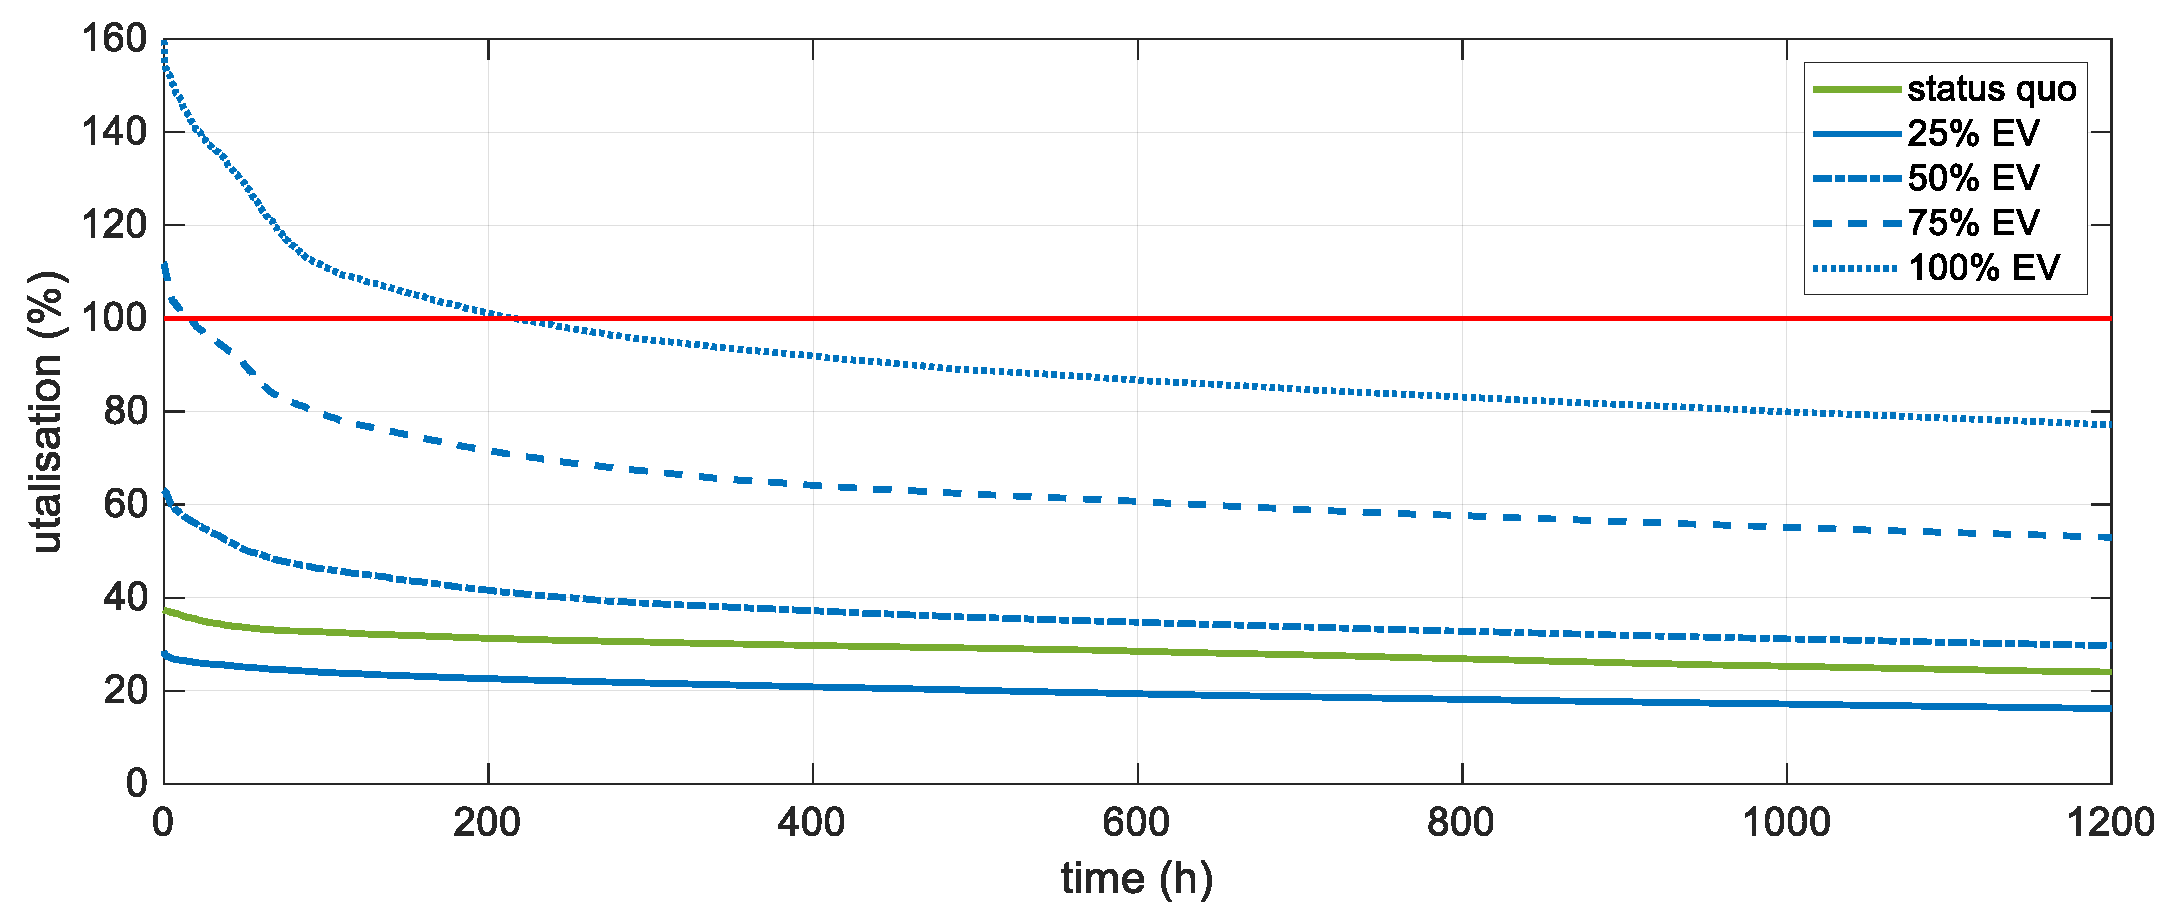
3.2. Case Study: Impact of E-Mobility Integration

Based on the simplified power grid model and the annual load profiles, load flow calculations for five different scenarios are performed: (i) the status quo, (ii) 25%, (iii) 50%, (iv) 75%, and (v) 100% penetration of e-mobility. A penetration of 100% corresponds to a scenario where every private vehicle is an EV. Based on the stochastic methodology described in Section 2.2, synthetic charging load profiles of electric vehicles are modelled for the different penetrations of e-mobility for a simulation duration of one year. For demonstration purposes, the charging strategy 1 with a charging power of 3.7 kW is selected for the determination of the synthetic charging profiles. Based on the results from the load flow calculations with annual load profiles for different penetrations of e-mobility, the load flows and the utilisation of the electrical equipment is analysed with regards to grid bottlenecks. As the main focus of this paper is on line utilisation, the maximum utilisation of each line during the simulation period of one year is determined. The maximum utilisations of 10 from 18 lines in the model (shown in Figure 17) usually do not occur at the same time (see Figure 18). While, as expected, the maximum utilisation of the lines (e.g., L31_1, L34_1) rise with an increasing penetration of e-mobility, the maximum line utilisation is reduced in some cases (e.g., L37_1, L68_2). This decrease in line utilisation is a result of existing producers in at least one of the cells connected by the affected line. From a penetration of 75% e-mobility, on the maximum line utilisation in all lines increases in relation to the scenario without e-mobility and leads to overloads (maximum utilisation > 100%) in one line (L68_2). A penetration of 100% e-mobility leads to overloads in four lines.
As expected, the maximum utilisation rises with an increasing penetration of e-mobility in some lines (L31_1, L34_1, L43_1). Those lines have in common that the cells connected by them have no producers. The lines with a reduction of the maximum utilisation by an increasing penetration of e-mobility connect cells where at least one cell has a producer. Table 5 shows the decrease in utilisation on line L37_1 from the scenario status quo to a penetration of 50% e-mobility as well as its increase for the penetrations of 75% and 100% e-mobility and its time of occurrence as illustrated in Figure 17. While the line L37_1 connects cells 3 and 7, cell 7 is also connected to cells 5 and 6 (L75_1/L76_1) via normally open points, see Figure 7. This means that depending on the production and consumption of cell 7, an import or export is only possible in cell 3. Therefore, Table 5 also shows the load, production and their difference from cell 7 at the times when the maximum line utilisation occurs. In the scenario associated with the status quo, the maximum line utilisation is caused by the production peak. Due to an increasing e-mobility, the load of the cell increases with constant production. As a result, the difference between load and producer is reduced. This reduction leads to the fact that the maximum line utilisation can take place at a different time. At penetrations of 75% e-mobility and above, the producer peak is reduced to such an extent by the e-mobility load that the maximum line utilisation is caused by a load peak.
Figure 18 shows that more than half of the maximum line utilisation occur in January and November, meaning that the grid is more stressed in winter than in summer. Furthermore, three of the five maximum utilisations reaching over 100% occur in November.
Since the duration of the occurring overloads is important in addition to the relative load, simulation periods of one year are advantageous. Table 6 shows the duration of the utilisations over 80% and 100% for the four overloaded lines during the simulation period of one year. At a penetration of 100% e-mobility, the most stressed line L68_2 is overloaded for 216.5 h per year (8760 h), and at a penetration of 75% the duration decreases to 16.75 h per year (see Figure 19). Due to the short overload duration of line L68_2, recommended or controlled charging should first be considered in order to avoid these overloads. Furthermore, Figure 19 shows that a penetration of 25% e-mobility leads to a reduction of the utilisation of line L68_2 for the simulation year compared to the status quo scenario.

4. Conclusions

In this paper we introduce a fast way to study the impact of an increasing grid load of future e-mobility on distribution grids. The presented approach is based on the development of a cell-based grid model and the determination of synthetic charging load profiles of electric vehicles. In addition to the analysis of the impact of increasing e-mobility on the power grid presented in this paper, this approach can also be used to analyse the integration of RES, heat pumps, storage systems, power to gas units, etc., or with a combination of these technologies.
It could be shown that using the cell-based grid model drastically reduced the calculation time needed to perform load flow calculations. As a result, using the cell-based grid model in comparison to the reference grid, at least seven times as many scenarios can be calculated at the same time expenditure. For each scenario, load flow calculations with annual load profiles were performed, allowing us to investigate seasonal effects. It is therefore not necessary to perform and compare load flow calculations for specific weeks (summer vs. winter) to identify possible line overloads. Instead, the maximum utilisation of the lines and their temporal occurrence can be determined. Based on the time of occurrence (date and time), it can be deduced whether higher grid loads are to be expected for the defined scenario, for example in winter or summer.
In addition to the development of the cell-based distribution grid model and the determination of annual load profiles for consumer, producers and synthetic charging load profiles of electric vehicles load flow calculations for five different scenarios were performed: (i) the status quo, (ii) 25%, (iii) 50%, (iv) 75%, and (v) 100% penetration of e-mobility. The comparison of the results from the load flow calculations show an increase on the utilisation of the lines with increasing e-mobility and the influence of producers at the same connection point as e-mobility.

Author Contributions

Conceptualization, J.V.; methodology, J.V.; software, J.V.; validation, J.V., C.K. and A.T.; formal analysis, J.V. and C.K.; investigation, J.V.; data curation, J.V.; writing—original draft preparation, J.V.; writing—review and editing, J.V., T.K., C.K.; visualization, J.V.; supervision, T.K.; All authors have read and agreed to the published version of the manuscript.

Funding

This research was funded by the Austrian Federal Ministry of Transport, Innovation and Technology via the FFG programme “Energie der Zukunft”, grant number 854637.

Conflicts of Interest

The authors declare no conflict of interest.

References

  1. Meinshausen, M.; Meinshausen, N.; Hare, W.; Raper, S.C.B.; Frieler, K.; Knutti, R.; Frame, D.J.; Allen, M.R. Greenhouse-gas emission targets for limiting global warming to 2 °C. Nature 2009, 458, 1158–1162. [Google Scholar] [CrossRef] [PubMed]
  2. Raftery, A.E.; Zimmer, A.; Frierson, D.M.W.; Startz, R.; Liu, P. Less than 2 °C warming by 2100 unlikely. Nclimate 2017, 7, 637–641. [Google Scholar] [CrossRef] [PubMed]
  3. Bundesministerium für Wissenschaft, Forschung und Wirtschaft. Energ. Österr. Zahl. Daten Fakten 2017, 6.
  4. Statistik Austria. Kraftfahrzeuge—Neuzulassungen. Available online: http://www.statistik.at/web_de/statistiken/energie_umwelt_innovation_mobilitaet/verkehr/strasse/kraftfahrzeuge_-_neuzulassungen/index.html (accessed on 30 September 2019).
  5. Clement-Nyns, K.; Haesen, E.; Driesen, J. The Impact of Charging Plug-In Hybrid Electric Vehicles on a Residential Distribution Grid. IEEE Trans. Power Syst. 2010, 25, 371–380. [Google Scholar] [CrossRef] [Green Version]
  6. Valsera Naranjo, E.; Sumper, A.; Lloret Gallego, P.; Villafáfila Robles, R.; Sudrià Andreu, A. Deterministic and Probabilistic Assessment of the Impact of the Electrical Vehicles on the Power Grid. REPQJ 2010, 1, 1505–1509. [Google Scholar] [CrossRef] [Green Version]
  7. Chandra Mouli, G.R.; Bauer, P.; Zeman, M. System design for a solar powered electric vehicle charging station for workplaces. Appl. Energy 2016, 168, 434–443. [Google Scholar] [CrossRef] [Green Version]
  8. Fattori, F.; Anglani, N.; Muliere, G. Combining photovoltaic energy with electric vehicles, smart charging and vehicle-to-grid. Sol. Energy 2014, 110, 438–451. [Google Scholar] [CrossRef]
  9. Fischer, D.; Harbrecht, A.; Surmann, A.; McKenna, R. Electric vehicles’ impacts on residential electric local profiles—A stochastic modelling approach considering socio-economic, behavioural and spatial factors. Appl. Energy 2019, 233, 644–658. [Google Scholar] [CrossRef]
  10. Iversen, E.B.; Morales, J.M.; Madsen, H. Optimal charging of an electric vehicle using a Markov decision process. Appl. Energy 2014, 123, 1–12. [Google Scholar] [CrossRef] [Green Version]
  11. Olivella-Rosell, P.; Villafafila-Robles, R.; Sumper, A.; Bergas-Jané, J. Probabilistic Agent-Based Model of Electric Vehicle Charging Demand to Analyse the Impact on Distribution Networks. Energies 2015, 8, 4160–4187. [Google Scholar] [CrossRef]
  12. Neaimeh, M.; Wardle, R.; Jenkins, A.M.; Yi, J.; Hill, G.; Lyons, P.F.; Hübner, Y.; Blythe, P.T.; Taylor, P.C. A probabilistic approach to combining smart meter and electric vehicle charging data to investigate distribution network impacts. Appl. Energy 2015, 157, 688–698. [Google Scholar] [CrossRef] [Green Version]
  13. Leou, R.C.; Su, C.L.; Lu, C.N. Stochastic Analyses of Electric Vehicle Charging Impacts on Distribution Network. IEEE Trans. Power Syst. 2014, 29, 1055–1063. [Google Scholar] [CrossRef]
  14. Gnann, T.; Funke, S.; Jakobsson, N.; Plötz, P.; Sprei, F.; Bennehag, A. Fast charging infrastructure for electric vehicles: Today’s situation and future needs. Transp. Res. Part D 2018, 62, 314–329. [Google Scholar] [CrossRef]
  15. Godde, M.; Findeisen, T.; Sowa, T.; Nguyen, P.H. Modelling the charging probability of electric vehicles as a gaussian mixture model for a convolution based power flow analysis. In Proceedings of the 2015 IEEE Eindhoven PowerTech, Eindhoven, The Netherlands, 29 June–2 July 2015; pp. 1–6, ISBN 978-1-4799-7693-5. [Google Scholar]
  16. Mobilität in Deutschland—MiD Ergebnisbericht; Infas—Institut für Angewandte Sozialwissenschaften GmbH; Deutsches Zentrum für Luftund Raumfahrt e.V. Institut für Verkehrsforschung; IVT Research GmbH; Bundesministerium für Verkehr und digitale Infrastruktur: Bonn, Germany, 2018.
  17. Lin, H.; Fu, K.; Liu, Y.; Sun, Q.; Wennersten, R. Modeling charging demand of electric vehicles in multi-locations using agent-based method. Energy Procedia 2018, 152, 599–605. [Google Scholar] [CrossRef]
  18. Wang, D.; Gao, J.; Li, P.; Wang, B.; Zhang, C.; Saxena, S. Modeling of plug-in electric vehicle travel patterns and charging load based on trip chain generation. J. Power Sources 2017, 359, 468–479. [Google Scholar] [CrossRef]
  19. Darabi, Z.; Ferdowsi, M. Aggregated Impact of Plug-in Hybrid Electric Vehicles on Electricity Demand Profile. IEEE Trans. Sustain. Energy 2011, 2, 501–508. [Google Scholar] [CrossRef]
  20. Garcia-Villalobos, J.; Zamora, I.; Eguia, P.; San Martin, J.I.; Asensio, F.J. Modelling social patterns of plug-in electric vehicles drivers for dynamic simulations. In Proceedings of the 2014 IEEE International Electric Vehicle Conference (IEVC), Florence, Italy, 17–19 December 2014; pp. 1–7, ISBN 978-1-4799-6075-0. [Google Scholar]
  21. Federal Highway Administration Office of Policy Information. 2017 NHTS Data User Guide. Available online: https://nhts.ornl.gov/ (accessed on 9 December 2019).
  22. Leou, R.C.; Su, C.L.; Teng, J.H. Modelling and verifying the load behaviour of electric vehicle charging stations based on field measurements. IET Gener. Transm. Distrib. 2015, 9, 1112–1119. [Google Scholar] [CrossRef]
  23. Qi, Z.; Yang, J.; Jia, R.; Wang, F. Investigating Real-World Energy Consumption of Electric Vehicles: A Case Study of Shanghai. Procedia Comput. Sci. 2018, 131, 367–376. [Google Scholar] [CrossRef]
  24. Österrreich Unterwegs 2013/2014 Ergebnisbericht; Infas—Institut für Angewandte Sozialwissenschaft GmbH; TRICONSULT—Wirtschaftsanalytische Forschung Gesellschaft m.b.H; HERRY Consult GmbH; Sammer und Partner Zivilingenieur GmbH, ZIS+P Verkehrsplanung; Institut für Verkehrswesen der Universität für Bodenkultur; Bundesministerium für Verkehr, Innovation und Technologie: Wien, Austria, 2016.
  25. Luo, L.; Gu, W.; Zhou, S.; Huang, H.; Gao, S.; Han, J.; Wu, Z.; Dou, X. Optimal planning of electric vehicle charging stations comprising multi-types of charging facilities. Appl. Energy 2018, 226, 1087–1099. [Google Scholar] [CrossRef]
  26. Jianfeng, W.; Xiangning, X.; Jian, Z.; Kunyu, L.; Yang, Y.; Shun, T. Charging demand for electric vehicle based on stochastic analysis of trip chain. IET Gener. Transm. Distrib. 2016, 10, 2689–2698. [Google Scholar] [CrossRef]
  27. Kazemi, M.A.; Sedighizadeh, M.; Mirzaei, M.J.; Homaee, O. Optimal siting and sizing of distribution system operator owned EV parking lots. Appl. Energy 2016, 179, 1176–1184. [Google Scholar] [CrossRef]
  28. Qian, K.; Zhou, C.; Allan, M.; Yuan, Y. Modeling of Load Demand Due to EV Battery Charging in Distribution Systems. IEEE Trans. Power Syst. 2011, 26, 802–810. [Google Scholar] [CrossRef]
  29. Aghaebrahimi, M.R.; Ghasemipour, M.M.; Sedghi, A. Probabilistic optimal placement of EV parking considering different operation strategies. In Proceedings of the MELECON 2014—2014 17th IEEE Mediterranean Electrotechnical Conference, Beirut, Lebanon, 13–16 April 2014; pp. 108–114, ISBN 978-1-4799-2337-3. [Google Scholar]
  30. Brady, J.; O’Mahony, M. Modelling charging profiles of electric vehicles based on real-world electric vehicle charging data. Sustain. Cities Soc. 2016, 26, 203–216. [Google Scholar] [CrossRef]
  31. Ul-Haq, A.; Azhar, M.; Mahmoud, Y.; Perwaiz, A.; Al-Ammar, E. Probabilistic Modeling of Electric Vehicle Charging Pattern Associated with Residential Load for Voltage Unbalance Assessment. Energies 2017, 10, 1351. [Google Scholar] [CrossRef]
  32. Mu, Y.; Wu, J.; Jenkins, N.; Jia, H.; Wang, C. A Spatial–Temporal model for grid impact analysis of plug-in electric vehicles. Appl. Energy 2014, 114, 456–465. [Google Scholar] [CrossRef] [Green Version]
  33. Grahn, P.; Munkhammar, J.; Widen, J.; Alvehag, K.; Soder, L. PHEV Home-Charging Model Based on Residential Activity Patterns. IEEE Trans. Power Syst. 2013, 28, 2507–2515. [Google Scholar] [CrossRef]
  34. Grahn, P.; Alvehag, K.; Soder, L. PHEV Utilization Model Considering Type-of-Trip and Recharging Flexibility. IEEE Trans. Smart Grid 2014, 5, 139–148. [Google Scholar] [CrossRef]
  35. Vopava, J.; Böckl, B.; Kriechbaum, L.; Kienberger, T. Anwendung zellularer Ansätze bei der Gestaltung zukünftiger Energieverbundsysteme. Elektrotech. Inftech. 2017, 134, 238–245. [Google Scholar] [CrossRef]
  36. Putrus, G.A.; Suwanapingkarl, P.; Johnston, D.; Bentley, E.C.; Narayana, M. Impact of electric vehicles on power distribution networks. In Proceedings of the IEEE Vehicle Power and Propulsion Conference, Dearborn, MI, USA, 7–10 September 2009; pp. 827–831, ISBN 978-1-4244-2600-3. [Google Scholar]
  37. Shao, S.; Pipattanasomporn, M.; Rahman, S. Challenges of PHEV penetration to the residential distribution network. In Proceedings of the 2009 IEEE PES General Meeting, Calgary, AB, Canada, 26–30 July 2009; pp. 1–8, ISBN 978-1-4244-4241-6. [Google Scholar]
  38. Böckl, B.; Kriechbaum, L.; Kienberger, T. Analysemethode für kommunale Energiesysteme unter Anwendung des zellularen Ansatzes. In Proceedings of the 14. Symposium Energieinnovation, Graz, Austria, 10–12 February 2016; Institut für Elektrizitätswirtschaft und Energieinnovation: Graz, Austria, 2016. [Google Scholar]
  39. Böckl, B.; Vopava, J.; Kriechbaum, L.; Kienberger, T. Limitations of integrating photovoltaic energy into municipal grids excluding and including storage systems. In Proceedings of the 6th Solar Integration Workshop, Vienna, Austria, 14–15 November 2016; Energynautics GmbH: Wien, Austria, 2016. [Google Scholar]
  40. Böckl, B.; Greiml, M.; Leitner, L.; Pichler, P.; Kriechbaum, L.; Kienberger, T. HyFlow—A Hybrid Load Flow-Modelling Framework to Evaluate the Effects of Energy Storage and Sector Coupling on the Electrical Load Flows. Energies 2019, 12, 956. [Google Scholar] [CrossRef] [Green Version]
  41. QGIS Entwicklungsteam. QGIS Geographisches Informationssystem; 2016. [Google Scholar]
  42. NEPLAN AG. NEPLAN; 2015. [Google Scholar]
  43. BDEW—Budesverband der Energie- und Wasserwirtschaft e.V. Standardlastprofile Strom. Available online: https://www.bdew.de/energie/standardlastprofile-strom/ (accessed on 3 April 2019).
  44. E-CONTROL. Sonstige Marktregeln. Kapitel 6: Zählwerte, Datenformate und Standardisierte Lastprofile. Available online: https://www.e-control.at/recht/marktregeln/sonstige-marktregeln-strom#p_p_id_56_INSTANCE_10318A20066 (accessed on 3 April 2019).
  45. Esslinger, P.; Witzmann, R. Entwicklung und Verifikation eines stochastischen Verbraucherlastmodells für Haushalte. In Proceedings of the Symposium Energieinnovation, Graz, Austria, 15–17 February 2012; Institut für Elektrizitätswirtschaft und Energieinnovation: Graz, Austria, 2012. [Google Scholar]
  46. Pflughardt, N. Modellierung von Wasser- und Energieverbräuchen in Haushalten. In Dissertation; Technische Universität Chemnitz: Chemnitz, Germany, 2016. [Google Scholar]
  47. Pflugradt, N. LoadProfileGenerator. Available online: https://www.loadprofilegenerator.de/ (accessed on 22 November 2019).
  48. Kraftfahrt-Bundesamt. Neuzulassungen—Deutschland. Available online: https://www.kba.de/DE/Statistik/Fahrzeuge/Neuzulassungen/neuzulassungen_node.html (accessed on 15 July 2019).
  49. Bosserhoff, D. Integration von Verkehrsplanung und Räumlicher Planung. Teil2: Abschötzung der Verkehrserzeugung Durch Vorhaben der Bauleitungplanung; Hessisches Landesamt für Straßen- und Verkehrswesen: Wiesbaden, Germany, 2000.
  50. Probst, A.; Braun, M.; Tenbolen, S. Erstellung und Simulation probabilistischer Lastmodelle von Haushalten und Elektrofahrzeugen zur Spannungsbandanalyse; Internationaler ETG-Kongress: Würzburg, Germany, 2011. [Google Scholar]
  51. Wieland, T.; Reiter, M.; Schmautzer, E.; Fickert, L.; Fabian, J.; Schmied, R. Probabilistische Methode zur Modellierung des Ladeverhaltens von Elektroautos anhand gemessener Daten elektrischer Ladestationen—Auslastungsanalysen von Ladestationen unter Berücksichtigung des Standorts zur Planung von elektrischen Stromnetzen. Elektrotech. Inftech. 2015, 132, 160–167. [Google Scholar] [CrossRef]
  52. Schuster, A. Batterie- bzw. Wasserstoffspeicher bei elektrischen Fahrzeugen. In Diplomarbeit; Technische Universität Wien: Wien, Austria, 2008. [Google Scholar]
  53. Marra, F.; Yang, G.Y.; Larsen, E.; Rasmussen, C.N.; You, S. Demand profile study of battery electric vehicle under different charging options. In Proceedings of the IEEE Power and Energy Society General Meeting, San Diego, CA, USA, 22–26 July 2012; pp. 1–7, ISBN 978-1-4673-2729-9. [Google Scholar]
Figure 1. Flowchart showing the five steps of the distribution grid model development using the cellular approach.
Energies 13 00039 g001
Figure 2. Schematic representation of the cell classification (Step 1). (a) Topography of the artificial sample area; (b) location and topology of the distribution grid; (c) and cell classification.
Energies 13 00039 g002
Figure 3. Aggregation of the assigned energy quantities into energy nodes (step 3).
Energies 13 00039 g003
Figure 4. Schematic representation of the principle of line implementation. (a) “Interconnectors” and “missing elements”; (b) energy nodes of the geographically located power grid model and their connection according to the reference grid.
Energies 13 00039 g004
Figure 5. Choice of cell boundaries with a negative influence on the cell-based grid model accuracy (a) reference grid and (b) developed grid model based on (a), leading to a load flow shift. Optimised (c) reference grid and (d) developed grid model based on (c).
Energies 13 00039 g005
Figure 6. Five kV reference grid including the selected cell division used to develop the simplified grid model.
Energies 13 00039 g006
Figure 7. Cell-based grid model representing the reference grid based on nine aggregated energy nodes shown in Figure 8.
Energies 13 00039 g007
Figure 8. Structure of the E-RLC modules for consideration of the reactive power losses of the “missing elements”.
Energies 13 00039 g008
Figure 9. Comparison of the (a) absolute and (b) relative deviation of the reactive power load flow with and without consideration of the reactive power losses of the “missing elements” for selected “interconnectors”.
Energies 13 00039 g009
Figure 10. Comparison of the absolute and relative deviations of the active power flows between grid model and reference grid.
Energies 13 00039 g010
Figure 11. Synthetic load profiles provided by e-control for ULA (hot water tank) and ULC (night heat storage tank), both without day recharging.
Energies 13 00039 g011
Figure 12. Flowchart for the determination of synthetic charging load profiles.
Energies 13 00039 g012
Figure 13. Original destination matrice according to Bosserhoff [49] and cumulative distribution function. (a) Trip home; (b) trip to work—shift operation.
Energies 13 00039 g013aEnergies 13 00039 g013b
Figure 14. Flowchart of the determination of the charging power for the charging strategy 3.
Energies 13 00039 g014
Figure 15. (a) 10 charging processes (CP); (b) aggregation of the charging processes from (a); (c) aggregated charging curves of all charging processes within a cell per user group (UG); and (d) aggregation of all charging curves.
Energies 13 00039 g015
Figure 16. Comparison duration of the load flow (a) calculation time and (b) calculation time per day of the reference grid with the grid model for different simulation periods—all calculations were performed with the same PC using the same software version (NEPLAN 5.5.6).
Energies 13 00039 g016
Figure 17. Maximum line utilisation during the simulation period of one year for selected lines.
Energies 13 00039 g017
Figure 18. Month of occurrence for the maximum line utilisation of selected lines during the simulation period of one year.
Energies 13 00039 g018
Figure 19. Duration curve of the utilisation of the line L68_2 for the period 0 to 1200 h.
Energies 13 00039 g019
Table 1. Comparison of the deviations with and without consideration of the reactive power losses of the “missing elements” for four selected lines.
L31_1L35_1L37_1L63_1
Orig. aComp. bOrig. aComp. bOrig. aComp. bOrig. aComp. b
QFlow(kvar)−7−7001414−3−3
Reference grid
QFlow(kvar)0−7240514−26−8
Grid model
Absolute deviation(kvar)−70−240−360235
Relative deviation(%)1000-0−2570−767−167
a Original (Orig.): without E-RLC module; b Compensated (Comp.): with E-RLC module.
Table 2. Comparison for the imported/generated active and reactive power for the slack bus.
PimpQimpPgenQgen
(MW)(Mvar)(MW)(Mvar)
Reference grid12.2151.68327.8511.553
Grid model12.1061.65627.7371.526
Absolute deviation0.1090.0270.1140.027
Relative deviation0.89%1.60%0.41% (a)1.74%
(a) The relative deviation of 0.41% of the active power generated in the grid can be traced back to rounding errors that already occur when the loads are aggregated into energy nodes.
Table 3. Comparison of the absolute and relative deviations for four selected lines.
L35_1L37_1L62_1L63_1
Reactive power flow—reference grid(kW)1478−7826498
Reactive power flow—grid model(kW)1455−75628151
Absolute deviation(kW)23−2636−53
Relative deviation(%)2356−54
Table 4. Comparison of the reference grid and the simplified grid model.
Reference GridGrid Model
Number of nodes1489
Number of consumer/producer752/8126/5
Number of sum load profiles (a)27424
Modelling duration of annual sum load profiles (b)16 h 53 min2 h 54 min
(a) Sum load profiles of consumers and producers; (b) all calculations were performed with the same PC using the same software version (MATLAB R2017a).
Table 5. Maximum utilisation and their occurrence of the line L37_1 as well as the load, producer and the difference of load and producer of cell 7. All calculations are based on Data of the year 2014.
EV Penetration (%)0255075100
Date 31 March 08:003 April 08:0031 March 21:3023 August 18:0023 August 18:00
Utilisation of L37_1(%)83.73368.95757.45693.468134.860
Load of cell 7(MW)1.0291.3740.9303.3804.324
Producer of cell 7(MW)3.0072.9982.2821.1881.188
Load—Producer of cell 7(MW)−1.978−1.624−1.3522.1923.136
Table 6. Duration of the utilisations over 80% and 100% for the four overloaded lines during the simulation period of one year.
EV Penetration (%) Duration of the Utilisation
L23_1L31_1L37_1L68_2
>80%>100%>80%>100%>80%>100%>80%>100%
0(h)0.000.000.000.0016.000.000.000.00
25(h)0.000.000.000.000.000.000.000.00
50(h)0.000.000.000.000.000.000.000.00
75(h)0.000.004.000.0017.000.0094.0016.75
100(h)163.0014.0092.005.75121.0058.00995.00216.50

