Article

Parametric Modelling and Multi-Objective Optimization of Electro Discharge Machining Process Parameters for Sustainable Production

1
Mechanical Engineering Department, Muhammad Nawaz Sharif University of Engineering and Technology, Multan 66000, Pakistan
2
Manufacturing Department, School of Aerospace, Transport and Manufacturing, Cranfield University, Cranfield, Bedfordshire MK43 0AL, UK
3
Faculty of Industrial Engineering, University of Engineering and Technology, Taxila 47080, Pakistan
4
School of Engineering and Digital Sciences, Nazarbayev University, Nur-Sultan 010000, Kazakhstan
*
Author to whom correspondence should be addressed.
Energies 2020, 13(1), 38; https://doi.org/10.3390/en13010038
Submission received: 19 November 2019 / Revised: 14 December 2019 / Accepted: 18 December 2019 / Published: 19 December 2019
(This article belongs to the Special Issue Energy Efficiency of Manufacturing Processes and Systems)

Abstract

:
Electro Discharge Machining (EDM) can be an element of a sustainable manufacturing system. In the present study, the sustainability implications of EDM of special-purpose steels are investigated. The machining quality (minimum surface roughness), productivity (material removal rate) improvement and cost (electrode wear rate) minimization are considered. The influence and correlation of the three most important machining parameters including pulse on time, current and pulse off time have been investigated on sustainable production. Empirical models have been established based on response surface methodology for material removal rate, electrode wear rate and surface roughness. The investigation, validation and deeper insights of developed models have been performed using ANOVA, validation experiments and microstructure analysis respectively. Pulse on time and current both appeared as the prominent process parameters having a significant influence on all three measured performance metrics. Multi-objective optimization has been performed in order to achieve sustainability by establishing a compromise between minimum quality, minimum cost and maximum productivity. Sustainability contour plots have been developed to select suitable desirability. The sustainability results indicated that a high level of 75.5% sustainable desirability can be achieved for AISI L3 tool steel. The developed models can be practiced on the shop floor practically to attain a certain desirability appropriate for particular machine limits.

1. Introduction

The enormously growing demand for tool steel during the last decades is due to its embedded properties including wear resistance, corrosion resistance, hardness and exceptional property of retaining cutting end at exalted temperatures. Moreover, its cost-effectiveness also makes it an ideal candidate over carbides, titanium and inconel materials. Therefore, tool steel is being extensively employed for tools and die manufacturing in automotive, nuclear and aerospace industries [1,2]. Tool steel is commercially available in a number of series such as D, A, H, L and M. L series is a special purpose low alloy steel and is available in a number of grades including L1, L2, L3, L6 and L7 [3]. Due to hard to cut nature of tool steels, their machining through conventional methods results in dimensional inaccuracies, residual stresses and higher surface roughness and tool wear. These limitations in conventional techniques of machining are being addressed by utilizing non-conventional or special purpose machining processes. Electric discharge machining (EDM) is a non-conventional machining process used for manufacturing complex profiles with accuracy [4]. Minimum chattering, residual stresses and mechanical vibration are eminent advantages obtained by EDM owing to the absence of direct interaction of tool with work part while machining.
With a growing competition of production rates among industries, there is a visible increase in resources utilization and emissions of toxic materials to the environment. This has initiated a sustainability study of manufacturing systems and technologies. Sustainability has three pillars—the environmental, economic and the social. Sustainability in manufacturing is concerned with the manufacturing of products having minimum adverse environmental effect, safety of employees, conservation of natural resources and energy and are economically viable for customers. Machining is a major constituent of manufacturing system and sustainability in machining is related to environmental friendliness (cutting fluids), minimum cost and energy consumption, higher production and quality, better waste management and safety of worker [5]. The productivity, cost and quality of electric discharge machined parts are measured through performance measures: material removal rate (MRR), electrode wear rate (EWR) and surface roughness (SR) respectively [6]. Machining performance measures are directly associated with process parameters including pulse on time (Pon), current, pulse off time (Poff), voltage, flushing pressure, polarity, servo speed, frequency, gap and jump distance as shown in Figure 1a. The illustration of selected process parameters (Pon, Poff and current) is presented in Figure 1b. The Pareto chart is based on a detailed literature review of more than fifty research papers published in the last 15 years for electric discharge machining of tool steel (only those papers are selected in which MRR, EWR and SR separately or in combination have been evaluated). For investigating the influence of process parameters on productivity, cost and quality of electric discharged machined part, it can be observed from Figure 1 that current, pulse on time (Pon) and pulse off time (Poff) are widely applicable process parameters as identified by researchers.
Literature also suggests that the current and Pon has a direct influence on MRR, EWR and SR; all three performance measures increase when current is increased [7,8,9,10,11,12,13,14,15,16,17,18,19,20,21,22,23,24,25,26]. Whereas, Pulse off time exhibits inverse effects that are, MRR, EWR and SR decrease at higher Poff [19,25]. Moreover, It had also been reported that Poff does not significantly influence MRR, EWR and SR [22].
Different mathematical and statistical approaches have been presented by various researchers for modelling and optimization of performance measures related to EDM of tool steel. These techniques include conventional methods, taguchi (orthogonal array), response surface methodology (RSM), genetic algorithm (GA), fuzzy logic and grey relational analysis (GRA) [7,8,9,10,16,17,18,23,24,25,26]. The application of these techniques for different tool steel materials is presented in Figure 2 [7,8,9,10,11,12,13,14,15,16,17,18,19,20,21,22,23,24,25,26,27,28,29,30,31,32,33,34,35,36,37,38,39,40,41,42,43]. The figure represents a literature summary of experimental works for different tool steels along with performance measures and experimental techniques. Each performance measure is indicated by a symbol as shown in Figure 2.
Although various researchers have attempted to investigate and model the impact of process parameters on EWR, SR and MRR, limited or no research has been reported on special-purpose low alloy tool steel (AISI L3) to predict MRR, EWR and SR. Furthermore, literature reveals that productivity and quality are inversely related [22,25] and current and pulse on time are the most decisive factors [44]. Productivity increases with high-energy consumption (higher values of current and pulse on time), whereas quality improves at low energy utilization (lower current and pulse on time) as observed by Mandaloi et al. [7], Payal et al. [14] and Singh et al. [15] for machining AISI M2 and EN-31 tool steels.
Sustainability in machining operation is related to different aspects such as tool life, surface quality of machined parts, production ratio, energy consumption, environment issues, usage of lubricants and coolants and safety and welfare of workers. All these elements are broadly classified as economic, environmental and social pillars of sustainability considering a machining operation [45]. This research aims to achieve sustainable production based on the economic aspect of sustainability while electric discharge machining of low alloying special-purpose AISI L3 tool steel. L3 alloy is selected as it possesses higher hardenability, because of higher percentages of Cr, V and C which make it suitable for making tools and dies. Empirical models have been derived adopting Response Surface Methodology (RSM) for MRR, EWR and SR and adequacy of models have been checked by analysis of the variance (ANOVA). Analysis of process parameters has been performed using surface plots. Moreover, sustainability has been achieved employing desirability based multi-objective optimization. In the end, micrographs have been discussed to reveal the machined surface in terms of voids, pits and micro-cracks.

2. Experimental Procedure

This segment illustrates the chemical properties of the material, preparation of material samples and tools, experimental setup and measurement of responses. Experiments have been performed on AISI L3 tool steel, the chemical composition is presented in Table 1. All samples of work material were prepared by extracting cylindrical samples having 20 mm length and 22 mm diameter, while copper rods in the form of cylindrical shape having dimensions 50.8 mm × 19 mm (length × diameter) were employed as electrodes as shown in Figure 3a,b respectively. The machining was performed on die-sinker electric discharge machine CM655C (75 N). Workpieces and electrodes were subjected to grinding and polishing before conducting experiments.
Three process parameters including, (i) current, (ii) pulse on time (Pon) and (iii) pulse off time (Poff) were investigated for machining AISI L3 tool steel. During each experiment, the material was removed up-to a depth of 1.5 mm and to ensure the uniformity of machining a new electrode was used for each experimental run. Moreover, each experimental run was repeated thrice (three times) to accurately estimate the variation in the obtained values and to avoid uncertainty in the results.
The productivity, cost and quality of electric discharge machined parts were measured using MRR, EWR and SR respectively. Moreover, the analysis of the microstructure of the samples was performed for surface quality evaluation. Before taking micrographs, samples were treated firstly by dipping them into a well-prepared mixture of resin and hardener and then dried for stabilization. Micrographs have been taken using the Scanning Electron Microscope (SEM), TESCAN (MIRA 3 XMU type). All micrographs were taken in nanospace, keeping 101× magnification and 10 kV High Voltage (HV) value. Weight difference method was used for the measurement of MRR and EWR [46,47,48]. For this purpose, weight balance Mettler PE 1600 was used before and after the individual experiment. The following relations (Equations (1) and (2)) were used for the calculation of MRR and EWR.
MRR   ( mm 3 / min )   =   W p   ( g )   W a ( g ) Machining   Time   ( min )   ×   Density   ( g / mm 3   )
EWR   ( mm 3 / min )   =   E p   ( g )   E a ( g ) Machining   Time   ( min )   ×   Density   ( g / mm 3   )
where Wp and Wa are the weights of workpieces prior to machining and afterwards; whereas, Ep and Ea are the weights of electrodes prior to machining and afterwards. Compressed air followed by dipping in acetone was employed to remove debris and kerosene remains on machined specimens. Surface roughness (SR) was recorded by surface roughness meter, SJ-410-Surftest. Three observations were made at random locations and the average was taken as final reading for further analysis.

3. Experimental Design

The higher and lower levels for the three parameters are chosen based on the literature review and trial runs as long as the machined parts remained within the acceptable quality range. The selected parameters together with their chosen ranges are provided in Table 2. Modelling and analysis of performance measures (MRR, EWR and SR) have been carried out through RSM employing the Box Behnken Design (BBD). Overall, seventeen (17) experimental runs were performed with twelve (12) factorial and five (5) center points. The experimental runs along with process parameters and observed values of performance measures have been presented in Table 3.

4. Results, Analysis and Discussions

This section is comprised of results discussion and statistical analysis using RSM. Moreover, mathematical model selection and adequacy confirmation through ANOVA are discussed. Influences of process parameters on performance measures have been evaluated using 3D graphs (surface plots).

4.1. Development of Empirical Models

Modelling of the performance measures MRR, EWR and SR have been performed through regression analysis using commercial software (Design Expert ® 10.06). Analysis of Variance have been used to test the significance of factors and developed models.

4.1.1. Material Removal Rate (MRR)

After detailed experimentation, linear, quadratic and cubic models were tested to select the fitted model. The results revealed quadratic expression as the preferable model for material removal rate (MRR) (based on minimum p-value and R2, adjusted R2 and predicted R2 (close to 1)). The results obtained through ANOVA are presented in Table 4. It can be observed that main effects Pon (A), current (B), poff (C), interaction effects Pon and current (AB), Pon and Poff (AC), current and Poff (BC) and quadratic effects Pon (A2), current (B2) and Poff (C2) were the significant terms of MRR model. The statistical measures R2, adjusted R2 and predicted R2 have also been provided. Form the results, it is evident that the fitted regression model is significant at 95% confidence interval with ‘p’ value under 0.05. Furthermore, resulted values of statistical terms (R2, adjusted R2 and predicted R2) are nearly 1 which depicted that model is satisfactory to adopt. The resulted empirical model for MRR is provided in Equation (3).
MRR = 22.22697 + ( 0.043425 × Pon ) + ( 1.88978 × Current ) + ( 0.089232 × Poff ) + ( 1.54167 × 10 3 × Pon × Current ) + ( 6.225 × 10 5 × Pon × Poff ) ( 3.46667 × 10 3 × Current × Poff ) ( 7.57938 × 10 5 × Pon 2 ) ( 0.063806 × Current 2 ) ( 4.027 × 10 4 × Poff 2 )

4.1.2. Electrode Wear Rate (EWR)

The fit model details for electrode wear rate (EWR) also confirms that the quadratic expression is the most suitable relationship (based on minimum p-value and R2, adjusted R2 and predicted R2 (close to 1)). The regression terms (main effect, interaction and quadratic) which are significant for EWR include Pon (A), current (B) and Poff (C), Pon and current (AB) and Pon and off (AC), Pon (A2) and Poff (C2), respectively. The ANOVA results along with adequacy measures have been provided in Table 4. The resulted empirical model with less than 0.5 ‘p’ value is shown in Equation (4) that can be used successfully for prediction.
EWR = 0.54243 + ( 6.46294 × 10 3 × Pon ) ( 0.023750 × Current ) ( 4.06579 × 10 4 × Poff ) + ( 5.66667 × 10 4 × Pon × Current ) + ( 4.95 × 10 5 × Pon × Poff ) ( 1.68651 × 10 5 × Pon 2 ) ( 7.68421 × 10 5 × Poff 2 )

4.1.3. Surface Roughness (SR)

The details of the fit model for surface roughness also recommended the quadratic model as the most appropriate model (based on minimum p-value and R2, adjusted R2 and predicted R2 (close to 1)). Pon (A) current (B) and Poff (C) main terms, Pon and Poff (AC) interaction terms and Pon (A2), current (B2) and Poff (C2) quadratic terms have significant effects on surface roughness model. The ANOVA results including regression terms have been demonstrated as Table 4. The developed model is valid because it illustrated a good relationship between parameters and performance measure as ‘p’ value is under 0.05 (Confidence interval= 95). Moreover, the obtained values of regression metrics are approximately 1 which establish the suitability of model. The empirical model of surface roughness is presented in Equation (5) which is effective for prediction.
SR = 1.71756 + ( 6.795 × 10 3 × Pon ) ( 0.12989 × Current ) + ( 0.015330 × Poff ) ( 8 × 10 6 × Pon × Poff ) ( 5.775 × 10 6 × Pon 2 ) + ( 0.020444 × Current 2 ) ( 8.84 × 10 5 × Poff 2 )

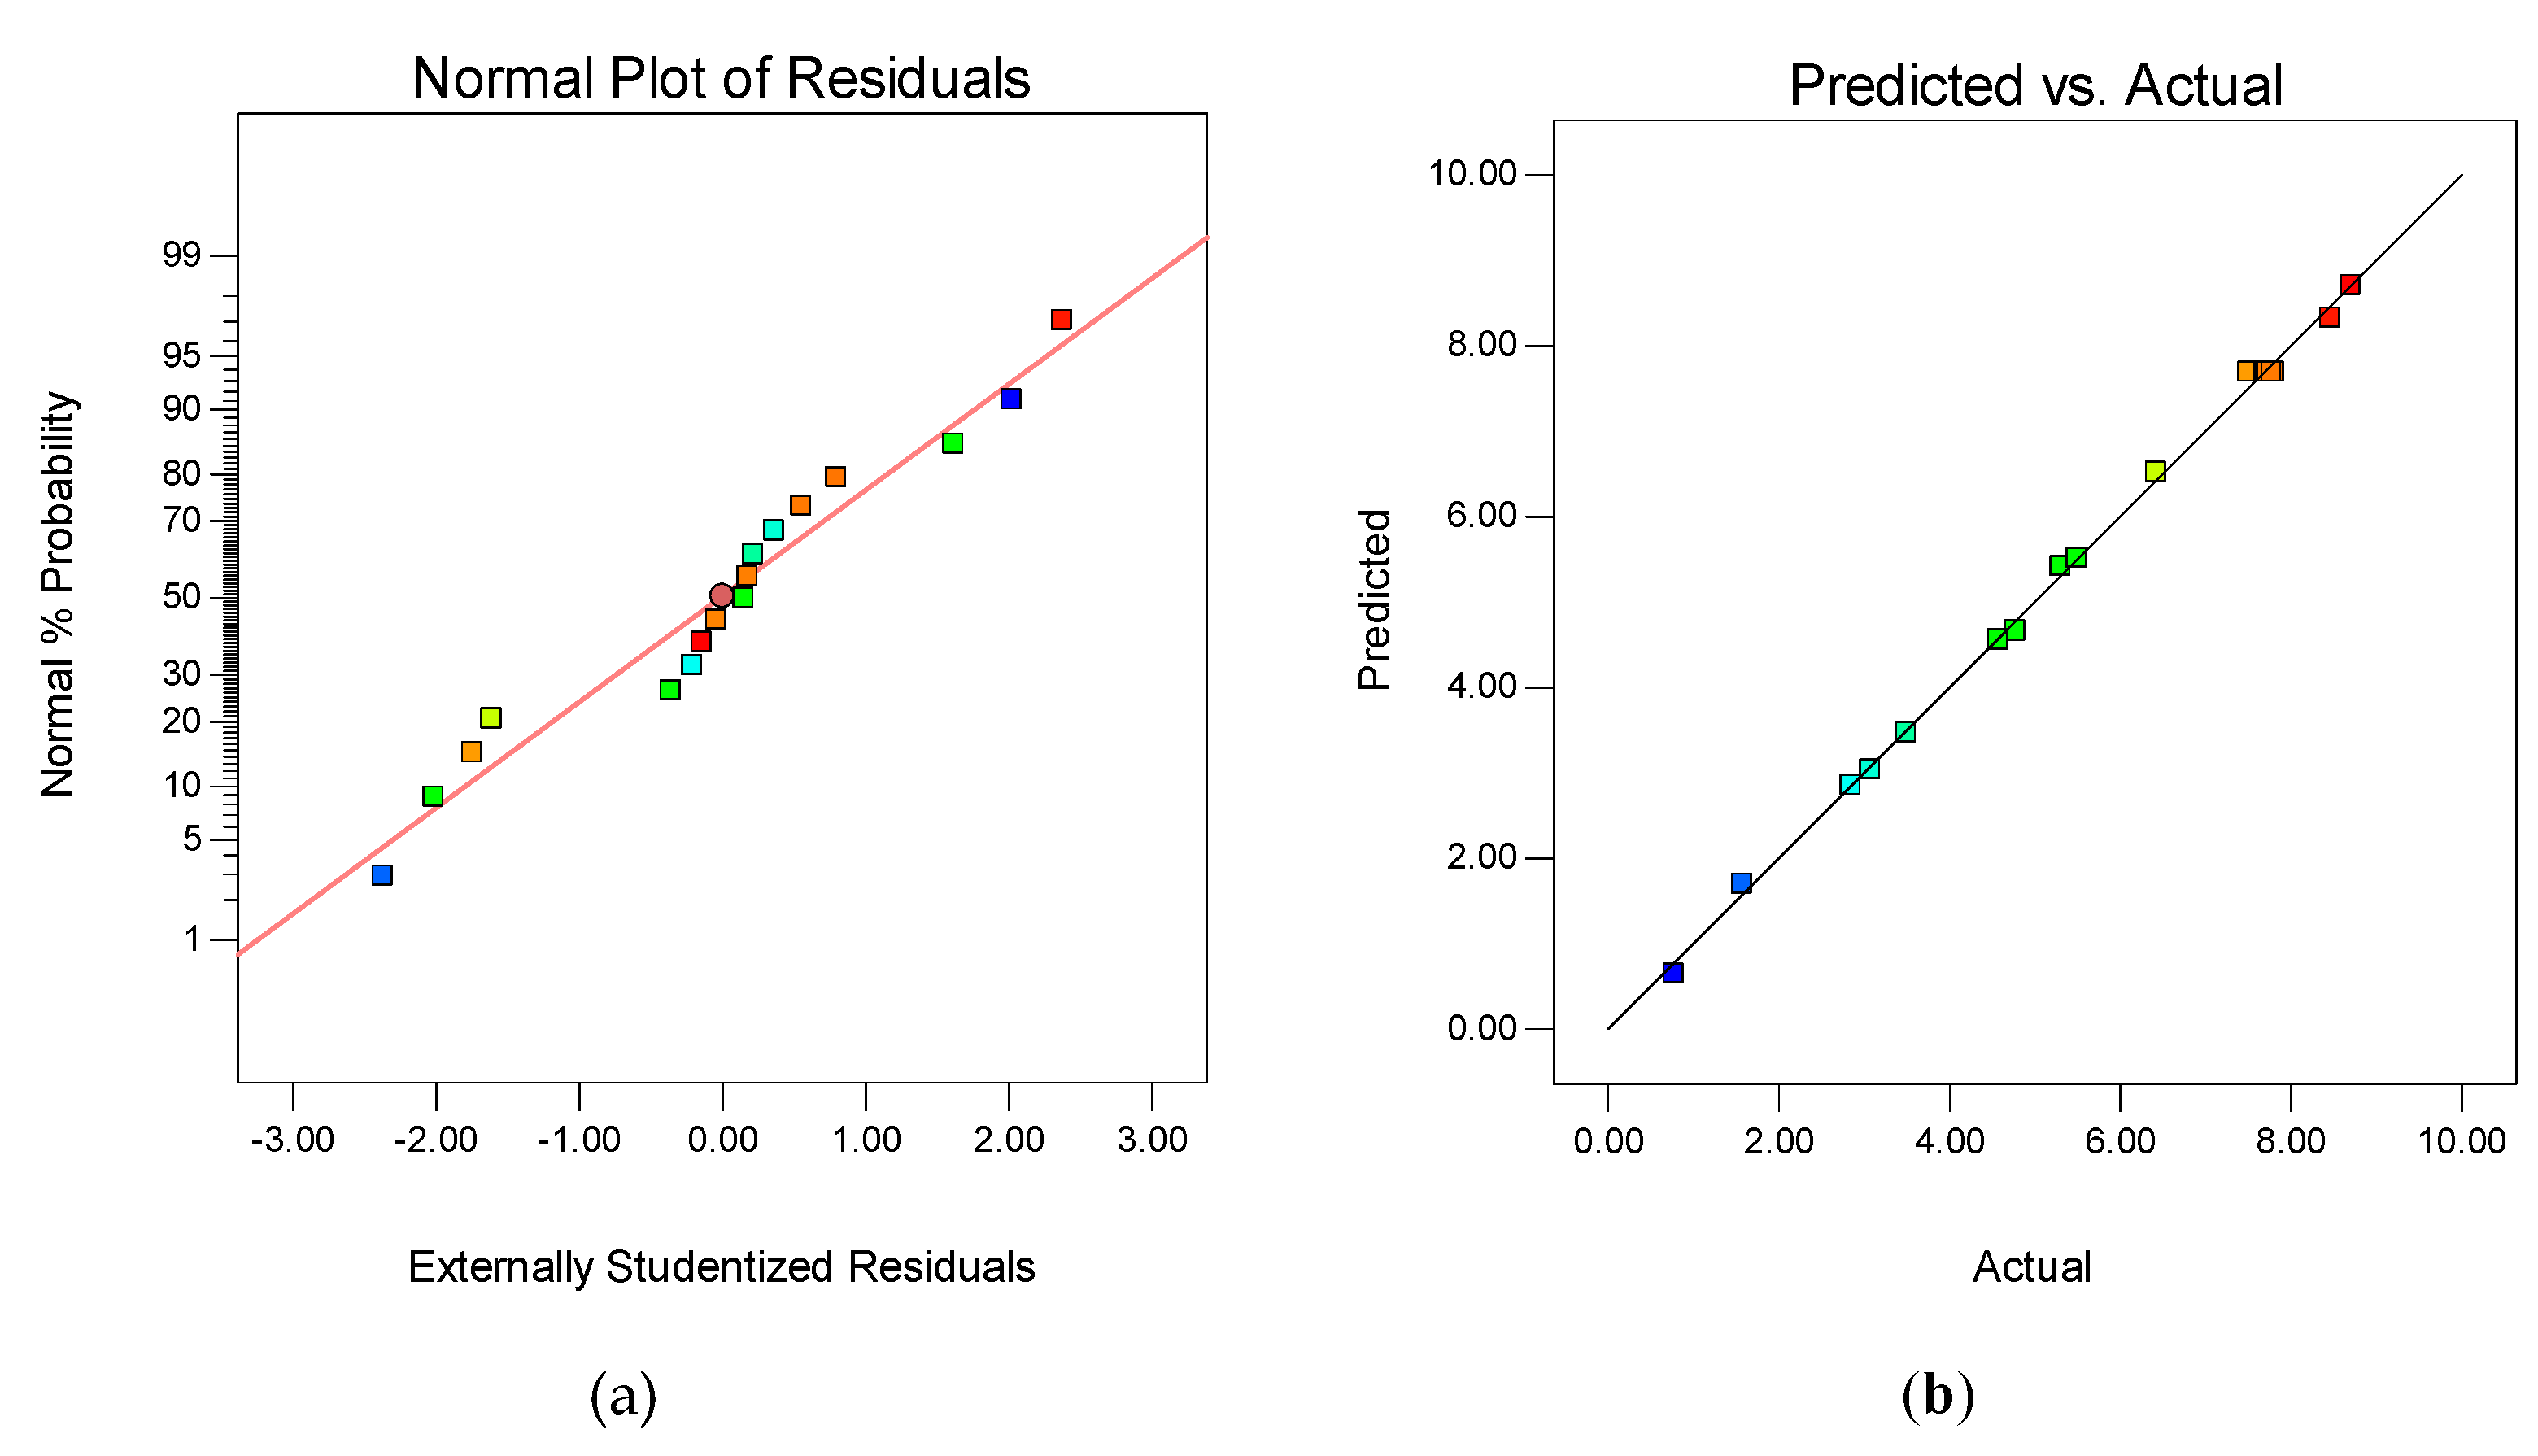
4.2. Validation of Model

Statistical analysis has been conducted to assure the fitness of regression models. Furthermore, for experimental validation of empirical models, additional confirmation experiments have been performed. In order to confirm either the developed model are the best representation of actual responses, normal probability plots have been plotted as shown in Figure 4a, Figure 5a and Figure 6a for MRR, EWR and SR respectively. It is observed that the residuals generally fall on a straight line implying that the errors are normally distributed. Moreover, the comparison plots of predicted against actual values of performance measures MRR, EWR and SR are established and shown in Figure 4b, Figure 5b and Figure 6b respectively. These plots confirm the normal distribution of error for all responses since all the theoretically assumed (predicted) and actual response values lie on the recommended straight-line or in its close approximation. Consequently, the established models are appropriate and are less likely to violate assumptions.
To validate the established empirical models, six (6) verification experimental runs were designed by randomly selecting the values of process parameters within design space (the selected levels were different from the designed values used for model development). The results of validation experiments and corresponding percentage error have been provided in Table 5. The percentage error value was calculated by using Equation (6) [48,49,50].
Percentage   Error =   | Actual   value     Predicted   value Predicted   value | ×   100
The established mathematical models are found valid as the percentage error is under 5%. Hence, these established models are effectively applicable for the prediction of performance measures in future.

4.3. 3D Response Surface

The effects of process parameters on material removal rate (MRR), electrode wear rate (EWR) and surface roughness (SR) have been presented in 3D response surface plots (Figure 7, Figure 8 and Figure 9).

4.3.1. Material Removal Rate (MRR)

The influence of both Pon and current on material removal rate (MRR) have been presented as a surface plot in Figure 7a. In the beginning, MRR increases as Pon increases up to a maximum value of 8.80 mm3/min and after that decreases. Contemporarily, a positive relationship exists between MRR and current, that is, MRR increases as current increases since maximum discharge energy enhances the material removal phenomena. Furthermore, Pon is the most influencing process parameter than current. Figure 7b describes the influence of Pon and Poff on MRR. Higher MRR is observed at the lower value of Poff and middle value of Pon. The correlation of MRR with Poff and current has been shown as 3D graph in Figure 7c. The graph confirms gradual increment in MRR along with increasing values of current. Conversely, Poff has an inverse effect on MRR. MRR increases as current and Pon increases because maximum discharge energy become available and deeper, and overlying craters are produced as a result of concentrated heat and localized melting. The trends are similar to those observed by Mandaloi et al. [7], Payal et al. [14], Sultan et al. [25] and Lin et al. [26].

4.3.2. Electrode Wear Rate (EWR)

Figure 8a presents the influence on electrode wear rate (EWR) when changing Pon and current. It is evident from the figure that Pon has more influence than current. Furthermore, EWR increases by increasing Pon and current. The highest value of EWR is observed at maximum values of Pon and current. The response of Poff and Pon on EWR have been presented in Figure 8b. The Figure clearly indicates that EWR is minimum at the lower value of Pon and high value of Poff and maximum at high level of Pon and low level of Poff. Moreover, EWR is relatively more affected by Pon than Poff. The surface plot of Poff and current (shown in Figure 8c) indicates that EWR is in direct relation with the current while Poff has an inverse effect on EWR. Maximum EWR resulted at higher values of current and Pon because more powerful discharging occurs with higher energy density that melts and removes more material from electrode. Similar effects have been observed by Sultan et al. [25] and Lin et al. [26].

4.3.3. Surface Roughness (SR)

The plot of surface roughness (SR) based on Pon and current indicates that SR increases as both current and Pon increase (Figure 9a). Furthermore, SR is significantly influenced by current than Pon. The 3D plot of Pon and Poff with SR is presented in Figure 9b. It is evident from the figure that minimum SR can be achieved at lower value of Pon and Poff. The effects of current and Poff is displayed in Figure 9c. The figure depicts that SR increases with the increase in current. Whereas, Poff has a negligible influence on SR. At higher levels of current, discharge energy becomes greater which enhances the erosion and melting of material and hence, surface roughness increases as stated by Sultan et al. [25] and Lin et al. [26].

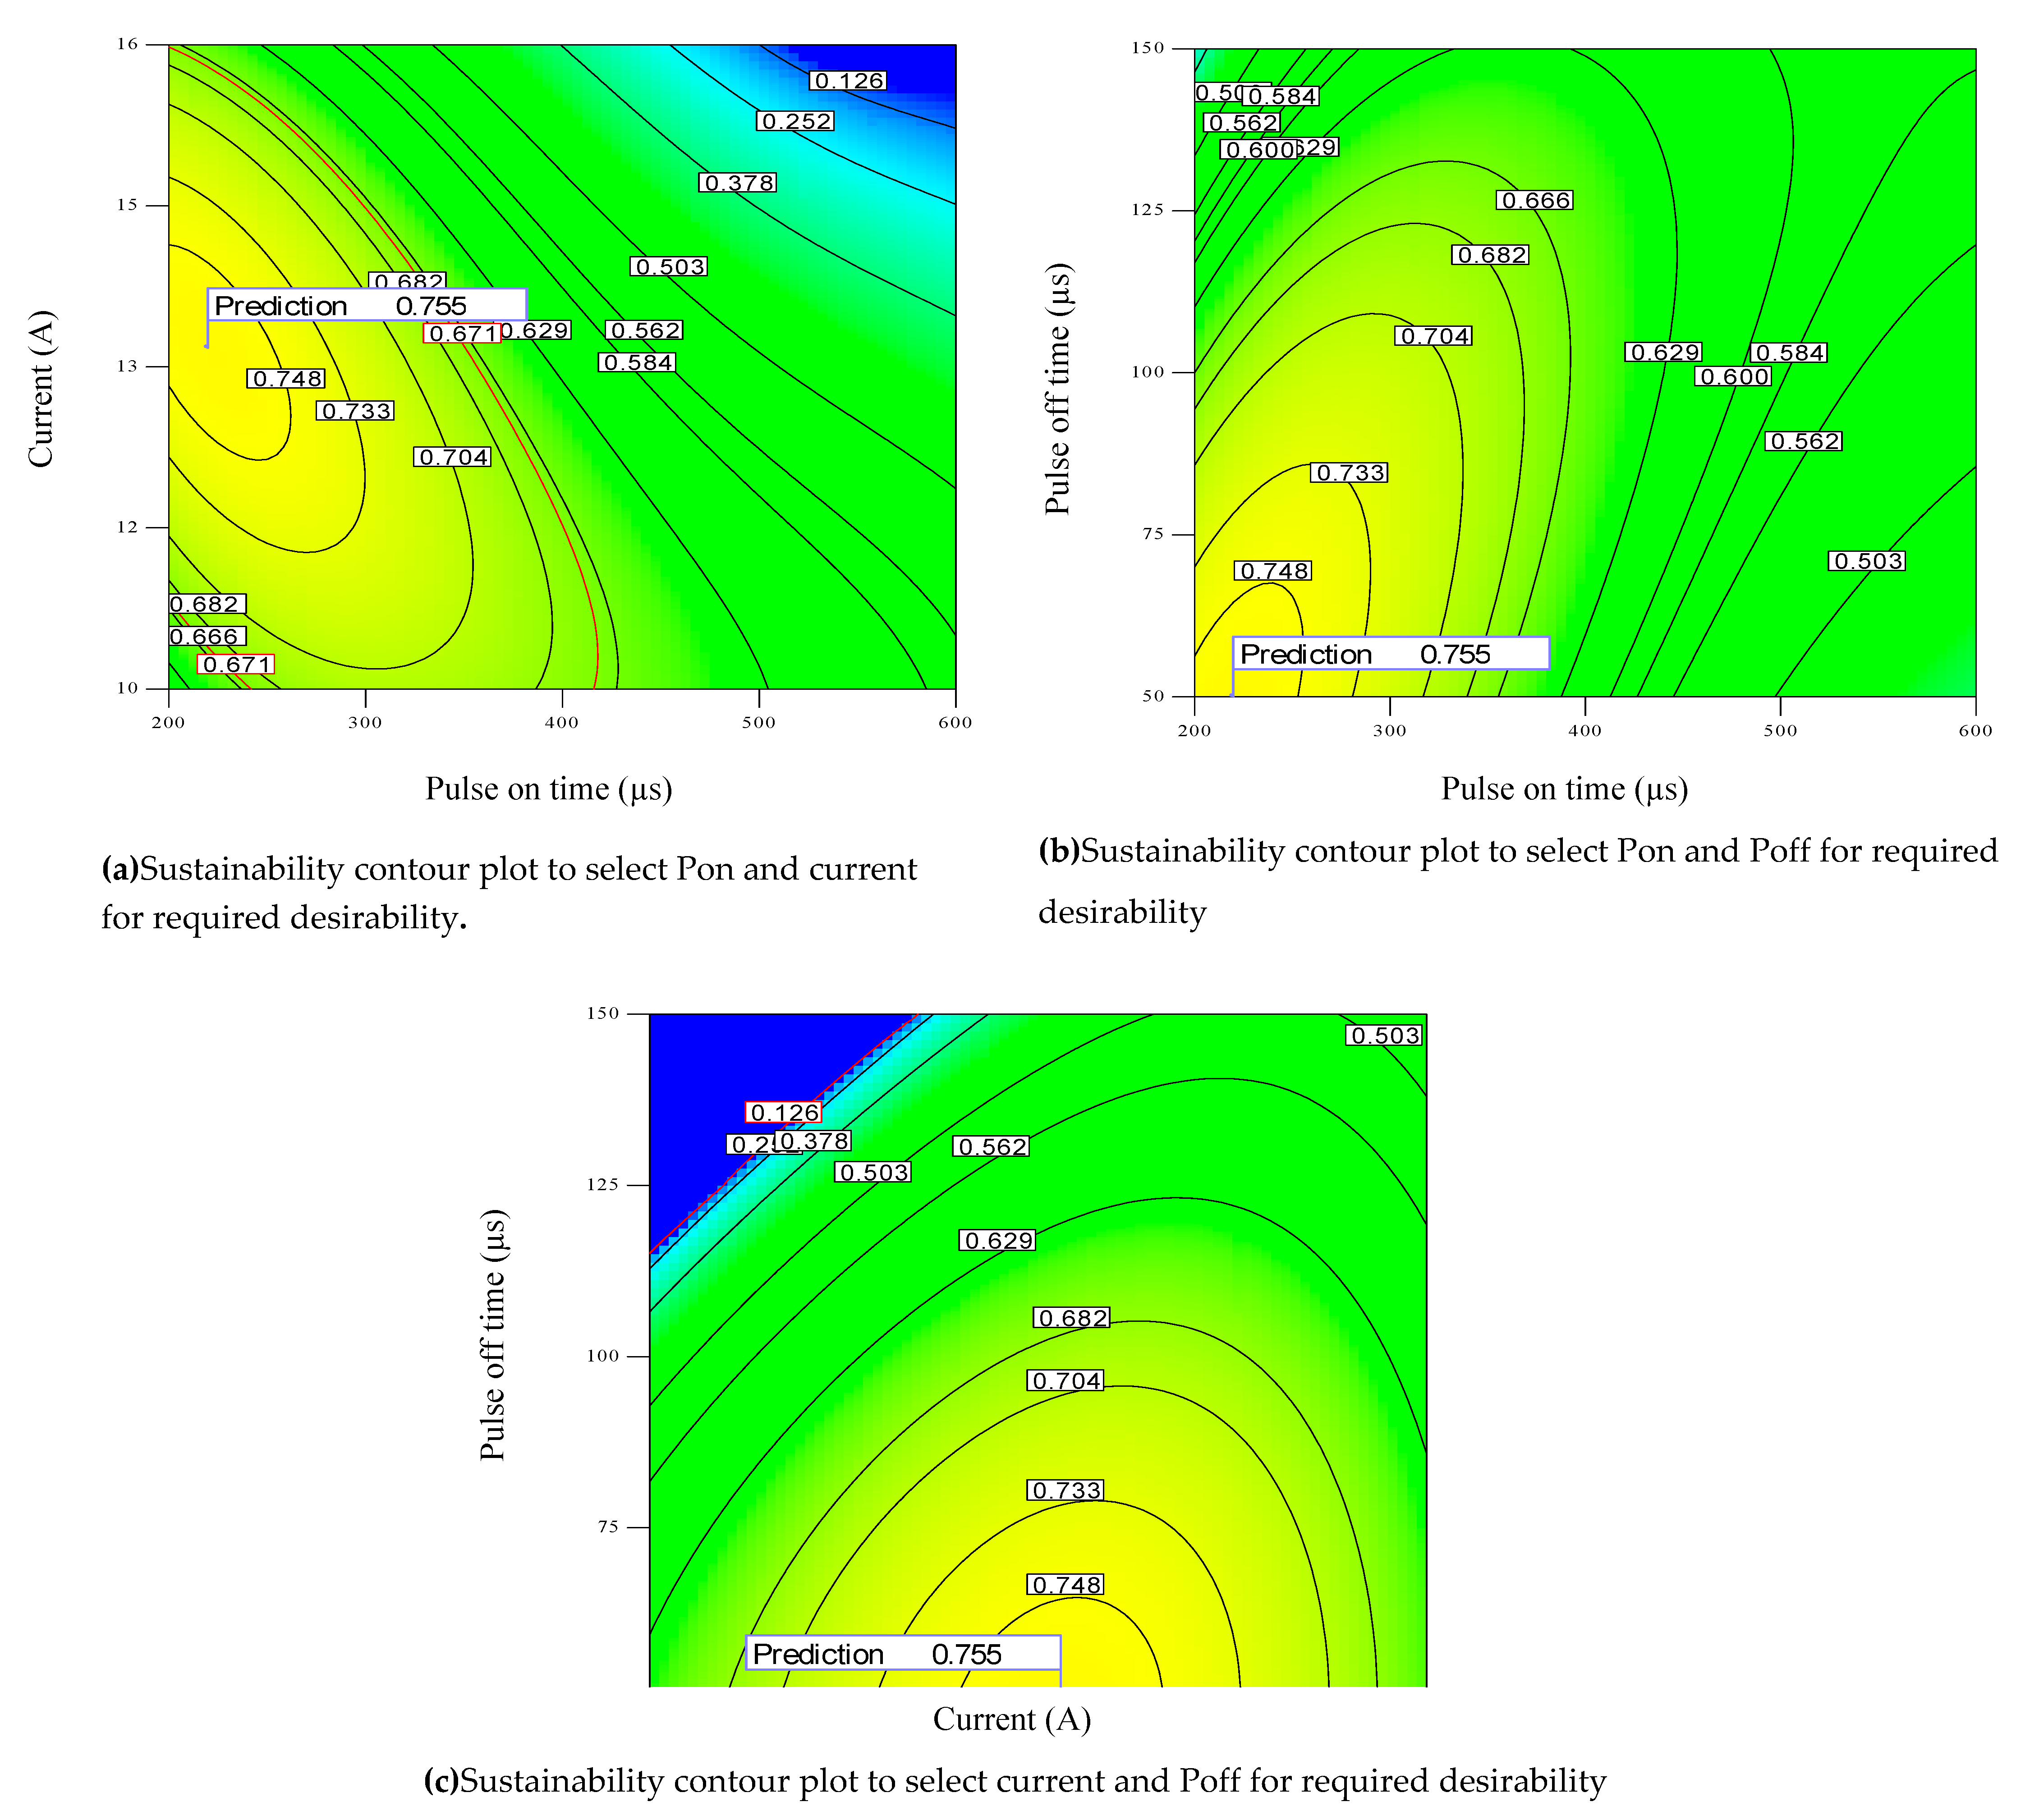
5. Optimization Associated with Sustainability

Sustainable machining aims to achieve high production rate at minimum cost while maintaining the highest quality standards. Simultaneous optimization of these objective functions leads to minimum environmental damage and thereby assures sustainable production. The performance measures for the current research include MRR, EWR and SR. The sustainability function is the combination of three objective functions and is given by the relation 7.
Sustainability = { Maximize   MRR   ( Productivity ) Minimize   EWR   ( Cost ) Minimize   SR   ( Quality )
On the basis of detailed analysis of empirical models and 3D response surfaces presented in previous sections, relationships of process parameters with respect to performance measures have been presented in Table 6. The table represents a comparison of two functions, “as-is” function versus “to-be” function. Here, “as-is” function characterizes achieved effects on performance measures (MRR, EWR and SR) while increasing level of the three process parameters (Pon, Current and Poff), for example, MRR, EWR and SR increase by increasing Pon and Current and vice versa. On the other hand, “to-be” function depicts the norm for desired sustainability. For instance, the objective function is to maximize MRR, while minimizing EWR and SR, whereas, in reality, all performance measures (MRR, EWR and SR) increase with the increase in Pon. Similar results are achieved by increasing current. Increase in Poff, on the other hand, leads to sustainable EWR and SR with compromised MRR.
From the above discussion, it can be concluded that the simultaneous optimization of these performance measures cannot be attained directly. To overcome this problem, multi-objective optimization has been carried out considering desirability. The purpose of the desirability function is to combine the effects of multiple responses into a single desirability value using mathematical transformation. This multi-objective optimization-based desirability has been accomplished in two stages namely (i) desirability identification and (ii) formulation of combined desirability geometric mean (CDGM). During the desirability identification stage, each performance measure Yi is converted into a single desirable value di having range 0 ≤ di ≤ 1, where 0 indicates the most undesirable value and 1 depicts the most desirable value. Once the desirability of individual performance measure has been obtained, they were combined into a single value using geometric mean. The desirability functions for maximizing MRR, minimizing EWR and SR and combined desirability geometric mean (CDGM) have been presented in Equations (8), (9) and (10) respectively [51,52,53].
di = { 0 , Y i   L i ( H i   Y i H i   L i ) w 1 , Y i   H i       ,   L i   <   y i   <   H i
di = { 0 , Y i   L i ( H i   Y i H i   L i ) w 1 , Y i   H i   ,   L i   <   y i   <   H i
DGM   =   ( d 1   ×   d 1   × ×   d n w n ) 1 n ,
where Hi, Li, w and n represent higher value, lower value, weight associated with a performance measure and number of performance measures respectively. The multi-objective optimization goals along with the conditions used for desirability approach have been provided in Table 7. All performance measures and process parameters are given equal weights (1) for both upper and lower limits and similarly equal importance value (3) for optimization. The process parameters values and achieved desirability are presented in Table 8. It is evident (from Table 8) that desirability values up to 75.5% have been achieved when all performance measures were given equal weights.
The corresponding values of process parameters and performance measures have been presented in Figure 10. The achievable ranges of performance measures are 1.9 mm3/min to 6.4 mm3/min for MRR, 1.5 mm3/min to 4.2 mm3/min for EWR and 1.47 µm to 5.10 µm for SR as shown in Figure 10. However, with maximum desirability of 75.5%, 4.47 mm3/min of MRR, 1.8 mm3/min of EWR and 2.01 µm SR can only be achieved. Practically on the shop floor, where machines exhibit different ranges, the process planners have the constraints of limited selection of process parameters values. For such critical situations, the contour plots (Figure 11a–c)) can be employed to use the available values with certain sustainability. For example, at 13A current and 400µs Pon, only 62.9% sustainability can be obtained (Figure 11a).

6. Microstructures Analysis

In order to have an explicit understanding of process parameters (Pon, current and Poff) on performance measures (MRR, EWR and SR), microstructures of machined parts have also been examined. Three samples were taken at low, middle and high levels of Pon and current while keeping Poff at the middle value of 100 µs. It is pertinent to mention that in this study, only Pon and current have been identified as the most significant process parameters as compared to Poff. The microstructures graphs of varying current and Pon have therefore been considered for detailed investigation. The microstructures graphs of samples are presented as Figure 12a–c). From Figure 12a, it is manifested that at lower levels of current and Pon (10 A and 200 µs) fewer numbers of craters, debris, globules, pits and voids are visible with minute level micro-cracks. Whereas an increase in the size of micro-cracks, debris, globules, pits craters and voids can be observed at middle levels of current (13 A) and Pon (400 µs), as presented in Figure 12b. Moreover, samples obtained at 16 A current (upper level) and Pon (600 µs) exhibited prominent micro-cracks, craters, debris, globules, pits and voids (Figure 12c). This clearly indicates that increase in current and Pon results in higher cracks, large globule size, pits and voids. This is due to increase vaporization at higher level of current and Pon.

7. Conclusions

The aim of this research was sustainable production by the enhancement of productivity and quality along with cost minimization during EDM of a low alloy tool steel (AISI L3). Initially, empirical models have been developed by analyzing the performance measures (MRR, SR and EWR) through response surface methodology. After that, multi-objective optimization, considering the sustainability, has been executed by instituting a compromise among productivity (MRR maximization), cost (EWR minimization) and quality (SR minimization). From the present investigation, the following interpretations can be concluded:
  • Pon and current are the most significant process parameters influencing performance measures, MRR, EWR and SR, to a great extent.
  • The higher values of MRR (productivity) can be achieved by keeping both Pon and current at their higher settings with Poff at its lower level. Conversely, lower values of SR and EWR (quality and cost) can be maintained at lower agreeable level of both Pon and current and upper level of Poff.
  • By performing multi-objective optimization while incorporating the sustainability measures, maximum MRR of 4.47 mm3/min, minimum EWR of 1.8 mm3/min and SR of 2.01 μm is obtained as compared to individual values obtained for maximum MRR (6.4 mm3/min), minimum EWR (1.5 mm3/min) and minimum SR (1.47 µm).
  • The microstructure analysis highlighted that the increase in Pon and current results in prominent micro-cracks, craters, debris, globules, pits and voids due to increase in vaporization at the high level of Pon and current.
  • The established sustainability contour plots can be employed successfully for feasible machine limits to attain a certain level of desirability.
Further research should evaluate the environmental aspect of sustainability using electric discharge machining. Besides, other performance measures like white/ grey recast layer and cost-based models should be investigated for improvement and enrichment of machining performance.

Author Contributions

Conceptualization, M.N., S.S. and W.A.; Data curation, M.N., S.S. and W.A.; Formal analysis, M.N. and S.S.; Funding acquisition, W.A. and K.S.; Investigation, M.N. and S.S.; Methodology, M.N.; Project administration, W.A. and E.S.; Resources, W.A.; Software, M.N., S.S. and W.A.; Supervision, W.A. and E.S.; Validation, W.A., E.S. and K.S.; Visualization, M.N., S.S., E.S. and K.S.; Writing–original draft, M.N.; Writing–review, editing, layout formatting M.N., S.S., E.S. and K.S. All authors have read and agreed to the published version of the manuscript.

Funding

The work is supported by the University of Engineering and Technology Taxila, Pakistan.

Acknowledgments

The authors would like to acknowledge the head and staff of Fracture and Mechanics Laboratory, University of Engineering and Technology Taxila, Pakistan for providing the experimental facility.

Conflicts of Interest

The authors declare no conflict of interest.

References

  1. Torres, A.; Puertas, I.; Luis, C.J. Modelling of surface finish, electrode wear and material removal rate in electrical discharge machining of hard-to-machine alloys. Precis. Eng. 2015, 40, 33–45. [Google Scholar] [CrossRef]
  2. Lin, Y.-C.; Cheng, C.-H.; Su, B.-L.; Hwang, L.-R. Machining characteristics and optimization of machining parameters of SKH 57 high-speed steel using electrical-discharge machining based on Taguchi method. Mater. Manuf. Process. 2006, 21, 922–929. [Google Scholar] [CrossRef]
  3. Cverna, F.; Conti, P. Worldwide Guide to Equivalent Irons and Steels; ASM International: Cleveland, OH, USA, 2006. [Google Scholar]
  4. Ho, K.; Newman, S. State of the art electrical discharge machining (EDM). Int. J. Mach. Tools Manuf. 2003, 43, 1287–1300. [Google Scholar] [CrossRef]
  5. Gamage, J.R.; DeSilva, A.K.M. Assessment of research needs for sustainability of unconventional machining processes. Procedia CIRP 2015, 26, 385–390. [Google Scholar] [CrossRef] [Green Version]
  6. Padhi, S.K.; Mahapatra, S.S.; Padhi, R.; Das, H.C. Performance analysis of a thick copper-electroplated FDM ABS plastic rapid tool EDM electrode. Adv. Manuf. 2018, 6, 442–456. [Google Scholar] [CrossRef]
  7. Mandaloi, G.; Singh, S.; Kumar, P.; Pal, K. Effect on crystalline structure of AISI M2 steel using copper electrode through material removal rate, electrode wear rate and surface finish. Measurement 2015, 61, 305–319. [Google Scholar] [CrossRef]
  8. Salonitis, K.; Stournaras, A.; Stavropoulos, P.; Chryssolouris, G. Thermal modeling of the material removal rate and surface roughness for die-sinking EDM. Int. J. Adv. Manuf. Technol. 2009, 40, 316–323. [Google Scholar] [CrossRef]
  9. Mondal, R.; De, S.; Mohanty, S.K.; Gangopadhyay, S. Thermal energy distribution and optimization of process parameters during electrical discharge machining of AISI D2 steel. Mater. Today Proc. 2015, 2, 2064–2072. [Google Scholar] [CrossRef]
  10. Guu, Y.H.; Hocheng, H.; Chou, C.Y.; Deng, C.S. Effect of electrical discharge machining on surface characteristics and machining damage of AISI D2 tool steel. Mater. Sci. Eng. A 2003, 358, 37–43. [Google Scholar] [CrossRef]
  11. Dhobe, M.M.; Chopde, I.K.; Gogte, C.L. Optimization of wire electro discharge machining parameters for improving surface finish of cryo-treated tool steel using DOE. Mater. Manuf. Process. 2014, 29, 1381–1386. [Google Scholar] [CrossRef]
  12. Gostimirovic, M.; Kovac, P.; Skoric, B.; Sekulic, M. Effect of electrical pulse parameters on the machining performance in EDM. Indian J. Eng. Mater. Sci. 2012, 18, 411–415. [Google Scholar]
  13. Thomas, D.; Kumar, R.; Singh, G.K.; Sinha, P.; Mishra, S. Modelling of surface roughness in coated wire electric discharge machining through response surface methodology. Mater. Today Proc. 2015, 2, 3520–3526. [Google Scholar] [CrossRef]
  14. Payal, H.S.; Choudhary, R.; Singh, S. Analysis of electro discharge machined surfaces of EN-31 tool steel. J. Sci. Ind. Res. 2008, 67, 1072–1077. [Google Scholar]
  15. Singh, A.; Kanth Grover, N. Wear properties of cryogenic treated electrodes on machining of En-31. Mater. Today Proc. 2015, 2, 1406–1413. [Google Scholar] [CrossRef]
  16. Baraskar, S.S.; Banwait, S.S.; Laroiya, S.C. Multiobjective optimization of electrical discharge machining process using a hybrid method. Mater. Manuf. Process. 2013, 28, 348–354. [Google Scholar] [CrossRef]
  17. Kanlayasiri, K.; Jattakul, P. Simultaneous optimization of dimensional accuracy and surface roughness for finishing cut of wire-EDMed K460 tool steel. Precis. Eng. 2013, 37, 556–561. [Google Scholar] [CrossRef]
  18. Tosun, N.; Cogun, C.; Tosun, G. A study on kerf and material removal rate in wire electrical discharge machining based on Taguchi method. J. Mater. Process. Technol. 2004, 152, 316–322. [Google Scholar] [CrossRef]
  19. Pellicer, N.; Ciurana, J.; Delgado, J. Tool electrode geometry and process parameters influence on different feature geometry and surface quality in electrical discharge machining of AISI H13 steel. J. Intell. Manuf. 2011, 22, 575–584. [Google Scholar] [CrossRef]
  20. Ferreira, J.C. A study of die helical thread cavity surface finish made by Cu-W electrodes with planetary EDM. Int. J. Adv. Manuf. Technol. 2007, 34, 1120–1132. [Google Scholar] [CrossRef]
  21. Shabgard, M.R.; Seyedzavvar, M.; Oliaei, S.N. Influence of input parameters on characteristics of EDM process. Strojniški vestnik-Journal Mech. Eng. 2011, 57, 689–696. [Google Scholar] [CrossRef] [Green Version]
  22. Amorim, F.L.; Weingaertner, W.L. The influence of generator actuation mode and process parameters on the performance of finish EDM of a tool steel. J. Mater. Process. Technol. 2005, 166, 411–416. [Google Scholar] [CrossRef]
  23. Kiyak, M.; Çakır, O. Examination of machining parameters on surface roughness in EDM of tool steel. J. Mater. Process. Technol. 2007, 191, 141–144. [Google Scholar] [CrossRef]
  24. Zarepour, H.; Tehrani, A.F.; Karimi, D.; Amini, S. Statistical analysis on electrode wear in EDM of tool steel DIN 1.2714 used in forging dies. J. Mater. Process. Technol. 2007, 187–188, 711–714. [Google Scholar] [CrossRef]
  25. Sultan, T.; Kumar, A.; Gupta, R.D. Material removal rate, electrode wear rate, and surface roughness evaluation in die sinking EDM with hollow tool through response surface methodology. Int. J. Manuf. Eng. 2014, 2014, 1–16. [Google Scholar] [CrossRef] [Green Version]
  26. Lin, J.L.; Lin, C.L. The use of grey-fuzzy logic for the optimization of the manufacturing process. J. Mater. Process. Technol. 2005, 160, 9–14. [Google Scholar] [CrossRef]
  27. Bundel, B. Experimental investigation of electrode wear in die-sinking EDM on different pulse-on & off time (µs) in cylindrical copper electrode. Int. J. Mod. Eng. Res. 2015, 5, 49–54. [Google Scholar]
  28. Dixit, A.C.; Kumar, A.; Singh, R.K.; Bajpai, R. An experimental study of material removal rate and electrode wear rate of high carbon-high chromium steel (AISI D3) in EDM process using copper tool electrode. Int. J. Innov. Res. Adv. Eng. 2015, 2, 257–262. [Google Scholar]
  29. Annamalai, N.; Sivaramakrishnan, V.; Baskar, N. Response surface modeling of electric discharge machining process parameters for EN 24 low alloy steel. In Proceedings of the 5th International & 26th All India Manufacturing Technology, Design and Research Conference, Guwahati, India, 12–14 December 2014. [Google Scholar]
  30. Mathew, N.; Kumar, D.; Beri, N.; Kumar, A. Study of material removal rate of different tool materials during EDM of H11 steel at reverse polarity. Int. J. Adv. Eng. Technol. 2014, 5, 25–30. [Google Scholar]
  31. Vates, U.K.; Singh, N.K. Optimization of surface roughness process parameters of electrical discharge machining of EN-31 by response surface methodology. Int. J. Eng. Res. Technol. 2013, 6, 835–840. [Google Scholar]
  32. Arunkumar, N.; Rawoof, H.S.A.; Vivek, R. Investigation on the effect of process parameters for machining Of EN31 (air hardened steel) by EDM. Int. J. Eng. Res. Appl. 2012, 2, 1111–1121. [Google Scholar]
  33. Singh, S.; Maheshwari, S.; Pandey, P.C. Some investigations into the electric discharge machining of hardened tool steel using different electrode materials. J. Mater. Process. Technol. 2004, 149, 272–277. [Google Scholar] [CrossRef]
  34. Purohit, R.; Rana, R.S.; Dwivedi, R.K.; Banoriya, D.; Singh, S.K. Optimization of electric discharge machining of M2 tool steel using grey relational analysis. Mater. Today Proc. 2015, 2, 3378–3387. [Google Scholar] [CrossRef]
  35. Amorim, F.L.; Dalcin, V.A.; Soares, P.; Mendes, L.A. Surface modification of tool steel by electrical discharge machining with molybdenum powder mixed in dielectric fluid. Int. J. Adv. Manuf. Technol. 2017, 91, 341–350. [Google Scholar] [CrossRef]
  36. Long, B.T.; Phan, N.H.; Cuong, N.; Jatti, V.S. Optimization of PMEDM process parameter for maximizing material removal rate by Taguchi’s method. Int. J. Adv. Manuf. Technol. 2016, 87, 1929–1939. [Google Scholar] [CrossRef]
  37. Molinetti, A.; Amorim, F.L.; Soares, P.C.; Czelusniak, T. Surface modification of AISI H13 tool steel with silicon or manganese powders mixed to the dielectric in electrical discharge machining process. Int. J. Adv. Manuf. Technol. 2016, 83, 1057–1068. [Google Scholar] [CrossRef]
  38. Samanta, A.; Sekh, M.; Sarkar, S. Influence of different control strategies in wire electrical discharge machining of varying height job. Int. J. Adv. Manuf. Technol. 2019, 100, 1299–1309. [Google Scholar] [CrossRef]
  39. Singh, V.; Bhandari, R.; Yadav, V.K. An experimental investigation on machining parameters of AISI D2 steel using WEDM. Int. J. Adv. Manuf. Technol. 2017, 93, 203–214. [Google Scholar] [CrossRef]
  40. Gov, K. The effects of the dielectric liquid temperature on the hole geometries drilled by electro erosion. Int. J. Adv. Manuf. Technol. 2017, 92, 1255–1262. [Google Scholar] [CrossRef]
  41. Lin, Y.-C.; Hung, J.-C.; Lee, H.-M.; Wang, A.-C.; Chen, J.-T. Machining characteristics of a hybrid process of EDM in gas combined with ultrasonic vibration. Int. J. Adv. Manuf. Technol. 2017, 92, 2801–2808. [Google Scholar] [CrossRef]
  42. Dwivedi, A.P.; Choudhury, S.K. Effect of tool rotation on MRR, TWR, and surface integrity of AISI-D3 steel using the rotary EDM process. Mater. Manuf. Process. 2016, 31, 1844–1852. [Google Scholar] [CrossRef]
  43. Tripathy, S.; Tripathy, D.K. Multi-response optimization of machining process parameters for powder mixed electro-discharge machining of H-11 die steel using grey relational analysis and topsis. Mach. Sci. Technol. 2017, 21, 362–384. [Google Scholar] [CrossRef]
  44. Talla, G.; Gangopadhyay, S.; Biswas, C.K. Multi response optimization of powder mixed electric discharge machining of aluminum/alumina metal matrix composite using grey relation analysis. Procedia Mater. Sci. 2014, 5, 1633–1639. [Google Scholar] [CrossRef] [Green Version]
  45. Shao, G.; Kibira, D.; Lyons, K. A virtual machining model for sustainability analysis. In Proceedings of the Volume 3: 30th Computers and Information in Engineering Conference, Parts A and B. (ASMEDC 2010), Montreal, QC, Canada, 15–18 August 2010; pp. 875–883. [Google Scholar]
  46. Pradhan, M.K. Estimating the effect of process parameters on MRR, TWR and radial overcut of EDMed AISI D2 tool steel by RSM and GRA coupled with PCA. Int. J. Adv. Manuf. Technol. 2013, 68, 591–605. [Google Scholar] [CrossRef]
  47. Niamat, M.; Sarfraz, S.; Aziz, H.; Jahanzaib, M.; Shehab, E.; Ahmad, W.; Hussain, S. Effect of different dielectrics on material removal rate, electrode wear rate and microstructures in EDM. Procedia CIRP 2017, 60, 2–7. [Google Scholar] [CrossRef]
  48. Niamat, M.; Sarfraz, S.; Shehab, E.; Ismail, S.O.; Khalid, Q.S. Experimental characterization of electrical discharge machining of aluminum 6061 T6 alloy using Different Dielectrics. Arab. J. Sci. Eng. 2019, 44, 8043–8052. [Google Scholar] [CrossRef] [Green Version]
  49. Sarfraz, S.; Jahanzaib, M.; Wasim, A.; Hussain, S.; Aziz, H. Investigating the effects of as-casted and in situ heat-treated squeeze casting of Al-3.5 % Cu alloy. Int. J. Adv. Manuf. Technol. 2017, 89, 3547–3561. [Google Scholar] [CrossRef]
  50. Sarfraz, S.; Shehab, E.; Salonitis, K.; Suder, W. Experimental Investigation of Productivity, Specific Energy Consumption, and Hole Quality in Single-Pulse, Percussion, and Trepanning Drilling of IN 718 Superalloy. Energies 2019, 12, 4610. [Google Scholar] [CrossRef] [Green Version]
  51. Davoodi, B.; Eskandari, B. Tool wear mechanisms and multi-response optimization of tool life and volume of material removed in turning of N-155 iron–nickel-base superalloy using RSM. Measurement 2015, 68, 286–294. [Google Scholar] [CrossRef]
  52. Assarzadeh, S.; Ghoreishi, M. A dual response surface-desirability approach to process modeling and optimization of Al2O3 powder-mixed electrical discharge machining (PMEDM) parameters. Int. J. Adv. Manuf. Technol. 2013, 64, 1459–1477. [Google Scholar] [CrossRef]
  53. Hanif, M.; Ahmad, W.; Hussain, S.; Jahanzaib, M.; Shah, A.H. Investigating the effects of electric discharge machining parameters on material removal rate and surface roughness on AISI D2 steel using RSM-GRA integrated approach. Int. J. Adv. Manuf. Technol. 2019, 101, 1255–1265. [Google Scholar] [CrossRef]
Figure 1. (a) Pareto chart for process parameters selection (b) Selected process parameters.
Energies 13 00038 g001aEnergies 13 00038 g001b
Figure 2. Literature review.
Energies 13 00038 g002
Figure 3. Samples of work material.
Energies 13 00038 g003
Figure 4. (a) Normal probability plot of residuals and (b) Predicted versus actual responses for material removal rate (MRR).
Energies 13 00038 g004
Figure 5. (a) Normal probability plot of residuals and (b) Predicted versus actual responses electrode wear rate (EWR).
Energies 13 00038 g005
Figure 6. (a) Normal probability plot of residuals and (b) Predicted versus actual responses for surface roughness (SR).
Energies 13 00038 g006
Figure 7. Response surface graphs showing the effects of (a) Pon and current, (b) Pon and Poff and (c) current and Poff on material removal rate.
Energies 13 00038 g007
Figure 8. Response surface graphs showing the effects of (a) Pon and current, (b) Pon and Poff and (c) current and Poff on electrode wear rate.
Energies 13 00038 g008
Figure 9. Response surface graphs showing the effects of (a) Pon and current, (b) Pon and Poff and (c) current and Poff on surface roughness.
Energies 13 00038 g009
Figure 10. Achievable range of performance measures against specific process parameters range with desirability 0.755.
Energies 13 00038 g010
Figure 11. Sustainability contour plot to select parameters for required desirability.
Energies 13 00038 g011
Figure 12. Scanning electron microscope (SEM) microstructures (a) at lower level of current (10 A) and Pon (200 µs), (b) at intermediate level of current (13 A) and Pon (400 µs), (c) at higher level of current (16 A) and Pon (600 µs).
Energies 13 00038 g012
Table 1. Chemical properties of AISI L3 low alloy tool steel.
CompositionCCrMnPSiSVFe
Weightage (%)1.021.30.590.010.320.010.18Balance
Table 2. Process parameters with their levels.
Process ParametersLevels
LowMiddleHigh
Pulse On Time (µs)200400600
Current (A)101316
Pulse Off Time (µs)50100150
Table 3. Design matrix.
Exp RunProcess ParametersPerformance Measures
Pulse On TimeCurrentPulse Off TimeMaterial Removal RateElectrode Wear RateSurface Roughness
(Pon) (Poff)(MRR)(EWR)(SR)
µsAµsmm3/minmm3/minµm
1200101001.571.140.64
2600101003.492.591.18
3200161002.841.773.10
4600161008.464.583.58
520013503.071.391.65
660013505.302.502.40
7200131500.771.001.20
8600131505.494.091.63
940010504.772.241.21
1040016508.703.563.56
11400101504.572.640.67
12400161506.423.573.10
13400131007.503.112.10
14400131007.803.002.19
15400131007.693.262.23
16400131007.723.122.12
17400131007.773.112.22
Table 4. ANOVA results for material removal rate, electrode wear rate and surface roughness.
Material Removal Rate
SourceSum of SquaresdfMean SquareF Valuep-Value
Prob > F
Model100.14911.13546.97<0.0001
A-Pon26.25126.251290.18<0.0001
B-Current18.06118.06887.81<0.0001
C-Poff2.6312.63129.46<0.0001
AB3.4213.42168.25<0.0001
AC1.5511.5576.20<0.0001
BC1.0811.0853.170.0002
A238.70138.701902.51<0.0001
B21.3911.3968.26<0.0001
C24.2714.27209.79<0.0001
Residual0470.020
Lack of Fit0.08730.0292.100.2432
Pure Error0.05540.014
Cor. Total100.2816
Std. Dev.0.14R-Squared0.9986
Mean5.53Adj. R-Squared0.9968
C.V. %2.58Pred. R-Squared0.9852
PRESS1.48Adeq Precision73.693
Electrode wear rate
SourceSum of SquaresdfMean SquareF Valuep-value
Prob > F
Model15.8272.26104.91<0.0001
A-Pon8.9518.95415.23<0.0001
B-Current2.9612.96137.60<0.0001
C-Poff0.3210.3215.040.0037
AB0.4610.4621.460.0012
AC0.9810.9845.49<0.0001
A21.9211.9289.18<0.0001
C20.1610.167.230.0248
Residual0.1990.022
Lack of Fit0.1650.0323.740.1129
Pure Error0.03448.55 × 10−3
Cor. Total16.0216
Std. Dev.0.15R-Squared0.9879
Mean2.75Adj. R-Squared0.9785
C.V. %5.35Pred. R-Squared0.9398
PRESS0.96Adeq Precision35.252
Surface roughness
SourceSum of SquaresdfMean SquareF Valuep-value
Prob > F
Model13.4271.92653.02<0.0001
A-Pon0.6110.61206.02<0.0001
B-Current11.62111.623955.57<0.0001
C-Poff0.6210.62209.78<0.0001
AC0.02610.0268.720.0162
A20.2210.2276.51<0.0001
B20.1410.1448.54<0.0001
C20.2110.2170.03<0.0001
Residual0.02692.937 × 10−3
Lack of Fit0.01352.51 × 10−30.720.6406
Pure Error0.01443.47 × 10−3
Cor. Total13.4516
Std. Dev.0.054R-Squared0.9980
Mean2.05Adj. R-Squared0.9965
C.V. %2.65Pred. R-Squared0.9905
PRESS0.13Adeq Precision79.960
Table 5. Evaluation of predicted and actual performance measures.
Run No.Process ParametersPerformance MeasuresPercentage Error
PredictedActual
PonCurrentPoffMRREWRSRMRREWRSRMRREWRSR
μsAμsmm3/minmm3/minμmmm3/minmm3/minμm%%%
130012805.752.301.665.962.241.613.652.63.01
250012807.003.041.967.182.931.922.573.612.04
3300121205.182.261.85.382.241.883.800.894.4
4500141208.103.922.518.183.872.570.981.282.39
5300141205.732.552.275.562.632.312.93.141.76
650014808.453.562.778.573.642.81.422.251.08
Table 6. As-is and To-be sustainability function.
ParametersAs-Is Function
(Achieved Function)
To-Be Sustainability Function
(Desired Sustainability Function)
MRREWRSRMRREWRSR
A: Pon Energies 13 00038 i001 Energies 13 00038 i001 Energies 13 00038 i001 Energies 13 00038 i001 Energies 13 00038 i002 Energies 13 00038 i002
B: Current Energies 13 00038 i001 Energies 13 00038 i001 Energies 13 00038 i001 Energies 13 00038 i001 Energies 13 00038 i002 Energies 13 00038 i002
C: Poff Energies 13 00038 i002 Energies 13 00038 i002 Energies 13 00038 i002 Energies 13 00038 i002 Energies 13 00038 i001 Energies 13 00038 i001
Notation: Energies 13 00038 i001 represents increasing function and Energies 13 00038 i002 represents decreasing function.
Table 7. Conditions for optimization.
ConditionUnitsGoalLimitsWeightsImportance
LowerUpperLowerUpper
A:PonµsIn range200600113
B:CurrentµsIn range1016113
C:PoffAIn range50150113
MRRmm3/minMaximize1.906.40113
EWRmm3/minMinimize1.494.23113
SRµmMinimize1.475.11113
Table 8. Achieved desirability.
No.PonCurrentPoffMRREWRSRDesirabilityRemarks
µsAµsmm3/minmm3/minµm
1220.2113.1750.004.471861.803642.010940.755Selected
2220.1313.2150.004.480821.804492.020740.755
3215.9013.2850.004.450331.76442.035680.755

