1. Introduction
The unconventional resource, which generally oil and gas resources, are the resources that are ‘locked’ in unconventional formations (such as shale and tight sandstone) and specialized production techniques (such as hydraulic fracturing and SAGD) are required [
1]. Unconventional oil is a special type of petroleum which is difficult to extract or refine, due to its high viscosity or being trapped/locked in geological structure with compacted or poorly connected pore spaces (such as oil sand, bitumen and shale oil, etc.) [
2,
3]. Therefore, the extraction of unconventional oil is relatively economically challenging. However, with the new technologies that have been continually developed, the cost of the production of unconventional oil resources can be significantly reduced. The development of unconventional oil resources has become a major priority worldwide nowadays in response to the increasing global energy demands, as well as the depletion of conventional oil resources.
Steam assisted gravity drainage (SAGD) has been the most widely used method for heavy oil in-situ recovery in western Canada (
Figure 1) [
5]. In SAGD, two parallel horizontal wells are drilled with an inter-well offset of around 4–6 m. High-temperature and high-pressure steam is injected into the reservoir through upper wellbore (injector) and form the steam chamber. Bitumen in the steam chamber is heated up and flow by gravity then produced by the lower wellbore (producer). SAGD solves the immobility challenge in in-situ bitumen recovery by taking advantage of the strong temperature dependency of bitumen viscosity.
Slotted liners have been extensively used in Western Canada for heavy oil recovery in SAGD operation. Sanding, inflow resistance and cost have become the main considerations in slotted liner design. These main factors determine the competing factors of slotted liner: (1) The slots must be narrow enough to retain formation sands; and yet (2) wide enough to minimize flow resistance/impairment. It has been proven that plugging plays a critical role in slotted liner’s damage [
6,
7]. Plugging in slotted liner can be attributed to two main mechanisms: (1) Pore plugging, in which the pore throats in the porous media are plugged by migrated fines, clays or other byproducts; and (2) slot plugging, which is defined as the reduction in the slot open area, due to trapped sands and fines, scaling, and corrosion. The consequence of plugging is the increase of inflow resistance and production decline, as well as the increase in drawdown pressure.
A primary source of plugging in porous media is flow-induced fines migration. The fines migration occurs in four stages: (1) Fines generation, (2) fines mobilization, (3) fines transportation, and (4) fines entrapment [
5]. It has been found that, in addition to the clay particle size, porous structure, mineralogy and electro-chemical interaction of the fines, the saturating fluids also influence the fines migration.
Several studies have been conducted to investigate the plugging mechanisms of slots. Ramonava and Ma [
7] took mosaic images of clean and plugged slots by using the backscattered electron detector on a scanning electron microscope. By analyzing the images, they concluded that the slot plugging starts with the formation of a microfilm clay on the surface of the slot. The microfilm tends to ‘grow’ upwards on the slot surface, infills the pores between the sand grains inside the slot and finally fully plugs the slot [
8]. Based on the results proposed by Ramonava and Ma [
7], clay products are the main plugging materials.
Previous laboratory studies employed single slot coupons, and proposed several sizing rules for slotted liner design, in which an optimum slot opening size was provided based on the Particle Size Distribution (PSD) of formation sand. These research works investigated the influence of slot opening size on slotted liner performance, but ignored the slot density. Slot density is a parameter that describes the density of slots on a typical slotted liner. It is usually represented by Slot per Volume (SPC), which is the numbers of slots in one column of a 7 inch diameter slotted liner. Slot density has proven to be an important parameter that affects the inflow resistance. There is a relationship between the slot density and pressure loss, due to flow distribution. The open flow area (OFA) of the liner, which is defined as the ratio of the open area exposed to the reservoir over the total area, depends on both slot width and slot density: Narrower slot openings would demand a higher slot density, which increases the manufacturing cost and decrease the mechanical strength. Thus, it is necessary to investigate the influence of slot density on liner performance. This study presents the results of parametric testing to investigate the effect of slot width and slot density on sand production, retained permeability, and fines migration.
Sand production and plugging are also affected by the flow velocity [
9]. At a constant flow rate, the OFA of slotted liner would determine the flow velocity inside the slots. Since the design criteria are proposed as a safe slot window, there exist variable combinations of slot width and slot density which result in the same OFA. Manufacturers are prone to choosing a more conservative design by selecting a narrower slot width, but a higher slot density. The question is, for a constant OFA, is it better to use narrower slots with higher slot density or wider slots with a lower slot density? To address this question, coupons with different combinations of slot width and slot density, but the same OFA were tested.
2. Review of Published Guidelines in Designing Sand Control Devices
Extensive research has been performed to optimize the design of slotted liners. Performance assessment of slotted liners is based on their ability to prevent sand production and to allow the passage of reservoir flow. Historically, design guidelines have been proposed in relation to the particle size and slot width. The central phenomena considered in the slotted liner design are the inflow performance and sand control. Considering these two factors, the current design criteria are proposed in terms of slot aperture window in relation to one or more attributes of the formation sand PSD [
10,
11,
12,
13,
14,
15,
16,
17]. The OFA is another important parameter that can influence the flow performance [
18]. Conventionally, the upper bound of the slot aperture is the aperture that keeps sanding at an acceptable level, while the lower bound is specified based on conditions that limit the plugging tendency [
11].
Retained Permeability (RP) is another widely used parameter to measure the slotted liner inflow efficiency and is defined as the ratio of near-screen permeability over the original formation permeability. A retained permeability of 50% is also proposed as the limit for the inflow resistance [
19]. As for the sand production, the maximum thresholds of 0.12 lb/sq ft (0.58 kg/m
2) [
20], and 0.15 lb/sq ft (0.73 kg/m
2) [
21] have been used to measure the sanding performance.
The overall design objectives of a sand control device are: (1) Allowing the maximum production flow rate with lowest pressure drop, or in other words, providing the optimal ‘formation-specific’ sand control with the lowest plugging level, (2) providing stability of the wellbore against geological stresses, and (3) prevention of the production of the formation sand and the erosion of downhole equipment [
6].
Inflow efficiency and sand control performance are the two key parameters in the design. The flow efficiency is mostly controlled by the OFA and the slot width. A larger slot width will result in a lower plugging, and therefore, a higher flow efficiency. However, a larger slot width will lead to a lower sand retention performance in the formation. Consequently, an optimum slot aperture must be determined to keep both sanding and plugging at an acceptable level.
2.1. Criteria for Sand Control Devices in Conventional Production Wells
The majority of studies for developing design criteria for sand control devices are experimental. The earliest work in this area is attributed to Coberly [
9] who conducted a series of tests to establish the mechanism of the stable sand bridge behind a slot. He found that a stable bridge of typical unconsolidated oil sands forms when the opening in the screen is two times the diameter of the coarse ten percent in PSD (w = 2D10). When the openings exceed two times D10, no bridge will form. He concluded that the slot width should not be larger than 2D10. He also mentioned that when facing a mixture of particles with different diameters, the sand control performance of screens is dependent on the coarse portion of the mixture.
Similar to Coberly [
9], Suman [
10] proposed his design criterion based on the experimental investigations on synthesized grains with certain particle size distributions to mimic the natural formation sand. He proposed that the slot width should be equal or less than the size of coarsest ten percent of the formation particles size (w < D10). Although using particles with different sizes makes the result more reliable compared to the previous study, the criterion seems to be too conservative. Furthermore, it was quite rudimentary to select slot opening based on only one parameter of the formation sand (D10).
Instead of relying on one data point from the PSD to describe the entire formation sand character, Markestad et al. [
11] used a complete description of particle size distribution to characterize the sand control performance and plugging tendency of single wrapped screens. They stated that when considering the sand retention capacity, the slot width should not exceed a certain level. Therefore, the proposed design criteria are given in relation to the sizes of larger particles on the PSD curve. However, when the purpose is to predict the plugging tendency, the smaller particle sizes on the PSD curve should be used. In their study, a range of acceptable slot width was provided for a typical sand type. The upper limit was determined by sand retention performance, and the lower limit was selected to avoid plugging. To represent the entire particle size distribution, they created a descriptive method based on the fractal theory [
22]. A series of laboratory experiments were performed to find the safe intervals of slot width. From their result, four slot widths were defined: (1) d++ is defined as the largest slot width for which severe sanding is observed; (2) d−− is defined as the smallest slot width for which plugging did occur; (3) d+ is the largest slot width for which sanding did not occur; and (4) d− is the smallest slot width for which plugging was not likely to occur. d++ and d are the extreme upper and lower limitations that should not be exceeded. The “safe interval” was considered to be between d+ and d−. However, they did not quantify such evaluative parameters as “continuous sand production” or “severe plugging” in their research.
Tiffin et al. [
23] suggested using the formation of sand sorting characteristics to develop the selection criteria for different screens. The parameter that they suggested to use was the sorting coefficient. Different from the uniformity coefficient, sorting coefficient represents the entire range of the PSD. They also took the fines (Mesh#325, 44 μm) into consideration since they may induce or promote plugging at the near-liner zone.
Williams et al. [
24] tested gravel pack and other screen control devices with two modes of testing: Conformance or pre-pack sand retention test, and non-conformance or slurry sand retention test. Based on the testing results, they recommended that a uniform mesh media allow the passage of a small percentage of fines which leads to the creation of a dynamic filter bed on the sand control media. Furthermore, it was suggested that the openings should be designed to allow less than 6% of sand in the effluent to pass through and the size of the produced sand should be less than 50 microns (D50 ≤ 50 μm).
2.2. Criteria for Sand Control Devices in Horizontal Production Wells
Underdown et al. [
21] proposed a standard method to evaluate the performance of sand control screens from different manufacturing companies. Experimental investigations were conducted on several screen types for screen type selection for some wellbores in the North Sea and Western Africa. They suggested that the design criteria of a sand control screen should account for both sand retention and screen plugging. Underdown et al. [
25] defined a parameter called sand control factor and used it to characterize sand retention. The screen plugging was represented by a performance factor which is an indication of the time it takes for the screen to plug. A perfect sand control screen would have a value equal to one for both factors.
Gillespie et al. [
13] proposed a similar method to that of Underdown et al. [
25] named “screen efficiency plot”. Nomographs were created by plotting the percentage of produced sand versus the rate of pressure build-up. In this situation, the ideal screen should have nearly zero pressure build-up value in the plot. Their experimental work was based on two types of samples: Very fine and uniform sand, and non-uniform sand. The results of their tests show that for premium mesh-type screens, when the uniformity coefficient (UC) is less than six, the recommended slot opening should be 2.5 times the mean grain size (2.5D50), while only 2D50 for wire-wrapped screens.
In addition to the amount of produced sand and flow capacity reduction, Hodge et al. [
19] developed a new evaluation method that accounts for the actual permeability reduction of the near screen layer (sand-retention layer). This procedure, for the first time, quantified the screen plugging. Based on the author’s field production experience, the acceptable value of produced sand for long horizontal wellbores in poorly consolidated reservoirs was considered to be 0.12 lb/sq ft (0.58 kg/m
2) (pound per square feet of screen inflow area). However, they did not explain whether this value is for the initial sand production or the continuous sanding. Same parameter of 0.15 lb/sq ft (0.73 kg/m
2) has been presented for horizontal, open-hole completion by Adams et al. [
26] for oil wells.
In terms of the flow impairment, Markestad et al. [
11] proposed a skin value of less than 0.5 for a well-functioning screen. Burton and Hodge [
27] suggested 20% retained screen permeability for minimal productivity impairment. Later, Constien and Skidmore [
20] defined the ‘effective formation-particle size’ which is equal to the media sand size divided by the uniformity coefficient (D50/UC). Based on the effective formation-particle size, they developed the performance master curves to predict the performance of standalone screens. The critical values of three performance indicators were also given: Produced sand less than or equal to 0.12 lb/sq ft (0.58 kg/m
2); the retained permeability more than or equal to 50%; the size of upper ten percent of produced sand less than or equal to 50 micron (D10 ≤ 50 μm).
2.3. Existing Criteria for Sand Control Devices in SAGD Wells
The sizing rules proposed by previous researchers is not applicable to thermal recovery sand-control device selection. Bennion et al. [
6] presented a lab protocol for an accurate simulation of downhole multiphase flow conditions during SAGD operations. Based on over 200 sand retention tests, they found that the clay content of the formation, flow velocity, wettability of formation and pH play crucial roles in the plugging mechanism and productivity of slotted liners. Bennion et al. [
6] also stated that clays are the main plugging medium in slots: Higher clay concentration results in a higher plugging potential. In addition, plugging is initiated by clay adherence in the slot, and then grows upward to the slot entry.
The design criteria that have been utilized in the slotted liner manufacturing company “RGL” are published by Fermaniuk [
28]. He developed a numerical model based on the design guidelines of slotted liners at Regent Energy. The criteria that he provided, come as a “safe range” of slot openings for specific formation sand. The upper and lower bounds of the range were set at 3.5 times the mean formation sand size (MaxSW = 3.5D50), and two times the smaller 30% sand size (MinSW = 2D70), respectively.
Mahmoudi et al. [
15] provided a set of new design criteria described by a novel “traffic light system (TLS)”. Like Fermaniuk [
28], their design criteria provide a safe slot window with respect to sand control performance and flow capacity. In their study, a novel pre-pack sand retention test (SRT) facility, capable of testing multi-slot coupons, was designed to investigate the effect of both slot width and slot density. Furthermore, they evaluated the effect of flow rate in the design criteria to consider actual wellbore operations.
Mechanisms of sanding and plugging in sand control devices have been subjected to many studies over the past decades. Most of the design guidelines proposed earlier are based on one or more parameters of the formation of sand particle distribution [
9,
10,
11,
12,
13,
14,
15,
16,
17,
18,
19,
20,
21,
23,
24,
25,
26,
27,
28]. Additionally, slot density which is described by numbers of slots per volume, has been used to investigate the interaction between slots. It is also considered as another parameter to establish slotted liner design criteria. However, the current design criteria failed to include the stress variation during oil production. Oil production induced pressure depletion result in the alteration of the stress condition around the slotted liner, which affect its sand control performance. In this study, the effect of stress on sand production has been investigated together with slot width and density, and is incorporated in the design criteria for slotted liners in SAGD operations. In order to do so, a novel sand control testing facility (scaled completion test, SCT) is utilized to study the performance of sand control tools for different stress regimes (triaxial compression/extension) [
16,
29]. The stress levels correspond to stress 218 variations during the life cycle of a SAGD production well.
3. Experimental Investigation
This section describes the experimental set-up, testing material and procedures employed in this study.
3.1. Scaled Completion Test (SCT) Set-Up
The experimental apparatus used in this study (Scaled Completion Test, SCT) [
16,
29,
30], accommodates the sand-pack sample on top of a sand screen coupon. Compared to conventional SRT set-ups, it has the versatility to use multi-slot liner samples which is an improved design to replicate the actual flow regime and streamlines near the sand control device/slotted liner of a production well. Furthermore, the facility was capable of applying both axial and radial stress to the sample, respectively. The pore fluid is injected by a metering pump which allows the pore pressure to be controlled individually. The application of effective stress, which is defined by total stress minus pore pressure [
31], allows the investigation of the effect of stress build-up and sand compaction at the near-screen zone on the liner performance.
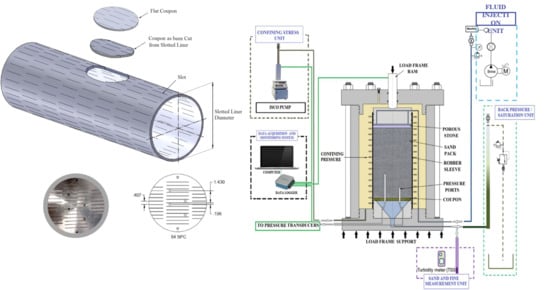
The SCT set-up (
Figure 2) consists of a fluid injection unit, the SCT cell, confining stress and axial loading unit, DAQ (Data Acquisition) unit, sand trap and back pressure unit.
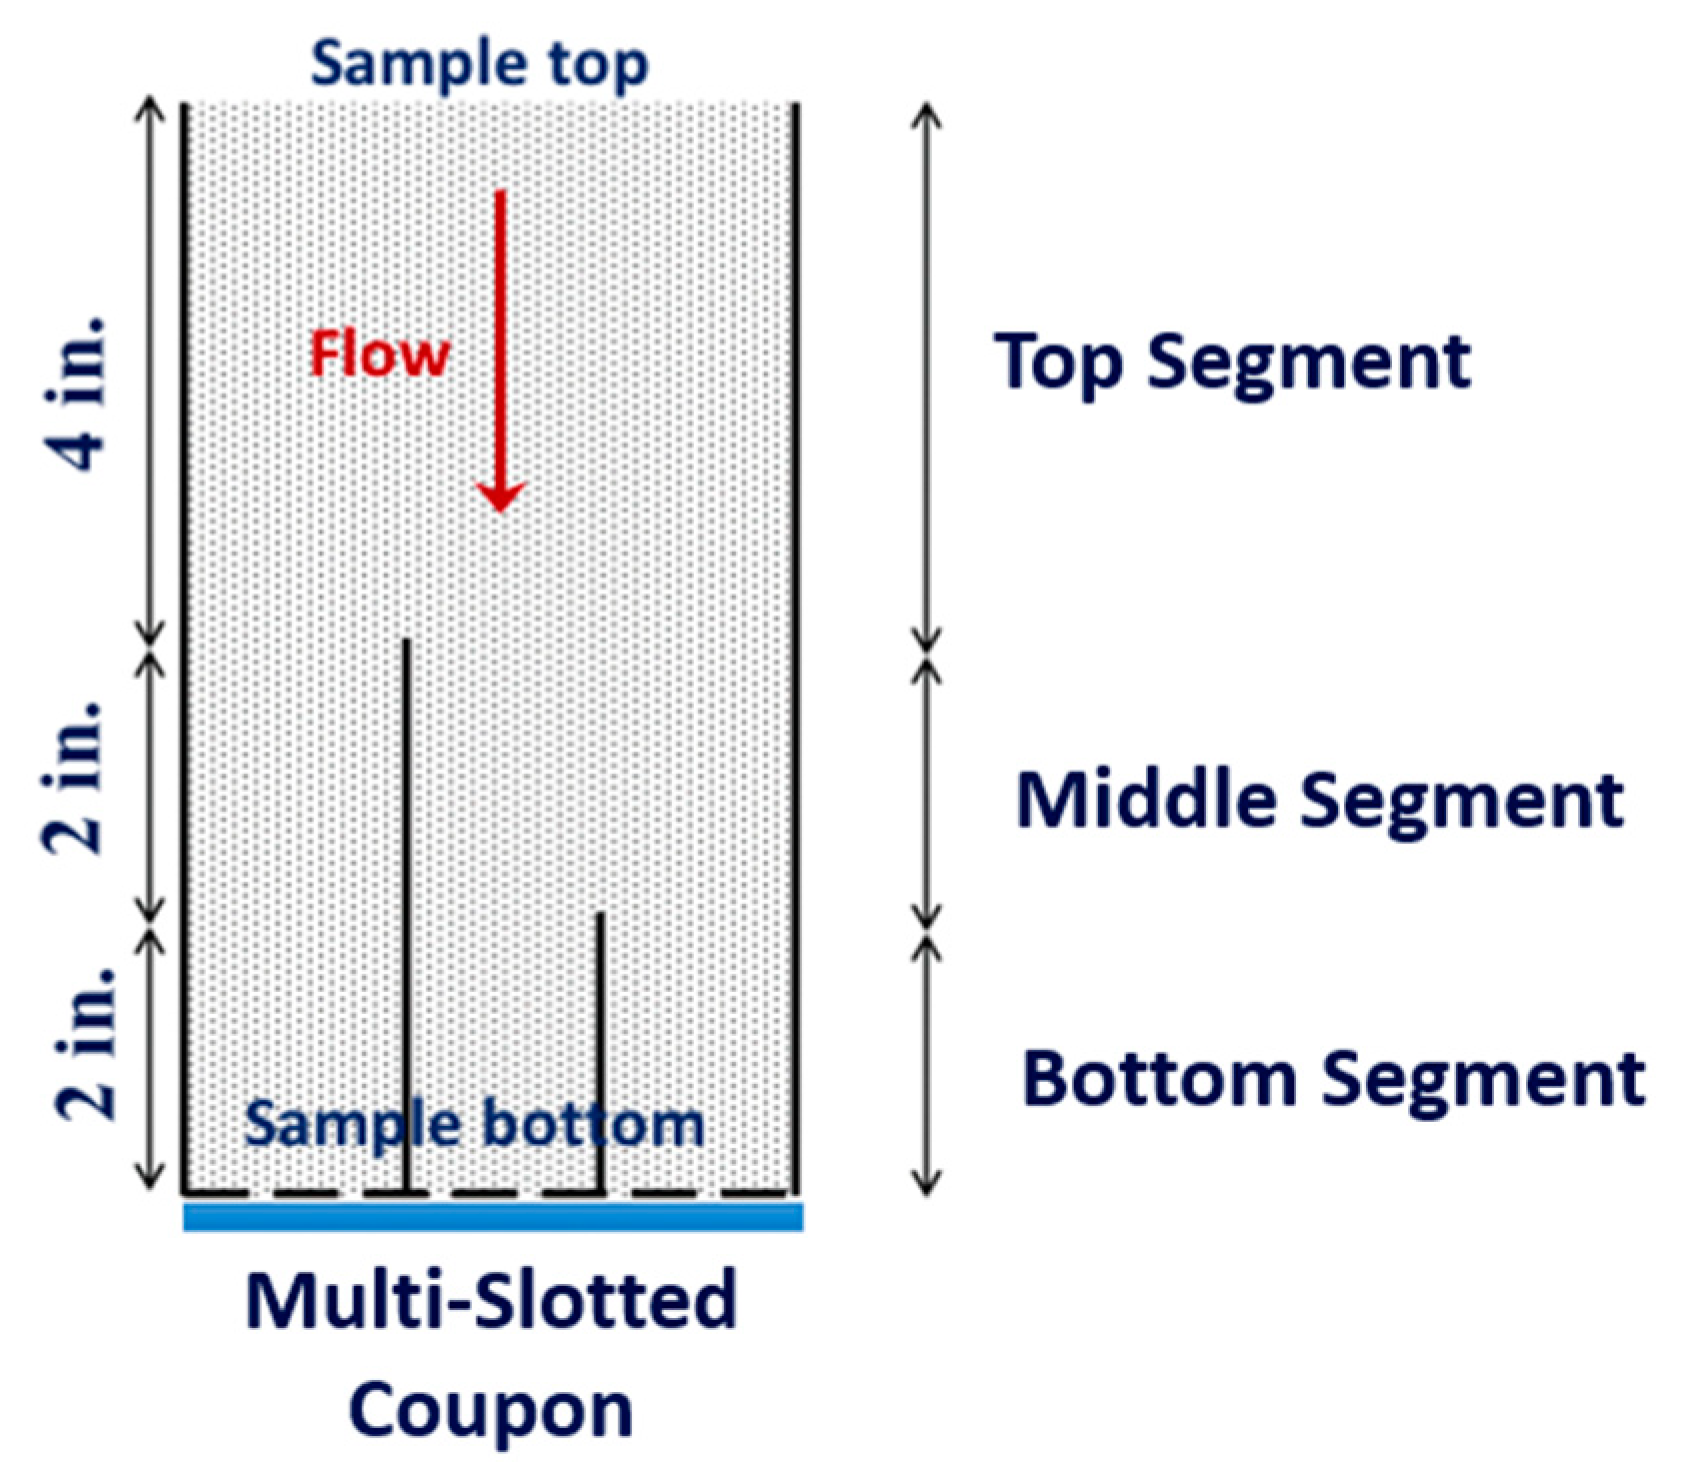
An ISCO pump is used in the fluid injection unit for the brine injection and pore pressure control. The fluid is injected from the top of the sample through the sand-pack towards the coupon. The SCT cell is a modified triaxial cell that accommodates the multi-slot coupon and large-scale sand-pack. The cell is capable of applying axial stress and radial stress independently. The axial stress was controlled by the Instron Loading Frame; the confining stress was controlled by ISCO pump. The data acquisition and monitor system consist of three pressure transmitters which are able to record the pressure differential at three segments (
Figure 3) along the sand-pack. The permeability changes, due to the flow disturbance and possible fines migration above the coupon are investigated through the measurements of pressure differentials. The specially designed sand trap is installed at the outflow line to collected produced sand and fines. The fluid is finally discharged at the back pressure column with around 3psi back pressure. The back pressure column is also used to saturate the sand-pack before the injection.
3.2. Sand Retention Test (SRT) Set-Up
Tests with the same multi-slot coupons and testing materials were also conducted with the pre-pack SRT facility. Since the main difference between the SCT and the SRT is the absence of hydraulic pressure (confining stress), the SRT tests are considered as the zero effective stress condition.
The SRT facility (
Figure 4) consists of a fluid injection unit, SRT cell, DAQ unit, produced sand collector and back pressure/saturation unit. Further details about the SRT test can be found in previous research [
15,
32].
3.3. Testing Material
The synthetic sand-pack is prepared by mixing commercial sands, silts and clays with a certain proportion. The aim is to duplicate the same Particle Size Distribution (PSD) of ClassⅡDevon Pike 1 proposed by Abram and Cain [
21]. According to the research conducted by Mahmoudi et al. [
33], when the synthetic commercial sand and natural oil sand have the same PSD, mineralogy, and shape factors, equivalent mechanical properties can be yield.
Figure 5 shows the PSD of ClassⅡ Devon Pike 1 and the synthetic sand pack employed in this research.
The disk-shaped coupon is 7-inch in diameter with a thickness of 0.5-inch. They are obtained from actual 7-inch (17.78 mm) slotted liner pipe. (
Figure 6). The coupons are multi-slotted with seamed slot configuration. We use the number of by Slot per Column (SPC) to represent the slot density. For example, a 7-inch (17.78 mm) slotted liner with 42 SPC means there are 42 slots in one column, corresponding to 168 slots per foot. The coupons with slot aperture and slot density of 0.014′′ (0.36 mm) to 0.022′′ (0.56 mm) SPC: 54; 0.018′′ (0.46 mm) to 0.026′′ (0.66 mm) SPC: 42; 0.026′′ (0.66 mm) to 0.034′′ (0.86 mm) SPC: 30 and 0.014′′ (0.36 mm) to 0.022′′ (0.56 mm) SPC: 30 were tested in this study.
Figure 7 shows the image of tested multi-slotted coupons and their dimensions.
In this study, the sodium chloride brine with 7.9 pH and 0.7% (7000 ppm) salinity is used as the saturation and injecting fluid. All the tests are conducted under room temperature (22 degree centigrade). The viscosity of sodium chloride brine with a salinity of 0.7% (7000 ppm) under room temperature is 0.967 cp. The fluid pH and salinity both stay in the range of the brine characteristics of a typical SAGD process. Since monovalent salt (NaCl) brine with a relatively high pH severely increases the fines mobilization, the designed brine seems to simulate the worst case for pore plugging [
34,
35,
36].
3.4. Testing Procedure
The pre-test preparation includes sand-pack mixing and SCT cell assembling. The main part of the test starts from sand-pack saturation, followed by applying target stresses and 2 h brine injection. When the test complete, samples are obtained along the sand-pack to investigate the fines mobilization.
The flow rate is designed based on the productivity of the actual SAGD process. A typical SAGD well which produces 1500 bbl/day (0.0027 m3/s) from a length of 800–1000 m. The typical slotted liner used in SAGD operation is 7 inches in diameter with 1–3% OFA. For the slot width of 0.010′′ (0.25 mm) at the lowest OFA (1%), there are 200 slots per foot. When all the slots are open, and the flow distribution among slots is uniform, the flow rate for each slot is in the range of 10–30 cc/slot/h. Considering a plugging factor range between 0% to 90%, the flow rate for the test will be in the range of 0.25–3 bbl/day. Therefore, a flow rate of 2.4 L/h (0.36 bbl/day) is adopted in all the tests.
Figure 8 shows the testing procedure with 300psi effective stress.
3.5. Test Matrix
Parametric testing was conducted to investigate the effects of slot width and slot density on sand production, retained permeability, and fines migration. Further, the testing program included different combinations of slot width and slot density at constant OFA.
Table 1 shows the test matrix for the investigation of slot width at constant slot density, and
Table 2 shows the test matrix for the investigation of slot density at constant slot width. These tests were conducted under 300 psi (2068 kPa) radial effective stress, and the effective axial stress is 50 psi higher than the radial effective stress. The idea was to conduct the test under isotropic stress condition. The extra 50 psi of axial loading is applied for safety issue. This effective stress is selected to represent the typical in-situ effective stress level of shallow oil sand project [
37].
Table 3 presents the test matrix for variable slot width and density at constant OFA to investigate whether the effect of slot width or density is stronger and to optimize the combination of these two parameters. Varying levels of stress (0, 300 psi) were used for these tests.
4. Result and Discussion
This section presents the test results in terms of produced sand, retained permeability, and fines concentration in the sample and produced brine for all tests. The uncertainty analysis is performed for all the results and presented by the confidence intervals (shown as the red-bars on
Figure 9,
Figure 10,
Figure 11,
Figure 12,
Figure 13,
Figure 14,
Figure 15 and
Figure 16).
4.1. Parametric Testing with Respect to Slot Width and Density
Testing results are first presented for the cases with variable slot width at constant slot density and variable slot density at a constant width. These cases involve coupons with variable open flow area.
4.1.1. Cumulative Produced Sand
Figure 9 shows the effect of slot width and slot density on cumulatively produced sand, respectively. Two acceptable limitations of sand production: 0.12 lb/sq ft (0.58 kg/m
2) and 0.15 lb/sq ft (0.73 kg/m
2) are also shown in the graphs.
Figure 9a indicates higher sand production for widerslots at a constant slot density.
Figure 9b shows more sanding for higher slot density at constant slot width. Since the testing flow rate was low and the sand production for all tests was significantly lower than the maximum threshold, they can be considered as initial sanding, which refers to the sanding, due to sand particles falling into slots before a stable bridge is formed. For wider slots, more sand particles are needed to form the sand bridge above each slot. Therefore, it is more difficult for wider slots to form sand bridges compared to narrower slots. Moreover, the stability of those sand bridges is less, which results in a greater amount of sanding at the initial stage. For narrower slot, the sand production was slightly higher for higher slot density. This is mainly because more sand particles fall into larger numbers of slots during the sand-pack compaction.
4.1.2. Retained Permeability
The retained permeability is used as an indicator to analyze the plugging tendency of the slotted liner. It is defined as the ratio of near-screen permeability over the original permeability. In this study, the retained permeability is calculated by dividing the permeability of the bottom segment (2 inches) of the sand-pack by the original sand-pack permeability under confining stress;
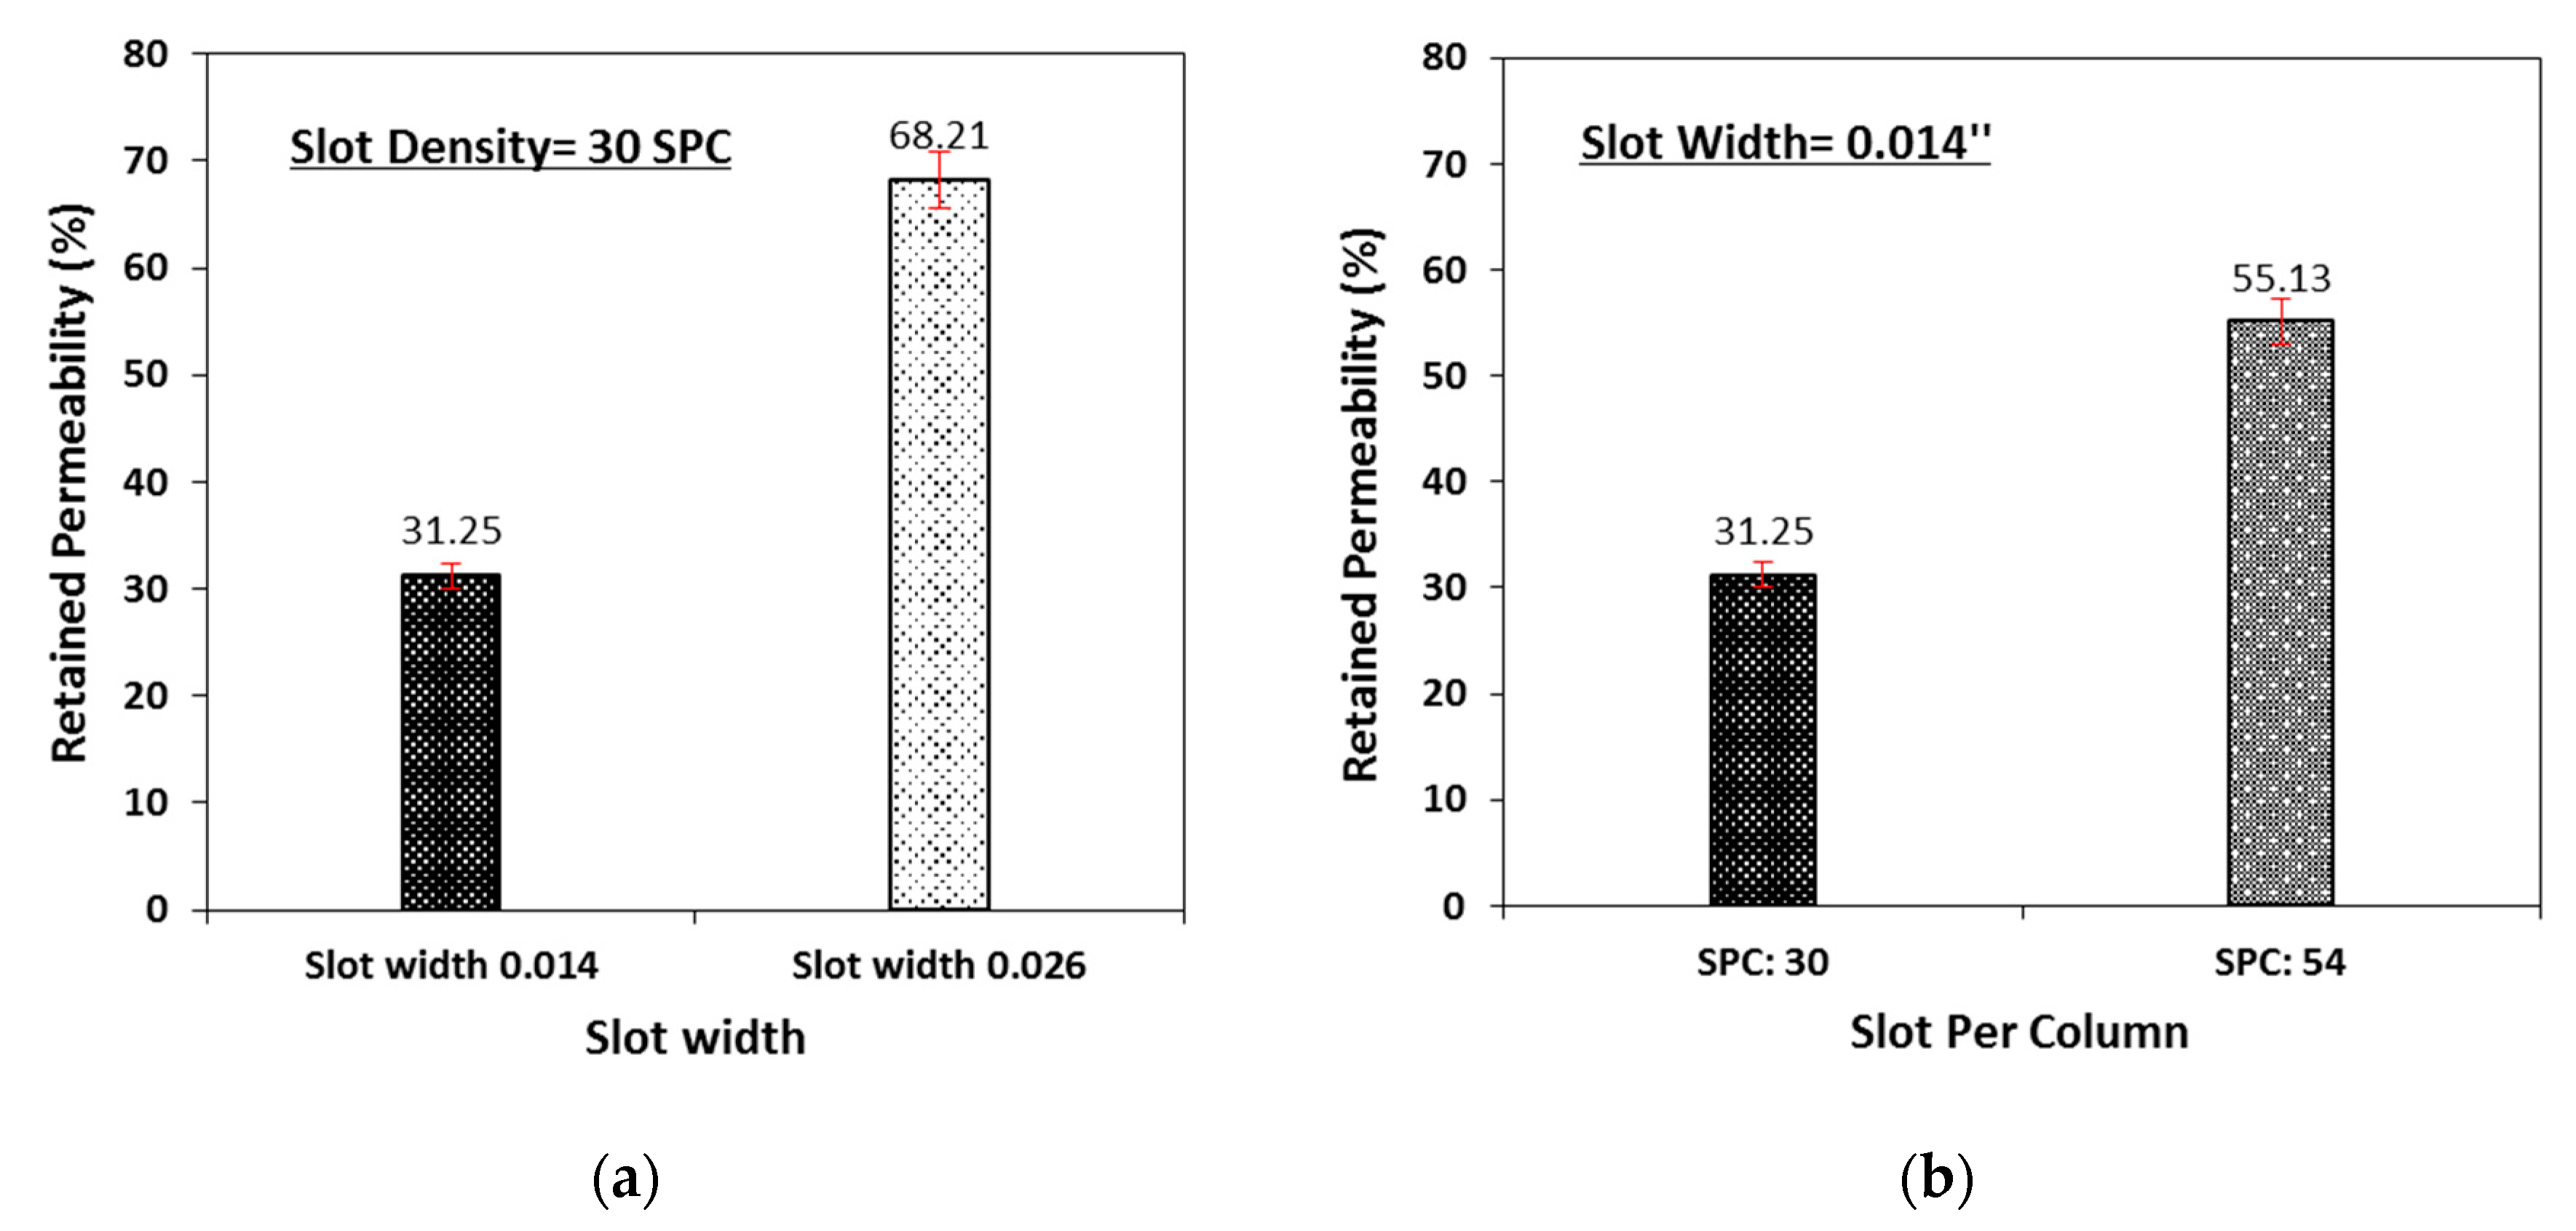
Figure 10a shows the retained permeability versus slot width for a constant slot density. Evidently, wider slots lead to higher retained permeability values. For a constant slot density, narrower slots result in more fines accumulation in the near-coupon zone, which causes more plugging and a lower retained permeability.
Figure 10b shows the retained permeability versus slot density for a constant slot width. Test results indicate a reduction in retained permeability for lower slot densities. For a constant slot width, higher slot densities results in fewer fines accumulation above the coupon, hence, a higher retained permeability. Comparison of
Figure 10a,b indicates that an increase in both slot width and slot density would cause an increase in the retained permeability. However, retained permeability variation, due to the change of slot width is stronger than that of change in the slot density.
4.1.3. Fines Concentration
Figure 11a,b show the fines concentration near the screen versus slot width at constant slot density, and versus slot density at constant slot width, respectively.
Figure 11 indicates lower fines concentrations for wider slots and higher slot densities. However, it is obvious from the figure that the effect of slot width on the fines content is greater than that of slot density.
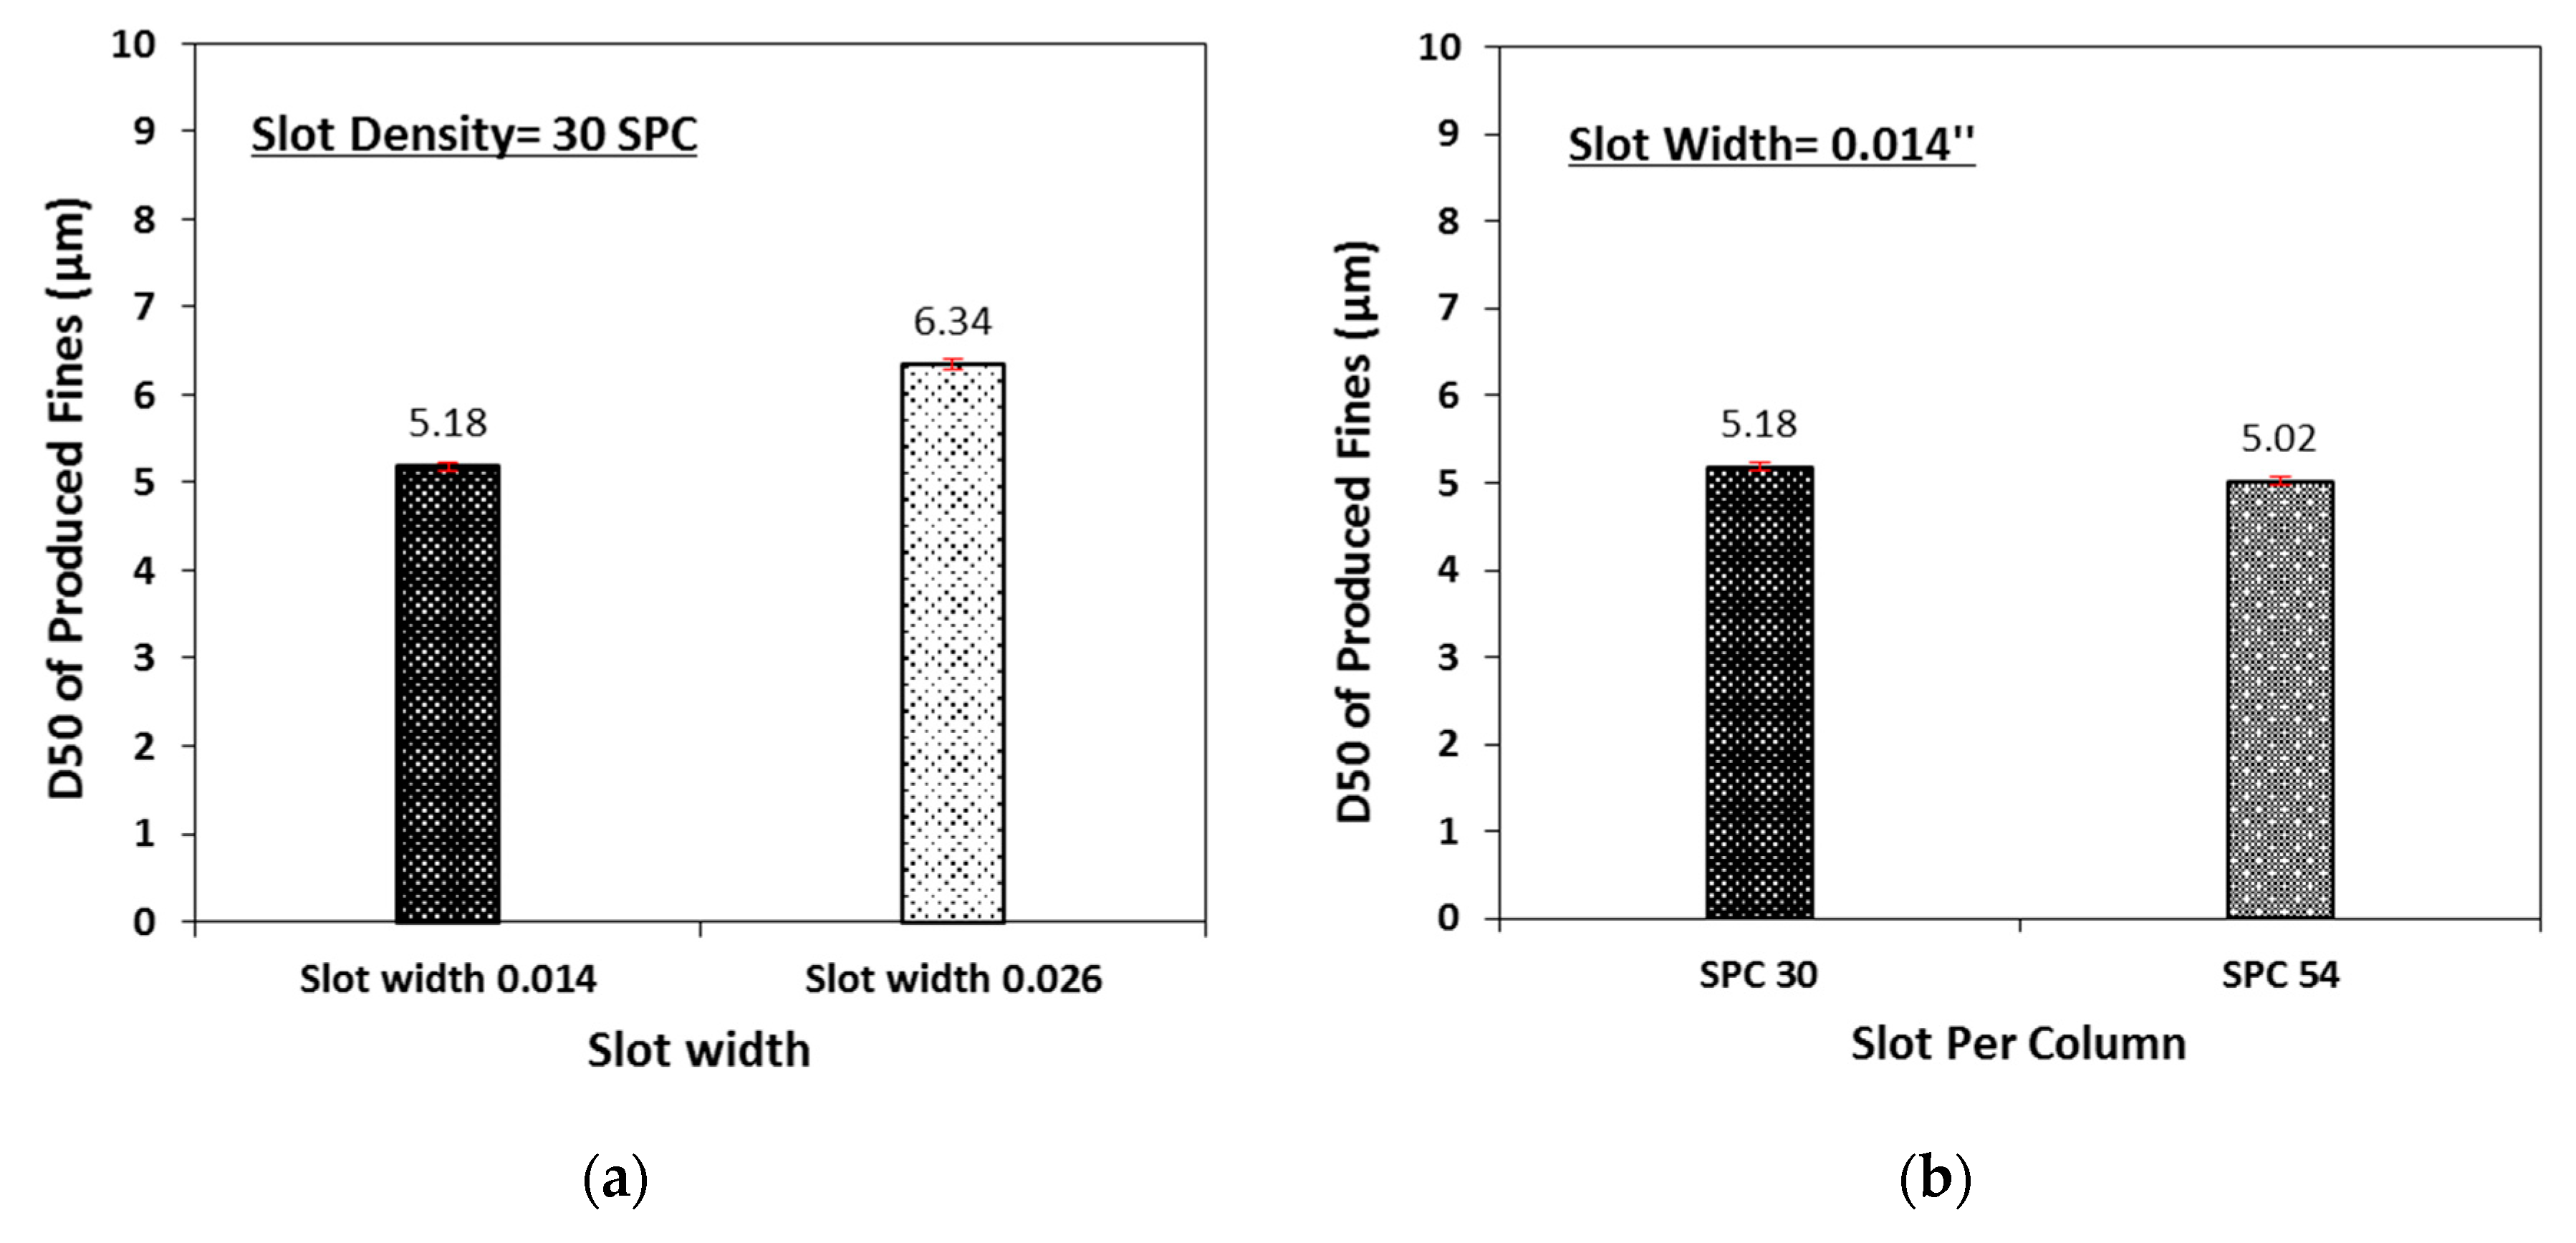
Figure 12a shows the effect of slot width on the median size of produced fines at constant slot density. According to
Figure 12a, larger produced fines are observed for wider slots.
Figure 12b shows the effect of slot density on the D50 of produced fines at a constant slot width. Test results indicate a small change in the size of the produced fines when coupons with higher slot density are employed. Therefore, the size of produced fines seems to be little affected by the slot density.
Right now, with limited numbers of testing results, it is difficult to conclude any relationship between slot width/slot density and sand production. More tests will be conducted and presented in our future work. With the support of more data points, a linear or non-linear correlation could be found, and an empirical equation could be obtained by fitting the data.
4.2. Parametric Testing at Constant OFA and Under Stress
It is evident that flow velocity plays a critical role in both sand production and plugging. The change in either slot width or slot density would alter the flow velocity by changing the total OFA. To isolate the effect of slot width and slot density on-screen performance and remove the effect of flow velocity change, coupons with constant OFA, but variable slot width and slot density were tested.
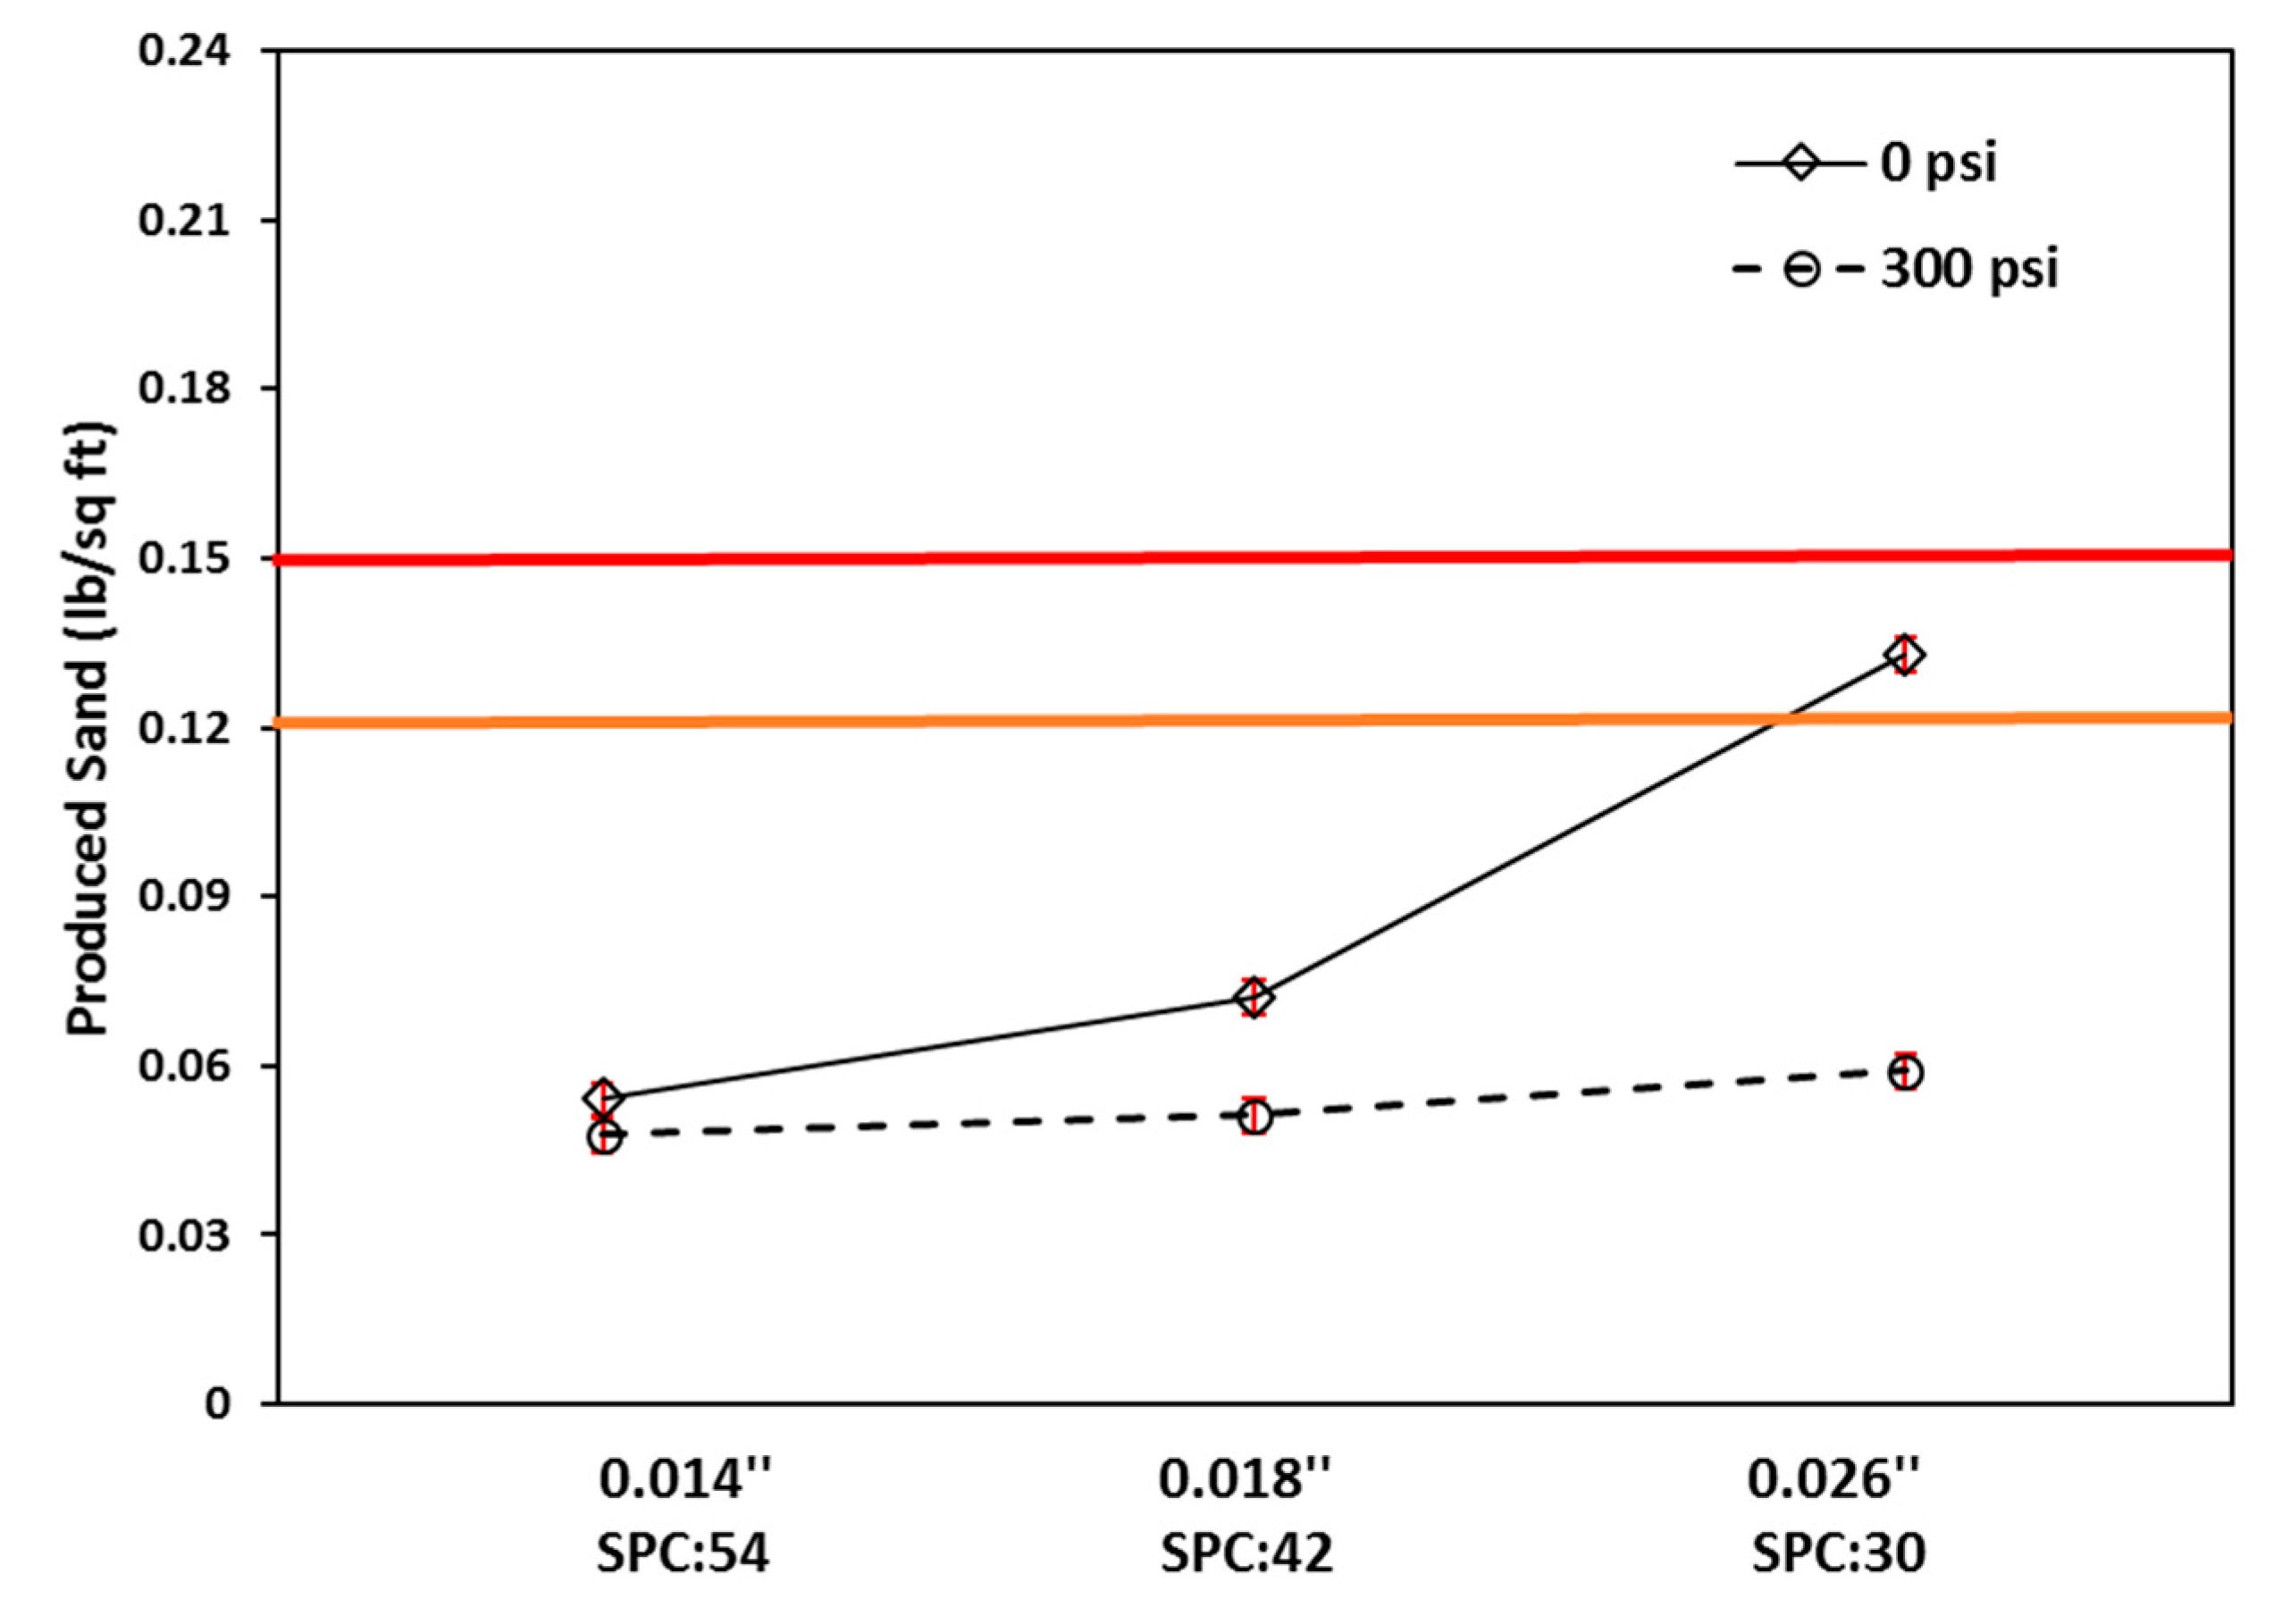
Figure 13 shows the cumulatively produced sand for three coupons with constant OFA. The figure shows more sanding occurs for wider slot and lower slot density. Limited produced sand is observed for slot size of 0.014′′ (0.36 mm) and 0.018′′ (0.46 mm). More sanding occurs when slot size 0.026′′ (0.66 mm) is used, and the amount of produced sand stays beyond the acceptable threshold. Wider slot openings tend to have more sanding; however, smaller SPC suggests less sanding. These two factors both influence the sanding performance here, and based on the testing results, the effect of slot width on sanding seems to be stronger compared to slot density since the overall sanding is increasing. Results are also indicating a significant impact of the stress on the produced sand, where, lower sanding occurs at higher stresses. This can be attributed to higher mobilized friction between the sand grains, hence, higher stability for sand bridges behind the slots.
Figure 14 shows the effect of slot size and density at two effective stress levels on the retained permeability. As expected, the coupon with wider slot shows a better flow performance than that of the higher slot density. The reason is that fewer fines are accumulated near the coupons with wider slots. The figure also shows a drastic drop in retained permeability at higher effective stress condition, but the change of retained permeability follow the same trend. Higher stresses result in higher sand compaction and a lower porosity and permeability. The smaller porosities also result in narrower pore channels, hence, a higher fines entrapment near the slots and a lower retained permeability. According to
Figure 14, wider slots with lower slot densities provide a lower plugging than narrower slots with higher slot densities.
Figure 15 shows the fines concentration at the near-coupon zone at the end of the test. The results show higher fines concentration for coupon with narrower slots and larger SPC, which agrees with the results of retained permeability measurements.
Figure 15 also indicates higher fines concentrations for higher effective stresses. Moreover, a stronger effect of stress on plugging is observed for narrower slots.
Figure 16 shows the effect of slot size and slot density on median size of produced fines (D50). Results indicate that coupons with wider slot sizes and smaller SPC tend to produce slightly coarser fines. In addition, the size of produced fines decreases sharply for higher effective stress. It seems the sand porosity plays a critical role in the fines transportation and production. The reason lies in the smaller pore throat sizes for lower porosities which only allows the transport of smaller fines.
5. Conclusions
This research employed a novel sand control testing facility (Scaled Completion Test, SCT) to study the slotted liner performance for various liner specifications. The test facility allows emulation of different stress conditions corresponding to stress variation during the life cycle of a SAGD producer. A detailed large-scale sand retention testing procedure was also presented to assess the performance of the slotted liner under the different stress levels. The experimental design utilized a multi-slot liner coupon to study the role of both slot width and density.
A series of SCT’s was performed to (1) investigate the role of slot width, and slot density on the performance of slotted liners, and (2) evaluate liner designs with different combinations of slot widths and slot densities, but constant OFA. Cumulatively produced sand at the end of testing was measured as an indicator of sand control performance. Retained permeability was calculated by pressure drops across the sand-pack and considered as the indicator of screen flow performance. Fines/clay concentration along the sand-pack was also measured after the test to investigate fines migration, which was considered as the main reason for plugging and permeability reduction.
Based on the result of parametric testing for investigating the effect of slot width and slot density on the liner performance, it is evident that higher sand production occurs for wider slots. Test results also indicated less retained permeabilities for narrower slots. A similar trend was observed for smaller SPC’s. However, the comparison of the two testing results implied that the effect of slot width is stronger than that of slot density. For each test, the fines concentration at the vicinity of the coupon was also tested. Observation indicates a higher fines concentration for narrower slots and smaller SPC’s.
Furthermore, it is evident that the fines concentration for wider slot approaches to the initial fines concentration, which results in less pore plugging, and hence, a higher well productivity. Wider slots resulted in slightly coarser produced fines. However, the slot density had a negligible effect on the size of the produced fines. The size of produced fines was proven to be highly sensitive to the flow velocity and the size of pore throats in the formation.
For the optimization of liner designs with various combination of slot width and slot density, but constant OFA, the liner design with wider slot and smaller SPC showed a higher sanding and less reduction in retained permeability. Moreover, sand production drastically decreased with the increase in effective stress. Similar trend for permeability reduction was also observed under high effective stress conditions. Test results of this study also showed a lower fines accumulation adjacent the coupons with wider slots and smaller SPC. The effective stress seemed to have a stronger effect on fines concentration for a narrower slot. This suggests the benefit of using wider slots to reduce the plugging potential.
Author Contributions
Conceptualization, A.N.; methodology, Y.G.; formal analysis, Y.G.; investigation, Y.G.; data curation, Y.G.; writing—original draft preparation, Y.G.; writing—review and editing, A.N., S.N.; visualization, S.N.; supervision, A.N.; funding acquisition, A.N. All authors have read and agree to the published version of the manuscript. All authors have read and agreed to the published version of the manuscript.
Funding
This research was funded by RGL Reservoir Management Inc. It is also founded by NSERC through their CRD program.
Acknowledgments
The authors would like to acknowledge Todd Kinnee, Engineering Technologist, for his help and assistance in conducting laboratory experiments.
Conflicts of Interest
The authors declare no conflict of interest.
Nomenclature
| DC-II | Class II Oil Sand for Devon Pike I |
| D | Diameter of Particle Size |
| D10 | Sieve opening size that retains 10% of the particles in a sample |
| D50 | Sieve opening size that retains 50% of the particles in a sample (Median size on the PSD curve) |
| D70 | Sieve opening size that retains 70% of the particles in a sample |
| k | Permeability |
| kbottom | Bottom Segment Permeability |
| kretained | Retained Permeability |
References
- Shi, Y.; Yassin, M.R.; Yuan, L.; Dehghanpour, H. Modelling imbibition data for determining size distribution of organic and inorganic pores in unconventional rocks. Int. J. Coal Geol. 2019, 201, 26–43. [Google Scholar] [CrossRef]
- Schlumberger Oilfield Glossary. Available online: https://www.glossary.oilfield.slb.com/en/Terms/u/unconventional_resource.aspx (accessed on 10 December 2019).
- Jia, B.; Tsau, J.S.; Barati, R. A review of the current progress of CO2 injection EOR and carbon storage in shale oil reservoirs. Fuel 2019, 236, 404–427. [Google Scholar] [CrossRef]
- Alberta Geological Survey 2011. Available online: http://www.history.alberta.ca/energyheritage/sands/origins/the-geology-of-the-oil-sands/the-location-of-oil-sands.aspx (accessed on 10 November 2019).
- Butler, R.M.; Stephens, D.J. The gravity drainage of steam-heated heavy oil to parallel horizontal wells. J. Can. Pet. Technol. 1981, 20. [Google Scholar] [CrossRef]
- Bennion, D.B.; Gupta, S.; Gittins, S.; Hollies, D. Protocols for slotted liner design for optimum SAGD operation. J. Can. Pet. Technol. 2009, 48, 21–26. [Google Scholar] [CrossRef]
- Romanova, U.G.; Piwowar, M.; Ma, T. Sand Control for Unconsolidated Heavy Oil Reservoirs: A Laboratory Test Protocol and Recent Field Observation. In Proceedings of the Presented at the International Symposium of the Society of Core Analysts, St. John, NL, Canada, 16–21 August 2015. [Google Scholar]
- Valdes, J.R.; Santamarina, J.C. Particle clogging in radial flow: Microscale mechanisms. SPE J. 2006, 11, 193–198. [Google Scholar] [CrossRef]
- Coberly, C.J. Selection of screen openings for unconsolidated sands. In Drilling and Production Practice; American Petroleum Institute: Washington, WA, USA, 1937. [Google Scholar]
- Suman, G.O. World Oil’s Sand Control Handbook; Gulf Pubulishing Company: Houston, TX, USA, 1975. [Google Scholar]
- Markestad, P.; Christie, O.; Espedal, A.; Rørvik, O. Selection of screen slot width to prevent plugging and sand production. In Proceedings of the SPE Formation Damage Control Symposium, Lafayette, LA, USA, 14–15 February 1996. [Google Scholar]
- Ballard, T.; Kageson-Loe, N.; Mathisen, A.M. The development and application of a method for the evaluation of sand screens. In Proceedings of the SPE European Formation Damage Conference, The Hague, The Netherlands, 31 May–1 June 1999. [Google Scholar]
- Gillespie, G.; Deem, C.K.; Malbrel, C. Screen selection for sand control based on laboratory tests. In Proceedings of the SPE Asia Pacific Oil and Gas Conference and Exhibition, Brisbane, Australia, 16–18 October 2000. [Google Scholar]
- Chanpura, R.A.; Hodge, R.M.; Andrews, J.S.; Toffanin, E.P.; Moen, T.; Parlar, M. A review of screen selection for standalone applications and a new methodology. SPE Drill. Completion 2011, 26, 84–95. [Google Scholar] [CrossRef]
- Mahmoudi, M.; Fattahpour, V.; Nouri, A.; Yao, T.; Baudet, B.A.; Leitch, M.; Fermaniuk, B. New criteria for slotted liner design for heavy oil thermal production. In Proceedings of the SPE Thermal Well Integrity and Design Symposium, Banff, AB, Canada, 28 November–1 December 2016. [Google Scholar]
- Fattahpour, V.; Azadbakht, S.; Mahmoudi, M.; Guo, Y.; Nouri, A.; Leitch, M. Effect of Near Wellbore Effective Stress on the Performance of Slotted Liner Completions in SAGD Operations. In Proceedings of the SPE Thermal Well Integrity and Design Symposium, Banff, AB, Canada, 28 November–1 December 2016. [Google Scholar]
- Roostaei, M.; Guo, Y.; Velayati, A.; Nouri, A.; Fattahpour, V.; Mahmoudi, M. How the Design Criteria for Slotted Liners in SAGD are Affected by Stress Buildup Around the Liner. In Proceedings of the 52nd US Rock Mechanics/Geomechanics Symposium, Seattle, WA, USA, 17–20 June 2018. [Google Scholar]
- Kaiser, T.M.; Wilson, S.; Venning, L.A. Inflow analysis and optimization of slotted liners. In Proceedings of the SPE/CIM International Conference on Horizontal Well Technology, Calgary, AB, Canada, 6–8 November 2000. [Google Scholar]
- Hodge, R.M.; Burton, R.C.; Constien, V.; Skidmore, V. An evaluation method for screen-only and gravel-pack completions. In Proceedings of the International Symposium and Exhibition on Formation Damage Control, Lafayette, LA, USA, 20–21 February 2002. [Google Scholar]
- Constien, V.G.; Skidmore, V. Standalone Screen Selection Using Performance Mastercurves. In Proceedings of the SPE International Symposium and Exhibition on Formation Damage Control, Lafayette, LA, USA, 15–17 February 2006. [Google Scholar]
- Abram, M.; Cain, G. Particle-Size Analysis for the Pike 1 Project, McMurray Formation. J. Can. Pet. Technol. 2014, 53, 339–354. [Google Scholar] [CrossRef]
- Shi, Y.; Yassin, M.R.; Dehghanpour, H. A modified model for spontaneous imbibition of wetting phase into fractal porous media. Colloids Surf. A Physicochem. Eng. Asp. 2018, 543, 64–75. [Google Scholar] [CrossRef]
- Tiffin, D.L.; King, G.E.; Larese, R.E.; Britt, L.K. New criteria for gravel and screen selection for sand control. In Proceedings of the SPE Formation Damage Control Conference, Lafayette, LA, USA, 18–19 February 1998. [Google Scholar]
- Williams, C.F.; Richard, B.M.; Horner, D. A new sizing criterion for conformable and nonconformable sand screens based on uniform pore structures. In Proceedings of the SPE International Symposium and Exhibition on Formation Damage Control, Lafayette, LA, USA, 15–17 February 2006. [Google Scholar]
- Underdown, D.R.; Dickerson, R.C.; Vaughan, W. The nominal sand-control screen: A critical evaluation of screen performance. SPE Drill. Completion 2001, 16, 252–260. [Google Scholar] [CrossRef]
- Adams, P.R.; Davis, E.R.; Hodge, R.M.; Burton, R.E.; Ledlow, L.B.; Procyk, A.D.; Crissman, S.C. Current State of the Premium Screen Industry; Buyer Beware. Methodical Testing and Qualification Shows You Don’t Always Get What You Paid For. SPE Drill. Completion 2009, 24, 362–372. [Google Scholar] [CrossRef]
- Burton, R.C.; Hodge, R.M. The Impact of Formation Damage and Completion Impairment on Horizontal Well Productivity. In Proceedings of the SPE Annual Technical Conference and Exhibition, New Orleans, LA, USA, 27–30 September 1998. [Google Scholar]
- Fermaniuk, B. Sand Control in Steam Assisted Gravity (SAGD) Wellbores. Master’s Thesis, University of Calgary, Calgari, AB, Canada, 2013. [Google Scholar]
- Guo, Y.; Roostaei, M.; Nouri, A.; Fattahpour, V.; Mahmoudi, M.; Jung, H. Effect of stress build-up around standalone screens on the screen performance in SAGD wells. J. Pet. Sci. Eng. 2018, 171, 325–339. [Google Scholar] [CrossRef]
- Guo, Y. Effect of Stress Build-up around SAGD Wellbores on the Slotted Liner Performance. Master’s Thesis, University of Alberta, Edmonton, AB, Canada, 2018. [Google Scholar]
- Jia, B.; Tsau, J.S.; Barati, R. Investigation of Shale-Gas-Production Behavior: Evaluation of the Effects of Multiple Physics on the Matrix. SPE Reserv. Eval. Eng. 2019. [Google Scholar] [CrossRef]
- Wang, C.; Pang, Y.; Mahmoudi, M.; Haftani, M.; Salimi, M.; Fattahpour, V.; Nouri, A. A set of graphical design criteria for slotted liners in steam assisted gravity drainage production wells. J. Pet. Sci. Eng. 2019, 106608. [Google Scholar] [CrossRef]
- Mahmoudi, M.; Fattahpour, V.; Nouri, A.; Yao, T.; Baudet, B.A.; Leitch, M. Oil Sand Characterization for Standalone Screen Design and Large-Scale Laboratory Testing for Thermal Operations. In Proceedings of the SPE Thermal Well Integrity and Design Symposium, Banff, AB, Canada, 23–25 November 2015. [Google Scholar]
- Mahmoudi, M.; Fattahpour, V.; Nouri, A.; Leitch, M. An Experimental Investigation of the Effect of pH and Salinity on Sand Control Performance for Heavy Oil Thermal Production. In Proceedings of the SPE Canada Heavy Oil Technical Conference, Calgary, AB, Canada, 7–9 June 2016. [Google Scholar]
- Tang, G.Q.; Morrow, N.R. Influence of brine composition and fines migration on crude oil/brine/rock interactions and oil recovery. J. Pet. Sci. Eng. 1999, 24, 99–111. [Google Scholar] [CrossRef]
- McGuire, P.L.; Chatham, J.R.; Paskvan, F.K.; Sommer, D.M.; Carini, F.H. Low salinity oil recovery: An exciting new EOR opportunity for Alaska’s North Slope. In Proceedings of the SPE Western Regional Meeting, Irvine, CA, USA, 30 March–1 April 2005. [Google Scholar]
- Collins, P.M. Injection pressures for geomechanical enhancement of recovery processes in the Athabasca oil sands. In Proceedings of the SPE International Thermal Operations and Heavy Oil Symposium and International Horizontal Well Technology Conference, Calgary, AB, Canada, 4–7 November 2002. [Google Scholar]
Figure 1.
Location of the Athabasca, Cold Lake and Peace River Oil Sands in Alberta [
4].
Figure 1.
Location of the Athabasca, Cold Lake and Peace River Oil Sands in Alberta [
4].
Figure 2.
Schematic view of the scaled completion test (SCT) facility.
Figure 2.
Schematic view of the scaled completion test (SCT) facility.
Figure 3.
Schematic view of three segments of sand-pack.
Figure 3.
Schematic view of three segments of sand-pack.
Figure 4.
Schematic view the sand retention test (SRT) facility.
Figure 4.
Schematic view the sand retention test (SRT) facility.
Figure 5.
The PSD of ClassⅡ Devon Pike 1 and the synthetic sand pack.
Figure 5.
The PSD of ClassⅡ Devon Pike 1 and the synthetic sand pack.
Figure 6.
The multi-slot coupon obtained from a section of the 7-inch diameter slotted liner.
Figure 6.
The multi-slot coupon obtained from a section of the 7-inch diameter slotted liner.
Figure 7.
Image and dimensions of multi-slotted coupons: (a) 0.014″–0.022″ SPC: 54, (b) 0.018″–0.026″ SPC: 42, (c) 0.026″–0.034″ SPC: 30.
Figure 7.
Image and dimensions of multi-slotted coupons: (a) 0.014″–0.022″ SPC: 54, (b) 0.018″–0.026″ SPC: 42, (c) 0.026″–0.034″ SPC: 30.
Figure 8.
Testing Procedure of 300 psi (2068 kPa) Effective Stress SCT Test.
Figure 8.
Testing Procedure of 300 psi (2068 kPa) Effective Stress SCT Test.
Figure 9.
(a) Effect of slot width on sand production, (b) effect of slot density on sand production at 300 psi.
Figure 9.
(a) Effect of slot width on sand production, (b) effect of slot density on sand production at 300 psi.
Figure 10.
(a) Effect of slot width on retained permeability, (b) effect of slot density on retained permeability.
Figure 10.
(a) Effect of slot width on retained permeability, (b) effect of slot density on retained permeability.
Figure 11.
(a) Effect of slot width on concentration of fines near the liner, (b) effect of slot density on concentration of fines near the screen.
Figure 11.
(a) Effect of slot width on concentration of fines near the liner, (b) effect of slot density on concentration of fines near the screen.
Figure 12.
(a) Effect of slot width on the D50 of produced fines, (b) effect of slot density on the D50 of produced fines.
Figure 12.
(a) Effect of slot width on the D50 of produced fines, (b) effect of slot density on the D50 of produced fines.
Figure 13.
Effect of slot size and density on cumulative sand production; solid lines are the upper limit of acceptable produced sand of 0.12 lb/sq ft (0.58 kg/m2) and 0.15 lb/sq ft (0.73 kg/m2).
Figure 13.
Effect of slot size and density on cumulative sand production; solid lines are the upper limit of acceptable produced sand of 0.12 lb/sq ft (0.58 kg/m2) and 0.15 lb/sq ft (0.73 kg/m2).
Figure 14.
Effect of slot size and density on retained permeability at the near-coupon zone.
Figure 14.
Effect of slot size and density on retained permeability at the near-coupon zone.
Figure 15.
Effect of slot size and density on retained permeability at the near-coupon zone.
Figure 15.
Effect of slot size and density on retained permeability at the near-coupon zone.
Figure 16.
Effect of slot size and density on d50 of produced fines.
Figure 16.
Effect of slot size and density on d50 of produced fines.
Table 1.
Testing matrix to study the role of slot width at constant slot density.
Table 1.
Testing matrix to study the role of slot width at constant slot density.
| Slot Width (thou) | SPC | Effective Stress (psi) |
|---|
| 0.014″–0.022″ | 30 | 300 |
| 0.026″–0.034″ | 30 | 300 |
Table 2.
Testing matrix to study the role of slot density at constant slot width.
Table 2.
Testing matrix to study the role of slot density at constant slot width.
| Slot Width (thou) | SPC | Effective Stress (psi) |
|---|
| 0.014″–0.022″ | 30 | 300 |
| 0.014″–0.022″ | 54 | 300 |
Table 3.
Testing matrix to study the performance of slotted liners with constant open flow area (OFA).
Table 3.
Testing matrix to study the performance of slotted liners with constant open flow area (OFA).
| Slot Width (thou) | SPC | OFA (%) | Effective Stress (psi) |
|---|
| 0.014″–0.022″ | 54 | 3% | 0, 300 |
| 0.018″−0.026″ | 42 | 3% | 0, 300 |
| 0.026″−0.034″ | 30 | 3% | 0, 300 |
© 2020 by the authors. Licensee MDPI, Basel, Switzerland. This article is an open access article distributed under the terms and conditions of the Creative Commons Attribution (CC BY) license (http://creativecommons.org/licenses/by/4.0/).


