Energy Efficiency Outlook of New Zealand Dairy Farming Systems: An Application of Data Envelopment Analysis (DEA) Approach


Abstract
:1. Introduction
2. Materials and Methods
2.1. Data Collection and Processing
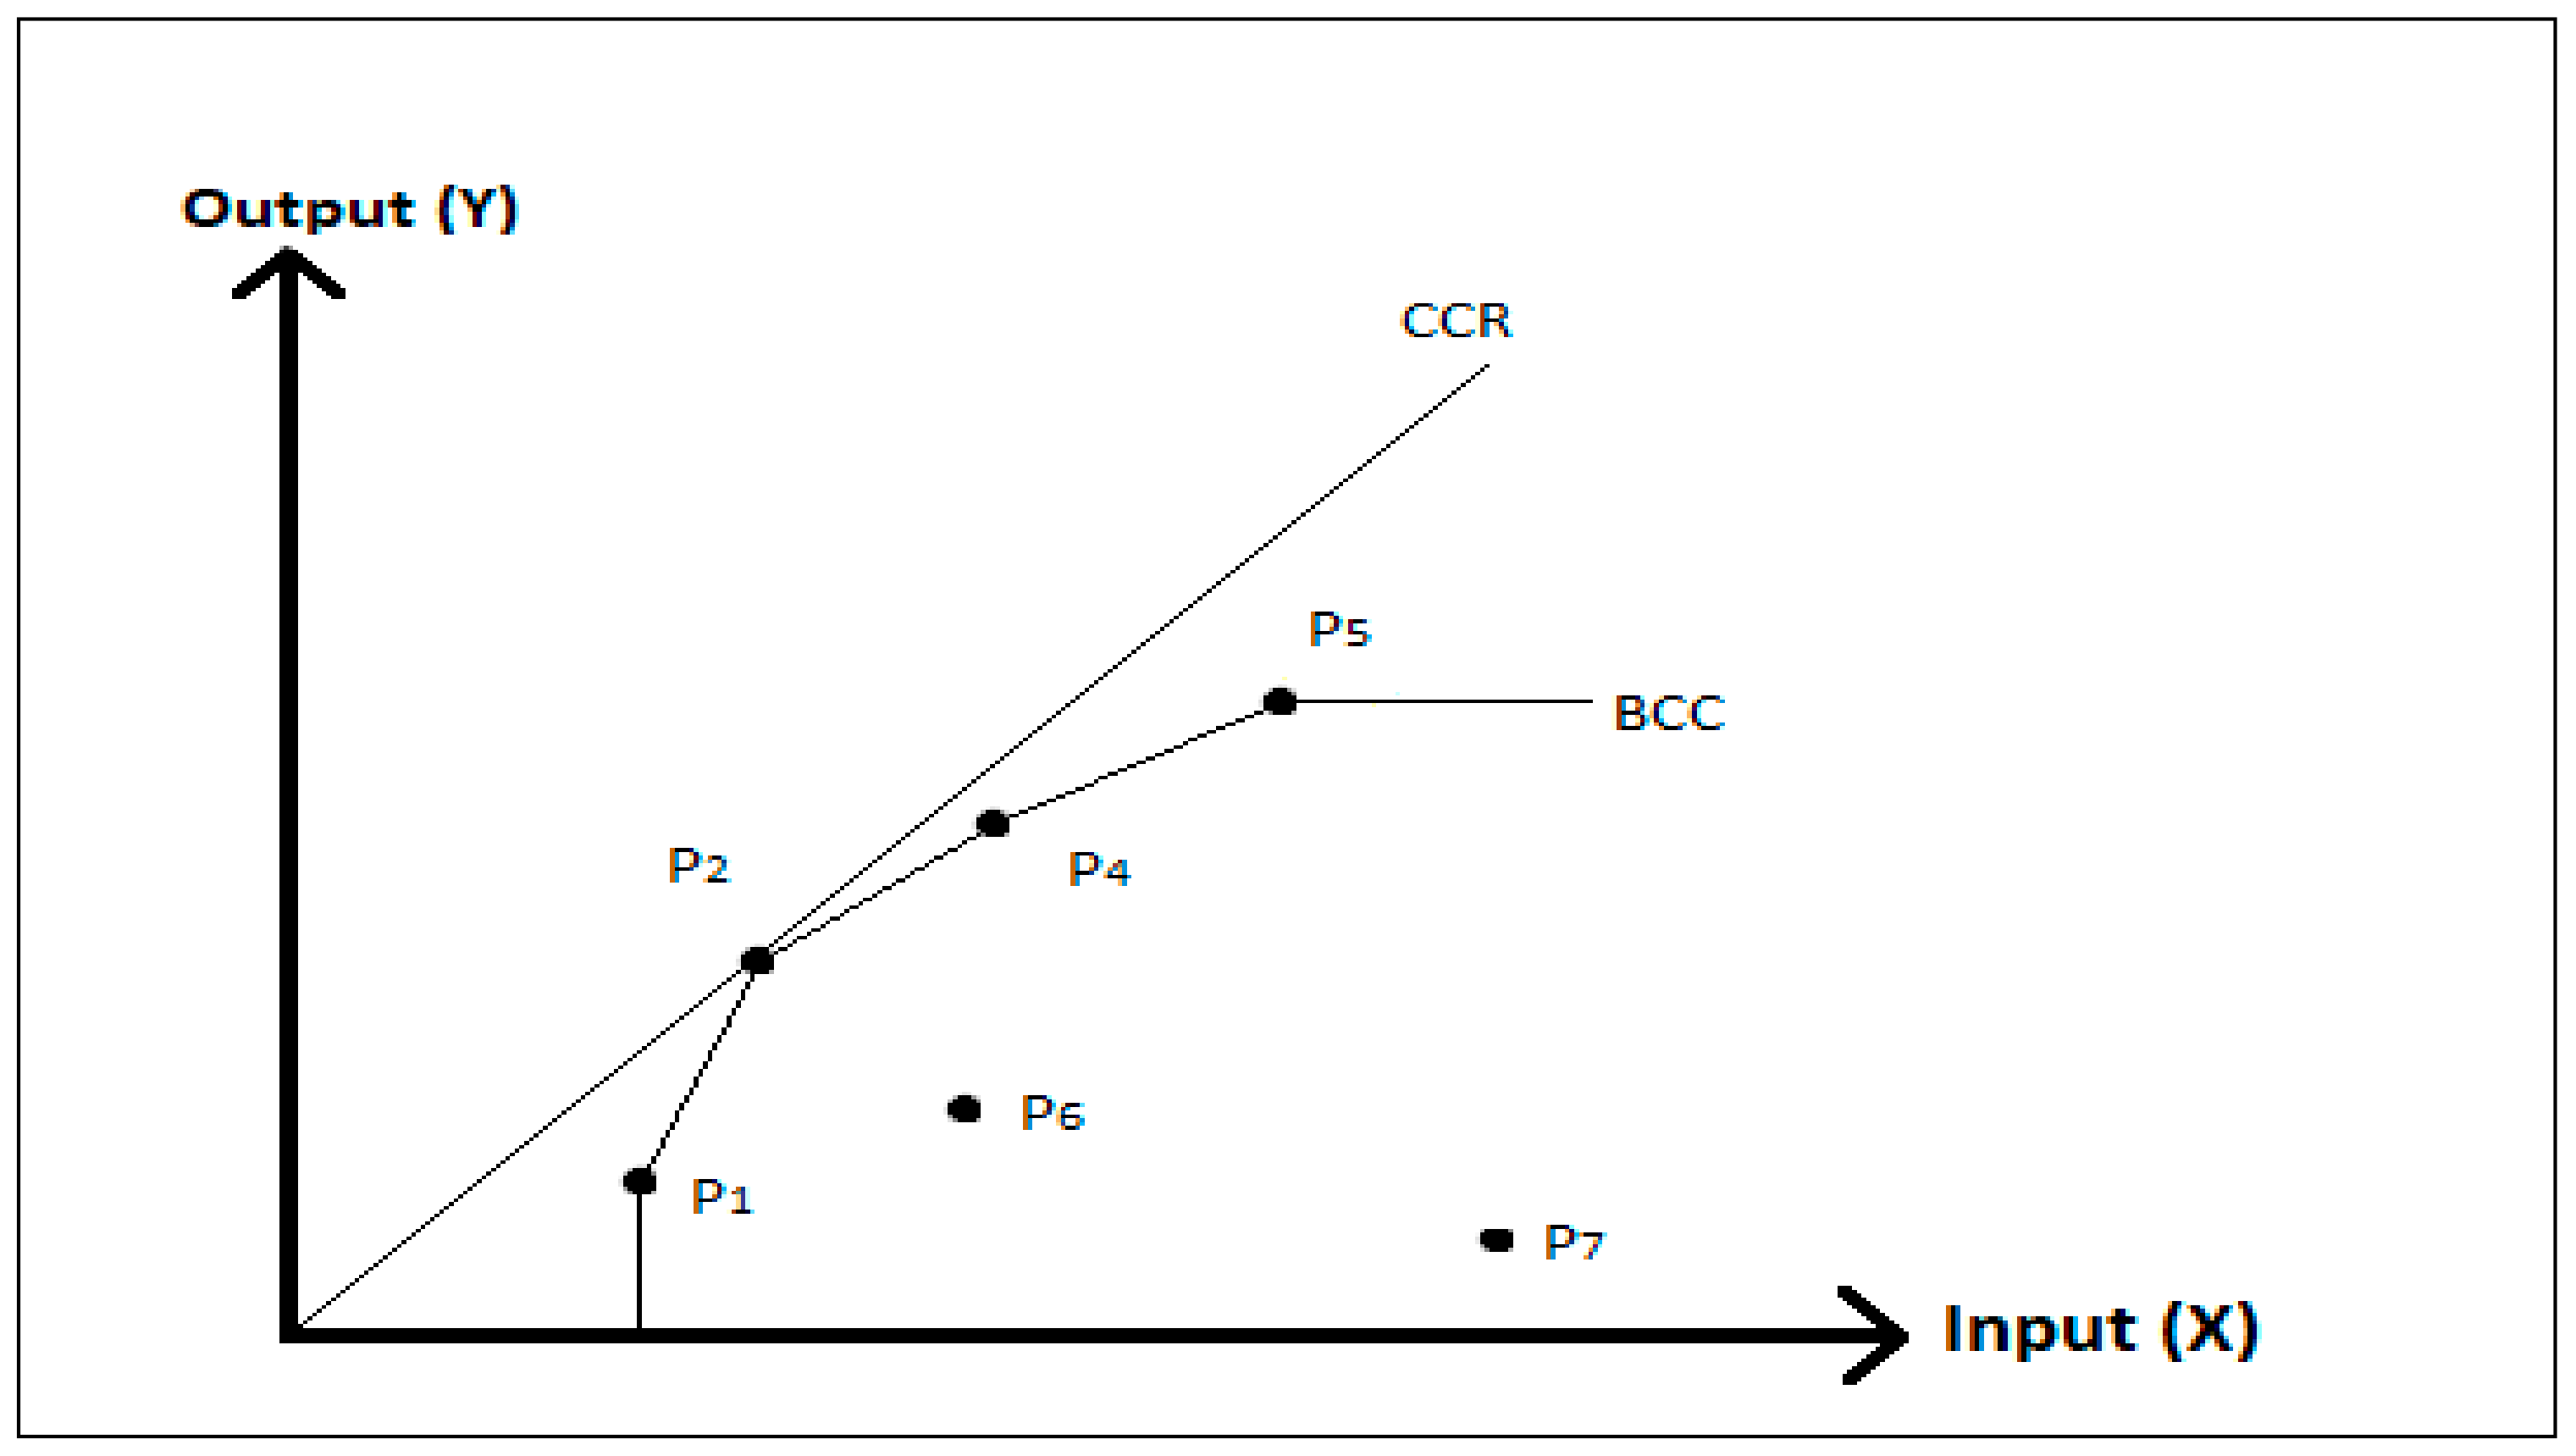
2.2. Data Envelopment Analysis Approach
3. Results
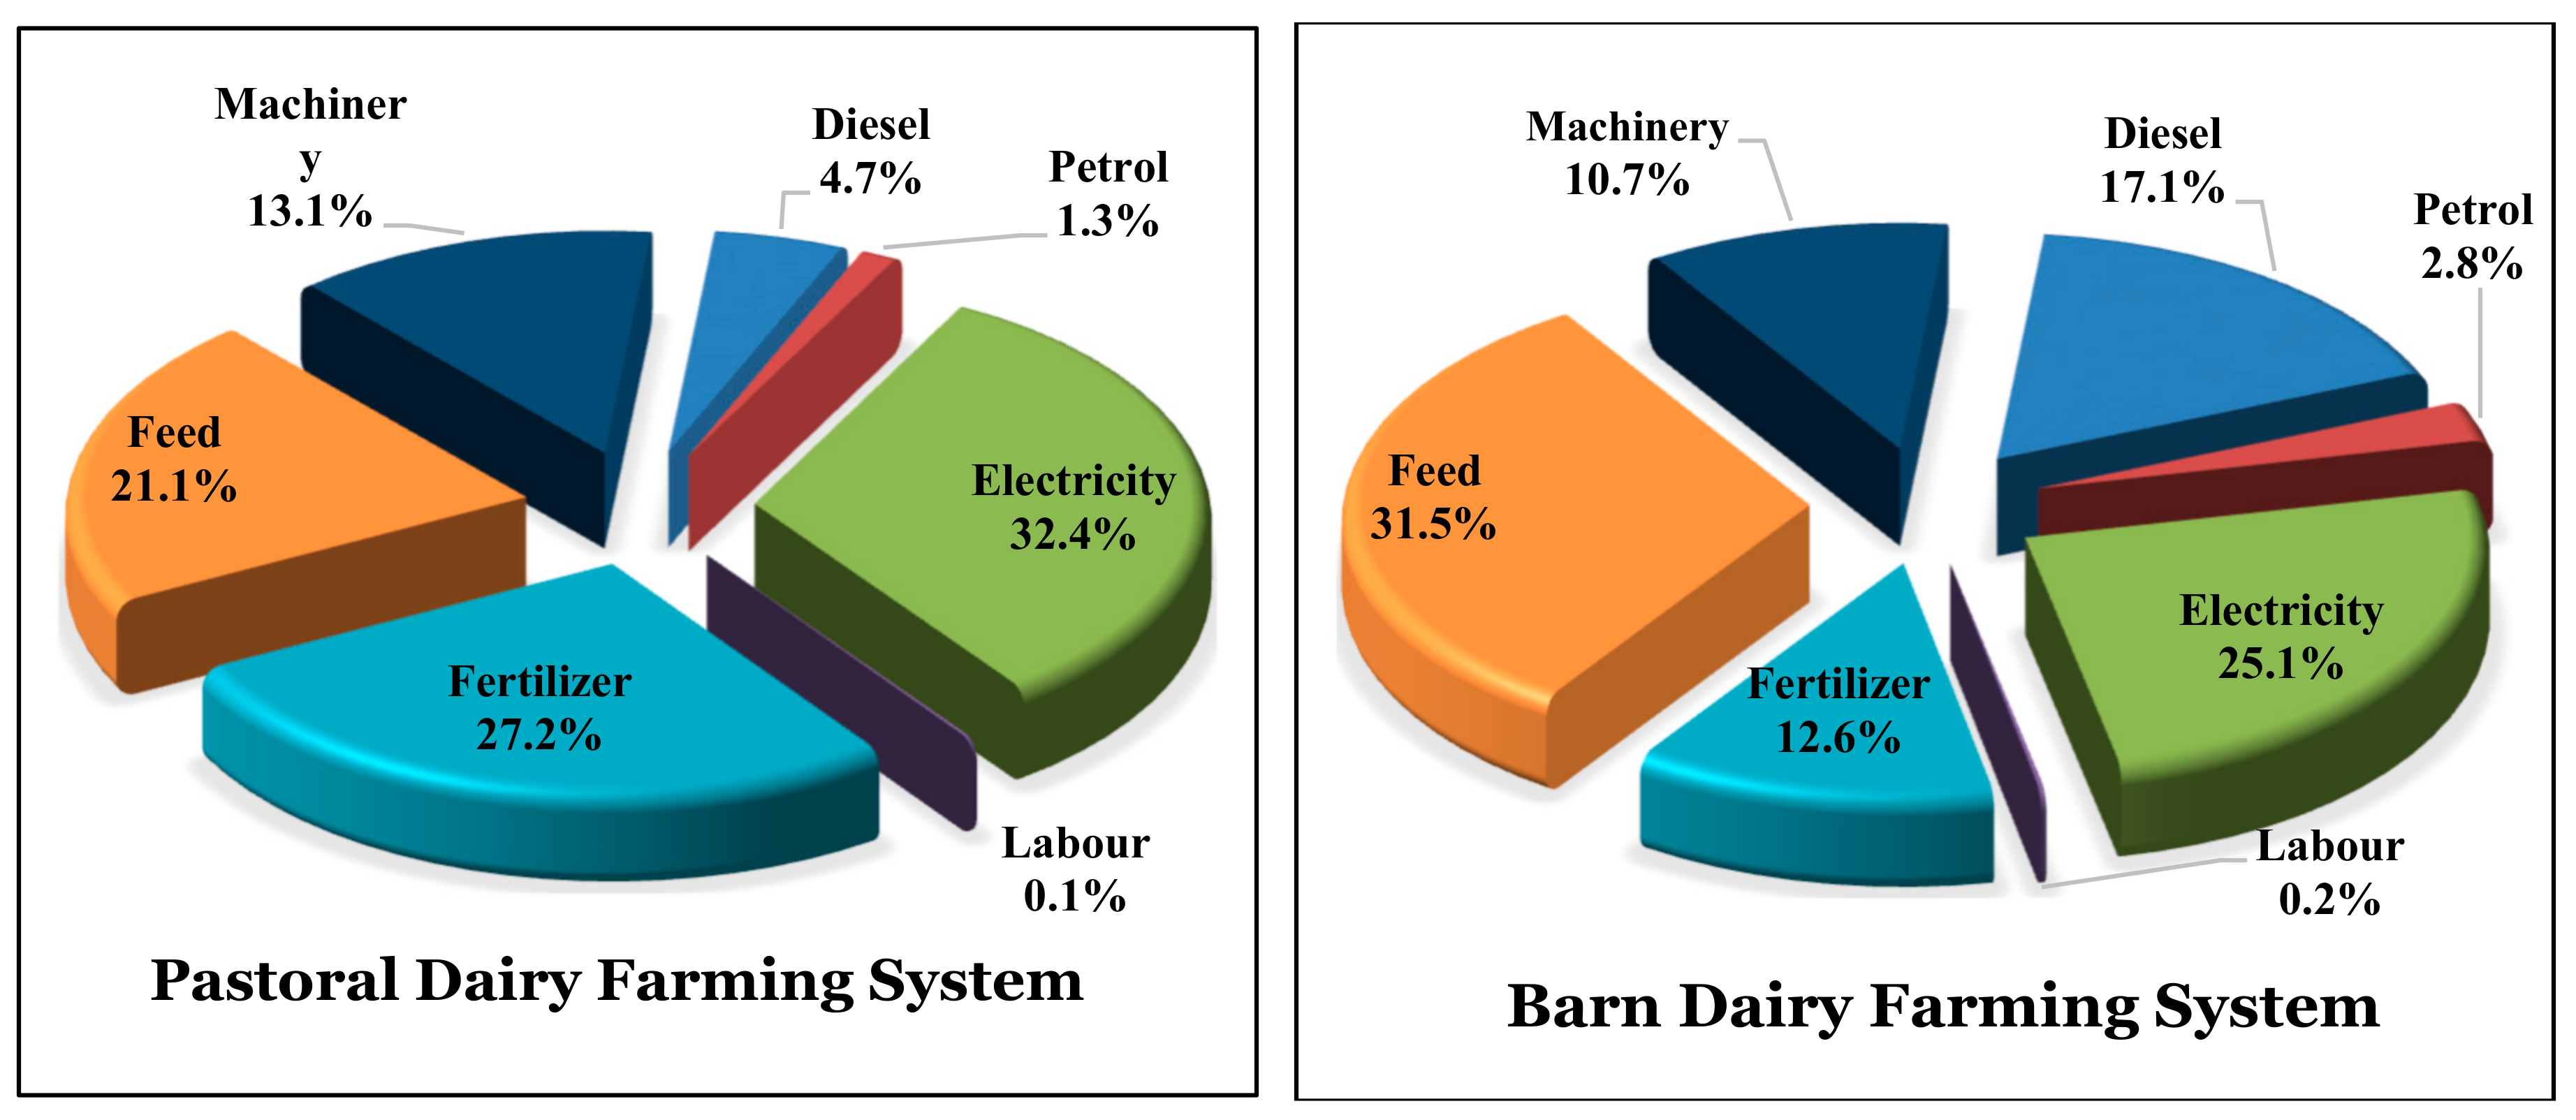
3.1. Energy Use Pattern
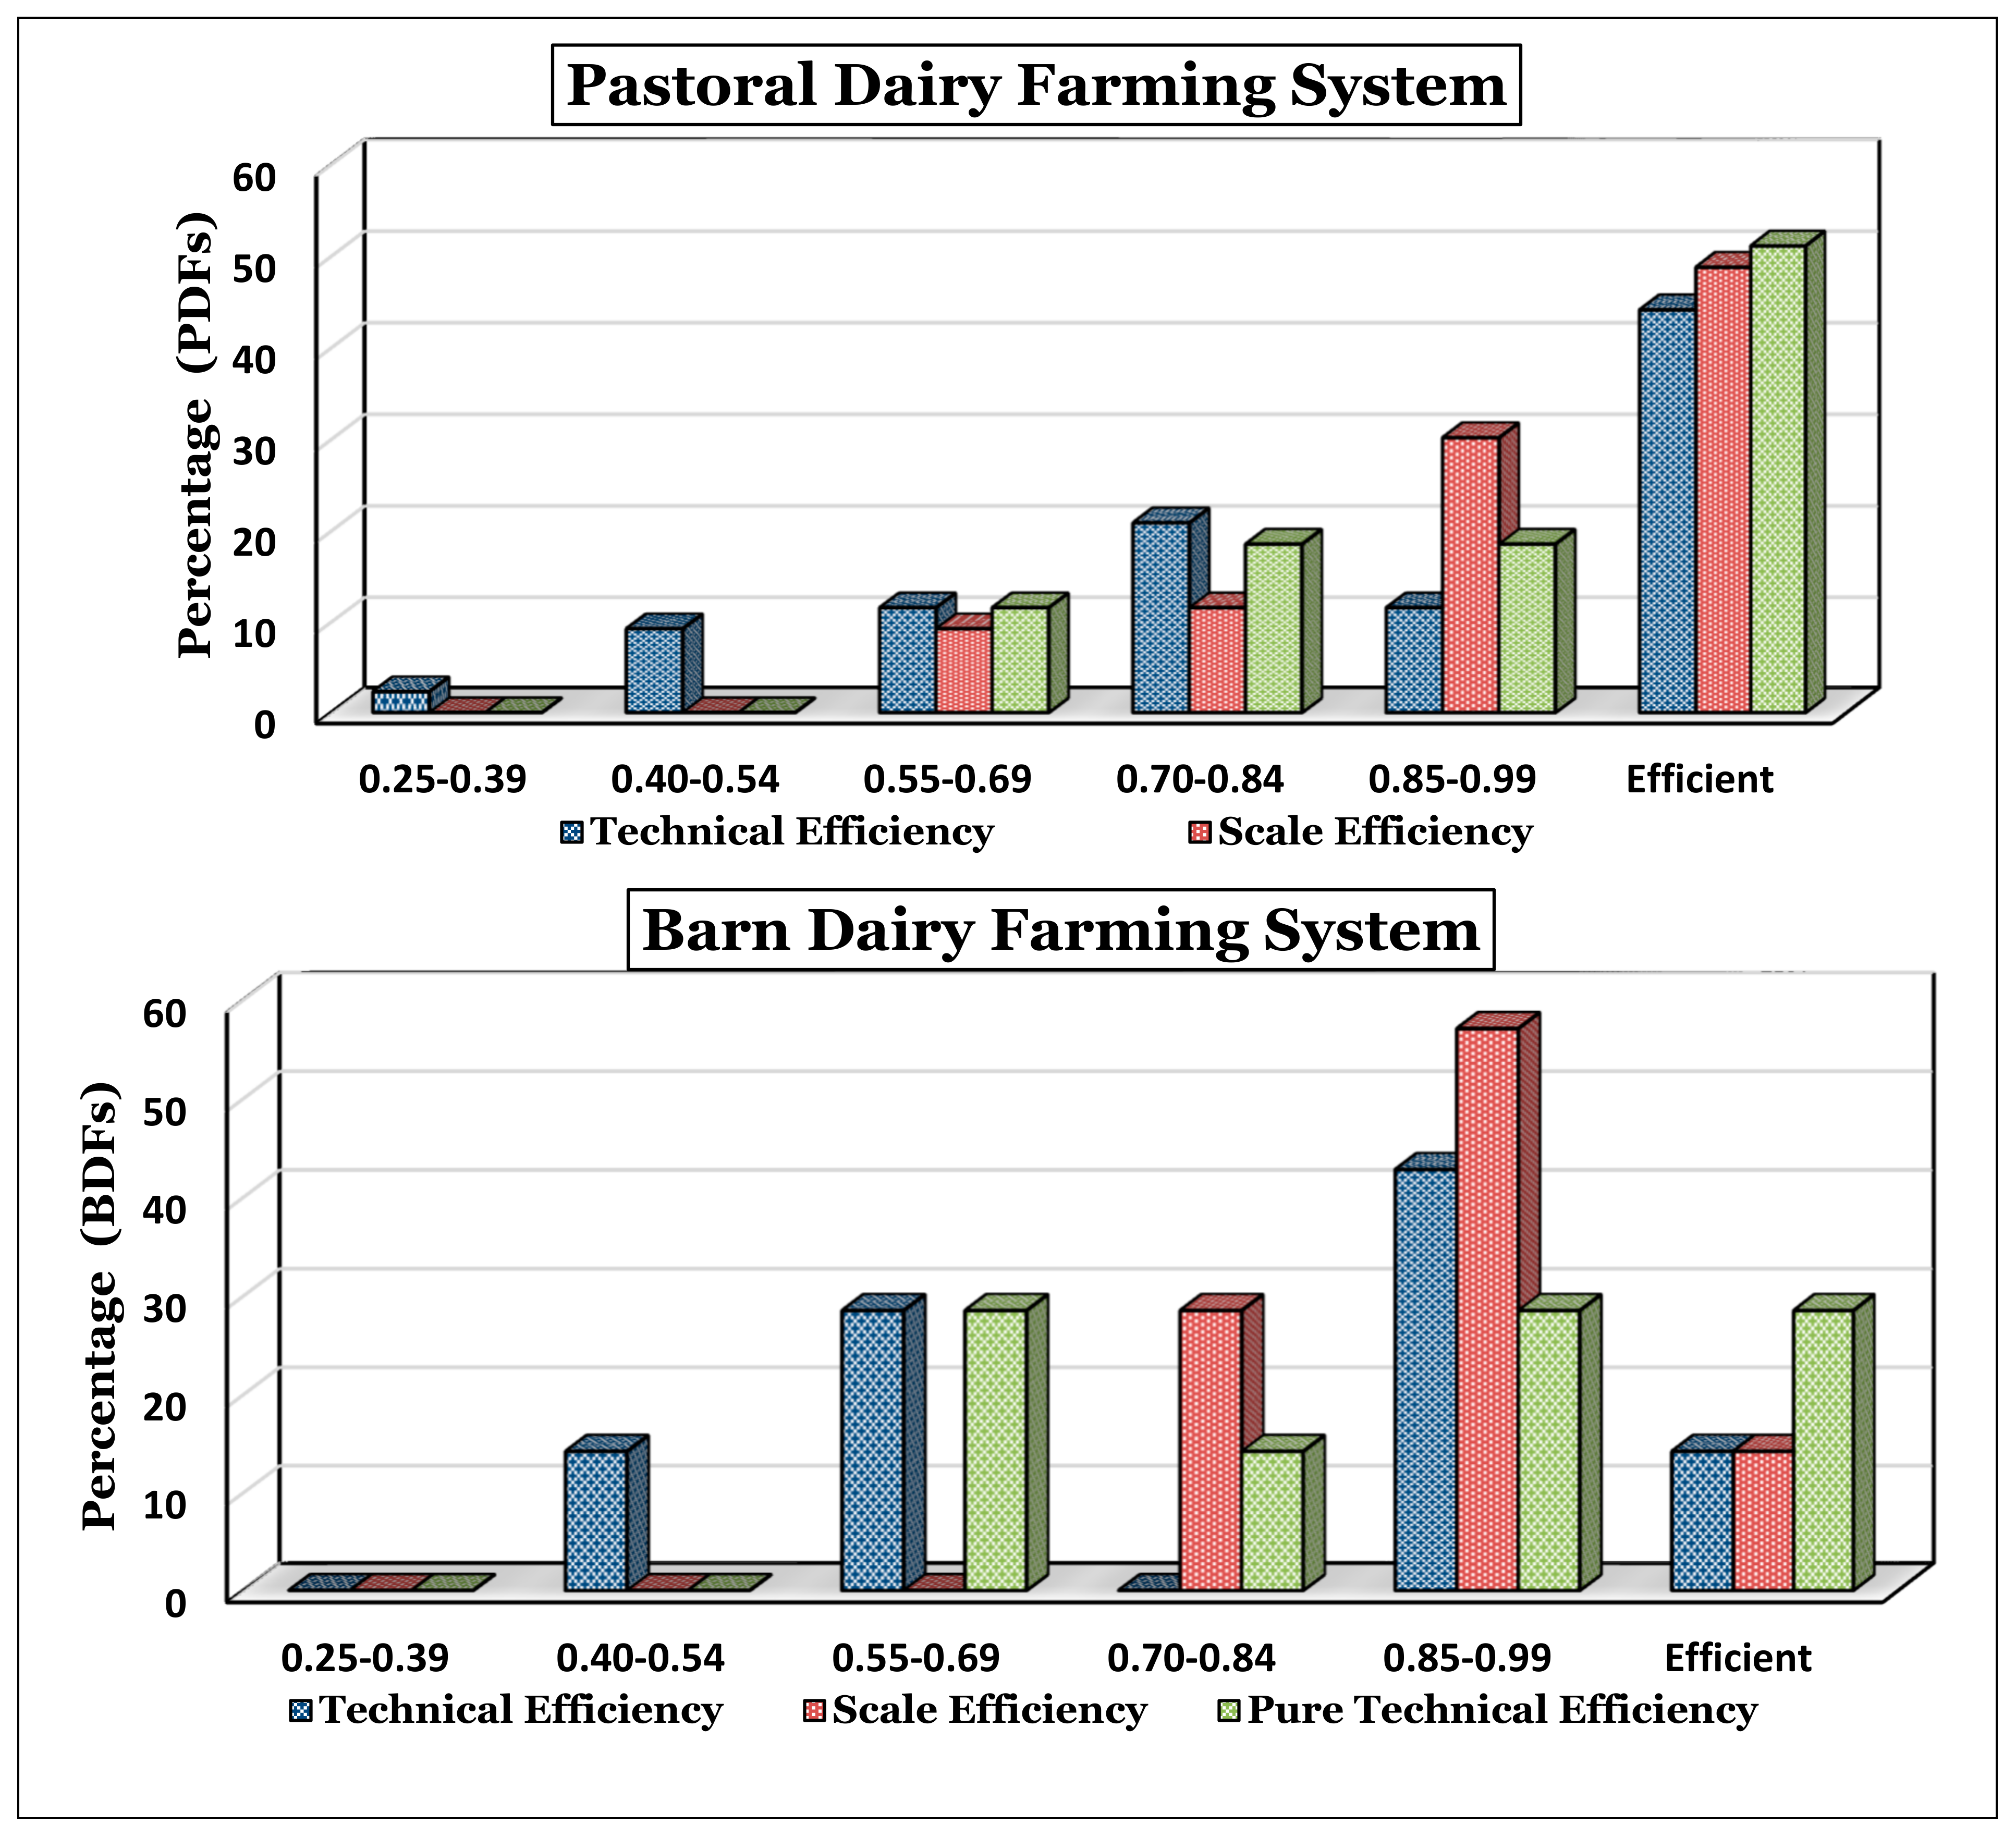
3.2. Efficiency Score of Dairy Farms
3.3. Benchmarking Categorization
3.4. Optimal Energy Requirements and Energy Saving Capacity
3.5. Improvement of Energy Indices
4. Conclusions
Author Contributions
Funding
Acknowledgments
Conflicts of Interest
References
- Liang, Q.M.; Fan, Y.; Wei, Y.M. Multi-regional input–output model for regional energy requirements and CO2 emissions in China. Energy Policy 2007, 35, 1685–1700. [Google Scholar] [CrossRef]
- Mohammadi, A.; Rafiee, S.; Jafari, A.; Keyhani, A.; Mousavi-Avval, S.H.; Nonhebel, S. Energy use efficiency and greenhouse gas emissions of farming systems in north Iran. Renew. Sustain. Energy Rev. 2014, 30, 724–733. [Google Scholar] [CrossRef]
- Esengun, K.; Gündüz, O.; Erdal, G. Input–output energy analysis in dry apricot production of Turkey. Energy Convers. Manag. 2007, 48, 592–598. [Google Scholar] [CrossRef]
- Uhlin, H.E. Why energy productivity is increasing: An IO analysis of Swedish agriculture. Agric. Syst. 1998, 56, 443–465. [Google Scholar] [CrossRef]
- Lackner, M. Energy Efficiency: Comparison of Different Systems and Technologies. In Handbook of Climate Change Mitigation and Adaptation; Springer: New York, NY, USA, 2017; pp. 1309–1384. [Google Scholar]
- Alam, M.S.; Alam, M.; Islam, K. Energy flow in agriculture: Bangladesh. Am. J. Environ. Sci. 2005, 1, 213–220. [Google Scholar] [CrossRef]
- Todde, G.; Murgia, L.; Caria, M.; Pazzona, A. A Comprehensive Energy Analysis and Related Carbon Footprint of Dairy Farms, Part 2: Investigation and Modeling of Indirect Energy Requirements. Energies 2018, 11, 463. [Google Scholar] [CrossRef] [Green Version]
- Uzal, S. Comparison of the energy efficiency of dairy production farms using different housing systems. Environ. Prog. Sustain. Energy 2013, 32, 1202–1208. [Google Scholar] [CrossRef]
- Wells, C. Total energy indicators of agricultural sustainability: Dairy farming case study. In Technical Paper 2001/13; MAF: Wellington, New Zealand, 2001; Volume 13. [Google Scholar]
- Ilyas, H.M.A.; Safa, M.; Bailey, A.; Rauf, S.; Pangborn, M. The carbon footprint of energy consumption in pastoral and barn dairy farming systems: A case study from Canterbury, New Zealand. Sustainability 2019, 11, 4809. [Google Scholar] [CrossRef] [Green Version]
- Dalgaard, T.; Halberg, N.; Porter, J.R. A model for fossil energy use in Danish agriculture used to compare organic and conventional farming. Agric. Ecosyst. Environ. 2001, 87, 51–65. [Google Scholar] [CrossRef] [Green Version]
- Meul, M.; Nevens, F.; Reheul, D.; Hofman, G. Energy use efficiency of specialised dairy, arable and pig farms in Flanders. Agric. Ecosyst. Environ. 2007, 119, 135–144. [Google Scholar] [CrossRef]
- Corré, W.; Schröder, J.J.; Verhagen, A. Energy use in conventional and organic farming systems. In Proceedings of the Open Meeting of the International Fertiliser Society, London, UK, 3 April 2003. [Google Scholar]
- DairyNZ. Zero Carbon Bill; DairyNZ Limited: Hamilton, New Zealand, 2019. [Google Scholar]
- Ajibefun, I.A.; Daramola, A.G.; Falusi, A.O. Technical efficiency of small scale farmers: An application of the stochastic frontier production function to rural and urban farmers in Ondo State, Nigeria. Int. Econ. J. 2006, 20, 87–107. [Google Scholar] [CrossRef]
- Moreira López, V.H.; Bravo-Ureta, B.E. A study of dairy farm technical efficiency using meta-regression: An international perspective. Chil. J. Agric. Res. 2009, 69, 214–223. [Google Scholar] [CrossRef]
- Jaforullah, M.; Devlin, N.J. Technical efficiency in the New Zealand dairy industry: A frontier production function approach. N. Z. Econ. Pap. 1996, 30, 1–17. [Google Scholar] [CrossRef]
- Jiang, N. Efficiency Analysis of NZ Dairy Farming and the Issue of Climate Change Policy. Ph.D. Thesis, The University of Auckland, Auckland, New Zealand, 2011. [Google Scholar]
- Jiang, N.; Sharp, B. Cost Efficiency of Dairy Farming in New Zealand: A stochastic frontier analysis. Agric. Resour. Econ. Rev. 2014, 43, 406–418. [Google Scholar] [CrossRef]
- Adler, N.; Friedman, L.; Sinuany-Stern, Z. Review of ranking methods in the data envelopment analysis context. Eur. J. Oper. Res. 2002, 140, 249–265. [Google Scholar] [CrossRef]
- Seiford, L.M.; Thrall, R.M. Recent developments in DEA: The mathematical programming approach to frontier analysis. J. Econ. 1990, 46, 7–38. [Google Scholar] [CrossRef]
- Hosseinzadeh-Bandbafha, H.; Safarzadeh, D.; Ahmadi, E.; Nabavi-Pelesaraei, A. Optimization of energy consumption of dairy farms using data envelopment analysis–A case study: Qazvin city of Iran. J. Saudi Soc. Agric. Sci. 2018, 17, 217–228. [Google Scholar] [CrossRef] [Green Version]
- Chauhan, N.S.; Mohapatra, P.K.; Pandey, K.P. Improving energy productivity in paddy production through benchmarking—An application of data envelopment analysis. Energy Convers. Manag. 2006, 47, 1063–1085. [Google Scholar] [CrossRef]
- Hosseinzadeh-Bandbafha, H.; Safarzadeh, D.; Ahmadi, E.; Nabavi-Pelesaraei, A.; Hosseinzadeh-Bandbafha, E. Applying data envelopment analysis to evaluation of energy efficiency and decreasing of greenhouse gas emissions of fattening farms. Energy 2017, 120, 652–662. [Google Scholar] [CrossRef]
- Nabavi-Pelesaraei, A.; Hosseinzadeh-Bandbafha, H.; Qasemi-Kordkheili, P.; Kouchaki-Penchah, H.; Riahi-Dorcheh, F. Applying optimization techniques to improve of energy efficiency and GHG (greenhouse gas) emissions of wheat production. Energy 2016, 103, 672–678. [Google Scholar] [CrossRef]
- Angulo-Meza, L.; Lins, M.P.E. Review of methods for increasing discrimination in data envelopment analysis. Ann. Oper. Res. 2002, 116, 225–242. [Google Scholar] [CrossRef]
- Nassiri, S.M.; Singh, S. Study on energy use efficiency for paddy crop using data envelopment analysis (DEA) technique. Appl. Energy 2009, 86, 1320–1325. [Google Scholar] [CrossRef]
- Cloutier, L.M.; Rowley, R. Relative technical efficiency: Data envelopment analysis and Quebec’s dairy farms. Can. J. Agric. Econ. Revue Canadienne D’agroeconomie 1993, 41, 169–176. [Google Scholar] [CrossRef]
- Barnes, A.; Oglethorpe, D. Scale Efficiencies and the Mid-Term Review: An Analysis of Scottish Dairy Farming. In Proceedings of the 78th Agricultural Economics Society, South Kensington, London, UK, 2–4 April 2004. [Google Scholar]
- Jaforullah, M.; Whiteman, J. Scale efficiency in the New Zealand dairy industry: A non-parametric approach. Aust. J. Agric. Resour. Econ. 1999, 43, 523–541. [Google Scholar] [CrossRef] [Green Version]
- Jaforullah, M.; Premachandra, E. Sensitivity of Technical Efficiency Estimates to Estimation Approaches: An Investigation Using New Zealand Dairy Industry Data; Economics Discussion Papers Series No. 306; University of Otago: Dunedin, New Zealand, 2003; p. 23. [Google Scholar]
- Wei, X. Efficiency Measurement of New Zealand Dairy Farms. Ph.D. Thesis, Auckland University of Technology, Auckland, New Zealand, 2014. [Google Scholar]
- Sefeedpari, P. Assessment and optimization of energy consumption in dairy farm: Energy efficiency. Iran. J. Energy Environ. 2012, 3, 213–224. [Google Scholar] [CrossRef]
- Latham, N.L. Carbon Footprints in the New Zealand Dairy Industry: A Comparison of Farming Systems. Master’s Thesis, Lincoln University, Lincoln, New Zealand, 2010. [Google Scholar]
- McChesney, I.G.; Sharp, B.M.; Hayward, J.A. Energy in New Zealand agriculture: Current use and future trends. Energy Agric. 1981, 1, 141–153. [Google Scholar] [CrossRef]
- Podstolski, M. The Evolution of Total Energy Inputs in the New Zealand Dairy Industry. Master’s Thesis, Lincoln University, Lincoln, New Zealand, 2015. [Google Scholar]
- Saunders, C.M.; Barber, A. Comparative Energy and Greenhouse Gas Emissions of New Zealand’s and the UK’s Dairy Industry; Lincoln University: Lincoln, New Zealand, 2007. [Google Scholar]
- Pow, T.; Longhurst, B.; Pow, Z. The future of NZ dairy farming systems: Self managing cows with access to partial housing. In Proceedings of the Fertilizer and Lime Research Centre (FLRC) Workshop, Wellington, New Zealand, 2–3 September 2014. [Google Scholar]
- Newman, M.; Journeaux, P. Wintering Barns No Quick Fix for Profit; DairyNZ: Hamilton, New Zealand, 2015. [Google Scholar]
- Kazemi, H.; Shahbyki, M.; Baghbani, S. Energy analysis for faba bean production: A case study in Golestan province, Iran. Sustain. Prod. Consum. 2015, 3, 15–20. [Google Scholar] [CrossRef]
- MED. Energy Data File 2011; Ministry of Economic Development: Wellington, New Zealand, 2012. [Google Scholar]
- Mani, I.; Kumar, P.; Panwar, J.; Kant, K. Variation in energy consumption in production of wheat–maize with varying altitudes in hilly regions of Himachal Pradesh, India. Energy 2007, 32, 2336–2339. [Google Scholar] [CrossRef]
- Wheeler. OVERSEER Technical Manual: Carbon Dioxide, Emboided and Other Gaseous Emissions; AgResearch Ltd.: Hamilton, New Zealand, 2018. [Google Scholar]
- Jekayinfa, S.; Bamgboye, A. Energy use analysis of selected palm-kernel oil mills in south western Nigeria. Energy 2008, 33, 81–90. [Google Scholar] [CrossRef]
- Coelli, T.J.; Rao, D.S.P.; O’Donnell, C.J.; Battese, G.E. An Introduction to Efficiency and Productivity Analysis; Springer Science & Business Media: Berlin, Germany, 2005. [Google Scholar]
- Alzamora, R.M.; Apiolaza, L.A. A DEA approach to assess the efficiency of radiata pine logs to produce New Zealand structural grades. J. For. Econ. 2013, 19, 221–233. [Google Scholar] [CrossRef]
- Zhu, J. Quantitative Models for Performance Evaluation and Benchmarking: Data Envelopment Analysis with Spreadsheets; Springer International Publishing: Cham, Switzerland, 2014. [Google Scholar]
- Allen, R.; Thanassoulis, E. Improving envelopment in data envelopment analysis. Eur. J. Oper. Res. 2004, 154, 363–379. [Google Scholar] [CrossRef]
- Charnes, A.; Cooper, W.W.; Rhodes, E. Measuring the efficiency of decision making units. Eur. J. Oper. Res. 1978, 2, 429–444. [Google Scholar] [CrossRef]
- Banker, R.D.; Charnes, A.; Cooper, W.W. Some models for estimating technical and scale inefficiencies in data envelopment analysis. Manag. Sci. 1984, 30, 1078–1092. [Google Scholar] [CrossRef] [Green Version]
- Coelli, T. A Guide to DEAP Version 2.1: A Data Envelopment Analysis (Computer) Program; Centre for Efficiency and Productivity Analysis, University of New England: Armidale, Australia, 1996. [Google Scholar]
- Ilyas, H.M.A.; Safa, M.; Bailey, A.; Rauf, S.; Cullen, M. Evaluation of Energy Footprint of Pastoral and Barn Dairy Farming Systems in New Zealand. In Proceedings of the 22nd International Farm Management Association (IFMA) Congress, Tasmania, Australia, 3–8 March 2019. [Google Scholar]
- Keehley, P. Benchmarking for Best Practices in the Public Sector: Achieving Performance Breakthroughs in Federal, State, and Local Agencies; Jossey-Bass Inc. Pub: Parow, South Africa, 1997. [Google Scholar]

| Inputs Items | Unit | Energy Coefficients (MJ unit−1) | References |
|---|---|---|---|
| Direct Energy Inputs | |||
| Diesel | litres | 45 | MED [41] |
| Petrol | litres | 42 | MED [41] |
| Electricity | kWh | 8.14 | Saunders and Barber [37] |
| Human Labour | hours | 1.96 | Mani, Kumar [42] |
| Indirect Energy Inputs | |||
| Fertilizers | |||
| kg | 64.1 | Wheeler [43] |
| kg | 28.4 | Wheeler [43] |
| kg | 17.8 | Wheeler [43] |
| kg | 3.24 | Wheeler [43] |
| Feed Supplement | |||
| t DM | 1781 | Wheeler [43] |
| t DM | 1564 | Wheeler [43] |
| t DM | 1329 | Wheeler [43] |
| t DM | 3905 | Wheeler [43] |
| t DM | 1800 | Wheeler [43] |
| Machinery & Equipment | |||
| kg | 160 | Wells [9] |
| kg | 160 | Wells [9] |
| kg | 160 | Wells [9] |
| sets of cups | Shed Energy | Wells [9] |
| Pastoral | Barn | |||||||
|---|---|---|---|---|---|---|---|---|
| Items | Avg | SD | Min | Max | Avg | SD | Min | Max |
| Direct Energy Inputs | ||||||||
| Diesel | 1824 | 778 | 436 | 4124 | 5099 | 4776 | 1570 | 15,750 |
| Petrol | 687 | 379 | 113 | 1752 | 1178 | 458 | 900 | 2198 |
| Electricity | 17,917 | 14,626 | 3312 | 78,954 | 19,447 | 11,206 | 10,095 | 34,020 |
| Labour | 86 | 21 | 46 | 141 | 114 | 30 | 55 | 150 |
| Indirect Energy Inputs | ||||||||
| Fertilizer | 15,128 | 4139 | 3579 | 19,064 | 9206 | 5071 | 0 | 16,244 |
| Feed Supplements | 6937 | 4338 | 0 | 16,124 | 12,515 | 2035 | 10,580 | 16,655 |
| Machinery | 7959 | 2546 | 1031 | 15,680 | 8274 | 2252 | 3688 | 10,559 |
| Total Energy Use | 50,538 | 16,598 | 18,539 | 108,750 | 55,833 | 11,494 | 40,737 | 69,872 |
| Output | ||||||||
| Milk | 60,571 | 17,480 | 32,693 | 94,141 | 64,121 | 18,447 | 44,894 | 96,710 |
| Particular | Pastoral | Barn | ||||||
|---|---|---|---|---|---|---|---|---|
| Avg | SD | Min | Max | Avg | SD | Min | Max | |
| Technical Efficiency | 0.84 | 0.19 | 0.36 | 1.00 | 0.78 | 0.20 | 0.51 | 1.00 |
| Pure Technical Efficiency | 0.90 | 0.13 | 0.58 | 1.00 | 0.84 | 0.18 | 0.55 | 1.00 |
| Scale Efficiency | 0.93 | 0.11 | 0.57 | 1.00 | 0.92 | 0.07 | 0.81 | 1.00 |
| DMU | System | TE Score | Frequency in Referent Set | Benchmarking * |
|---|---|---|---|---|
| 1 | P | 1 | 9 | |
| 2 | P | 1 | 10 | |
| 3 | P | 1 | 10 | |
| 4 | P | 1 | 11 | |
| 5 | P | 0.68 | 1 (0.2) 2 (0.2) 6 (0.1) | |
| 6 | P | 1 | 7 | |
| 7 | P | 1 | 8 | |
| 8 | P | 0.36 | 2 (0.2) 3 (0.0) 4 (0.0) 6 (0.1) 14 (0.0) 23 (0.1) | |
| 9 | P | 0.98 | 1 (0.6) | |
| 10 | P | 1 | 2 | |
| 11 | P | 0.54 | 2 (0.1) 3 (0.1) 27 (0.0) 28 (0.2) 33 (0.1) 49 (0.1) | |
| 12 | P | 0.81 | 4 (0.1) 28 (0.3) 33 (0.4) | |
| 13 | P | 1 | 2 | |
| 14 | P | 1 | 2 | |
| 15 | P | 1 | 0 | |
| 16 | P | 1 | 3 | |
| 17 | P | 0.52 | 2 (0.2) 3 (0.0) 6 (0.4) 14 (0.0) 36 (0.0) | |
| 18 | B | 0.56 | 2 (0.1) 3 (0.0) 7 (0.1) 27 (0.3) 33 (0.1) 36 (0.1) | |
| 19 | B | 0.63 | 1 (0.2) 13 (0.3) 27 (0.1) | |
| 20 | B | 0.94 | 3 (0.3) 4 (0.0) 28 (0.3) 33 (0.1) | |
| 21 | B | 0.90 | 7 (0.7) 27 (0.2) 28 (0.0) | |
| 22 | B | 0.91 | 7 (0.6) 13 (0.0) 27 (0.2) | |
| 23 | P | 1 | 2 | |
| 24 | P | 0.97 | 2 (0.6) 4 (0.0) 6 (0.1) 33 (0.1) 43 (0.3) 49 (0.0) | |
| 25 | B | 0.51 | 1 (0.2) 4 (0.1) 43 (0.0) 49 (0.3) 50 (0.2) | |
| 26 | P | 0.56 | 1 (0.1) 2 (0.1) 4 (0.1) 6 (0.4) 49 (0.0) 50 (0.1) | |
| 27 | B | 1 | 9 | |
| 28 | P | 1 | 9 | |
| 29 | P | 0.93 | 2 (0.2) 3 (0.3) 27 (0.0) 33 (0.3) 36 (0.1) | |
| 30 | P | 0.69 | 4 (0.1) 6 (0.5) 43 (0.1) 49 (0.2) | |
| 31 | P | 0.70 | 3 (0.3) 28 (0.2) 33 (0.3) 36 (0.1) 49 (0.1) | |
| 32 | P | 0.53 | 6 (0.1) 16 (0.5) 36 (0.1) | |
| 33 | P | 1 | 13 | |
| 34 | P | 0.76 | 1 (0.3) 16 (0.4) 36 (0.1) | |
| 35 | P | 0.71 | 2 (0.1) 3 (0.1) 27 (0.1) 33 (0.3) 36 (0.0) | |
| 36 | P | 1 | 11 | |
| 37 | P | 0.92 | 7 (0.4) 28 (0.3) 43 (0.1) 49 (0.4) | |
| 38 | P | 0.91 | 3 (0.2) 10 (0.1) 33 (0.3) 36 (0.3) 40 (0.2) | |
| 39 | P | 0.56 | 3 (0.1) 7 (0.2) 27 (0.0) 28 (0.0) 33 (0.2) 36 (0.0) | |
| 40 | P | 1 | 1 | |
| 41 | P | 0.66 | 1 (1.0) | |
| 42 | P | 0.81 | 1 (0.3) 4 (0.1) 43 (0.3) 49 (0.3) | |
| 43 | P | 1 | 6 | |
| 44 | P | 0.53 | 7 (0.5) 27 (0.1) 28 (0.1) 49 (0.0) | |
| 45 | P | 0.79 | 2 (0.2) 4 (0.3) 10 (0.0) 33 (0.2) | |
| 46 | P | 0.70 | 1 (0.0) 4 (0.4) 23 (0.3) 33 (0.0) 36 (0.0) 43 (0.1) | |
| 47 | P | 0.70 | 7 (0.0) 16 (0.1) 33 (0.6) 36 (0.0) | |
| 48 | P | 0.74 | 4 (0.0) 7 (0.7) 28 (0.0) | |
| 49 | P | 1 | 9 | |
| 50 | P | 1 | 2 |
| Inputs | Actual Energy Consumption (MJha−1) | Optimal Energy Requirements (MJha−1) | Saving Energy (MJha−1) | |||
|---|---|---|---|---|---|---|
| Pastoral | Barn | Pastoral | Barn | Pastoral | Barn | |
| Diesel | 1824 | 5099 | 1278 | 1782 | 546 | 3317 |
| Petrol | 687 | 1178 | 537 | 633 | 150 | 544 |
| Electricity | 17,917 | 19,447 | 14,173 | 14,586 | 3745 | 4861 |
| Labour | 86 | 114 | 70 | 79 | 15 | 36 |
| Fertilizer | 15,128 | 9206 | 11,975 | 6766 | 3153 | 2440 |
| Feed Supplements | 6937 | 12,515 | 4491 | 6422 | 2446 | 6093 |
| Machinery | 7959 | 8274 | 6440 | 6201 | 1519 | 2073 |
| Total | 50,538 | 55,833 | 38,964 | 36,469 | 11,574 | 19,364 |
| Items | Unit | Actual Energy Consumption | Optimal Energy Requirement | ||
|---|---|---|---|---|---|
| Pastoral | Barn | Pastoral | Barn | ||
| Energy Productivity | kgMS MJ−1 | 0.035 | 0.031 | 0.046 | 0.048 |
| Overall Energy Ratio | MJin/MJout | 0.90 | 0.92 | 0.66 | 0.57 |
| Direct Energy | MJha−1 | 20,514 | 25,838 | 16,058 | 17,080 |
| Indirect Energy | MJha−1 | 30,024 | 29,995 | 22,906 | 19,389 |
© 2020 by the authors. Licensee MDPI, Basel, Switzerland. This article is an open access article distributed under the terms and conditions of the Creative Commons Attribution (CC BY) license (http://creativecommons.org/licenses/by/4.0/).
Share and Cite
Ilyas, H.M.A.; Safa, M.; Bailey, A.; Rauf, S.; Khan, A. Energy Efficiency Outlook of New Zealand Dairy Farming Systems: An Application of Data Envelopment Analysis (DEA) Approach. Energies 2020, 13, 251. https://doi.org/10.3390/en13010251
Ilyas HMA, Safa M, Bailey A, Rauf S, Khan A. Energy Efficiency Outlook of New Zealand Dairy Farming Systems: An Application of Data Envelopment Analysis (DEA) Approach. Energies. 2020; 13(1):251. https://doi.org/10.3390/en13010251
Chicago/Turabian StyleIlyas, Hafiz Muhammad Abrar, Majeed Safa, Alison Bailey, Sara Rauf, and Azeem Khan. 2020. "Energy Efficiency Outlook of New Zealand Dairy Farming Systems: An Application of Data Envelopment Analysis (DEA) Approach" Energies 13, no. 1: 251. https://doi.org/10.3390/en13010251
APA StyleIlyas, H. M. A., Safa, M., Bailey, A., Rauf, S., & Khan, A. (2020). Energy Efficiency Outlook of New Zealand Dairy Farming Systems: An Application of Data Envelopment Analysis (DEA) Approach. Energies, 13(1), 251. https://doi.org/10.3390/en13010251