Article

Proposal of a Novel Semi-Submersible Floating Wind Turbine Platform Composed of Inclined Columns and Multi-Segmented Mooring Lines

1
School of Civil Engineering and Mechanics, Huazhong University of Science and Technology, Wuhan 430074, China
2
Department of Architecture and Building Engineering, Tokyo Institute of Technology, Yokohama, Kanagawa 1528550, Japan
3
Key Laboratory for Bridge and Wind Engineering of Hunan Province, College of Civil Engineering, Hunan University, Changsha 410082, China
*
Author to whom correspondence should be addressed.
Energies 2019, 12(9), 1809; https://doi.org/10.3390/en12091809
Submission received: 12 April 2019 / Revised: 7 May 2019 / Accepted: 8 May 2019 / Published: 12 May 2019

Abstract

:
The semi-submersible floating offshore wind turbine has been studied in detail due to its good stability. However, the occurrence of typhoons are very frequent in China’s offshore area, putting forward a higher requirement for the stability of the floating wind turbine system. By changing the connection mode of the mooring line as well as the structural form of the platform based on the original OC4 model, two groups of models were examined by an in-house developed code named as the Analysis Tool of Floating Wind Turbine (AFWT). The influence of the arrangement of the mooring lines and the inclination angle of the upper columns on the motion response were clarified. It was found that the surge motion of the platform would be obviously decreased by decreasing the length of the upper segments of the mooring lines, while the heave motion of the platform would be significantly decreased as increasing the inclined angle of the columns. Therefore, a new model integrating the optimized multi-segmented mooring lines and the optimized inclined columns was proposed. The examinations showed that compared with the response motions of the original OC4 semi-submersible model, the proposed model could reduce both the surge and heave motions of the platform effectively.

1. Introduction

Wind energy continues to receive more and more attention due to its renewable and non-polluting advantages. From the beginning of the 21st-Century, wind power has been continuously developed around the world, making crucial contributions to dealing with global warming [1,2,3]. The on-shore wind energy has developed rapidly in the recent decades. However, on-shore wind power accounts for a large amount of land resources, and in some countries, such as China, the on-shore wind energy is always far away from the cities with high demand for electricity. Furthermore, studies about wind turbine noise (WTN) found that WTN has the indirect health effects, such as sleep disturbance and annoyance [4,5,6,7,8], which can be overcome by offshore wind turbines to some extent. In addition, considering the advantages that the offshore wind energy is close to the developed cities and the offshore wind speed is relatively high in Chinese seas, developing offshore wind energy has become an inevitable trend. Moreover, with the increase of water depth in the construction area of offshore wind farms, in order to ensure the operation of the wind turbine and reduce the construction cost, the foundation of the offshore wind turbine develops from the traditional fixed type to the floating type.
Several offshore wind turbine concepts have been studied to explore the feasibility using offshore wind energy. In shallow to medium water depths below 60 m, conventional bottom support monopiles, tripods, and jacket structures can be utilized. However, in deeper waters, floating platforms may be more feasible and economical as support structures [9]. Additionally, there are several widely used floating platforms, including spar type [10,11,12,13,14,15,16,17,18,19,20], tension leg platform (TLP) type [21,22,23], and semi-submersible type [24,25,26,27,28]. Among these platforms, the semi-submersible foundation tends to rely mainly on the balance of its own gravity and buoyancy to maintain vertical stability and the mooring system to ensure the stability of the system in the other directions. Therefore, the semi-submersible wind turbines have become a popular floating platform type [29].
Many studies have aimed at reducing the motions of the semi-submersible platform. It has not only been studied numerically [30,31,32,33], but also through experiments [34,35,36,37]. For instance, Zambrano et al. [38] proposed a MiniFloat concept for a semi-submersible platform, capable of supporting three wind turbines. Meanwhile, a coupled motion model, including the floating body and the anchor chain, was established. However, the cost was found to be too high to be adopted in the actual application. Shimada et al. [39] put forward a semi-submersible structure with three wind turbines. They carried out a 1:150 model test and the experimental results indicated that the dynamic response of the platform could be reduced effectively. However, the whole system was extremely large, increasing the difficulties for construction. Robertson et al. [40] proposed the well-known OC4 semi-submersible floating system which was extensively examined [41,42,43]. This concept has several advantages. Firstly, its static and dynamic stability provides sufficiently low pitch performance enabling the use of commercial offshore wind turbines; second, its design and fabrication methodology allow for onshore assembly of the complete system including the wind turbine. Then, several floating platform concepts similar to the OC4 semi-submersible floating system were proposed, such as WindFloat by Roddier et al. [44], Tri-Floater by Huijs et al. [45], and the fish-farming cage type by Zheng et al. [46].
In the design phase, numerical simulation is an important way examining the system behavior. Jonkman et al. [47] developed a numerical code to calculate the dynamic performances of the floating platforms based on both the potential flow theory and the Morison equations, by which Ormberg et al. [48] examined several floating wind turbine concepts. Then, Karimirad et al. [49] further developed a code and carried out a comprehensive numerical study for the spar floating wind turbines with catenary and tension mooring systems, considering the effects of aerodynamic and hydrodynamic damping under extreme environmental conditions. The National Renewable Energy Laboratory (NREL) developed a code named as FAST (Fatigue, Aerodynamics, Structures, and Turbulence), which was adopted in many researches [50,51]. At the same time, Borg et al. [26] developed a code especially for floating vertical axis wind turbines (VAWTs) and used it for calculating a series of complex simulation load cases.
However, the occurrence of typhoons is very frequent in the China offshore area, putting forward a higher requirement for the stability of the floating wind turbine system. Therefore, based on the original OC4 semi-submersible model, a new semi-submersible floating wind turbine platform is proposed to improve the stability of the system in the present study. The mooring system adopts multi-segmented mooring lines, while the platform model consists of three vertically inclined columns. The motion responses of the platform under different load conditions are calculated by AFWT. The basic calculation theories are introduced in Section 2. Section 3 introduces the main parameters of each part of the original model firstly, and then it will demonstrate the specific parameters of the modified models. In Section 4, AFWT will be validated by comparing with the experiments. After that, the platform motion responses of each model under regular wave and irregular wave conditions will be studied and compared with the original OC4 model.

2. Numerical Calculation Theory

Compared to traditional onshore wind turbines, the floating wind turbines are subject to more complex environmental loads, including aerodynamic loads on the turbine rotor, hydrodynamic loads, and mooring forces on the floating platform. The aerodynamic force is transmitted to the floating platform through the tower, and the mooring system provides restoring force to the platform, which affects the movement of the platform. The calculation theory of the aerodynamics, mooring system, and platform will be briefly introduced below.

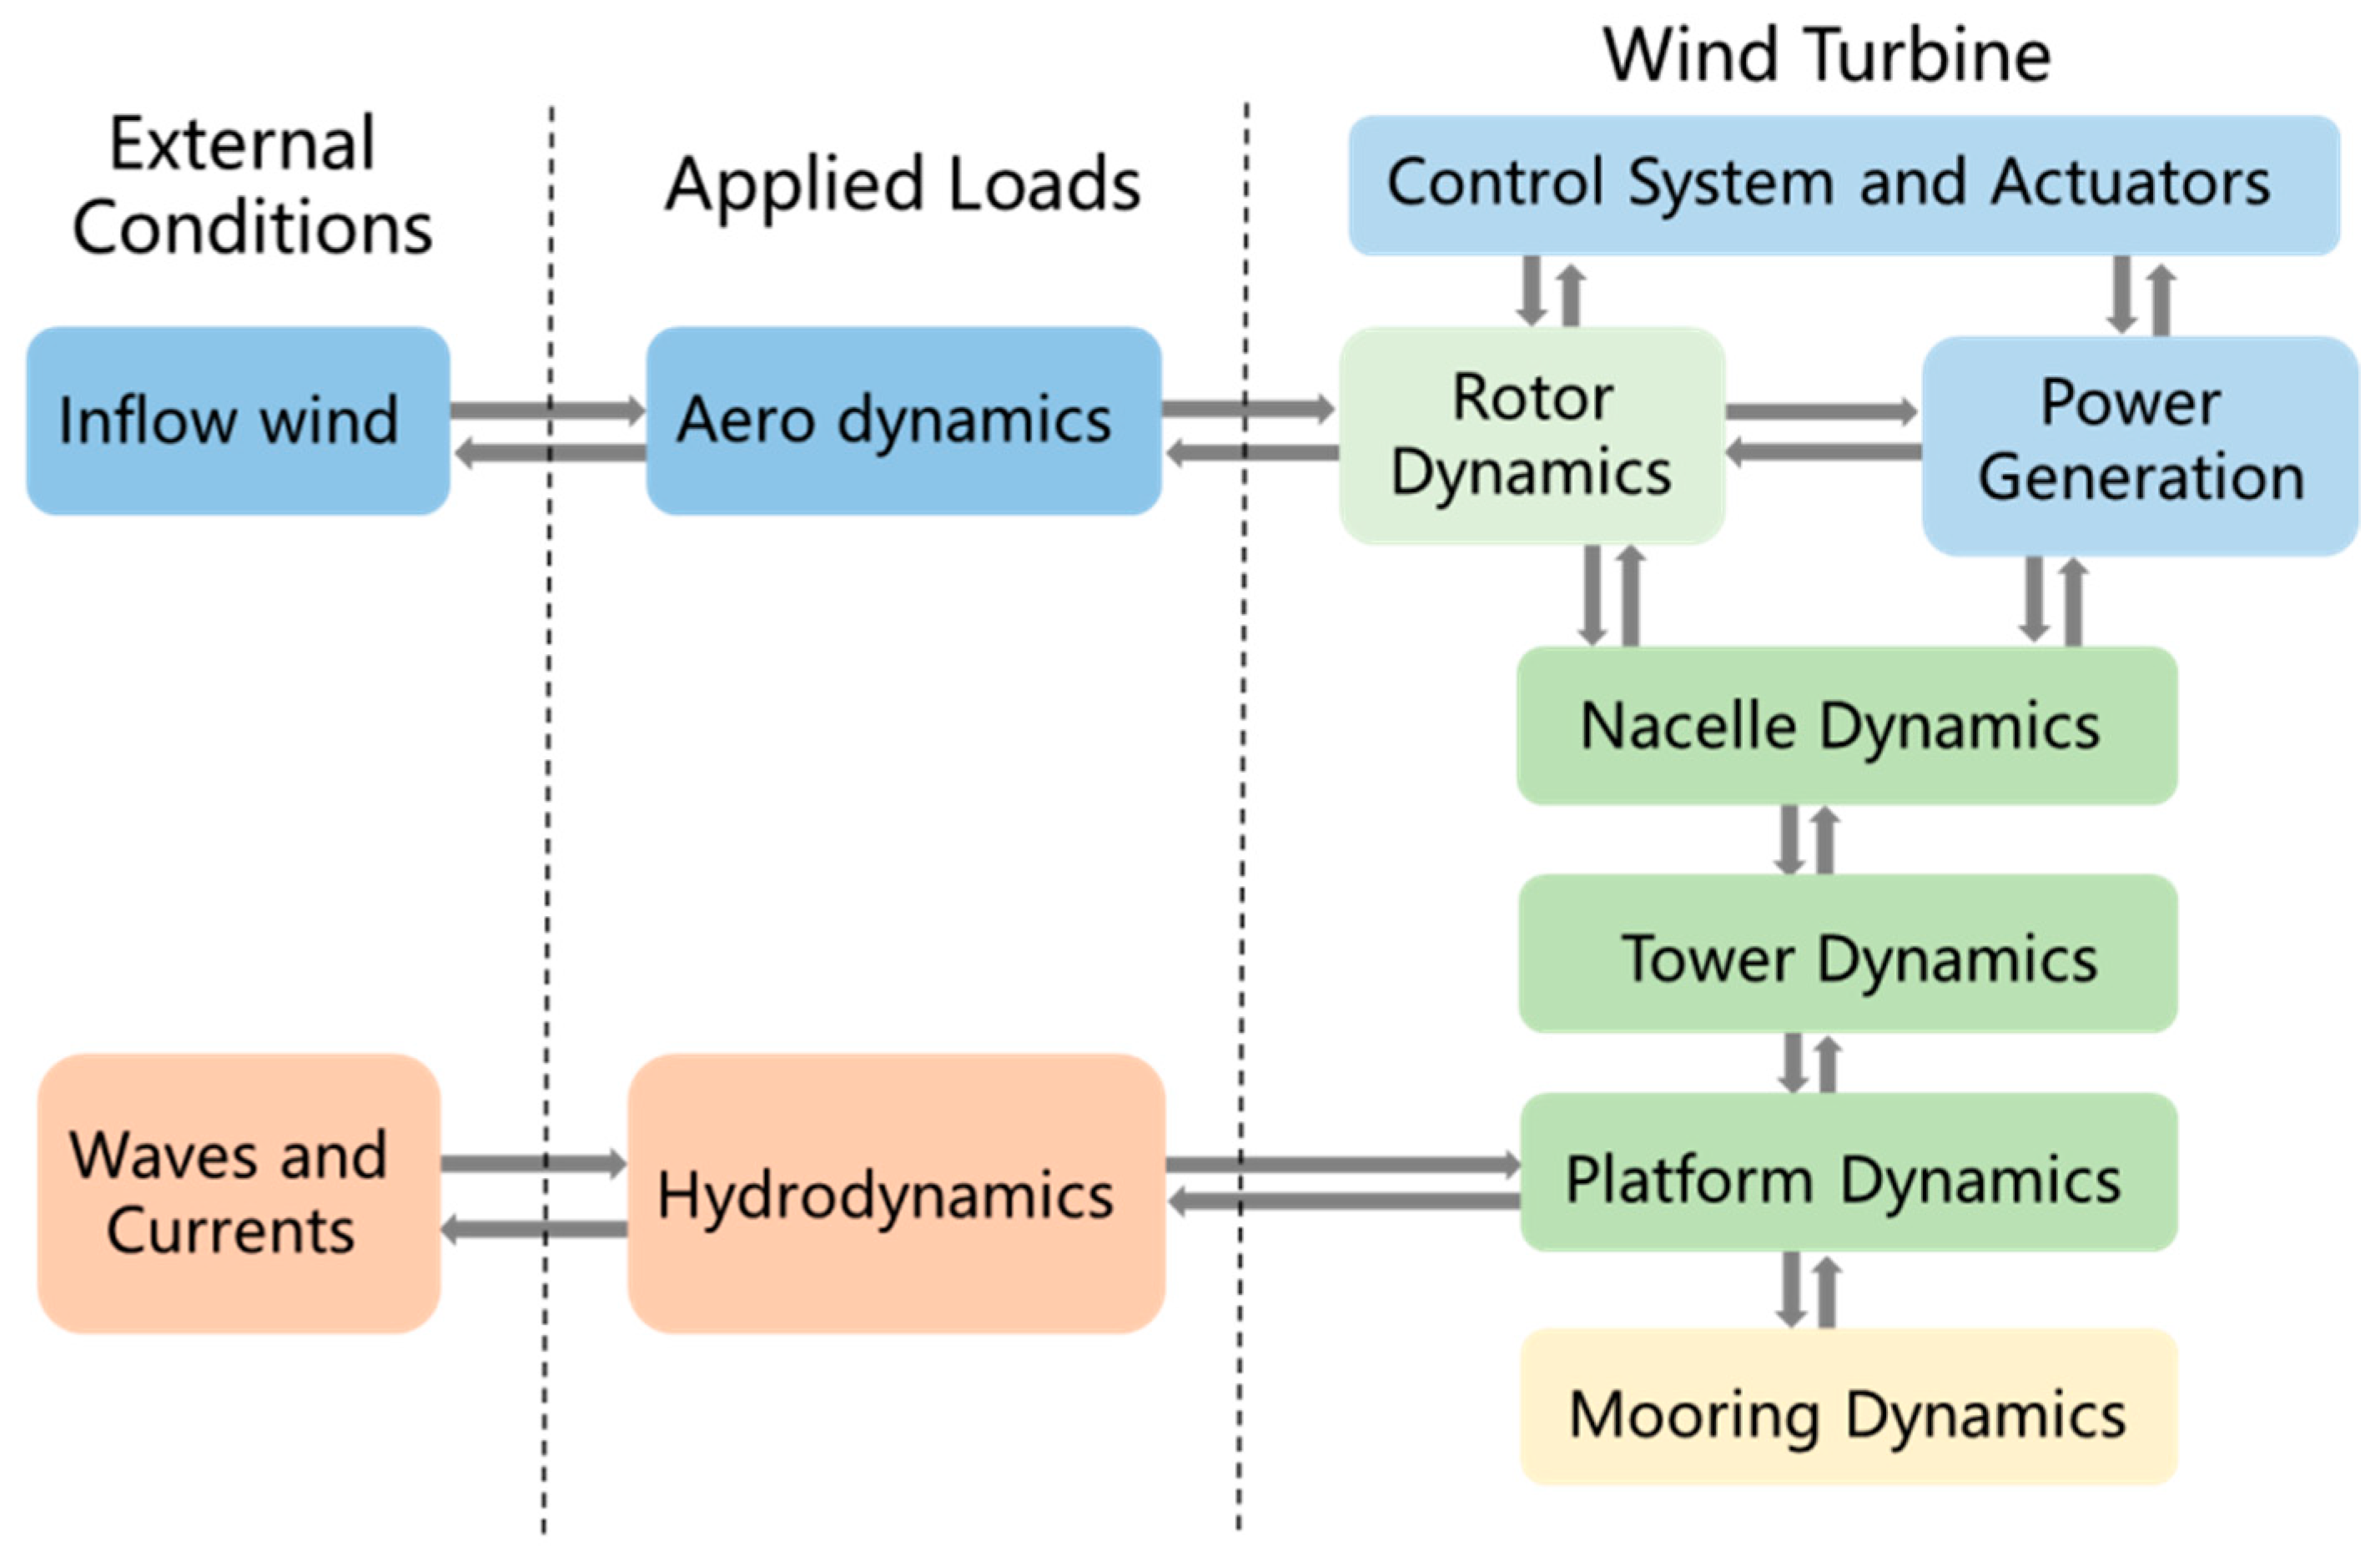
2.1. Dynamic Coupling Process

AFWT employed in this paper consists of the models of aerodynamics, hydrodynamics, and structural dynamics. Additionally, the inflow wind, waves, and currents are considered in this paper as the external conditions, where the blade element moment (BEM) theory is used to calculate the aerodynamic loads on the blade, and the hydrodynamic loads are calculated by the potential theory. Figure 1 shows the main modules and their coupling relationship in AFWT. In AFWT, the wind turbine tower and platform are considered as a rigid body, which is calculated by multi-body dynamics method. In the calculation process, the low-frequency response of six degrees of freedom (DOF) is analyzed, and the second-order effects of the platform as well as the wind turbine are ignored. The mooring system uses quasi-static multi-segment catenary theory to calculate the line shape and the forces on the mooring lines.

2.2. BEM Theory

The blades and towers of the wind turbine are subject to aerodynamic loads, and the BEM theory is used to calculate the aerodynamic loads of the blades. During the calculation process, the upper structure of the wind turbine has been modelled as a rigid body, and the calculated aerodynamic loads are transmitted to the whole structure, which can be calculated by BEM [52,53]. The normal force and the torque on the control volume of the thickness dr are expressed as follows:
d T = 1 2 ρ B C n V 1 2 ( 1 a ) 2 c d r s i n 2 φ
d M = 1 2 ρ B C t V 1 ( 1 a ) ω r ( 1 + a ) c r d r s i n φ c o s φ
where ρ represents the air density, B is the number of the blades, V1 is the wind speed, c is the blade chord length, φ represents the relation flow angle, equaling to the blades pitch angle adding the angle of attack, and Cn and Ct are the coefficients for the normal force and thrust force, which can be calculated by the lift coefficient Cl and drag coefficient Cd, respectively:
C n = C l c o s φ + C d s i n φ
a and a′ are the axial and tangential induction factor, respectively. They can be calculated using the expression below:
a = 1 4 s i n 2 φ σ C n + 1 ,   a = 1 4 s i n φ c o s φ σ C t 1
where σ is the fraction of the annular area in a control volume.

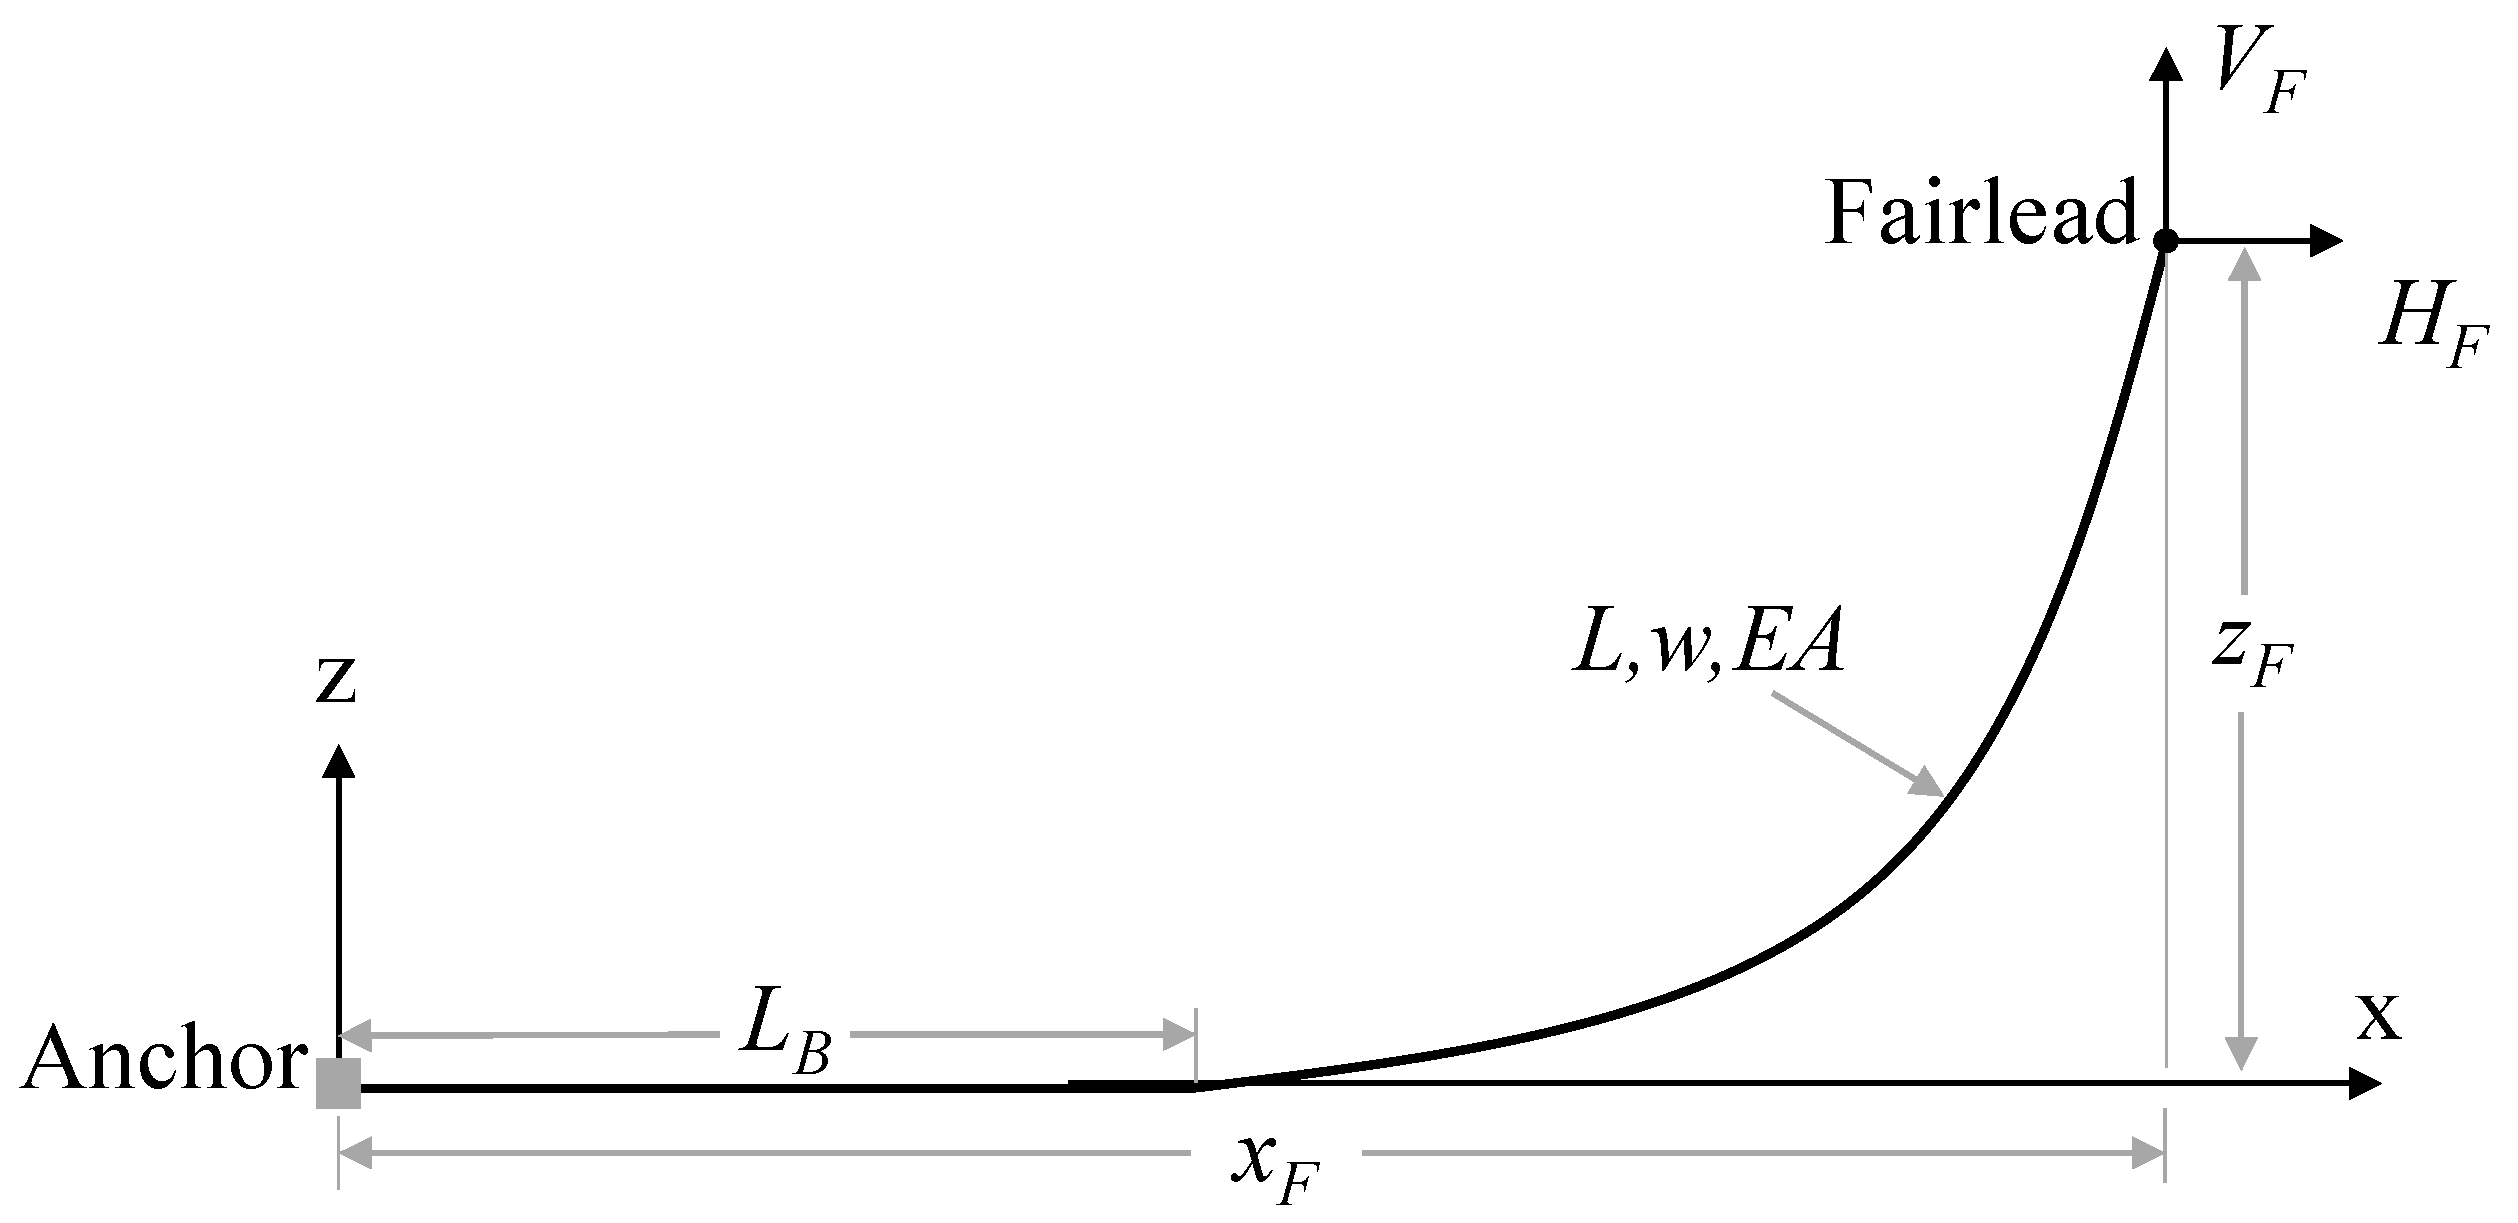
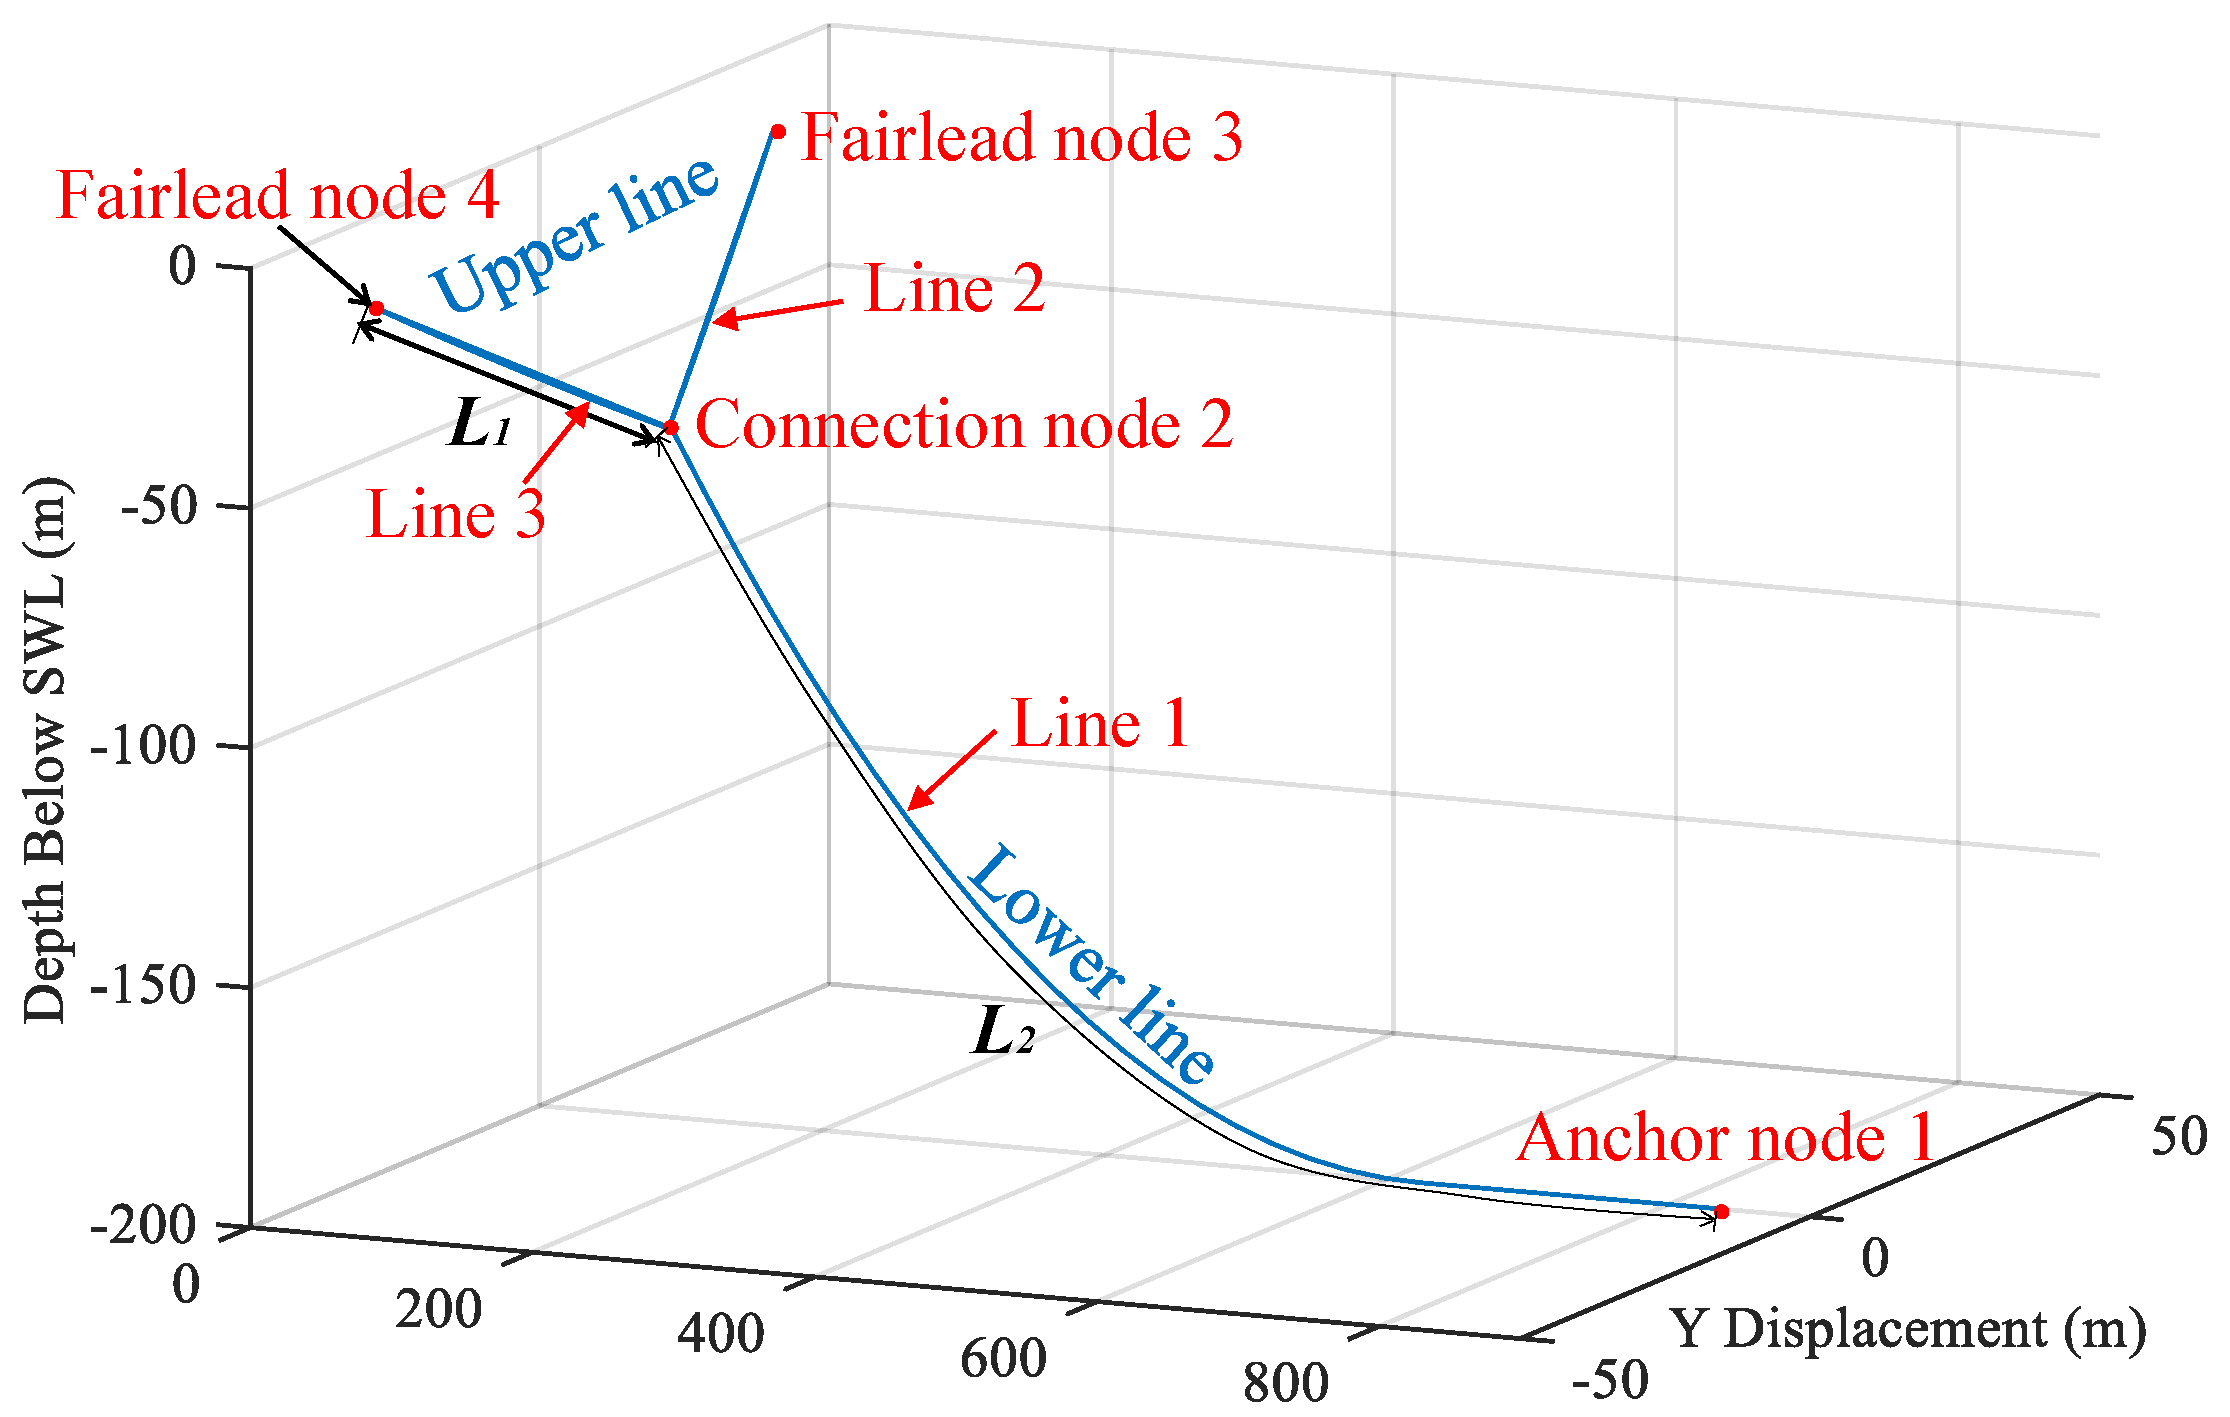
2.3. Mooring System Theory

Quasi-static theory [49] is applied to calculate the line shape as well as the tension of the mooring lines. The analytical equation for a single mooring line between two fixed points is expressed in Equations (6) and (7) and the key parameters are shown in Figure 2.
When a portion of the line lays on the seabed [54,55]:
x F ( H F , V F ) = L B + H F w l n [ V F H F + 1 + ( V F H F ) 2 ] + H F L E A + C B w 2 E A [ L B 2 + ( L B H F C B w ) M A X ( L B H F C B w , 0 ) ]
z F ( H F , V F ) = H F w [ 1 + ( V F H F ) 2 1 + ( V F w L H F ) 2 ] + 1 E A ( V F L w L 2 2 )
where xF and zF are, respectively, the horizontal and vertical coordinates of the fairlead position relative to the anchor. HF and VF are, respectively, the horizontal and vertical components of the effective tension in the mooring line at the fairlead, w represents the mass of the mooring line per unit length, L is the total unstretched mooring line length, and EA represents the sectional stiffness of the mooring line, CB is the coefficient of static friction between the seabed and the mooring line, L B = L V F w is the length of catenary relaxation on the seabed. Equations (6) and (7) are solved iteratively in the local coordinate system using methods such as the Newton–Raphson method.
Subsequently, the line shape and tension of the catenary can be calculated using Equations (8)–(11), when a portion of cable is relaxing on the seabed:
x ( s ) = { s   for   0 s ( L B H F C B w ) s + C B w 2 E A [ s 2 2 s ( L B H F C B w ) + ( L B H F C B w ) λ ]   for   ( L B H F C B w ) < s L B   L B + H F w l n [ w ( s L B ) H F + 1 + ( w ( s L B ) H F ) 2 ] + H F s E A + C B w 2 E A [ λ ( L B H F C B w ) L B 2 ] for   L B < s L
z ( s ) = { 0   for   0 s L B H F w [ 1 + ( w ( s L B ) H F ) 2 1 ] + w ( s L B ) 2 2 E A   for   L B < s L
T e ( s ) = { M A X [ H F + C B w ( s L B ) ,   0 ]   for   0 s L B H F 2 + [ w ( ( s L B ) ) ] 2   for   L B < s L
λ = { L B H F C B w   if   ( L B H F C B w ) > 0 0   otherwise
where s is the length from the catenary point to the anchor, x and z are the lengths in the horizontal and vertical directions, respectively, and Te is the line tension. Similarly, HA and VA are the horizontal and vertical components of the effective tension in the mooring line at the anchor, respectively. They can be calculated as HA = MAX [HF + CBwLB, 0] and VA = 0.
The mooring system of the modified models is specially connected by multi-segment catenaries. Thus, to obtain the analytical solution of the multi-segment catenary equations, the coordinate transformation is carried out. Additionally, the analytical model is converted from the local xz coordinate system to the global XYZ coordinate system. In addition, the unknowns for each line are solved in the local xz frame, and the static equilibrium is ascertained by solving for line properties, resulting in zero sum forces on the nodes in the XYZ frame.
In the multi-segmented mooring lines in Figure 3, the coordinates of nodes 1, 3, and 4 are determined. In order to find the coordinates of the connecting node 2 and the force at each point, the force on the node 2 must satisfy the following force balance equation:
{ H 1 u } X + { H 2 l } X + { H 3 l } X = 0
{ H 1 u } Y + { H 2 l } Y + { H 3 l } Y = 0
V 1 u + V 2 l + V 3 l = F e x t
where Hiu, Viu, Hil, and Vil are the magnitudes of horizontal (“H”) and vertical (“V”) forces at the upper node (“u”) and lower node “l” of line i, respectively. Fext is the external force at the connection node 2, such as the buoyancy module or the node weight. In this particular application, Fext = 0. Then we can determine the line shapes and tensions of each catenary according to Equations (8)–(11). More detailed introduction can be found in the study by Masciola et al. [55].
The force of the sub-mooring line is calculated by the above-mentioned single-line catenary theory under local coordinate system. The numerical value of force in the global coordinate system can be obtained by the coordinate conversion matrix.

2.4. Hydrodynamic Theory

The research by Jonkman [47,56] suggested two theories for calculating the hydrodynamic loads. One is the Morison’s equation and the other is the potential flow theory. Morison’s equation is applicable for calculating the hydrodynamic loads on slender cylindrical structures when the effects of diffraction and radiation damping are negligible. In order to model the interaction between the waves and the structures in a more accurate way, the potential flow theory was adopted, which is capable of considering the forces induced by both the diffraction and the radiation. Therefore, in the present study the potential flow theory is applied. By defining a potential function ϕ ( x ,   y ) , the governing equation for ϕ is:
2 ϕ = 0
where ϕ / x = u , ϕ / y = v , and ϕ / z = w . u, v, and w are the velocity components of the flow fields in the Cartesian coordinates. After determining the boundary conditions at the free surface, the surface of the structures, and the sea bed, the potential function can be solved and the velocity distribution can be obtained.

2.5. Platform Motion Equation

To study the dynamic responses of a FOWT in the time domain, the platform was considered as a rigid body, with its motion from the equation given as [57]:
( M + A ) X ¨ ( t ) + C X ˙ ( t ) + K X ( t ) = F w a v e s ( t ) + F w i n d ( t ) + F m o o r i n g ( t ) + F v i s ( t )
where X(t) is the generalized displacement of the platform in the time domain; X ˙ ( t ) and X ¨ ( t ) represent the generalized velocity and acceleration, respectively; M is the mass matrix; A and C are the added mass matrix and damping coefficient matrix, respectively, which are caused by the wave radiation; K represents the hydrostatic restoring force matrix. Fwaves(t) is the incident-wave induced force; Fwind(t) is the wind loads acting on the blades and tower, Fmooring(t) represents the mooring tension, and Fvis(t) is the drag force caused by fluid viscosity.
The wave induced force, F w a v e s , is calculated by:
F w a v e s = + 1 2 π W ( ω ) 2 π B ( ω ) X j ( ω , β ) e i ω t d ω  
where ω is the frequency of the incident wave; W ( ω ) is Fourier transform of a white noise time series with unit variance, B ( ω ) is the wave spectrum (P-M spectrum in this paper), X j ( ω , β ) is the wave-induced force, and β is the incident wave direction angle.
The flow separation behind the structures will induce the viscous drag force, F i v i s , which is calculated by:
F i v i s = 0 h 1 2 ρ C d w D ( v w , i v s , i ) | v w , i v s , i | d z
where C d w is the drag coefficient of water, v w , i is the velocity of water and v s , i is the velocity of structure, and h is the height of the structure.
The added mass matrix, A i j , and damping coefficient matrix, C i j , is calculated as:
A i j = ρ w R e { ϕ i n ϕ j d S }
C i j = ρ w l m { ϕ i n ϕ j d S }
where ϕ is the potential function, S is the mean body wetted surface, and ρ w is the seawater density.
The hydrostatic restoring force matrix K i j , affected by the wetted surface and the hydrostatic pressure, is defined as:
K 33 = ρ w g n 3 d S
K 34 = ρ w g n 3 y b d S
K 35 = ρ w g n 3 x b d S
K 44 = ρ w g n 3 y b 2 d S + ρ w g z b m g z g
K 45 = ρ w g n 3 x b y b d S
K 46 = ρ w g x b + m g x g
K 55 = ρ w g n 3 x b 2 d S + ρ w g z b m g z g
K 56 = ρ w g y b + m g y g
where all other values of K i j = 0 , g is the gravity acceleration equaling to 9.8 m s−2. is the average of the submerged volume, defined as:
= n 1 x d S = n 2 y d S = n 3 z d S
and x g , y g , and z g are the coordinates of the center of gravity of the structure, and x b , y b , and z b are the coordinates of the center of buoyancy of the structure.

3. Models of the Semi-Submersible FOWT

The configuration of the original OC4 semi-submersible model along with the modified models will be introduced, and the load cases will be also summarized in this section.

3.1. Wind Turbine

The NREL offshore 5 MW baseline wind turbine [58] is a conventional three-blade upwind turbine, which is mounted on the top of semi-submersible floating platform. The tower base is located at 10 m high from the still water level (SWL). Table 1 summarizes the key properties for the wind speed and the mass distribution of the wind turbine.

3.2. Floating Platform of Original OC4

The semi-submersible floating platform in OC4 consists of three main offset columns along with a central column used to support the wind turbine, and a series of diagonally intersecting and horizontal bracing components. The base columns are connected to the bottom of the upper columns to prevent the platform from generating excessive heave motions. The center column of the platform has a diameter of 6.5 m and a length of 30 m. The upper columns of the three main offset columns have a diameter of 12 m and a length of 26 m. Similarly, the base columns have a diameter of 24 m and a length of 6 m, which are connected by 1.6 m diameter cross-bracings [59,60,61]. Table 2 summarizes the main configurations of the platform. Meanwhile, Figure 4 illustrates the structure of the original OC4 model.

3.3. Mooring System of Original OC4

The platform is moored by three mooring lines which are 120 degrees apart from each other. In the mooring system, the fairleads of the mooring lines are situated at the top of the base columns, 14.0 m deep below the SWL, and 40.87 m from the centerline of the platform. Table 3 shows the main characteristics of the mooring line.

3.4. Modifications of the Original OC4 Model

Two groups of modified models based on the original OC4 model will be examined. The first group applies multi-segmented mooring lines and the second group applies inclined columns. Figure 3 shows the mooring system adopted in the first group. Here, the mooring line is divided into three segments. Lines 2 and 3 are the upper lines from the connection node to the fairlead node, while line 1 is the lower line from the anchor to the connection node. Models 2, 3, and 4, as listed in Table 4, are generated by changing the length of the upper mooring line L1. Furthermore, to ensure that the total weight of the mooring lines is a constant, the density of the upper line is changed to be 55.05 kg/m. The second group (Model 5 and Model 6), as listed in Table 4, is generated by changing the vertical upper columns in OC4 to be inclined upper columns. The tilt angles, θ, of the upper columns of Model 5 and Model 6 are 15° and 30°, respectively. The tilt angle is applied with respect to the base columns, and is positive for clockwise rotation with respect to the main column. Finally, Model 7, as an integration of Model 4 and Model 6, is proposed. Table 4 summarizes the sketch of the models and the key geometrical parameters of each model. It should be pointed out that Model 5 and Model 6 only change the tilt angle of the upper columns. The length, as well as the diameter, of the upper columns is unchanged. The length of the upper braces becomes longer but the weight of the upper braces is set to be a constant.
Mooring line pretensions for the different models are listed in Table 5. It can be seen from Table 5 that the pretension of Line 1 in the original Model 1 is 1.11 × 10⁶ N. From Models 1–4, the pretension of Line 1 is gradually increased. The pretensions of Lines 2 and 3 are found to be very sensitive to the change of the length of the upper segment lines. The pretensions of Lines 2 and 3 in Model 4 are about twice as large as those in Model 1. Figure 5 shows the restoring force as a function of the displacement in each direction to calculate the mooring stiffness, which is listed in Table 6. The increase of the mooring stiffness in the surge direction from Model 1 to Model 4 is clear; however, there is almost no change for the stiffness in heave and pitch directions. The natural periods of each model determined by free decay tests are listed in Table 7, from which we can find that the natural period of the surge direction is decreased as the model changes from Model 1 to Model 4, due to the increase of the surge stiffness of the system. On the other hand, for the natural period in the heave direction, a clear increase can be found as change the model from Model 1 to Model 5 and Model 6, due to the fact that the more inclined columns increase the waterplane area which, in turn, increases the added mass of the system.

3.5. Load Cases

To study the performance of the models, the dynamic motions of these 7 models at different wave conditions are calculated. Table 8 lists the main parameters of load cases, where H is the wave height and T is the period for regular waves. Additionally, Hs is the significant wave height and Tp is the peak spectral period for irregular waves. More specifically, wind and waves are in the surge direction. Linear Airy wave theory is used in the generation of regular waves, and irregular waves are described by the Pierson Moskowitz spectrum.

4. Results

In this section, the motion responses of the models under different load conditions are calculated by AFWT. The rigid body platform consists of six DOFs, including surge, sway, heave, roll, pitch, and yaw. In general, the surge, heave, and pitch responses of the platform are relatively apparent motions of the whole system. As such, only the surge, heave, and pitch motions of the platform will be studied. Firstly, AFWT is validated. After that, the code is used in calculating the motion of the models in different load conditions.

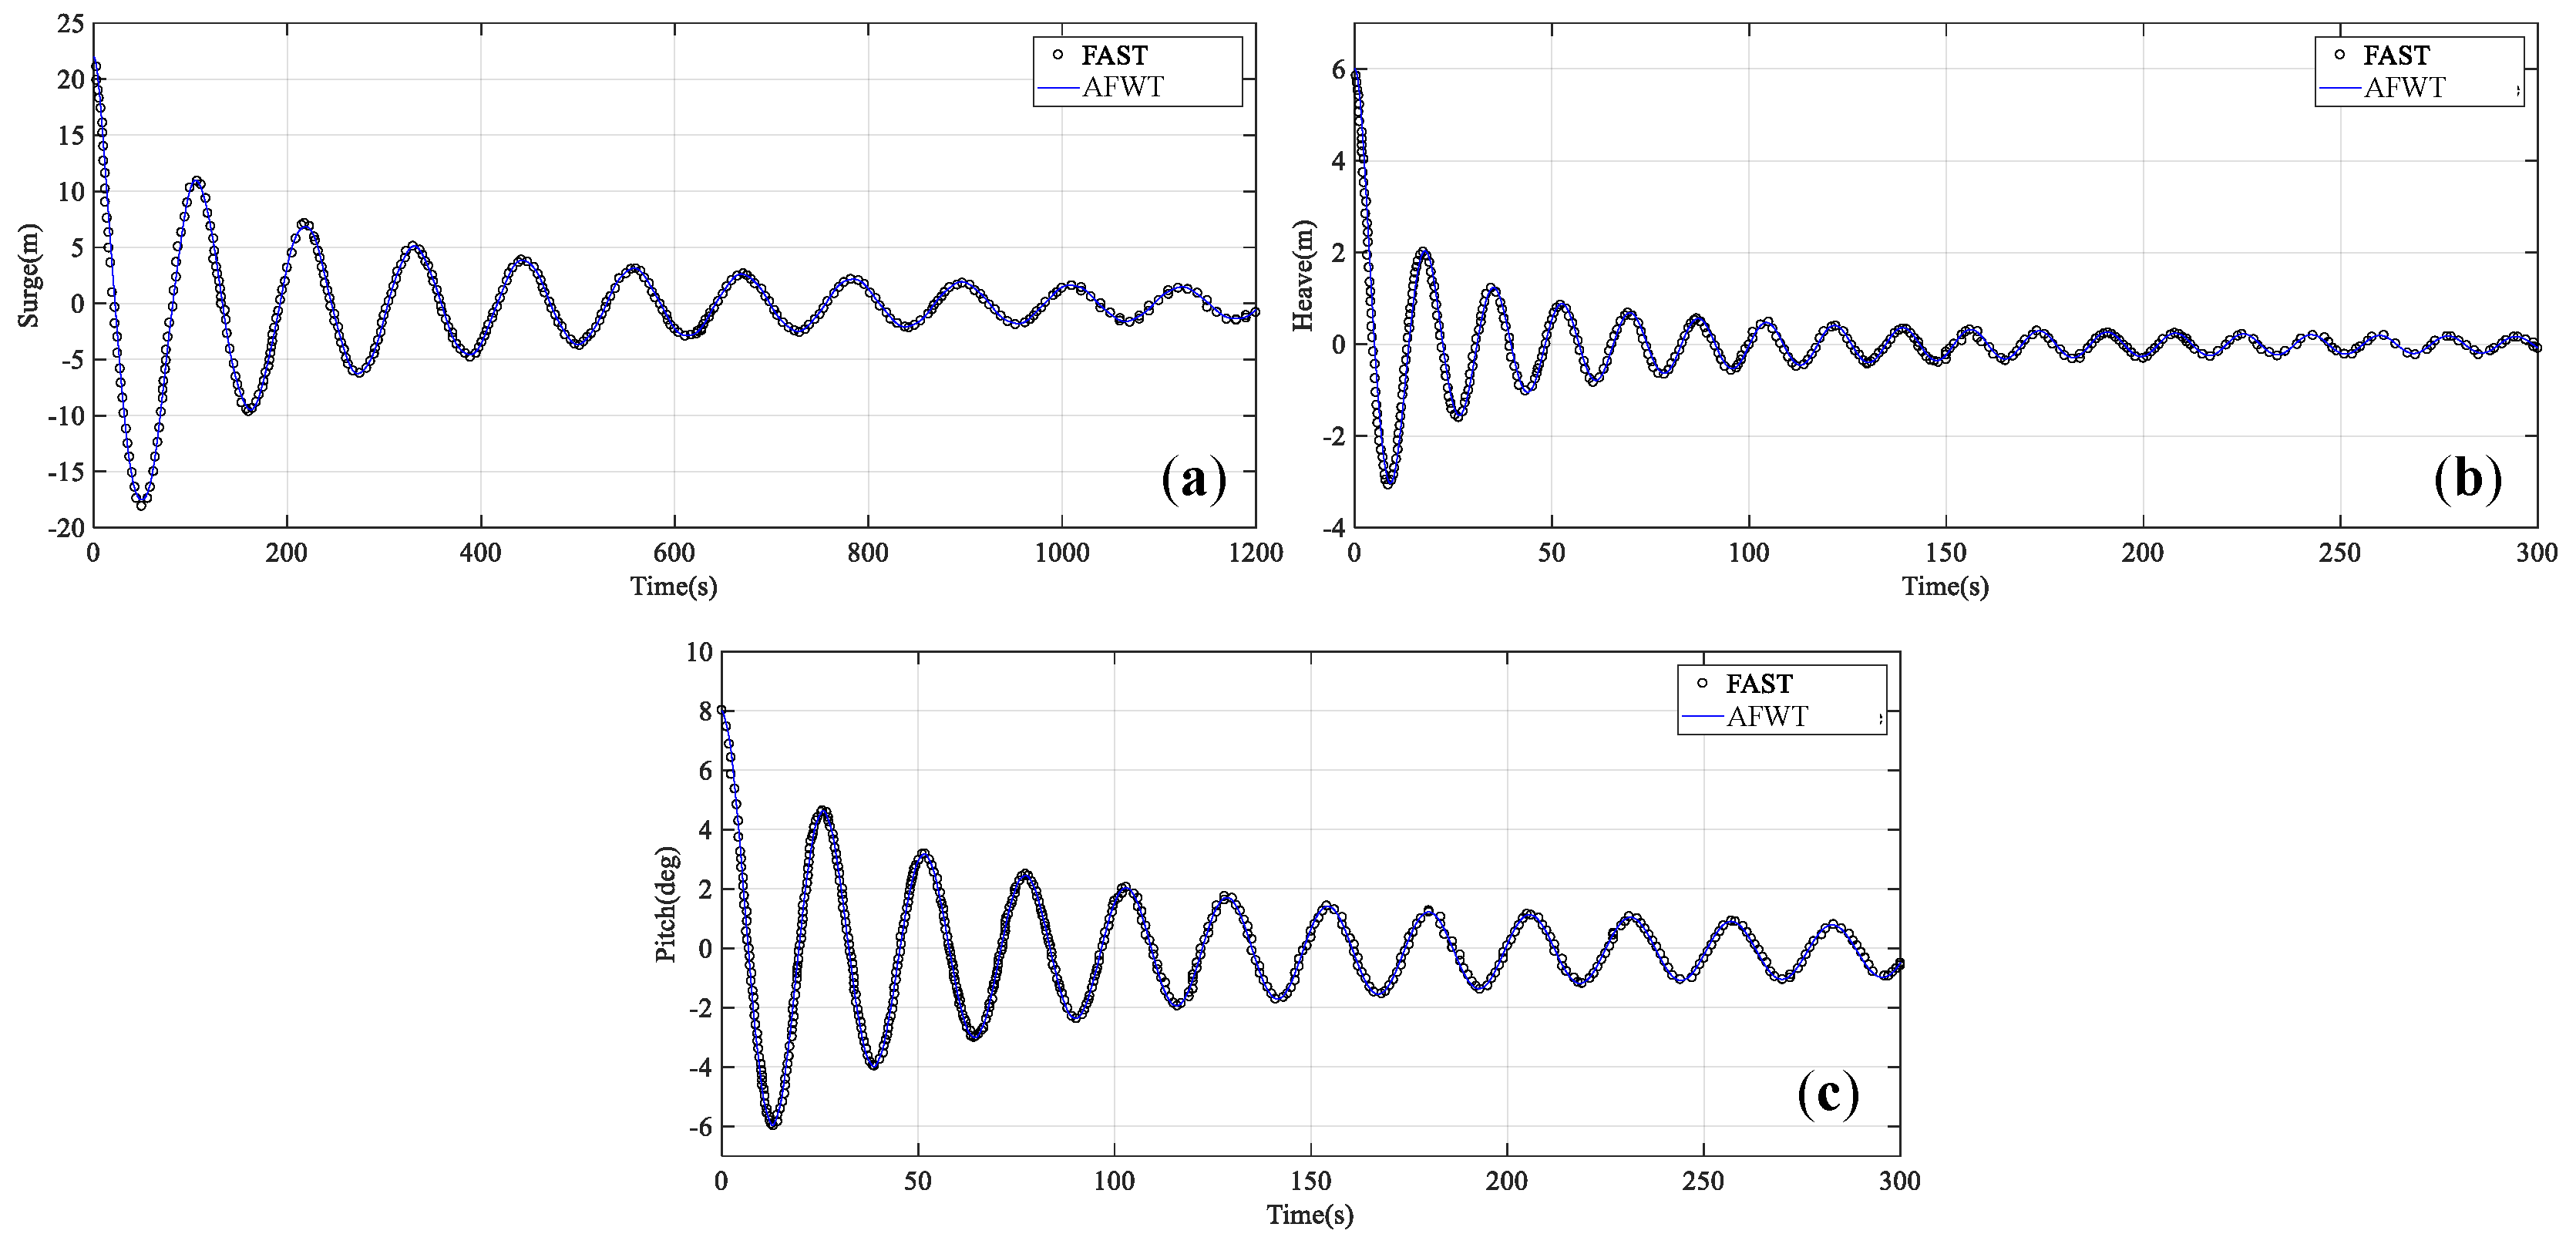
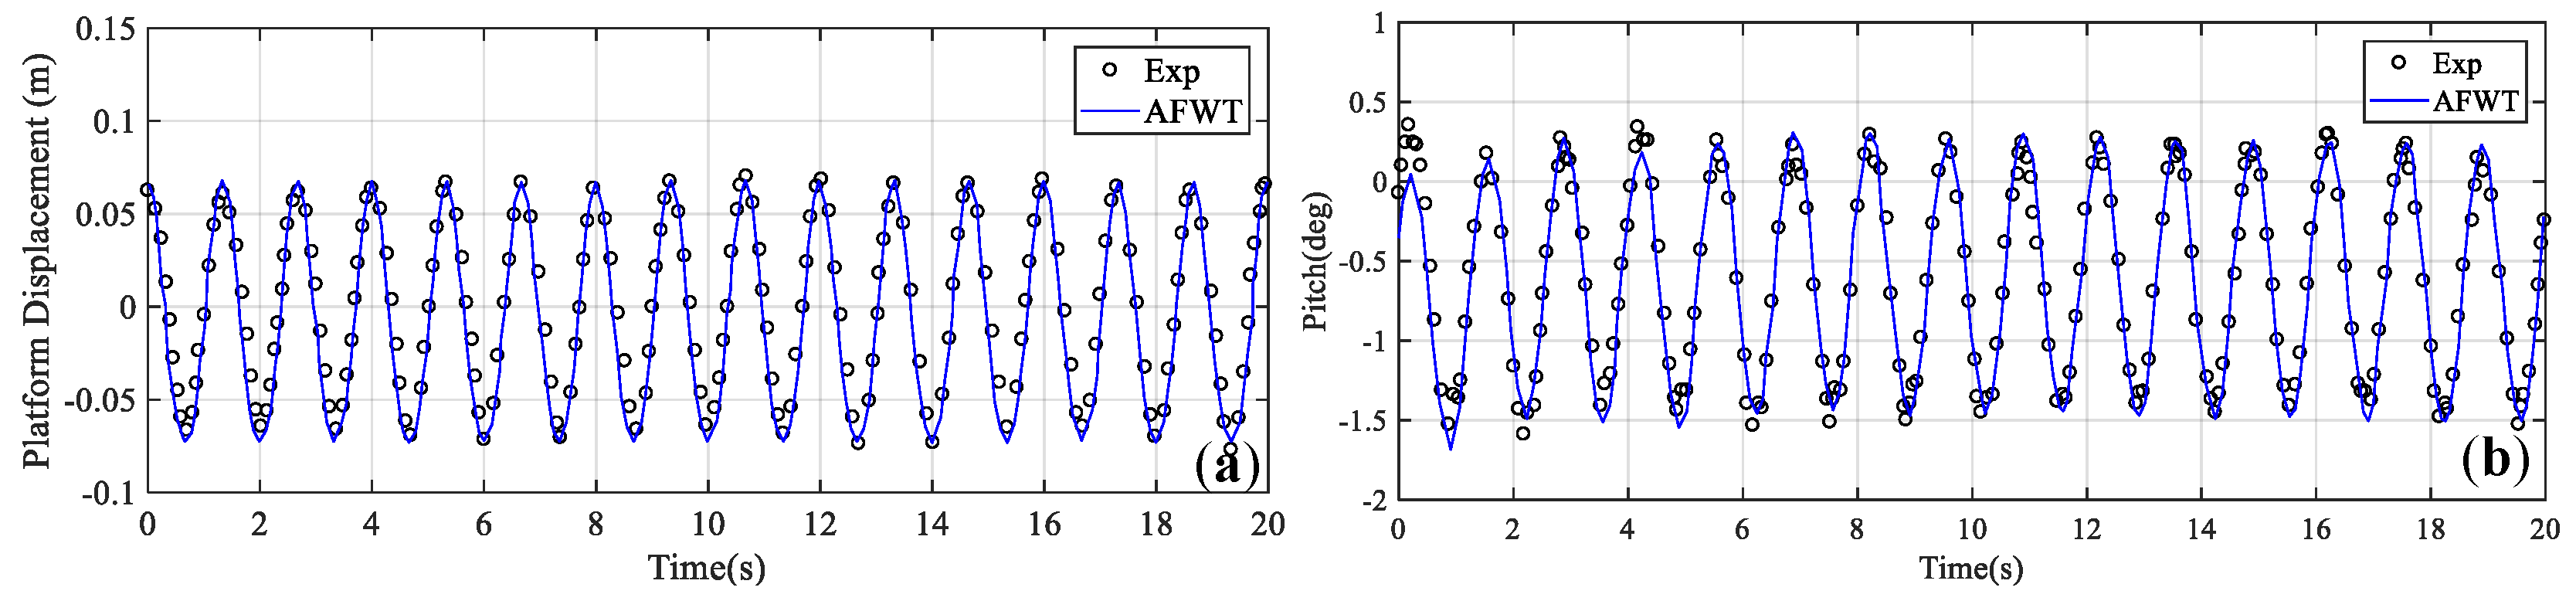
4.1. Validation of the Code

Before calculating the response of the platform, AFWT is first verified numerically. A free-decay test is carried out on the floating platform without wind or waves. Although there is no wind and the water is still, the radiated waves produced by the initial motion of the platform will still generate hydrodynamic loads on the platform and the mooring system. The details of the settings of the verification case can be found in the study of Liu et al. [62]. The motions in surge, heave and pitch directions in the time domain obtained by FAST and those by AFWT are shown in Figure 6, where satisfactory agreement is achieved. The platform’s surge natural period is 109.4 s, the heave natural period is 17.4 s, and the pitch natural period is 26.0 s as determined by Fast Fourier Transformation (FFT).
Further verification of the code is compared with the available OC4 FOWT experimental data [63], as shown in Figure 7. The experimental scale model is carried out under the regular wave conditions with a wave height of 0.14 m and a wave period of 1.33 s. The code calculation results are in good agreement with the experimental data.

4.2. Multi-Segmented Mooring Line Models

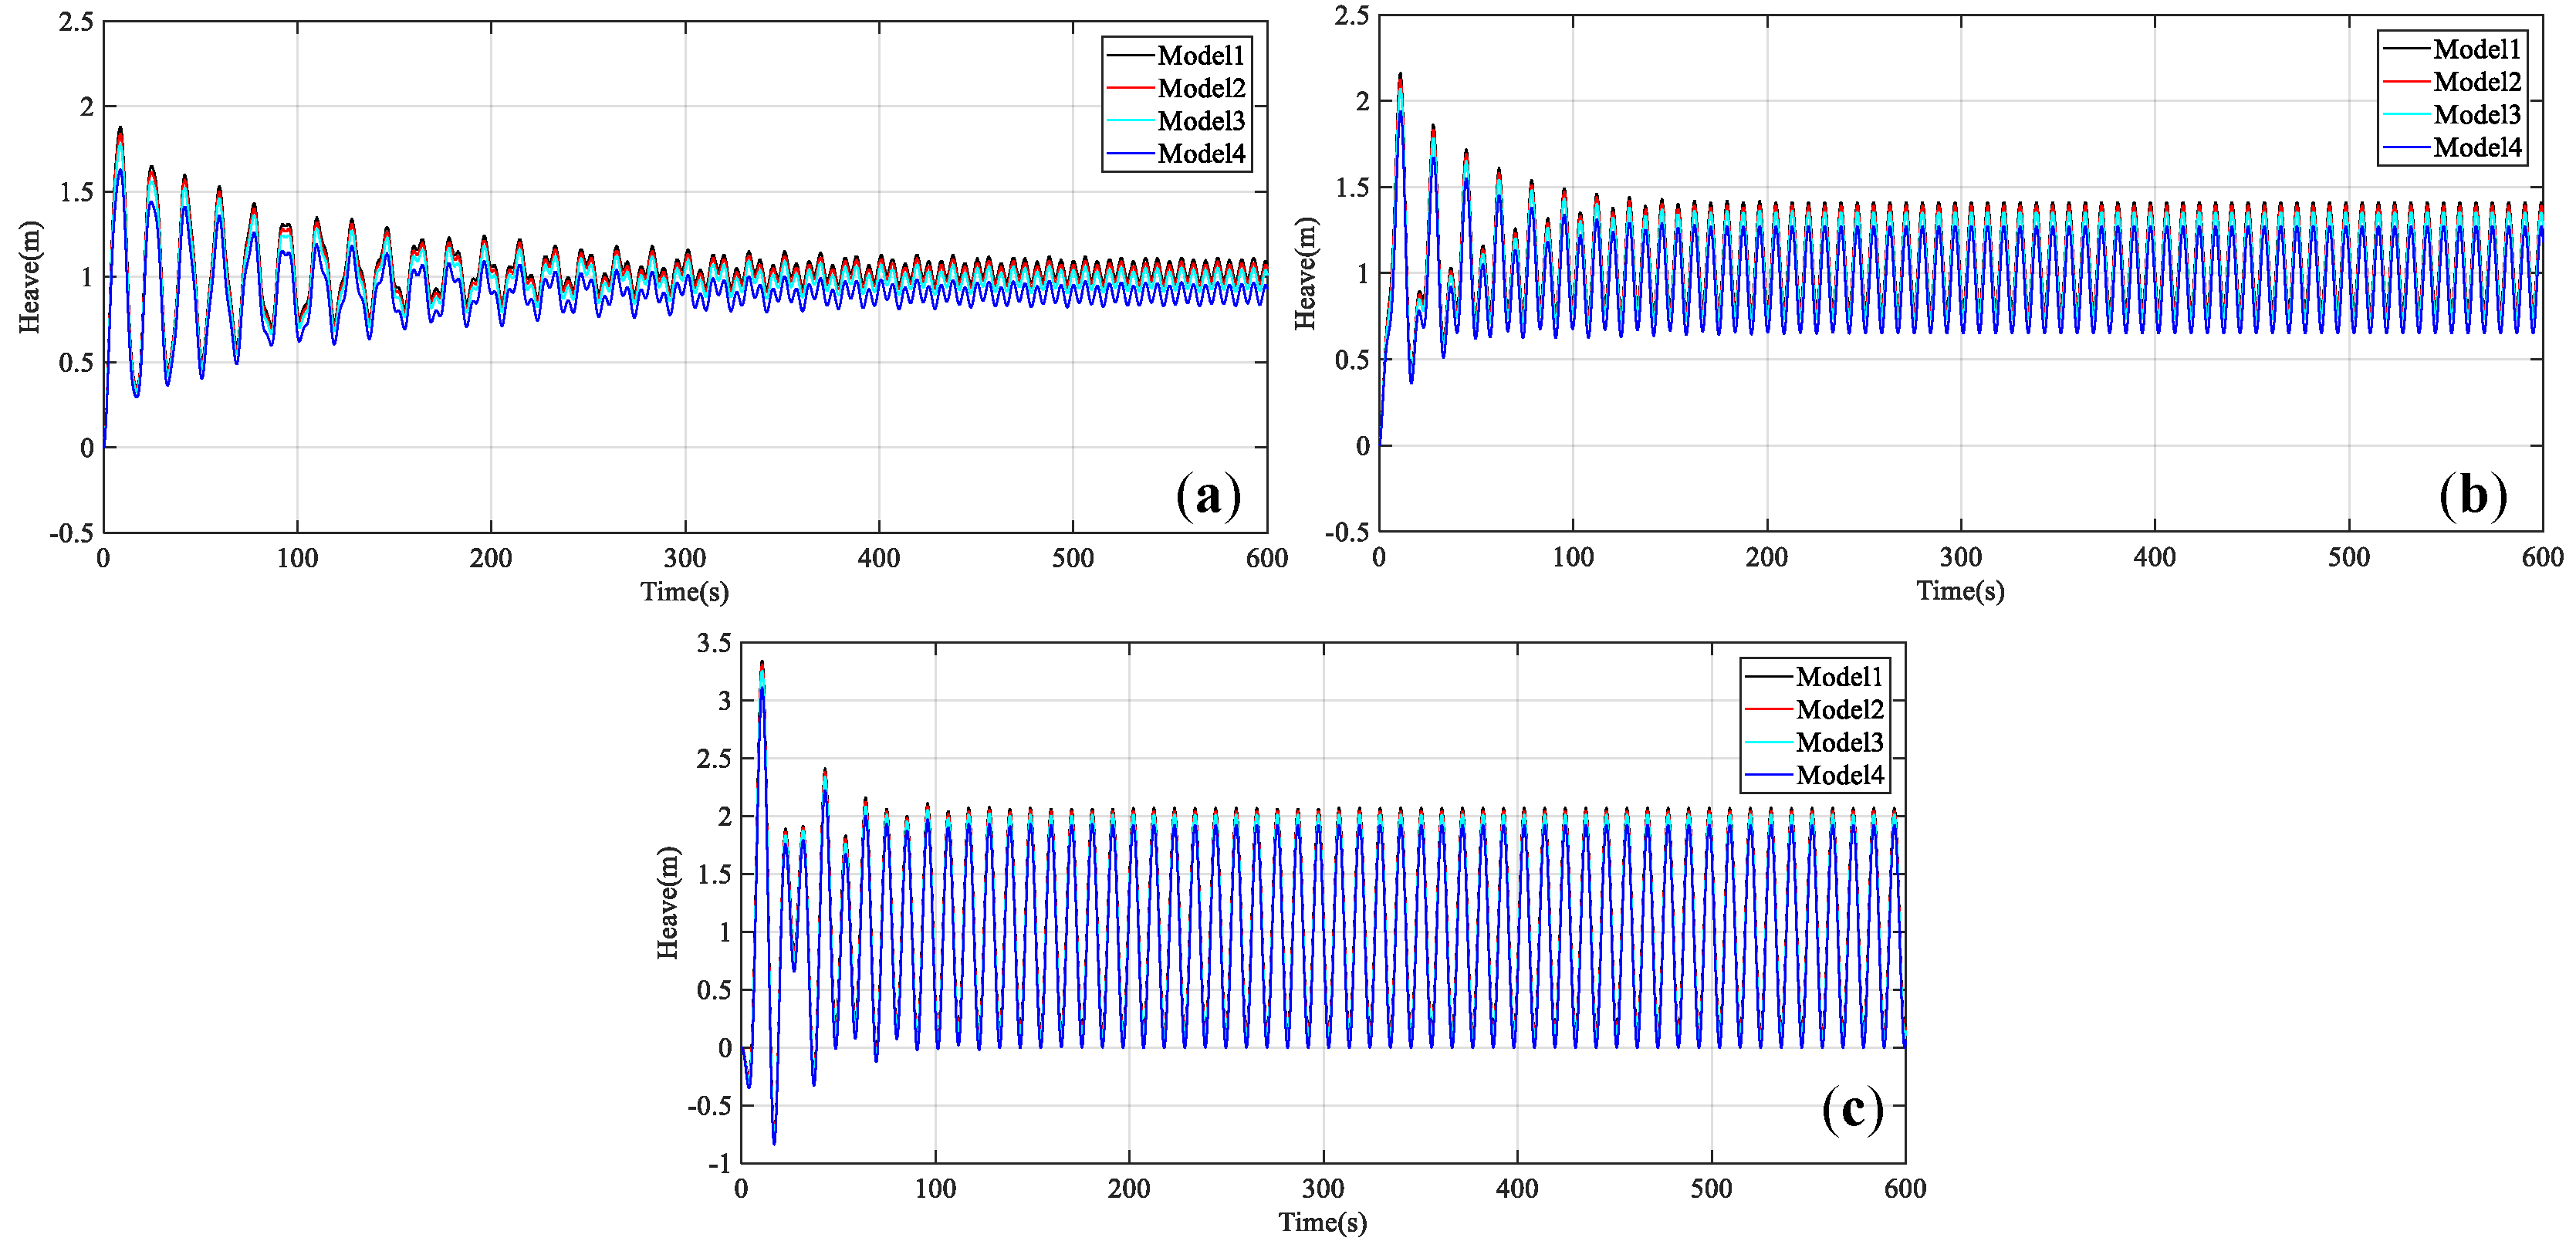
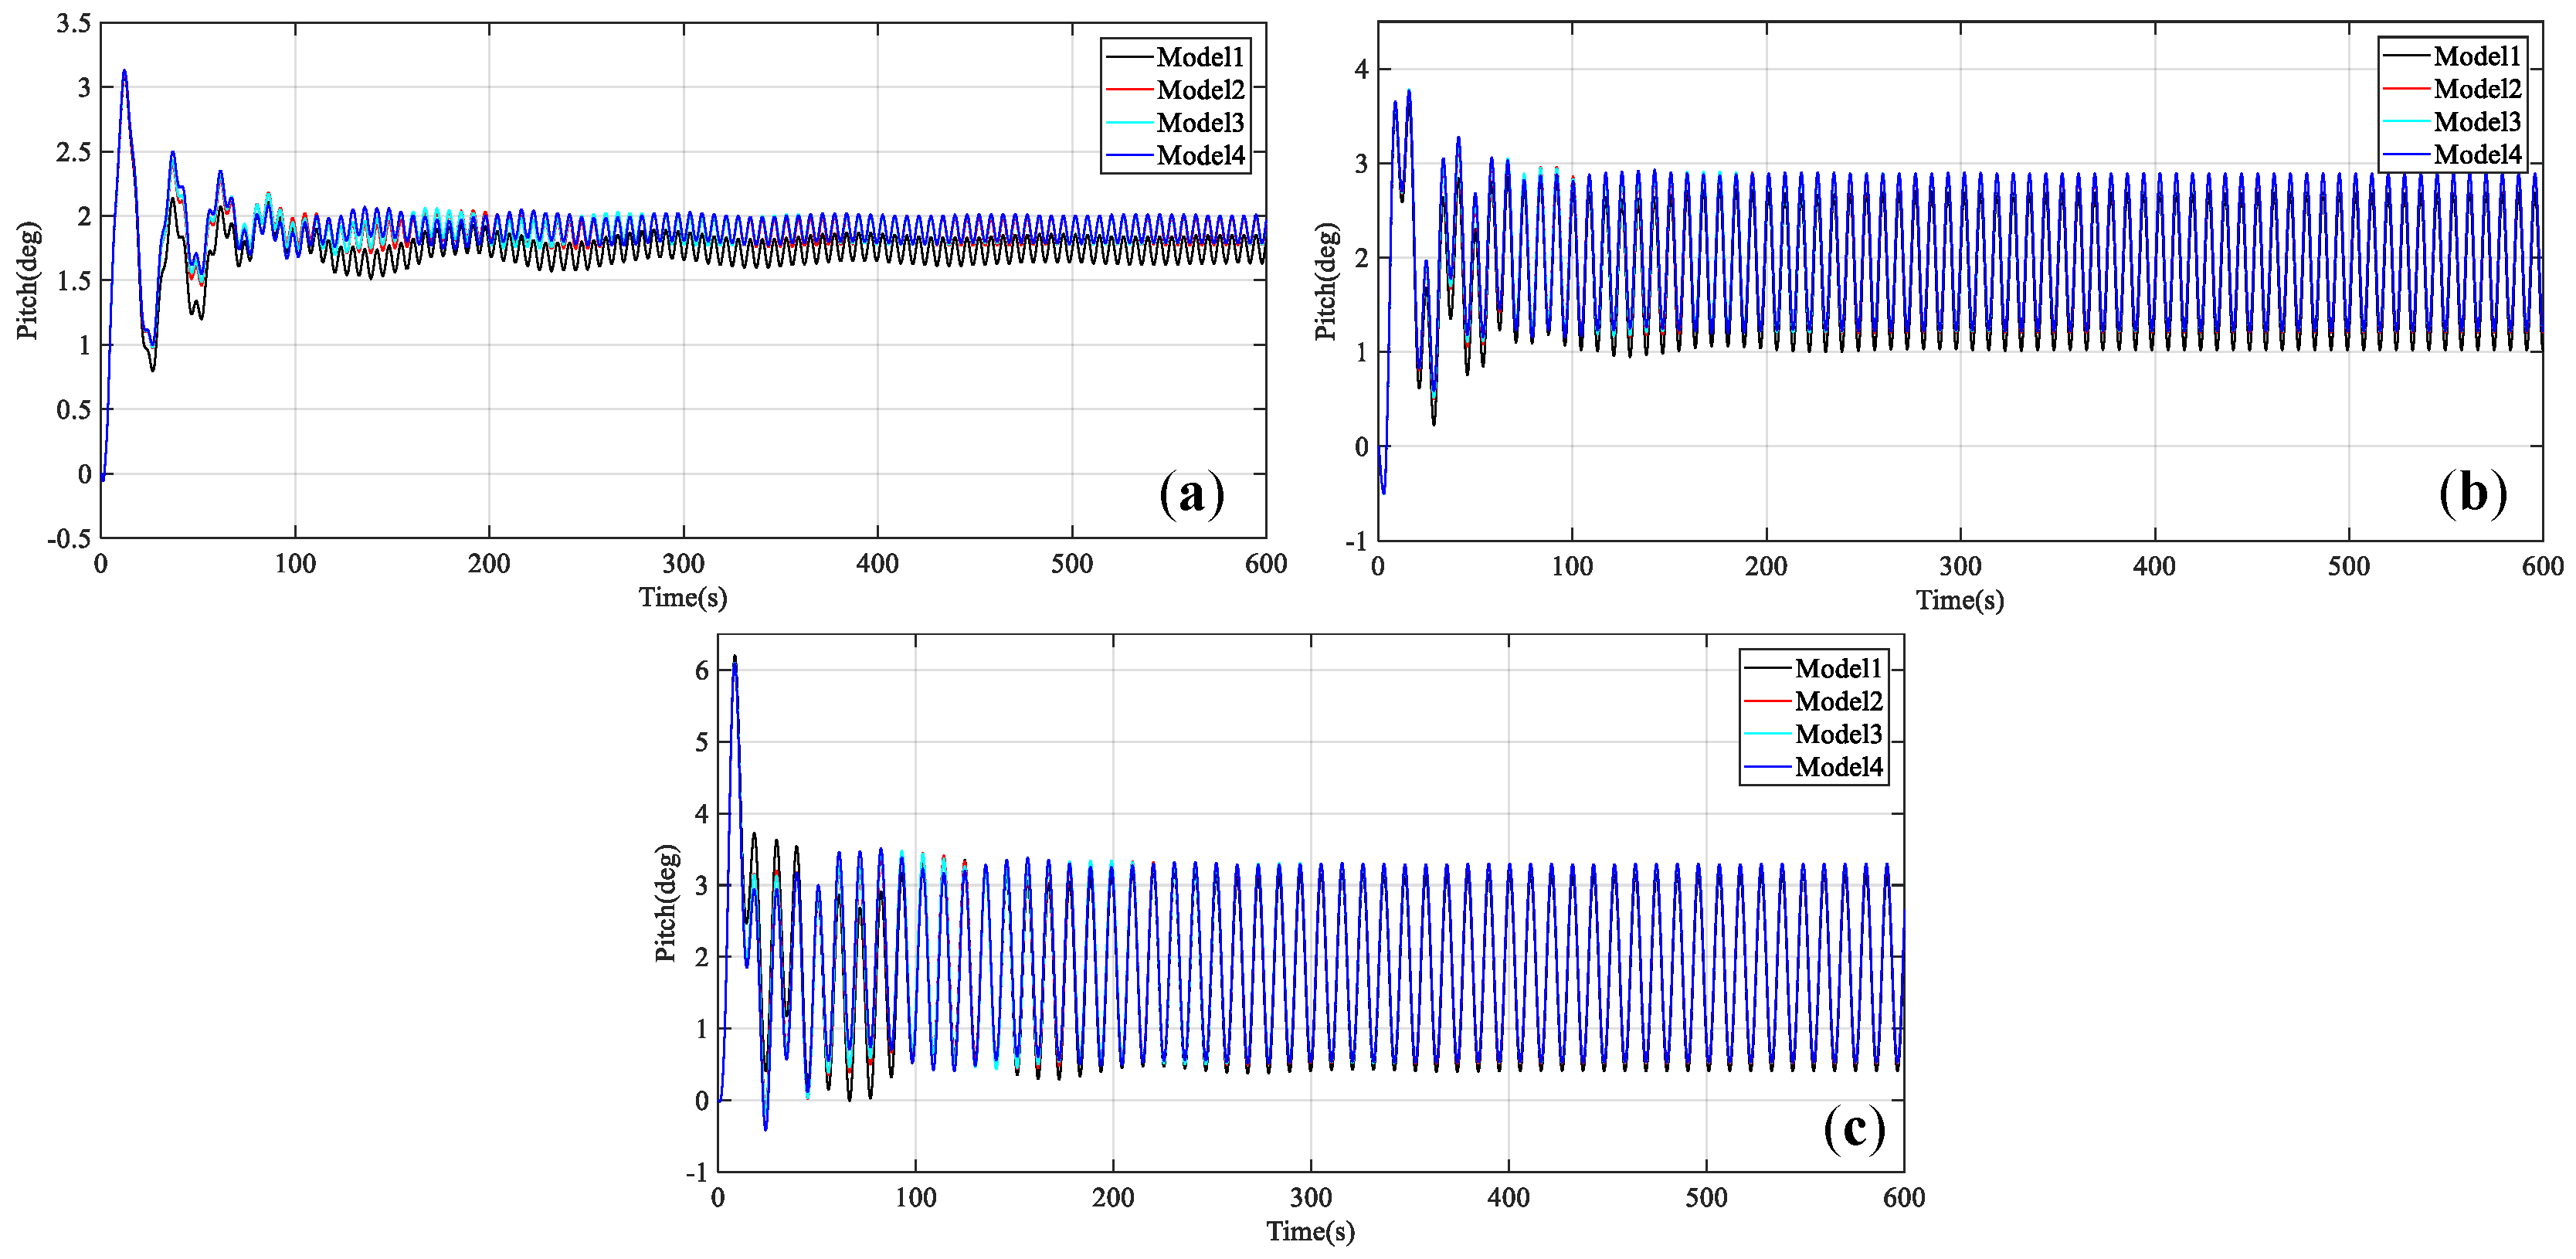
4.2.1. Regular Waves

Figure 8, Figure 9 and Figure 10 illustrate the signals of platform motions of the multi-segmented mooring line models (Model 2~4) under regular waves in time domain. As found in Figure 8, the surge motion of the models reaches the stable stage at about 400 s for all of the load conditions. In LC1, the peak value of the surge motion of the Model 1 is estimated to be 9.2 m before the stable stage and about 5.3 m after the stable stage. While, the peak value of the surge motion of the Model 4 is about 6 m before the stable stage and about 3 m after the stable stage. Not only for LC1, but also for LC2 and LC3, the reduction of the surge motion is obvious from Model 1 to Model 4. This demonstrates that the shorter the upper segment lines are, the greater there will be a reduction to the surge of the platform in the regular waves. Similar with the surge motion, the heave motion of the platform is also reduced from Model 1 to Model 4, as shown in Figure 9. However, the magnitude of the reduction is small, indicating that changing the length of the upper segment lines has little effects on the platform heave motion. For the pitch motions illustrated in Figure 10, there is no obvious changes from Model 1 to Model 4.
Due to the computational start-up fluctuation, the representative statistics are calculated based on the 400–600 s signals and the results are listed in Table 9. Most obviously, the mean surge offset decreases from 6.12 m (Model 1) to 3.86 m (Model 4) in LC2, while the mean heave motions just decrease from 1.10 m (Model 1) to 0.96 m (Model 4), and the mean pitch of platform even increases from 1.85° (Model 1) to 2.05° (Model 4). Similarly, the maximum surge motion is also reduced enormously from Model 1 to Model 4, while the maximum heave and pitch motions are found to show a very small change. The stationary motion amplitudes of Models 1–4 are listed in Table 10. It can be seen that the surge amplitude gradually decreases from Model 1 to Model 4. However, the heave and pitch amplitudes are insensitive to the change of the length of the upper segment lines. Therefore, it can be concluded that the multi-segmented mooring line models are feasible to increase the stability of the platform under regular waves, especially for the surge motion. The increase of the stiffness in surge direction of the mooring system due to the reduction of the length of the upper segment lines should be the major reason. In addition, the introduction of multi-segmented lines also has a significant effect on the yaw stiffness of the structure, which can partially explain the reduction of surge motions due to the reduction of surge-yaw coupling.

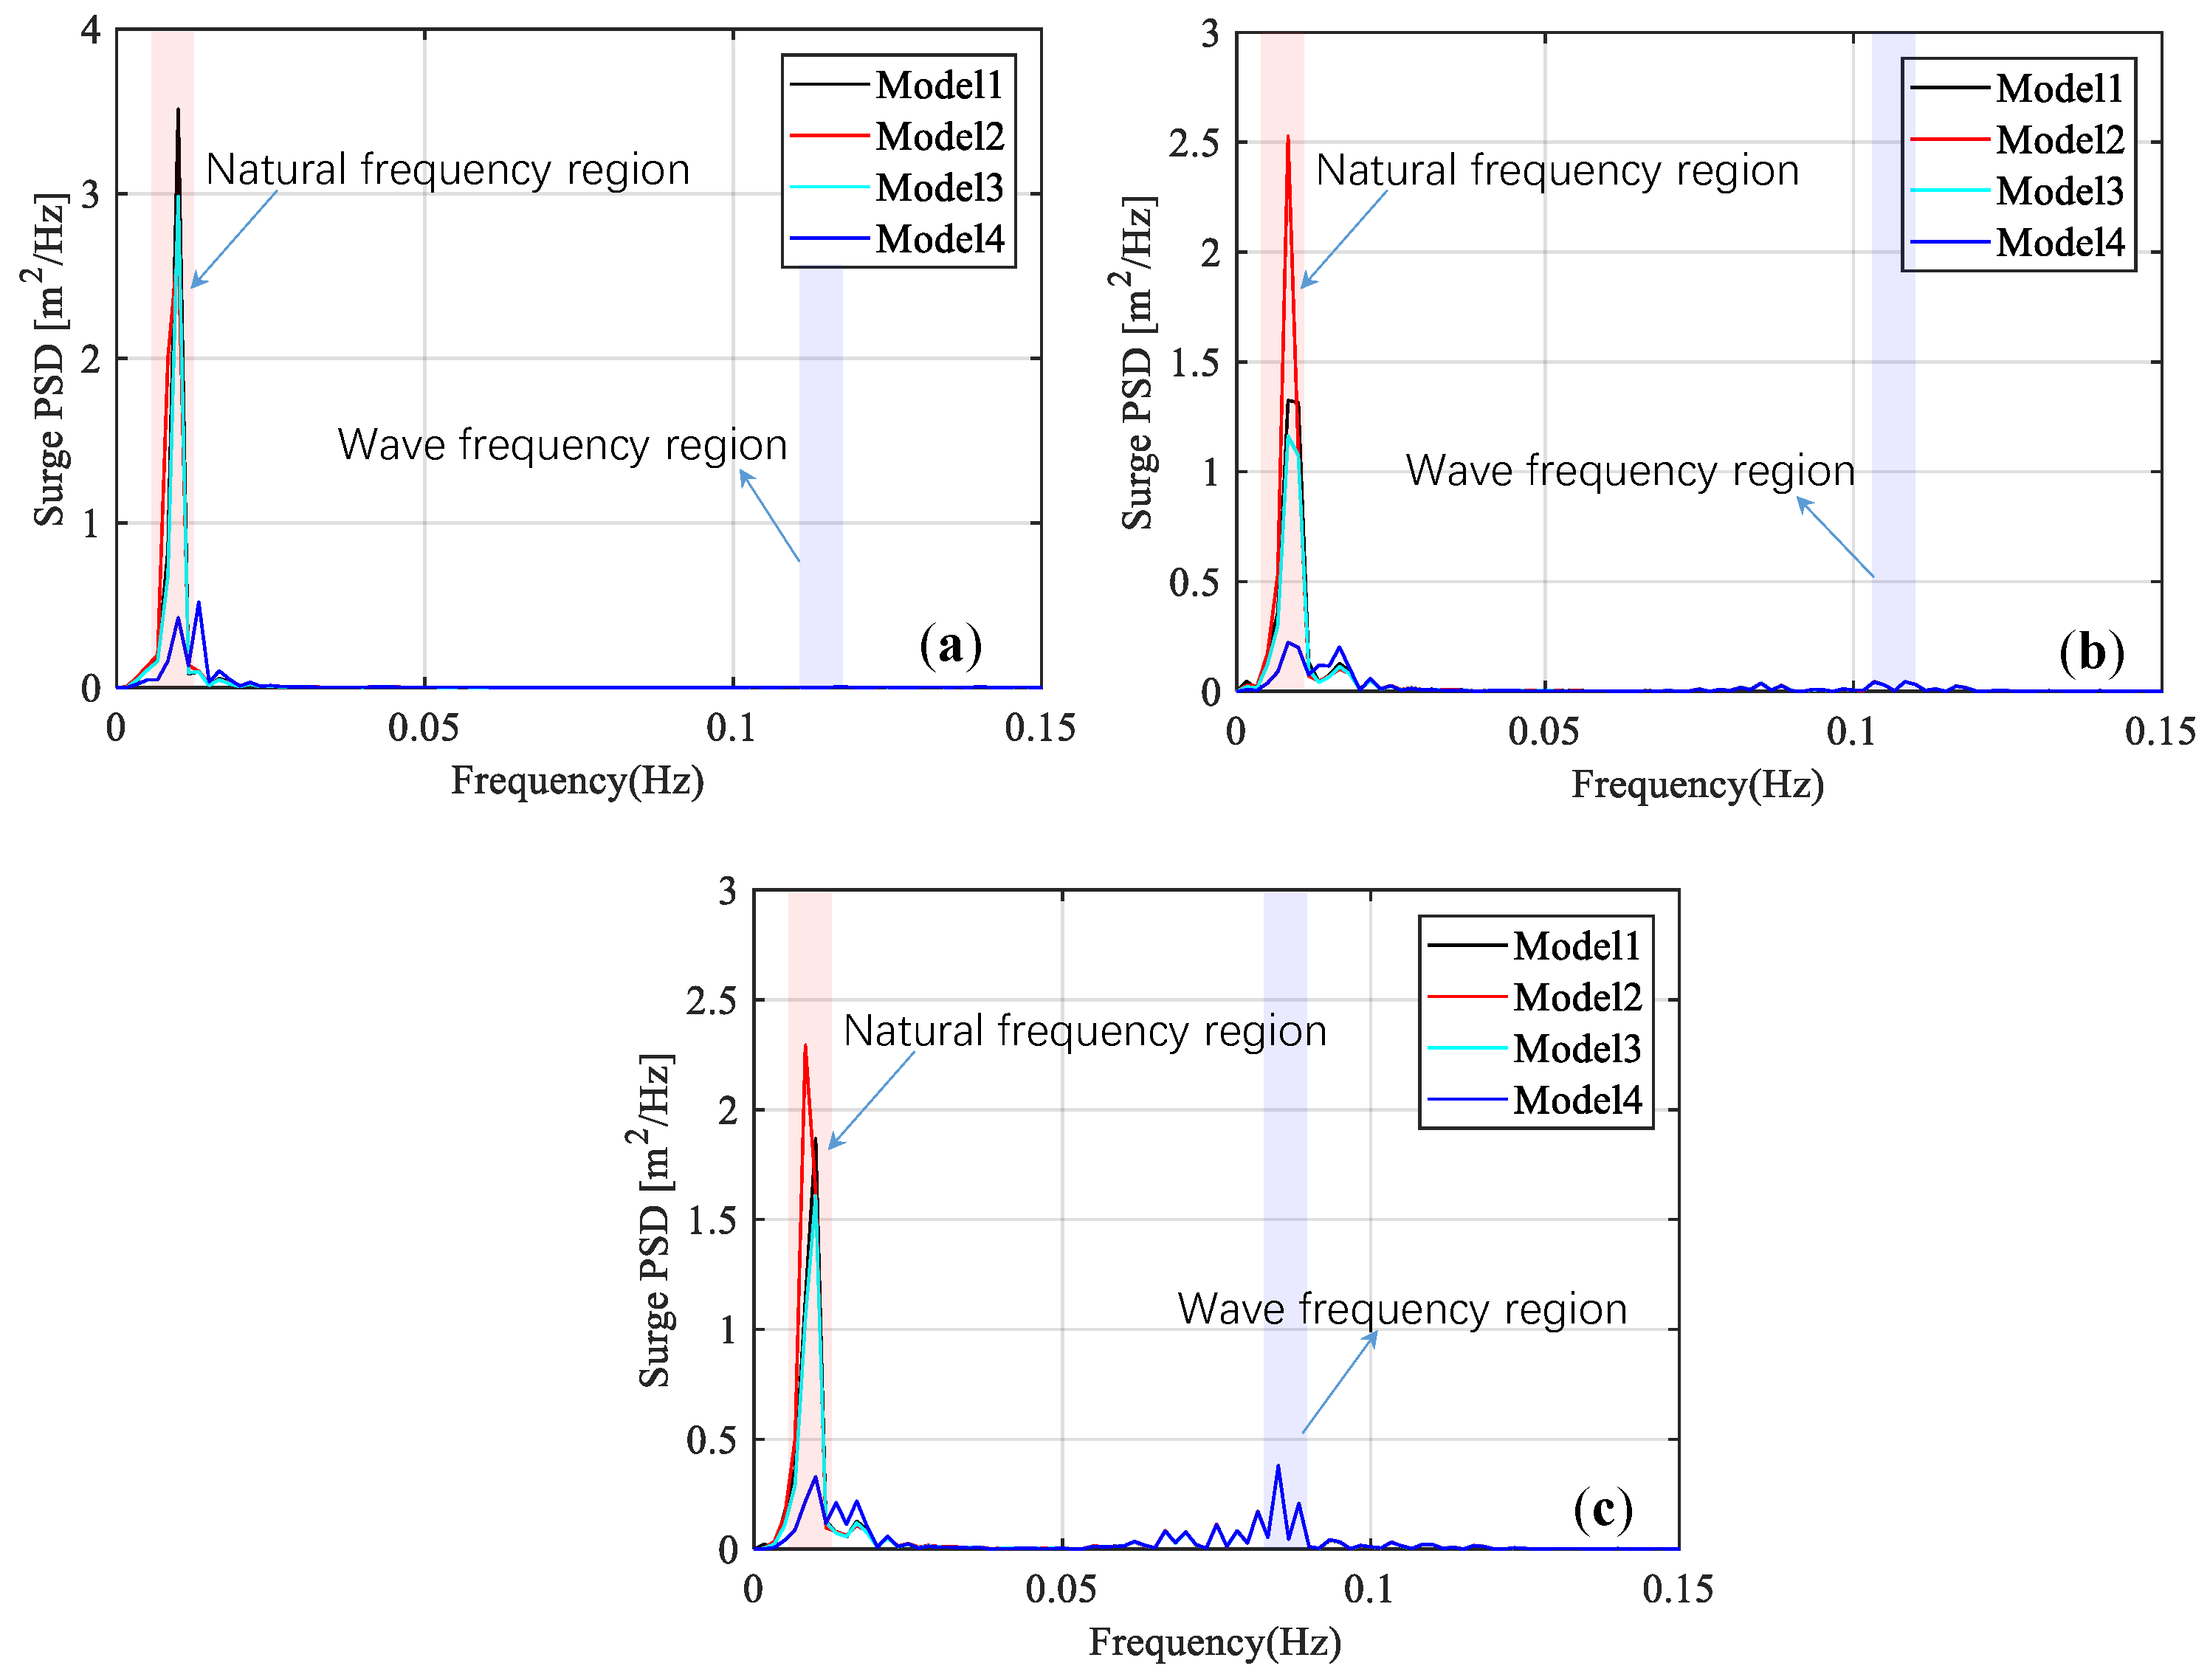
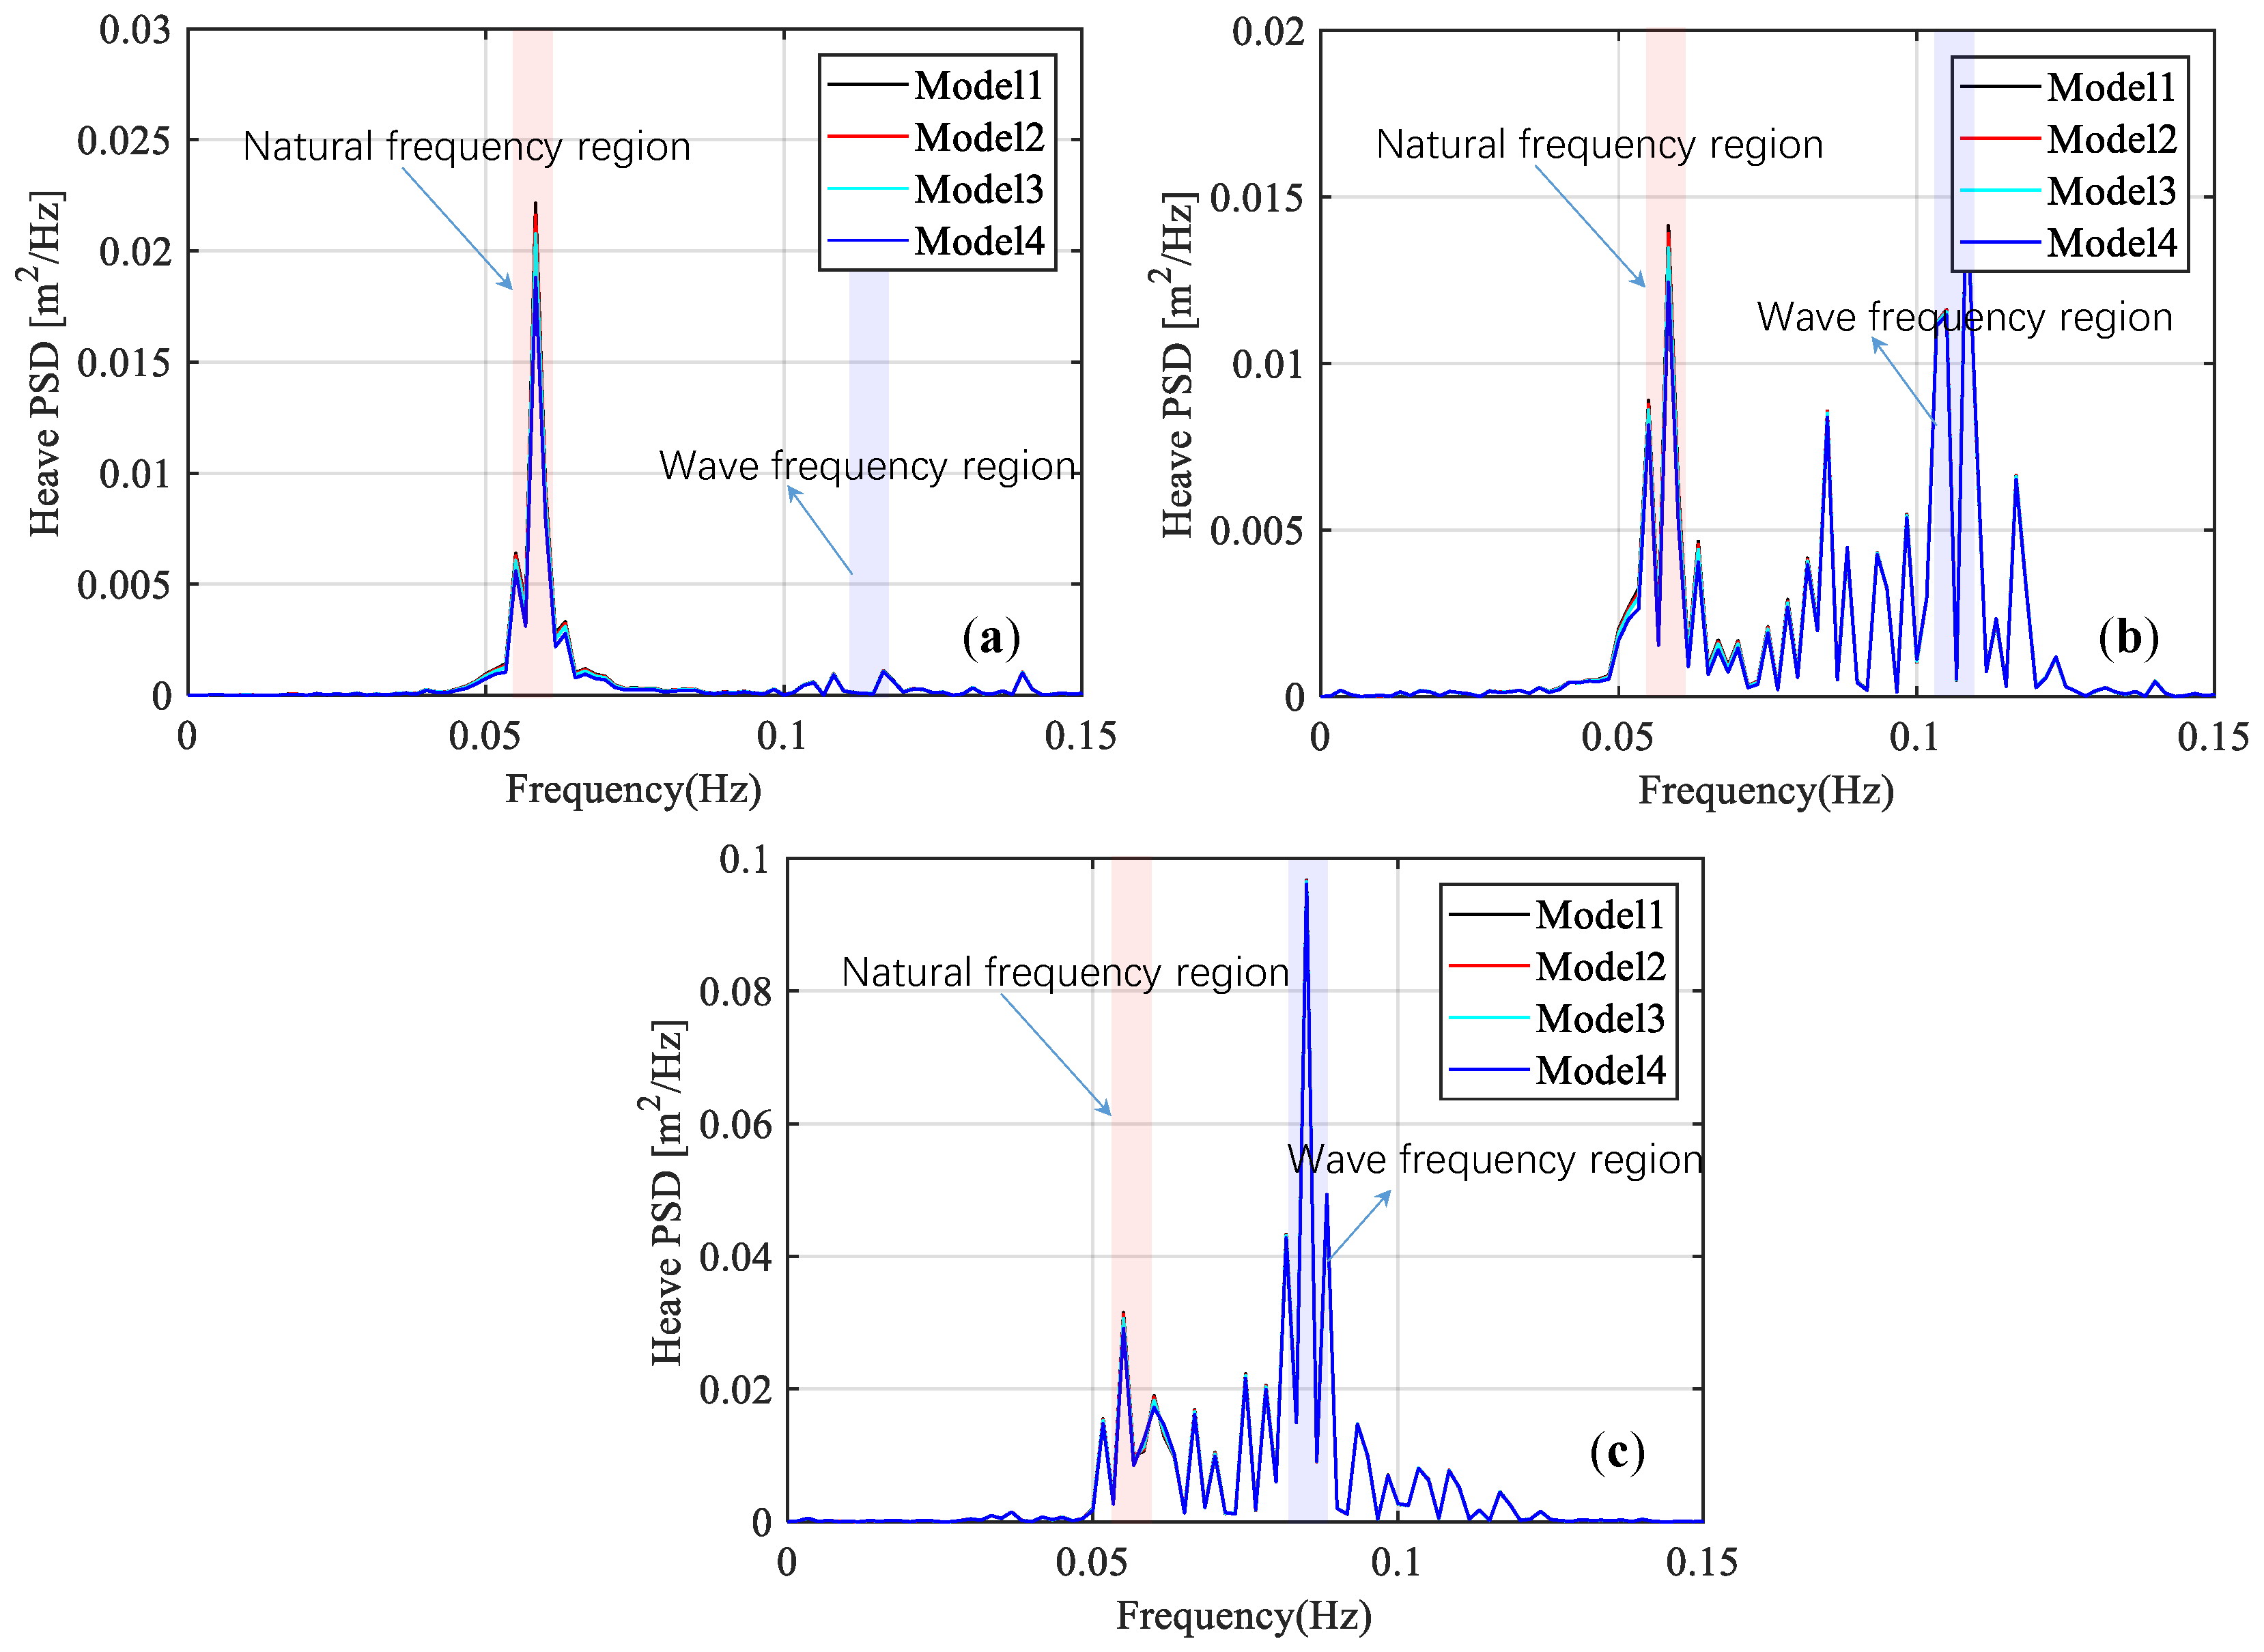
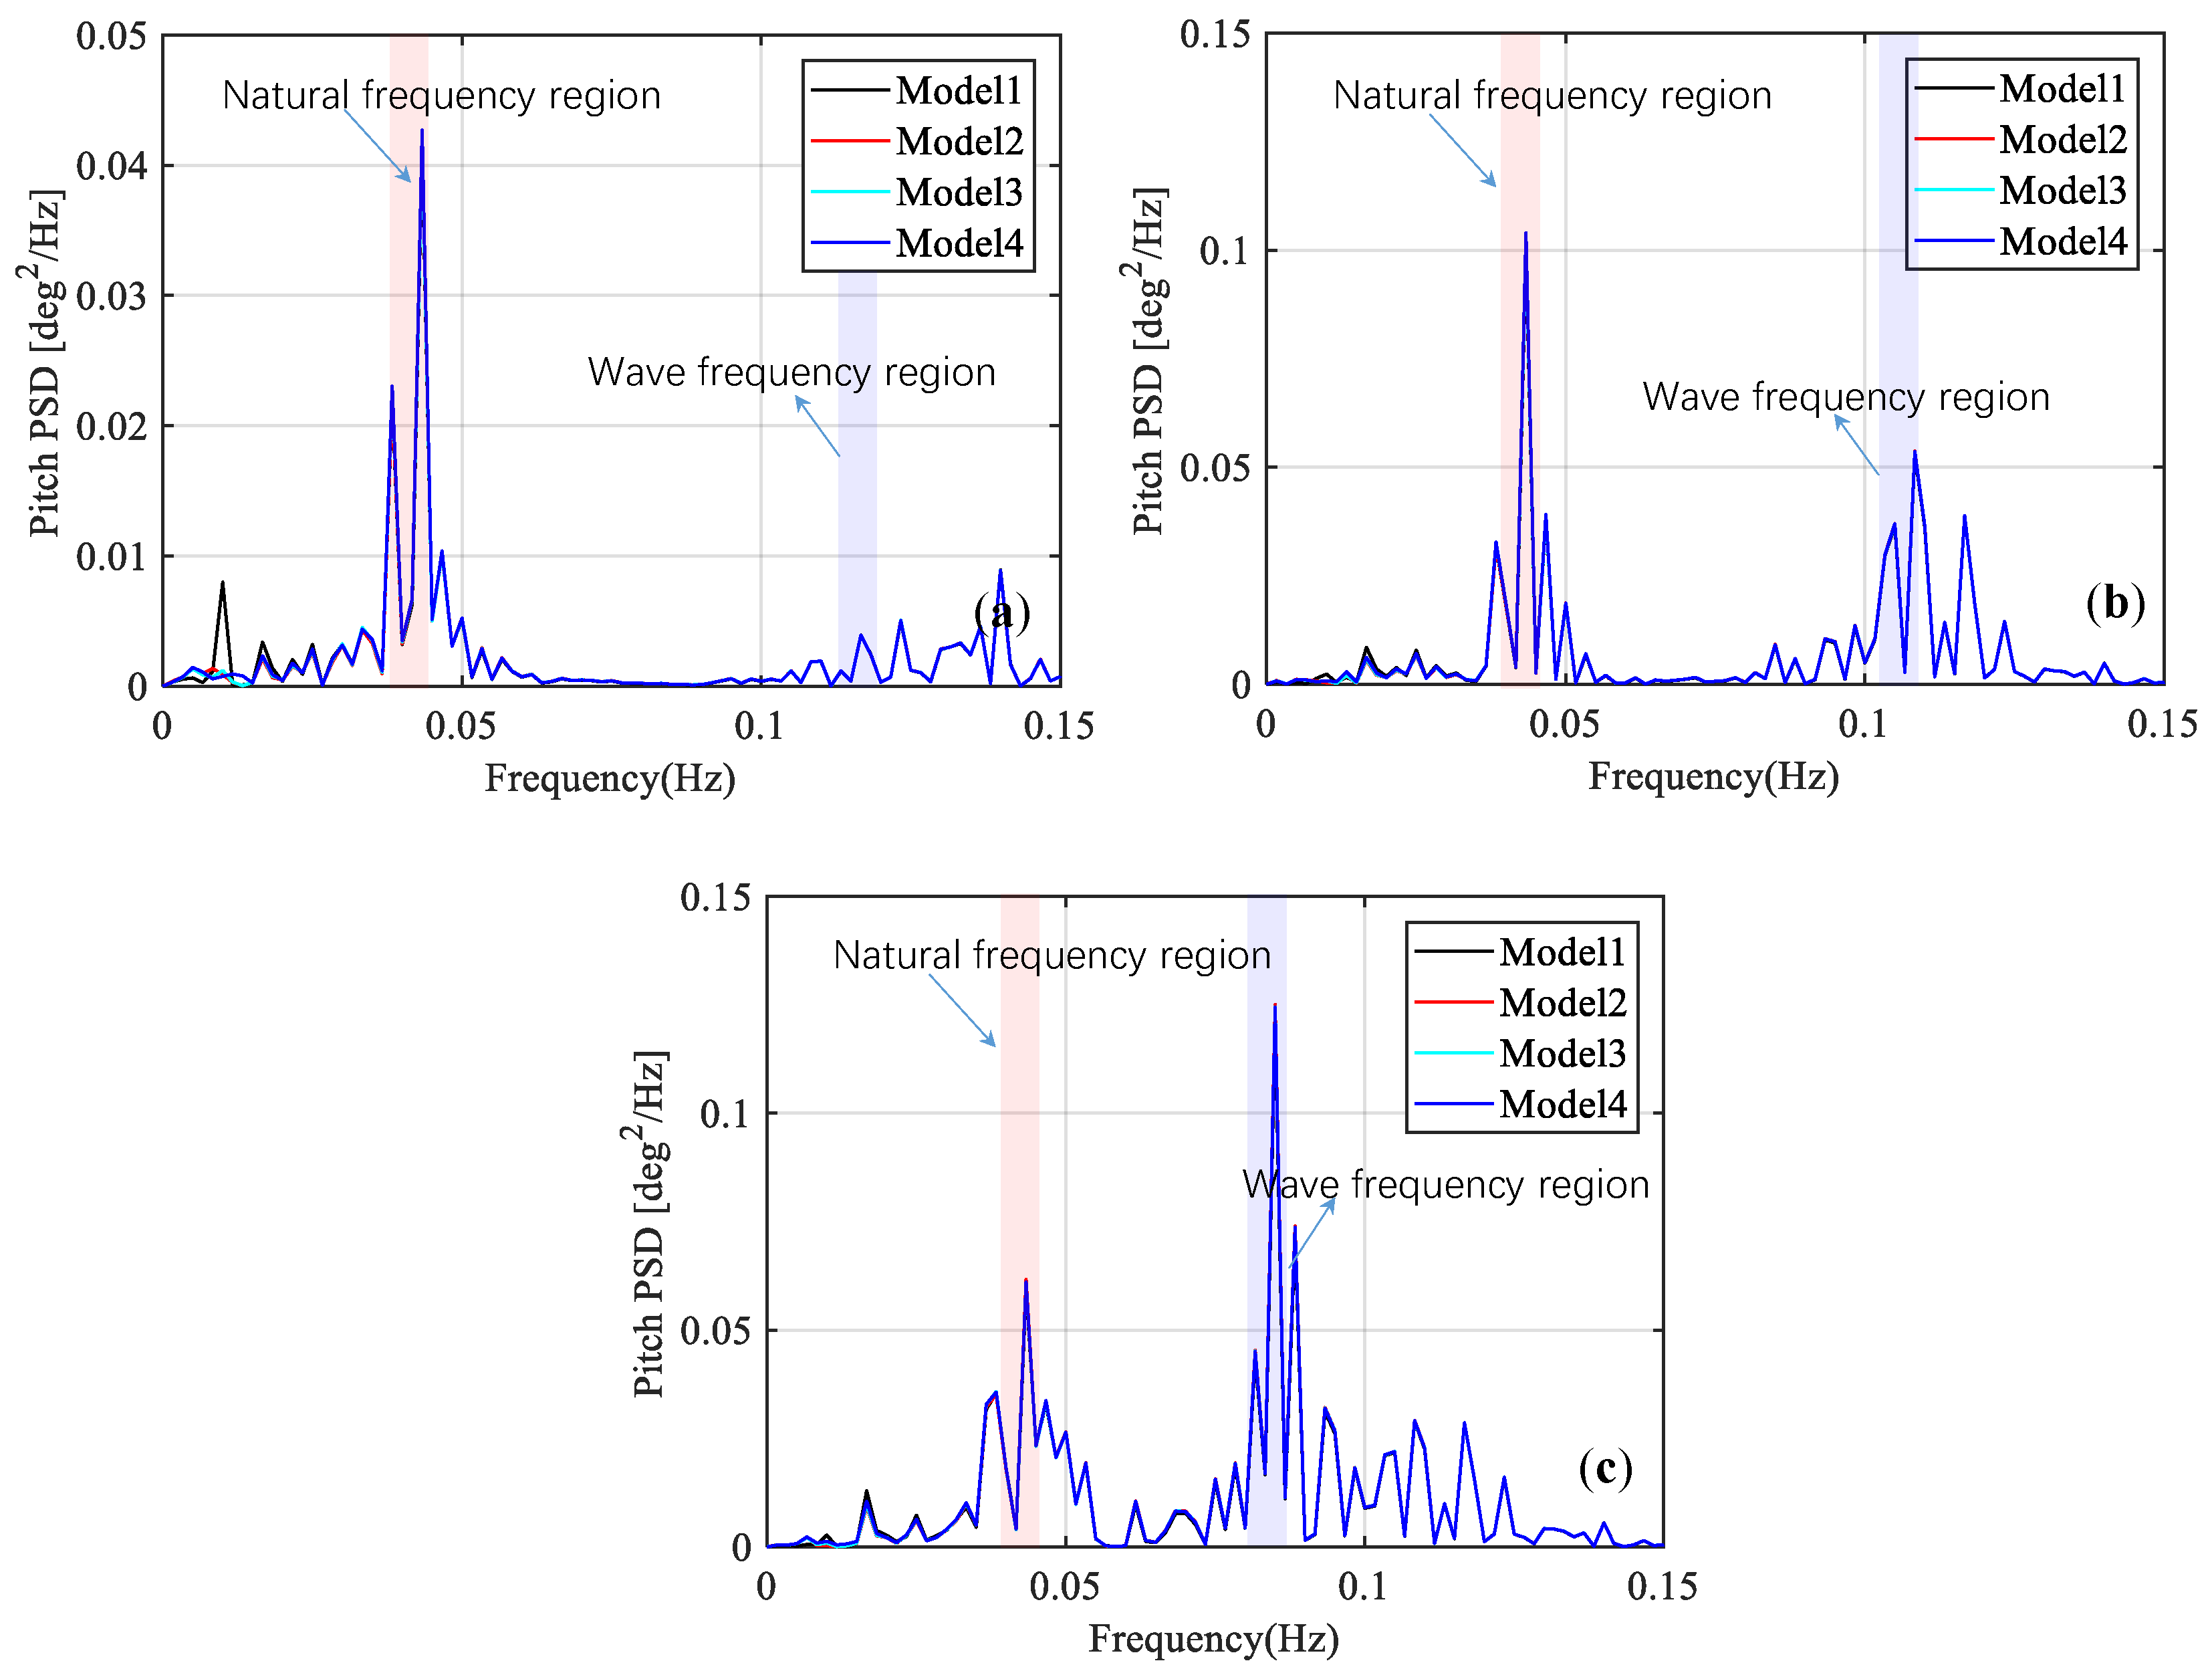
4.2.2. Irregular Wave

The motion response of the multi-segmented mooring line models is further studied under irregular wave conditions. Since the time domain curves of the motion responses under irregular waves are random, it is difficult to present the result clearly using the time domain signals. As such, the results are discussed in the frequency-domain obtained by transforming the time-domain signal to the frequency-domain signal through FFT [64]. The total time of the simulations is 1400 s and the time step is 0.1 s. The motion data in the first 400 s is deleted to remove the transient response, then the mean value of the motions in the remaining 1000 s was obtained. Lastly, removing the mean value and FFT was carried out to obtain the spectra of motions in the frequency domain.
As shown in Figure 11, the first peak of the platform surge motion appears at about 0.01 Hz, close to the natural frequency of the platform. And it can be seen in Figure 11 that the surge spectral peak frequency has a slight shift from Model 1 to Model 4, due to the increased surge stiffness. As the wave frequency decreases, two peaks in surge power spectral density (PSD) occur, with one corresponding to the structure frequency and the other corresponding to the wave frequency. In addition, it is interesting that with changing the wave frequency close to the natural frequency of the system, the additional motions with the frequency close to the wave frequency will be enhanced. Also, in the frequency range 0~0.03 Hz, the surge PSD curves of Model 4 are found to be the lowest under LCs 4, 5, and 6, consistent with the result of regular wave in the previous section. However, similar to the findings in the regular wave examinations, there is no obvious effect on the heave and pitch motions with changes in the length of the upper segment lines. Furthermore, there is a trend that, as the wave frequency close to the natural frequency of the system changes, the additional motions with the frequency close to the wave frequency is also obviously found in both heave and pitch motions (Figure 12 and Figure 13).
Table 11 summarizes the first peaks of the surge, heave, and pitch PSD of the multi-segmented mooring line models in the frequency domain along with their corresponding frequencies. The peak frequencies of the platform response are basically the same from Model 1 to Model 4 and exhibit a small difference from LC4 to LC6. The most obvious reduction of the surge motion is found in LC4, where the peak value of the surge PSD is reduced from 3.516 m2/Hz (Model 1) to 0.520 m2/Hz (Model 4). For the other load conditions, the surge PSDs also show apparent reductions. However, the reduction of the peak heave and surge PSDs are very limited. The motion standard deviations of the multi-segmented mooring line models under irregular waves are listed in Table 12, where the standard deviation of the surge motion is found to be decreased as decreasing the length of the upper segment lines and the effects seem to be more obvious as increasing the wave frequency.

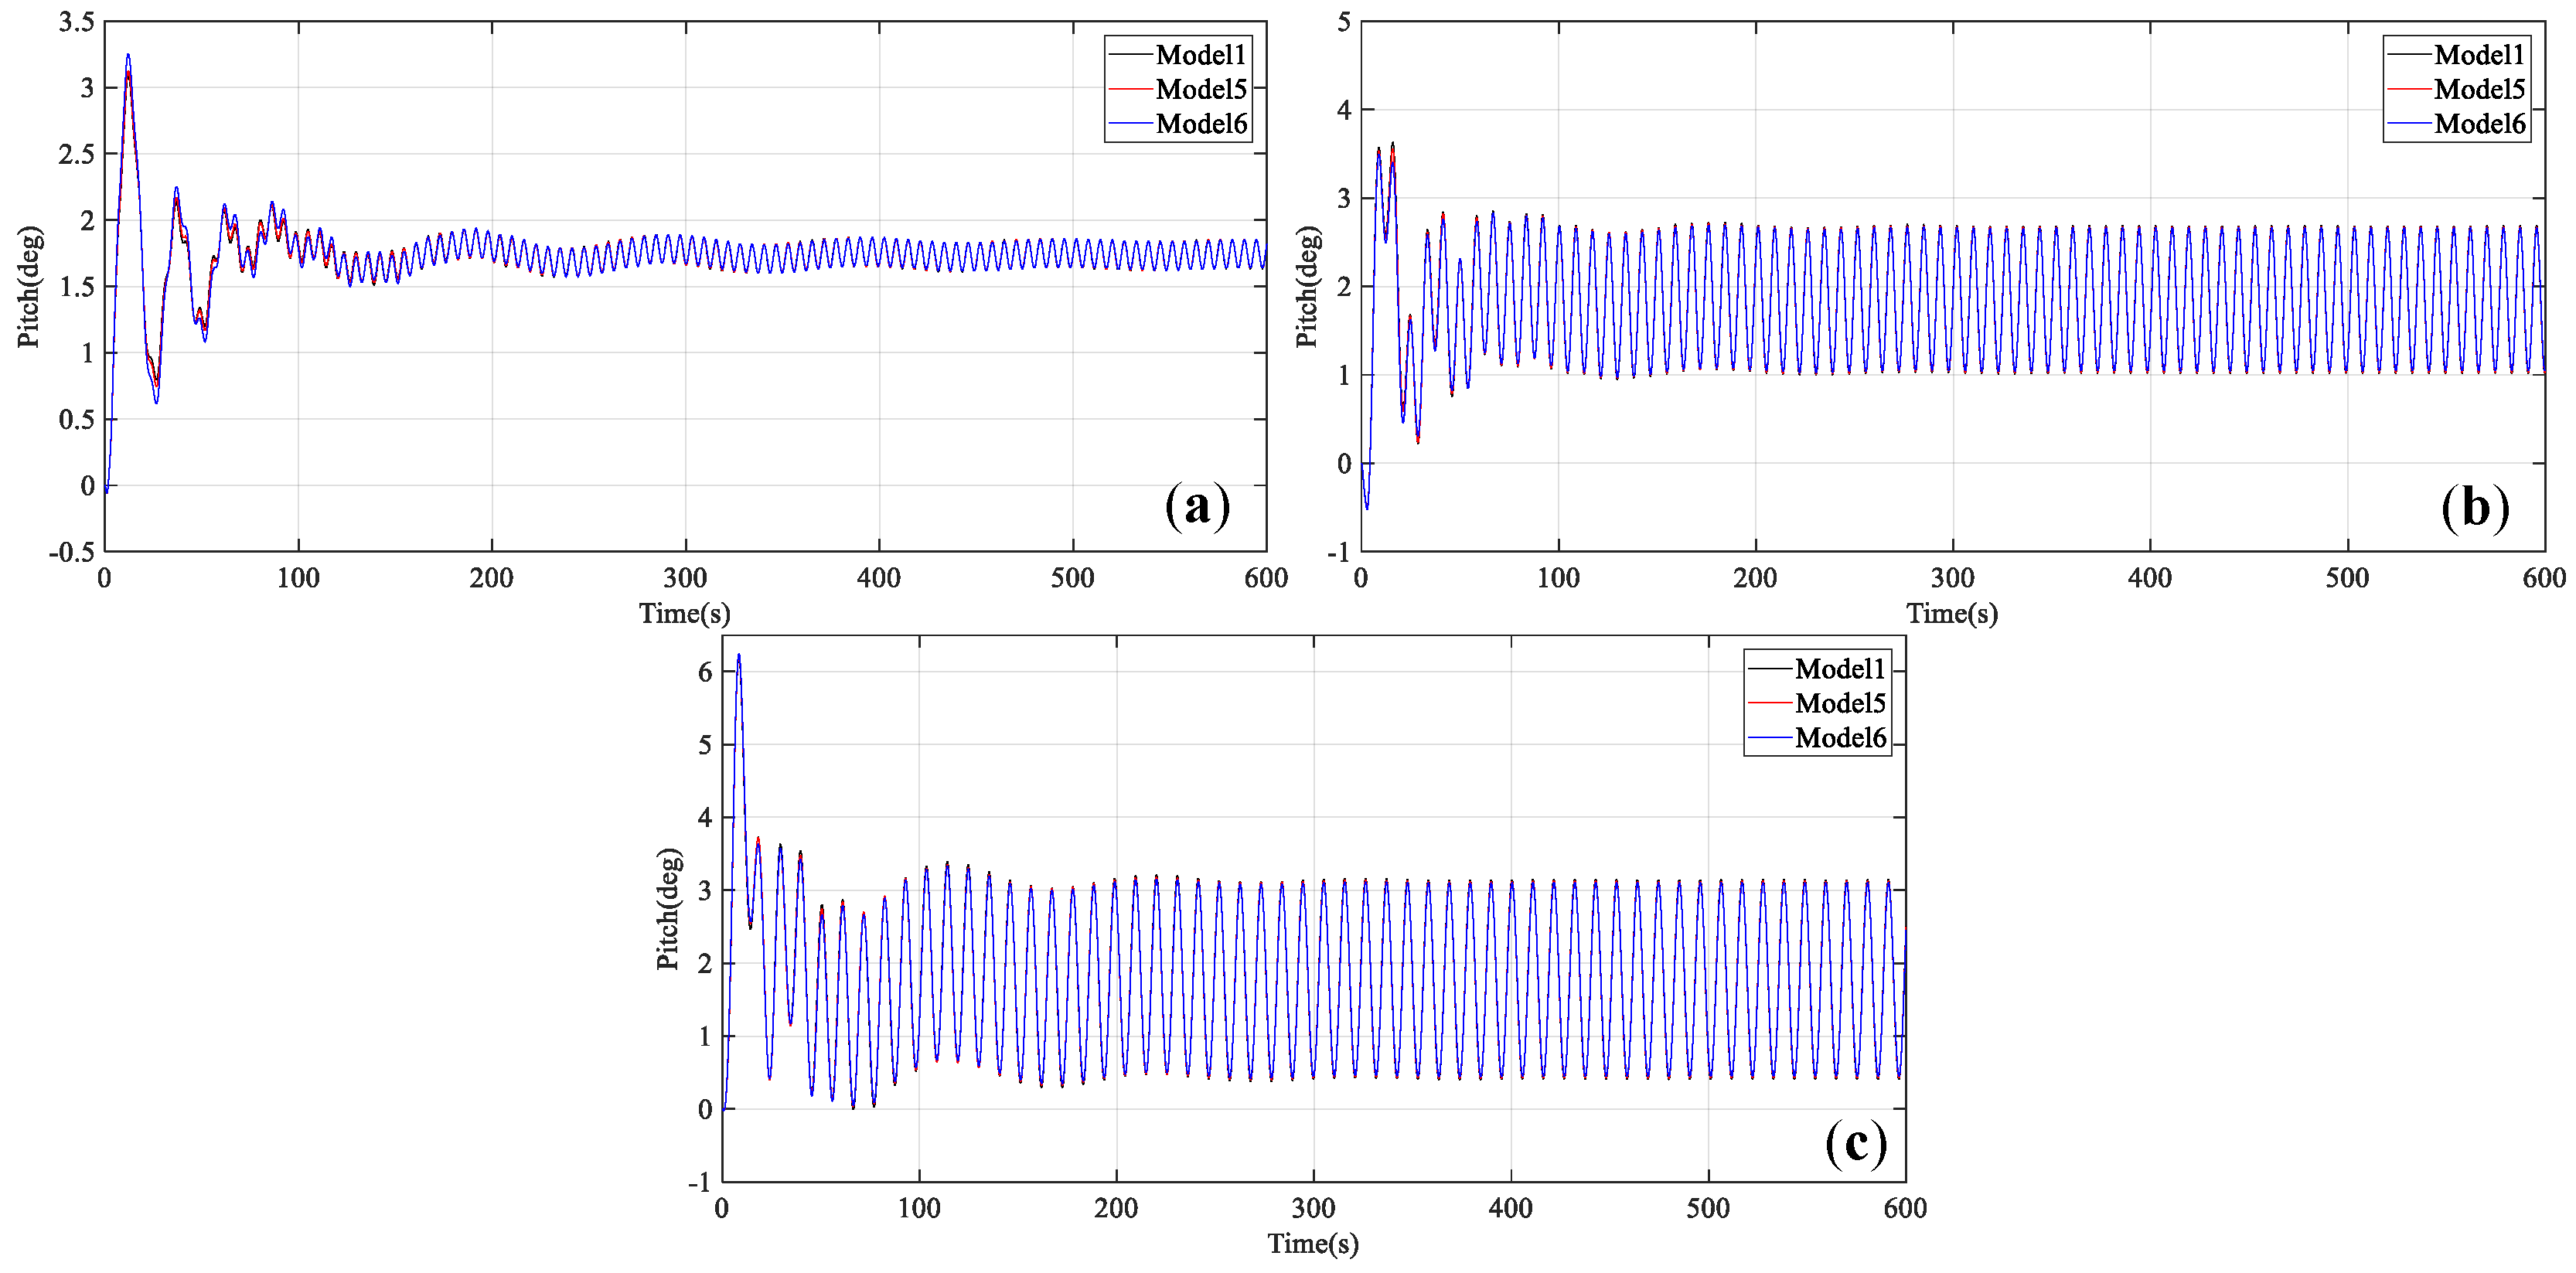
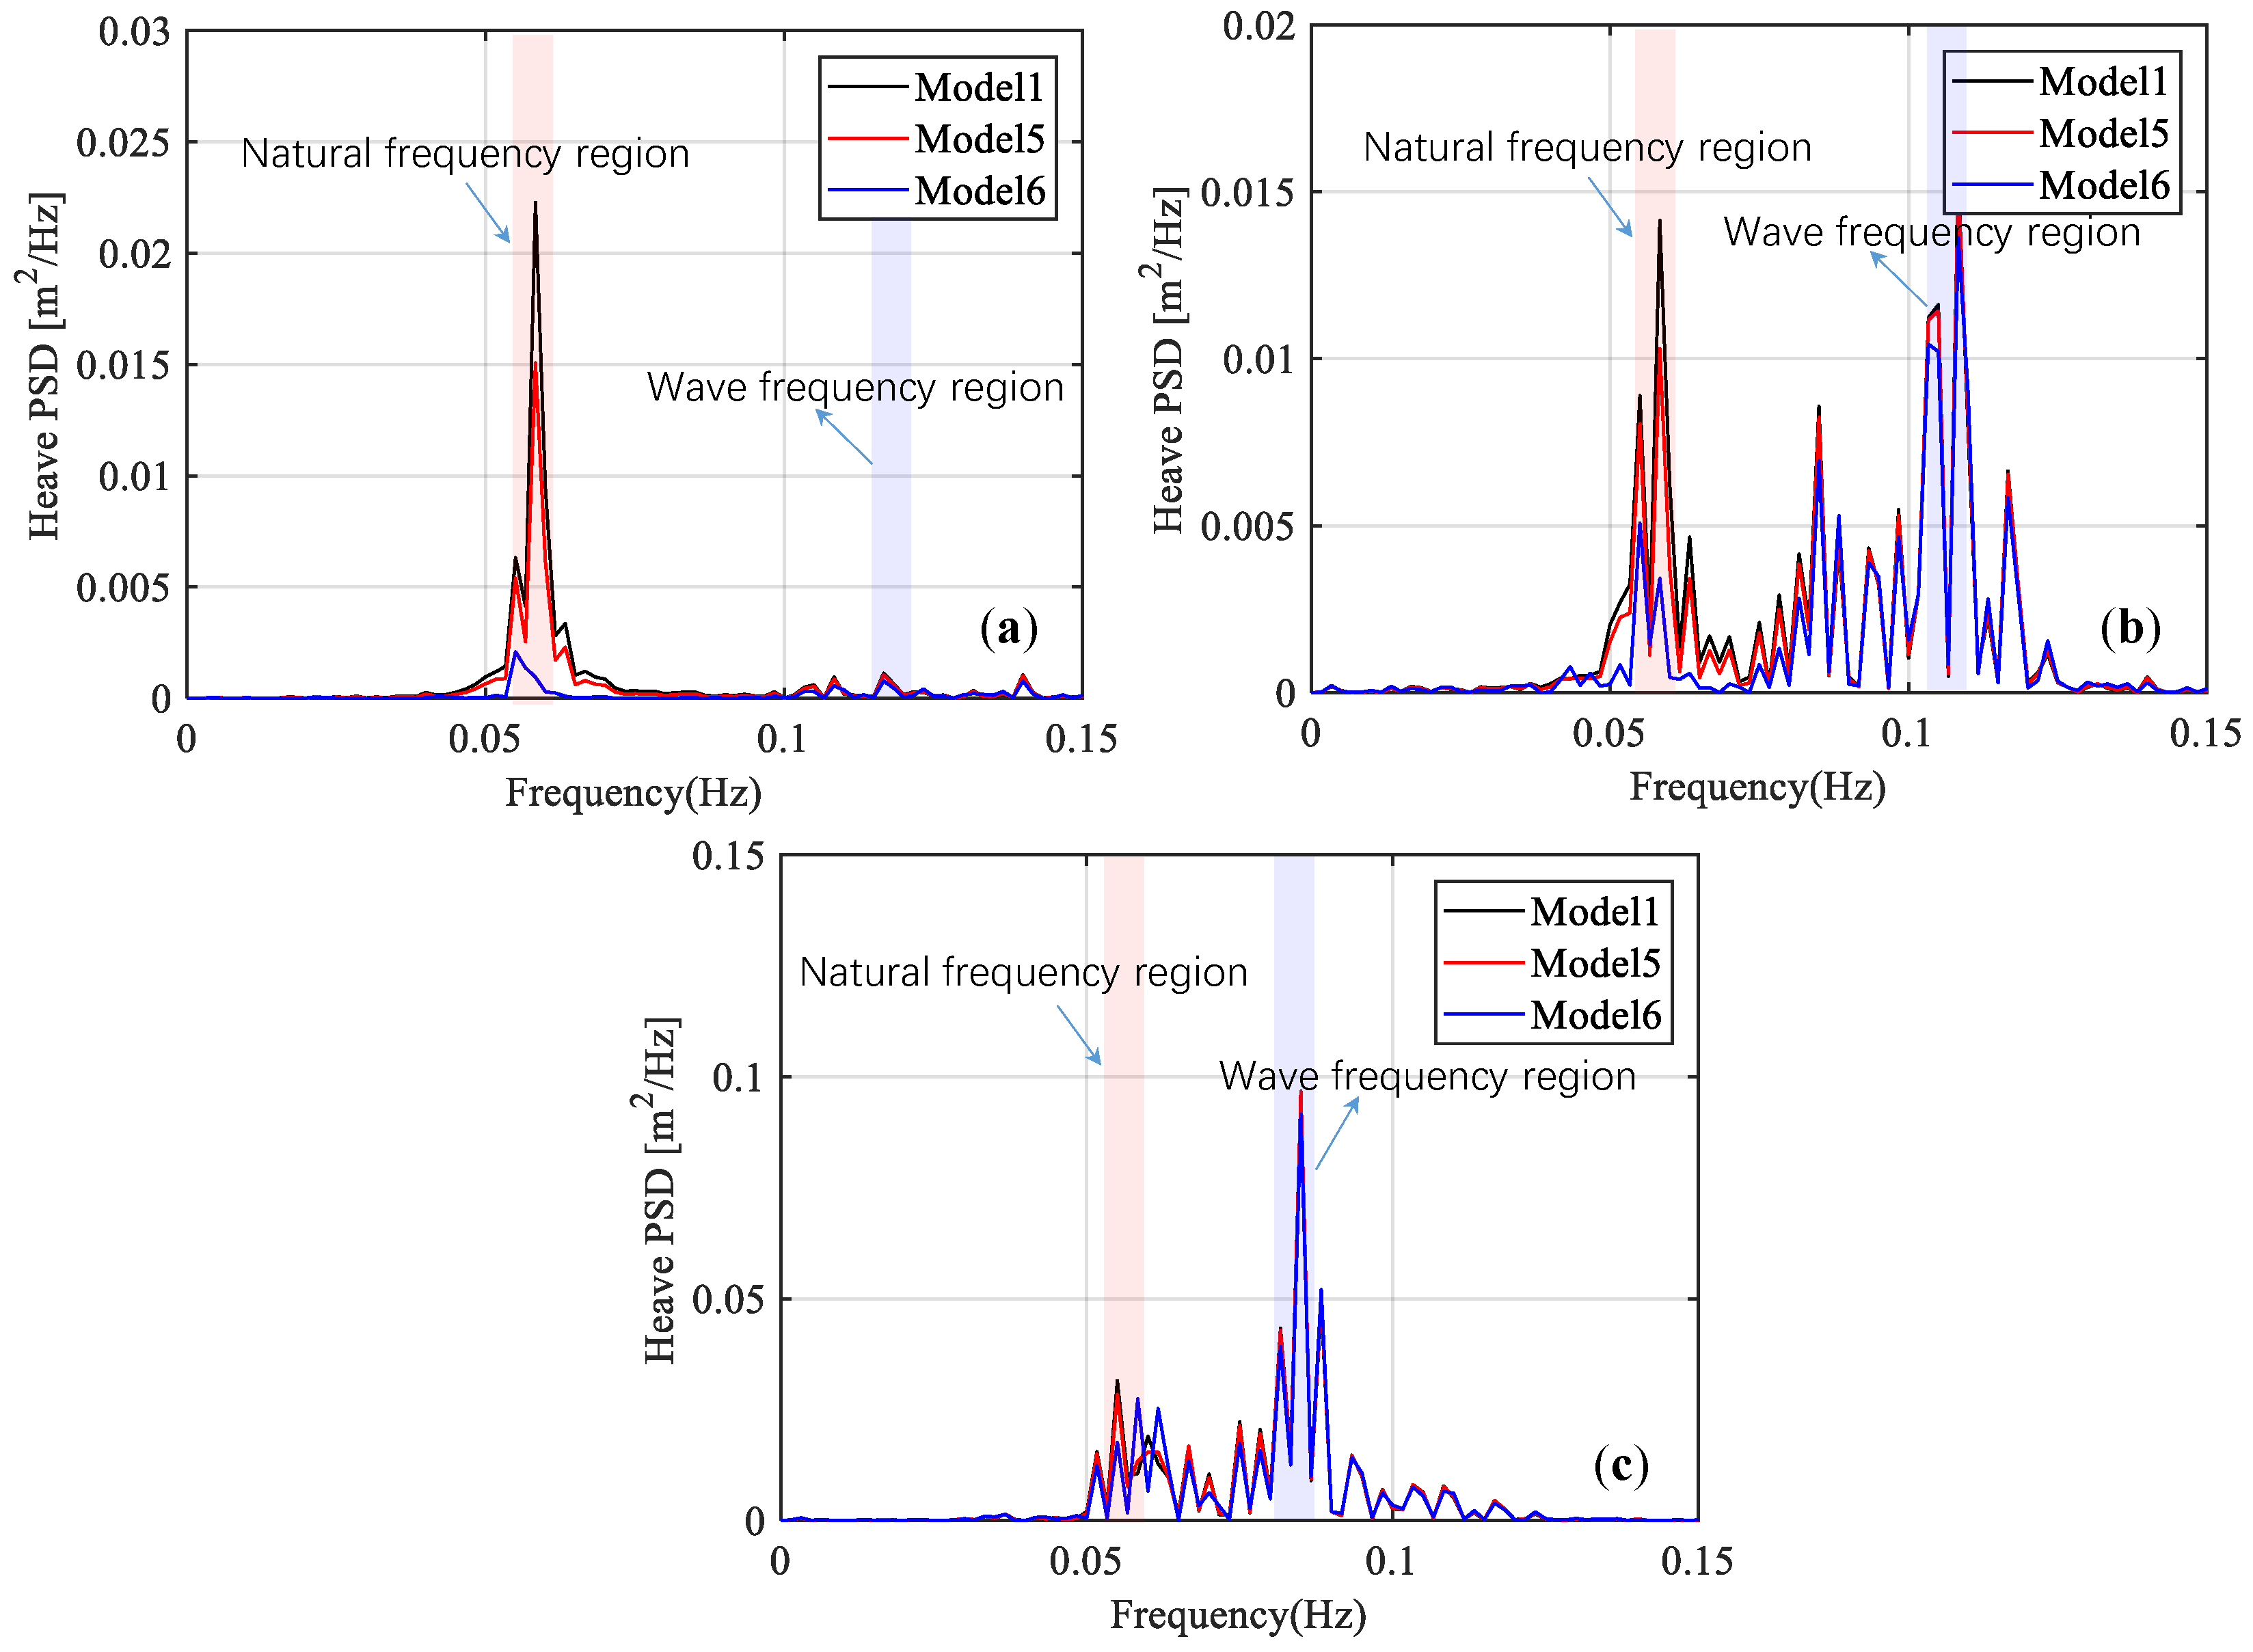
4.3. Inclined Upper Column Models

4.3.1. Regular Waves

The dynamic responses of the inclined upper column models (Models 5 and 6) under regular waves are shown in Figure 14, Figure 15 and Figure 16. As illustrated in Figure 14 and Figure 16, the surge and the pitch motion of the inclined upper column models are not much different from the original Model 1 under LC1, LC2, and LC3. However, as indicated in Figure 15, the heave motions of the inclined upper column models are much lower than that of the original Model 1. Model 6, whose upper columns are tilted 30 degrees, shows the largest reduction of the heave motions. The mean heave response of Model 6 is even close to 0 m. This means that the heave motion of the platform will decrease as increasing the inclined angle of the upper columns. The increases in added mass in the heave direction and the increase of the waterplane area due to the inclination of the columns should be the reason inducing the decrease of the heave displacement and the overall stability of the concept.
From the statistic point of view, the mean surge and pitch motions of the inclined upper column models are found to be almost the same with the original Model 1, as listed in Table 13. At the same time, the statistics of the surge and pitch motions are also nearly consistent no matter how inclined the upper columns are. It is notable that increasing the inclined angle of the upper columns is very effective to decrease not only the mean heave motions but also the maximum ones. From LC1, LC2, and LC3, it is evident that the maximum of the heave and pitch responses gradually increase. However, the minimum of the heave and pitch responses gradually decrease. It explains that the larger the wave height is, the larger the range of motion responses will be. For Model 1, 5, and 6, as increasing the inclined angle of the upper columns, an obvious reduction of the heave motion amplitudes can only be found for the wave with a high frequency; see Table 14. Slight decreases of the surge and pitch amplitudes can be identified for the wave with low frequency.

4.3.2. Irregular Waves

To illustrate the effect of the inclined upper column models on the platform motion responses under irregular wave conditions, the models under the irregular waves are further examined, as shown in Figure 17, Figure 18 and Figure 19. Comparing Model 1, Model 5, and Model 6, it is apparent that only the platform heave PSD is significantly reduced. The surge PSD shows slight reduction, while the pitch PSD increases slightly. This finding is consistent with the results of the regular wave in the previous section. It is also observable that the heave PSD of Model 6 is the smallest, which indicates that the platform whose upper columns are tilted 30° has the best performance for the heave motion under the irregular wave among Models 1, 5, and 6. The most obvious reduction in the heave direction is found to be in LC4. It is evident from Table 15 that the peak heave PSD in Model 6 is about only one tenth that of Model 1. In addition, there is a clear shift of the peak frequency for the heave motion, which is 0.058 Hz in Model 1, 0.55 Hz in Model 5, and 0.52 Hz in Model 6, due to the fact that the effects providing added mass area should dominate the additional stiffness from the increased waterplane area. The motion standard deviations of the inclined upper column models under irregular waves are listed in Table 16, where the decrease of the heave motion as changing the model from Model 1 to Model 5 and Model 6 is obvious when the wave frequency is high; however, this reduction reduces with increasing wave frequency.
It is interesting that there is no clear frequency shift for the pitch motion, and we think it is probably due to the fact that the added mass in the pitch direction from the increased waterplane area should be very limited compared with the wind turbine blades and the hub, together with the fact that the stiffness in pitch direction is not sensitive to the inclination of the columns, as can be found from Table 15. The natural pitch frequency can be abruptly determined as ω = k θ / I , where k θ is the stiffness in pitch direction, I is the moment of inertia determined as I = ( m + m a ) r 2 d r , m is the mass and ma is the added mass. Considering that the distance of the added mass to the center of the floater is much less than that of the wind turbine and the hub, and also I is proportional to the square of r, the natural frequency shift due to the added mass should not be as obvious as that in the heave direction.

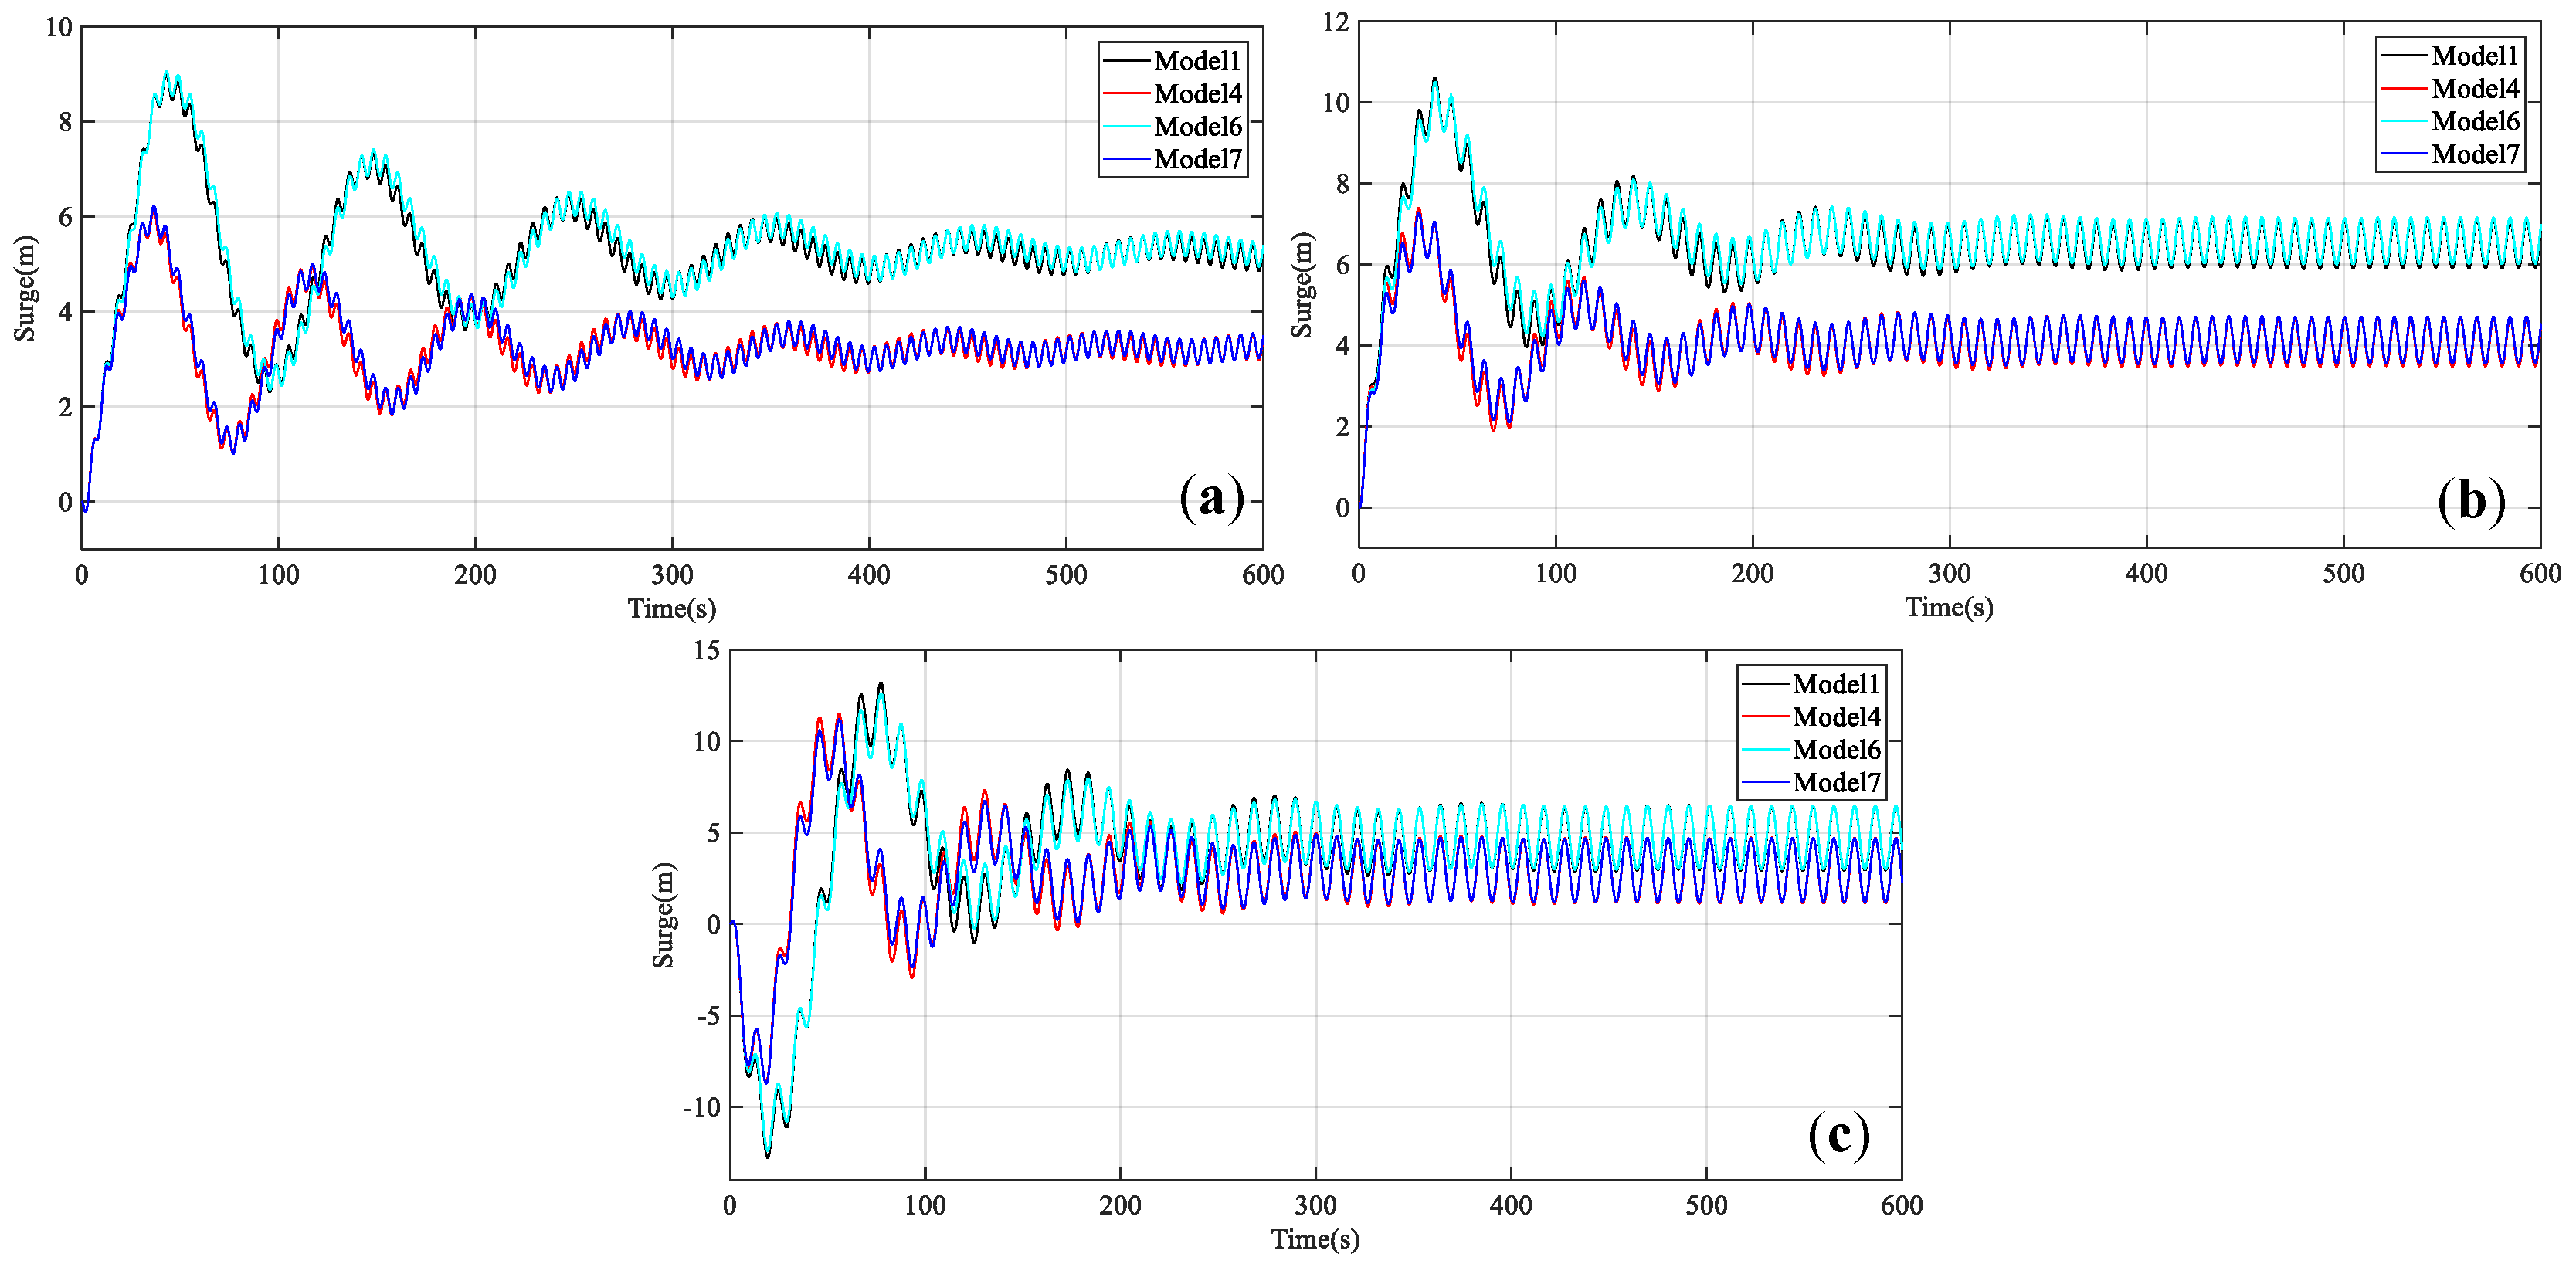
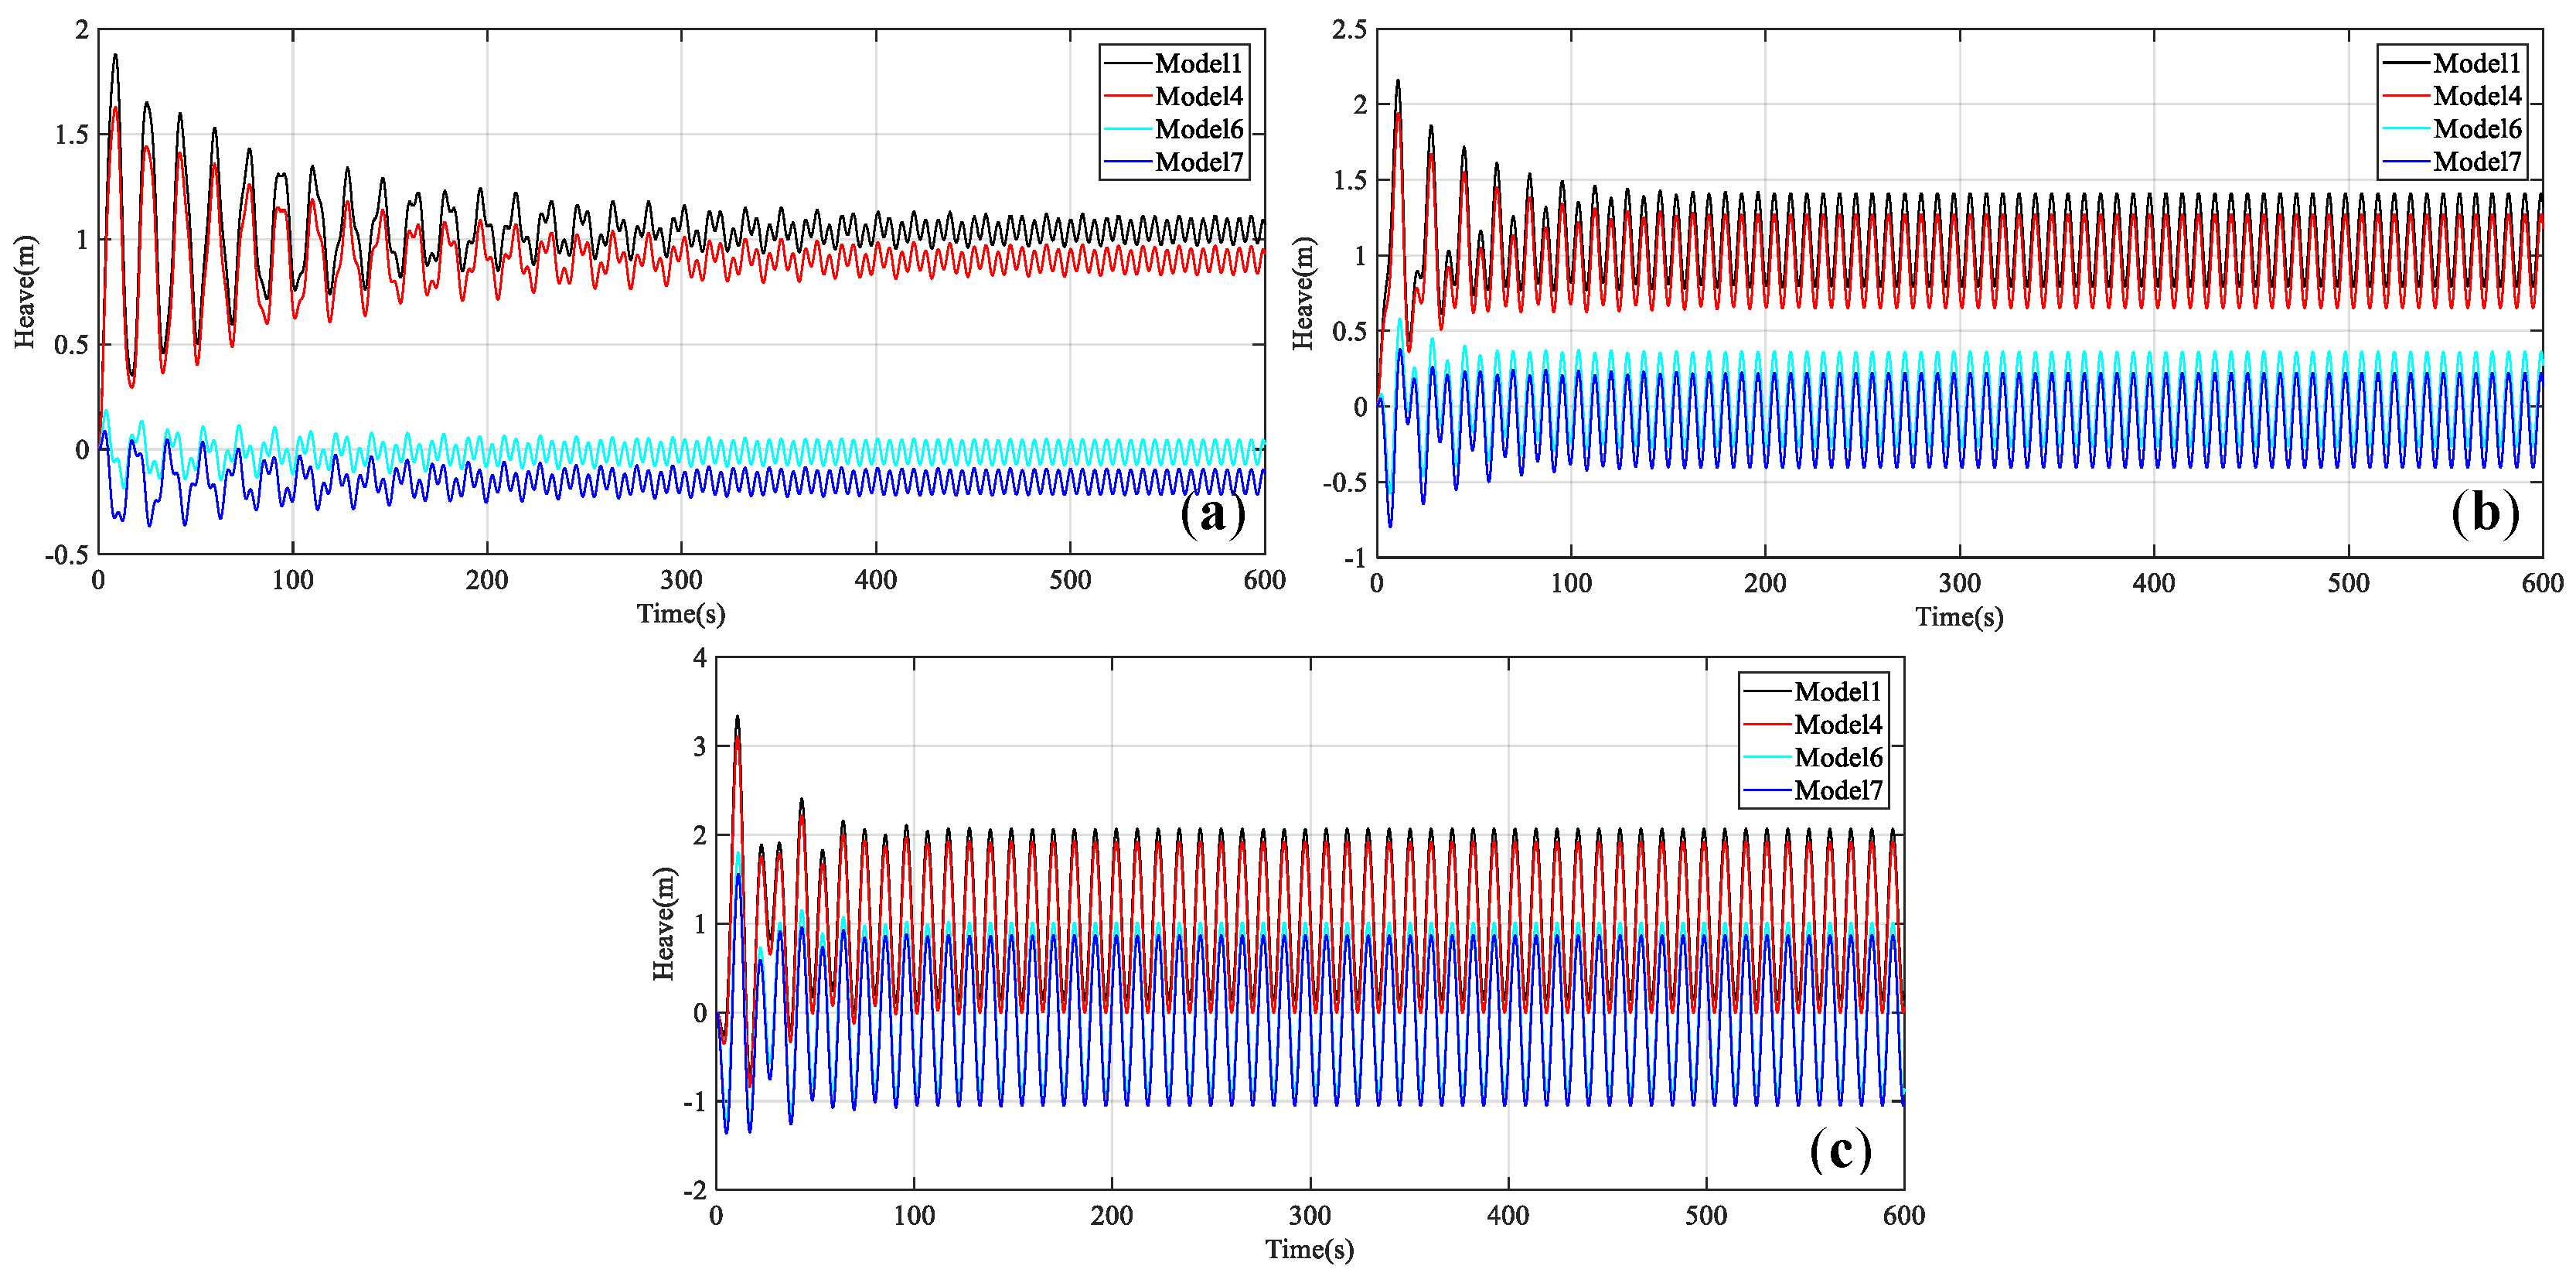
4.4. Combination of Models 4 and 6

The multi-segmented mooring line models or the inclined upper column models examined previously have conspicuous impacts on the platform motion response in only one direction, i.e., Model 4 can only greatly reduce the platform surge response, while Model 6 can only greatly reduce the platform heave response. In this section, Model 7, as a combination of Model 4 and Model 6, is proposed, in which the mooring system of Model 7 is arranged in the same way as Model 4, and the upper columns same as those of the platform of Model 6 tilted 30°.

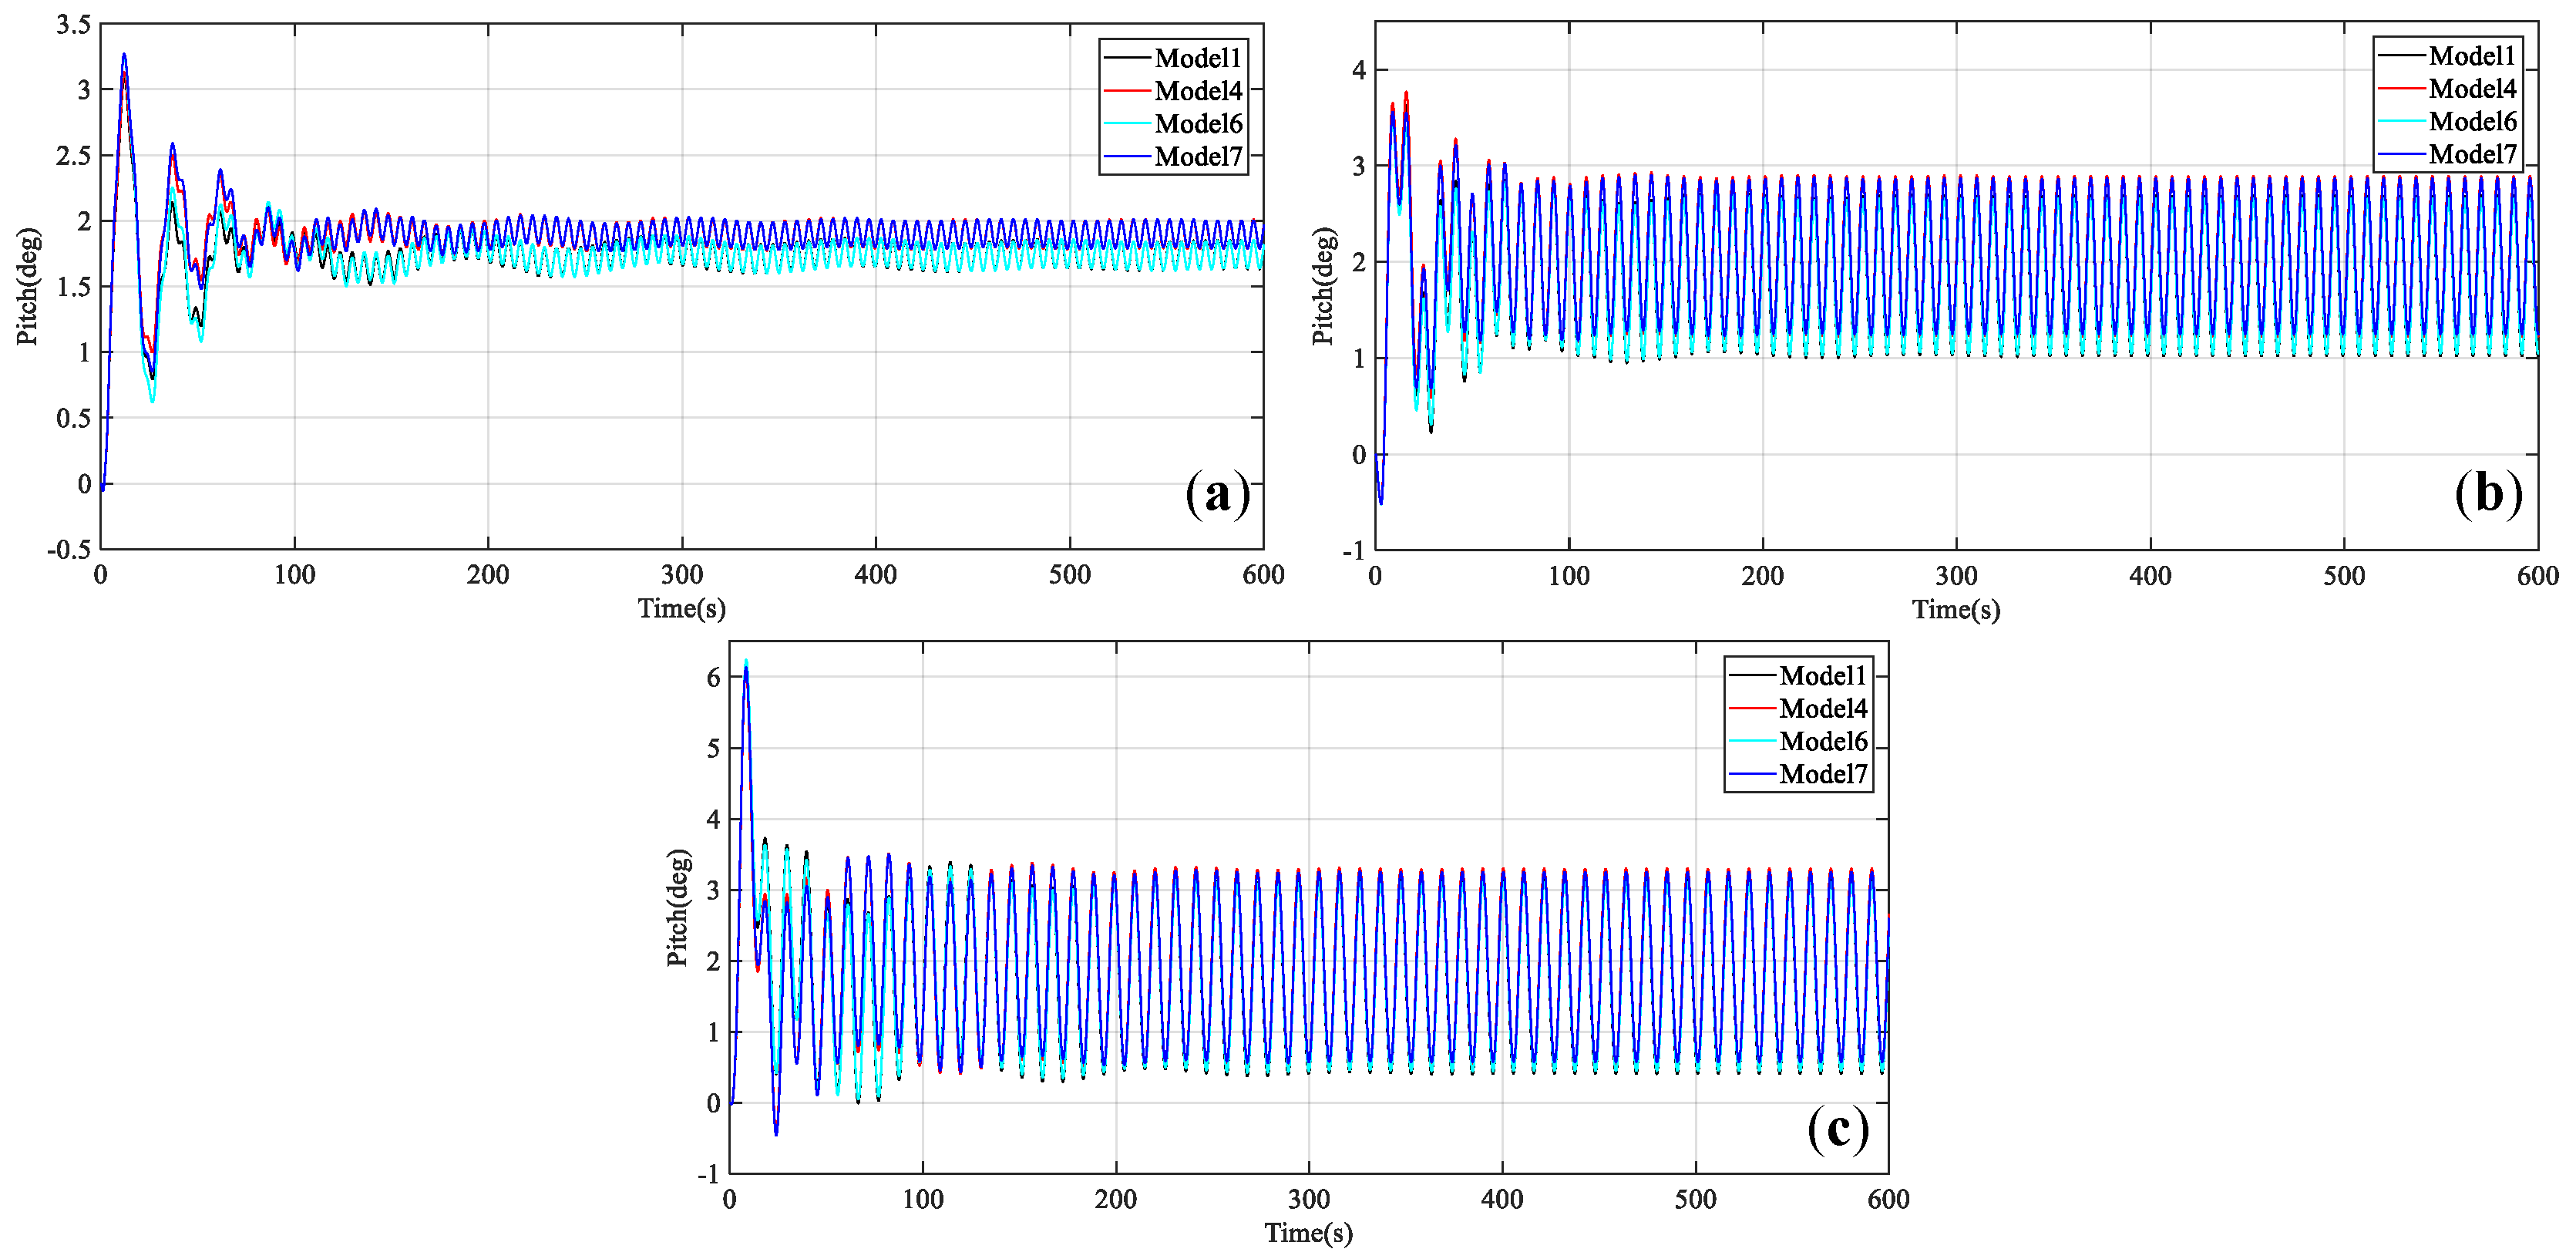
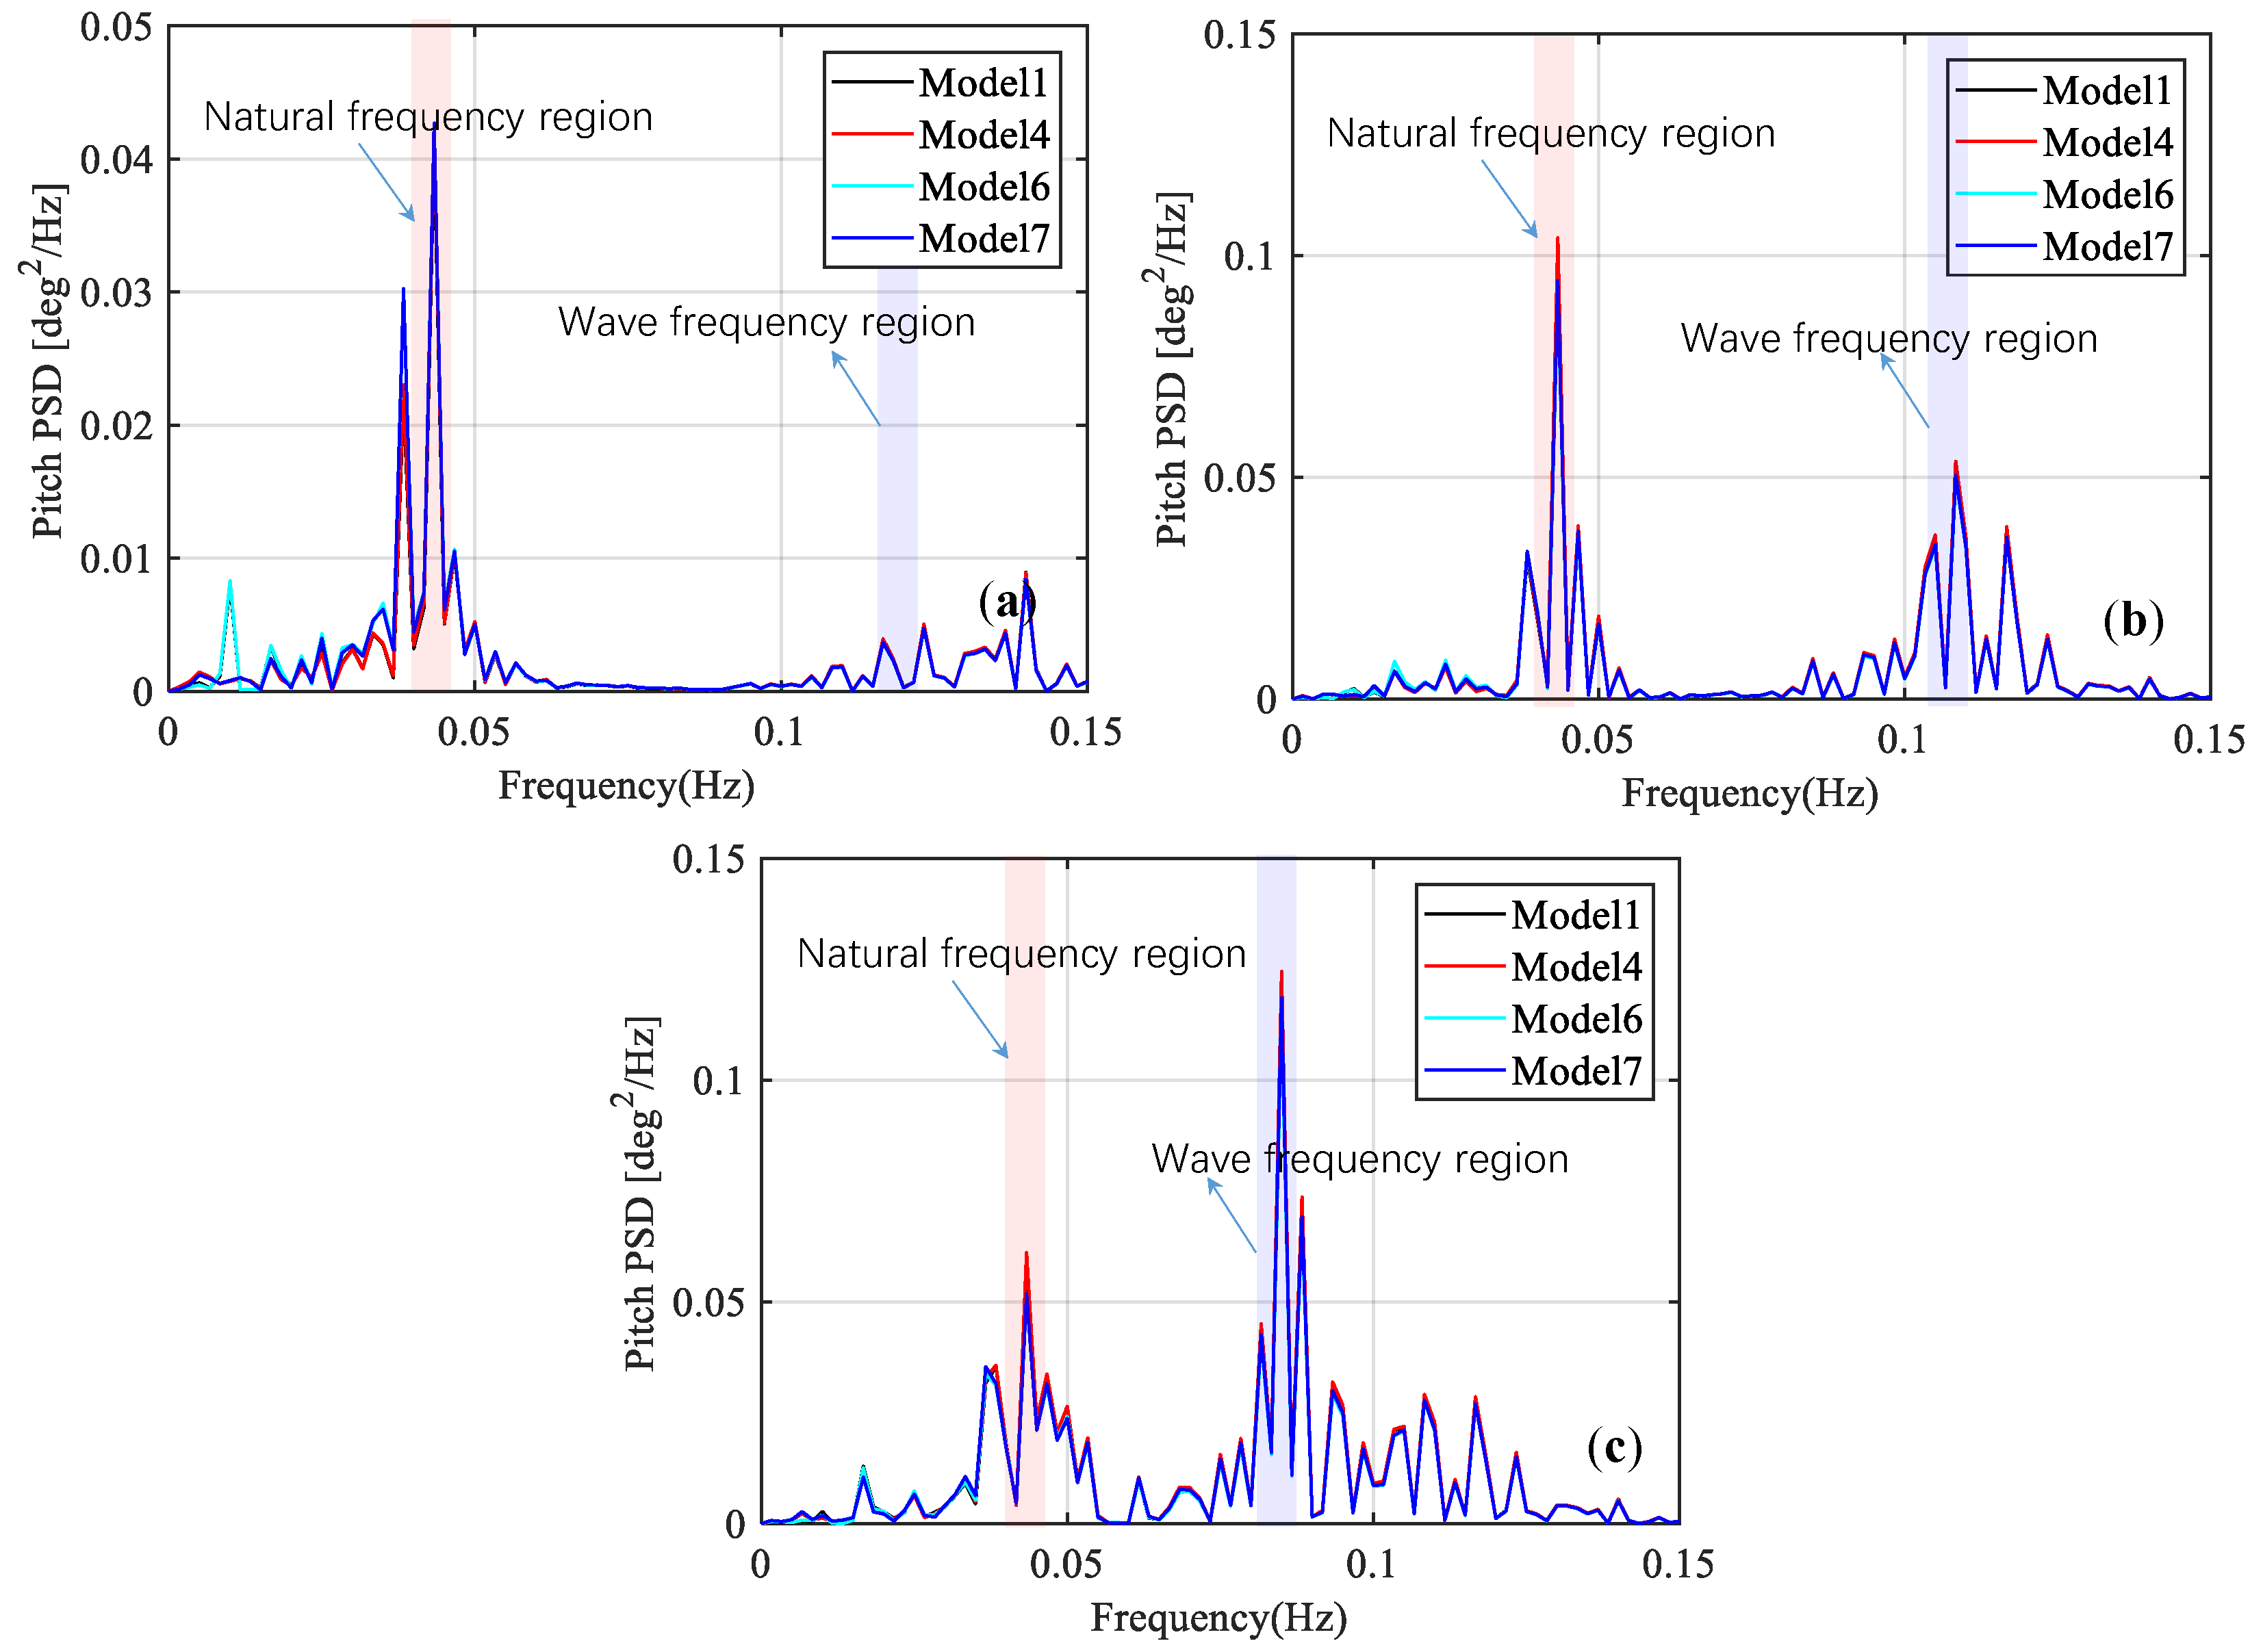
4.4.1. Regular Waves

As illustrated in Figure 20, different from Model 1, the surge motions of Model 4 and Model 7 are the most reduced. Meanwhile, the surge motion of Model 4 and Model 7 are nearly coincident. At the same time, Figure 21 shows that the platform heave motions are gradually reduced, while the heave motions of Model 6 and Model 7 are around the same. Compared to Model 1, the pitch motions of Models 4, 6, and 7 do not change much, see Figure 22. Overall, Model 7 depicts the smallest motions in both the surge and heave directions as compared with the other models under the regular waves.
Figure 23 shows the maximum, minimum, mean values, and the amplitude of the response motions from 400–600 s. The averaged value of the surge motion of Model 7 is about 0.7 as large as that in Model 1 under different load conditions. Meanwhile, the mean value of heave motion of Model 7 is close to 0, indicating that Model 7 can greatly decline the platform heave motion. As clarified in Figure 23c, there are no significant changes to the average values of pitch motion from the original Model 1 to the modified models. As for the amplitudes of the motion, Model 7 also provides the best performance in both surge and heave directions.

4.4.2. Irregular Waves

The frequency domain curves of the platform motion PSD of Model 7 in surge, heave, and pitch directions under different irregular waves are plotted in Figure 24, Figure 25 and Figure 26, respectively. From the figures, it is evident that the peak values of the surge and heave PSD of Model 7 are much smaller than those of the other models. However, the pitch PSD peak values of the models are not much different. Table 17 lists the motion standard deviations of Models 1, 4, 6, and 7 under irregular waves, from which it is clear that the motion standard deviations in both surge and heave directions of Model 7 are minimal compared with the other models. Overall, we can say that Model 7 has a much better performance in comparison with the original OC4 model.

5. Conclusions

In this study, by changing the connection mode of the mooring line as well as the structural form of the platform based on the original OC4 model, two groups of models were examined by AFWT. The influence of the arrangement of the mooring lines and the inclination angle of the upper columns on the motion response were clarified. Based on the findings in both of the two groups of the models, a new model is proposed. From the study, some important conclusions are drawn, which can be summarized into the following aspects:
  • The numerical results calculated by AFWT are basically consistent with FAST and those in experiment, which verifies the accuracy of AFWT used in this paper.
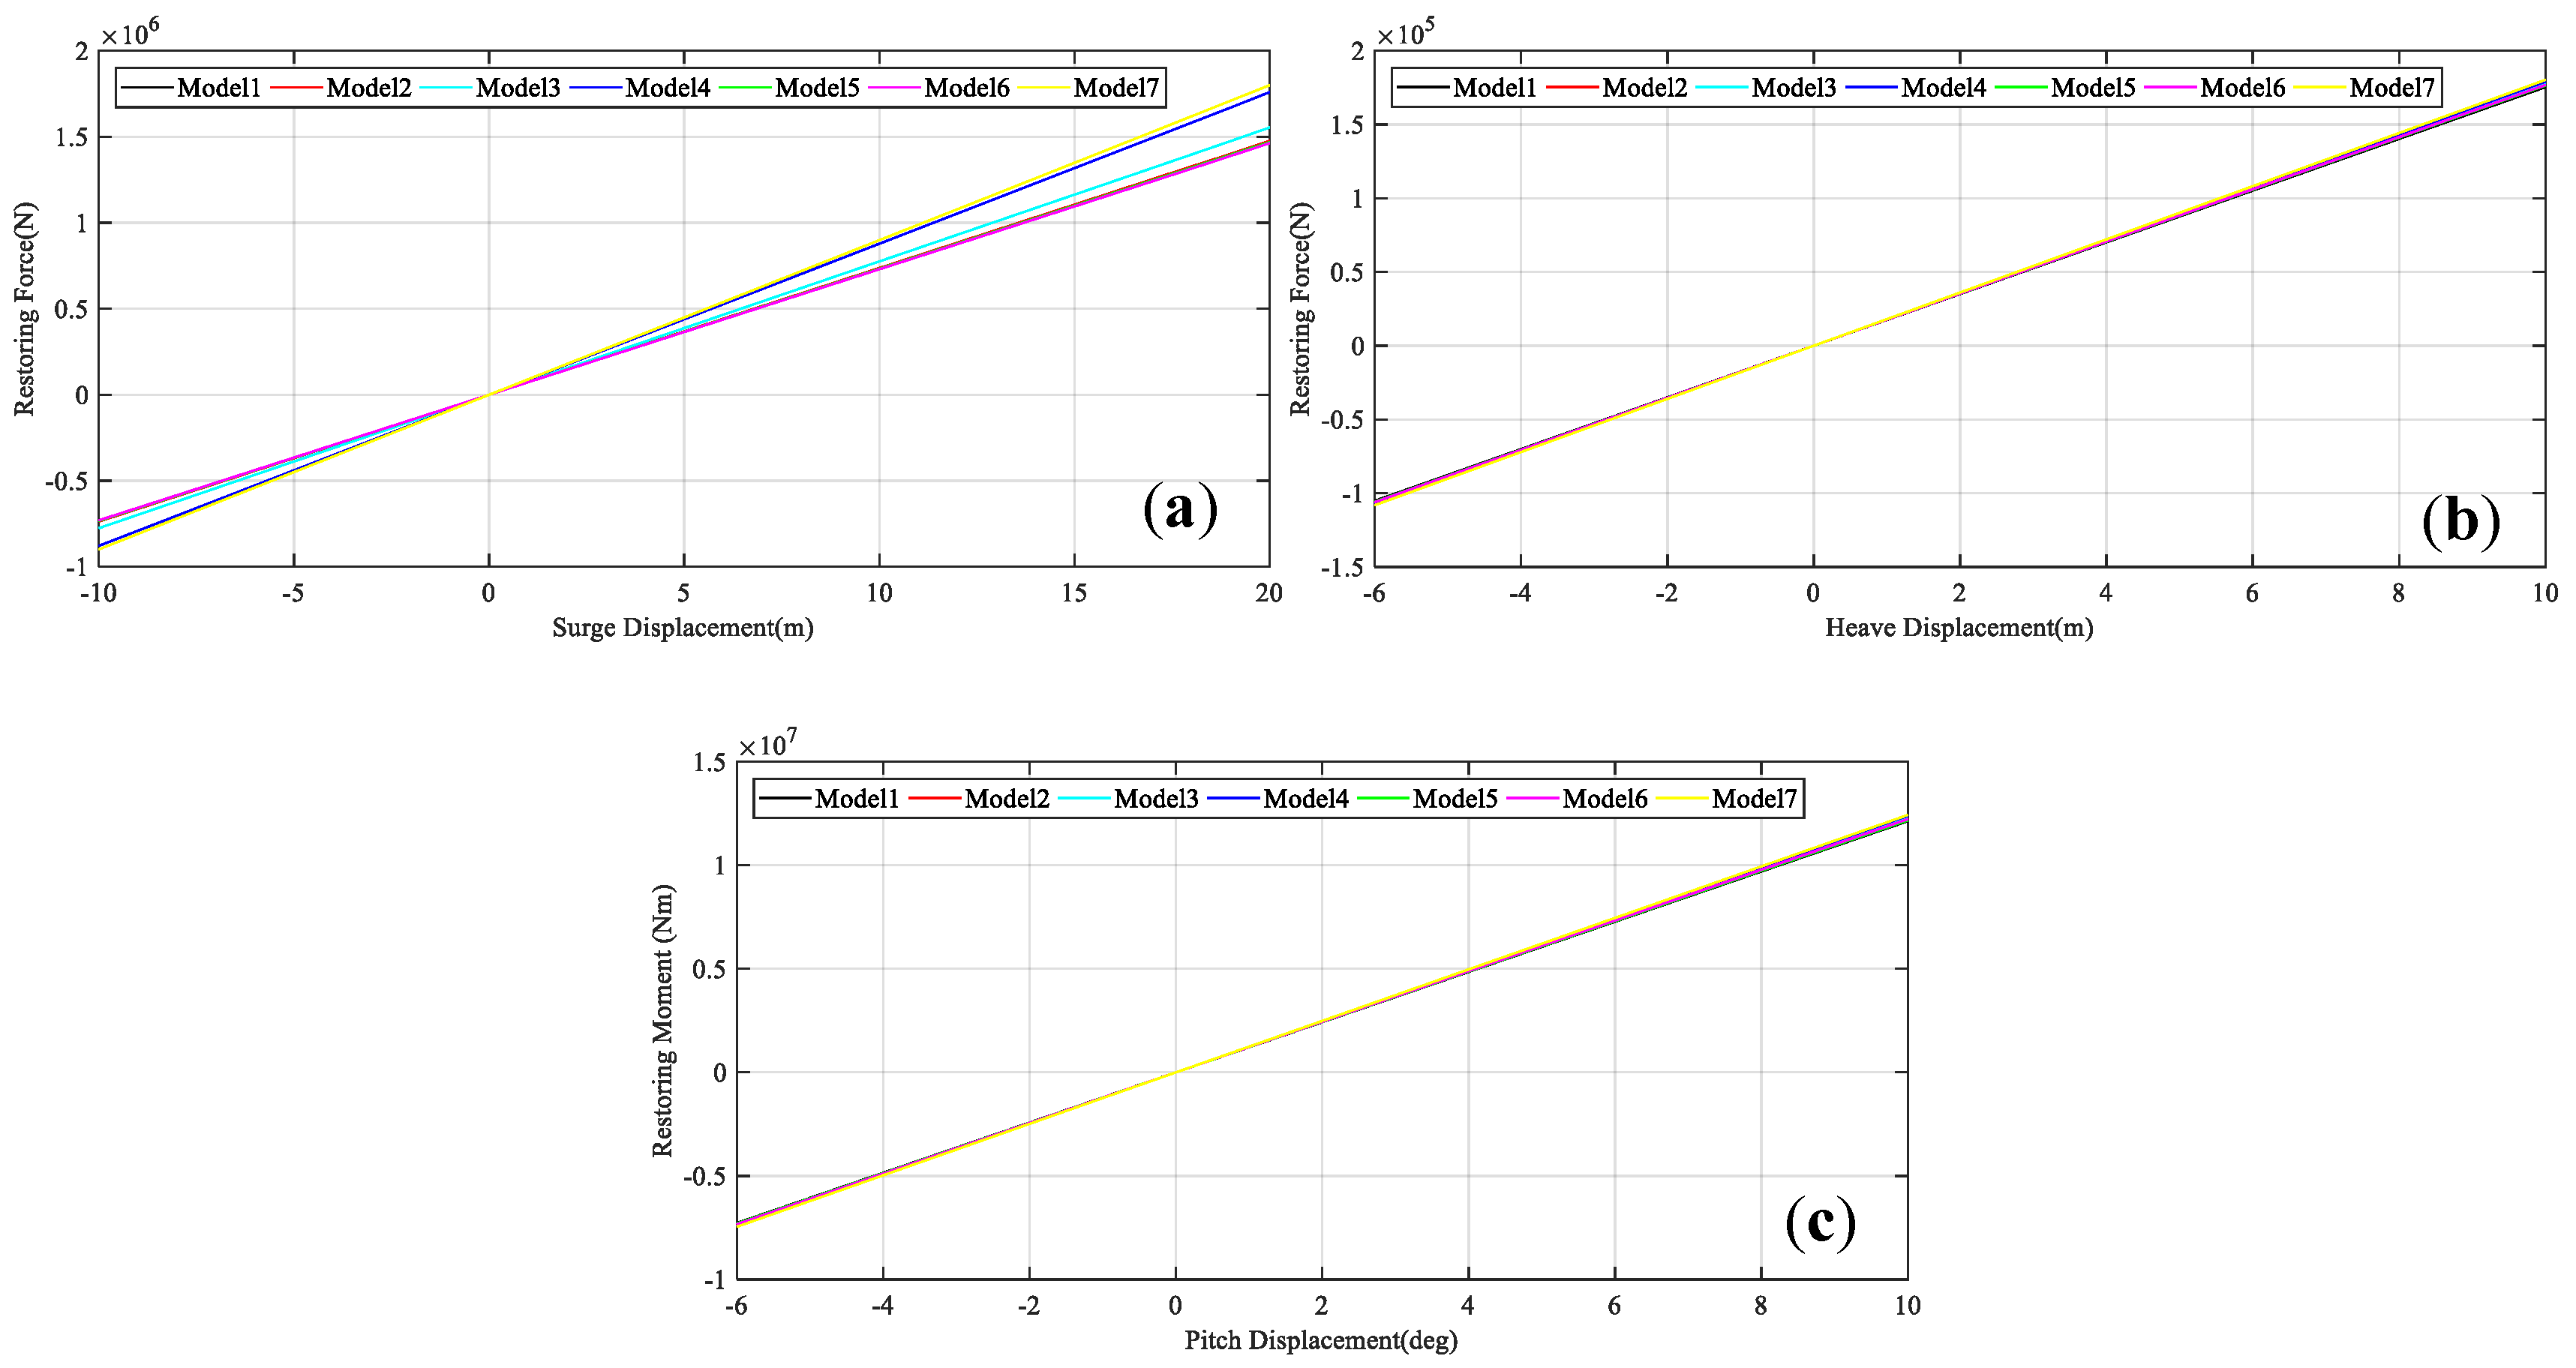
  • Changing the arrangement of the mooring system can greatly reduce the surge response of the platform, although it will have little effect on the response of heave and pitch. Among Models 2, 3, and 4, the mooring system layout in Model 4 has the most remarkable effect on reducing the platform surge response by about 30% compared with the original Model 1, indicating that the shorter the upper lines are, the greater the reduction to the surge of the platform will be.
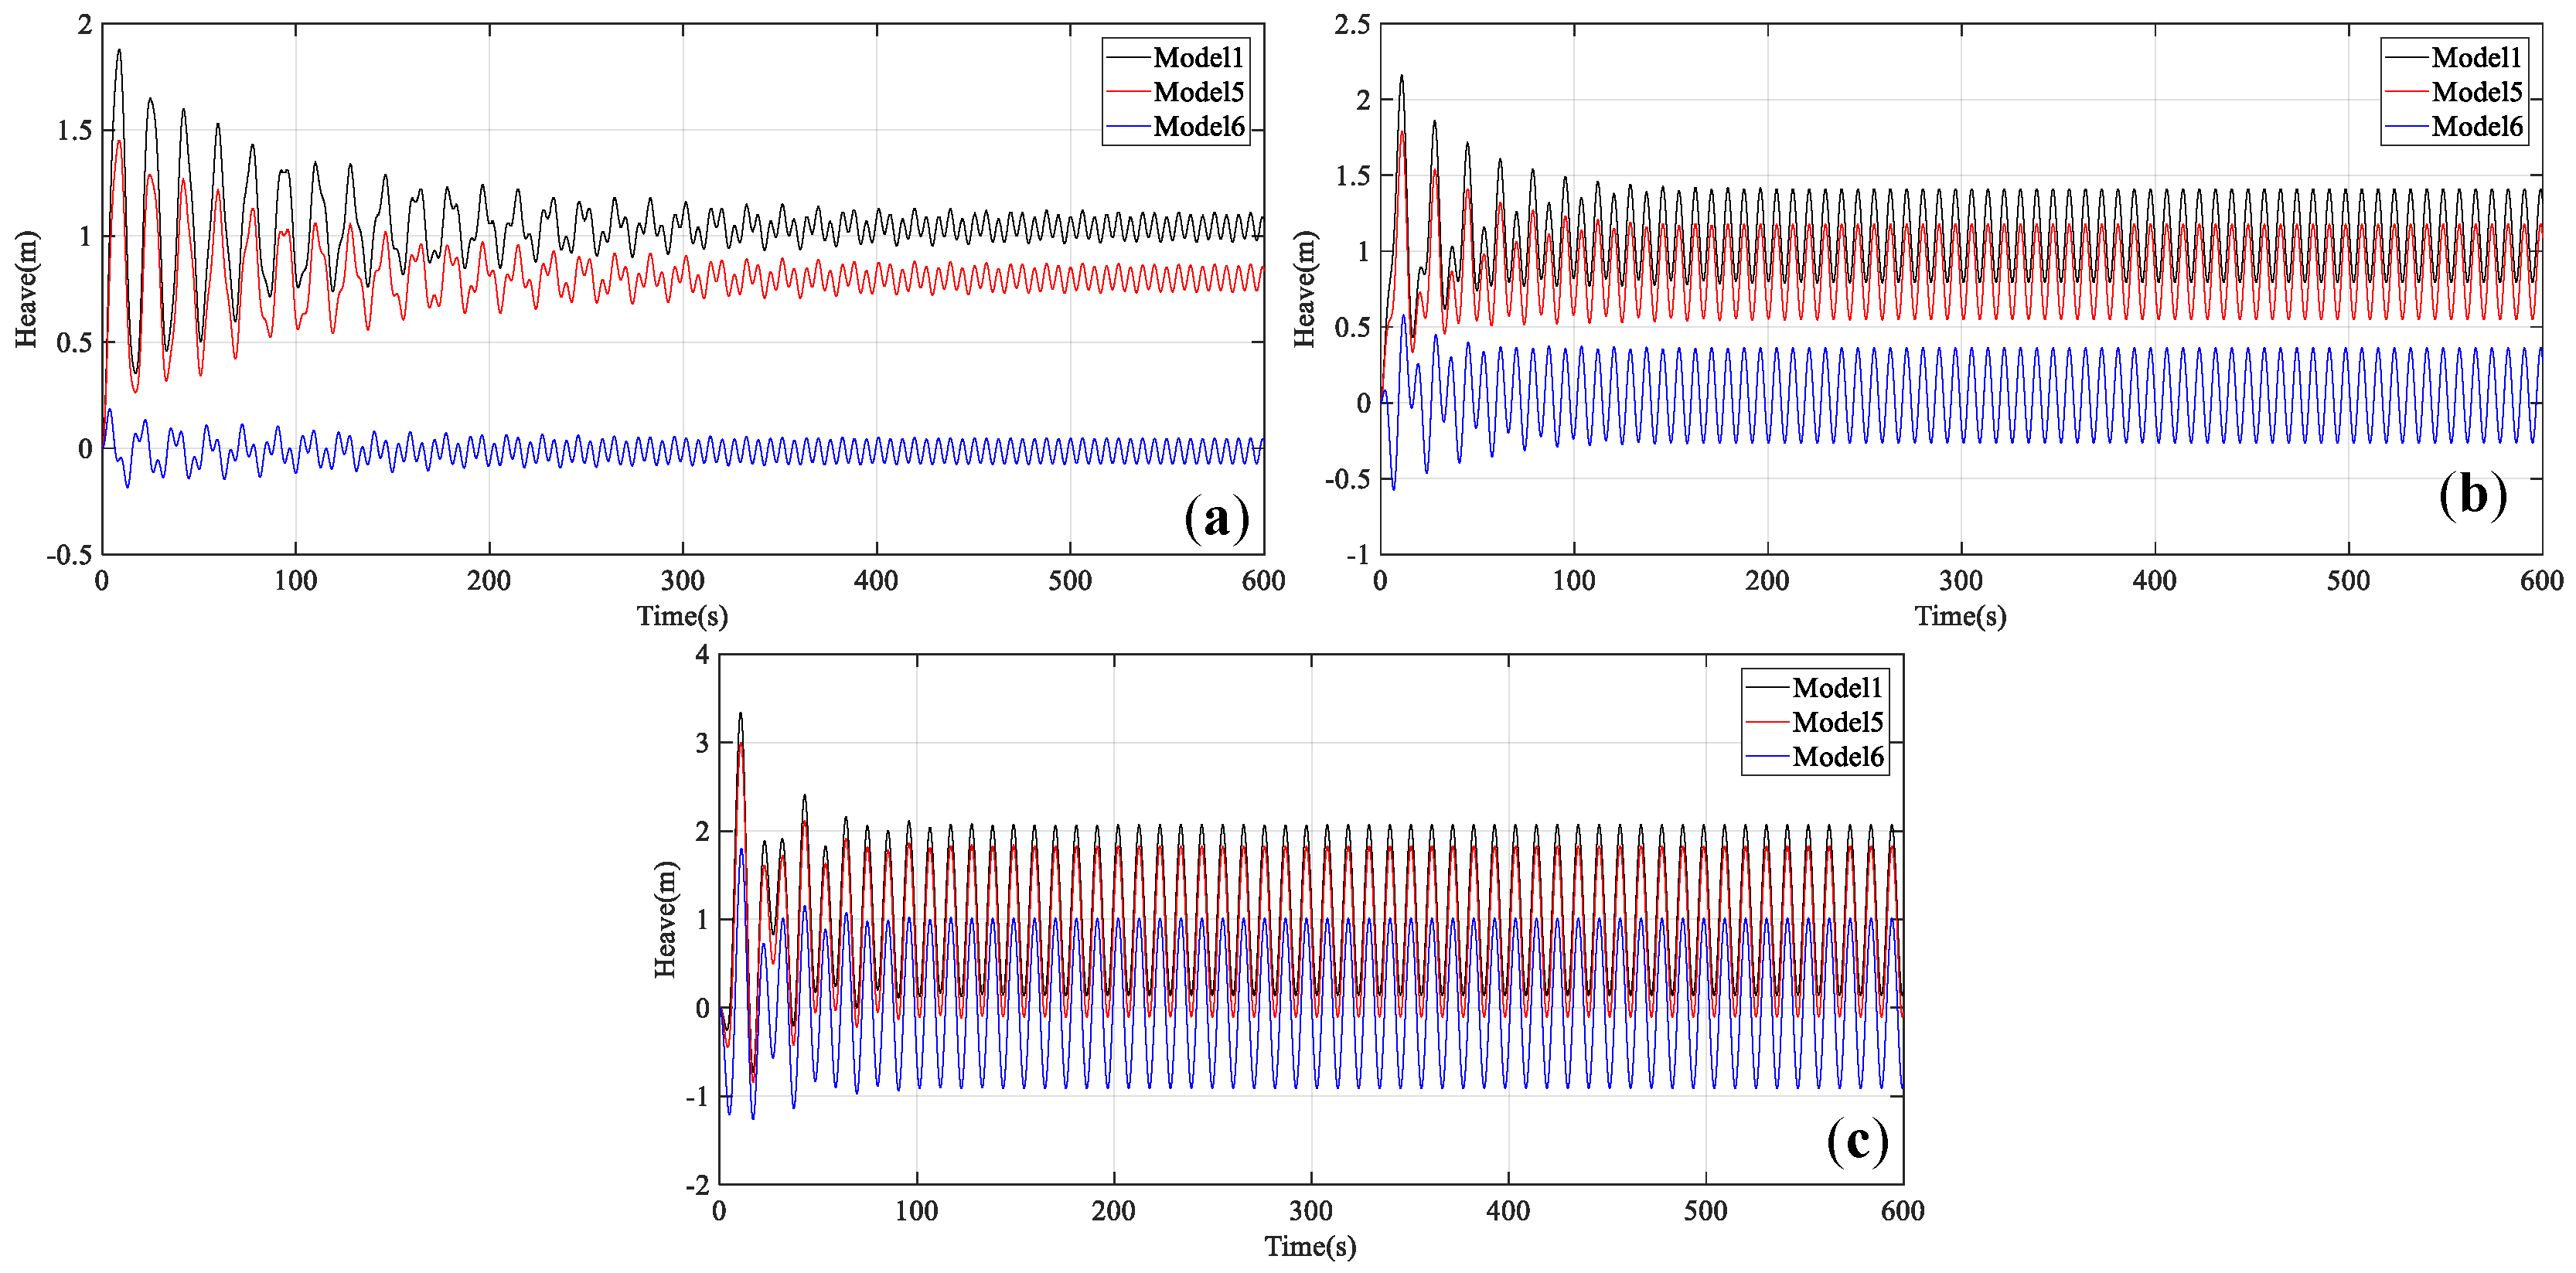
  • Tilting the upper columns of the floating platform can greatly reduce the platform heave response. It is found that the heave motion of the platform will decrease as the inclined angle of the upper column increases. However, it has little effect on the responses in surge and pitch directions.
  • A new model integrating the optimized multi-segmented mooring lines and the optimized inclined columns is proposed. The surge and heave motion responses of this new model are greatly declined. It should be able to increase the stability of the floating platform during operation and improve the working efficiency of the floating wind turbines.

6. Discussion

The proposed structural modifications will also increase the internal tensions in mooring lines and structural elements. This will lead to an increase in the requirement of the structural strength, which may increase the costs of installation, manufacturing, and maintenance of the FOWT. Therefore, additional research considering the economic issues and the service life of the mooring lines as well as the structural elements due to the increases of internal tensions should be carried out. The method of adding dampers to reduce the wind turbine motions is also an important direction.

Author Contributions

Author Contributions: Conceptualization: Q.Z. and Z.L.; methodology: Z.L.; software: Q.Z.; validation: Q.Z. and Z.L.; formal analysis: Q.Z. and Z.L.; investigation: Q.Z. and Y.T.; data curation: Q.Z. and Z.L.; writing—original draft preparation: Q.Z., Y.T. and W.W.; writing—review and editing: Q.Z., Z.L., Y.T., W.W. and X.H.; supervision: Z.L., Q.Z., Y.T., W.W. and X.H.

Funding

The study is funded by National Key Research and Development Plan of China (2016YFE0127900), and the National Natural Science Foundations of China (51608220).

Acknowledgments

The corresponding author sincerely thanks Key Laboratory for Bridge and Wind Engineering of Hunan Province for the support to this research.

Conflicts of Interest

No potential conflict of interest was reported by the authors.

Nomenclature

aAxial induction factor
aTangential induction factor
BNumber of the blades
B ( ω ) Wave spectrum (P-M spectrum)
cLeaf chord length (m)
CBSeabed friction coefficient
CnCoefficients for the normal force
CtCoefficients for the thrust force
EASectional stiffness of the mooring line (kN)
ϕ ( x ,   y ) Potential function
Fwaves(t)Incident-wave induced force (kN)
Fwind(t)Wind loads acting on the blades and tower (kN)
Fmooring(t)Mooring tension (kN)
Fvis(t)Drag force caused by fluid viscosity (kN)
FextExternal force at the connection node (kN)
HAHorizontal component of the effective tension at the anchor (kN)
HFHorizontal component of the effective tension at the fairlead (kN)
LTotal unstretched mooring line length (m)
LBUnstretched length of cable lying on the seabed (m)
sLength from the catenary point to the anchor (m)
TeMooring line tension (kN)
V1Wind speed (m/s)
VhubWind speed at the hub (m/s)
VAVertical component of the effective tension at the anchor (kN)
VFVertical component of the effective tension at the fairlead (kN)
φRelation flow angle (°)
ωFrequency(Hz)
wMass of the mooring line per unit length (kN/m)
W ( ω ) Fourier transform of a white noise time series with unit variance
X j ( ω , β ) Wave-induced force array normalized per unit wave amplitude (kN/m)
xFHorizontal coordinate of the fairlead position relative to the anchor (m)
zFVertical coordinate of the fairlead position relative to the anchor (m)
AFWTAnalysis tool of floating wind turbine
BEMBlade element momentum
CMCenter of mass
DOFDegree of freedom
FASTFatigue, Aerodynamics, Structures, and Turbulence
FFTFast Fourier Transform
FOWTFloating offshore wind turbine
HAWTHorizontal axis wind turbine
LCLoad case
MSQSMulti-Segmented, Quasi-Static
NRELNational Renewable Energy Laboratory
OC3Offshore Code Comparison Collaboration
OC4Offshore Code Comparison Collaboration Continuation
P-MPierson Moskowitz
PSDPower spectral density
RAOResponse amplitude operator
SWLStill water level
TLPTension Leg Platform
WAMITWave Analysis Massachusetts Institute of Technology
WTNWind turbine noise
VAWTVertical axis wind turbine

References

  1. Heronemus, W.E. Pollution-Free Energy from the Offshore Winds; Marine Technology Society: Washington, DC, USA, 1972. [Google Scholar]
  2. European Wind Energy Association. The European Offshore Wind Industry-key Trends and Statistics 1st Half 2013; European Wind Energy Association: Brussels, Belgium, 2013. [Google Scholar]
  3. Maine International Consulting LLC. Floating Offshore Wind Foundations: Industry Consortia and Projects in the United States, Europe and Japan; Maine International Consulting LLC: Bremen, ME, USA, 2013. [Google Scholar]
  4. Gille, L.A.; Marquis-Favre, C.; Morel, J. Testing of the European Union exposure-response relationships and annoyance equivalents model for annoyance due to transportation noises: The need of revised exposure-response relationships and annoyance equivalents model. Environ. Int. 2016, 94, 83–94. [Google Scholar] [CrossRef]
  5. Janssen, S.A.; Vos, H.; Eisses, A.R.; Pedersen, E. A comparison between exposure-response relationships for wind turbine annoyance and annoyance due to other noise sources. J. Acoust. Soc. Am. 2011, 130, 3743–3756. [Google Scholar] [CrossRef] [PubMed]
  6. Takayuki, K.; Takashi, Y.; Sonoko, K.; Shinichi, S.; Hideki, T. Exposure-response relationship of wind turbine noise with self-reported symptoms of sleep and health problems: A nationwide socioacoustic survey in Japan. Noise Health 2016, 18, 53–61. [Google Scholar]
  7. Fredianelli, L.; Gallo, P.; Licitra, G.; Carpita, S. Analytical assessment of wind turbine noise impact at receiver by means of residual noise determination without the wind farm shutdown. Noise Control Eng. J. 2017, 417–433. [Google Scholar] [CrossRef]
  8. Fredianelli, L.; Carpita, S.; Licitra, G. A procedure for deriving wind turbine noise limits by taking into account annoyance. Sci. Total Environ. 2019, 648, 728–736. [Google Scholar] [CrossRef] [PubMed]
  9. Musial, W.; Butterfield, S.; Boone, A. Feasibility of Floating Platform Systems for Wind Turbines. In Proceedings of the 42nd AIAA Aerospace Sciences Meeting and Exhibit, Reno Nevada, NV, USA, 5–7 January 2004. [Google Scholar]
  10. Karimirad, M.; Moan, T. Feasibility of the Application of a Spar-type Wind Turbine at a Moderate Water Depth. Energy Procedia 2012, 24, 340–350. [Google Scholar] [CrossRef]
  11. Ahn, H.J.; Shin, H. Model test and numerical simulation of OC3 spar type floating offshore wind turbine. Int. J. Naval Arch. Ocean Eng. 2019, 11, 1–10. [Google Scholar] [CrossRef]
  12. Tomasicchio, G.R.; D’Alessandro, F.; Avossa, A.M.; Riefolo, L.; Musci, E.; Ricciardelli, F.; Vicinanza, D. Experimental modelling of the dynamic behaviour of a spar buoy wind turbine. Renew. Energy 2018, 127, 412–432. [Google Scholar] [CrossRef]
  13. Markus, L.; De-Prada-Gil, M.; Molins, C. The influence of different wind and wave conditions on the energy yield and downtime of a Spar-buoy floating wind turbine. Renew. Energy 2019, 136, 1–14. [Google Scholar]
  14. Ma, Y.; Hu, Z.Q.; Xiao, L.F. Wind-wave induced dynamic response analysis for motions and mooring loads of a spar-type offshore floating wind turbine. J. Hydrodyn. 2015, 26, 865–874. [Google Scholar] [CrossRef]
  15. Jeon, S.H.; Cho, Y.U.; Seo, M.W.; Cho, J.R.; Jeong, W.B. Dynamic response of floating substructure of spar-type offshore wind turbine with catenary mooring cables. Ocean Eng. 2013, 72, 356–364. [Google Scholar] [CrossRef]
  16. Si, Y.L.; Hamid, R.K.; Gao, H.J. Modelling and optimization of a passive structural control design for a spar-type floating wind turbine. Eng. Struct. 2014, 69, 168–182. [Google Scholar] [CrossRef]
  17. Ye, K.; Ji, J.C. Current, wave, wind and interaction induced dynamic response of a 5 MW spar-type offshore direct-drive wind turbine. Eng. Struct. 2019, 178, 395–409. [Google Scholar] [CrossRef]
  18. Hong, S.; Lee, I.; Park, S.H.; Lee, C.; Chun, H.H.; Lim, H.C. An experimental study of the effect of mooring systems on the dynamics of a SPAR buoy-type floating offshore wind turbine. Int. J. Naval Arch. Ocean Eng. 2015, 7, 559–579. [Google Scholar] [CrossRef]
  19. Subbulakshmi, A.; Sundaravadivelu, R. Heave damping of spar platform for offshore wind turbine with heave plate. Ocean Eng. 2016, 121, 24–36. [Google Scholar] [CrossRef]
  20. Duan, F.; Hu, Z.Q.; Niedzwecki, J.M. Model test investigation of a spar floating wind turbine. Mar. Struct. 2016, 49, 76–96. [Google Scholar] [CrossRef]
  21. American Petroleum Institute. Recommended Practices for Planning, Designing, and Constructing Tension Leg Platforms; American Petroleum Institute: Washington, DC, USA, 1997. [Google Scholar]
  22. Vita, L.; Ramachandran, G.K.V.; Krieger, A.; Kvittem, M.I.; Merino, D.; Cross-Whiter, J.; Ackers, B.B. Comparison of Numerical Models and Verification Against Experimental Data, Using PelaStar TLP Concept. In Proceedings of the ASME 2015 34th International Conference on Ocean, Offshore and Arctic Engineering, St John’s, NL, Canada, 31 May–5 June 2015. [Google Scholar]
  23. Oguz, E.; Clelland, D.; Day, A.H.; Incecik, A.; López, J.A.; Sánchez, G.; Almeria, G.G. Experimental and numerical analysis of a TLP floating offshore wind turbine. Ocean Eng. 2018, 147, 591–605. [Google Scholar] [CrossRef]
  24. Bulder, B.H.; Van, H.; Henderson, A.; Huijsmans, R.H.M.; Pierik, J.T.G.; Snijders, E.J.B.; Wijnants, G.H.; Wolf, M.J. Studie Naar Haalbaarheid Van en Randvoorwaarden Voor Drijvende Offshore Windturbines; Drijfwind Project Report; TNO: Delft, The Netherlands, 2002. [Google Scholar]
  25. Robertson, A.N.; Jonkman, J.M. Loads analysis of several offshore floating wind turbine concepts. In Proceedings of the 21st International Offshore and Polar Engineering Conference, Maui, HI, USA, 19–24 June 2011; pp. 443–450. [Google Scholar]
  26. Borg, M.; Wang, K.; Collu, M.; Moan, T. A comparison of two coupled model of dynamics for offshore floating vertical axis wind turbines. In Proceedings of the ASME 33rd International Conference on Ocean, Offshore and Arctic Engineering, San Francisco, CA, USA, 8–13 June 2014. [Google Scholar]
  27. Beyer, F.; Choisnet, T.; Kretschmer, M.; Cheng, P.W. Coupled MBS-CFD Simulation of the Ideol Floating Offshore Wind Turbine Foundation Compared to Wave Tank Model Test Data. In Proceedings of the 25th International Ocean and Polar Engineering Conference, Kona, Big Island, HI, USA, 21–26 June 2015. [Google Scholar]
  28. Robertson, A.; Jonkman, J.; Masciola, M.; Song, H.; Goupee, A.; Coulling, A.; Luan, C. Definition of the Semisubmersible Floating System for Phase II of OC4 NREL/TP-5000–60601; National Renewable Energy Laboratory (NREL): Golden, CO, USA, 2014.
  29. Paquette, J.; Barone, M.; Paquette, J.; Barone, M. Innovative offshore vertical-axis wind turbine rotor project. In Proceedings of the EWEA 2012 Annual Event, Copenhagen, Denmark, 16–19 April 2012. [Google Scholar]
  30. Jonkman, J.M. Influence of control on the pitch damping of a floating wind turbine. In Proceedings of the 2008 ASME Wind Energy Symposium, Reno, NV, USA, 7–10 January 2008. [Google Scholar]
  31. Luan, C.; Gao, Z.; Moan, T. Modelling and analysis of a semi-submersible wind turbine with a central tower with emphasis on the brace system. In Proceedings of the 32nd International Conference on Ocean, Offshore and Arctic Engineering, Nantes, France, 9–14 June 2013. [Google Scholar]
  32. Jonkman, J.M.; Buhl, M.L., Jr. Loads Analysis of a Floating Offshore Wind Turbine Using Fully Coupled Simulation. In Proceedings of the Wind Power 2007 Conference & Exhibition, Los Angeles, CA, USA, 3–6 June 2007. [Google Scholar]
  33. Barooni, M.; Ali, N.A.; Ashuri, T. An open-source comprehensive numerical model for dynamic response and loads analysis of floating offshore wind turbines. Energy 2018, 154, 442–454. [Google Scholar] [CrossRef]
  34. Viselli, A.M.; Goupee, A.J.; Dagher, H.J. Model test of a 1:8-scale floating wind turbine offshore in the gulf of maine. J. Offsh. Mech. Arctic Eng. 2015, 137, 041901. [Google Scholar] [CrossRef]
  35. Jain, A.; Robertson, A.N.; Jonkman, J.M.; Goupee, A.J.; Swift, R.W. FAST code verification of scaling laws for DeepCwind floating wind system tests. In Proceedings of the 22nd International Offshore and Polar Engineering Conference, Rhodes, Greece, 17–22 June 2012; pp. 355–365. [Google Scholar]
  36. Michailides, C.; Gao, Z.; Moan, T. Experimental study of the functionality of a semisubmersible wind turbine combined with flap-type Wave Energy Converters. Renew. Energy 2016, 93, 675–690. [Google Scholar] [CrossRef]
  37. Li, L.; Gao, Y.; Hu, Z.Q.; Yuan, Z.M.; Sandy, D.; Li, H.R. Model test research of a semisubmersible floating wind turbine with an improved deficient thrust force correction approach. Renew. Energy 2018, 119, 95–105. [Google Scholar] [CrossRef]
  38. Zambrano, T.; Cready, T.M.; Kiceniuk, T. Dynamic modeling of deepwater offshore wind turbine structures in Gulf of Mexico storm conditions. In Proceedings of the 25th International Conference on Offshore Mechanics and Arctic Engineering, Hamburg, Germany, 4–9 June 2006; pp. 1–6. [Google Scholar]
  39. Shimada, K.; Miyakawa, M.; Ishihara, T. A Study on a Semi-Submersible Floating Offshore Wind Energy Conversion System. In Proceedings of the 16th International Offshore and Polar Engineering Conference, San Francisco, CA, USA, 28 May–2 June 2006; pp. 348–355. [Google Scholar]
  40. Robertson, A.N.; Jonkman, J.M.; Masciola, M.D.; Molta, P.; Coulling, A.J.; Goupee, A.J. Summary of Conclusions and Recommendations Drawn from the DeepCWind Scaled Floating Offshore Wind System Test Campaign. In Proceedings of the ASME 2013 International Conference on Ocean, Offshore and Arctic Engineering, Nantes, France, 9–14 June 2013. [Google Scholar]
  41. Coulling, A.J.; Goupee, A.J.; Robertson, A.N.; Jonkman, J.M.; Dagher, H.J. Validation of a FAST semi-submersible floating wind turbine numerical model with DeepCwind test data. Renew. Sustain. Energy 2013, 3. [Google Scholar] [CrossRef]
  42. Hall, M.; Goupee, A. Validation of a lumped-mass mooring line model with DeepCwind semisubmersible model test data. Ocean Eng. 2015, 590–603. [Google Scholar] [CrossRef]
  43. Masciola, M.; Robertson, A.; Jonkman, J.; Coulling, A.; Goupee, A. Assessment of the Importance of Mooring Dynamics on the Global Response of the DeepCwind Floating Semisubmersible Offshore Wind Turbine. In Proceedings of the Twenty-third International Offshore and Polar Engineering Conference, Anchorage, AL, USA, 30 June–5 July 2013. [Google Scholar]
  44. Roddier, D.; Cermelli, C.; Weinstein, A. WindFloat: A Floating Foundation for Offshore Wind Turbines-Part II: Hydrodynamic Analysis. In Proceedings of the 28th International Conference on Ocean, Offshore Mechanics and Arctic Engineering, Honolulu, HI, USA, 31 May–5 June 2009; pp. 1–9. [Google Scholar]
  45. Huijs, F.; Bruijn, R.D.; Savenije, F. Concept design verification of a semi-submersible floating wind turbine using coupled simulations. Energy Procedia 2014, 53, 2–12. [Google Scholar] [CrossRef]
  46. Zheng, X.Y.; Lei, Y. Stochastic Response Analysis for a Floating Offshore Wind Turbine Integrated with a Steel Fish Farming Cage. Appl. Sci. 2018, 8, 1229. [Google Scholar] [CrossRef]
  47. Jonkman, J.M. Dynamics Modeling and Loads Analysis of an Offshore Floating Wind Turbine; Technical Report NREL/TP-500–41958; The National Renewable Energy Laboratory: Lakewood, CO, USA, 2007.
  48. Ormberg, H.; Bachynski, E.E. Global analysis of floating wind turbines: Code development, model sensitivity and benchmark study. In Proceedings of the 22nd International Ocean and Polar Engineering Conference, Rhodes, Greece, 17–22 June 2012. [Google Scholar]
  49. Karimirad, M. Stochastic Dynamic Response Analysis of Spar-Type Wind Turbines with Catenary or Taut Mooring Systems. Ph.D. Thesis, Norwegian University of Science and Technology, Trondheim, Norway, 2011. [Google Scholar]
  50. Goupee, A.J.; Fowler, M.J.; Kimball, R.W.; Helder, J.; Ridder, E.J. Additional wind/wave basin testing of the DeepCwind semi-submersible with a performance-matched wind turbine. In Proceedings of the ASME 33rd International Conference on Ocean, Offshore and Arctic Engineering, San Francisco, CA, USA, 8–13 June 2014. [Google Scholar]
  51. Skaare, B.; Hanson, T.D.; Nielsen, F.G.; Yttervik, R.; Hansen, A.M.; Thomsen, K.; Larsen, T.J. Integrated dynamic analysis of floating offshore wind turbines. In Proceedings of the European Wind Energy Conference, Milan, Italy, 7–10 May 2007; pp. 7–10. [Google Scholar]
  52. Moriarty, P.J.; Hansen, C.A. AeroDyn Theory Manual; Technical Report; National Renewable Energy Laboratory: Golden, CO, USA, 2005.
  53. Jonkman, J.M.; Hayman, G.J.; Jonlman, B.J.; Damiani, R.R.; Murray, R.E. AeroDyn v15 User’s Guide and Theory Manual; National Renewable Energy Laboratory (NREL): Golden, CO, USA, 2016.
  54. Masciola, M.; Jonkman, J.; Robertson, A. Implementation of a Multi-segmented, Quasi-Static cable model. In Proceedings of the 23rd International Ocean and Polar Engineering Conference, Anchorage, AL, USA, 30 June–5 July 2013. [Google Scholar]
  55. Masciola, M.; Jonkman, J. Instructional and Theory Guide to the Mooring Analysis Program Phase I: The Multi–Segmented Quasi–Static Model; NREL Technical Report; National Renewable Energy Laboratory (NREL): Golden, CO, USA, 2013.
  56. Jonkman, J.M.; Robertson, A.N.; Hayman, G.J. HydroDyn User’s Guide and Theory Manual; National Renewable Energy Laboratory (NREL): Golden, CO, USA, 2015.
  57. Wang, H.; Hu, Z.Q.; Meng, X.Y. Dynamic Performance Investigation of a Spar-Type Floating Wind Turbine Under Different Sea Conditions. China Ocean Eng. 2018, 32, 256–265. [Google Scholar] [CrossRef]
  58. Butterfield, S.; Musial, W.; Scott, G. Definition of a 5-MW Reference Wind Turbine for Offshore System Development; Technical Report NREL/TP 500–38060; National Renewable Energy Laboratory (NREL): Golden, CO, USA, 2009.
  59. Kim, H.C.; Kim, M.H. Comparison of simulated platform dynamics in steady/dynamic winds and irregular waves for OC4 semi-submersible 5MW wind-turbine against DeepCwind model-test results. Ocean Syst. Eng. 2016, 1, 1–21. [Google Scholar] [CrossRef]
  60. Goupee, A.; Koo, B.; Lambrakos, K.; Kimball, R. Model tests for three floating wind turbine concepts. In Proceedings of the Offshore Technology Conference, Houston, TX, USA, 30 April–3 May 2012. [Google Scholar]
  61. Palm, J.; Moura Paredes, G.; Eskilsson, C.; Taveira Pinto, F.; Bergdahl, L. Simulation of mooring cable dynamics using a discontinuous galerkin method. In Proceedings of the V International Conference on Computational Methods in Marine Engineering, Hamburg, Germany, 29–31 May 2013. [Google Scholar]
  62. Liu, Y.Y.; Yoshida, S.; Yamamoto, H.; Toyofuku, A.; He, G.H.; Yang, S.H. Response Characteristics of the DeepCwind Floating Wind Turbine Moored by a Single-Point Mooring System. Appl. Sci. 2018, 11, 2306. [Google Scholar] [CrossRef]
  63. Christian, K.; Frank, L.; Friedemann, B.; Denis, M.; Po, W.C. Validation of INNWIND.EU Scaled Model Tests of a Semisubmersible Floating Wind Turbine. In Proceedings of the International Ocean and Polar Engineering Conference, Rhodos, Greece, 26 June–1 July 2016. [Google Scholar]
  64. Ramachandran, G.K.V.; Robertson, A.N.; Jonkman, J.M.; Masciola, M.D. Investigation of Response Amplitude Operators for Floating Offshore Wind Turbines. In Proceedings of the 23rd International Ocean, Offshore and Polar Engineering Conference, Anchorage, AL, USA, 30 June–5 July 2013. [Google Scholar]
Figure 1. Sketch of the models in AFWT.
Energies 12 01809 g001
Figure 2. Local coordinate system of the mooring lines.
Energies 12 01809 g002
Figure 3. Connection form of the multi-segment mooring lines.
Energies 12 01809 g003
Figure 4. Sketch of the original OC4 model.
Energies 12 01809 g004
Figure 5. Restoring forces as a function of the displacement for determining the stiffness of the system in (a) surge direction; (b) heave direction; and (c) pitch direction.
Energies 12 01809 g005
Figure 6. Dynamic response of the original Model 1 under the free decay condition calculated by FAST and AFWT: (a) surge decay; (b) heave decay; and (c) pitch decay.
Energies 12 01809 g006
Figure 7. Comparison of the surge and pitch responses between the experiment and AFWT under a regular wave: (a) surge response; and (b) pitch response.
Energies 12 01809 g007
Figure 8. Time domain curves of the surge motion of Models 1~4: (a) LC1; (b) LC2; and (c) LC3.
Energies 12 01809 g008
Figure 9. Time domain curves of the heave motion of Models 1~4: (a) LC1; (b) LC2; and (c) LC3.
Energies 12 01809 g009
Figure 10. Time domain curves of the pitch motion of Model 1–4: (a) LC1; (b) LC2; and (c) LC3.
Energies 12 01809 g010
Figure 11. Frequency domain curves of the surge PSD of the multi-segmented mooring line models: (a) LC4; (b) LC5; and (c) LC6.
Energies 12 01809 g011
Figure 12. Frequency domain curves of the heave PSD of the multi-segmented mooring line models: (a) LC4; (b) LC5; and (c) LC6.
Energies 12 01809 g012
Figure 13. Frequency domain curves of the pitch PSD of the multi-segmented mooring line models: (a) LC4; (b) LC5; and (c) LC6.
Energies 12 01809 g013
Figure 14. Time domain curves of the surge motion of the inclined upper column models: (a) LC1; (b) LC2; and (c) LC3.
Energies 12 01809 g014
Figure 15. Time domain curves of the heave motion of the inclined upper column models: (a) LC1; (b) LC2; and (c) LC3.
Energies 12 01809 g015
Figure 16. Time domain curves of the pitch motion of the inclined upper column models: (a) LC1; (b) LC2; and (c) LC3.
Energies 12 01809 g016
Figure 17. Frequency domain curves of the surge PSD of the inclined upper column models: (a) LC4; (b) LC5; and (c) LC6.
Energies 12 01809 g017
Figure 18. Frequency domain curves of the heave PSD of the inclined upper column models: (a) LC4; (b) LC5; and (c) LC6.
Energies 12 01809 g018
Figure 19. Frequency domain curves of the pitch PSD of the inclined upper column models: (a) LC4; (b) LC5; and (c) LC6.
Energies 12 01809 g019
Figure 20. Comparison of the surge motion of Model 1, 4, 6, and 7 in the time domain: (a) LC1; (b) LC2; and (c) LC3.
Energies 12 01809 g020
Figure 21. Comparison of the heave motion of Model 1, 4, 6, and 7 in the time domain: (a) LC1; (b) LC2; and (c) LC3.
Energies 12 01809 g021
Figure 22. Comparison of the pitch motion of Model 1, 4, 6, and 7 in the time domain: (a) LC1; (b) LC2; and (c) LC3.
Energies 12 01809 g022
Figure 23. Comparison of the statistics of the stationary motion of Model 1, 4, 6, and 7 from 400–600 s: (a) surge; (b) heave; and (c) pitch.
Energies 12 01809 g023
Figure 24. Comparison of the surge motion of Model 1, 4, 6, and 7 in the frequency domain: (a) LC4; (b) LC5; and (c) LC6.
Energies 12 01809 g024
Figure 25. Comparison of the heave motion of Model 1, 4, 6, and 7 in the frequency domain: (a) LC4; (b) LC5; and (c) LC6.
Energies 12 01809 g025
Figure 26. Comparison of the pitch motion of Model 1, 4, 6, and 7 in the frequency domain: (a) LC4; (b) LC5; and (c) LC6.
Energies 12 01809 g026
Table 1. Selected properties of the NREL 5MW baseline wind turbine.
Turbine PropertiesValue
Rotor configurationUpwind, 3 Blades
Rotor diameter126 m
Hub height above SWL90 m
Cut-in wind speed3 m/s
Rated wind speed11.4 m/s
Cut-out wind speed25 m/s
Rotor mass110,000 kg
Nacelle mass240,000 kg
Tower mass347,460 kg
Table 2. Platform properties in OC4.
ItemsValue
Depth to platform base below SWL (total draft)20.0 m
Elevation to platform top (tower base) above SWL10.0 m
Platform mass, including ballast13,473,000 kg
Displaced volume13,986.8 m3
Center of mass (CM) location below SWL14.4 m
Platform roll inertia about CM8.011 × 109 kg m2
Platform pitch inertia about CM8.011 × 109 kg m2
Platform yaw inertia about platform centerline1.391 × 1010 kg m2
Table 3. Key properties of mooring lines in OC4.
Mooring System PropertiesValue
Depth to anchors below SWL (water depth)200 m
Depth to fairleads below SWL14 m
Radius to anchors from platform centerline837.6 m
Radius to fairleads from platform centerline40.87 m
Unstretched mooring line length835.5 m
Mooring line diameter0.0766 m
Equivalent mooring line mass density113.35 kg/m
Equivalent mooring line mass in water108.63 kg/m
Equivalent mooring line extensional stiffness753.6 × 106 N
Seabed drag coefficient1.0
Table 4. Models examined in the present study.
NameSketch of the ModelsL1 (m)θ (°)
Model 1
(original OC4 model)
Energies 12 01809 i00100
Model 2 Energies 12 01809 i002900
Model 3 Energies 12 01809 i003700
Model 4 Energies 12 01809 i004500
Model 5 Energies 12 01809 i005015
Model 6 Energies 12 01809 i006030
Model 7 Energies 12 01809 i0075030
Table 5. Mooring line pretension of the different models.
Line 1 (N)Line 2 (N)Line 3 (N)
Model 11.11 × 10⁶//
Model 21.19 × 1066.68 × 1056.68 × 105
Model 31.24 × 1067.94 × 1057.94 × 105
Model 41.32 × 1061.25 × 1061.25 × 106
Model 51.11 × 10⁶//
Model 61.11 × 10⁶//
Model 71.32 × 1061.25 × 1061.25 × 106
Table 6. Mooring stiffness of each model.
Surge (N/m)Heave (N/m)Pitch (Nm/deg)
Model 173,04717,5341.213 × 106
Model 273,67617,6811.219 × 106
Model 377,55117,7761.228 × 106
Model 487,83217,9121.239 × 106
Model 573,30217,6411.217 × 106
Model 672,98617,6821.223 × 106
Model 789,90118,0251.245 × 106
Table 7. Natural period of each model.
Model 1Model 2Model 3Model 4Model 5Model 6Model 7
Surge(s)109.4108.9106.298.7109.2109.497.6
Heave(s)17.417.417.417.418.419.519.4
Pitch(s)26.026.026.025.926.026.026.1
Table 8. Load case definitions.
Load CaseWave ConditionH or Hs (m)T or Tp (s)Wind Condition
LC1Regular wave2.446.2Steady, uniform, Vhub = 8 m/s
LC2Regular wave5.328.4Steady, uniform, Vhub = 8 m/s
LC3Regular wave7.5610.6Steady, uniform, Vhub = 8 m/s
LC4Irregular wave3.57.2Steady, uniform, Vhub = 8 m/s
LC5Irregular wave5.59.4Steady, uniform, Vhub = 8 m/s
LC6Irregular wave7.511.6Steady, uniform, Vhub = 8 m/s
Table 9. Statistics of the stationary motion of the multi-segmented mooring line models.
DOFLoad CaseModel 1Model 2Model 3Model 4
Max.Min.MeanMax.Min.MeanMax.Min.MeanMax.Min.Mean
Surge
(m)
LC16.034.975.476.045.085.575.284.414.843.763.013.38
LC27.205.056.127.565.526.516.544.615.584.743.033.86
LC36.672.634.666.913.094.896.062.354.094.971.443.11
Heave
(m)
LC11.160.931.041.130.911.021.100.880.981.010.790.90
LC21.410.791.101.390.771.081.350.741.051.270.650.96
LC32.070.141.102.040.121.082.010.081.051.920.010.96
Pitch
(°)
LC11.871.601.742.011.761.882.021.771.892.031.771.90
LC22.691.011.852.881.212.042.891.222.052.901.222.05
LC33.160.401.763.310.511.883.310.521.893.310.531.90
Table 10. Amplitudes of the stationary motion of the multi-segmented mooring line models.
DOFLoad CaseModel 1Model 2Model 3Model 4
Surge (m)LC11.060.960.870.75
LC22.152.041.931.71
LC34.043.823.713.53
Heave (m)LC10.230.220.220.22
LC20.620.620.610.62
LC31.931.921.931.91
Pitch (°)LC10.270.250.250.26
LC21.681.671.671.68
LC32.762.802.792.78
Table 11. Surge, heave, and pitch PSDs of the multi-segmented mooring line models in the frequency domain.
DOFLoad
Case
Model 1Model 2Model 3Model 4
Frequency
(Hz)
PeakFrequency
(Hz)
PeakFrequency
(Hz)
PeakFrequency
(Hz)
Peak
Surge
(m2/Hz)
LC40.0103.5160.0102.6960.0112.9850.0130.520
LC50.0081.3250.0082.5310.0101.1650.0120.223
LC60.0101.8720.0082.2950.0101.590.0120.329
Heave
(m2/Hz)
LC40.0580.0220.0580.0220.0580.0210.0580.019
LC50.0580.0140.0580.0140.0580.0130.0580.012
LC60.0850.0960.0850.0950.0850.0950.0850.094
Pitch
(deg2/Hz)
LC40.0430.0430.0430.0430.0430.0430.0430.043
LC50.0430.1040.0430.1040.0430.1040.0430.104
LC60.0820.1250.0820.1230.0820.1220.0820.122
Table 12. Motion standard deviation of the multi-segmented mooring line models under irregular waves.
Load CaseDOFModel 1Model 2Model 3Model 4
LC4Surge (m)1.2761.2581.2110.707
Heave (m)0.0860.0860.0860.086
Pitch (°)0.2760.2730.2720.273
LC5Surge (m)1.0511.1911.0150.701
Heave (m)0.2560.2560.2560.256
Pitch (°)0.5880.5900.5900.591
LC6Surge (m)1.4011.5291.3731.041
Heave (m)0.5160.5160.5160.516
Pitch (°)0.7440.7530.7520.753
Table 13. Statistics of the stationary motion of the inclined upper column models.
DOFLoad CaseModel 1Model 5Model 6
Max.Min.MeanMax.Min.MeanMax.Min.Mean
Surge
(m)
LC16.034.975.476.014.995.486.075.015.54
LC27.205.056.127.185.096.137.235.166.19
LC36.672.634.666.642.624.686.692.714.72
Heave
(m)
LC11.160.931.040.910.710.800.09−0.080.01
LC21.410.791.101.180.550.860.36−0.270.05
LC32.070.141.101.83−0.100.861.01−0.910.05
Pitch
(°)
LC11.871.601.741.871.601.741.881.601.74
LC22.691.011.852.671.031.852.661.041.85
LC33.160.401.763.140.421.763.110.451.76
Table 14. Amplitudes of the stationary motion of the inclined upper column models.
DOFLoad CaseModel 1Model 5Model 6
Surge (m)LC11.061.021.06
LC22.152.092.07
LC34.044.023.98
Heave (m)LC10.230.20.17
LC20.620.630.63
LC31.931.931.92
Pitch (°)LC10.270.270.28
LC21.681.641.62
LC32.762.722.66
Table 15. Surge, heave, and pitch PSD statistics of the inclined upper column models in the frequency domain.
DOFLoad CaseModel 1Model 5Model 6
Frequency
(Hz)
PeakFrequency
(Hz)
PeakFrequency
(Hz)
Peak
Surge
(m2/Hz)
LC40.0103.5160.0103.3290.0103.329
LC50.0081.3250.0081.3070.0081.413
LC60.0121.8720.0121.6410.0121.574
Heave
(m2/Hz)
LC40.0580.0220.0550.0150.0520.002
LC50.0580.0140.0580.0100.1120.015
LC60.0850.0970.0850.0970.0850.092
Pitch
(deg2/Hz)
LC40.0430.0430.0430.0430.0430.043
LC50.0430.1040.0430.0970.0430.092
LC60.0820.0600.0820.0570.0820.051
Table 16. Motion standard deviation of the inclined upper column models under irregular waves.
Load CaseDOFModel 1Model 5Model 6
LC4Surge (m)1.2761.2441.264
Heave (m)0.0860.0750.042
Pitch (°)0.2760.2730.269
LC5Surge (m)1.0511.0301.040
Heave (m)0.2560.2570.232
Pitch (°)0.5880.5780.565
LC6Surge (m)1.4011.3771.381
Heave (m)0.5160.5190.514
Pitch (°)0.7440.7340.720
Table 17. Motion standard deviation of Models 1, 4, 6, and 7 under irregular waves.
Load CaseDOFModel 1Model 4Model 6Model 7
LC4Surge (m)1.2760.7071.2640.706
Heave (m)0.0860.0860.0420.042
Pitch (°)0.2760.2730.2690.272
LC5Surge (m)1.0510.7011.0400.702
Heave (m)0.2560.2560.2320.231
Pitch (°)0.5880.5910.5650.578
LC6Surge (m)1.4011.0411.3811.039
Heave (m)0.5160.5160.5140.513
Pitch (°)0.7440.7530.7200.744

