Abstract
In recent years, with the increase of annual average temperature and the decrease of annual precipitation in Beijing, the fragility of Beijing’s energy system has become more and more prominent, especially the balance of electricity supply and demand in extreme weather. In the context of unstable supply of new and renewable energies, it is imperative to strengthen the ability of the energy system to adapt to climate change. This study first simulated climate change in Beijing based on regional climate data. At the same time, the Statistical Program for Social Sciences was used to perform multiple linear regression analysis on Beijing’s future power demand and to analyze the impact of climate change on electricity supply in both the RCP4.5 and RCP8.5 (representative concentration pathway 4.5 and 8.5) scenarios. Based on the analysis of the impact of climate change on energy supply, a multi-objective optimization model for new and renewable energy structure adjustment combined with climate change was proposed. The model was then used to predict the optimal power generation of the five energy types under different conditions in 2020. Through comparison of the results, it was found that the development amount and development ratio of various energy forms underwent certain changes. In the case of climate change, the priority development order of new and renewable energies in Beijing was: external electricity > other renewable energy > solar energy > wind energy > biomass energy. The energy structure adjustment program in the context of climate change will contribute to accelerating the development and utilization of new and renewable energies, alleviating the imbalance between power supply and demand and improving energy security.
1. Introduction
Due to the non-renewability of fossil energy, its large-scale development and utilization has led to the depletion of limited resources [1]. At the same time, in the process of its development and utilization, fossil energy also brings serious environmental and economic problems such as climate warming and ecological destruction [2]. These create challenges for the sustainable development of human society in the future. As a modern international metropolis, it is imperative that Beijing develops new green energies. During the period of the 12th Five-Year Plan, Beijing has achieved positive results in the development of new and renewable energies [3]. However, gaps remain in terms of the development requirements for accelerating the construction of green and low carbon energy options, safety and efficiency, and covering urban and rural modern energy systems [4]. The main performance gaps are as follows: First, the proportion of new and renewable energy consumption is still low, the degree of integration with conventional energy systems is not high, and the development of key regional resources is insufficient [5]; Second, policies and regulations, market mechanisms etc. need to be further improved, and the development environment for new and renewable energies needs to be optimized [6]; Third, the levels of independent innovation, core key technology research, and transformation of results still need to be further improved, and high-end industries such as R&D and services need to be strengthened [7]. Therefore, in order to promote the green, intelligent and efficient transformation of urban energies, accelerating the development and utilization of new and renewable energies is of great significance.
In the past, the development and utilization of new and renewable energies has had serious problems such as the heavy investment required for construction, light planning management, heavy requirements for technology advancement, and light overall planning [8]. As a result, the energy structure was seriously unbalanced, and its development was greatly restricted. New and renewable energies cannot form a scale effect or form a synergy with traditional energies, and cannot fully substitute for, or even exert a supplemental effect on, traditional energies [9]. Therefore, it is particularly important to comprehensively consider the multi-level goals of society, the economy and the environment, and to implement total control in optimizing the development structure ratio of various energy forms according to pre-established new and renewable energy development goals [10]. In addition, on the one hand, climate change has led to a significant increase in the frequency of extreme weather (high temperature phenomena) in Beijing, and an increase in electricity demand (especially peak) [11], increasing the imbalance between power supply and demand. On the other hand, climate change has triggered dramatic changes in meteorological factors such as wind speed, light and precipitation [12], which may affect the output of wind power, photovoltaic power and hydropower. These changes will increase the complexity of the issues involved in Beijing’s power system management and planning, and will bring further impacts for the balance of power supply and demand and energy security.
In the past few decades, domestic and foreign scholars have carried out many studies on the impact of climate change on energy supply and demand. In terms of the impact of climate change on energy demand, Ruth and Lin used dynamic computer modeling and time series analysis to analyze energy and power demand in the USA [13]; Nateghi and Mukherjee established a multi-paradigm framework for estimating the climate sensitivity of end-use energy demand in Indiana [14]; Auffhammer et al. applied temperature response functions and a global climate model to simulate the relationship between electricity demand and temperature in the USA [15]. In most cases, existing literature has analyzed the impact of climate change (especially temperature variation) on energy demand. However, this effect has rarely been incorporated into design studies for subsequent energy structure adjustment programs. In terms of the impact of climate change on energy supply, Pašičko et al. used a global climate model to assess renewable energy supply in Croatia [16]; Crook et al. studied photovoltaic and solar power output based on an ocean-atmosphere climate model [17]; and Lucena et al. developed a generation system simulation model to analyze renewable energy production in Brazil [18]. Many previous studies have analyzed the impact of changes in meteorological elements (wind speed, radiation, and precipitation) on energy supply, but few of these effects have been incorporated into the optimization model for energy structure adjustment. Examples of the application of optimization techniques in energy structure design and allocation fields [19,20,21,22,23,24] include Schmidt et al. who assessed the environmental effect in Brazil by optimizing the daily dispatch of energies [19]; Kocaman et al. constructed an optimal sizing relationship of energy generation to ease concerns about electricity generation [20]; Pereira et al. proposed a mixed integer optimization model to evaluate costs and CO2 emissions of electricity generation [21]; Dong et al. developed a Bayesian interval robust energy system optimization method for a regional energy system planning model [22]; Prebeg et al. proposed a two-level approach with multi-objective optimization at the global level, which was used to design a Croatian Energy System [23]; and Yu et al. developed an interval-stochastic basic-possibilistic programming method for planning sustainable energy systems, which could facilitate analysis of the tradeoff between economic objective and pollutant mitigation [24]. Previous studies have shown that the optimization method was suitable for dealing with energy planning and management issues. It helped decision-makers to determine the optimal energy development and structural adjustment programs, under resource and environmental constraints, necessary in order to meet users’ power needs. However, past research has often focused on the study of optimization algorithms and some key model parameters were based mostly on predictions and estimates. In addition, the interaction between climate change and energy supply and demand was also often overlooked in past research. In fact, the sharp increase in electricity demand caused by climate change and the volatility of new energy supplies caused by changes in meteorological factors (including wind speed, radiation and precipitation), will bring further impacts on the balance of power supply and demand [25].
There are several relevant published works in the literature which focus on this topic for developed countries, whereas other places such as Beijing have not been fully investigated. Under the conditions of climate change, Beijing’s power load and energy demand are increasing. Previous studies have isolated load simulations, output predictions, and operational mechanisms, and conducted separate studies without correlating these. Based on the existing planning and policies in Beijing, qualitative and quantitative analysis of energy supply and demand under climate change conditions were undertaken in this paper. Then, the results of load simulation and output prediction were used as inputs for the optimization model, which can ensure the rationality of the final scheme. The results obtained using this model will help improve the ability of Beijing’s power system to adapt to climate change and help decision-makers understand the current energy supply and demand situation in Beijing.
2. Analysis of the Impact of Beijing Power Supply and Demand
2.1. Study Framework
Beijing’s energy input and consumption are typical of its status as an international metropolis. Moreover, its energy resources are relatively scarce, therefore, climate change has a more obvious impact on its energy supply and demand. At present, Beijing’s research on the adaptation of urban energy systems to climate change is just beginning. However, the substitution of new energy and renewable energy for traditional energy sources is crucial for Beijing’s energy security and the balance of power supply and demand.
This study used climate simulation and regression analysis to analyze electricity demand under climate change conditions. At the same time, the supply of new and renewable energies was calculated for two climate change scenarios. Based on the analysis and calculation of data, a multi-objective optimization model for a new and renewable energy structure under climate change conditions was constructed. Figure 1 provides the establishment process for the Beijing new and renewable energy structure optimization model under climate change conditions.
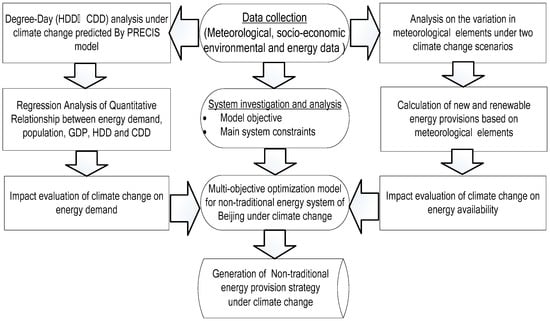
Figure 1.
Establishment of Beijing new and renewable energy structure optimization model under climate change conditions.
2.2. Analysis of the Impact of Climate Change on Beijing Power Demand
2.2.1. Analysis of Temperature Variation in Beijing
Extreme weather can be expressed as a meteorological phenomenon in which one or several climate variables exceed specified values or conventional observations [26]. According to the latest assessment report released by the Intergovernmental Panel on Climate Change (IPCC) [27], the statistics and comparison results of the past 50 years showed that extreme weather events, especially heavy rainfall and high temperature, displayed a significant trend with higher frequencies and stronger disruptions. The report predicted that these extreme events will appear more frequently in the future. In July 1999, high temperature weather of around 40 °C occurred continuously in Beijing, when the highest temperature exceeded 37 °C for four days. The highest temperature reached was 42.2 °C, and the surface temperature at the urban station exceeded 60 °C. On 24 July 1999, temperatures in some areas were above 42 °C. On 21 June 2016, Beijing issued the first high-temperature yellow warning for 2016, and this was followed by high-temperature weather across multiple time periods. As the temperature increased, the cooling load continued to climb all the way. In the summer of 2000, a 40 °C high temperature alarm was issued, Beijing’s temperature broke a 160-year record in July, and the cooling load soared, causing Beijing’s power grid to have to withstand the highest load in its history.
Based on historical temperature data from 1951 to 2012, Figure 2 and Figure 3 show the temperature variation in Beijing over the past 60 years. As shown in Figure 2, the highest and the lowest temperatures in Beijing increased between 1951 and 2012. The minimum temperature increased from −20 °C in the 1950s to around −11 °C after 2000. The maximum temperature rose from 39 °C in the 1950s to around 40 °C after 2000. It can be seen from Figure 3 that the temperatures from the 1950s to 1960s in Beijing were mostly higher than or equal to 35 °C, and began to decline in the 1970s and 1980s, with high temperature days continuing to increase after the 1990s. The high temperature days, with temperatures greater than or equal to 38 °C, also increased significantly after the 1990s. Regional climate simulation results showed that the annual maximum and minimum temperatures in Beijing were increasing, and the maximum temperature was above 35 °C. Therefore, in the future, there will be a high possibility of high temperature weather, and even extremely high temperature weather, in Beijing. Thus, it is imperative to identify power demand under extreme weather conditions in Beijing.
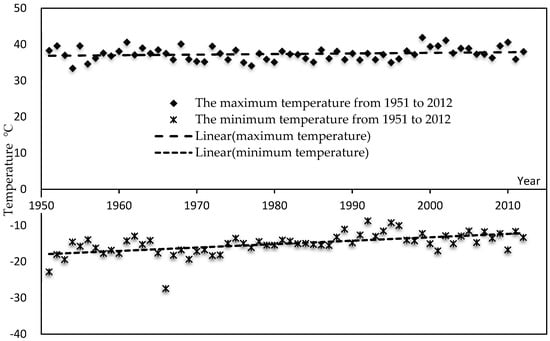
Figure 2.
Trends of annual maximum and minimum temperatures from 1951 to 2012.
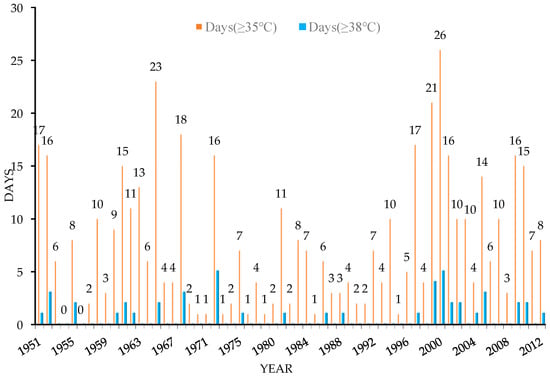
Figure 3.
The number of days of temperature greater than or equal to 35 °C (38 °C).
2.2.2. Impact of Climate Change on Heating and Cooling Energy Consumption
In recent years, many scholars have used degree-day as a time temperature index that reflects the energy demand for heating and cooling [28]. The degree-day analysis method is used as a basic method for studying the relationship between temperature and energy, and is widely used in various fields [29]. The degree-day is defined as the difference between the specified base temperature and the average temperature of the daily series. It is divided into two types: heating degree-day (HDD) and cooling degree-day (CDD) [30]. The formulae for calculating the values of HDD and CDD in a given year are as follows:
where Nd is the number of days in a year; Ti is the daily average temperature, °C; Tb is the base temperature (balance point temperature, °C); γd is 1 if the daily average temperature is higher than the base temperature, otherwise, it is 0; HDD is the heating degree-day value of a given year. CDD is the heating degree-day value of a given year.
According to the "Notice of the General Office of the State Council on Strictly Implementing Temperature Control Standards for Air-Conditions of Public Buildings" promulgated in June 2007, combined with the winter heating and summer cooling requirements of Chinese residents, the basic temperature of China’s HDD should be maintained at 5 °C. Under this condition, the indoor temperature is above 10 °C, which meets the heating requirements of residents. Similarly, the basic temperature of the summer CDD should be maintained at 26 °C to meet the normal living demands of residents. In this paper, HDD and CDD were used as quantitative indicators of heating energy consumption and cooling energy consumption respectively. Developed by the Met Office Hadley Centre, the PRECIS regional climate model has been widely utilized to produce detailed temperature projections [31] owing to its high-resolution, ease of use, and wide suitability in any chosen region of the world. At the same time, based on the regional temperature simulation results of PRECIS, the daily minimum and maximum temperature values for the next three periods (2011–2030, 2046–2065, 2080–2099) in Beijing were predicted [31]. As shown in Table 1, HDD values showed a downward trend and CDD values increased from 1951 to 2012. Under the two emission scenarios (RCP4.5 and RCP8.5 (representative concentration pathway 4.5 and 8.5)), HDD values will decline and CDD values will rise from 2020 to 2099. It can be seen that under the circumstances of extreme high temperature climate in the future, Beijing’s heating energy consumption will continue to decrease, while cooling energy consumption will continue to rise.

Table 1.
Heating degree-day (HDD) values and cooling degree-day (CDD) values in different periods and under different scenarios.
2.2.3. Beijing Power Demand Forecast Based on Linear Statistical Theory
Firstly, based on historical data, multiple linear regression analysis was performed using the Statistical Program for Social Sciences (SPSS) to determine the response relationship between HDD, CDD, population, GDP, and electricity demand. Then, according to the HDD and CDD prediction results, Beijing’s electricity demand under future climate change conditions was determined. Finally, HDD and CDD were calculated by using the average annual temperature to predict future power demand. By comparing these with the power demand predicted by two emission scenarios in future years—2020s (2011–2030), 2060s (2046–2065) and 2090s (2080–2099)—the impact of climate change on energy and power demand can be obtained. In order to further reveal the relationship between HDD, CDD, population, GDP and power demand in Beijing, the historical data of the above parameters from 1978 to 2015 in Beijing were selected as independent and dependent variables. At the same time, multiple linear regression analysis of its relationship was performed using SPSS. The regression equation between power demand and each variable is as follows:
where D is the annual total energy or electricity demand of the society (100 million kWh); HDD is the annual average of heating degree-day (dimensionless); CDD is the annual average of cooling degree-day (dimensionless); GDP is the annual gross domestic product (100 million yuan); P is the total population at the end of the year; and a, b, c, d, e are equation parameters.
Following the SPSS calculation, it can be seen from Table 2 that the input variables and output variables meet the predetermined requirements. The value of R2 in the model summary reached 0.985, the correction was 0.983, and the fit was good. The significance value in the analysis of variance section of the table was less than 0.05, which indicates that the level of significance of the equation is higher. In the coefficient section of the table, the population coefficient was significant, but the HDD variable was relatively low. The electricity demand for Beijing’s three representative periods (2020s, 2060s and 2090s) is predicted for the next 100 years according to the equations obtained from the regression analysis. The future population and GDP were predicted according to the “Outline of the 13th Five-Year Plan for National Economic and Social Development of Beijing” and “Beijing Urban Master Plan (2004–2020)” [32,33]. The parameters and results used in the prediction process are shown in Table 3.
Table 2.
SPSS multiple linear regression analysis results.
Table 3.
Population and GDP forecast for Beijing in 2020, 2060, and 2099.
Table 4 provides a comparison of Beijing’s electricity consumption between climate change prediction and non-climate change prediction under two emission scenarios (HDD and CDD values were calculated using the mean values from 1951 to 2016). Whether or not climate change was considered, the total electricity consumption of Beijing will increase in the future, compared with 95.27 billion KWh at the end of 2015, as shown in Table 4. Compared with the RCP4.5 scenario, the total societal power consumption in the RCP8.5 scenario will increase significantly. The comparison of total societal power consumption between climate change and non-climate change analyses, found that the difference in the 2020s was small, the difference in the 2060s reached 3.918–8.337 billion kWh, and the difference in the 2090s increased to 8.881–15.764 billion KWh. In summary, climate change will have a significant impact on Beijing’s future total electricity demand. Beijing’s energy structure is dominated by external electricity. Coupled with the impact of climate change, the increase in urban electricity demand will bring great difficulties for Beijing’s power system management and planning. Therefore, in the process of generating a power structure adjustment strategy in Beijing, the impact of changes in power demand should be fully considered in order to generate a safe, reliable, and stable power supply scheme. This scheme is particularly important to reduce the impact and loss of social and economic development caused by the insufficient supply of electricity.
Table 4.
Beijing’s electricity demand forecast in 2020, 2060, and 2099.
2.3. Impact of Climate Change on Beijing’s New and Renewable Energy Electricity Supply
2.3.1. Impact of Climate Change on Wind Power Generation
1. Wind speed change
According to the average wind speed change in Beijing over the years, combined with the regional climate simulation results, it was determined that the average wind speed in future showed a significant downward trend. An average decrease of 0.19 m/s every 10 years may result in a decline in wind power generation in the future. The degree of decline is determined by referring to the wind turbine output calculation formula [34].
where Vci represents the cut-in wind speed of the wind turbine, m/s. When the wind speed is higher than this value, the automatic device integrates the wind turbine into the grid to prepare for power generation; Vco indicates the cut-out wind speed of the wind turbine, m/s. When the wind speed is higher than this value, the wind turbine stops generating electricity and it is disconnected from the grid. VR is the rated wind speed, m/s. When the wind speed is greater than or equal to this value and less than the cut-out wind speed, the wind turbine output is the rated output power. Vt is the wind speed at t time, m/s; PWR is the rated output power of the wind turbine, KW. According to wind turbine selection and future rated power design, Vt is the predicted wind speed, 4.5 m/s, Vci is the cut-in wind speed specified by the wind turbine, 3 m/s, and Vr is the rated wind speed specified by the wind turbine, 10.5 m/s.
2. Estimation of maximum wind power generation
According to the relevant development policies and goals of Beijing’s new and renewable energies, wind power generation is expected to reach 1106.95 million KWh in 2020. When considering climate change conditions, wind power generation decreases. The power generation for RCP8.5 and RCP4.5 was 996.255 million KWh and 1040.533 million KWh, respectively.
2.3.2. Impact of Climate Change on Photovoltaic Power Generation
1. Sunshine
According to the changes of the total solar radiation in Beijing over the years, combined with the simulation results of the regional climate model, it was determined that the total radiation in future showed a downward trend. The average rate of decline was approximately 23.50 (MJ/m2)/a. A decrease in total radiation may result in a reduction in photovoltaic power generation. At present, there are many methods for calculating the annual average power generation of photovoltaic power plants, including the standard method, component area method, standard solar radiation hour method and empirical coefficient method. This paper selected the standard method to calculate the output of photovoltaic power plants [35], and determine the degree of decline in photovoltaic power generation.
where HA is the total annual solar radiation amount (KWh/m2); PAS is the system installation capacity, KW; K is the comprehensive efficiency coefficient.
2. Estimation of maximum photovoltaic power generation
Beijing is located in a region with abundant solar energy resources. In the future, it will focus on the widespread application of distributed photovoltaic power generation and solar water heating systems, and vigorously promote the implementation of the “Sunshine Double Hundred” program. Therefore, the amount of photovoltaic power generation will be greatly improved, and it is expected to reach a maximum of 1398 million KWh. Taking climate change into account, photovoltaic power generation declines. The photovoltaic power generation for RCP8.5 and RCP4.5 was 1300.14 million KWh and 1356.06 million KWh, respectively.
2.3.3. Impact of Climate Change on Biomass Power Generation
Based on relevant data, it is known that due to the impact of climate change, especially the increase in temperature, the area where total production of crop straw resources in China has increased significantly is mainly concentrated in North China, where there has been an obvious increase in production of more than 15%. In the future, Beijing will actively promote the construction of waste incineration power generation projects in Shunyi, Tongzhou and Fangshan, and make full use of the landfill gas resources of existing landfills to promote the construction of landfill gas power generation projects. Therefore, in 2020, biomass power generation is expected to reach a maximum of 1505 million KWh. Under the conditions of climate change, the biomass power generation for RCP8.5 and RCP4.5 was 1730.75 million KWh and 1580.25 million KWh, respectively.
2.3.4. Impact of Climate Change on External Electricity
By reviewing the data, it was concluded that the increase in temperature and storm intensity may reduce the transmission efficiency of the grid and increase the risk of physical damage. Therefore, the total supply of external electricity will decline under climate change conditions. In 2020, it is expected that external power will reach 10000 million KWh. Under the conditions of climate change, the external electricity generation for RCP8.5 and RCP4.5 was 9400 million KWh and 9800 million KWh, respectively.
2.3.5. Impact of Climate Change on Other Renewable Energies (Ground Source Heat Pumps and Hydropower)
The ground temperature is positively correlated with the surface temperature, and the precipitation intensity in Beijing is fluctuating and decreasing. However, the scale of hydropower in Beijing is limited and mainly concerns development of existing hydropower resources. Therefore, ground source heat pumps are developing rapidly. Geothermal heat pump systems are preferred in the new regional municipal infrastructure special plan. In 2020, the maximum power generation is expected to reach 8760 million KWh. In general, climate change has led to an increase in its supply. The generation of other renewable energy for RCP8.5 and RCP4.5 was 10,950 million KWh and 10,074 million KWh, respectively.
Table 5 provides the maximum supply of new and renewable energies in Beijing in 2020 (target year) without considering climate change. Table 6 summarizes the maximum supply of renewable energies in Beijing under climate change conditions and effectively reflects the impact of changes in meteorological elements on new and renewable energy supply. This provides good support for the future development of reasonable and effective energy structure adjustment programs in order to avoid an imbalance between energy supply and demand.
Table 5.
Maximum electricity supply without considering climate change conditions in 2020.
Table 6.
Maximum supply of new and renewable energies under climate change conditions (million KWh).
3. Methodology
This study used the PRECIS model (Providing Regional Climates for Impacts Studies), statistical regression analysis, and scenario analysis technology to comprehensively analyze Beijing’s electricity supply and demand. Based on the above research results of climate change impact, this study used 2015 as the base year to build a structural optimization model for Beijing’s new and renewable energies in 2020 under climate change conditions. In order to examine the impact of climate change on energy structure adjustment, the impact of changes in meteorological elements on the maximum supply of various energy forms was combined into the power generation limit constraint (6a). In addition, combined with the proportion of future new and renewable energy generation, the impact of temperature change on electricity demand was combined with the power supply and demand balance constraint (6b). The specific form is as follows:
Income function:
Carbon emission objective function:
Development proportional objective function:
where refers to the annual development amount of the renewable energies form i, which is the decision-making variable, (100 million kWh). is the elasticity coefficient of the income function. is the elastic coefficient of the carbon emission objective function; is the coefficient of elasticity of the development proportional objective function; is the unit income of the development energy form i (yuan/kWh). is CO2 emissions of the development and utilization of unit energy x, (g/kWh).
Main constraint conditions:
3.1. Requirements and Endowment Constraints
3.2. Technical Constraints
3.3. Economic Constraints
3.4. Environmental Constraints
3.5. Security Constraints
Finally, based on all of the above constraints, a set of optimization models for Beijing’s new and renewable energy structure adjustment under climate change conditions was constructed.
4. Results and Analysis
4.1. Optimization Analysis of a New and Renewable Energy Structure in Beijing without Consideration of Climate Change Conditions
Three different weight combinations were designed to compare the structural changes of energy development without considering climate change: economy as the priority, environment as the priority and the balanced development of each objective. When the economy was prioritized, the weight coefficients of the objective function were taken as ωf = 0.5, ωg = 0.25, ωh = 0.25, the power generation cost coefficient was 0.75, the economic factor coefficient was 1.25, and the index constraint coefficients of the remaining constraints were taken as 1. When the environment was prioritized, the weight coefficients of the objective function were taken as ωf = 0.25, ωg = 0.5, ωh = 0.25, the carbon emission constraint coefficient and the solid waste emission coefficient were both 0.75, the environmental factor constraint coefficient was taken as 1.2, and the index constraint coefficients of the remaining constraints were taken as 1. In the balanced development of each objective, the weight coefficients of the objective function were taken as ωf = 0.33, ωg = 0.33, ωh = 0.33, the technology factor, economy factor and environment factor were taken as 1.15, and the index constraint coefficients of the remaining constraints were taken as 1. According to Beijing’s new and renewable energy development goals, during the 13th Five-Year Plan period, the generation of new and renewable energies should account for more than 15% of the total power generation. Combined with the forecast total electricity consumption in Beijing in 2020, it was determined that the generation of new and renewable energies should exceed 15 billion KWh when climate change was not considered.
As shown in Figure 4, when the impact of climate change was not considered, under the condition that economic development was dominant, the development amount of biomass energy remained at the 2015 level. The reason is that the unit revenue of biomass energy is low (0.35 yuan/kWh) and its installed capacity is the minimum [36], which is not conducive to meeting the requirements of maximizing the economic benefits of the objective function. The development amount of external electricity reached the maximum allowable value. The development amount of other renewable energies also increased. There are some reasons that explain this. Firstly, the unit income of external green power is the highest (0.8 yuan/kWh), which is conducive to the maximization of the objective function. The unit income of other renewable energies is also higher (0.35 yuan/ kWh), which also contributes to the maximum economic benefit. Secondly, external green power and other renewable energies have the highest energy conversion rate. The energy conversion rate of other renewable energies exceeds 70%, which helps to save power generation costs and make it more economical [37]. At the same time, the optimization results also indicate that two forms of energy are temporarily limited by the amount of energy available, but there is still more room for development, and the primary consideration is to develop such energy. The development of the other two forms of energy, wind and solar energy, also increased significantly compared to 2015, reaching 366.2413 million kWh and 343.7485 million kWh, respectively. This is mainly due to the high technical maturity of wind energy, which can reach second place in the technical maturity of the five energies [38,39]. However, the development time of wind energy is shorter, and its power generation cost is higher (0.43 yuan/kWh), so it fails to reach the maximum development amount. Solar energy has a higher unit income (0.45 yuan/KWh), but its energy stability index and energy conversion rate are lower, so it is also not up to the maximum development amount.
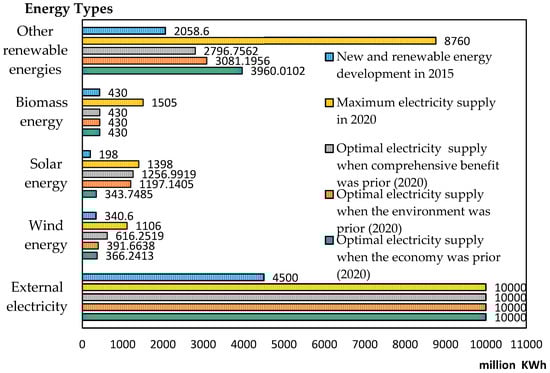
Figure 4.
New and renewable energy electricity supply without considering climate change conditions.
If the environment impact was dominant, biomass energy development was at the base year level. This is because the solid waste emission of biomass energy is ranked first among the five energies [36]. Additionally, the carbon emission (10 g/KWh) and other environment impacts of wind energy are second only to biomass energy, which is not conducive to the realization of the goal of minimizing pollutant emissions [39]. Therefore, its growth is limited. When the development amount of external electricity reached the maximum value, the development amount of solar energy was also significantly improved. This is mainly because the carbon emission and solid waste emission of external electricity are the lowest, and other environment impacts generated are the smallest, in the same period. The carbon emission and solid waste emission of solar energy are at a low level, and other environment impacts are second only to external electricity. The development amount of other renewable energies has increased compared to 2015. This is due to the fact that the carbon emission (3.9 g/KWh) of other renewable energies is second only to external green power, but their solid waste emissions are only at a medium level, so they did not reach the maximum development amount.
Under the condition of balanced development of various targets, the energy development structure was similar to the condition of giving priority to environment impact. The development amount of external electricity reached the maximum exploitable value, while the development of biomass energy remained at the 2015 level. Solar energy development grew by a large margin. This is because the external green power has the highest unit revenue and the lowest carbon emission and solid waste emission, so it has a large advantage in all energy types. Additionally, the unit income, development safety and other environment impacts of solar energy are second only to external electricity. At the same time, the solid waste emission and carbon emission in the solar energy development process are at a medium level, so its comprehensive score is higher. The unit revenue of biomass energy is ranked second to the bottom and it has the highest solid waste and carbon emissions [35], so its overall score is the lowest. The development amount of wind energy and other renewable energies was higher than that of 2015, but they did not reach the maximum. The reason is that the solid waste emission of wind energy is second only to that of external electricity and its carbon emission is at the middle level [39], but its unit income is the lowest. Therefore, the development amount of this energy increased slightly but did not reach the maximum exploitable amount. The technical maturity of other renewable energies is relatively low, and its other environmental impacts may be greater in the process of development [37]. Therefore, its comprehensive effect is similar to that of wind energy.
Under the conditions of the three different weight combinations, the improved energy structure optimization model was used to predict the Beijing’s optimal power supply in 2020. Through the analysis and comparison of energy optimization results under different conditions, this model has a great contribution to make to understanding the future development of energy supply and demand and improving energy stability in Beijing. At the same time, it also lays the foundation for Beijing’s energy supply and demand with climate change.
4.2. Optimization Analysis of New and Renewable Energy Structure in Beijing with Consideration of Climate Change Conditions
Under the RCP8.5 and RCP4.5 scenarios, this study gave the power generation for five energy forms when the economic benefit was given priority. In the case of climate change, the priority order for the development and use of new and renewable energies in Beijing, in the two different scenarios was: external electricity > other renewable energies > solar energy > wind energy > biomass energy.
As shown in Figure 5 and Figure 6, the proportion of external electricity development reached more than 48% of the entire energy system in two scenarios. Furthermore, its development amount reached the maximum developable amount (9.4 billion KWh, 9.8 billion KWh), which was significantly higher than other energies. The main reason is that external electricity is less affected by climate change. It has the lowest development cost, the highest unit revenue, the highest energy conversion rate and technology maturity, and the least solid waste and carbon emissions generated during the development process. In addition, Beijing also has some policy support for the introduction of external electricity, which is the main measure to slow down Beijing’s power supply in the future. Biomass energy is also less affected by climate change, but its unit income is ranked fourth and economic factor is ranked fifth, which is not conducive to maximizing economic benefits. Therefore, its development amount stayed at the 2015 level.
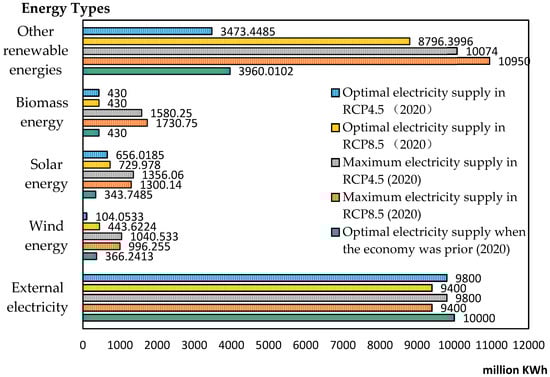
Figure 5.
Optimal electricity supply for new and renewable energies when considering climate change conditions.
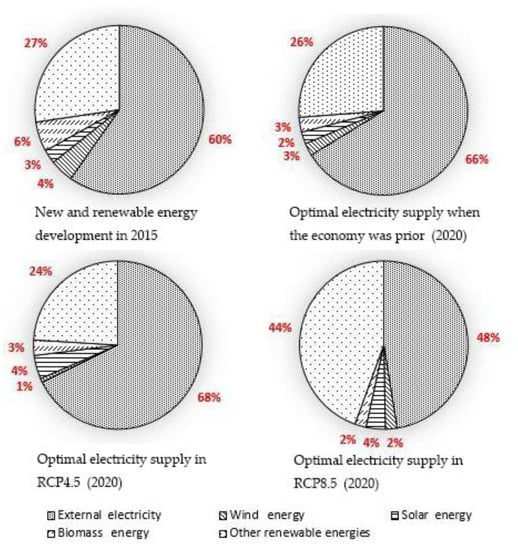
Figure 6.
Changes in the proportion of electricity supply for new and renewable energies.
The development amount of wind, solar and other renewable energies increased compared to 2015. The development amount of other renewable energies in the two scenarios can reach 8796.3996 million KWh, 3473.4485 million KWh, respectively. In the RCP8.5 scenario, its proportion was more than 44.43%, which was much higher than that in the RCP4.5 scenario. This is because this energy form has the lowest power generation cost, the highest energy conversion rate, and its installed capacity can reach 2 million KW in 2020. However, due to its low technical maturity [37], its development amount increased significantly, but it did not reach the maximum exploitable amount. Under the condition of climate change, the solar energy development amount in the two scenarios reached 729.978 million KWh and 656.0185 million KWh, respectively. Although it did not reach the maximum developable amount, it still increased. This is because there is a certain degree of policy support and market demand for the application of solar energy heating and photovoltaic power generation in Beijing [40]. Its installed capacity in 2020 can reach 1.165 million KW, which is about 10 times that of the base year. The development amount of wind energy in the two scenarios was higher than that in 2015. The reason is that the unit revenue of wind energy is low, and the energy conversion rate is also low. However, its technology maturity is high, and its pollutant emission is small. Therefore, under the influence of developing proportional objective function, its development amount still increased.
Comparing the two optimization results with or without considering climate change, we can see that the development amount and ratios of external electricity, wind energy, solar energy and other renewable energies changed. Among them, although the development amount of external electricity declined, it was always at the maximum exploitable amount (9400 million kWh and 9800 million kWh). This is because its unit revenue, carbon emission, solid waste emission, energy conversion rate and other factors bring the greatest comprehensive advantages. However, due to climate change, the maximum energy supply for external electricity was reduced. When considering climate change, the development amount of other renewable energies in the RCP8.5 scenario was significantly higher than that without considering climate change conditions and RCP4.5 was not much different. The main reason is the rapid increase in the total energy demand. At the same time, external electricity cannot meet the power demand of social production and life, and the development and utilization of other renewable energies is preferred. Therefore, under the constraints, the development of other renewable energies in the RCP8.5 scenario significantly improved. When considering climate impacts, the development amount of wind and solar energy was higher than that without considering climate impacts. Although wind energy and solar energy were greatly affected by meteorological factors such as effective wind speed and radiation, climate change led to an increase in total electricity demand and a decline in total energy development. The development of external electricity and other renewable energies alone was insufficient to meet energy demand, so both wind and solar power generation increased. Although climate change is conducive to the increase of biomass energy reserves, biomass energy is subject to the disadvantages in its own development process, and its development is not supported. Thus, biomass energy maintained its development at the 2015 level. In summary, new and renewable energies will play a large role in Beijing’s future power supply process. This is of great significance for accelerating the development and utilization of new and renewable energies, alleviating the imbalance between power supply and demand, and improving energy security.
All the above predicted results of Beijing’s optimal power supply under climate change conditions were based on the improved energy structure optimization model. Through the comparison of the two sets of results, it is found that the proportion and development of Beijing’s future energy development will change. Therefore, these results provide comprehensive guidance for energy security and the balance of Beijing’s power supply and demand in the future.
5. Conclusions
In this study, regional climate simulation and SPSS multiple linear regression were used to analyze Beijing’s electricity supply and demand situation, and the new and renewable energies structure adjustment optimization model was used to predict the development of five energy types in 2020. However, climate change has intensified the imbalance between power supply and demand. Therefore, a structural adjustment optimization model for new and renewable energies combined with climate change was proposed to predict the Beijing’s optimal electricity supply in the future.
Based on the analysis of Beijing’s electricity supply and demand, the energy structure optimization model and scenario analysis were used to predict the power generation of five energy types in Beijing. Firstly, when the climate change conditions were not considered, the economy, environment, and comprehensive benefit were considered, and the changes in energy development structure under different weight conditions were compared. Secondly, when considering the climate change conditions, this paper predicted the optimal power supply of Beijing’s new and renewable energies in two scenarios, RCP8.5 and RCP4.5, in 2020. The comprehensive results show that whether or not climate change is considered external electricity provides the maximum power supply. Therefore, it is the main development energy in Beijing. Considering the influence of many factors, other renewable energies are the second development energy. At the same time, in order to make up for the shortage of power supply and alleviate the imbalance between power supply and demand, energies such as solar energy, wind energy and biomass energy should be properly developed. Comparing the two optimization results with or without considering climate change, the development amount and development ratio of various energy forms underwent certain changes. In the case of climate change, the priority development order of Beijing’s new and renewable energies is: external electricity > other renewable energies > solar energy > wind energy > biomass energy.
However, the model still needs to be strengthened in some places in order to further enhance its practicality and reliability. First, this study didn’t consider seasonal fluctuations in the relationship between electricity demand and temperature. Only a simple linear regression model was used to fit the relationship between variables. In the future, other patterns such as nonlinear regression, neural networks etc. can be considered to better reflect the relationship between variables. In addition, although climate change can reflect the inherent randomness and volatility of new and renewable energies to a certain extent, it is more a trend forecast. In fact, based on the impact analysis of climate change, the construction of a stochastic variable optimization model can achieve better results. In order to increase the practicability and feasibility of the model, it is worth further study to better identify the impact of climate change on electricity demand and accurately reflect the uncertainty of new and renewable energy outputs. In general, this research can be used as the design basis for the future Beijing energy structure adjustment program, providing scientific support for the government’s decision-making and the development of related industries.
Author Contributions
Formal analysis: X.D., G.H. and Y.X.; Resources: Y.X. and L.L.; Methodology: X.D., Y.X. and J.G.; Software: J.G.; Data curation: L.L.; Writing—original draft: L.L.; Writing—review and editing: X.D.
Funding
This research was supported by the National Key R&D Program of China CERC-WET Project under Grant [number SQ2018YFE010367& 2016YFE0102400]; Fundamental Research Funds for the Central Universities under Grant [number 2017MS050]; Fundamental Research Funds for the Central Universities of PRC (2017YQ002); and the National key scientific and technological projects of the PRC (2014ZX07104-005).
Acknowledgments
We are very grateful to the National Key R&D Program of China CERC-WET Project under Grant [number SQ2018YFE010367& 2016YFE0102400]; Fundamental Research Funds for the Central Universities under Grant [number 2017MS050]; Fundamental Research Funds for the Central Universities of PRC (2017YQ002); and the National key scientific and technological projects of the PRC (2014ZX07104-005). The authors gratefully acknowledge the financial support of these programs and agencies.
Conflicts of Interest
The authors declare no conflicts of interest.
References
- Chandrasekhar, K.; Lee, Y.J.; Lee, D.W. Biohydrogen Production: Strategies to Improve Process Efficiency through Microbial Routes. Int. J. Mol. Sci. 2015, 16, 8266–8293. [Google Scholar] [CrossRef] [PubMed]
- Gonçalves, A.L.; Simões, M. Metabolic engineering of Escherichia coli for higher alcohols production: An environmentally friendly alternative to fossil fuels. Renew. Sustain. Energy Rev. 2017, 77, 580–589. [Google Scholar]
- Hong, L.; Zhou, N.; Fridley, D. Assessment of China’s renewable energy contribution during the 12th Five Year Plan. Energy Policy 2013, 62, 1533–1543. [Google Scholar] [CrossRef]
- Dou, X.; Cui, H. Low-carbon society creation and socio-economic structural transition in China. Environ. Dev. Sustain. 2016, 19, 1577–1599. [Google Scholar] [CrossRef]
- Zhou, Z.; Wu, W.; Chen, Q. Study on sustainable development of rural household energy in northern China. Renew. Sustain. Energy Rev. 2008, 12, 2227–2239. [Google Scholar] [CrossRef]
- Frank, A.G.; Gerstlberger, W.; Paslauski, C.A. The contribution of innovation policy criteria to the development of local renewable energy systems. Energy Policy. 2018, 115, 353–365. [Google Scholar] [CrossRef]
- Miremadi, I.; Sabooh, Y.; Jacobsson, S. Assessing the performance of energy innovation systems: Towards an established set of indicators. Energy. Res. Social. Sci. 2018, 40, 159–176. [Google Scholar] [CrossRef]
- Yu, H.; Duan, J.; Du, W. China’s energy storage industry: Develop status, existing problems and countermeasures. Renew. Sustain. Energy Rev. 2017, 71, 767–784. [Google Scholar] [CrossRef]
- Xu, B.; Lin, B.Q. Assessing the development of China’s new energy industry. Energy Econ. 2018, 70, 116–131. [Google Scholar] [CrossRef]
- Ren, H.; Zhou, W.; Nakagami, K.; Gao, W.J. Multi-objective optimization for the operation of distributed energy systems considering economic and environmental aspects. Appl. Energy 2010, 87, 3642–3651. [Google Scholar] [CrossRef]
- Fan, J.L.; Tang, B.J.; Yu, H. Impact of climatic factors on monthly electricity consumption of China’s sectors. Nat. Hazards 2015, 75, 2027–2037. [Google Scholar] [CrossRef]
- Zhang, P.; Zhang, J.; Chen, M. Economic impacts of climate change on agriculture: The importance of additional climatic variables other than temperature and precipitation. J. Environ. Econ. Manag. 2017, 83, 8–31. [Google Scholar] [CrossRef]
- Ruth, M.; Lin, A. Regional energy demand and adaptation to climate change: Methodology and application to the state of Maryland, USA. Energy Policy 2006, 34, 2820–2833. [Google Scholar] [CrossRef]
- Nateghi, R.; Mukherjee, S. A multi-paradigm framework to assess the impacts of climate change on end-use energy demand. PLoS ONE 2017, 12. [Google Scholar] [CrossRef]
- Auffhammer, M.; Baylis, P.; Hausman, C.H. Climate change is projected to have severe impacts on the frequency and intensity of peak electricity demand across the United States. Proc. Natl. Acad. Sci. USA 2017, 114, 1886–1891. [Google Scholar] [CrossRef] [PubMed]
- Pašičko, R.; Brankovic, Č.; Šimic, Z. Assessment of climate change impacts on energy generation from renewable sources in Croatia. Renew. Energy 2012, 46, 224–231. [Google Scholar] [CrossRef]
- Crook, J.A.; Jones, L.A.; Forster, P.M. Climate change impacts on future photovoltaic and concentrated solar power energy output. Energy Environ. Sci. 2011, 4, 3101. [Google Scholar] [CrossRef]
- Lucena, A.F.P.D.; Szklo, A.S.; Schaeffer, R. The vulnerability of renewable energy to climate change in Brazil. Energy Policy. 2009, 37, 879–889. [Google Scholar] [CrossRef]
- Schmidt, J.; Cancella, R.; Pereira, A.O. An optimal mix of solar PV, wind and hydro power for a low-carbon electricity supply in Brazil. Renew. Energy 2016, 85, 137–147. [Google Scholar] [CrossRef]
- Kocaman, A.S.; Abad, C.; Troy, T.J. A stochastic model for a macroscale hybrid renewable energy system. Renew. Sustain. Energy Rev. 2016, 54, 688–703. [Google Scholar] [CrossRef]
- Pereira, S.; Ferreira, P.; Vaz, A.I.F. Optimization modeling to support renewables integration in power systems. Renew. Sustain. Energy Rev. 2016, 55, 316–325. [Google Scholar] [CrossRef]
- Dong, C.; Huang, G.H.; Cai, Y.P. Bayesian interval robust optimization for sustainable energy system planning in Qiqihar City, China. Energy Econ. 2016, 60, 357–376. [Google Scholar] [CrossRef]
- Prebeg, P.; Gašparović, G.; Krajačić, G. Long-term energy planning of Croatian power system using multi-objective optimization with focus on renewable energy and integration of electric vehicles. Appl. Energy 2016, 184, 1493–1507. [Google Scholar] [CrossRef]
- Yu, L.; Li, Y.P.; Shan, B.G. A scenario-based interval-stochastic basic-possibilistic programming method for planning sustainable energy system under uncertainty: A case study of Beijing, China. J. Clean. Prod. 2018, 197, 1454–1471. [Google Scholar] [CrossRef]
- Jennifer, C.; Gabrial, A.; Olivier, D. Climate change impacts on the energy system: A review of trends and gaps. Climatic. Chang. 2018, 151, 19–93. [Google Scholar]
- Bowen, V. Extreme weather: Is ‘abnormal’ becoming the new ‘normal’? Weather 2015, 70, S15–S16. [Google Scholar] [CrossRef]
- O’Neill, B.C.; Oppenheimer, M.; Warren, R. IPCC reasons for concern regarding climate change risks. Nat. Clim. Chang. 2017, 7, 28–37. [Google Scholar] [CrossRef]
- Ying, S.; Wang, G.L.; Gao, X.J. Effects of climate and potential policy changes on heating degree days in current heating areas of China. Sci. Rep.-UK 2018, 8, 10211. [Google Scholar]
- David, L. Bayesian estimation of a building’s base temperature for the calculation of heating degree-days. Energy Build. 2017, 134, 154–161. [Google Scholar]
- Spinoni, J.; Vogt, J.V.; Barbosa, P. Changes of heating and cooling degree-days in Europe from 1981 to 2100. Int. J. Climatol. 2017, 38, e191–e208. [Google Scholar] [CrossRef]
- Guo, J.H.; Huang, G.H.; Wang, X.Q.; Li, Y.P.; Lin, Q.G. Dynamically-downscaled projections of changes in temperature extremes over China. Clim. Dyn. 2018, 50, 1045–1066. [Google Scholar] [CrossRef]
- Tursun, H.; Li, Z.; Liu, R. Contribution weight of engineering technology on pollutant emission reduction based on IPAT and LMDI methods. Clean. Technol. Environ. 2015, 17, 225–235. [Google Scholar] [CrossRef]
- Li, F.; Hu, D.; Liu, X. Comprehensive urban planning and management at multiple scales based on ecological principles: A case study in Beijing, China. Int. J. Sustain. Dev. World. 2008, 15, 524–533. [Google Scholar] [CrossRef]
- Wu, C.B.; Huang, G.H.; Li, W. An inexact fixed-mix fuzzy-stochastic programming model for heat supply management in wind power heating system under uncertainty. J. Clean. Prod. 2016, 112, 1717–1728. [Google Scholar] [CrossRef]
- Amutha, W.M.; Rajini, V. Cost benefit and technical analysis of rural electrification alternatives in southern india using homer. Renew. Sustain. Energy Rev. 2016, 62, 236–246. [Google Scholar] [CrossRef]
- Abbasi, T.; Abbasi, S.A. Biomass energy and the environmental impacts associated with its production and utilization. Renew. Sustain. Energy Rev. 2010, 14, 919–937. [Google Scholar] [CrossRef]
- Imelda; Fripp, M.; Roberts, M.J. Variable Pricing and the Cost of Renewable Energy. Available online: https://ssrn.com/abstract=3198014 (accessed on 8 April 2019).
- Hdidouan, D.; Staffell, I. The impact of climate change on the levelised cost of wind energy. Renew. Energy 2017, 101, 575–592. [Google Scholar] [CrossRef]
- Leung, D.Y.C.; Yang, Y. Wind energy development and its environmental impact: A review. Renew. Sustain. Energy Rev. 2012, 16, 1031–1039. [Google Scholar] [CrossRef]
- Fang, X.; Li, D. Solar photovoltaic and thermal technology and applications in China. Renew. Sustain. Energy Rev. 2013, 23, 330–340. [Google Scholar] [CrossRef]
© 2019 by the authors. Licensee MDPI, Basel, Switzerland. This article is an open access article distributed under the terms and conditions of the Creative Commons Attribution (CC BY) license (http://creativecommons.org/licenses/by/4.0/).