Article

An Innovative Procedure to Evaluate the Hydrogen Diffusion Coefficient in Metals from Absorption Measurements

1
Dipartimento Fusione e Tecnologie per la Sicurezza Nucleare, ENEA, Via E. Fermi 45, Frascati, 00044 Rome, Italy
2
Consiglio Nazionale delle Ricerche, Istitutodei Sistemi Complessi, U.O.S. La Sapienza, Piazzale A. Moro 5, 00185 Rome, Italy
3
Dipartimento Tecnologie Energetiche, ENEA, Via Anguillarese 301, S. Maria di Galeria, 00123 Rome, Italy
4
Dipartimento di Fisica, Sapienza Università di Roma, Piazzale A. Moro 5, 00185 Rome, Italy
*
Author to whom correspondence should be addressed.
Energies 2019, 12(9), 1652; https://doi.org/10.3390/en12091652
Submission received: 29 March 2019 / Revised: 18 April 2019 / Accepted: 24 April 2019 / Published: 30 April 2019
(This article belongs to the Section D1: Advanced Energy Materials)

Abstract

:
A large number of metallic alloys are currently under investigation in the field of hydrogen storage and hydrogen separation membranes. For such applications, the knowledge of the hydrogen diffusion coefficient in the given alloy is of great importance even if its direct measurement is not always easy to perform. In this view, the aim of this work is to describe an innovative procedure able to provide the lower limit of the hydrogen diffusion coefficient by performing hydrogen absorption kinetic experiments. Two different tools are presented: The first is a numerical code which solves the diffusion problem inside metals according to the general theory of the transport phenomena, and the second is a dimensional analysis that describes the dependence of the hydrogen diffusion coefficient from a few governing parameters. Starting from the results of several hydrogen absorption kinetic experiments performed on a Pd–Ag sample under different experimental conditions, the hydrogen diffusion coefficients were assessed by using both the described tools. A good agreement among the results obtained by means of the two procedures was observed.

1. Introduction

Membranes based on Pd–Ag alloys are one of the reference technologies for the separation of hydrogen from other gas species, especially in those cases in which the purity of the produced hydrogen is one of the main requirements [1,2]. In fact, Pd–Ag and many metallic membranes exhibit an infinite selectivity toward hydrogen, i.e., only hydrogen can permeate through such membranes [3,4]. The hydrogen permeation through dense metal membranes is a solution–diffusion mechanism, which foresees several steps: (i) Absorption of the molecular hydrogen on the metal surface, (ii) dissociation of the hydrogen molecule into atoms on the metal surface, (iii) diffusion of hydrogen through the metal lattice, (iv) recombination of the hydrogen atoms at the opposite side of the metal wall, and (v) desorption of the molecular hydrogen from the metal surface [5]. Usually, the driving force of the process is the hydrogen concentration gradient between the two sides of the metal membrane in a no stress-strained metal. In the simplest case, in which the gradient of the concentration is restricted to one direction (x), the hydrogen flux across the metal membrane can be expressed from the first Fick’s law:
J = D c x
where J (mol m−2 s−1) is the steady state flux of hydrogen through the metal wall, D is the diffusion coefficient (m2 s−1), c (mol m−3) is the hydrogen concentration in the membrane, and x (m) is the axial coordinate along the direction perpendicular to the membrane surface.
By assuming that the atomic hydrogen dissolved in the metal membranes behaves as a dilute solution, then its concentration in the metal lattice (c) can be expressed as:
c = S T p H 2
where S(T) (mol m−3 Pa−0.5) is the solubility (or Sieverts constant), T (K) is the temperature, and p H 2 (Pa) is the hydrogen partial pressure in the gas phase. From the combination of Equations (1) and (2), it is possible to obtain Equation (3), known as Richardson’s equation, which relates the hydrogen permeation flux (J) in a dense metallic membrane to the H2 pressure difference, the temperature, and the membrane characteristics. Particularly, the product among the diffusivity ( D T ) and the solubility ( S T ) represents the permeability ( P e T ) (mol m−1 s−1 Pa−0,5) of hydrogen through the metal:
J = S T D T p H 2 , h i g h p H 2 ,   l o w l = P e T p H 2 ,   h i g h p H 2 ,   l o w l
In several cases, the literature reports the evidence of a deviation of the hydrogen permeation flow from Equation (3) especially with regard to the square root dependence [6,7,8]. From a practical point of view, this means that in real systems, both the hydrogen diffusivity and solubility in the metal lattice are influenced by the hydrogen concentration or the hydrogen equilibrium pressure.
From an experimental point of view, the measurement of the hydrogen solubility in dense metallic membranes is accomplished by using a Sieverts-type apparatus [9,10], while the permeability can be assessed with a dedicated setup capable of measuring the hydrogen flux across the metal wall at steady state conditions [5,6].
Regarding the techniques used to study the bulk-diffusivity, they are usually based either on the measure of the distribution of the hydrogen concentration or on the measure of the hydrogen flux in transient conditions. Most of the methods used to measure the diffusion coefficient are based on electrochemical techniques [11,12,13,14]. The main advantages of electrochemical techniques are related to their applicability even at low H concentrations (down to a few at-ppm) and to the simplicity of equipment, while their drawbacks are mainly related to the limited temperature range between the freezing and the boiling point of the electrolyte.
More recent techniques also relies on the use of light transmission to monitor the concentration of hydrogen as a function of both the position and time [15,16,17]. Another route to assess the diffusion coefficient is by performing permeation experiments. In this case, a pressure difference is set up across the metallic membrane and the hydrogen flux through the membrane is measured. Of course, steady state permeation experiments can only provide a value for the permeability while the diffusion coefficient can be directly measured only by making use of measurements during transient conditions. The propagation time, or ‘time-lag’, for the change in pressure on one side of the specimen to reach the other side depends on the diffusion coefficient, but is independent of solubility [11]. Therefore, from measurements of the time-lag, the diffusion coefficient can be determined. A complementary form of the experiment is the ‘outgassing’ experiment in which gas is removed rapidly from a chamber and the pressure rise due to the outgassing of the specimen is measured.
In those kind of measurements, great care must be devoted in order to assure that no leakage is present between the high and low pressure sides of the membrane. Experimentally, this is a very difficult task as a proper metallic gasket should assure the sealing. All these techniques require dedicated set-ups and non-trivial procedures [18]. Quite recently, a series of non-ideal behaviours were considered and reformulations of the Fick’s law were suggested and applied to experimental data [19,20,21]. Moreover, some first principle calculations were performed in order to calculate the diffusion coefficient in a large variety of metals [22]. Detailed microscopic models for the hydrogen diffusion were proposed [23]. Also, the hydrogen diffusion coefficient of alloys used as electrodes of Ni/MH batteries was reported [24].
Nowadays, many new materials are considered for replacing Pd–Ag because the latter alloy is made up of strategic and expensive metals. In this view, membranes composed of less expensive and/or strategic metals, like Ni, Nb, V, and Cu, are investigated [1,25,26]. Due to the experimental difficulties in measuring the permeability and therefore the diffusion coefficient, a few values of D are available, only for selected materials. However, a larger scale evaluation of the diffusion coefficient of new materials would boost the search for alternative promising compounds.
Here, we propose a new procedure for evaluating the diffusion coefficient of hydrogen in metal foils based on the combined use of absorption measurements and numerical analysis. In particular, hydrogen absorption measurements were performed in a standard Sieverts apparatus, which can be found in most laboratories working on hydrogen storage or permeation. According to a well-known experimental procedure, the hydrogen solubility into the metal was calculated from the steady-state values of the pressure in the gas phase [27]. The behavior of the pressure in the gas phase of the Sieverts’ setup along time provides further information about the kinetics of the hydrogen diffusion through the metal lattice. In this vein, this work was aimed at assessing the diffusion coefficient via a numerical procedure based on the mass transfer mechanisms (Fick’s laws) and using the records of the pressure in the gas phase of the Sieverts apparatus. Such a numerical procedure was then integrated by a dimensional analysis. Once the numerical determination of the diffusion coefficients was completed, the technique of dimensional analysis could be applied. The application of the dimensional analysis to the problem of the diffusion of hydrogen in a Pd–Ag alloy allowed an analytical solution to be defined. We defined a function, applicable to our experimental apparatus, that allows calculation of the diffusion coefficient once the experimental parameters are known. Although these procedures cannot give an accurate value of D, they are useful to perform an initial screening of candidate materials proposed for hydrogen separation and storage.

2. Materials and Methods

All hydrogen absorption measurements were conducted on commercial Pd77Ag23(subscripts represent wt%) foil with a thickness of 25 μm. Four pieces of the membranes (with typical dimensions of ~20 mm × 7 mm and a total mass of ~148 mg) were cut and used for collecting the data of the kinetics of hydrogen absorption in a homemade Sieverts apparatus [9,10] working up to a 200 bar pressure and a 500 °C temperature. These membrane pieces were already used for measuring the pressure–composition isotherms reported in [27]. The amount of hydrogen exchanged between the gas atmosphere and the solid samples was measured by the pressure variation in calibrated cylinders connected by Swagelok tubes to the reaction chamber, where the sample was placed. The real gas state equation was used to calculate the exchanged hydrogen moles. To perform these gas sorption measurements, hydrogen gas with a purity ≥99.9999% was used.
In order to measure fast kinetics (in some cases, the total absorption was is lower than 10 s), the acquisition electronic system of the Sieverts apparatus was modified. Usually, it consists of a Keithley 2700/7700 multiplexer voltmeter that reads the temperature of the five gas reservoirs, the temperature of the sample holder, the output voltage of a gas transducer microbaratron MKS 870B working between 0 and ≈200 bar, and the output voltage of a gas transducer microbaratron MKS 870B working between 0 and ≈7 bar. The overall time needed by the voltmeter and the acquisition program written in Labview to collect all these data is about 0.4 s, which is too a long time for the presently investigated kinetics. Therefore, for the present experiments, the temperature of the reservoirs and of the sample holder was measured before the absorption process and only the output voltage of a gas transducer microbaratron MKS 870B working between 0 and ≈7 bar was collected as a function of time every 20 ms by means of a National Instruments NI USB-6211A/D converter. Data were stored and saved by a home-made Labview program. Absorption kinetics measurements were performed at selected temperatures between 150 and 400 °C and various pressures ranging between 0.05 and 1 bar. Before each single absorption experiment, the Pd–Ag sample was degassed pumping by means of a Pfeiffer Vacuum turbo pump (p≈10−4 mbar in the sample holder), until no more hydrogen desorption from the sample could be detected by a combined Pirani–Penning vacuum gauge. The amount of hydrogen absorbed in the sample measured by this new acquisition procedure was identical to that previously reported in [27].

3. Results and Discussion

The activity started with the measurements of the hydrogen absorption kinetics in a Pd–Ag sample under several pressure (p) and temperature (T) conditions (Table 1). During these experiments, the variation of the hydrogen pressure in the vessel versus time was recorded and the hydrogen content in the solid sample, which in the following will be indicated as (H/M), i.e., the number of hydrogen atoms per atom of metal, was assessed [28]. Then, a numerical code was developed to evaluate the lower limit of the hydrogen diffusion coefficient starting from the information acquired during the absorption experiments. To solve the diffusion problem, the code needs the hydrogen superficial concentration on the sample, which can be identified from the H/M content. The output of the numerical code is a lower value of the hydrogen diffusion coefficient. After this first step, the technique of dimensional analysis was applied, aiming at providing a quick tool able to assess the diffusion coefficient from the direct measurement of the experimental parameters. The dimensional analysis approach is generic, but its analytical solution is characteristic for the experimental apparatus used in the absorption experiments.

3.1. Hydrogen Absorption Kinetics Measurements

The hydrogen absorption kinetics curves were measured between 150 and 400 °C with various pressures ranging between 0.05 and 1 bar in a Pd–Ag sample with a volume (VC) and a mass (MC) of 1.275 × 10⁻⁸ m3 and 1.477 × 10⁻⁴ kg, respectively. The initial pressure and sample temperature, as well as the final hydrogen content in the sample indicated as H/M, in each experiment are reported in Table 1.
As reported in Figure 1, the acquisition of data starts at a constant pressure, which is the initial value of p, pi, imposed in the reservoir. At a certain time, the valve connecting the gas reservoir with the initially pumped sample holder is opened. Correspondingly, the pressure abruptly drops, due to the change of volume of the gas. After about 0.3 s, the pressure smoothly decreases as the sample starts to absorb hydrogen. For longer times, the pressure becomes constant and from the measure of the total pressure (ΔpTOT), it is possible to assess the final hydrogen content in the solid sample (H/M). In Figure 1, one can observe that increasing the temperature, starting from similar values of p, the kinetics becomes faster as less time is needed to reach the steady state. However, it must be noted that the pressure drop at lower T is higher, in agreement with the higher hydrogen content measured at lower temperatures by the pressure–composition isotherms [27]. Moreover, considering the curves measured at the sample temperature of 250 °C starting with different pressures, one can note a faster kinetics at higher p. This behavior is the one expected for metal hydrides. In conclusion, the hydrogen kinetics curves show the expected behavior. In the following, we will use these data to evaluate quantitatively the diffusion coefficient of hydrogen into the Pd–Ag alloy, introducing an innovative procedure.

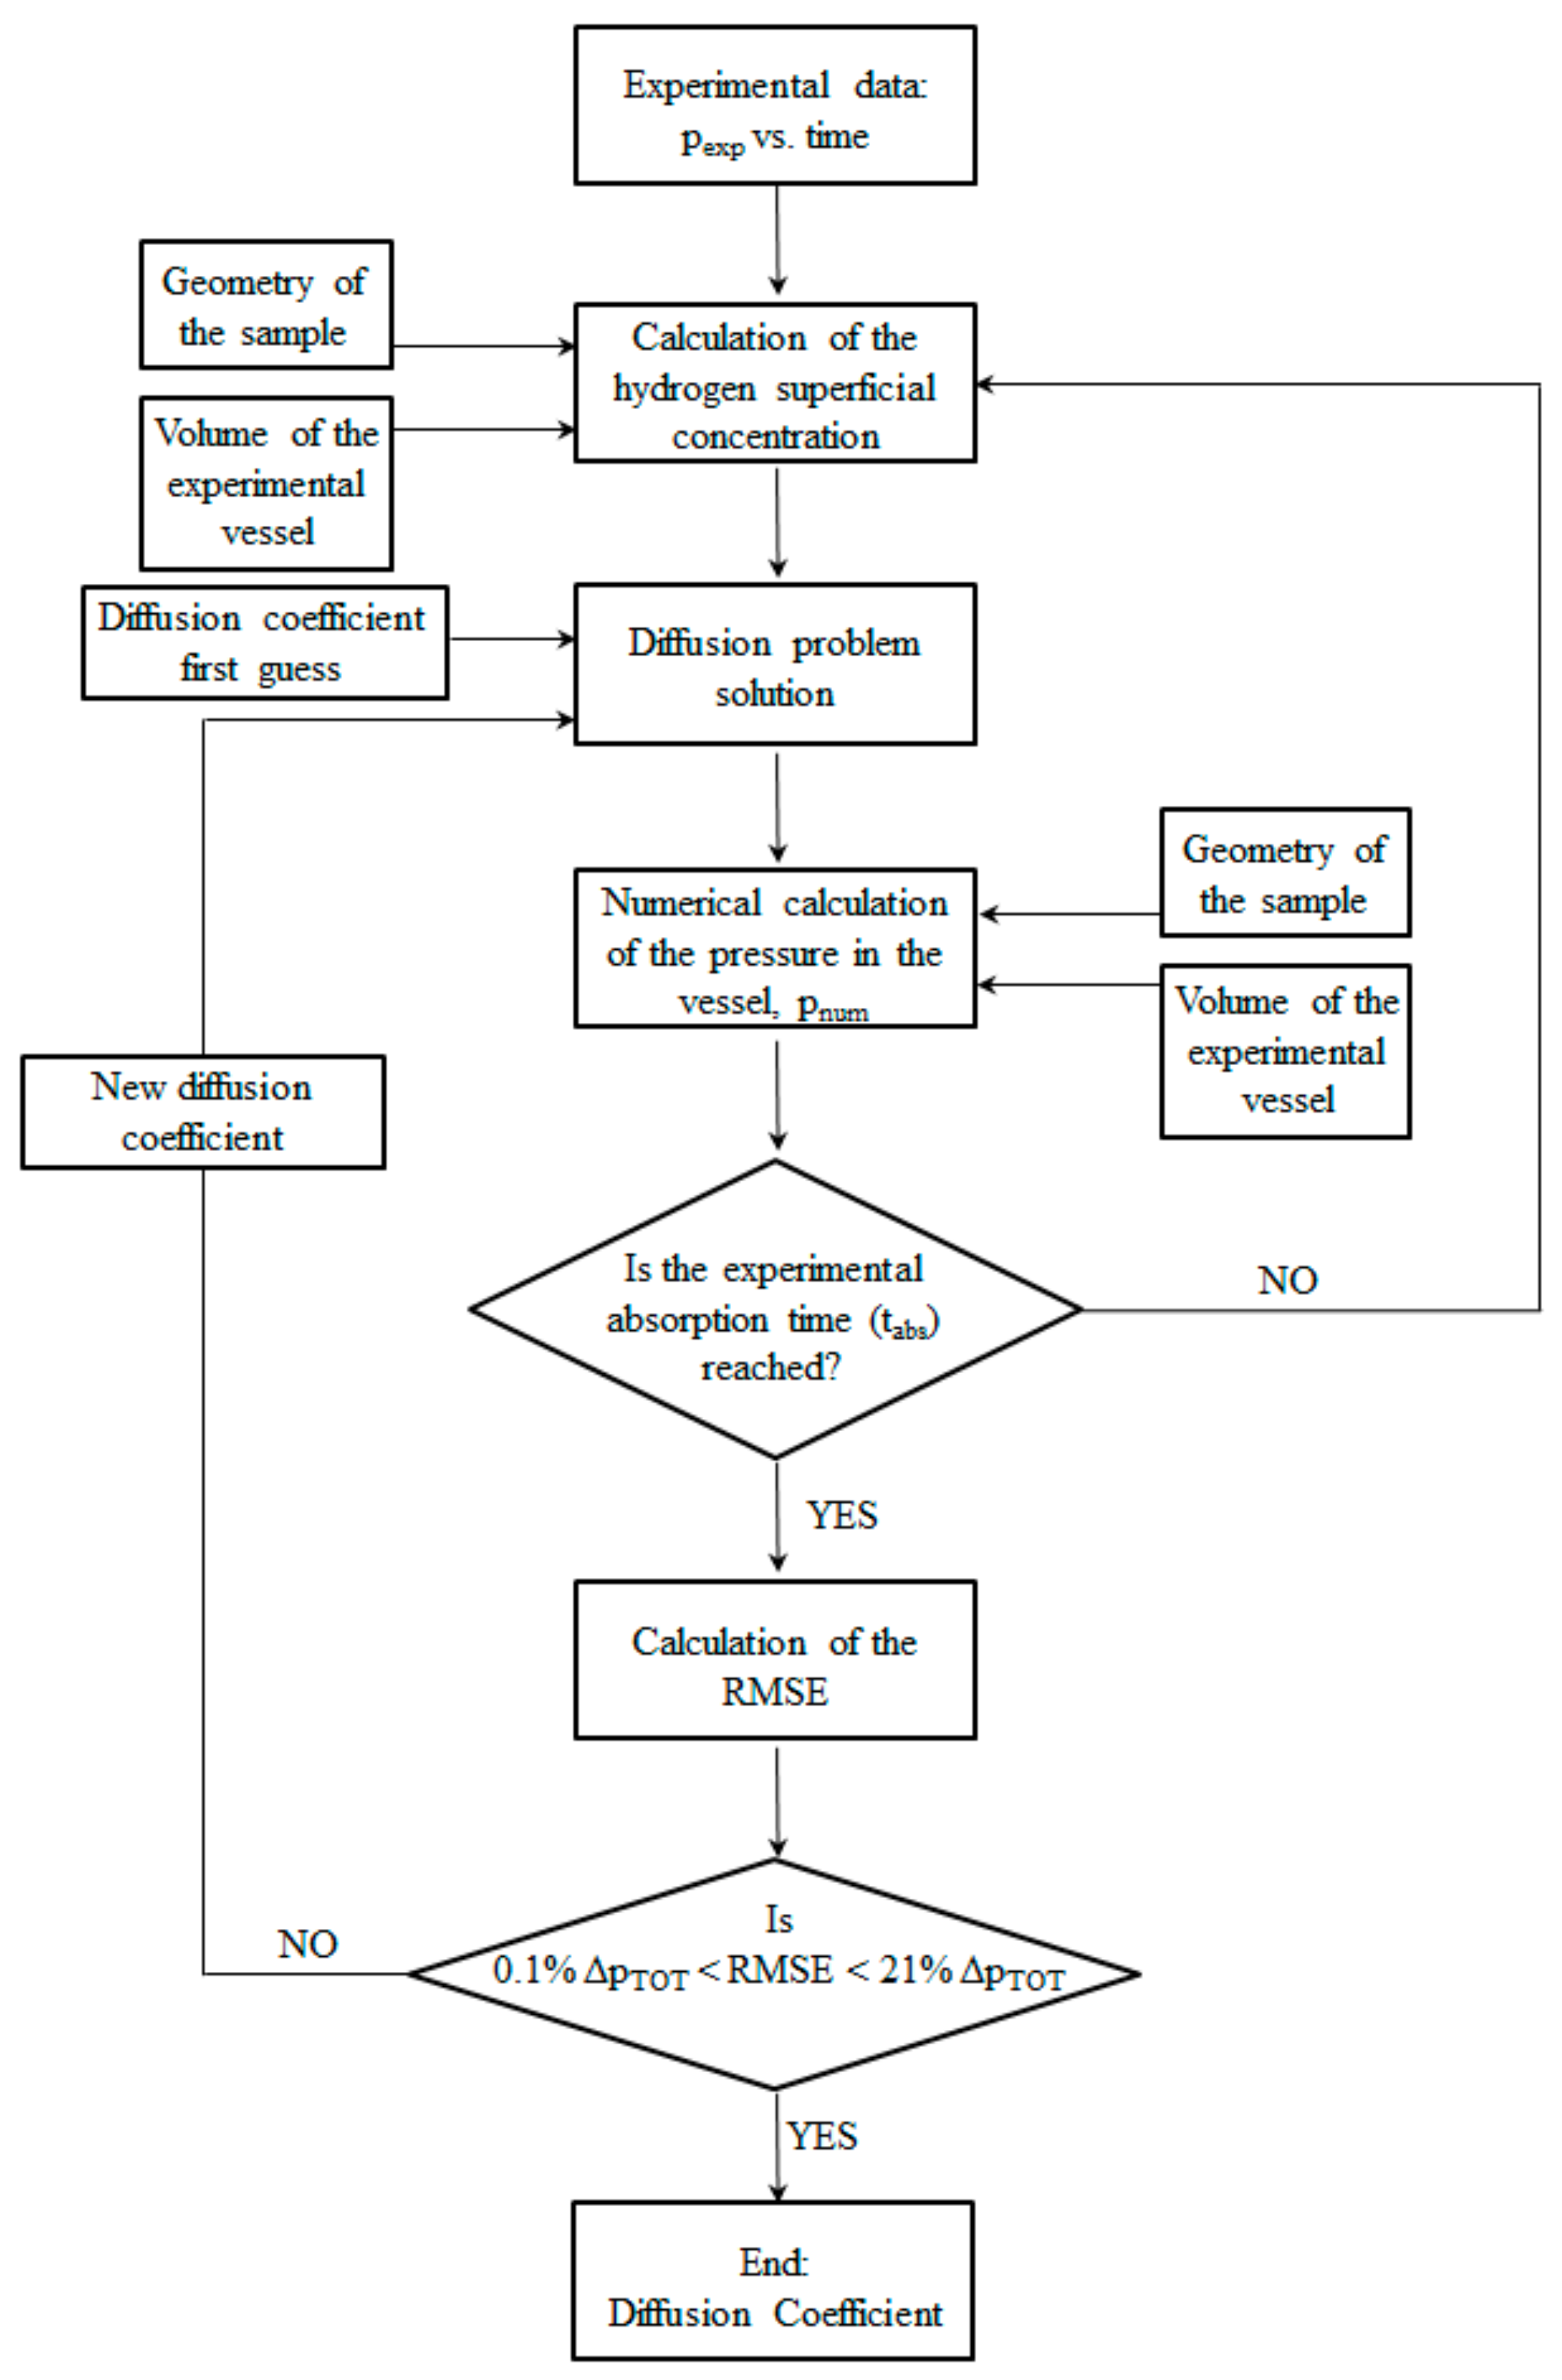
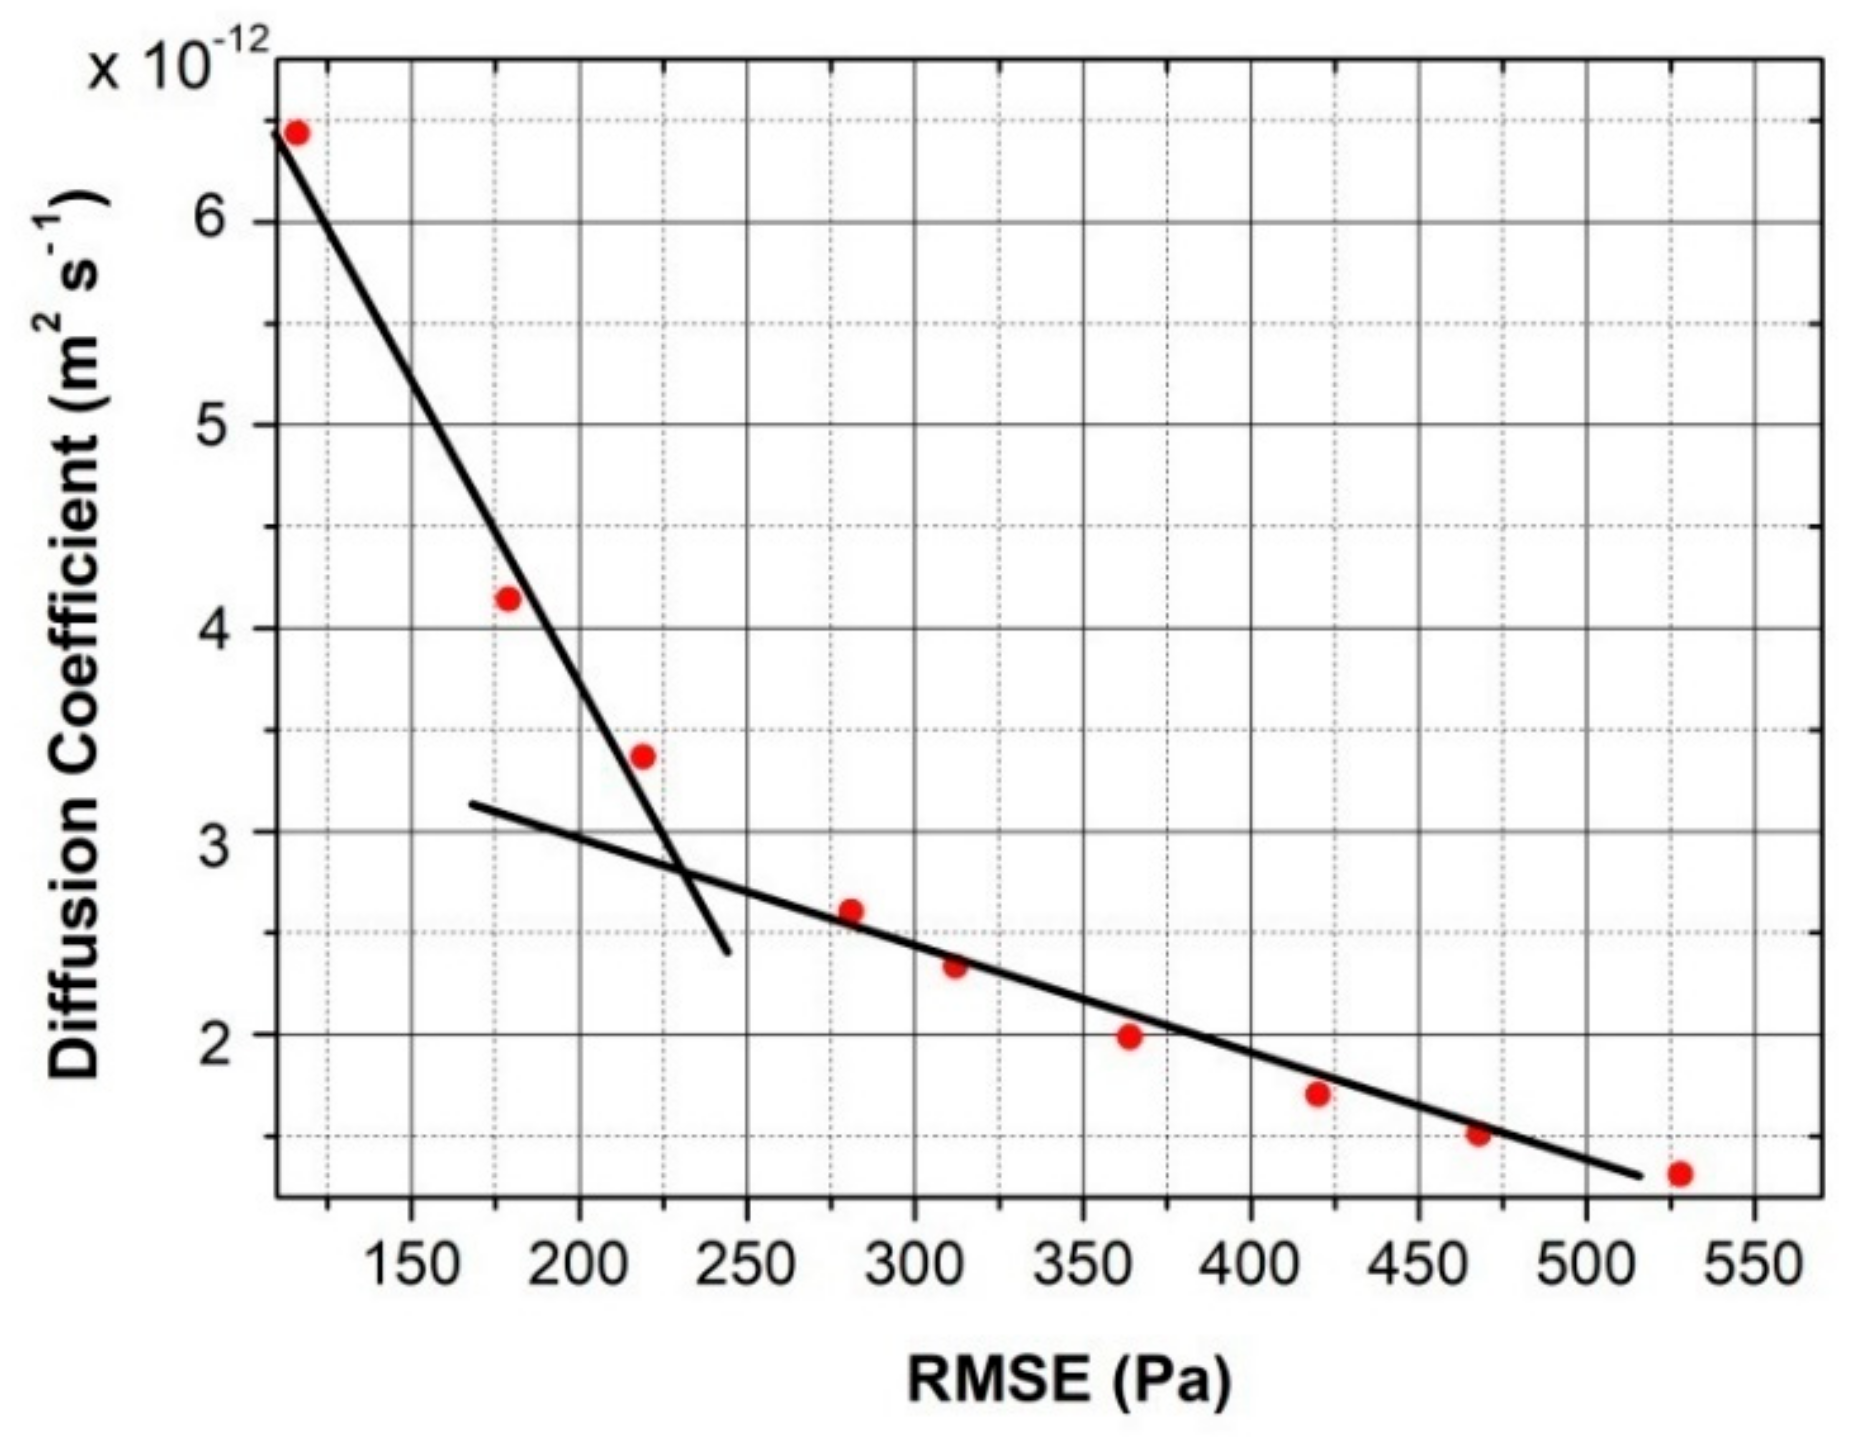
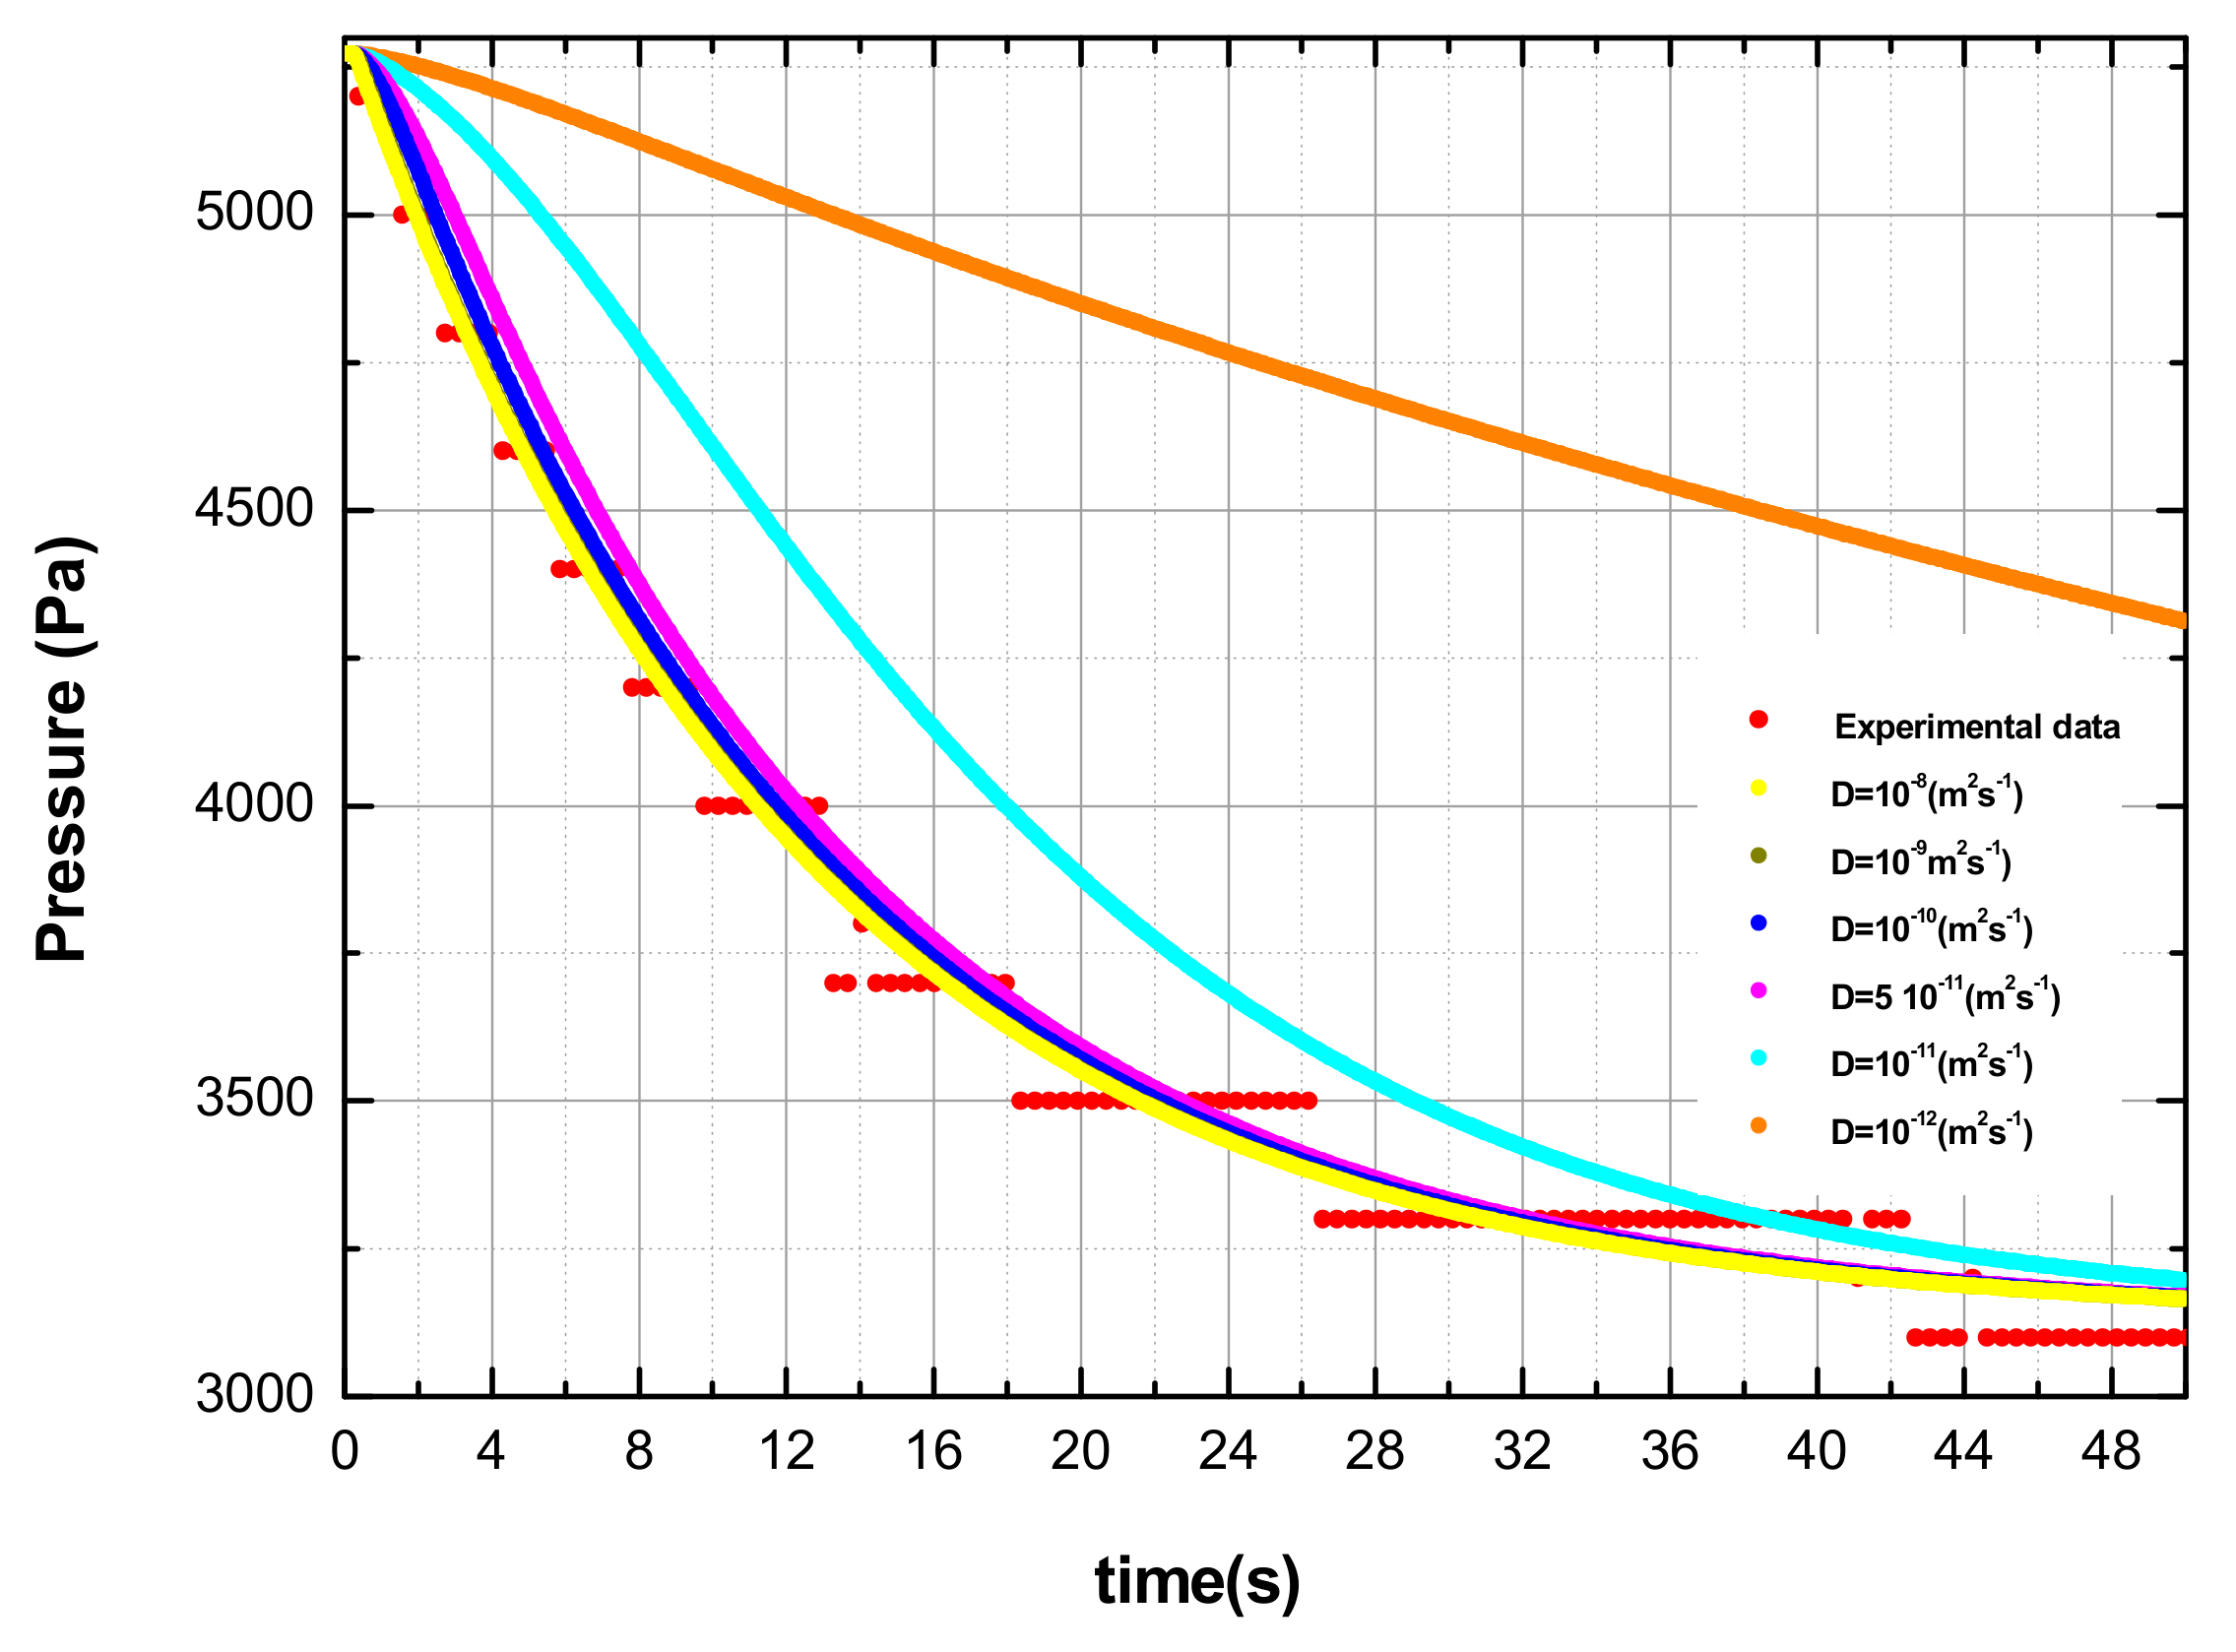
3.2. Numerical Code to Evaluate the Lower Limit of the Hydrogen Diffusion Coefficient

A numerical code was developed to evaluate the hydrogen diffusion coefficient from the hydrogen absorption experiments previously described. As shown in Figure 1, the experiments measured the pressure (pexp) versus time in each test. With the volume of the Sieverts apparatus and the geometry of the sample known, it is possible to assess also the H/M content versus time inside the sample and the corresponding hydrogen concentration on the sample surface. In fact, with VC the hydrogen concentration inside the sample volume and assuming an homogenous distribution, the corresponding surface concentration (SC) can be expressed by the relation, S C = V C 2 / 3 .
Starting from the knowledge of the hydrogen surface concentration calculated from the experimental data and assuming an initial arbitrary value for the diffusion coefficient, the code solves the hydrogen diffusion through metal in accordance with the general theory of transport phenomena [29]. It provides, as the output, the hydrogen concentration profile inside the sample, which is converted via hydrogen mass balances to a certain pressure value inside the experimental vessel (pnum). The calculus is repeated several times until the time experimentally required in the hydrogen absorption process (tabs) is reached. tabs is defined as the highest time at which a pressure drop is observed experimentally. Of course, in each iteration, the code considers a new value for the hydrogen surface concentration in agreement with the one experimentally assessed.
To evaluate the goodness of the diffusion coefficient initially assumed, the model calculates the root mean square error (RMSE) between the pressure experimentally measured (pexp) with the ones numerically obtained in the code (pnum) in each repetition (i.e., at each time):
R M S E = i = 1 m p e x p , i p n u m ,   i 2 m
With the measurable pressure drop values significant only in the first part (40%) of the entire time required from the absorption process (tabs), the comparison among pexp and pnum is done exclusively in the time interval between 0.3 s and 40% tabs. Under this assumption, m, which is the number of time intervals considered in the simulation, is equal to:
m = 40 %   t a b s     0.3 Δ t
where Δt is set in order to provide a value m = 1000.
The entire simulation is repeated by considering a new diffusion coefficient able to reduce the RMSE. Particularly, the diffusion coefficients accepted in this analysis are those able to provide an RMSE in the range between the 21 and the 0.1% of the total pressure drop (ΔpTOT) measured in each single experiment. Figure 2 provides the flow chart of the numerical code.
The code is based on the iteration of a few steps. For each time interval, ∆t, the surface concentration is derived by the experimental data at the time, t +t, as previously described and assumed to be uniform within the sample. This value is assigned to the time, t, and then the diffusion problem is solved with the previous input to the time, t +t, thus obtaining a coefficient of diffusion that realizes the imposed range error. It is worth noting that the code solves the diffusion problem inside the sample autonomously, but uses the experimental data in every time step to define the superficial concentration.
Figure 3 illustrates the relation between the RMSE and the diffusion coefficient values assessed by the numerical code for test #7 (Table 1). The same kind of behavior is observed when the numerical code is applied to all the other tests listed in Table 1.
It was observed that starting with a low diffusion coefficient, the curve of the pressures numerically assessed (pnum) vs. time does not overlap with the experimental pressure (pexp) values. As the diffusion coefficient is increased in the code, the numerical and the experimental pressure curves vs. time become closer and the RMSE linearly decreases.
An example of how the value of the diffusion coefficient affects the pnum is reported in Figure 4.
However, above a certain value of the diffusion coefficient, the RMSE reduces less quickly. From a physical point of view this means that when low diffusion coefficients are considered, the limiting step in the overall absorption–diffusion process is the diffusion through the metal lattice, while in the case of high diffusion coefficients, the limiting step becomes the hydrogen absorption on the sample surface. The latter situation cannot be precisely simulated with the described numerical procedure. For this reason, the diffusion coefficient assessed in each absorption test is the one corresponding to the intersection of the two RMSE interpolation lines (see Figure 3). Particularly for each experiment (i.e., hydrogen absorption at selected p and T), 11 evaluations of the diffusion coefficient were performed by varying the RMSE. According to the consideration previously explained, the final diffusion coefficients assessed with the code, and illustrated in Figure 5, represent from a physical point of view the lower limit of the real diffusion coefficient. Figure 5 reports the behavior of the diffusion coefficient evaluated by the numerical code as a function of the temperature of the specimen and of the initial pressure. It clearly shows that the calculated diffusion coefficient increases as p or T increases, in agreement with experimental findings. Indeed, the calculated values of the diffusion coefficients are reported in Table 1.
Measurements of hydrogen diffusion through Pd and its alloy are indeed extensively reported in the literature [30]. Generally, these measurements are affected by the testing conditions, i.e., the diffusion coefficient may depend on both the hydrogen and silver concentration as well as on the working status of the material. In pure Pd, the diffusion coefficient is dependent on the hydrogen concentration only in the βphase, where higher hydrogen uploading into the metal lattice occurs [31]. In Pd–Ag alloys, for small silver concentrations, the diffusion coefficient remains nearly constant, while it reduces dramatically over 25% and achieves a minimum at 60% of silver [32,33,34]. Sakamoto et al. found that cold working decreases the hydrogen diffusivity and increases the activation energy [35]. The results of this model are in the lower limit of the diffusion values reported in the literature and then in agreement with the hypothesis at the basis of the numerical procedure adopted. The dependence of the diffusion coefficient on the pressure (i.e., on the hydrogen content) especially at lower temperatures is explained by the coexistence of the two phases of α and β as reported in a previous work [27].

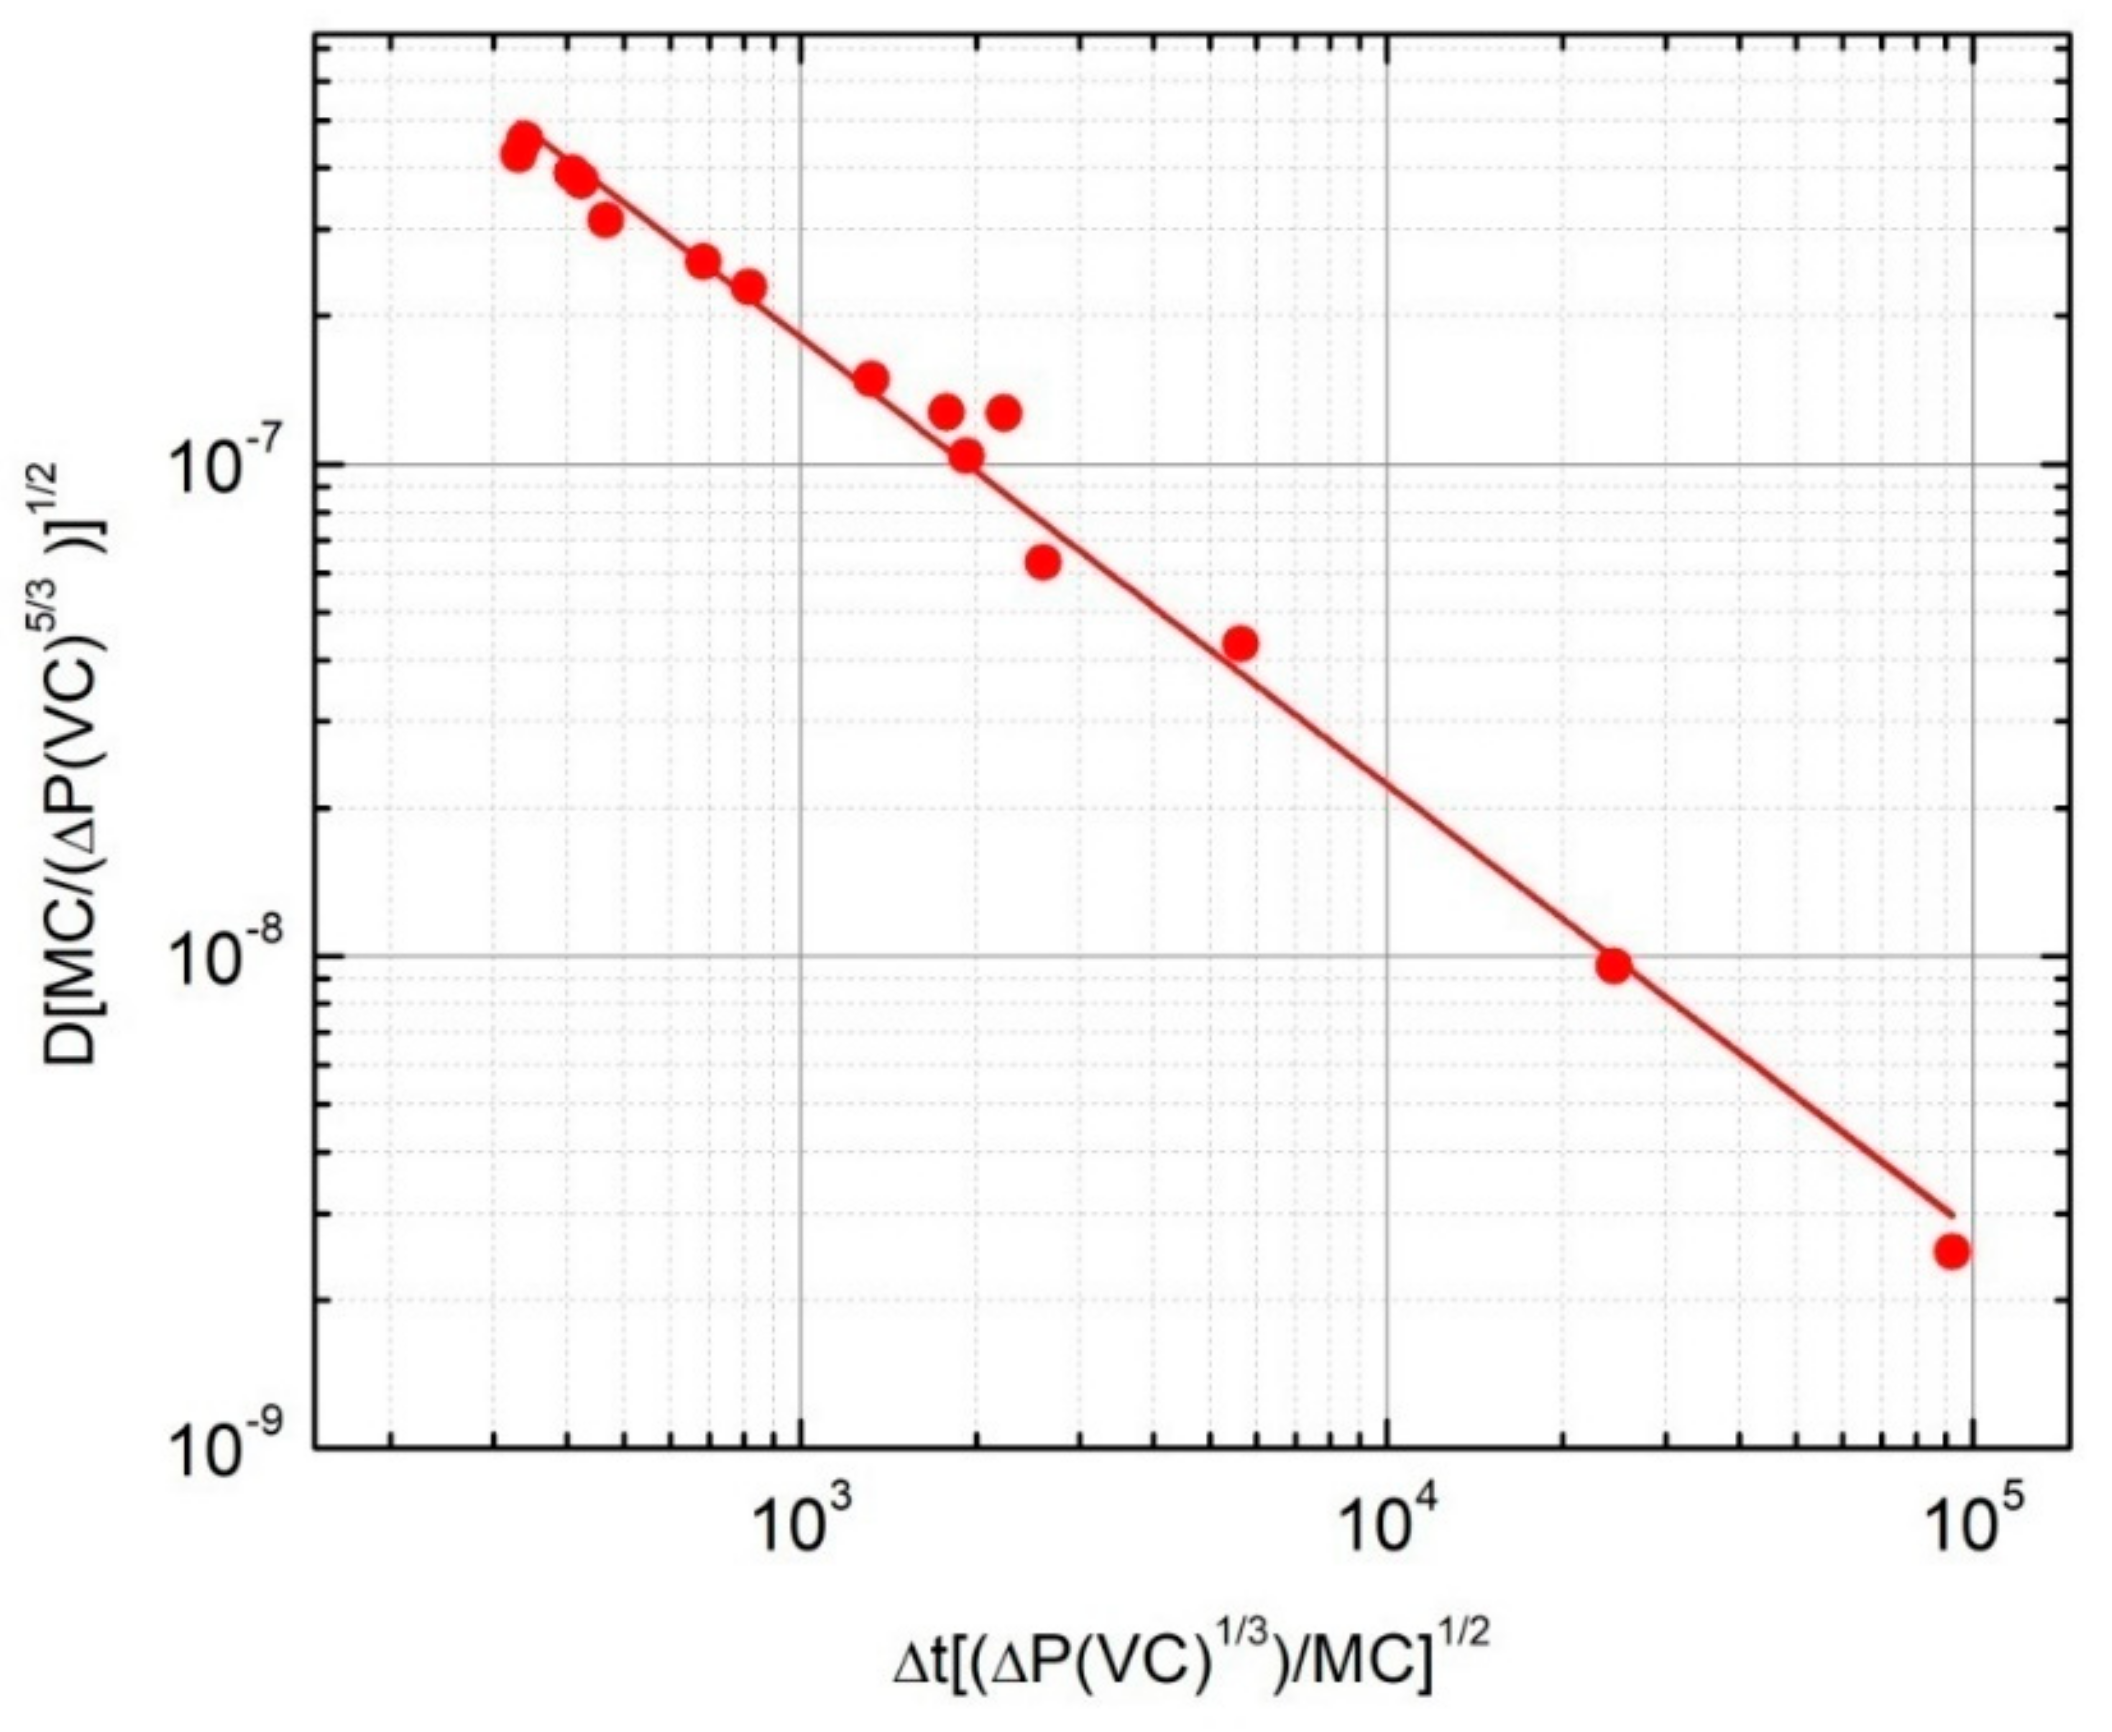
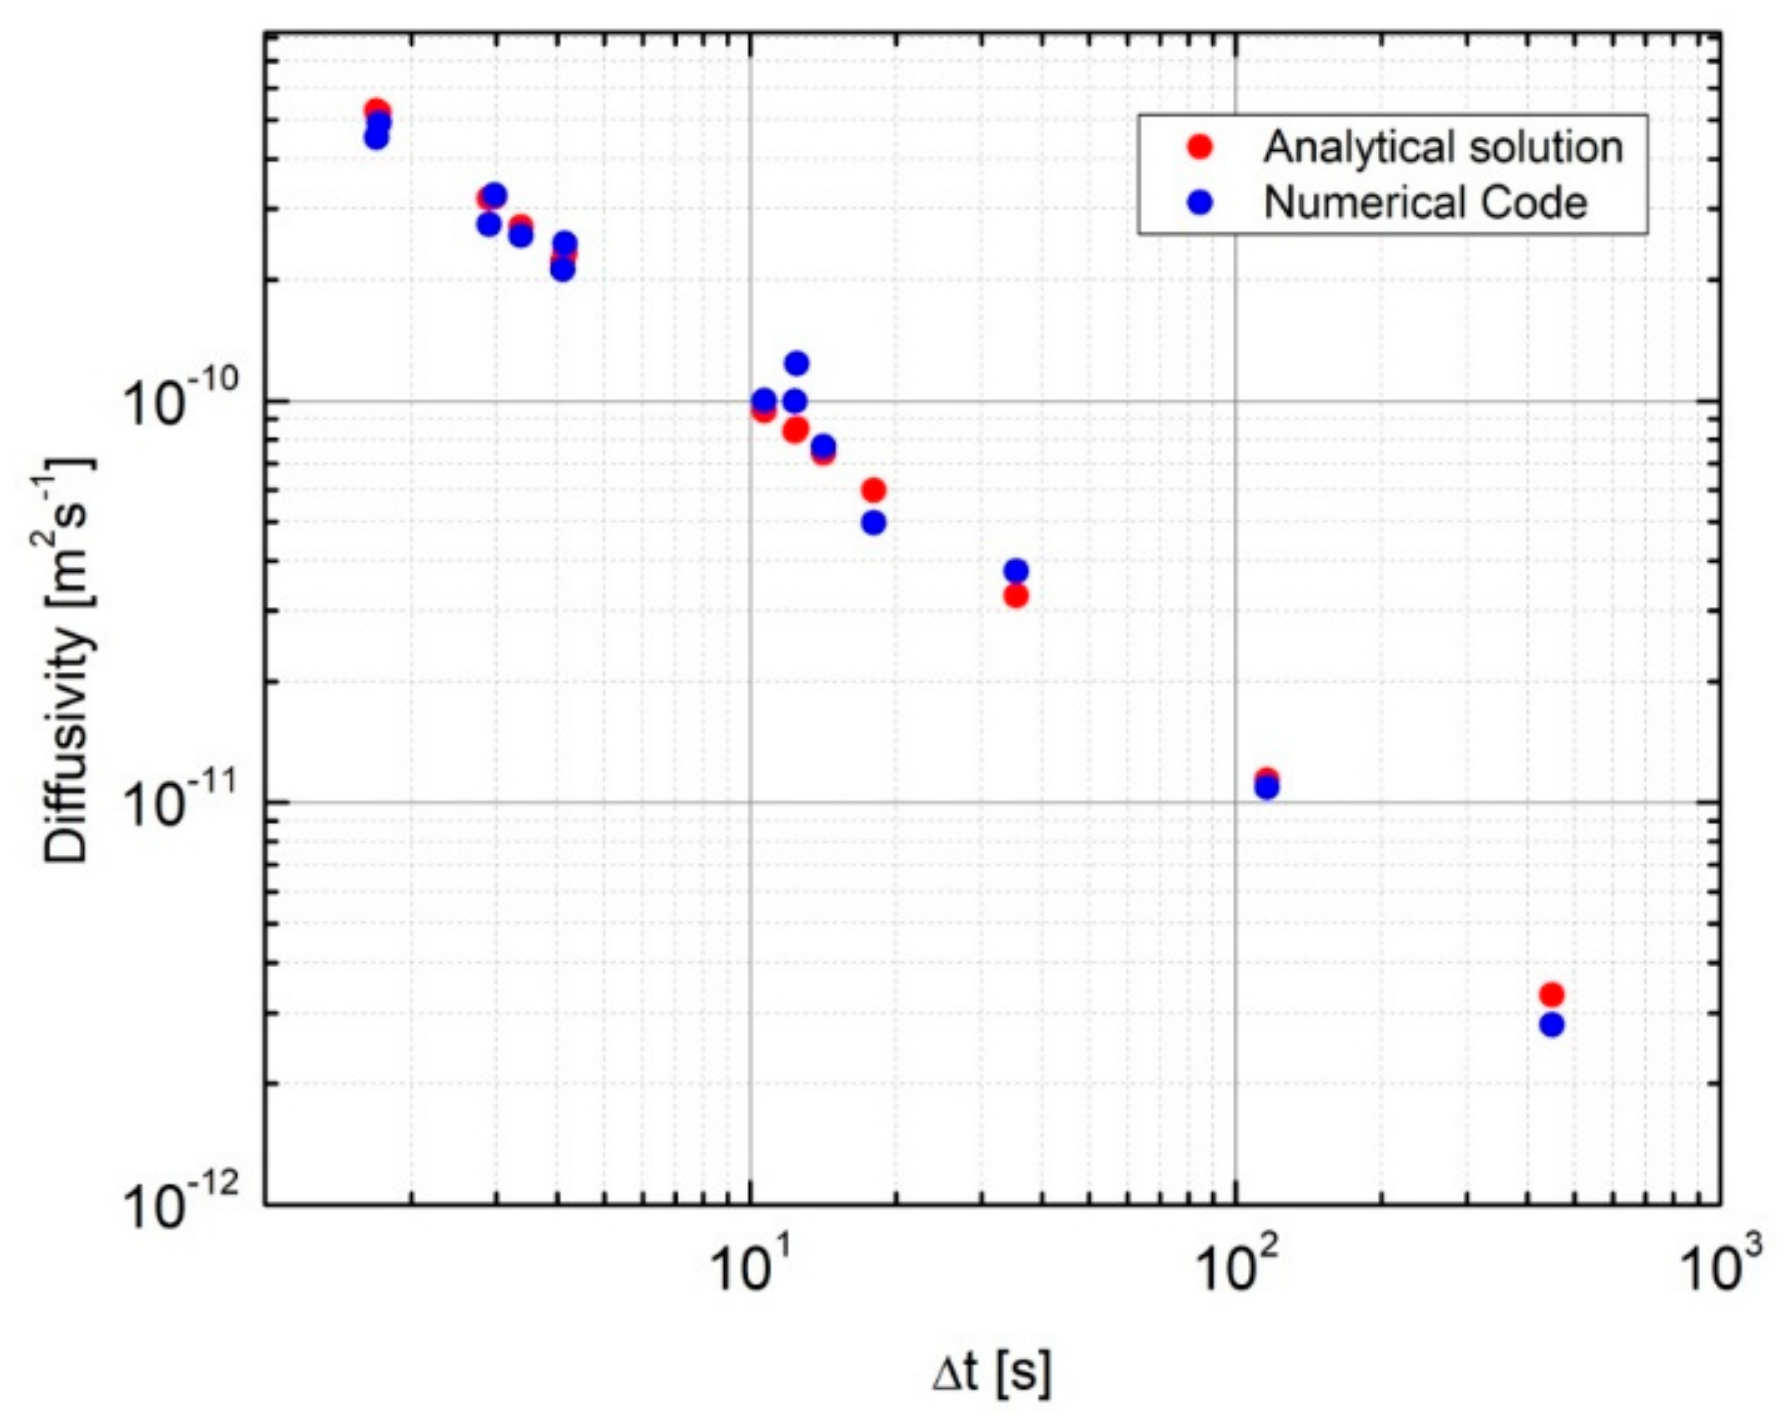
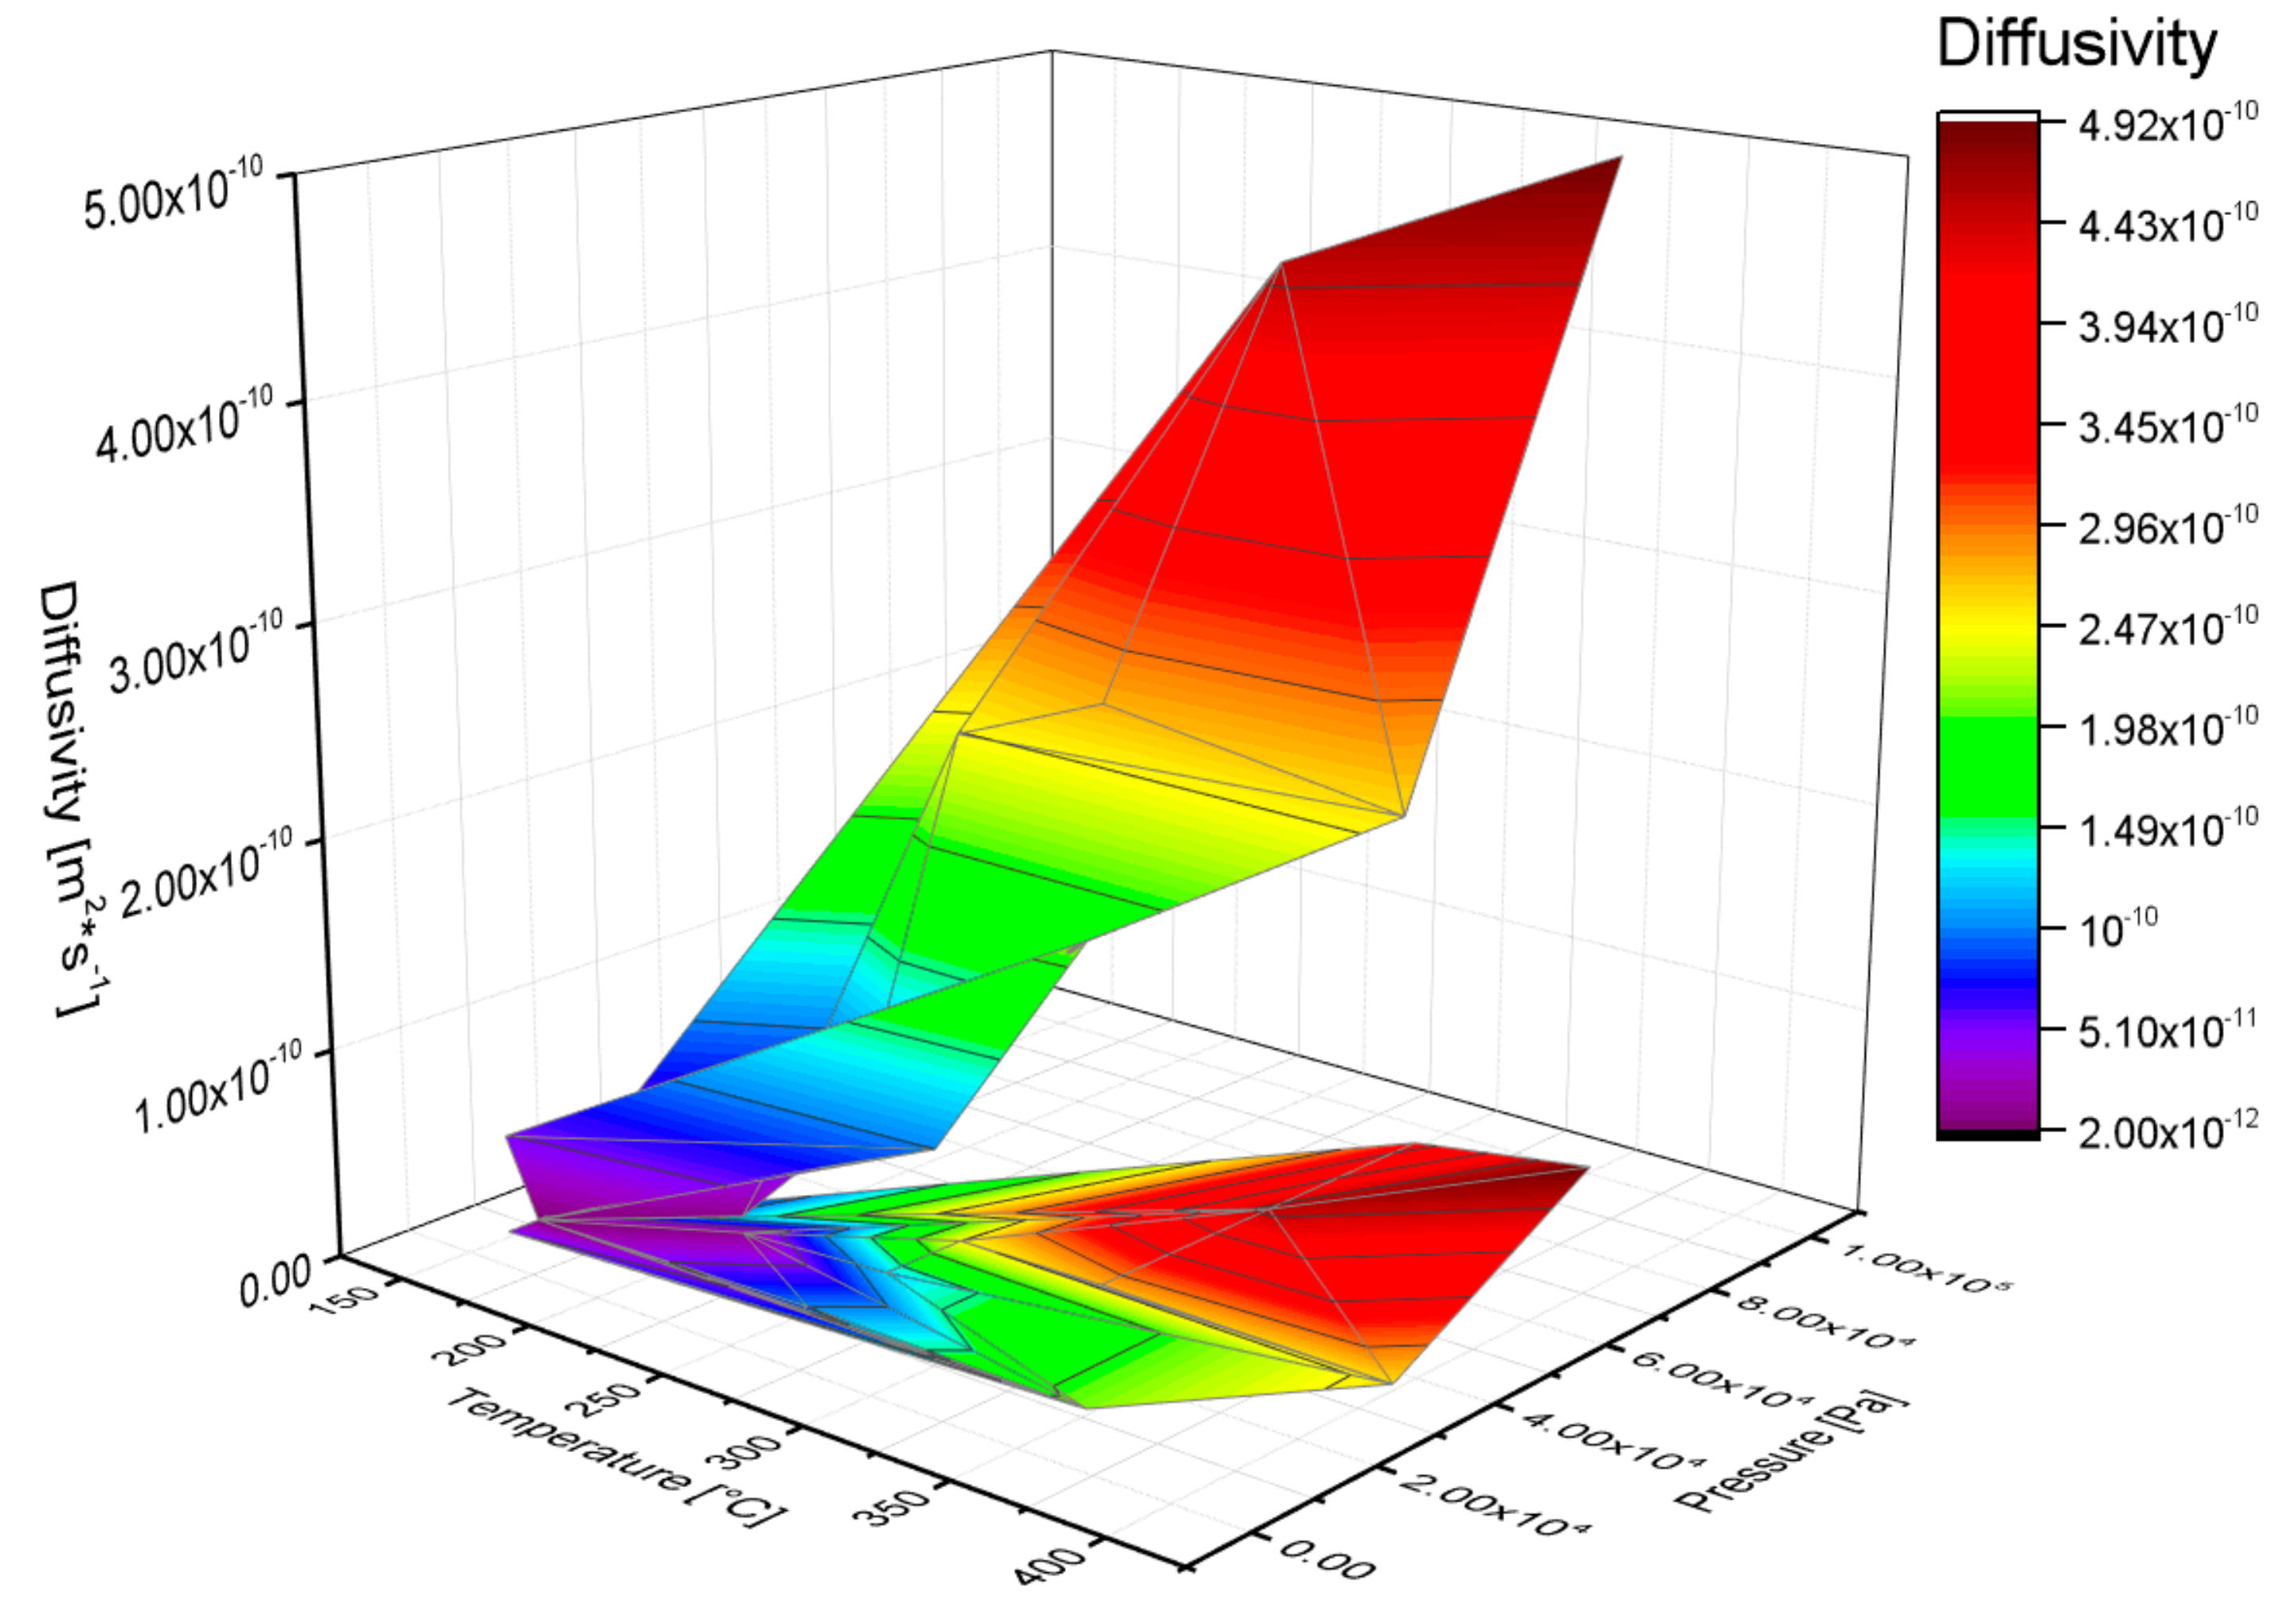
3.3. Dimensional Analysis to Evaluate the Hydrogen Diffusion Coefficient

To improve the potentiality for deriving a lower estimate of the diffusion coefficient from hydrogen absorption measurements, we exploited a method based on the dimensional analysis in order to derive an expression of D from parameters of the sample, such as mass and volume, applicable in our experimental apparatus also for specimens which could be measured in the future. The dimensional analysis technique studies physical phenomena and in particular the dependence of a certain quantity, in general dimensional and on dimensional governing parameters. This relationship can be expressed as the dependence of a dimensionless quantity on the dimensionless combinations of the governing parameters. The number of these dimensionless combinations is equal to the difference between the total number of governing parameters and the number of parameters with independent dimensions.
In particular, the application of the dimensional analysis to the problem of the diffusion of hydrogen in the Pd–Ag alloy allowed an analytical solution of the calculation of the diffusion coefficient to be defined.
In general, the time for the absorption of hydrogen by the alloy, Pd77Ag23, Δ t , can be written as:
Δ t = Δ t Δ P , D , M C , V C
where Δ P is the pressure jump during the absorption process, D is the diffusion coefficient, and M C and V C are the mass and volume of the specimen, respectively. The parameters, Δ P , D , M C , and V C , are the governing parameters, i.e., the independent parameters. The parameters, Δ P , M C , and V C , are assumed to be dimensionally independent, while the dimensions of   D and Δ t can be expressed as a function of the dimensions of the Δ P , M C , and V C governing parameters.
Δ t = Δ P 1 2 M C 1 2 V C 1 6
D = Δ P 1 2 M C 1 2 V C 5 6
One can define two dimensionless parameters:
Π 1 = D Δ P * V C 5 3 M C 1 2 ,
Π = Δ t M C Δ P * V C 1 3 1 2
Using these quantities, we can rewrite Equation (6) in the form:
Π = Δ t Δ P , D , M C , V C M C Δ P ·   V C 1 3 1 2 = Δ P   V C 1 3 M C 1 2 Δ t Δ P , Π 1 Δ P ·   V C 5 3 M C 1 2 , M C , V C = F Δ P , M C , V C , Π 1
As the quantities, Π , Π 1 , are dimensionless, their numeric values do not change when changing unit systems within the same class. On the contrary, it is possible to pass to a system of units of measure in which any parameter, Δ P , M C , or   V C , changes by an arbitrary factor while the other two do not change. Therefore, the relation (10) can be represented by a function of an argument:
Π = Φ Π 1
This leads to the following functional form:
Δ t Δ P , D , M C , V C = M C Δ P   V C 1 3 1 2 Π =   M C Δ P   V C 1 3 1 2 Φ D Δ P   V C 5 3 M C 1 2
The use of the dimensional analysis allows the difficulty of determining the absorption time Δ t , to be reduced because one can decrease the number of governing parameters (in our case, 4: Δ P , D , M C , V C ) by the number of governing parameters with an independent dimension (in our case, 3: Δ P , M C   e   V C ), leaving only one free parameter (in our case, D).
Since experimentally one measures the time, Δ t , and one would like to obtain the diffusion coefficient, one can define the inverse function:
D   MC Δ P   V C 5 3 1 2 = Φ 1 Δ t   Δ P · V C 1 3 M C 1 2 .
The above equation reveals that for a sample having a mass, MC, and a volume, VC, there is a certain function ( Φ 1 ) among the diffusion coefficient (D), the time required by the absorption process (Δt), and the pressure drop (ΔP) registered during the absorption experiment. In particular, by using the experimental data illustrated in Section 3.1 and a logarithmic representation, the function, Φ 1 , has a linear behaviour as shown in Figure 6 and its analytical solution is:
D = e 9.2504 Δ t 0.9083 Δ P 1 0.9083 2 V C 5 0.9083 6 M C 1 0.9083 2
It must be pointed out that the dimensional analysis approach illustrated here can be applied in general for assessing the lower limit of the hydrogen diffusion coefficient starting from the measurements of the hydrogen absorption versus time. However, the found analytical solution (i.e., Equation (15)) cannot be considered as universal, but characteristic for the specific Sieverts apparatus used for the hydrogen absorption experiments. In fact, if the same experiments were done in another set-up with a different vessel volume, the resulting ΔP vs. Δt curves would be different.
Figure 7 displays in a logarithmic scale the comparison between the diffusivity coefficients assessed via the numerical code described in Section 3.2 with the analytical solution of the dimensional analysis. One can note the very good agreement between the values of the hydrogen diffusion coefficients assessed by the two procedures.

4. Conclusions

In the present paper, we exploited the possibility of deriving a lower limit of the hydrogen diffusion coefficient in solid membranes by means of a numerical analysis of the kinetics of the hydrogen absorption curves. A numerical code was developed in order to solve the mass transfer law (Fick’s law) in the solid and autonomously derive a lower limit of D.
Moreover, a dimensional analysis of the obtained values of the diffusion coefficient allowed find analytical expression to be found to directly determine a value of D in other samples once the absorption time of hydrogen and the relative pressure jump during the absorption process in those other metals or alloys were experimentally measured by the same Sieverts apparatus used to collect the data inputs for the numerical code.

Author Contributions

Conceptualization, S.T., A.P. (Annalisa Paolone) and A.M. software, A.M.; validation, A.M. and A.P. (Alfonso Pozio); investigation, A.P. (Annalisa Paolone), O.P. and F.T. writing—original draft preparation, O.P., A.P. (Annalisa Paolone), A.S. and S.T.; writing—review and editing, all authors.

Funding

This research received no external funding.

Acknowledgments

In this section you can acknowledge any support given which is not covered by the author contribution or funding sections. This may include administrative and technical support, or donations in kind (e.g. materials used for experiments).

Conflicts of Interest

The authors declare no conflict of interest.

References

  1. Ockwig, N.W.; Nenoff, T.M. Membranes for hydrogen separation. Chem. Rev. 2007, 107, 4078–4110. [Google Scholar] [CrossRef]
  2. Gallucci, F.; Medrano, J.A.; Fernandez, E.; Melendez, J.; van SintAnnaland, M.; Pacheco-Tanaka, D.A. Advances on high temperature Pd-based membranes and membrane reactors for hydrogen purification and production. J. Membr. Sci. Res. 2017, 3, 142–156. [Google Scholar]
  3. Steward, S.A. Review of hydrogen isotope permeability through metals. In US National Laboratory Report; UCRL-53441; Lawrence Livermore National Lab: Livermore, CA, USA, 1983. [Google Scholar]
  4. Alefeld, G.; Volkl, J. Hydrogen in Metals; Springer-Verlag: Berlin, Germany, 1978; Volume II. [Google Scholar]
  5. Santucci, A.; Borgognoni, F.; Vadrucci, M.; Tosti, S. Testing of dense Pd-Ag tubes: Effect of pressure and membrane thickness on the hydrogen permeability. J. Membr. Sci. 2013, 444, 378–383. [Google Scholar] [CrossRef]
  6. Chapelle, D.; Feng, L.; Rauch, J-Y.; Nardin, P. Assessment of the gas permeation through thin coated polymeric membranes; Improvement of the gas barrier ability for hydrogen storage. In Defect and Diffusion Forum; Trans Tech Publications: Zurich, Switzerland, 2012; pp. 393–399. [Google Scholar] [CrossRef]
  7. Hara, S.; Caravella, A.; Ishitsuka, M.; Suda, H.; Mukaida, M.; Haraya, K.; Shimano, E.; Tsuji, T. Hydrogen diffusion coefficient and mobility in palladium as a function of equilibrium pressure evaluated by permeation measurement. J. Membr. Sci. 2012, 421, 355–360. [Google Scholar] [CrossRef]
  8. Flanagan, T.B.; Wang, D. Exponents for the pressure dependence of hydrogen permeation through Pd and Pd−Ag alloy membranes. J. Phys. Chem. C 2010, 114, 14482–14488. [Google Scholar] [CrossRef]
  9. Palumbo, O.; Brutti, S.; Trequattrini, F.; Sarker, S.; Dolan, M.; Chandra, D.; Paolone, A. Temperature dependence of the elastic modulus of (Ni0.6Nb0.4)1−xZrx membranes: Effects of thermal treatments and hydrogenation. Energies 2015, 8, 3944–3954. [Google Scholar] [CrossRef]
  10. Palumbo, O.; Trequattrini, F.; Vitucci, F.M.; Bianchin, A.; Paolone, A. Study of the hydrogenation/dehydrogenation process in the Mg-Ni-C-Al system. J. Alloys Compd. 2015, 645, S239–S241. [Google Scholar] [CrossRef]
  11. Kirchheim, R. Solid solutions of hydrogen in complex materials. Solid State Physics 2004, 59, 203–305. [Google Scholar] [CrossRef]
  12. Jebaroy, J.M.J.; Morrison, D.; Suni, I.I. Hydrogen diffusion coefficients through Inconel 718 in different metallurgical conditions. Corros. Sci. 2014, 80, 517–522. [Google Scholar] [CrossRef]
  13. Boes, N.; Zuchner, H. Electrochemical methods for studying diffusion, permeation and solubility of hydrogen in metals. J. Less Comm. Metals 1976, 49, 223–240. [Google Scholar] [CrossRef]
  14. Yoshinari, O.; Matsuda, H.; Fukuhara, K.; Tanaka, K. Hydrogen diffusivity and solubility in Pd–Y alloys. Mater. Trans. JIM 508–513. [CrossRef]
  15. Palsson, G.K.; Bliersbach, A.; Wolff, M.; Zamani, A.; Hjorvarsson, B. Using light transmission to watch hydrogen diffuse. Nat. Commun. 2012, 3, 892. [Google Scholar] [CrossRef]
  16. Huang, W.; Pálsson, G.K.; Brischetto, M.; Palonen, H.; Droulias, S.A.; Hartmann, O.; Wolff, M.; Hjörvarsson, B. Finite size effects: Deuterium diffusion in nm thick vanadium layers. New J. Physics. 2017, 19, 123004. [Google Scholar] [CrossRef]
  17. Flanagan, T.B.; Wang, D.; Shanahan, K.L. Diffusion of H through Pd membranes: Effects of non-ideality. J. Membr. Sci. 2007, 306, 66–74. [Google Scholar] [CrossRef]
  18. Tyurin, Y.I.; Larionov, V.V.; Nikitenkov, N.N. A laboratory device for measuring the diffusion coefficient of hydrogen in metals during their simultaneous hydrogenation and electron irradiation. Instrum. Exp. Tech. 2016, 59, 772–774. [Google Scholar] [CrossRef]
  19. Hara, S.; Caravella, A.; Ishitsuka, M.; Suda, H.; Mukaida, M.; Haraya, K.; Simano, E.; Tsuji, T. Hydrogen diffusion coefficient and mobility in palladium as a function of equilibrium pressure evaluated by permeation measurements. J. Membr. Sci. 2012, 421, 355–360. [Google Scholar] [CrossRef]
  20. Raina, A.; Sime, N. Effects of anisotropy and regime of diffusion on the measurement of lattice diffusion coefficient of hydrogen inmetals. Proc. R. Soc. A 2018, 474, 20170677. [Google Scholar] [CrossRef]
  21. Tosti, S.; Fabbricino, M.; Moriani, A.; Agatiello, G.; Scudieri, C.; Borgognoni, F.; Santucci, A. Pressure effect in ethanolsteamreforming via dense Pd-basedmembranes. J. Membr. Sci. 2011, 377, 65–74. [Google Scholar] [CrossRef]
  22. Hirata, K.; IIkubo, S.; Koyama, K.; Tsuzaki, K.; Ohtani, H. First-principles study on hydrogen diffusivity in BCC, FCC, and HCP iron. Metall. Mat. Mat. Trans. A 2018, 49A, 5015–5022. [Google Scholar] [CrossRef]
  23. Galindo-Nava, E.I.; Basha, B.I.Y.; Rivera-Díaz-del-Castillo, P.E.J. Hydrogen transport in metals: Integration of permeation, thermal desorption and degassing. J. Mat. Sci. Technol. 2017, 33, 1433–1447. [Google Scholar] [CrossRef]
  24. Volodin, A.A.; Denys, R.V.; Tsirlina, G.A.; Tarasov, B.P.; Fichtner, M.; Yartys, V.A. Hydrogen diffusion in La1.5Nd0.5MgNi9 alloy electrodes of the Ni/MH battery. J. Alloy. Compd. 2015, 645, S288–S291. [Google Scholar] [CrossRef]
  25. Dolan, M.D. Non-Pd BCC alloy membranes for industrial hydrogen separation. J. Membr. Sci. 2010, 362, 12–28. [Google Scholar] [CrossRef]
  26. Sarker, S.; Chandra, D.; Hirscher, M.; Dolan, M.; Isheim, D.; Wermer, J.; Viano, D.; Baricco, M.; Udovic, T.J.; Grant, D.; et al. Developments in the Ni-Nb-Zr amorphous alloy membranes. Appl. Phys. A 2016, 122, 168. [Google Scholar] [CrossRef]
  27. Paolone, A.; Tosti, S.; Santucci, A.; Palumbo, O.; Trequattrini, F. Hydrogen and deuterium solubility in commercial Pd–Ag alloys for hydrogen purification. ChemEngineering 2018, 1, 14. [Google Scholar] [CrossRef]
  28. Palumbo, O.; Trequattrini, F.; Sarker, S.; Hulyakar, M.; Pal, N.; Chandra, D.; Dolan, M.; Paolone, S. New studies of the physical properties of metallic amorphous membranes for hydrogen purification. Challenges 2017, 8, 4. [Google Scholar] [CrossRef]
  29. Kreith, F.; Black, W.B. Basic Heat Transfer; Harper & Row: New York, NY, USA, 1980. [Google Scholar]
  30. Shu, J.; Grandjean, B.P.A.; Van Neste, A.; Kaliaguine, S. Catalytic palladium-based membrane reactors: A review. Can. J. Chem. Eng. 1991, 69, 1036–1060. [Google Scholar] [CrossRef]
  31. Nagamoto, H.; Inoue, H. Sorption and desorption of hydrogen on palladiumsheet. NipponKagaku Kaishi 1977, 9, 1264–1267. [Google Scholar] [CrossRef]
  32. Barlag, H.; Opara, L.; Züchner, H. Hydrogen diffusion in palladium based f.c.c. alloys. J. Alloys Compd. 2002, 330, 434–437. [Google Scholar] [CrossRef]
  33. Opara, L.; Klein, B.; Züchner, H. Hydrogen-diffusion in Pd1− xAgx (0< x< 1). J. Alloys Compd. 1997, 253, 378–380. [Google Scholar] [CrossRef]
  34. Holleck Gerhard, L. Diffusion and solubility of hydrogen in palladium and palladium-silver alloys. J. Phys. Chem. 1970, 74, 503–511. [Google Scholar] [CrossRef]
  35. Sakamoto, Y.; Hirata, S.; Nishikawa, H. Diffusivity and solubiltiy of hydrogen in Pd-Ag and Pd-Au alloys. J. Less Comm. Metals 1982, 88, 387–395. [Google Scholar] [CrossRef]
Figure 1. Hydrogen absorption kinetic curves at selected temperatures and pressures. In particular, the curves refer to the experimental condition reported in Table 1 as Test 11 (blue line), Test 13 (green line), and Test 14 (red line).
Energies 12 01652 g001
Figure 2. Flow chart of the numerical code.
Energies 12 01652 g002
Figure 3. Relation between the root mean square error(RMSE) and the diffusion coefficient calculated for test #7 (T = 150 °C and pi= 10,390 Pa).
Energies 12 01652 g003
Figure 4. Behavior of the calculated pressure curves as a function of time; the various curves are obtained with different values of the diffusion coefficient. The experimental data are also reported (set 9 in Table 1).
Energies 12 01652 g004
Figure 5. Diffusion coefficient evaluated by the numerical code as a function of the temperature of the specimen and of the initial pressure.
Energies 12 01652 g005
Figure 6. Representation of the function, Φ 1 using the experimental data with a regression line.
Energies 12 01652 g006
Figure 7. Comparison between the results obtained with the numerical code and those of the analytical solution of the dimensional analysis.
Energies 12 01652 g007
Table 1. Conditions of the absorption kinetics measurements and relative calculated diffusion coefficient.
NameInitial Pressure × 105 (Pa)Sample Temperature (°C)Final Hydrogen Content (H/M)Diffusion Coefficient (m2s−1) ×10−10
Test 90.0581500.023080.979
Test 70.1041500.048630.02806
Test 100.1042000.031080.3763
Test 110.2252000.050840.1093
Test 120.1102500.020480.7703
Test 150.1182500.021160.9975
Test 140.2432500.036091.237
Test 130.3642500.044512.46
Test 160.1023000.017741.001
Test 170.3683000.032642.749
Test 180.6613000.041514.526
Test 190.9363000.059083.243
Test 200.1073500.010062.117
Test 220.1003500.043544.917
Test 240.3604000.017262.575
Some examples of absorption curves are reported in Figure 1.

