Costs of Demand Response from Residential Customers’ Perspective
Abstract
1. Introduction
2. Methodology
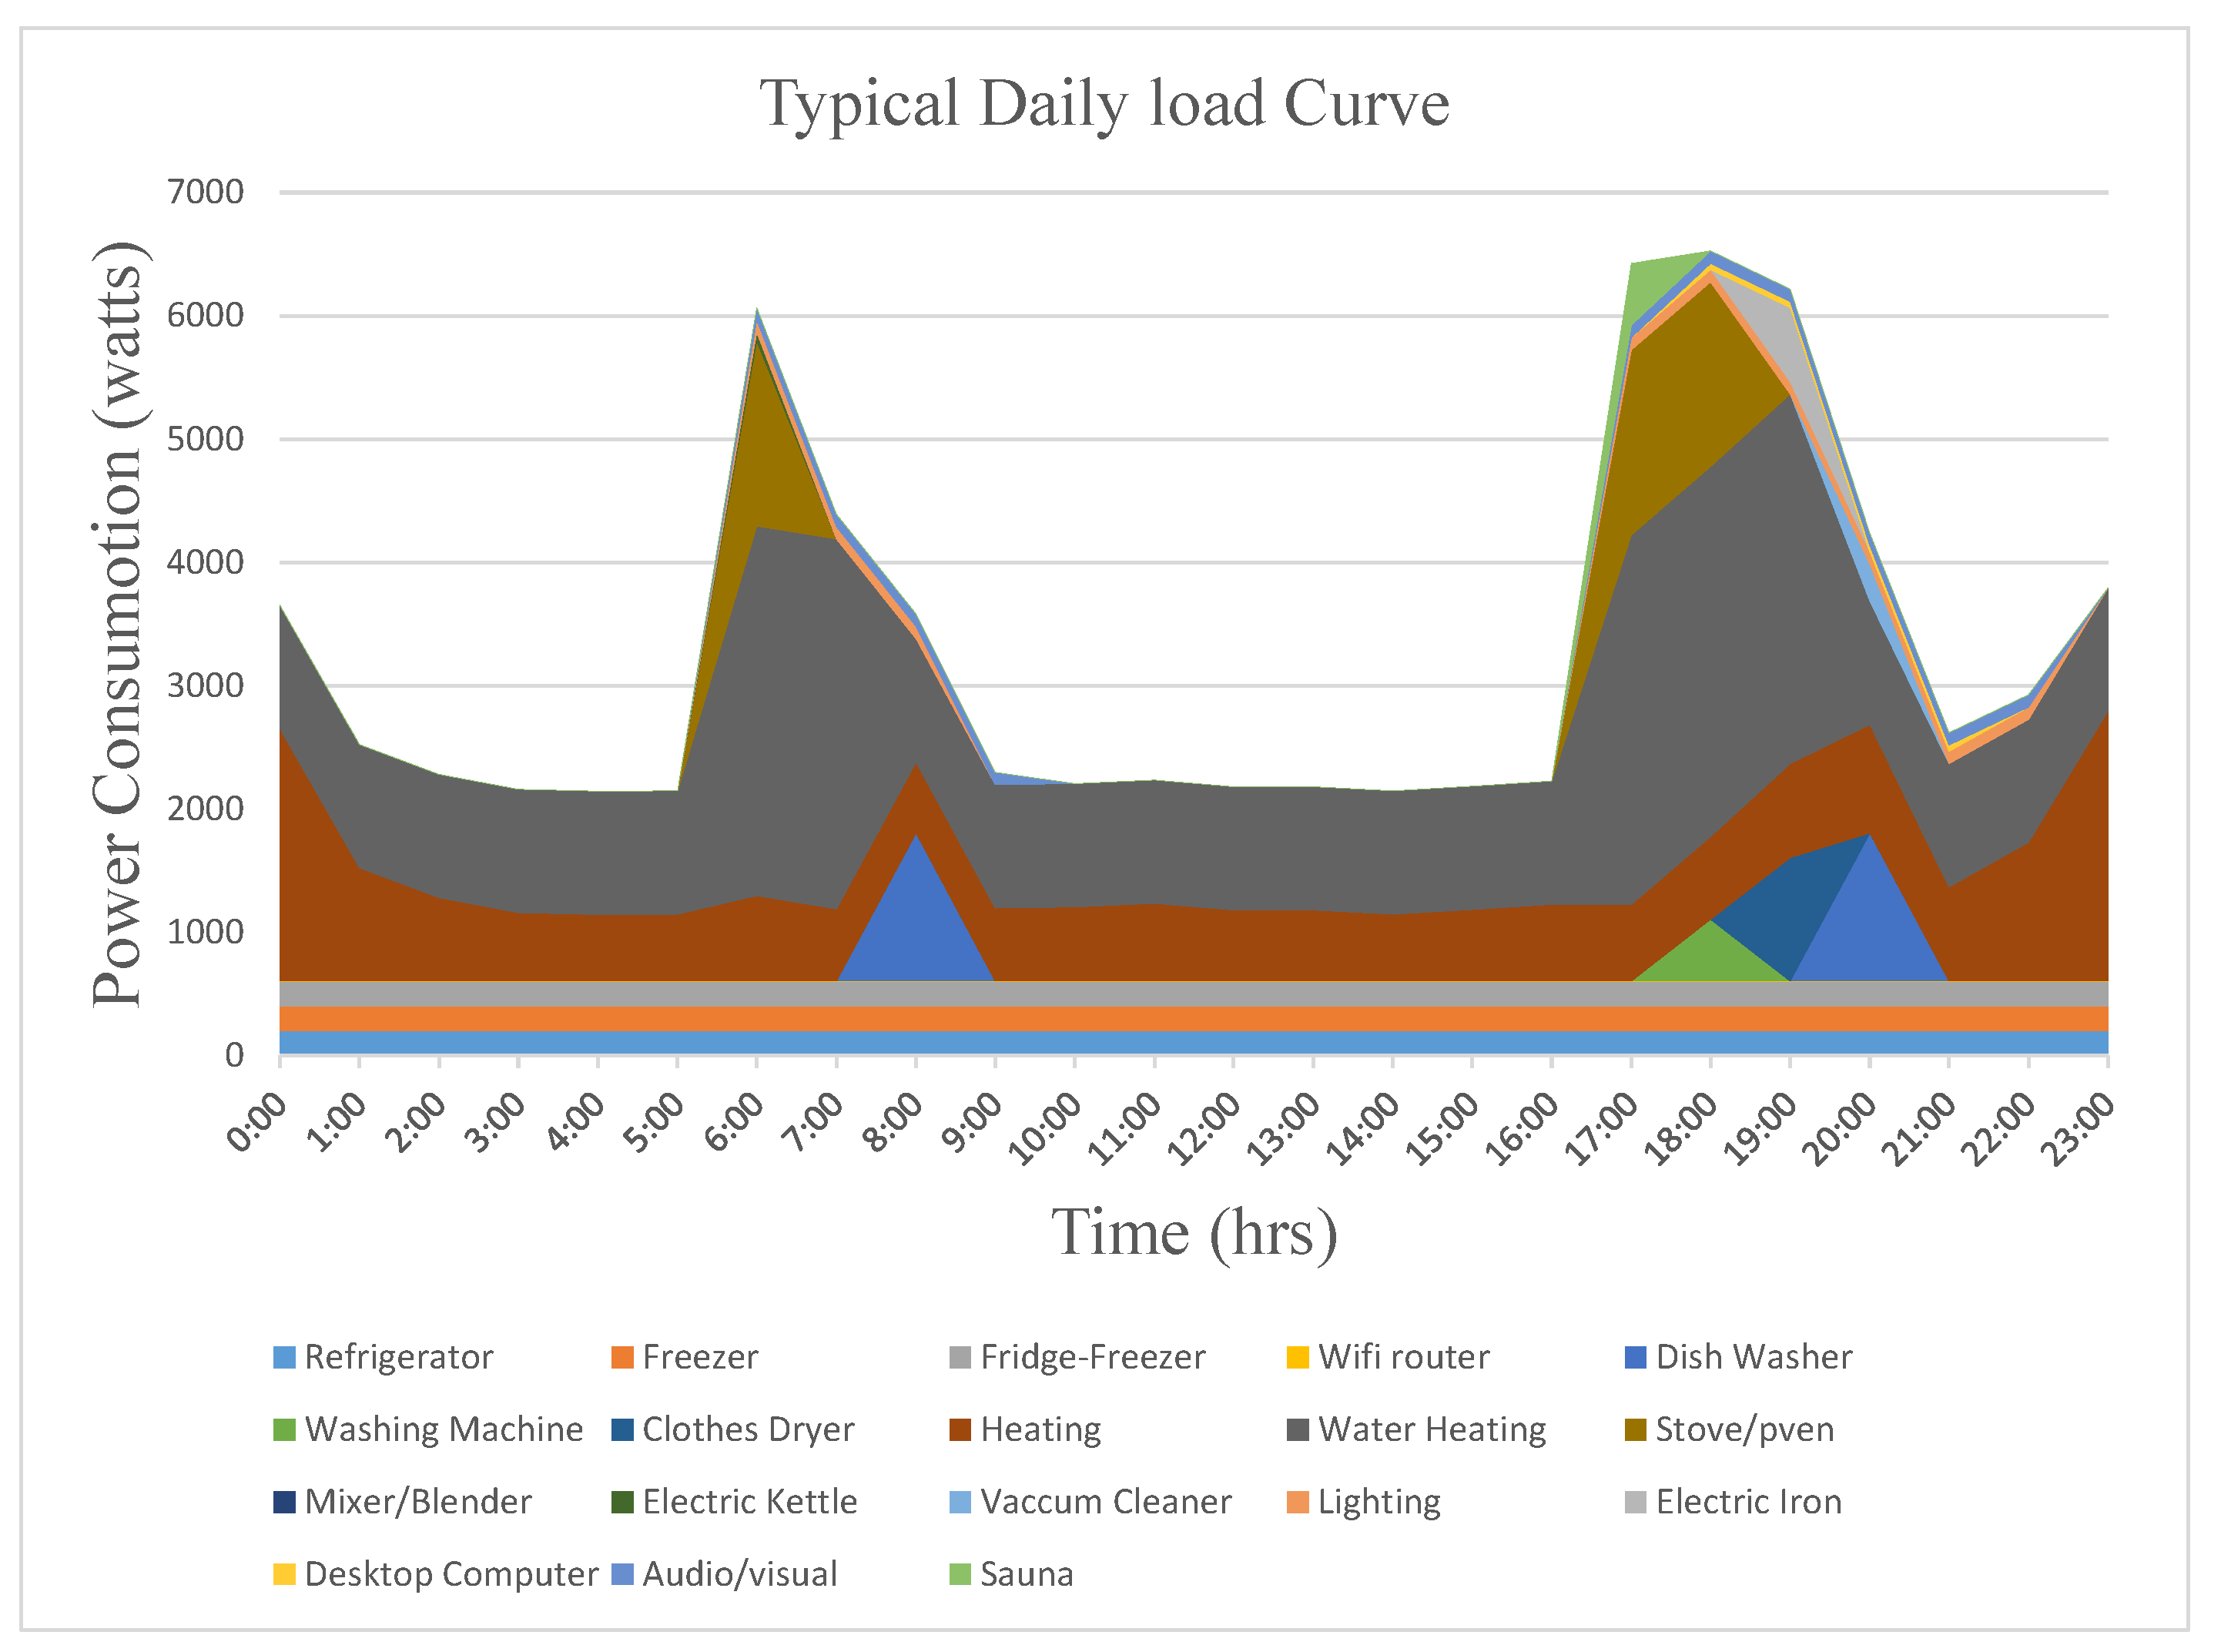
2.1. Daily Load Curve
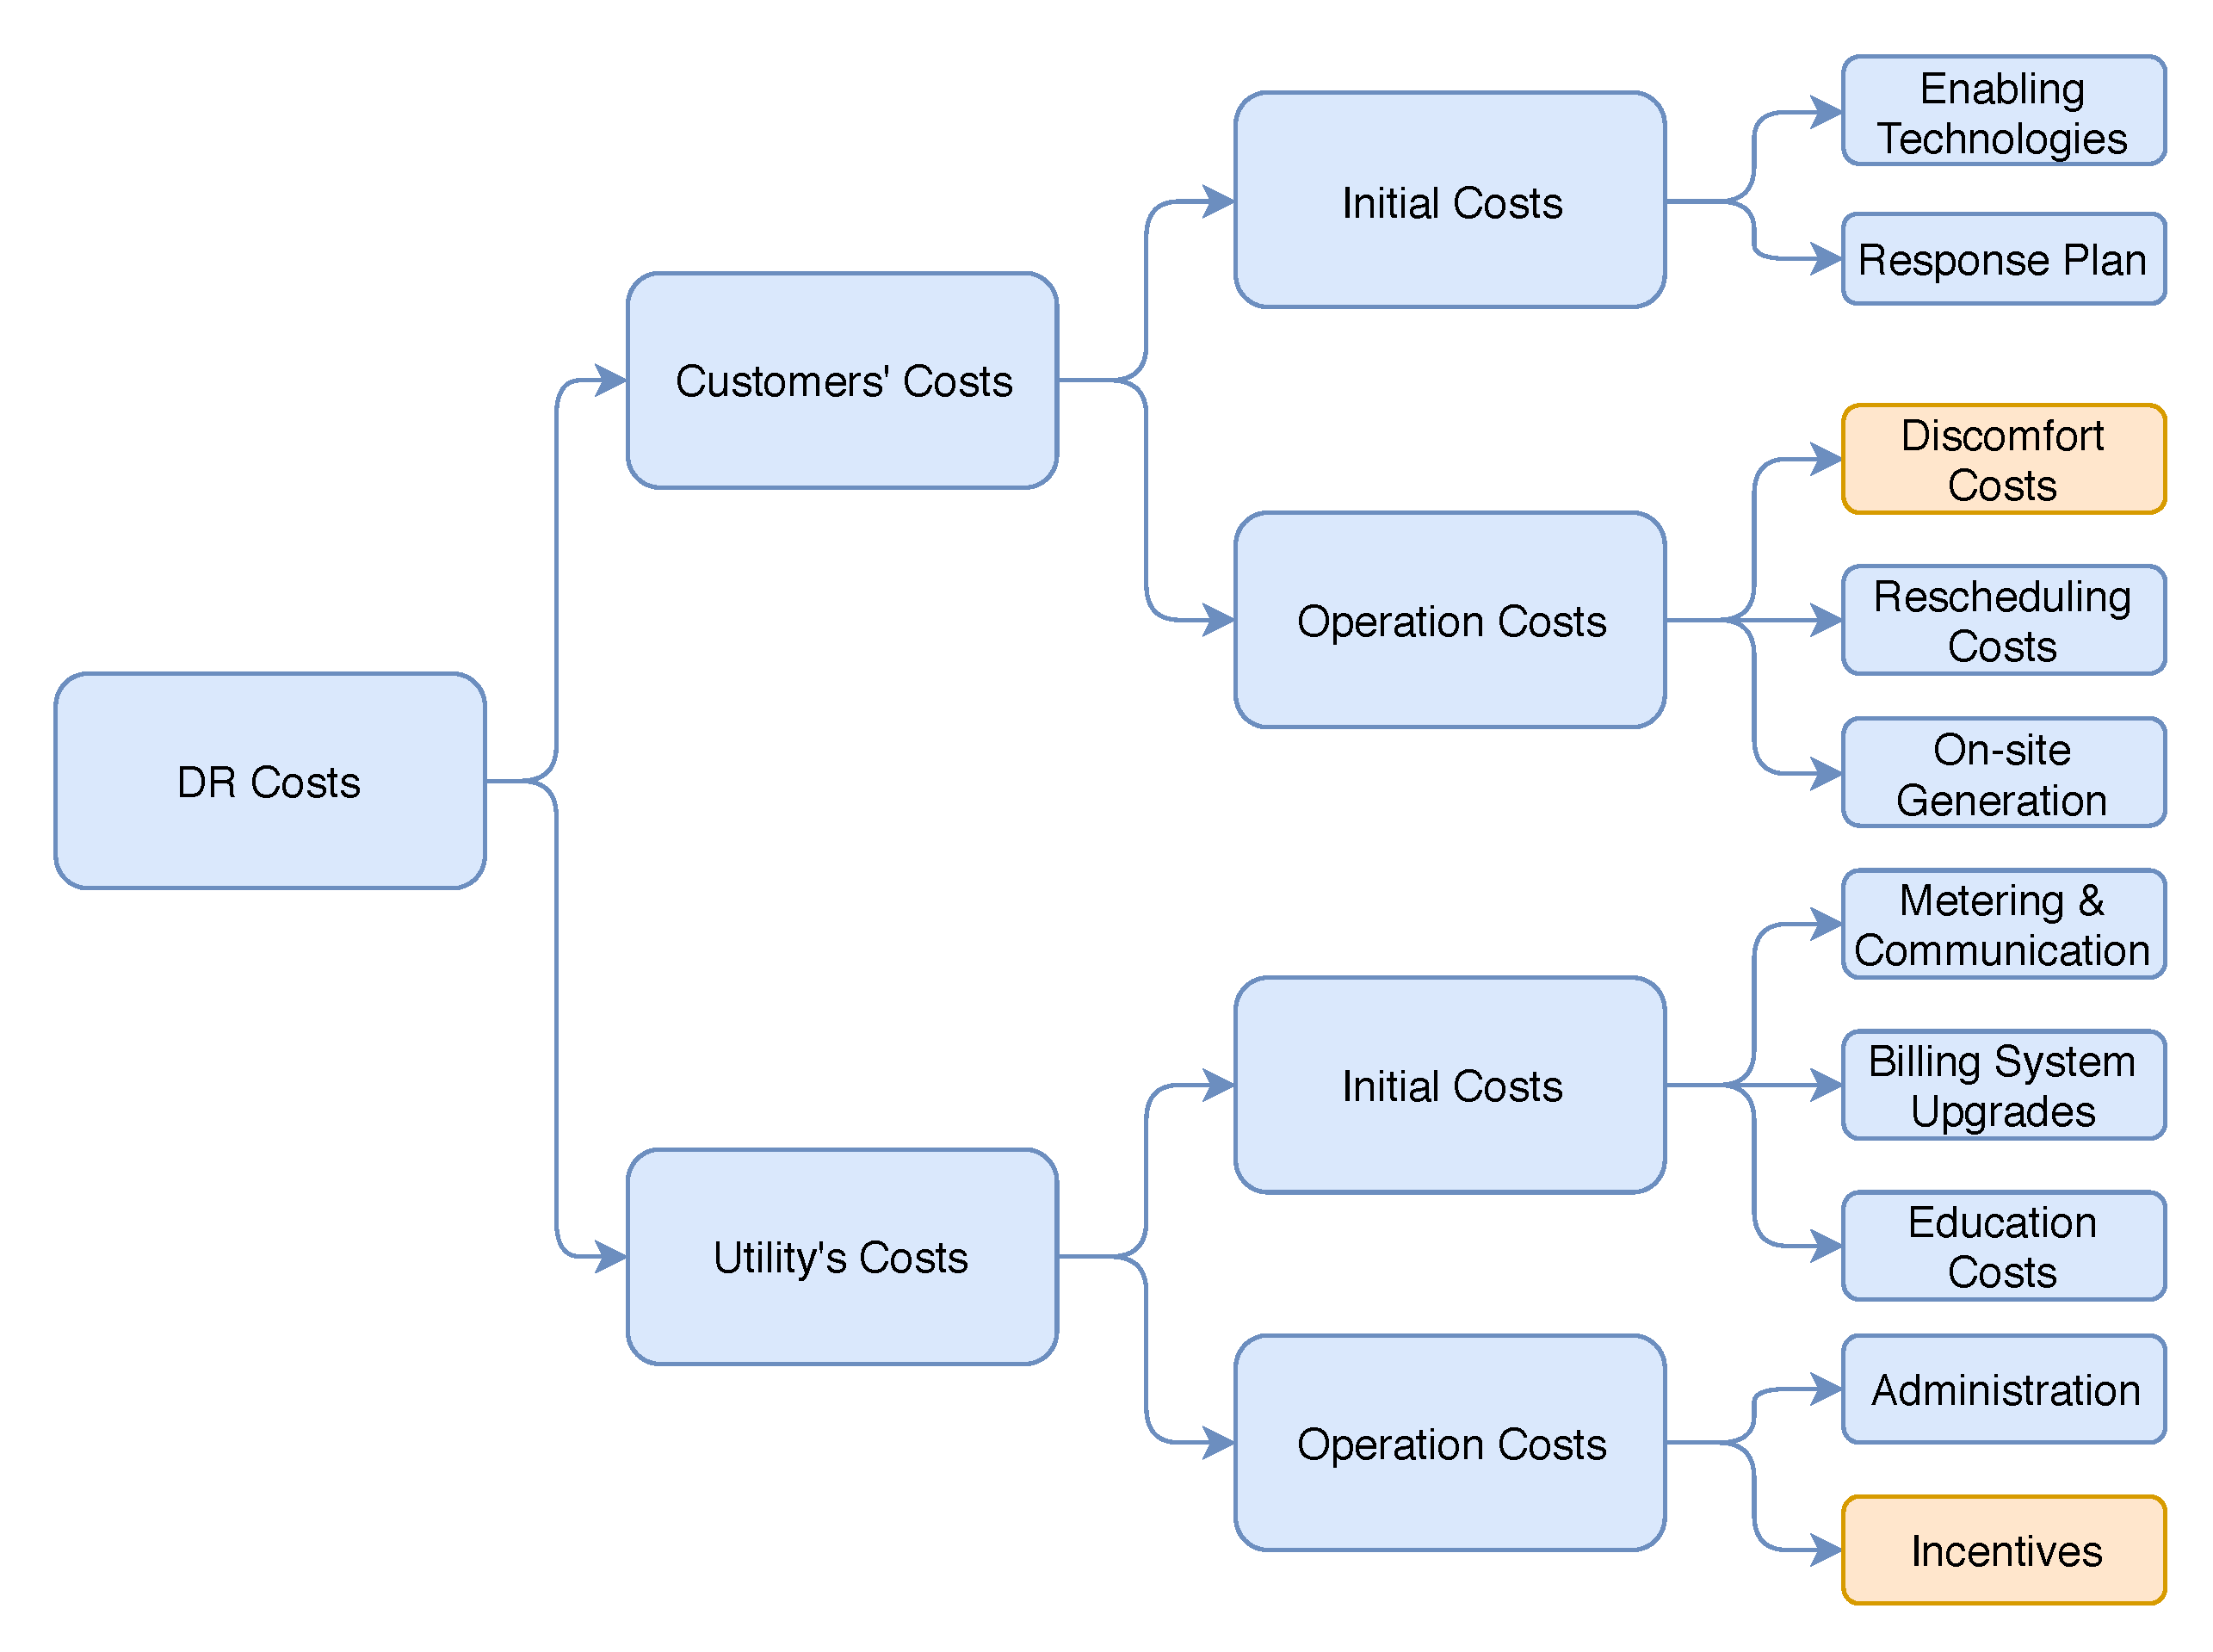
2.2. Direct and Indirect Cost Calculation Methods
2.3. Correlation between Customer Interruption Cost (CIC) and DR Cost
- Food spoilage
- Restriction of leisure activities at home
- Restriction of working performance
- Data loss and reconfiguration of equipment
- Interruption of space heating or cooling, hence compromising the comfort levels
- Other inconvenience
2.4. Procedure
- A customer survey was conducted for 145 residential customers (sample questionnaire is given in Supplementary Materials. Customers were asked to show their willingness to shift, against each of their appliance along with the shifting duration. They were also asked percentage compensation on electricity bills they are willing to accept (WTA) in return. Hence, a WTA approach is adopted in this research. Shifting duration varied from 5 min to 600 min. More details can be found in the survey questionnaire.
- Survey results are given in Appendix A.1 which summarize the percentage shifting flexibility of each appliance against each shifting time interval.
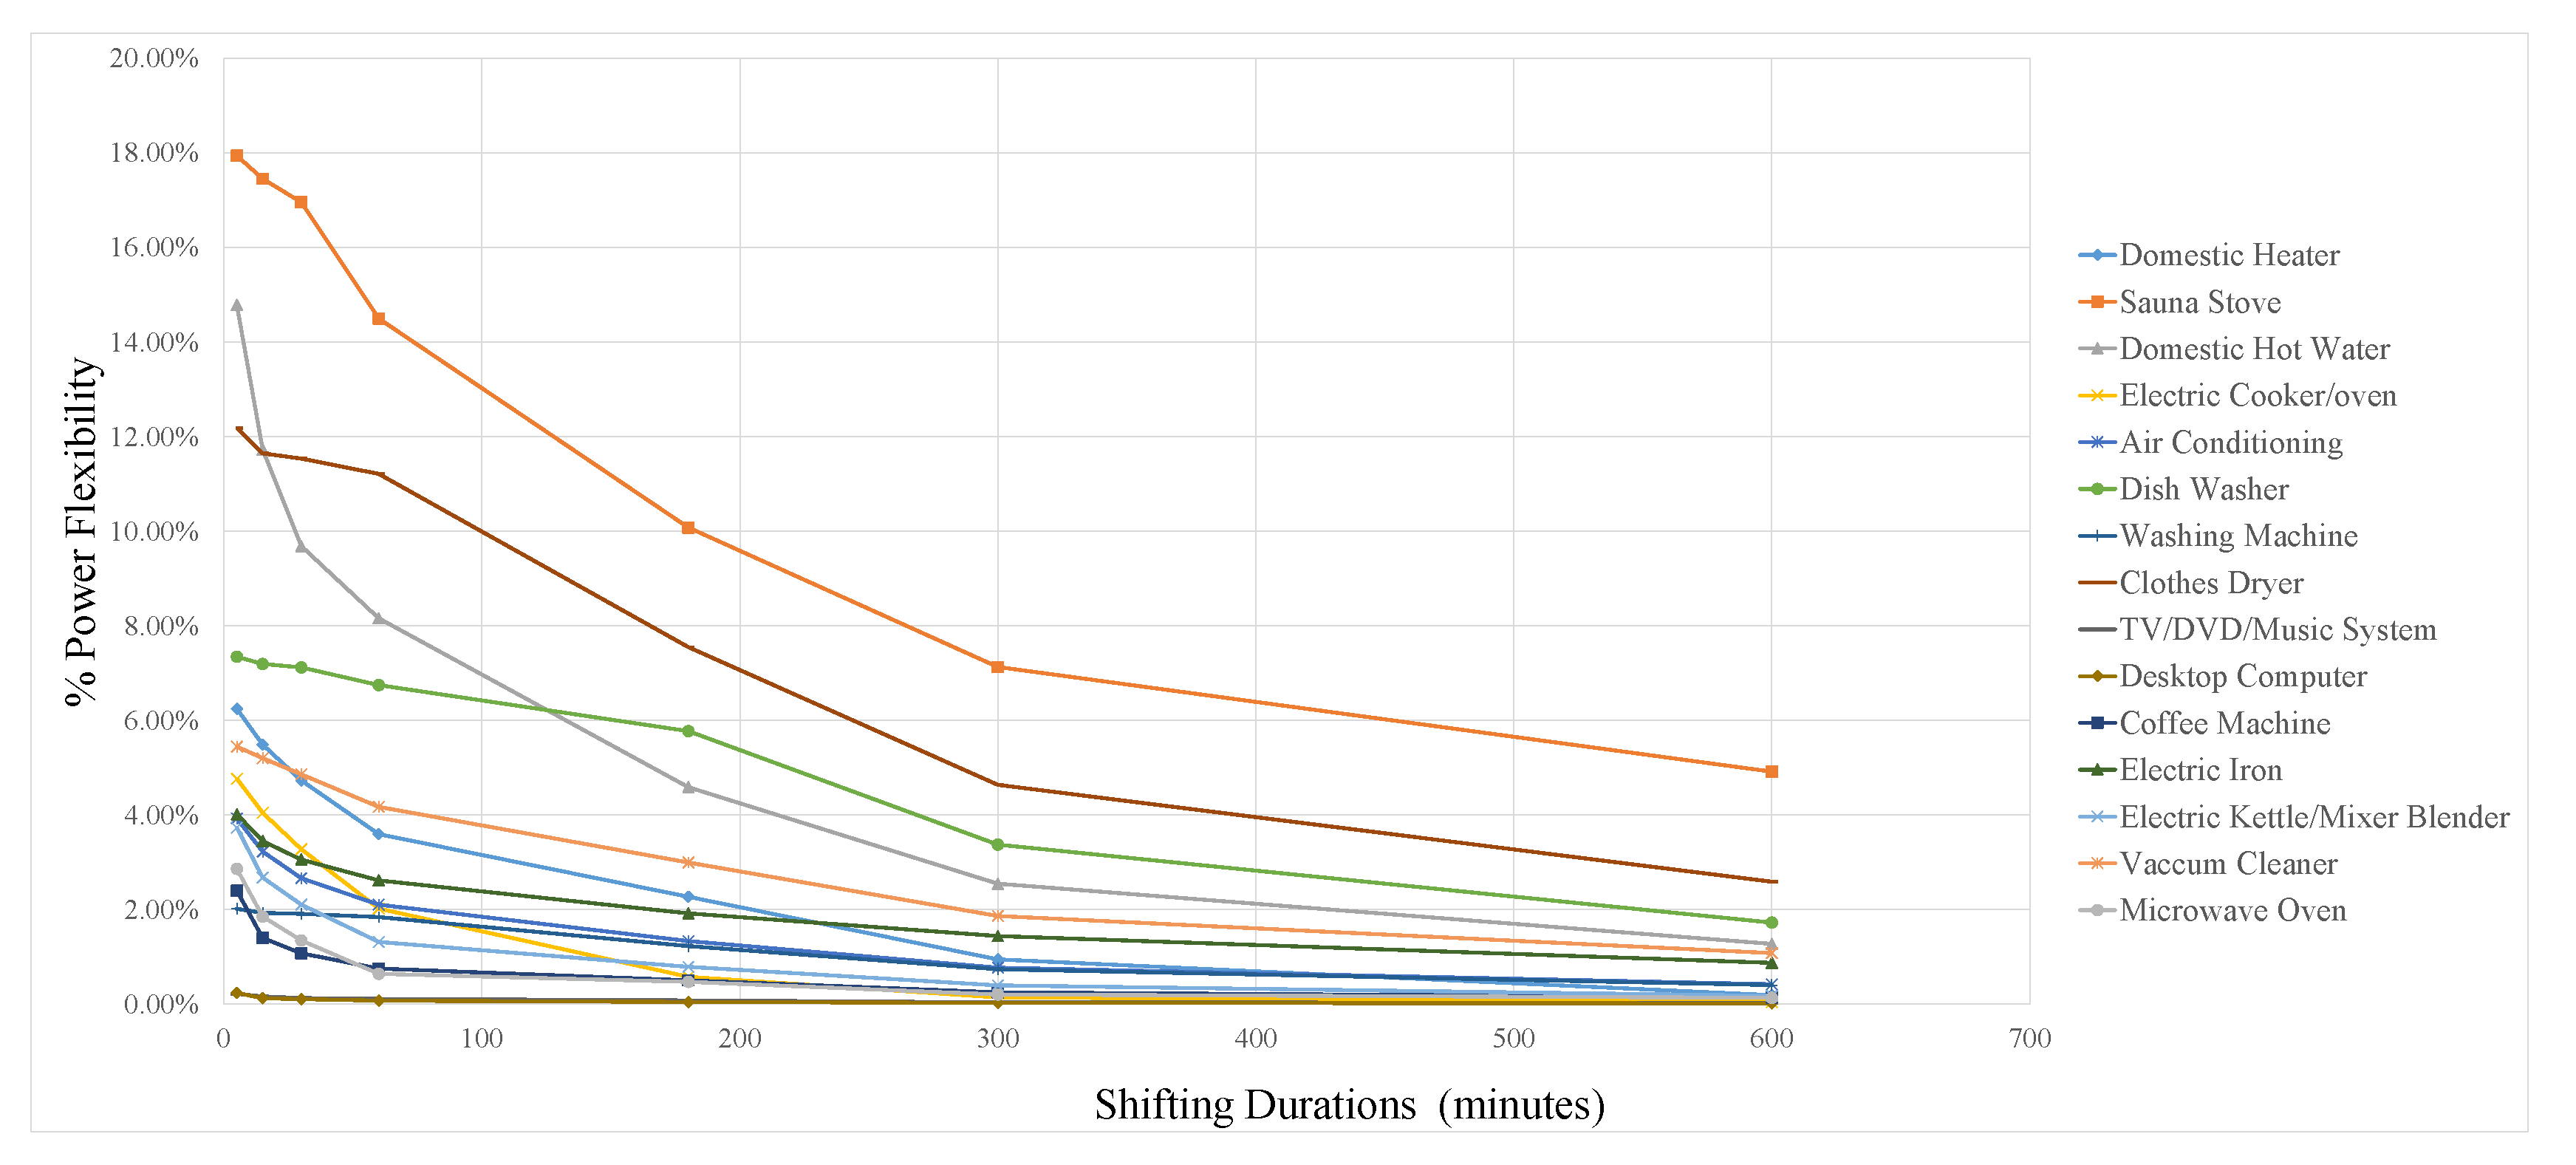
- From the percentage shifting flexibility, a more useful parameter, percentage power flexibility was calculated.
- Average percentage compensation is calculated for all the houses.
- Average dependency factor for all the customers on electricity is calculated based on the shifting flexibility.
- DR cost is calculated by using the average compensation percentage and dependency factor. Both are then compared with CIC.
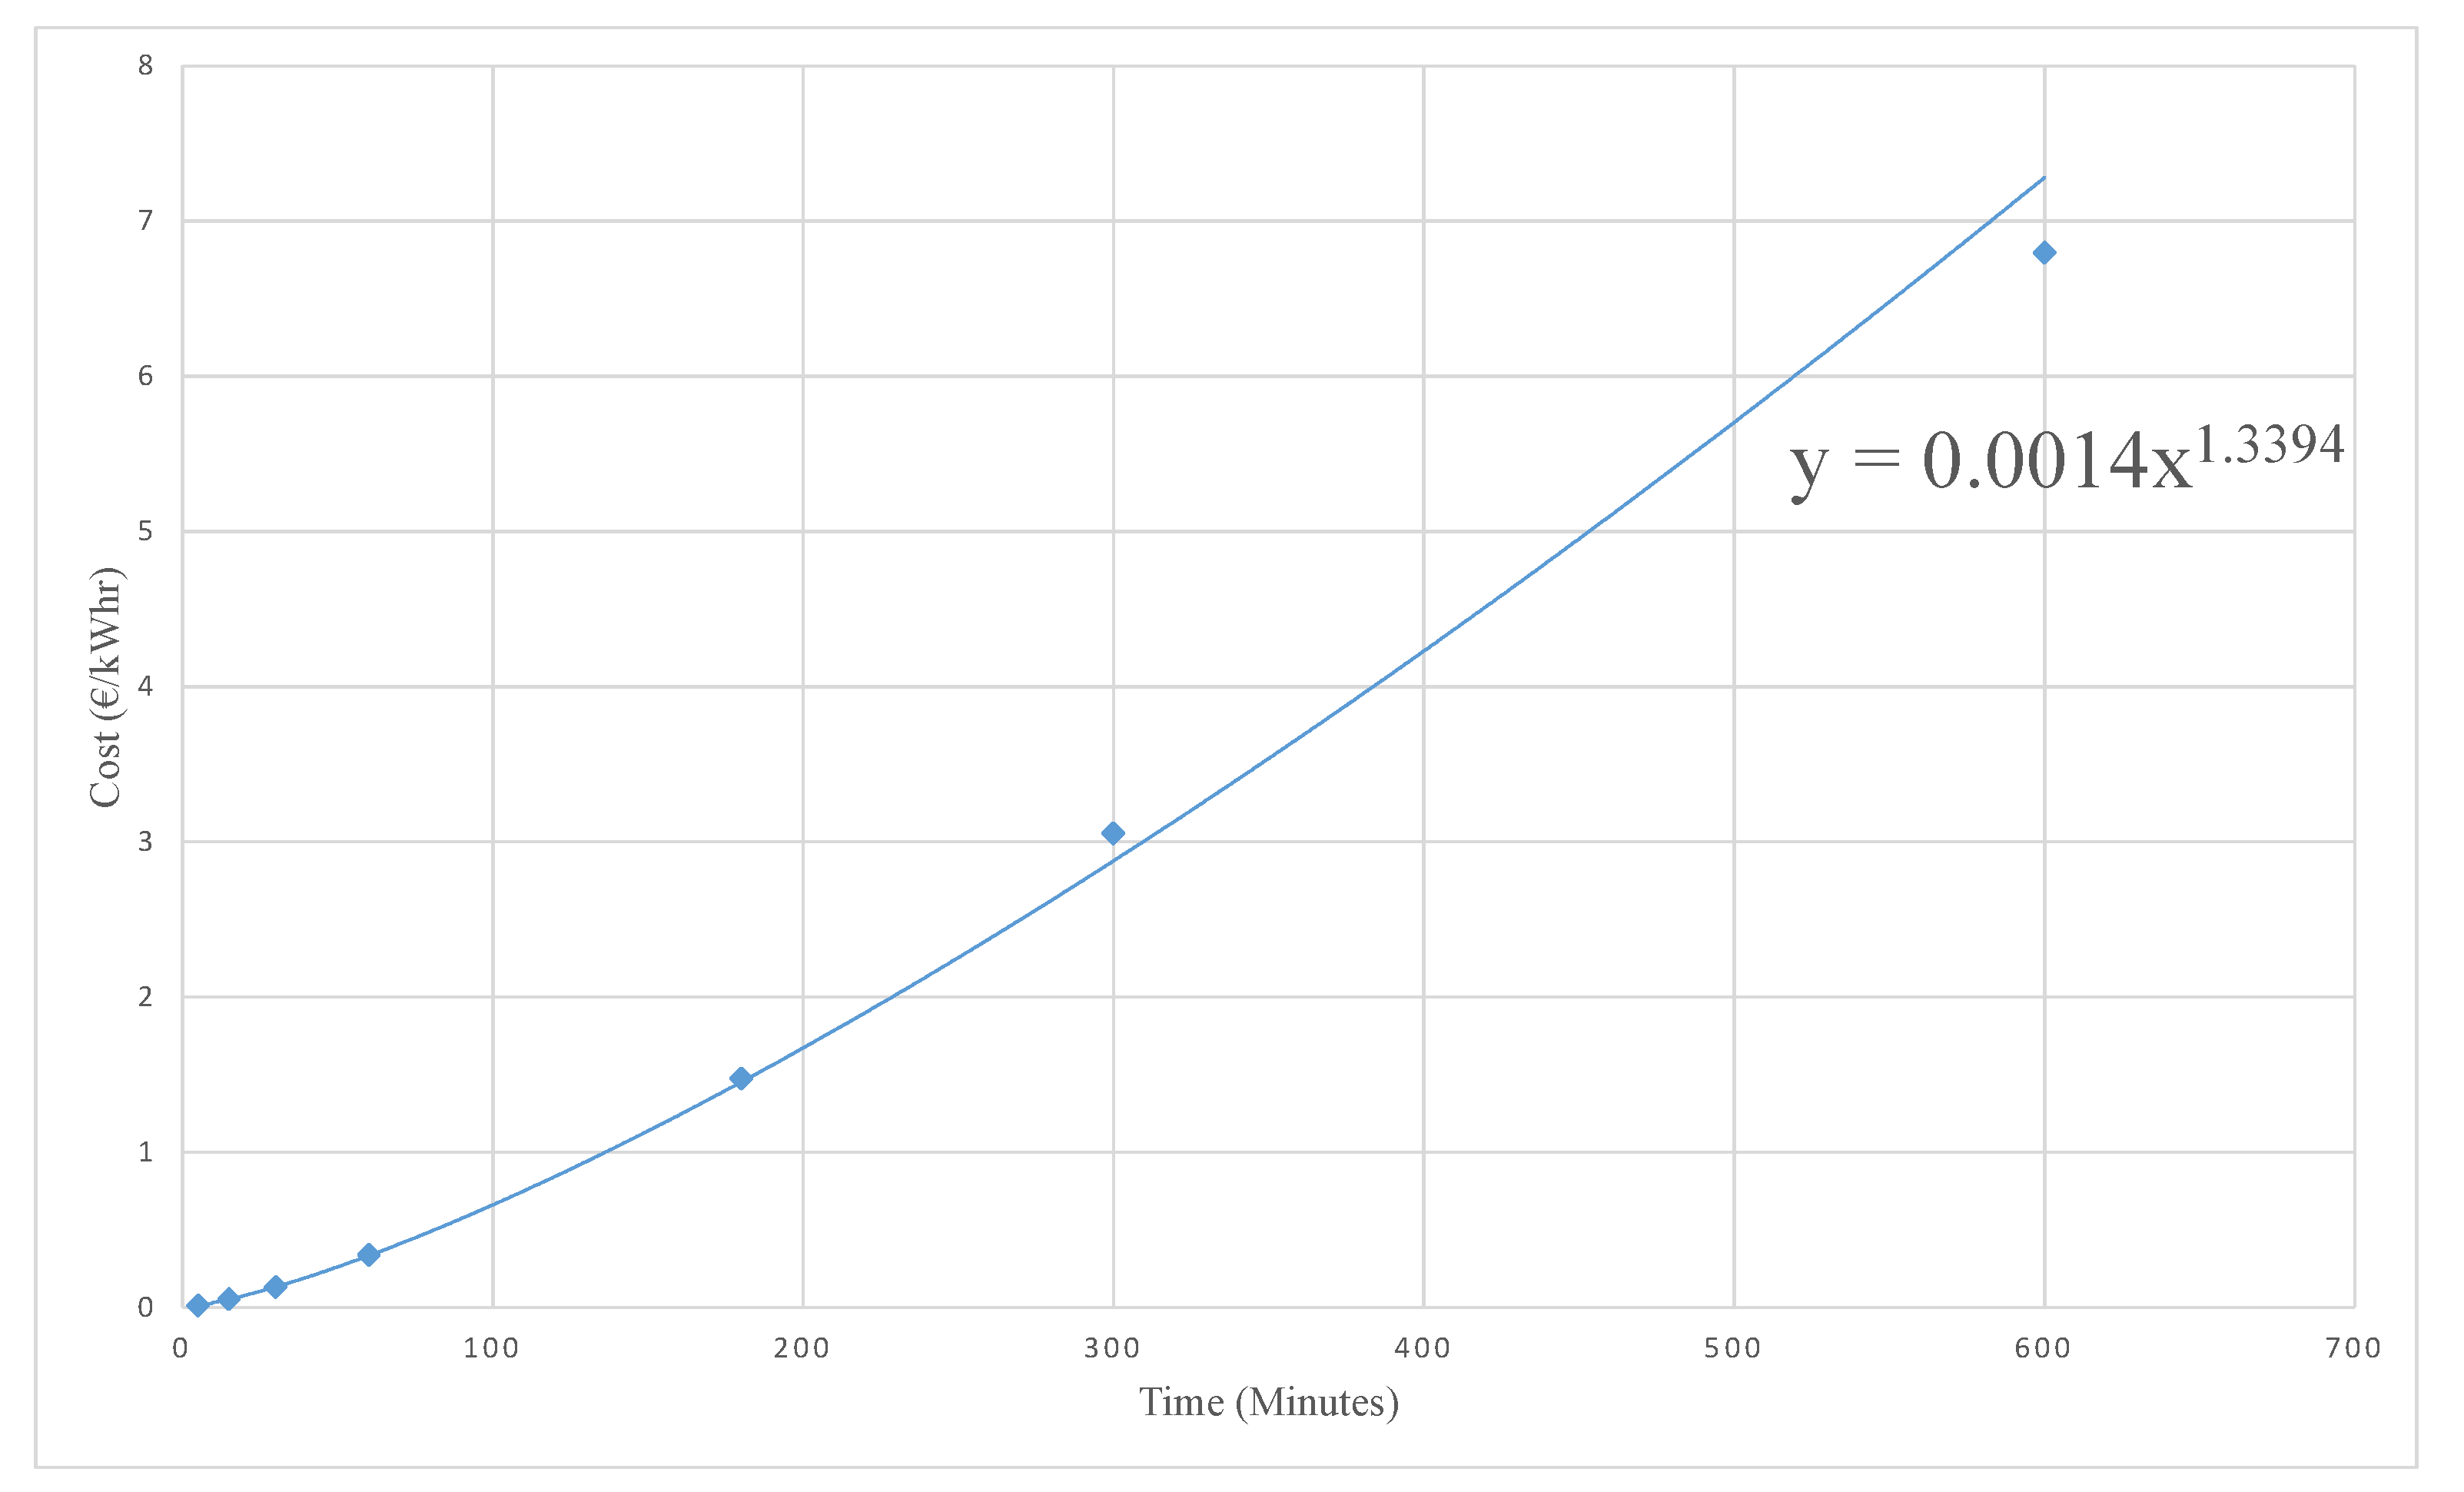
- The DR costs calculated above are then plotted as a function of shifting intervals to find a mathematical relationship.
3. Customer Survey and DR Cost Calculation
3.1. Sample Data Analysis
3.2. Average Flexibility of Appliances
3.3. Reduction in Power Reduction Due to the Shifting of Domestic Appliances
3.4. Compensation Cost Calculation
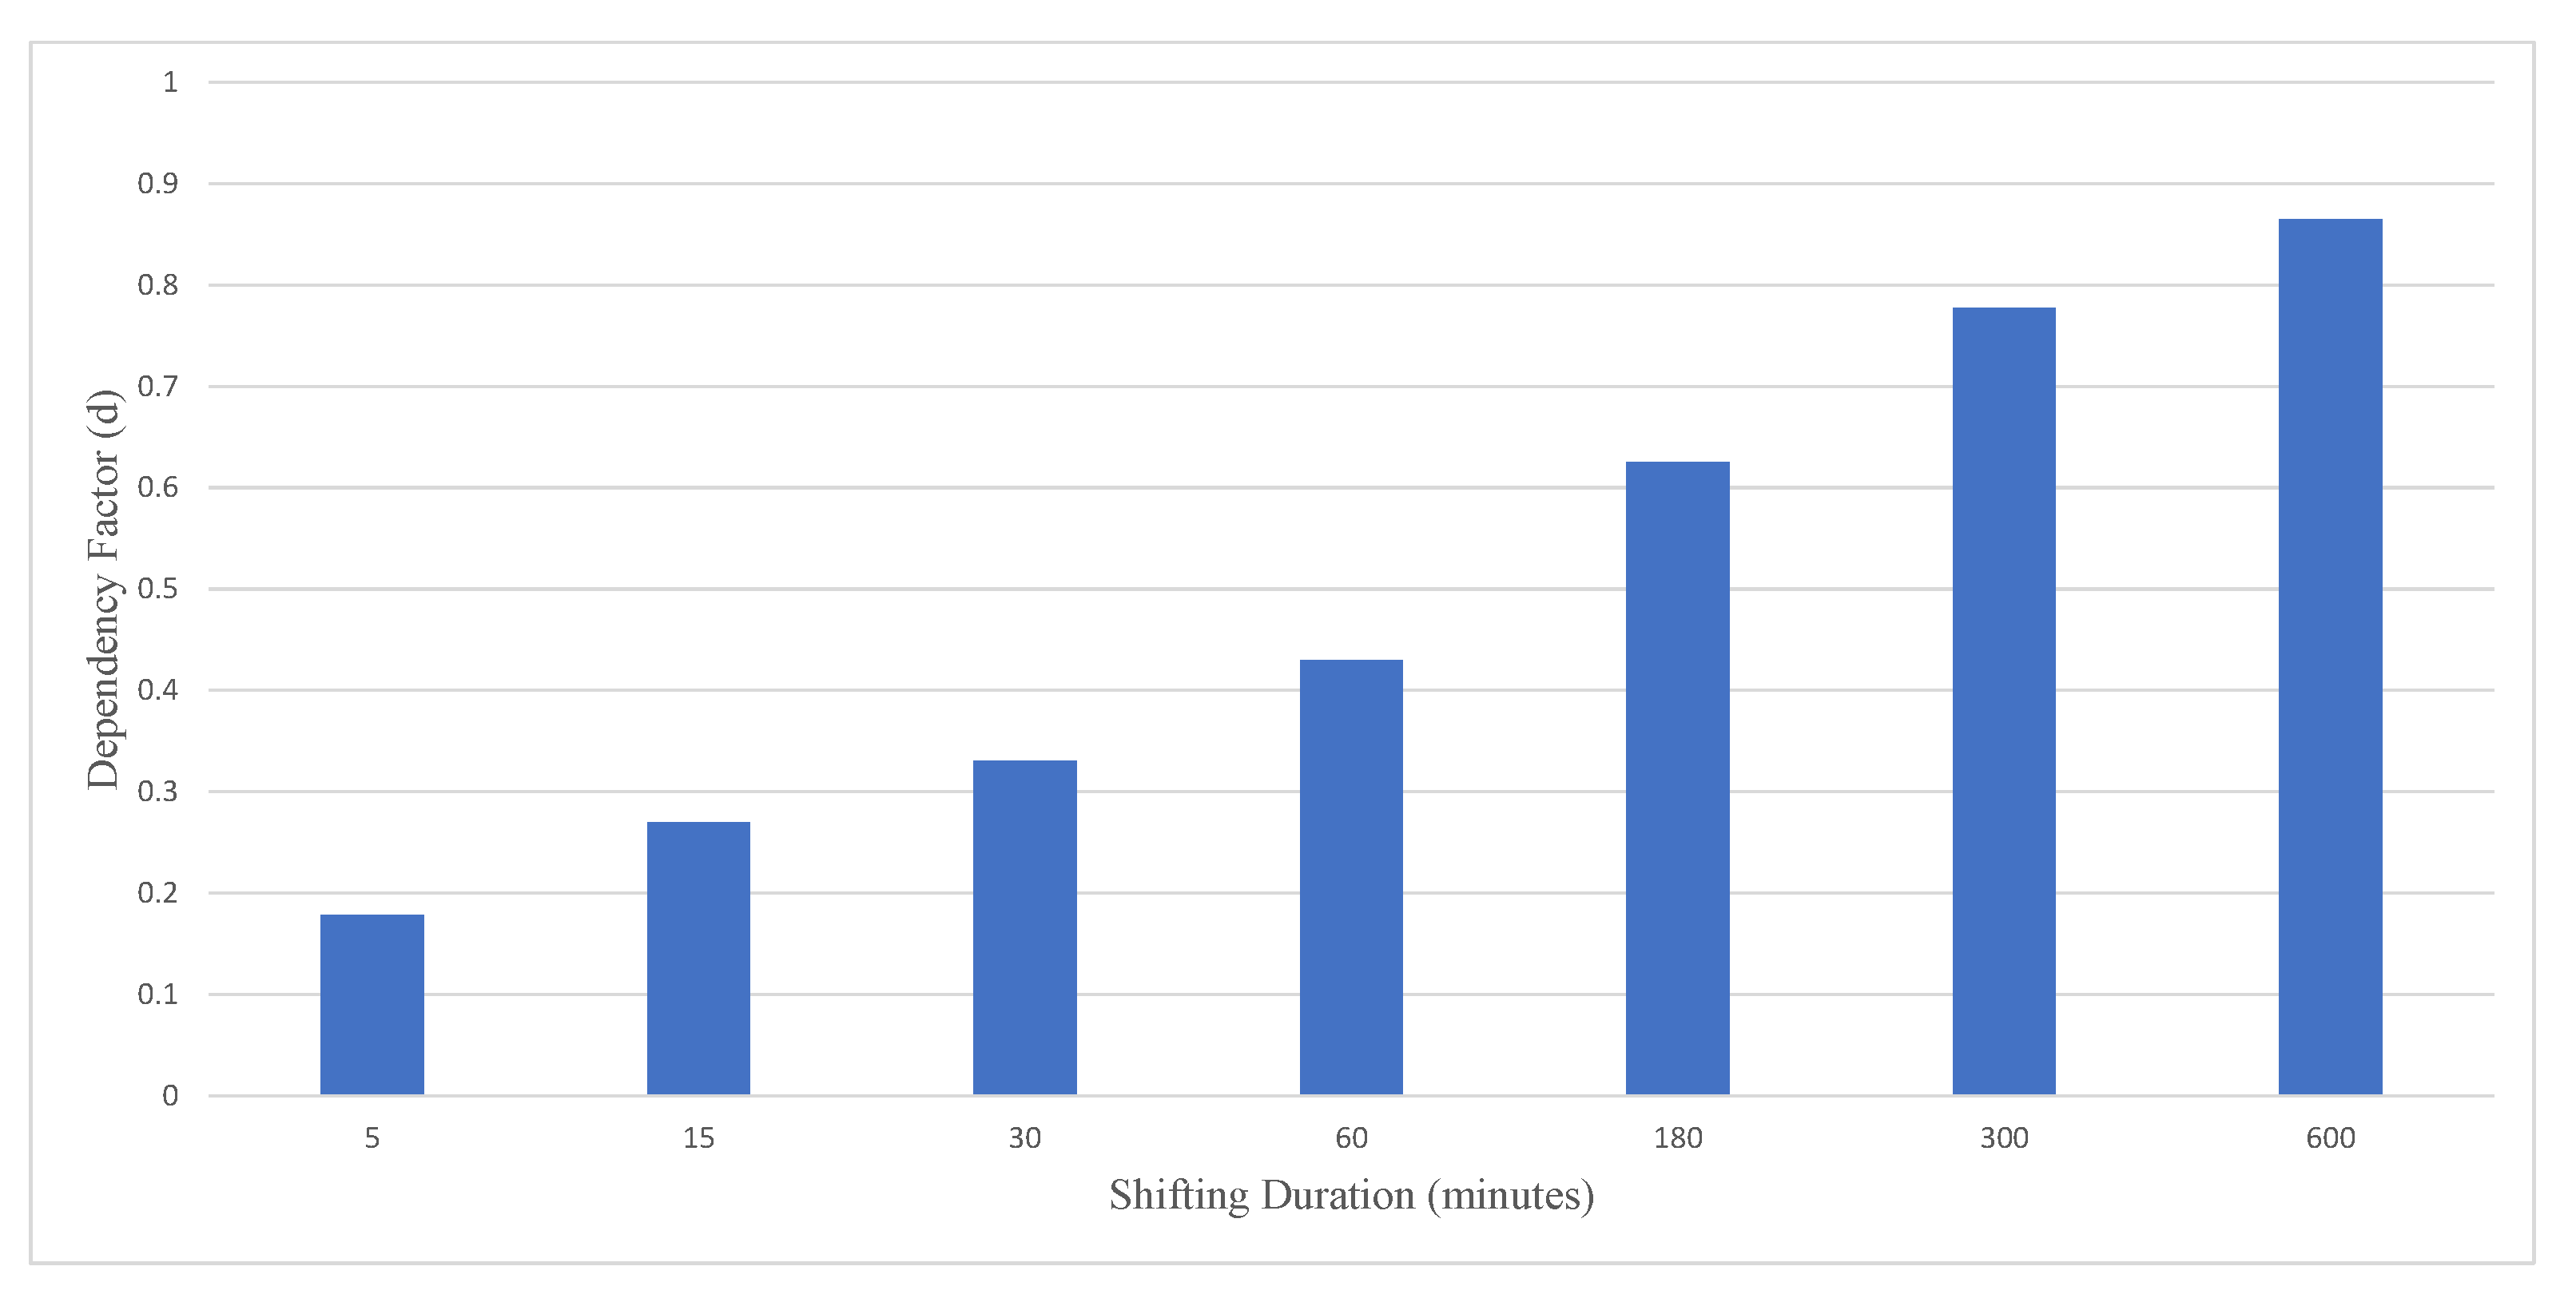
3.5. Customers’ Dependency Factor ‘d’
3.6. DR Cost Calculation Based on Dependency Factor d
4. Comparison between CIC and DR Compensation Cost
5. Conclusions
Supplementary Materials
Author Contributions
Funding
Conflicts of Interest
Appendix A
Appendix A.1. Survey Results
| Appliance Name | Ownership | NWS | 5 min Shift | 15 min Shift | 30 min Shift | 60 min Shift | 180 min Shift | 300 min Shift | 600 min Shift |
|---|---|---|---|---|---|---|---|---|---|
| Domestic Heater | 55% | 17.50% | 10% | 10% | 15% | 17.50% | 17.50% | 10% | 2.50% |
| Sauna Stove | 53% | 5.20% | 2.60% | 2.60% | 12.99% | 23.37% | 15.88% | 11.68% | 25.97% |
| Domestic Hot Water | 46% | 12.12% | 18.18% | 12.12% | 9.09% | 21.21% | 12.12% | 7.58% | 7.58% |
| Electric Cooker | 90% | 24.50% | 11.45% | 12.21% | 19.84% | 22.90% | 6.87% | 1.52% | 0.76% |
| Air Conditioning | 41% | 6.67% | 16.67% | 13.33% | 13.33% | 18.33% | 13.33% | 8.33% | 10% |
| Dish Washer | 70% | 2.97% | 1.98% | 1% | 4.95% | 12.87% | 31.68% | 21.78% | 22.77% |
| Washing Machines | 83% | 4.17% | 4.17% | 0.83% | 3.33% | 29.16% | 23.33% | 15.83% | 19.16% |
| Clothes Dryer | 81% | 3.42% | 4.27% | 0.85% | 2.56% | 29.05% | 23.08% | 16.23% | 20.51% |
| AV Systems | 79% | 35% | 17.54% | 8.71% | 6.14% | 9.65% | 11.40% | 3.51% | 7.89% |
| Desktop Computer | 78% | 43.36% | 26.55% | 5.31% | 7.08% | 7.08% | 3.54% | 3.54% | 3.54% |
| Coffee Machine | 65% | 28.72% | 29.79% | 9.57% | 9.58% | 7.45% | 7.45% | 3.19% | 4.26% |
| Electric Iron | 73% | 13.21% | 12.26% | 8.50% | 9.43% | 15.09% | 10.38% | 12.26% | 18.87% |
| Cooking Accessories | 79% | 26.08% | 20.87% | 11.30% | 15.65% | 10.43% | 7.83% | 4.35% | 3.47% |
| Vacuum Cleaner | 83% | 7.50% | 4.17% | 5.83% | 11.66% | 20% | 19.16% | 13.33% | 18.33% |
| MW Oven | 86% | 32% | 24% | 12% | 16.80% | 4% | 6.40% | 1.60% | 3.20% |
Appendix A.2. Flexibility of Individual Appliances
| Shifting Intervals (min) | 5 | 15 | 30 | 60 | 180 | 300 | 600 |
|---|---|---|---|---|---|---|---|
| Domestic Heater | 83% | 73% | 63% | 48% | 30% | 13% | 3% |
| Sauna Stove | 95% | 92% | 90% | 77% | 53% | 38% | 26% |
| Domestic Hot water tank | 88% | 70% | 58% | 48% | 27% | 15% | 8% |
| Electric Cooker/Oven | 76% | 64% | 52% | 32% | 9% | 2% | 1% |
| Air Conditioning | 93% | 77% | 63% | 50% | 32% | 18% | 10% |
| Dish Washer | 97% | 95% | 94% | 89% | 76% | 45% | 23% |
| Washing Machine | 96% | 92% | 91% | 88% | 58% | 35% | 19% |
| Clothes Dryer | 97% | 92% | 91% | 89% | 60% | 37% | 21% |
| Tv/Video/DVD/Music System | 65% | 47% | 39% | 32% | 23% | 11% | 8% |
| Desktop Computer | 57% | 30% | 25% | 18% | 11% | 7% | 4% |
| Coffee Machine | 71% | 41% | 32% | 22% | 15% | 7% | 4% |
| Electric Iron | 87% | 75% | 66% | 57% | 42% | 31% | 19% |
| Electric Kettle/Mixer/Blender | 74% | 53% | 42% | 26% | 16% | 8% | 3% |
| Vacuum Cleaner | 93% | 88% | 83% | 71% | 51% | 32% | 18% |
| Microwave Oven | 68% | 44% | 32% | 15% | 11% | 5% | 3% |
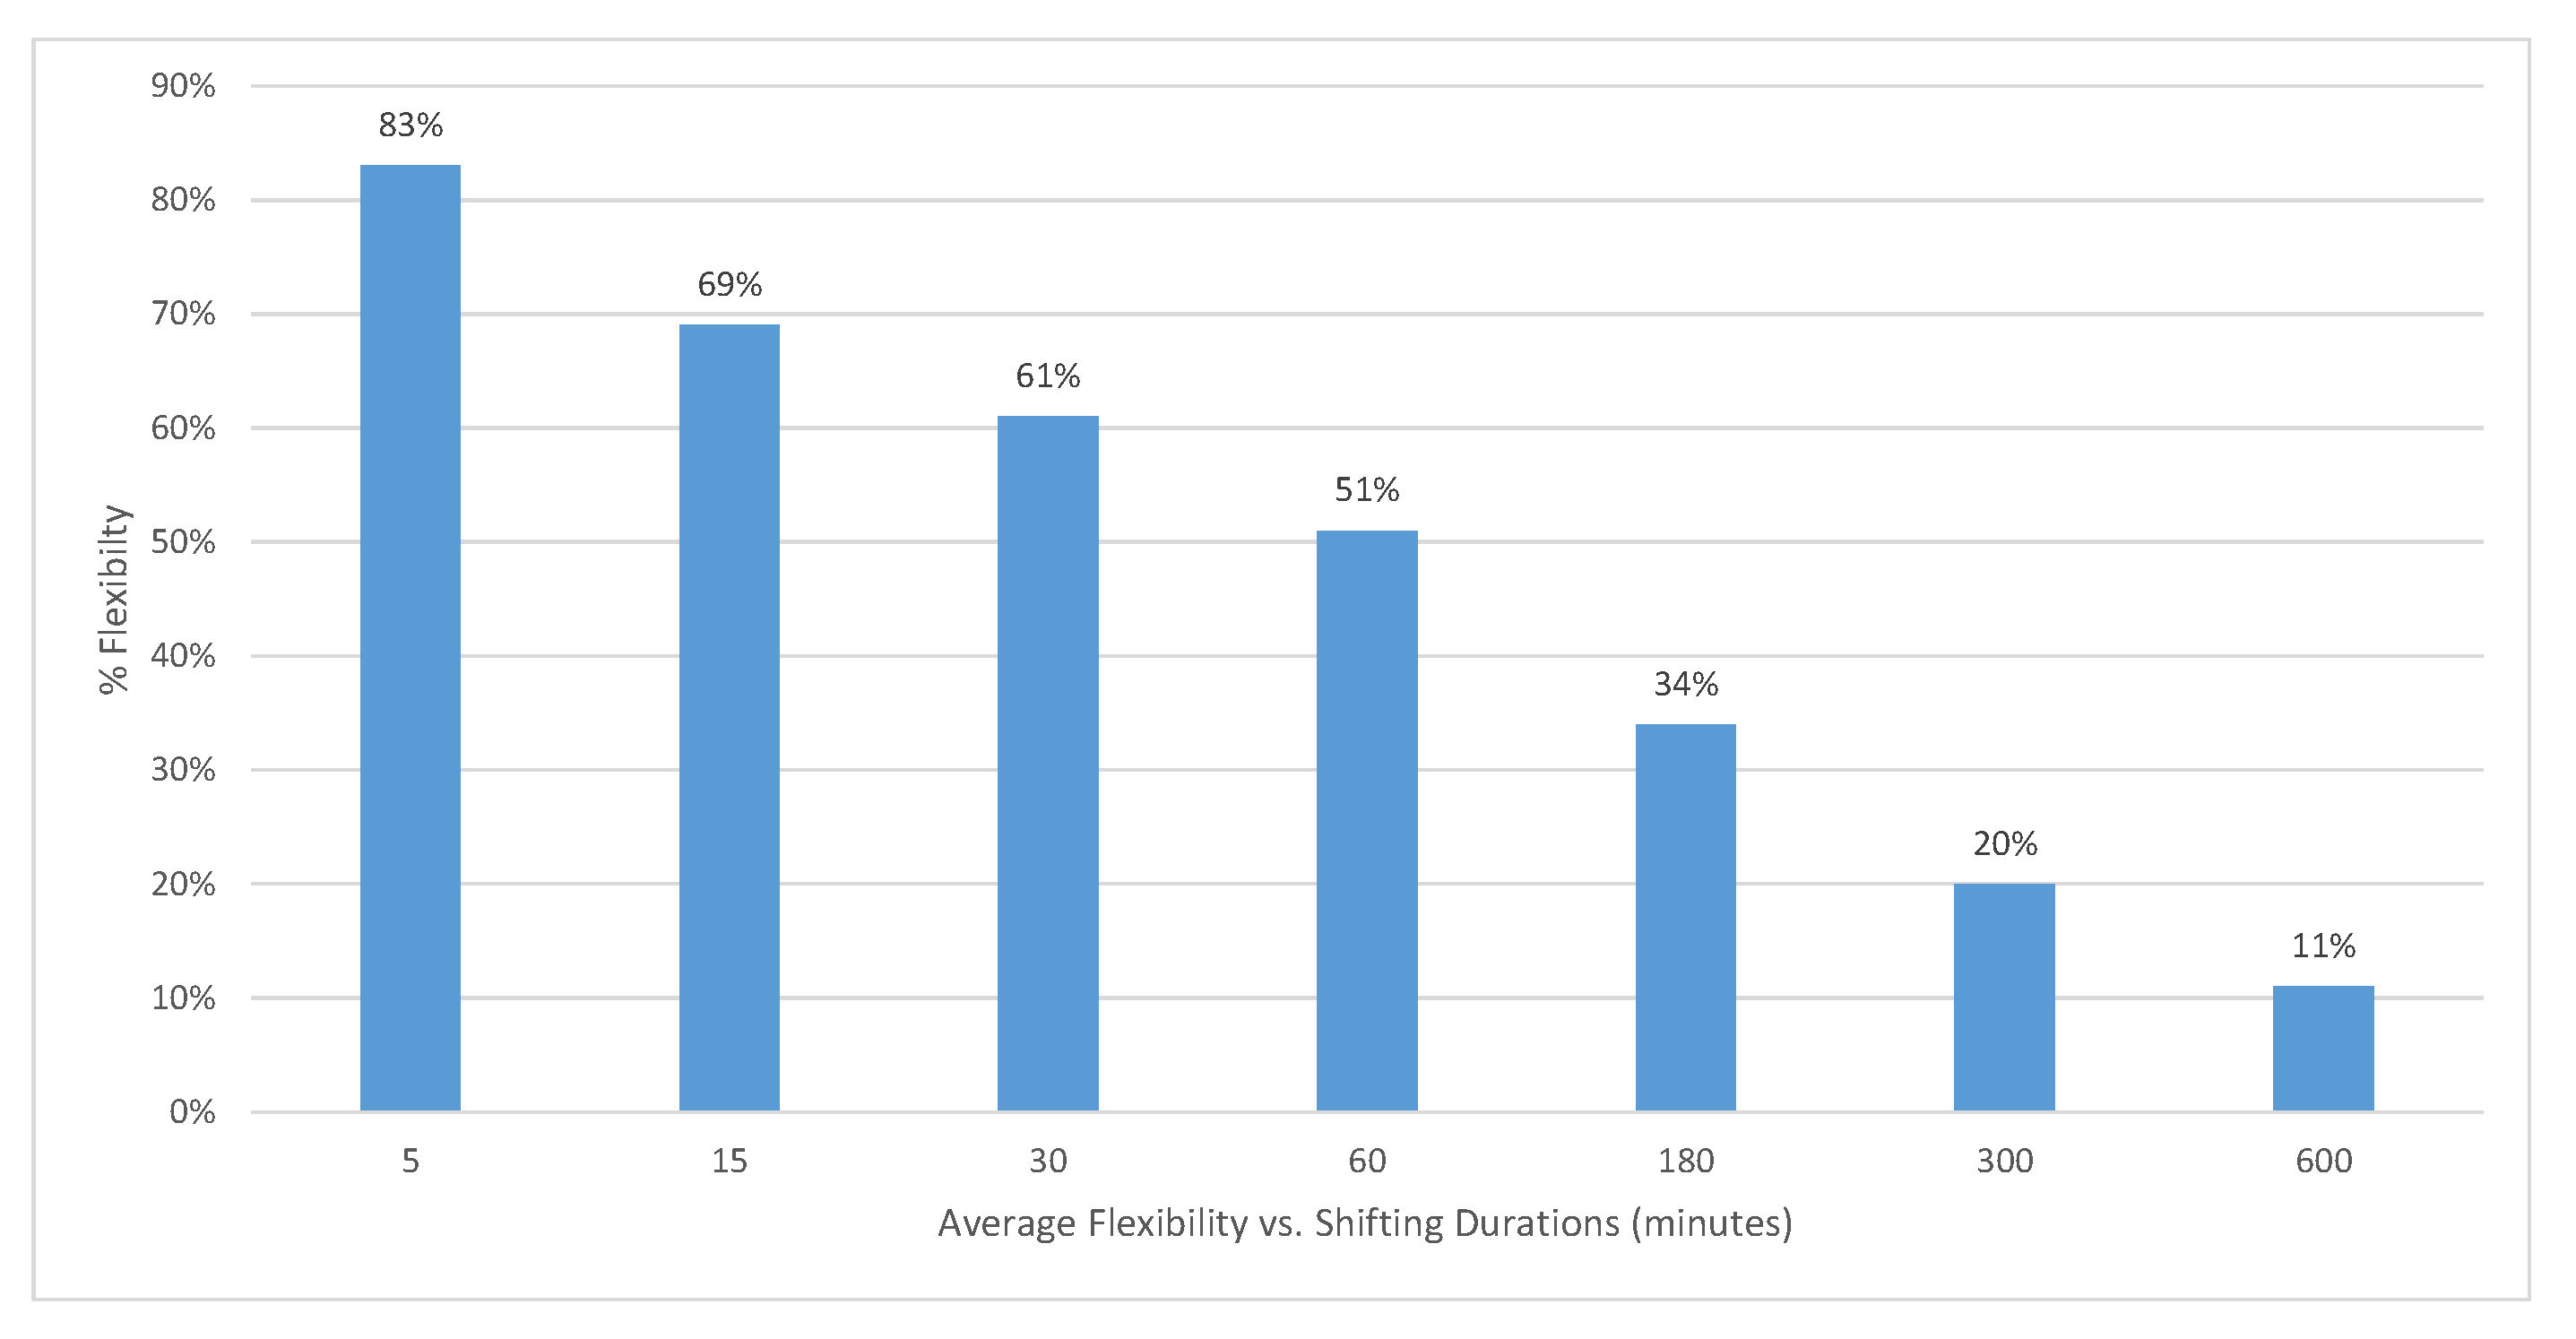
| Average Flexibility | 83% | 69% | 61% | 51% | 34% | 20% | 11% |
References
- Safdar, M.; Ahmad, M.; Hussain, A.; Lehtonen, M. Optimized residential load scheduling under user defined constraints in a real-time tariff paradigm. In Proceedings of the 2016 17th International Scientific Conference on Electric Power Engineering (EPE), Prague, Czech Republic, 16–18 May 2016; pp. 1–6. [Google Scholar]
- Strbac, G. Demand side management: Benefits and challenges. Energy Policy 2008, 36, 4419–4426. [Google Scholar] [CrossRef]
- Palmer, J.; Terry, N.; Kane, T.; Firth, S.; Hughes, M.; Pope, P.; Young, J.; Knight, D.; Godoy-Shimizu, D. Further Analysis of the Household Electricity Use Survey Electrical Appliances at Home: Tuning in to Energy Saving. Cambridge Architectural Research Limited. Technical Report. 2012. Available online: https://assets.publishing.service.gov.uk/government/uploads/system/uploads/attachment_data/file/275484/electricity_survey_2_tuning_in_to_energy_saving.pdf (accessed on 27 April 2019).
- Küfeoğlu, S.; Lehtonen, M. Comparison of different models for estimating the residential sector customer interruption costs. Electr. Power Syst. Res. 2015, 122, 50–55. [Google Scholar] [CrossRef]
- Wang, S.; Xue, X.; Yan, C. Building power demand response methods toward smart grid. HVAC&R Res. 2014, 20, 665–687. [Google Scholar]
- Kostková, K.; Omelina, L’.; Kyčina, P.; Jamrich, P. An introduction to load management. Electr. Power Syst. Res. 2013, 95, 184–191. [Google Scholar] [CrossRef]
- Bashir Ahmad, A.; Pourakbari Kasmaei, M.; Safdarian, A.; Lehtonen, M. Matching of Local Load with On-Site PV Production in a Grid-Connected Residential Building. Energies 2018, 11, 2409. [Google Scholar] [CrossRef]
- Kousksou, T.; Bruel, P.; Jamil, A.; Rhafiki, T.E.; Zeraouli, Y. Energy storage: Applications and challenges. Sol. Energy Mater. Sol. Cells 2014, 120, 59–80. [Google Scholar] [CrossRef]
- Mohsenian-Rad, A.H.; Wong, V.W.; Jatskevich, J.; Schober, R.; Leon-Garcia, A. Autonomous demand-side management based on game-theoretic energy consumption scheduling for the future smart grid. IEEE Trans. Smart Grid 2010, 1, 320–331. [Google Scholar] [CrossRef]
- Bashir Ahmad, A.; Pourakbari-Kasmaei, M.; Contreras, J.; Lehtonen, M. A novel energy scheduling framework for reliable and economic operation of islanded and grid-connected microgrids. Electr. Power Syst. Res. 2019, 171, 85–96. [Google Scholar] [CrossRef]
- Khodaei, A.; Shahidehpour, M.; Bahramirad, S. SCUC with hourly demand response considering intertemporal load characteristics. IEEE Trans. Smart Grid 2011, 2, 564–571. [Google Scholar] [CrossRef]
- Albadi, M.H.; El-Saadany, E.F. Demand response in electricity markets: An overview. In Proceedings of the 2007 IEEE Power Engineering Society General Meeting, Tampa, FL, USA, 24–28 June 2007; pp. 1–5. [Google Scholar]
- López, M.; De La Torre, S.; Martín, S.; Aguado, J. Demand-side management in smart grid operation considering electric vehicles load shifting and vehicle-to-grid support. Int. J. Electr. Power Energy Syst. 2015, 64, 689–698. [Google Scholar] [CrossRef]
- Siano, P. Demand response and smart grids—A survey. Renew. Sustain. Energy Rev. 2014, 30, 461–478. [Google Scholar] [CrossRef]
- Earle, R.; Faruqui, A. Toward a new paradigm for valuing demand response. Electr. J. 2006, 19, 21–31. [Google Scholar] [CrossRef]
- Soares, A.; Gomes, Á.; Antunes, C.H. Categorization of residential electricity consumption as a basis for the assessment of the impacts of demand response actions. Renew. Sustain. Energy Rev. 2014, 30, 490–503. [Google Scholar] [CrossRef]
- Vivekananthan, C.; Mishra, Y.; Ledwich, G.; Li, F. Demand response for residential appliances via customer reward scheme. IEEE Trans. Smart Grid 2014, 5, 809–820. [Google Scholar] [CrossRef]
- Shimomura, Y.; Nemoto, Y.; Akasaka, F.; Chiba, R.; Kimita, K. A method for designing customer-oriented demand response aggregation service. CIRP Ann. 2014, 63, 413–416. [Google Scholar] [CrossRef]
- Haider, H.T.; See, O.H.; Elmenreich, W. A review of residential demand response of smart grid. Renew. Sustain. Energy Rev. 2016, 59, 166–178. [Google Scholar] [CrossRef]
- Torriti, J. Price-based demand side management: Assessing the impacts of time-of-use tariffs on residential electricity demand and peak shifting in Northern Italy. Energy 2012, 44, 576–583. [Google Scholar] [CrossRef]
- Nikzad, M.; Mozafari, B. Reliability assessment of incentive- and priced-based demand response programs in restructured power systems. Int. J. Electr. Power Energy Syst. 2014, 56, 83–96. [Google Scholar] [CrossRef]
- Wu, Z.; Zhou, S.; Li, J.; Zhang, X.P. Real-time scheduling of residential appliances via conditional risk-at-value. IEEE Trans. Smart Grid 2014, 5, 1282–1291. [Google Scholar] [CrossRef]
- Alberini, A.; Filippini, M. Response of residential electricity demand to price: The effect of measurement error. Energy Econ. 2011, 33, 889–895. [Google Scholar] [CrossRef]
- Yoon, J.H.; Bladick, R.; Novoselac, A. Demand response for residential buildings based on dynamic price of electricity. Energy Build. 2014, 80, 531–541. [Google Scholar] [CrossRef]
- Wang, Y.; Mao, S.; Nelms, R.M. Distributed online algorithm for optimal real-time energy distribution in the smart grid. IEEE Internet Things J. 2014, 1, 70–80. [Google Scholar] [CrossRef]
- Ozturk, Y.; Senthilkumar, D.; Kumar, S.; Lee, G. An intelligent home energy management system to improve demand response. IEEE Trans. Smart Grid 2013, 4, 694–701. [Google Scholar] [CrossRef]
- Setlhaolo, D.; Xia, X.; Zhang, J. Optimal scheduling of household appliances for demand response. Electr. Power Syst. Res. 2014, 116, 24–28. [Google Scholar] [CrossRef]
- Kinhekar, N.; Padhy, N.P.; Gupta, H.O. Multiobjective demand side management solutions for utilities with peak demand deficit. Int. J. Electr. Power Energy Syst. 2014, 55, 612–619. [Google Scholar] [CrossRef]
- Di Giorgio, A.; Liberati, F. Near real time load shifting control for residential electricity prosumers under designed and market indexed pricing models. Appl. Energy 2014, 128, 119–132. [Google Scholar] [CrossRef]
- Pallonetto, F.; Rosa, M.D.; Milano, F.; Finn, D.P. Demand response algorithms for smart-grid ready residential buildings using machine learning models. Appl. Energy 2019, 239, 1265–1282. [Google Scholar] [CrossRef]
- Gyamfi, S.; Krumdieck, S.; Urmee, T. Residential peak electricity demand response—Highlights of some behavioural issues. Renew. Sustain. Energy Rev. 2013, 25, 71–77. [Google Scholar] [CrossRef]
- Hamidi, V.; Li, F.; Robinson, F. Demand response in the UK’s domestic sector. Electr. Power Syst. Res. 2009, 79, 1722–1726. [Google Scholar] [CrossRef]
- Qdr, Q. Benefits of Demand Response in Electricity Markets and Recommendations for Achieving Them; US Department Energy: Washington, DC, USA, 2006.
- Jordehi, A.R. Optimisation of demand response in electric power systems, a review. Renew. Sustain. Energy Rev. 2019, 103, 308–319. [Google Scholar] [CrossRef]
- Palmer, J.; Terry, N.; Firth, S.; Kane, T.; Godoy-Shimizu, D.; Pope, P. Energy Use at Home: Models, Labels and Unusual Appliances. Available online: https://www.gov.uk/government/publications/models-labels-and-unusual-appliances (accessed on 27 April 2019).
- Kariuki, K.; Allan, R. Assessment of customer outage costs due to electric service interruptions: Residential sector. IEE Proc.-Gener. Transm. Distrib. 1996, 143, 163–170. [Google Scholar] [CrossRef]
- Billinton, R.; Chan, E.; Wacker, G. Probability distribution approach to describe customer costs due to electric supply interruptions. IEE Proc.-Gener. Transm. Distrib. 1994, 141, 594–598. [Google Scholar] [CrossRef]
- Wacker, G.; Billinton, R. Customer cost of electric service interruptions. Proc. IEEE 1989, 77, 919–930. [Google Scholar] [CrossRef]
- Nasseri, I.; Fotuhi-Firuzabad, M. Modeling the Customer Outage Cost; Introduction of New Fuzzy Modeling in Comparison with Customary Average Modeling. Available online: https://www.researchgate.net/publication/229022433_Modeling_the_Customer_Outage_Cost_Introduction_of_New_Fuzzy_Modeling_in_Comparison_With_Customary_Average_Modeling (accessed on 27 April 2019).
- Praktiknjo, A.J. Stated preferences based estimation of power interruption costs in private households: An example from Germany. Energy 2014, 76, 82–90. [Google Scholar] [CrossRef]
- Morrissey, K.; Plater, A.; Dean, M. The cost of electric power outages in the residential sector: A willingness to pay approach. Appl. Energy 2018, 212, 141–150. [Google Scholar] [CrossRef]
- Billinton, R. Methods to Consider Customer Interruption Costs in Power System Analysis: Task Force, Task Force (TF) 38.06. 01; Cigré Technical Brochure: Paris, France, 2001. [Google Scholar]
- Küfeoglu, S.; Lehtonen, M. Evaluation of Power Outage Costs for Industrial and Service Sectors in Finland. In Proceedings of the 22nd International Conference on Electricity Distribution (CIRED), Stockholm, Sweden, 10–13 June 2013. [Google Scholar]
- Küfeoğlu, S. Economic Impacts of Electric Power Outages and Evaluation of Customer Interruption Costs. Ph.D. Thesis, Aalto University, Espoo, Finland, 2015. [Google Scholar]
- Finland, H. Our Electrical Product for You (in Cents per Kilowatt-Hour). Available online: https://www4.helen.fi/Sahkokauppa/MakeContract.aspx (accessed on 27 April 2019).
- Praktiknjo, A.J.; Hähnel, A.; Erdmann, G. Assessing energy supply security: Outage costs in private households. Energy Policy 2011, 39, 7825–7833. [Google Scholar] [CrossRef]

| Shift Duration (min) | % Willingness to Shift |
|---|---|
| 5 | 24% |
| 15 | 12% |
| 30 | 17% |
| 60 | 4% |
| 180 | 6% |
| 300 | 2% |
| 600 | 3% |
| Shift Duration (min) | % Percentage Flexibility |
|---|---|
| 5 | 68% |
| 15 | 44% |
| 30 | 32% |
| 60 | 15% |
| 180 | 11% |
| 300 | 5% |
| 600 | 3% |
| Shift Interval | Avg. Flexibility per Household for Specific Shifting Interval |
|---|---|
| 5 | 83% |
| 15 | 69% |
| 30 | 61% |
| 60 | 51% |
| 180 | 34% |
| 300 | 20% |
| 600 | 11% |
| Average Flexibility per House | 11.8% |
| Average Flexibility Duration | 170 min |
| Average Compensation (asked by the customers) | 7.50% |
| Shift Interval (min) | Energy Cost of the Shifted Load (€) | Average % Compensation | Average Compensation Cost (€/House/Shifting Interval) |
|---|---|---|---|
| 5 | 1.925 | 0.22 | 0.0042 |
| 15 | 1.662 | 0.66 | 0.011 |
| 30 | 1.478 | 1.32 | 0.019 |
| 60 | 1.206 | 2.65 | 0.032 |
| 180 | 0.772 | 7.90 | 0.061 |
| 300 | 0.432 | 13.23 | 0.057 |
| 600 | 0.219 | 26.47 | 0.058 |
| Shift Duration (min) | Average d per House |
|---|---|
| 5 | 0.1781 |
| 15 | 0.2698 |
| 30 | 0.3301 |
| 60 | 0.4297 |
| 180 | 0.6256 |
| 300 | 0.7771 |
| 600 | 0.8649 |
| Shift Duration (min) | Average d per House | DR Cost (€/kW) |
|---|---|---|
| 5 | 0.1781 | 0.0117 |
| 15 | 0.2698 | 0.0530 |
| 30 | 0.3301 | 0.1297 |
| 60 | 0.4297 | 0.3377 |
| 180 | 0.6256 | 1.4750 |
| 300 | 0.7771 | 3.0537 |
| 600 | 0.8649 | 6.7975 |
| CIC Cost (€/kW) | DR Cost | ||||
|---|---|---|---|---|---|
| Outage Duration | WTA | WTP | (€) | DR- (€/kW) | |
| 1 h | 7.8 | 12.12 | 1.2 | 0.031 | 0.337 |
| 3 h | 23.4 | 36.36 | 3.6 | 0.060 | 1.475 |
© 2019 by the authors. Licensee MDPI, Basel, Switzerland. This article is an open access article distributed under the terms and conditions of the Creative Commons Attribution (CC BY) license (http://creativecommons.org/licenses/by/4.0/).
Share and Cite
Safdar, M.; Hussain, G.A.; Lehtonen, M. Costs of Demand Response from Residential Customers’ Perspective. Energies 2019, 12, 1617. https://doi.org/10.3390/en12091617
Safdar M, Hussain GA, Lehtonen M. Costs of Demand Response from Residential Customers’ Perspective. Energies. 2019; 12(9):1617. https://doi.org/10.3390/en12091617
Chicago/Turabian StyleSafdar, Madia, Ghulam Amjad Hussain, and Matti Lehtonen. 2019. "Costs of Demand Response from Residential Customers’ Perspective" Energies 12, no. 9: 1617. https://doi.org/10.3390/en12091617
APA StyleSafdar, M., Hussain, G. A., & Lehtonen, M. (2019). Costs of Demand Response from Residential Customers’ Perspective. Energies, 12(9), 1617. https://doi.org/10.3390/en12091617


