1. Introduction
The urgent environmental need to reduce greenhouse gas emissions has led to the integration of renewable energy sources (RESs) into the power grid. In 2018, the global cumulative installed capacity of RESs such as wind power and solar photovoltaic (PV) generation amounted to 539,123 MW [
1] and 402.5 GW [
2], respectively. However, RESs have disadvantages in terms of variability, intermittency, and uncertainty of electricity generation [
3]. Therefore, energy storage systems (ESS), particularly battery ESS (BESS), have recently been attracting significant interest in the electricity industry as an effective means of mitigating the disadvantages of RESs [
4,
5].
The installed BESS capacity for power system applications is expected to increase consistently, not only for utility-scale applications but also for distributed small-scale applications, whereby a large number of BESS are expected to be connected to PV systems and behind the meter [
6,
7]. This trend of increasing BESS usage is likely to be accelerated by the widespread adoption of electric vehicles (EVs), supported by improvements in vehicle-to-grid and grid-to-vehicle technologies [
8]. Furthermore, cost reductions in BESS technology are widely expected to become a key determinant of their increased installation. For instance, it is expected that the cost of lithium-ion BESS will decrease significantly, namely by 54–61%, between 2016 and 2030 [
6], or by 52% between 2018 and 2040 [
9]. For the latter period, it is estimated that USD 620 billion in investment in the vehicle and the electricity sectors will ensue [
9].
Despite the positive forecasts regarding the cost of BESS, currently, costs are still so high that the economic feasibility of their installation is not always given [
10]. For this reason, several studies have dealt with the economic aspects of BESS [
11,
12,
13,
14,
15,
16,
17,
18,
19,
20,
21,
22,
23,
24,
25,
26,
27,
28,
29,
30,
31,
32,
33,
34,
35,
36,
37,
38]. For instance, studies examine the BESS size and the associated charging/discharging strategy for optimal usage, either by minimizing total cost or maximizing the net present value (NPV) of grid-connected renewable energy systems [
11,
12,
13,
14,
15]. Further, for a given BESS capacity, studies examine the operating strategy (i.e., the charging/discharging schedule) is determined to minimize the cost or maximize the net benefit under a dynamic pricing scheme [
16,
17,
18]. Other researchers consider how a bidding strategy for BESS in an electricity market environment can also be developed to increase profit [
19,
20]. The economic aspects of BESS have also been considered for EV charging station planning [
21,
22,
23]. Finally, economic considerations are important in the process of designing and operating a microgrid with ESS [
24,
25,
26], where the methods based on particle swarm optimization have been used to determine an optimal size and/or an optimal operational strategy of ESS in a microgrid. Particular consideration is given to the integration of RESs into the microgrid in [
24,
25,
26].
Economic feasibility is also an important factor to be considered for the various grid applications of BESS [
5,
27]. This study focuses on the application of load leveling and analyzes its economic benefits. Peak shaving using the discharging operation of BESS (when electricity demand is particularly high) is inevitably followed by the charging operation during off-peak periods. Therefore, the analysis of load leveling with BESS in this study includes peak shaving. Previous studies dealing with the economic aspects of load leveling with BESS obtained the following results: It was found that load leveling with BESS achieves an increase in the cost savings of thermal units [
28,
29,
30]. Further, research suggests that BESS can be used to maximize the NPV of a renewable energy system and a substation [
31,
32]. Evidence also suggests that the leveled loads with BESS may provide economic benefits by reducing the required capacity of other equipment, such as generators and transformers, and by reducing the frequency with which investment in such network equipment is needed [
33]. Finally, it has been shown that an economic benefit can also be obtained by peak shaving or peak reduction with BESS under a dynamic electricity pricing scheme [
34,
35,
36]. Since the accurate forecasts of generation and load are essential to improving the performance of peak shaving, a method for peak shaving combined with a forecasting method based on the adaptive neuro-fuzzy inference system is presented in [
37].
Customers of electricity providers, particularly the industrial customers, pay the electricity bill, which is comprised of the consumed energy cost and the peak demand surcharge. Thus, the economic benefit of load leveling or peak reduction with BESS is obvious to customers. Since the buying cost of electricity is a major cost component of a utility company, the provider’s economic benefit with BESS corresponds to the reduction in the purchasing cost. Further, this economic benefit is relevant for the government agencies which are responsible for the policies of the electricity industry because the government permits billing rates to customers considering the cost of a utility. It can induce a utility to lower the bill if the cost can be reduced by load leveling with BESS. This study considers the perspective of a utility company and/or government agency. Hence, the problem to address in this study can be simply expressed as the following questions: Does load leveling with BESS necessarily lead to the economic benefit of a utility company? If so, how does the economic benefit change as the BESS size increases? If not, what is the reason for the results contrary to the previous studies?
Answering these questions fills a research gap as the insightfulness of previous studies is limited by the fact that electricity prices are always regarded as given. However, if the number and/or size of BESS is large, then the leveled loads with BESS will result in a change in electricity prices, which, in turn, modifies the charging/discharging operation of BESS. Accounting for this reality induces an iterative process that is challenging to resolve. If the electricity price follows a typical parabolic cost function, the iterative process may be resolved by mathematically finding a converging point. However, in a competitive electricity market, the strategic decisions of participants may distort the electricity price pattern. Therefore, the change in electricity prices due to the leveled loads with BESS should be estimated as a basis for performing any economic analysis. Consequently, in this study, we derive the answers to the research questions by conducting an economic analysis of load leveling from the perspective of a utility company, while considering changes in electricity prices, particularly thus induced by large BESS in an electricity market environment. To illustrate the results, we consider the situation of Korea’s electricity market and use the corresponding data as a case study.
The contributions of this paper are (1) the change in electricity prices due to the leveled loads are explicitly considered in the economic analysis as the price function is defined with respect to loads; (2) in defining the price function, a data-driven regression model is used and estimation accuracy is achieved by data grouping; (3) it is shown as a main claim that it may be blind faith for load leveling with BESS whereby a large cumulative capacity of BESS is always economically beneficial.
The remainder of the paper is organized as follows. To provide important background information,
Section 2 summarizes the structure of the Korean electricity market.
Section 3 describes the optimization formulation to perform load leveling and a method to estimate electricity prices with respect to the load.
Section 4 presents the necessary data for the analysis.
Section 5 presents the results of the case study, followed by a discussion in
Section 6. Finally, concluding remarks are provided in
Section 7.
2. Korean Electricity Market
The electric industry in Korea was re-structured in 2001, whereby the vertically integrated utility company, the Korea Electric Power Corporation (KEPCO), was divided into an independent system operator, the Korea Power Exchange (KPX); some generation companies (GENCOs), subsidiaries of KEPCO; and the KEPCO itself playing correspondingly a reduced role. The Korean electricity market was also defined as a result of the restructuring and is now run by the KPX.
The Korean electricity market is a cost-based pool. The GENCOs submit the amount of electricity generation capacity and the cost function to the KPX. Then, the KPX determines the hourly generation of each GENCO based on forecasted demand. The methods applied to this end, such as economic dispatch or optimal power flow, must satisfy various conditions, such as balance of supply and demand, reserve requirements, and maximum power flows of transmission lines. The KPX also sets the hourly system marginal price (SMP). The SMP is usually set as the marginal generation cost of the most expensive generator, or the marginal generator, and is used in the settlement process. The KEPCO buys electricity through the market and pays the GENCOs according to the SMP. The KEPCO recovers the cost of purchasing electricity by invoicing customers based on the billing rates approved by the government agency.
3. Methodology
3.1. Load Leveling
The variation in original loads is mitigated or leveled by BESS charging/discharging operations. The load leveling performance can be evaluated based on how close the leveled loads are to a reference value. The mean-squared error (MSE) is selected in this study as a measure of closeness to the reference value. Thus, the objective function to determine the optimal BESS operation for load leveling is the MSE with respect to the reference value (
):
where
is the original load at hour
and
is the number of hours corresponding to the time horizon for load leveling. The reference,
, is defined for all
as the constant average of the original loads during the entire time period:
Alternatively, BESS can be operated for load leveling on a daily basis. In this case, the reference value on a specific day
may be defined as:
For convenience, the references in Equations (2) and (3) are denoted as the yearly reference (Yref) and the daily reference (Dref), respectively. After including BESS,
in (1) is replaced with the leveled load,
, defined as:
where
is the electricity used to charge the BESS (leading to a positive value) or discharged from the BESS (resulting in a negative value) at hour
. Therefore, load leveling involves determining the value of
that minimizes Equation (1), subject to the BESS-related constraints described below.
The first constraint is related to the maximum hourly charging and discharging power,
, given as:
In this study, the value of
is considered equal to BESS capacity. For normal operation, the state of charge (SOC) of the BESS should be bounded:
where
is the SOC at hour
and
and
are the lower and upper bounds of the SOC, respectively. The value of
is updated every hour according to the following rule:
where
and
are the charging and discharging efficiencies, respectively. From Equation (7), even if
and
are equal, the update equation is asymmetric because the effects of these values are different for charging and discharging. However, the asymmetry for considering the loss of BESS makes the solution of the optimization problem using the mixed integer quadratic programming method extremely time-consuming. For example, when
is set to 168 h (one week), both
and
are set to 95%, the BESS size is 50 GWh, the computation time to find the optimal solution is 110 s. By contrast, if the loss of BESS is neglected, that is, if
and
in Equation (7) are equal to one, it can be reduced to a simpler equation:
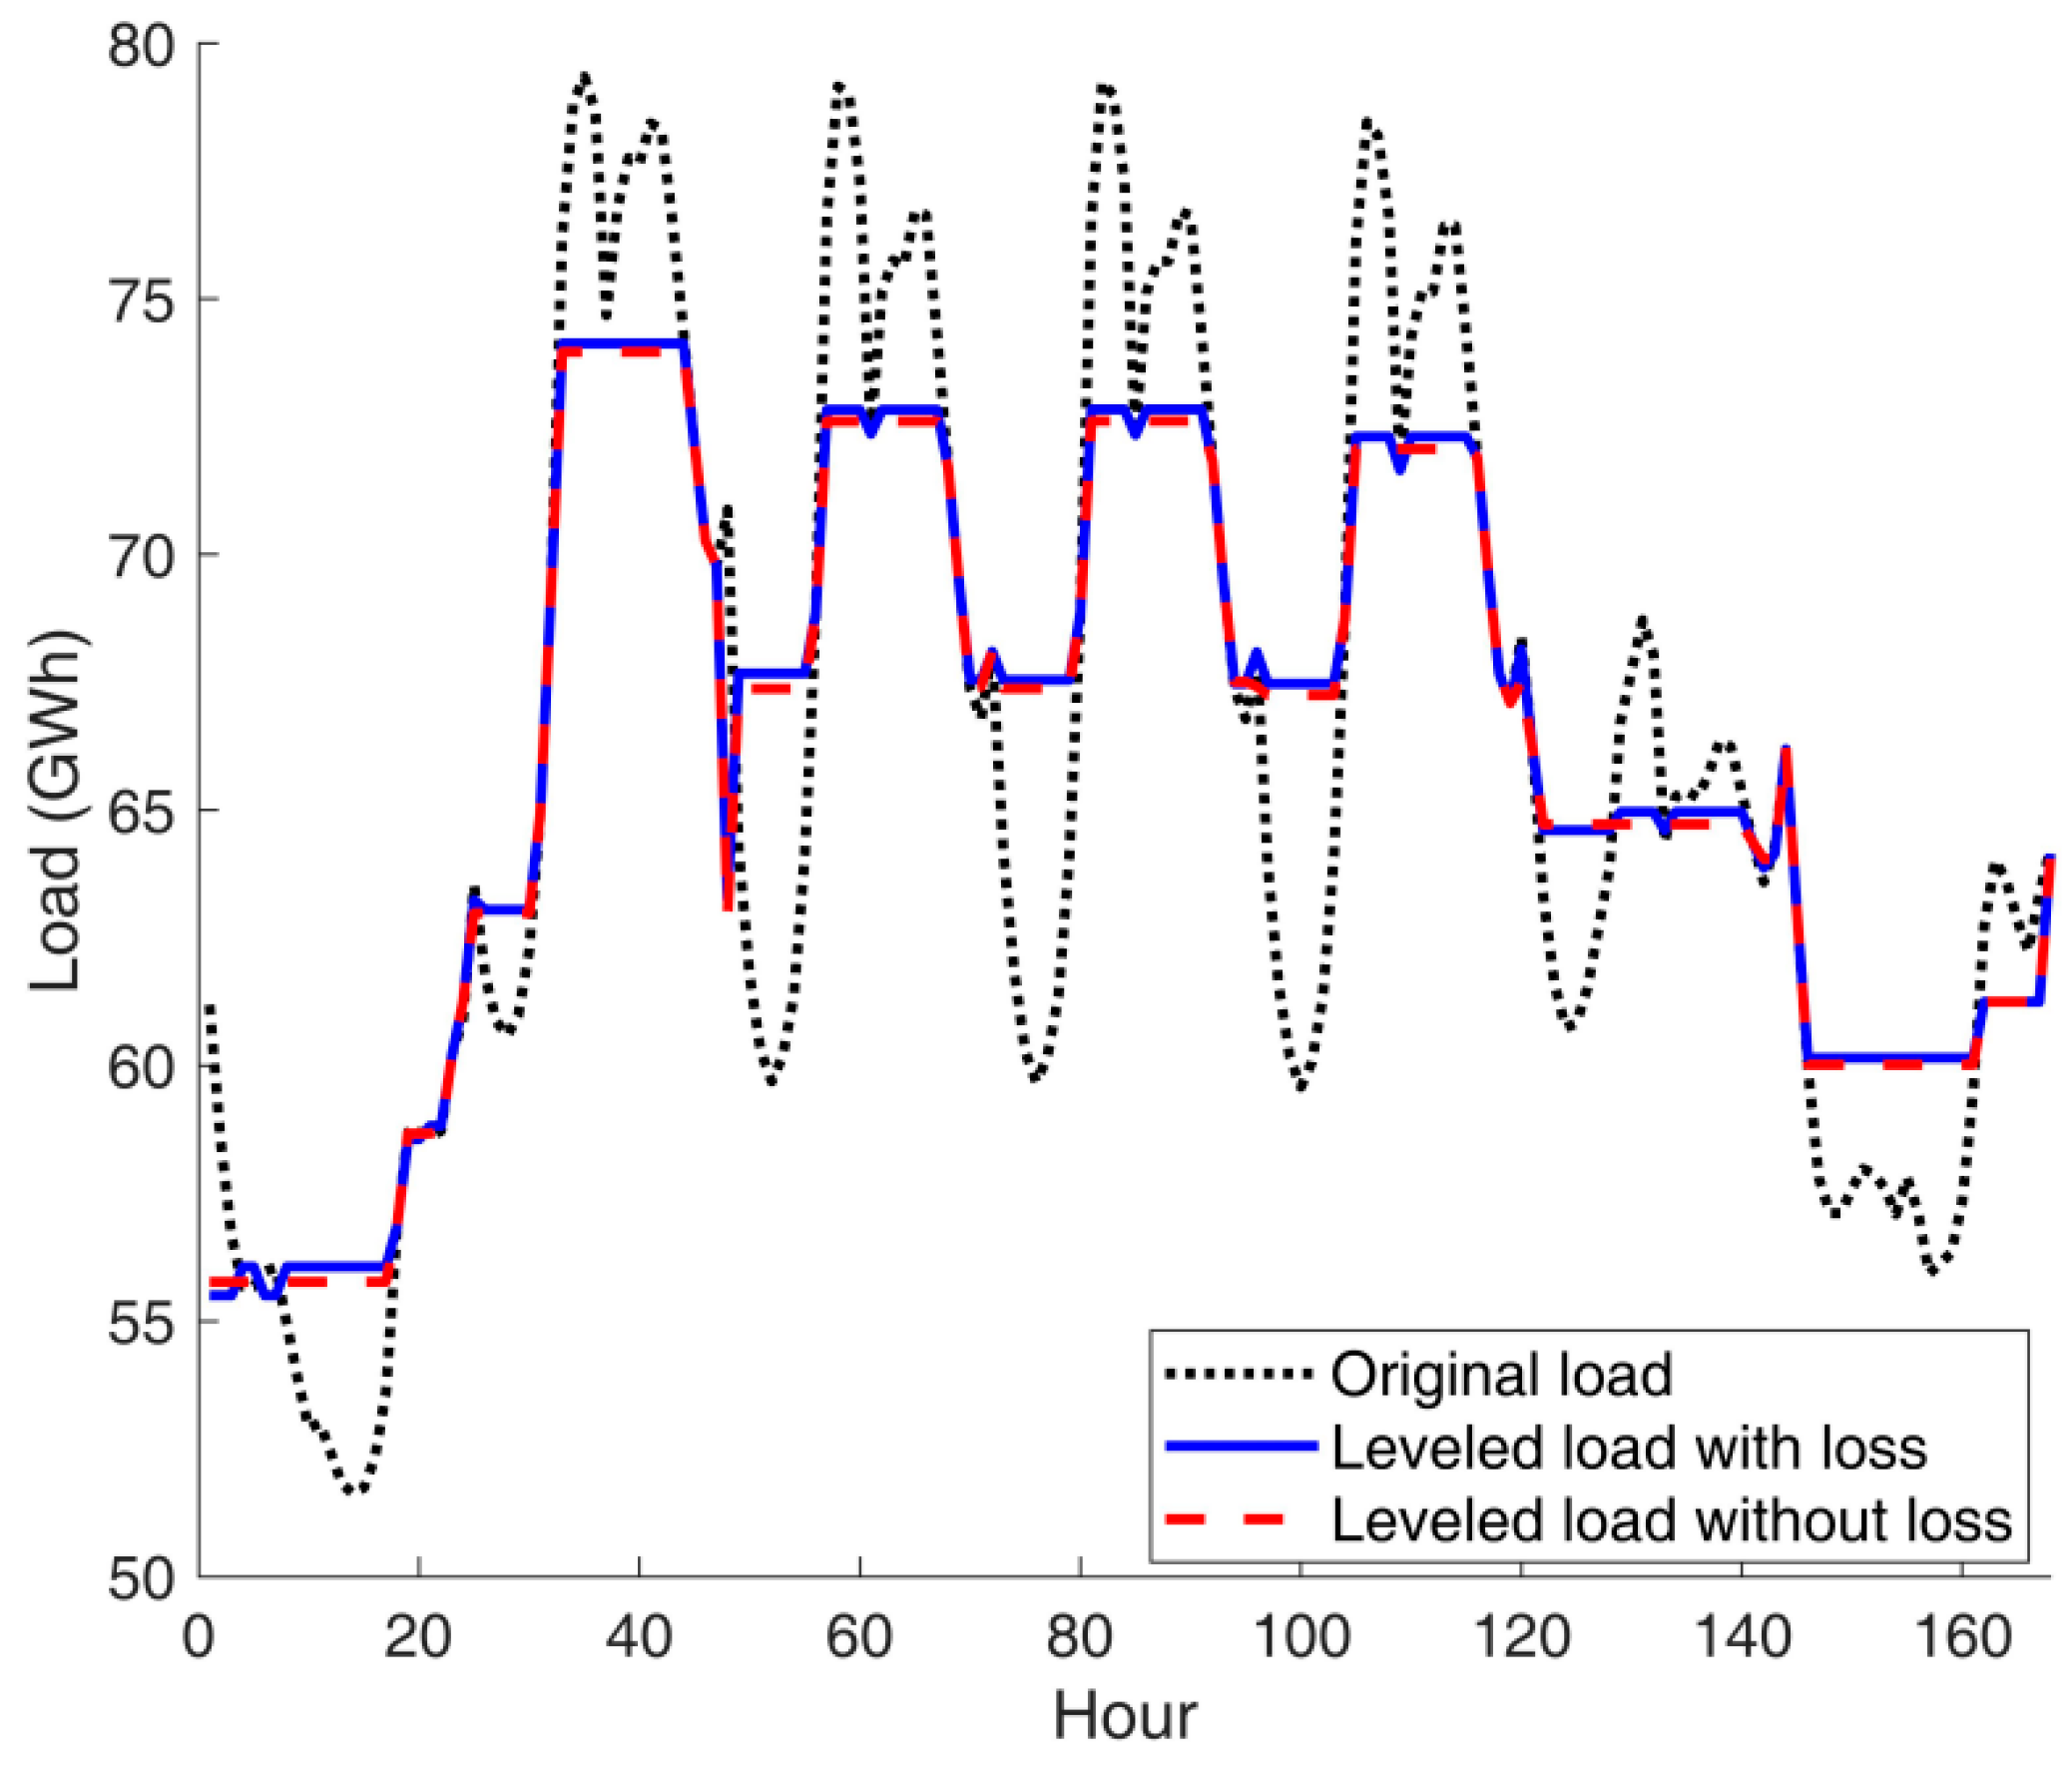
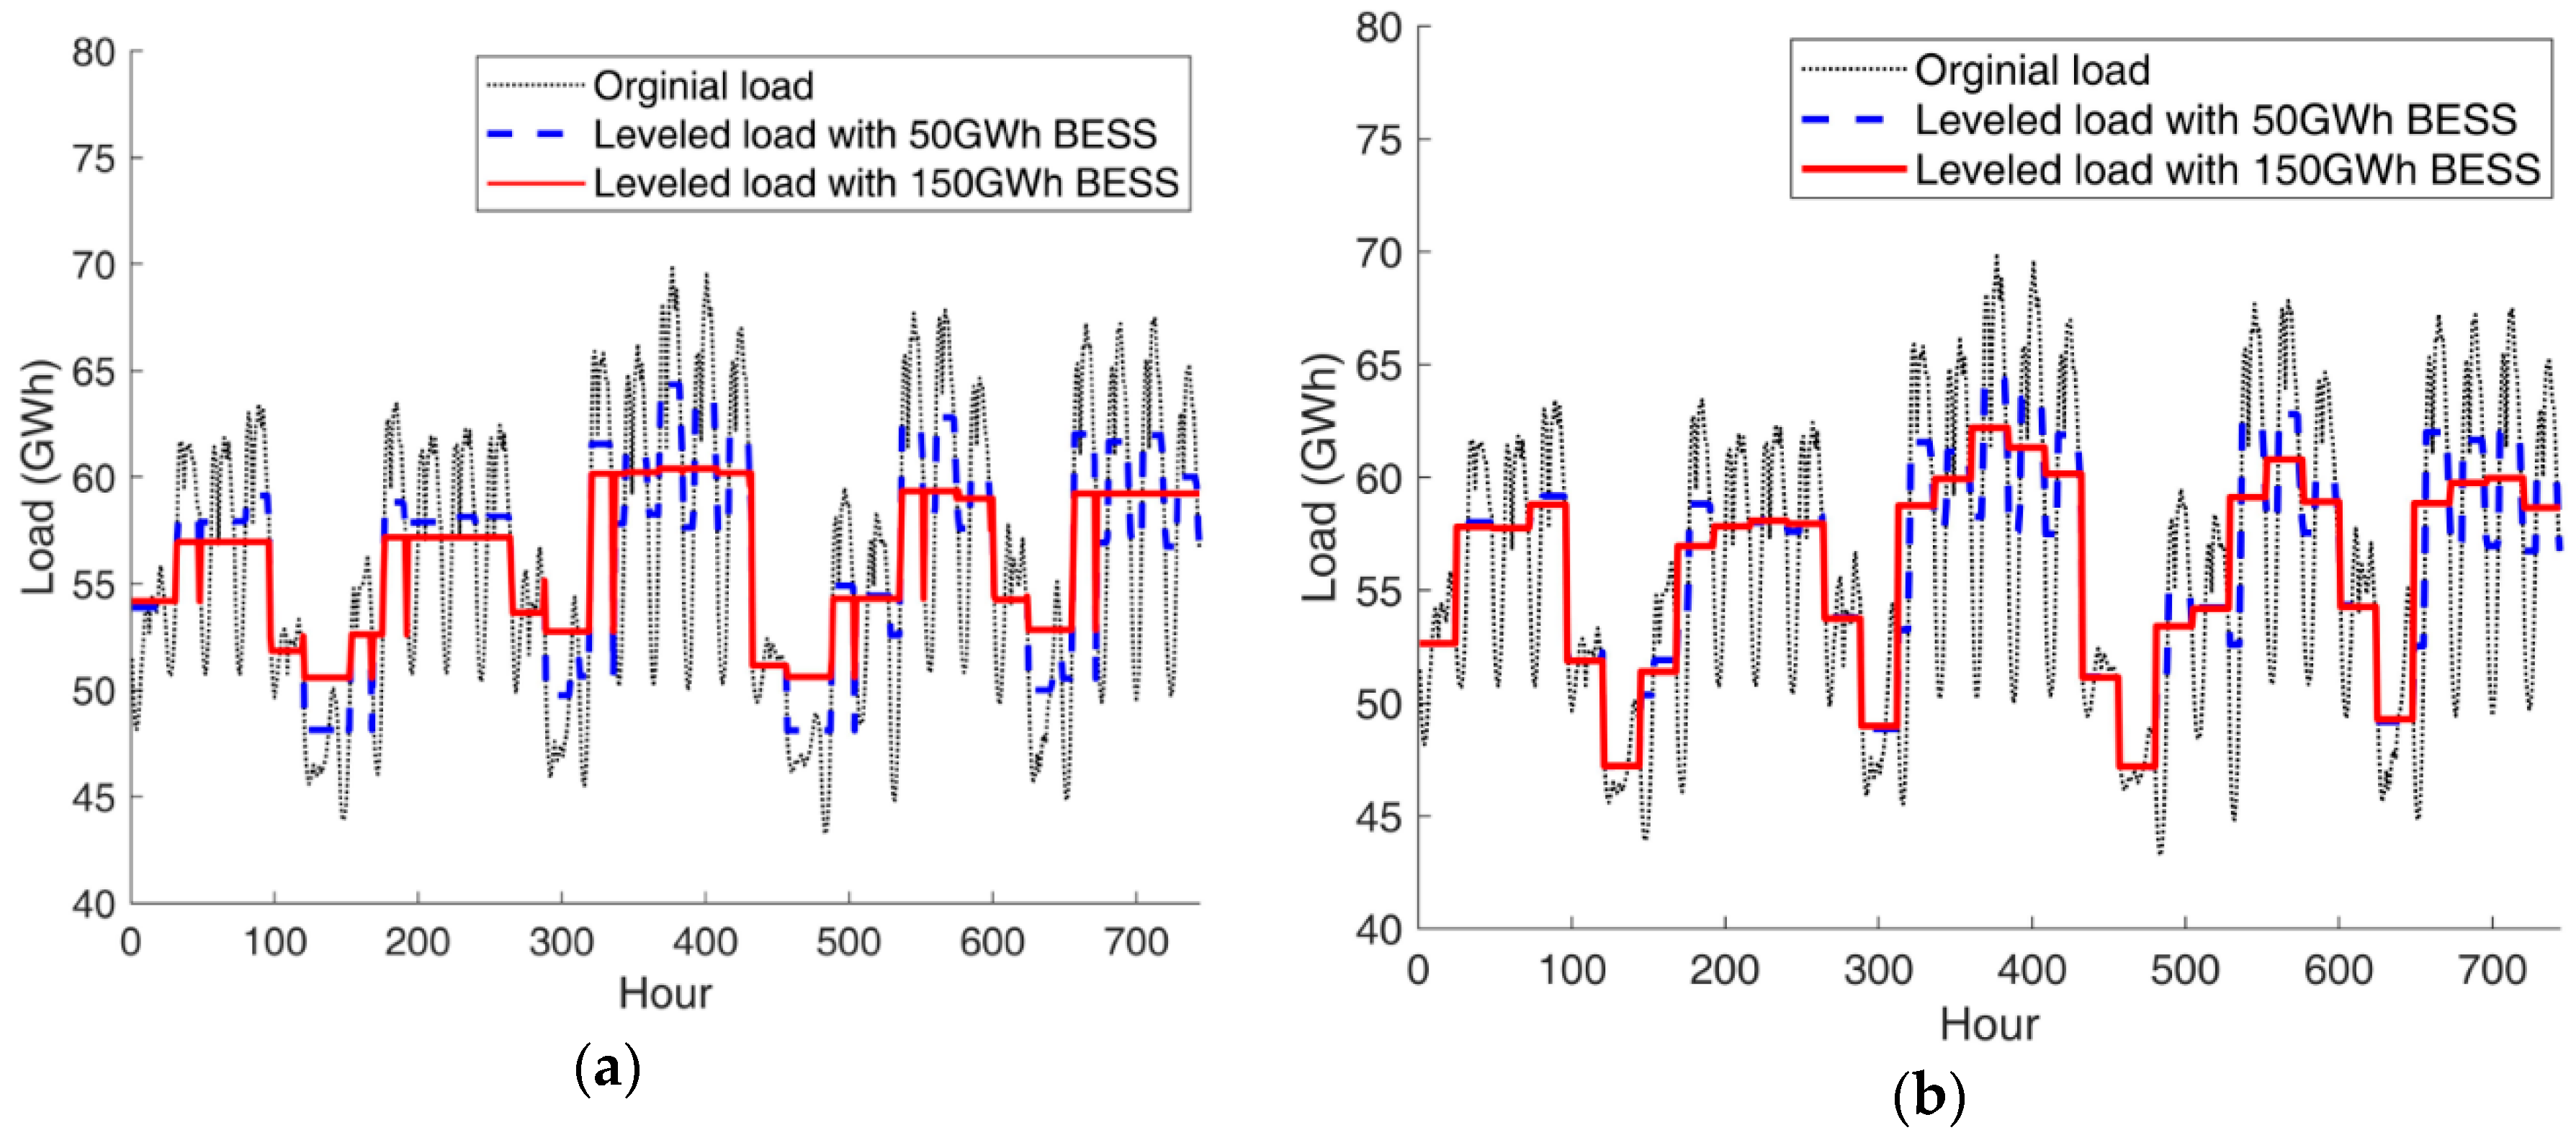
As a result, for the same load leveling problem over 168 h, the computation time falls significantly to just 0.2 s, which is a 99.82% decrease in computation time. The leveled loads with and without the loss of BESS are shown in
Figure 1 together with the original load.
Figure 1 clarifies that the solutions for the two cases are very similar in shape, and their mean absolute percentage errors (MAPEs) are as small as 0.26%. This minor difference is not the primary concern of this study. Moreover, in our analysis,
is equal to 8760 h (one year). This means that if the formulas that consider the loss of BESS are applied, the computation time would be too large because the search space expands exponentially as
increases. Consequently, Equation (8) without loss is used instead of Equation (7) for the remainder of this study. This enhances computational efficiency without causing a noteworthy loss of informativeness of results.
3.2. Electricity Price as a Function of Load
Electricity prices should be represented as a function of load to estimate the change in price for the leveled loads. Among the methods for identifying the relationship between input and output values, we selected the polynomial regression method [
38], in which the load corresponds to the input, and the electricity price is the output. Then, the price function,
, can be represented as:
where
’s are the regression coefficients and
is the error term. It should be noted that the original loads,
, are used in (9) because the price function is found using the original loads. Then, the change in price after load leveling is estimated by substituting the leveled load,
, into the price function in (9).
The degree of the polynomial,
, is selected according to the adjusted
index, which indicates the quality of the regression model. When a model fits the data well, the adjusted
index becomes closer to 1 [
38]. Therefore, the degree of the polynomial is chosen as the value where the adjusted
saturates at a value closer to 1 or its rate of increase becomes moderately small.
4. Case Description
The data on loads and electricity prices are taken from the Korean power system for the year 2018 [
39,
40]. The case study consists of three steps. The first step is to find the leveled loads using BESS based on the formulation in
Section 3.1. It is performed by varying the BESS size from 1 GWh to 150 GWh by increments of 1 GWh, where the maximum size is approximately 1.7 times the peak load of 87.03 GWh. The maximum and minimum SOC are set to 90% and 10%, respectively. The two references of Yref and Dref are applied separately. The second step is to represent the electricity prices as a function of loads using a polynomial regression. In order to determine a suitable degree of polynomial, the adjusted R-squared values are calculated by varying the degree of the polynomial (which entails varying the number of terms in the polynomial regression) from one to nine. Then, the fitted price function of loads is derived as a polynomial function of the selected degree. The final step is to perform the economic analysis by calculating the total cost of leveled loads based on the results from the first and second steps.
For a more detailed economic analysis, another simulation, which is essentially the opposite of the previous scenario, is performed to examine how the BESS operation for reducing the cost affects the load leveling performance. In other words, BESS are operated with the goal of minimizing the total cost, not optimizing load leveling. Then, it can be investigated to what extent the adjusted loads are spread with respect to the reference, Yref or Dref, by calculating the MSE. In this second scenario, the first step is to again vary the BESS size from 1 GWh to 150 GWh by increments of 1 GWh, thus determining the charging/discharging schedule of BESS, which reduces the total cost for the original electricity prices. Then, the adjusted loads and the corresponding total cost are calculated. The second step is to calculate the MSE for the adjusted loads with respect to Yref and Dref.
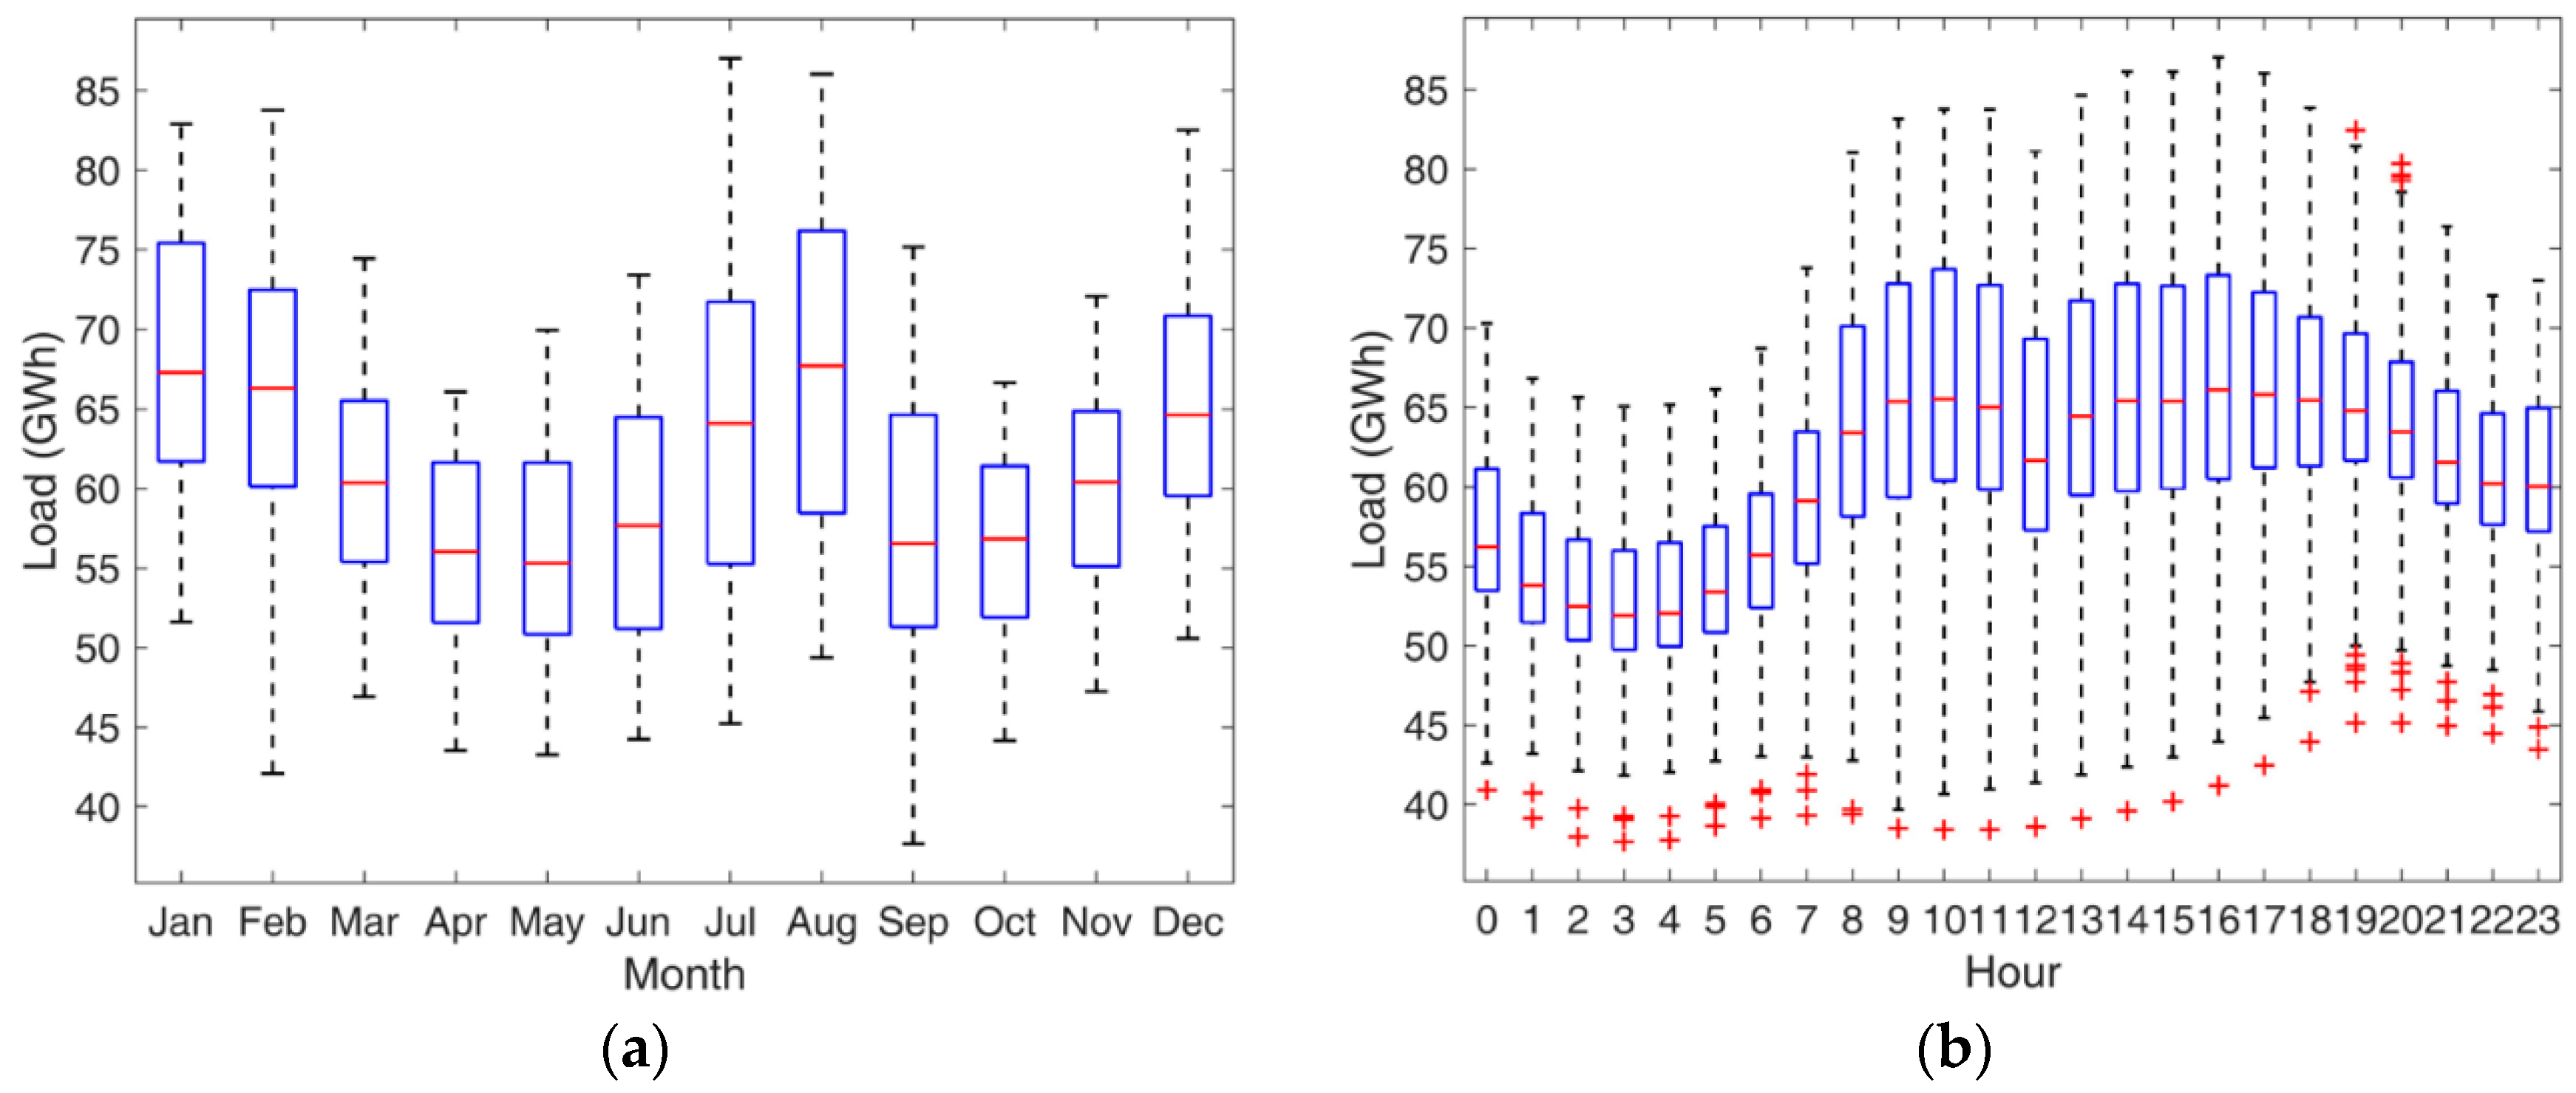
The monthly and hourly load patterns are represented as box plots using Matlab in
Figure 2a,b, respectively. When generating
Figure 2a, the hourly loads over the year are grouped by month. Thus, the number of data points in each month is equal to 24 h times the number of days in the corresponding month. Then, the monthly loads in each month are sorted in ascending order and represented as a box plot, where the upper and lower sides of the blue box indicate the 75th percentile (the third quartile, Q3) and 25th percentile (the first quartile, Q1), respectively. The red line in the middle of the blue box indicates the median (50th percentile) of the sorted loads and the highest and lowest black lines indicate the maximum and minimum values, respectively. When generating
Figure 2b, the hourly loads over the year are grouped by hour, such that there are 365 data for each hour group. Then, the hourly loads for each hour are sorted in ascending order and represented as a box plot. Like
Figure 2a, the upper side, the red line, and the lower side of the blue box indicate the 25th percentile, 50th percentile (median), and 75th percentile of the sorted loads. However, the hourly loads are distributed quite widely, such that there are some points that are greater than Q3 + 1.5 times (Q3 − Q1) or less than Q1 − 1.5 times (Q3 − Q1). These data points are referred to as whiskers. This type of points can be interpreted as outliers in data analysis and are represented as red crosses in
Figure 2b. If there are red crosses outside the highest and lowest black lines, then the black line indicates Q3 + 1.5 times (Q3 − Q1) or Q1 − 1.5 times (Q3 − Q1); otherwise, it indicates the maximum or minimum value of the sorted hourly loads. The average hourly load of the analyzed year is equal to 61.25 GWh.
Figure 2 shows that summer (July and August) and winter (January, February, and December) are the peak seasons of electricity consumption over the year. In addition, during a day, two peaks occur just before and just after noon.
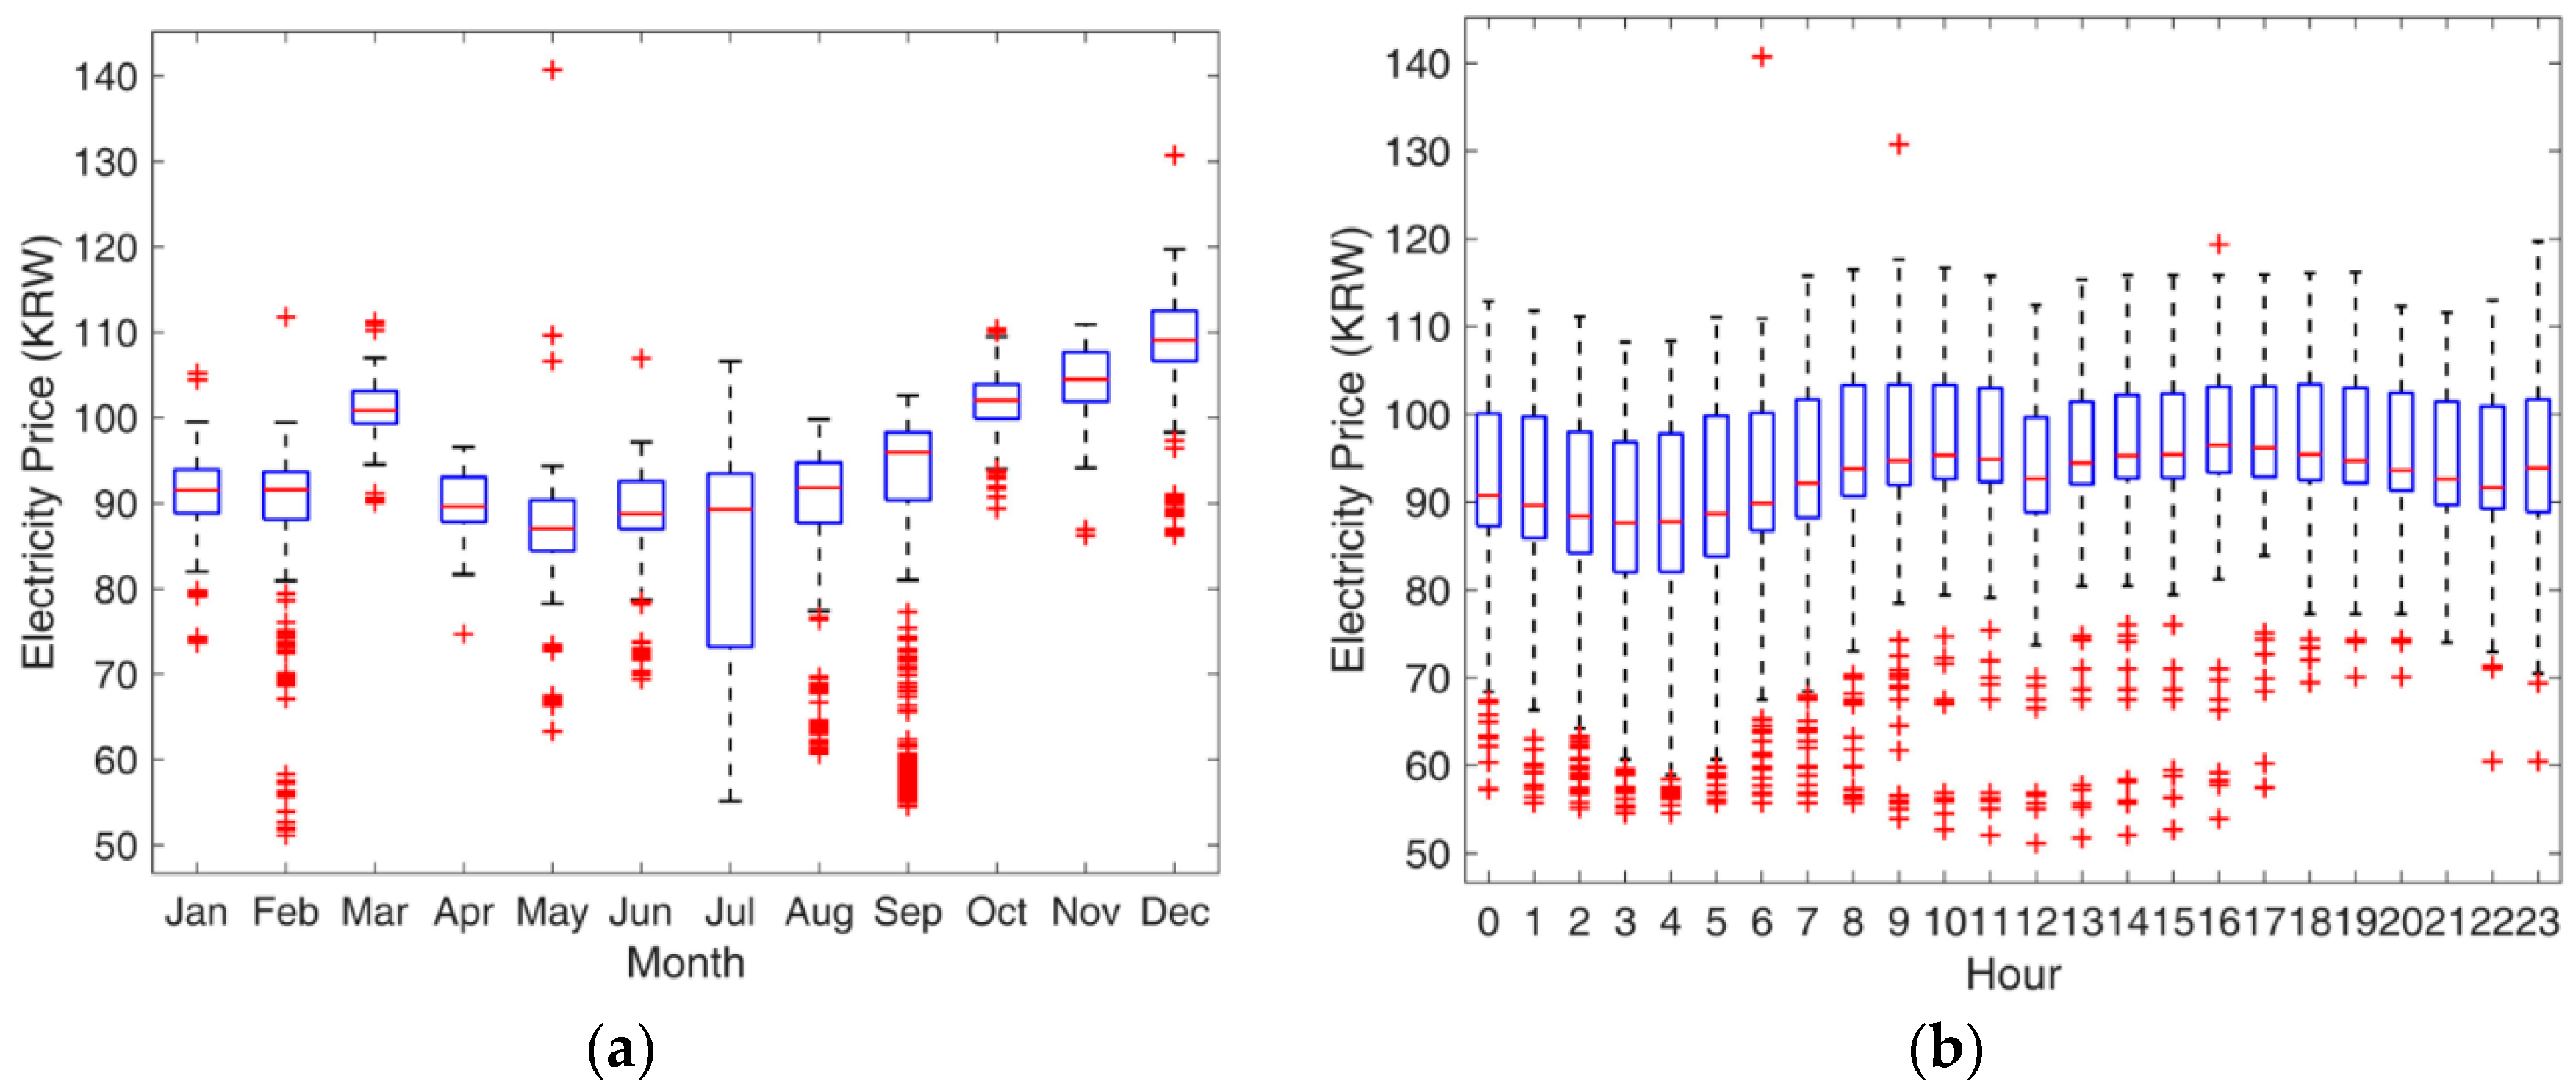
The monthly and hourly patterns of original electricity prices are represented as the box plots using Matlab in
Figure 3a,b, respectively. The methods of grouping the price data for the year and the meaning of the symbols of the box plot are the same as those for the loads in
Figure 2a,b. Electricity prices need to be represented as a function of load in this study, which requires a relationship to exist between them.
Figure 3b shows a similar pattern to
Figure 2a, although peak and off-peak hours are not as apparent as the loads. Therefore, it can be inferred that there is a positive relationship between loads and electricity prices. However, the monthly variation of electricity prices in
Figure 3a does not show a clear pattern which was observed seen in
Figure 2a. Therefore, we checked the correlation coefficient between loads and electricity prices. The correlation coefficient for the entire dataset is 0.47, indicating a moderately positive correlation. By contrast,
Table 1 shows that the monthly correlation coefficients are very high, indicating a highly positive relationship. Consequently, the polynomial regression is performed on monthly data, so that a total of 12 price functions are found to estimate the price change in response to the leveled loads. The specific results of the polynomial regression are presented in
Section 4.
5. Simulation Results
5.1. Load Leveling
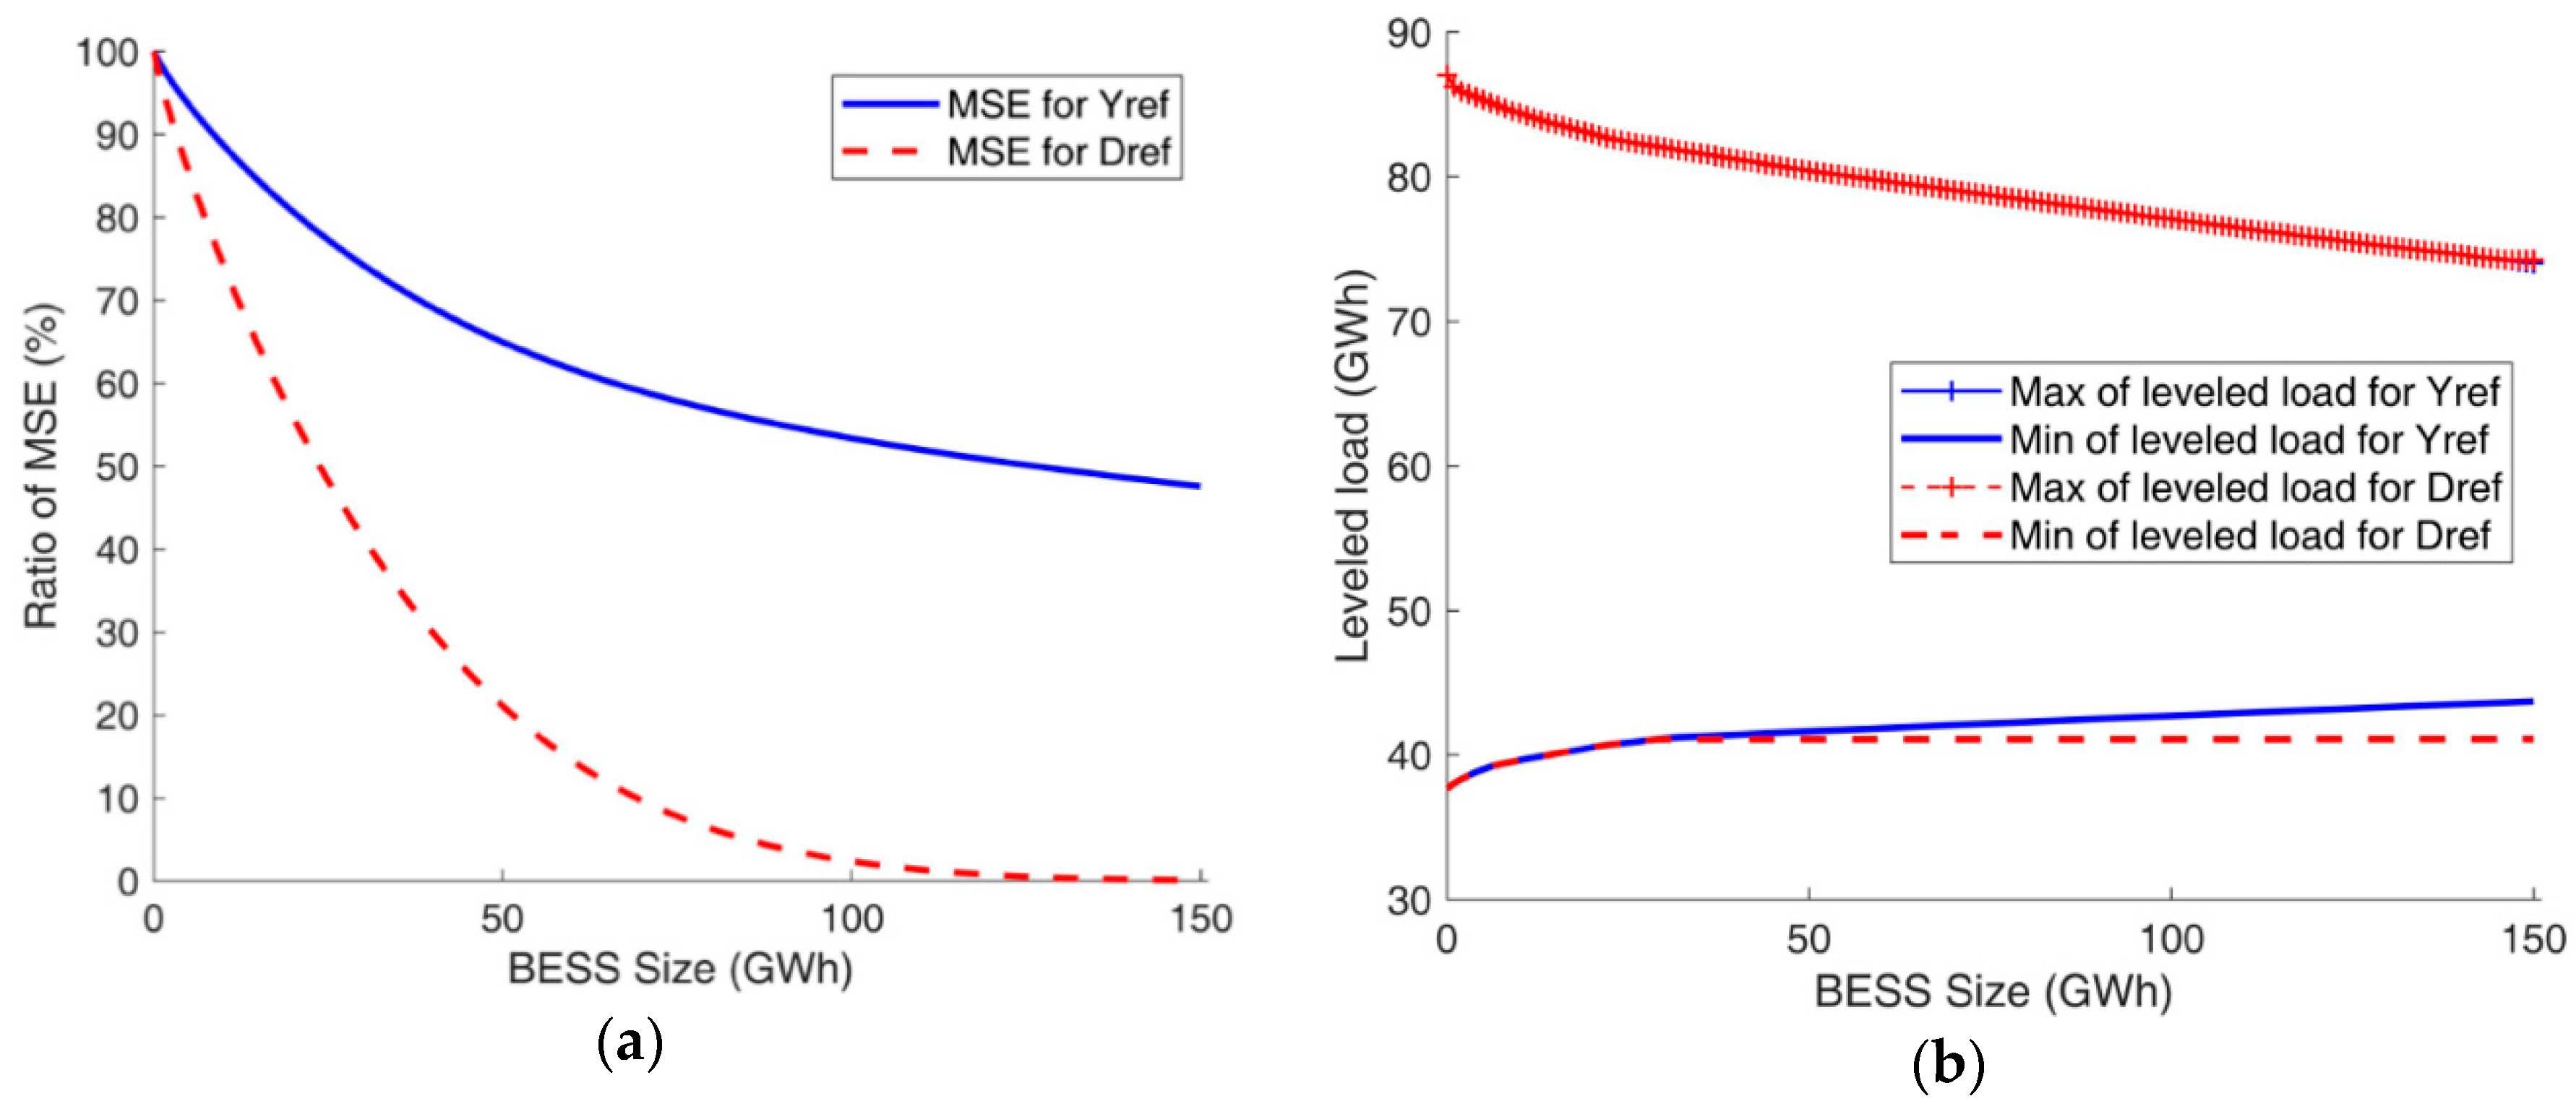
It is expected that the load will be leveled more and the MSE will decrease as the BESS size increases. Further, the important result to be examined is not the absolute value of the MSE, but how much the MSE is reduced when BESS size is increased. Therefore, the load leveling performance in terms of the MSE is represented in
Figure 4a as the percentage ratio to the MSE of the original loads without BESS. Since two references of Yref and Dref are used in this study, two graphs of the MSE ratio are shown in
Figure 4a. Additionally, the original loads and the leveled loads with the BESS sizes of 50 GWh and 150 GWh for the month of May are shown in
Figure 5 to identify the changes from load leveling more clearly. Another measure to examine the load leveling performance is the maximum/minimum values of the leveled loads because they will be closer to a reference, that is, the maximum will decrease and the minimum will increase, as the BESS size increases. Thus, the maximum/minimum values of the leveled loads for Yref and Dref are given in
Figure 4b.
Figure 4a shows that the marginal improvement in the load leveling performance by the unit increase in BESS size gradually decreases as BESS size increases. This is because the load duration of very high or very low loads is relatively short, so that a relatively small BESS can significantly improve load leveling. However, as BESS size increases, the duration for which loads need to be lowered or raised with respect to the reference value increases. Therefore, the degree of reduction in MSE decreases. More specifically, the decrease in the degree of reduction is severe, especially for Yref, because the load leveling is performed for the same constant reference over the entire time period.
Figure 4a clarifies this relationship by showing the slow decrease in the MSE for Yref, which makes a significant difference for a large BESS. Specifically, the MSE for Dref is reduced to less than 10% for a BESS size greater than 70 GWh. By contrast, the MSE for Yref is still equal to approximately 48%, even for a BESS size of 150 GWh.
On the other hand, as
Figure 4b shows, the maximum and minimum values of the leveled loads are almost the same for the two references. Specifically, the maximum values of the leveled loads for the two references are equal to each other in the beginning (hence why the lines in the graph almost exactly coincide), but a difference in the minimum values becomes evident from the BESS size of 30 GWh. The results can be clarified with
Figure 5. Regardless of whether the load leveling is performed during a year or a day, the goal is to lower the high loads and raise the low loads. Thus, the overall shapes of
Figure 5 for the two reference values are similar. However, the highs and lows improve more for Yref than for Dref. This is because the number of days with high loads, such as summer and winter weekdays, is greater than the number of days with low loads, such as holidays and spring/autumn weekends. Therefore, lowering the maximum total loads for Yref is equivalent to lowering the maximum of a day of high loads for Dref. However, after increasing the minimum of the holidays and weekends of low loads, the minimum of the leveled days of low loads remains unchanged. Consequently, as seen in
Figure 4b, the minimum of the leveled load for Dref hardly changes after some point, which corresponds to a BESS size of 30 GWh in this case study.
5.2. Representation of Electricity Prices
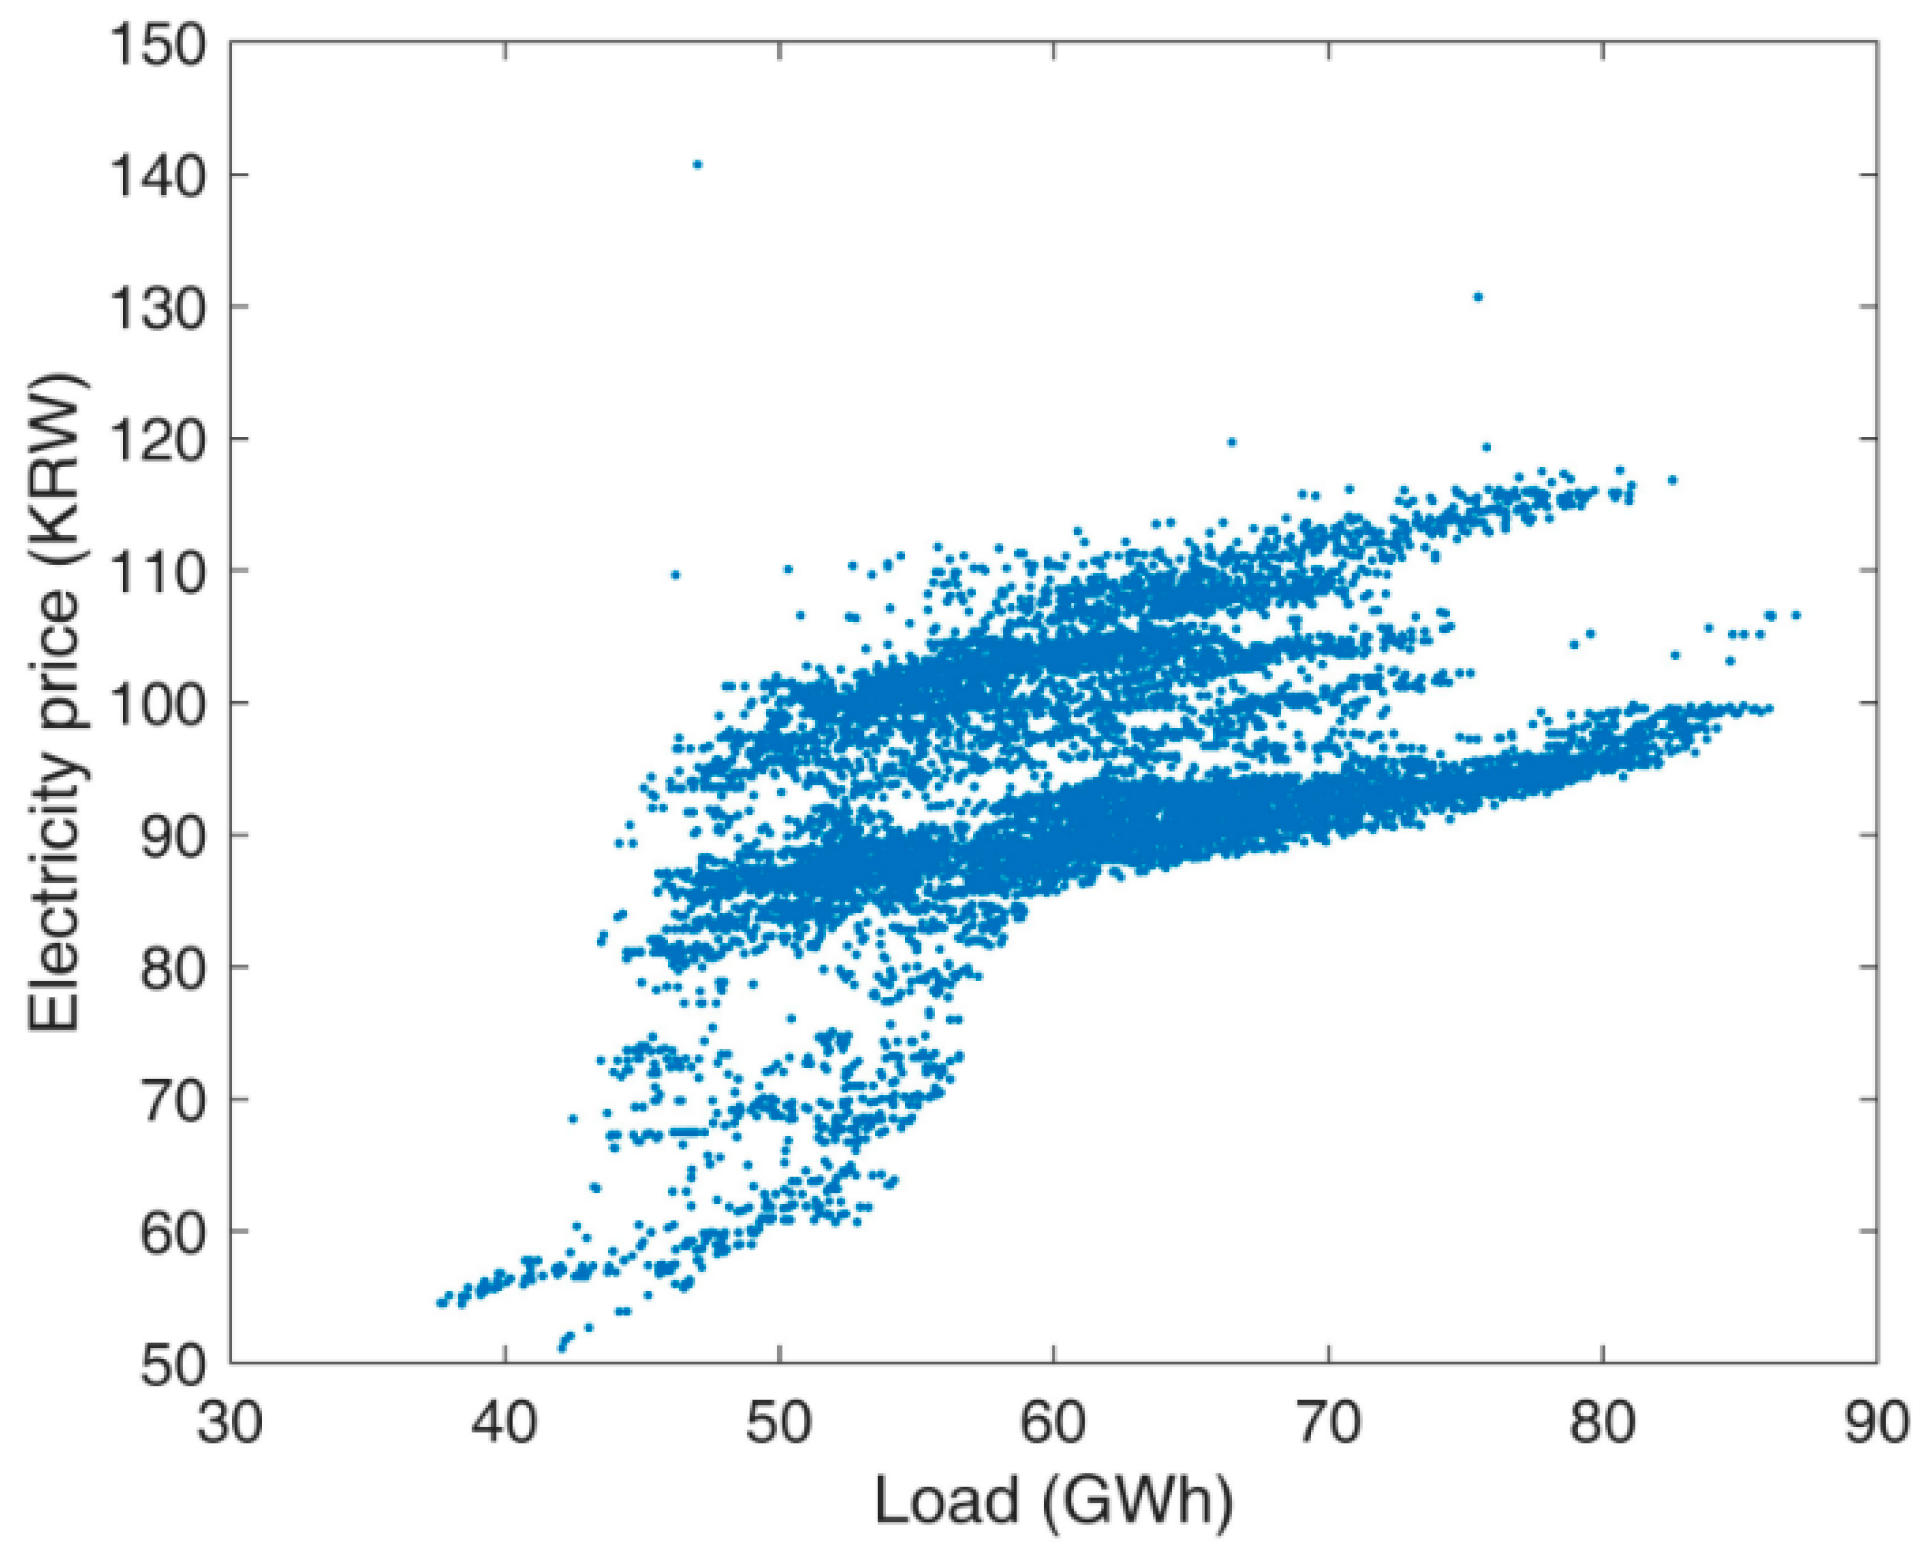
In
Figure 6, electricity prices are represented as a scatter plot with respect to the load. Although the electricity price appears to increase as the load increases, a relationship between them is difficult to identify. Therefore, considering the monthly correlation coefficients in
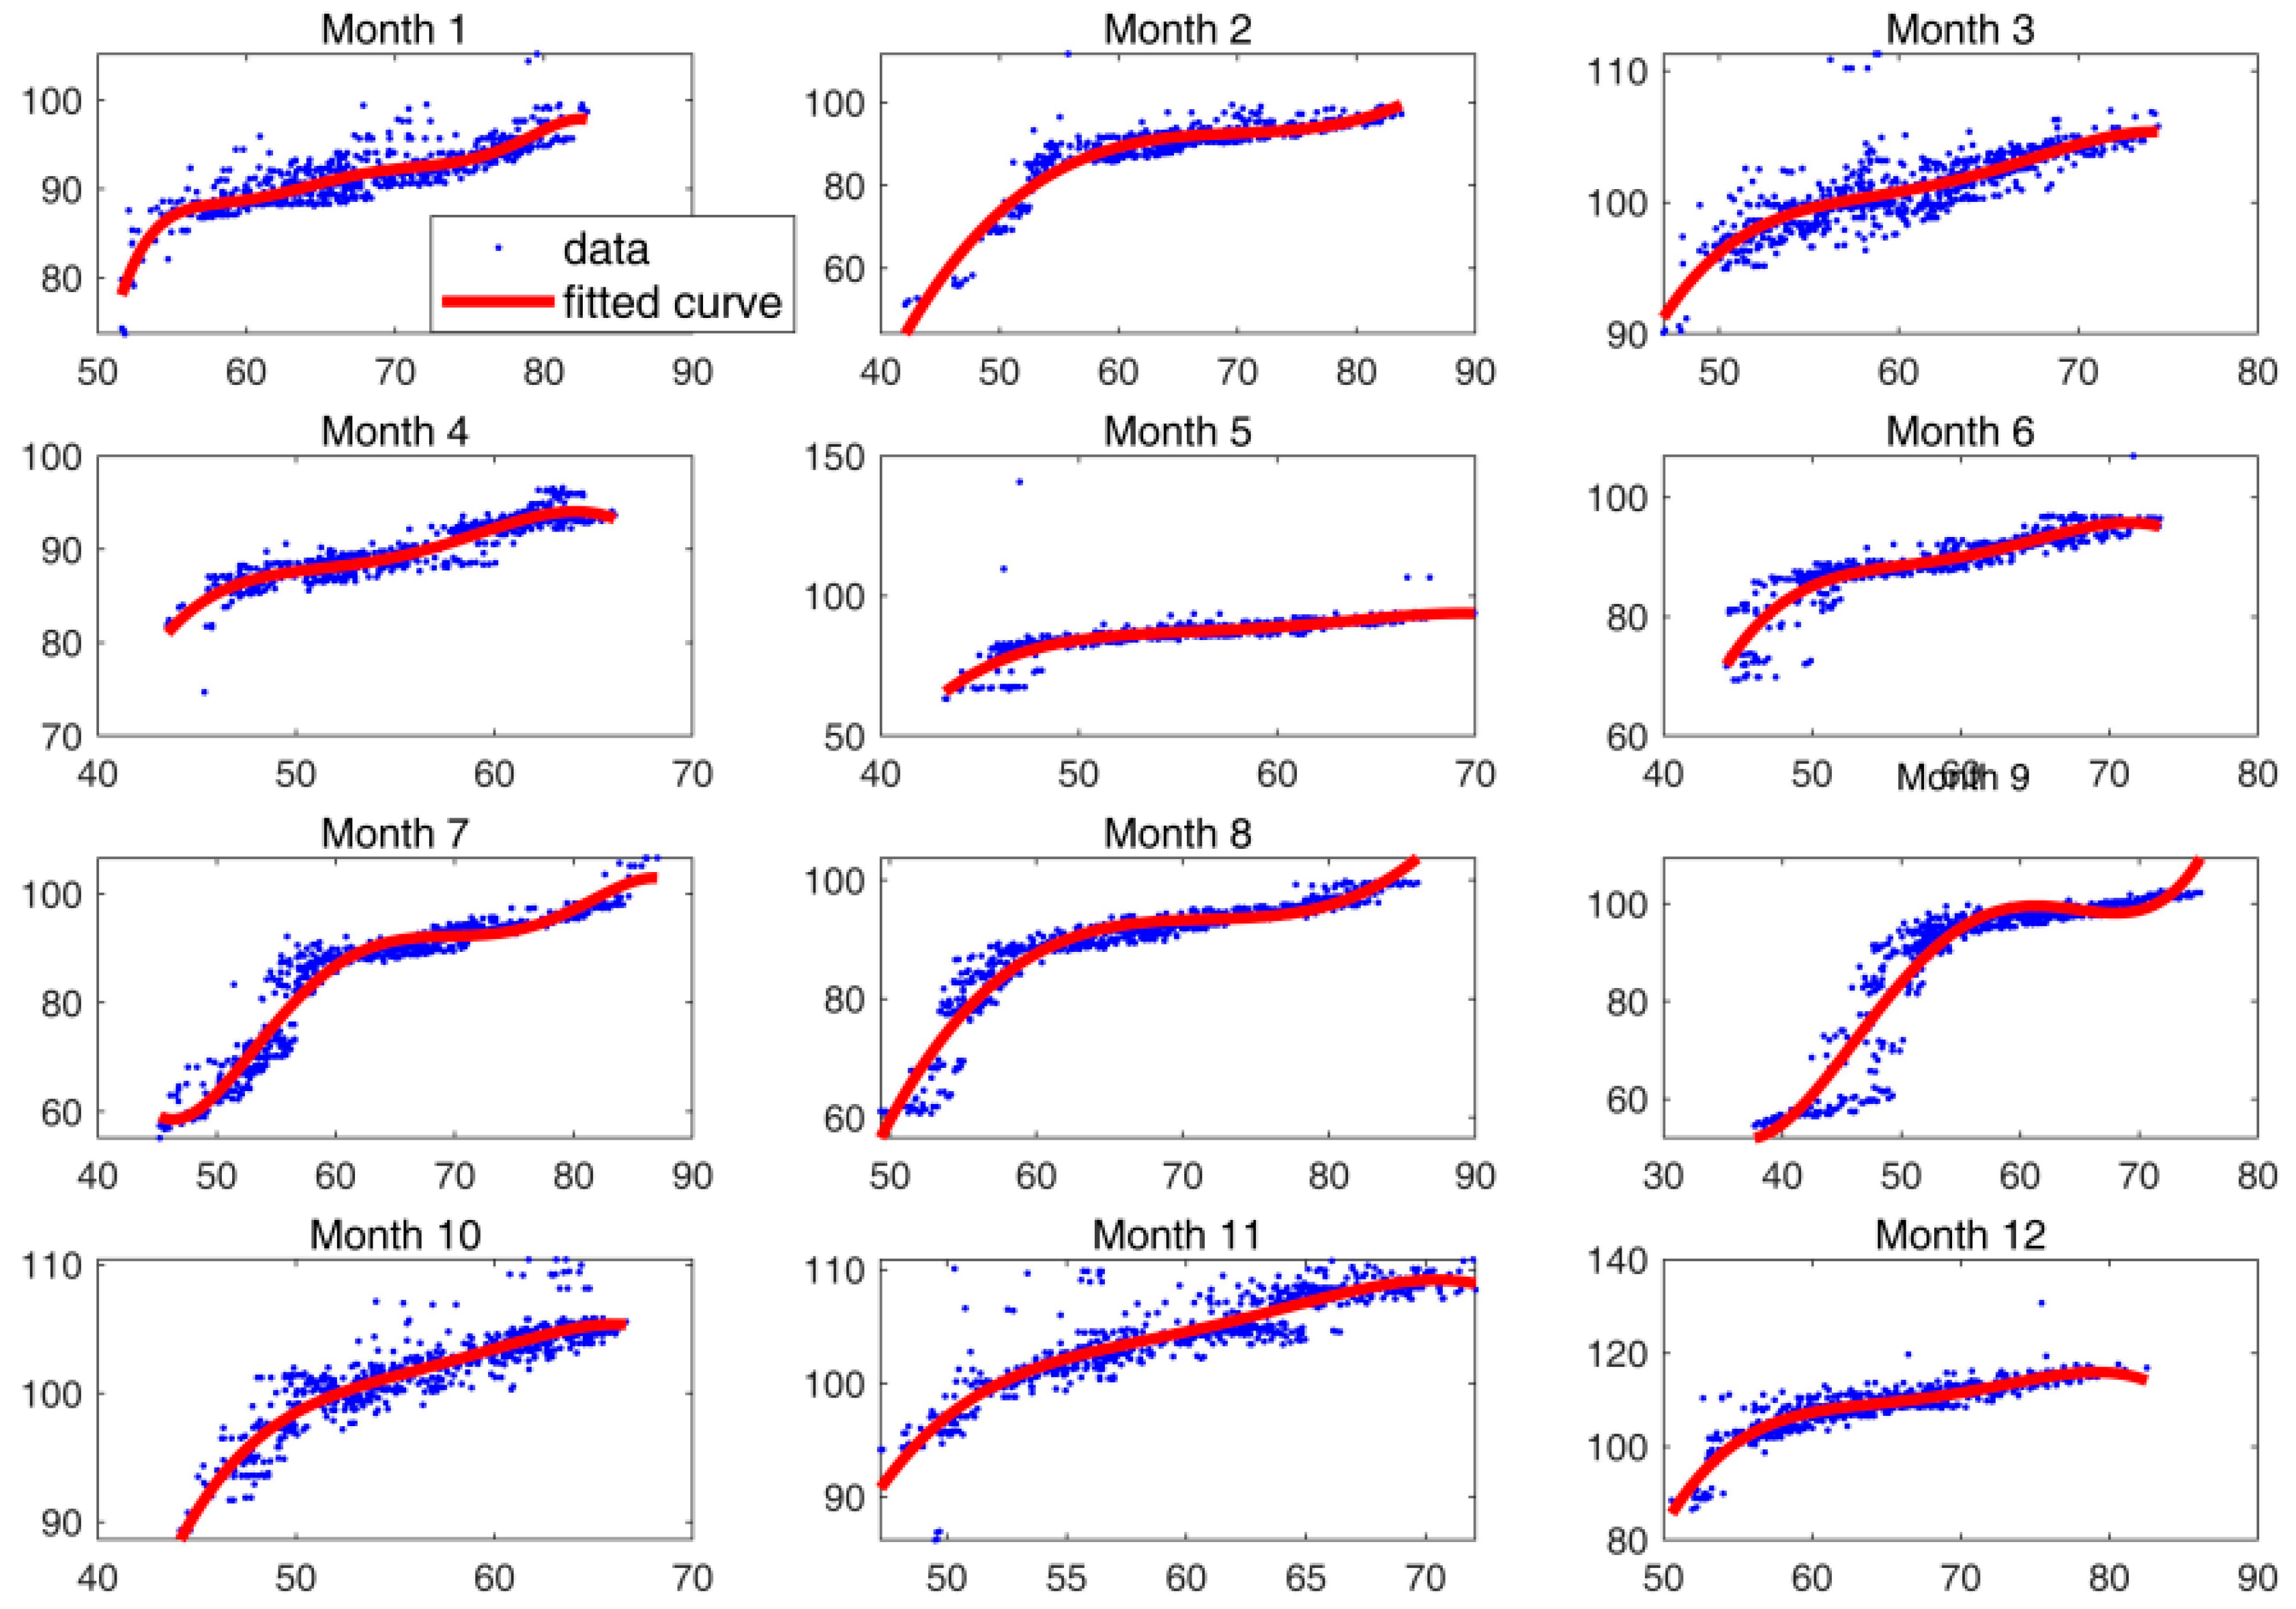
Table 1, we divide the data by month and represent them as separate scatter plots in
Figure 7. Contrary to
Figure 6, the variation of data points is small, so a relationship between electricity prices and loads becomes evident.
The results of the adjusted R-squared values are shown in
Figure 8. By checking whether the adjusted R-squared value is close enough to 1, the degrees of the polynomial of each month, from January to December, are selected as 6, 3, 4, 4, 4, 4, 5, 3, 4, 4, 4, and 4, respectively. The fitted functions are represented as the solid red lines on the original data points in
Figure 7. The fitted graph of each month in
Figure 7 represents the original electricity prices well. Specifically, the MAPE of the fitted electricity prices during a year is equal to 1.78%.
5.3. Economic Analysis
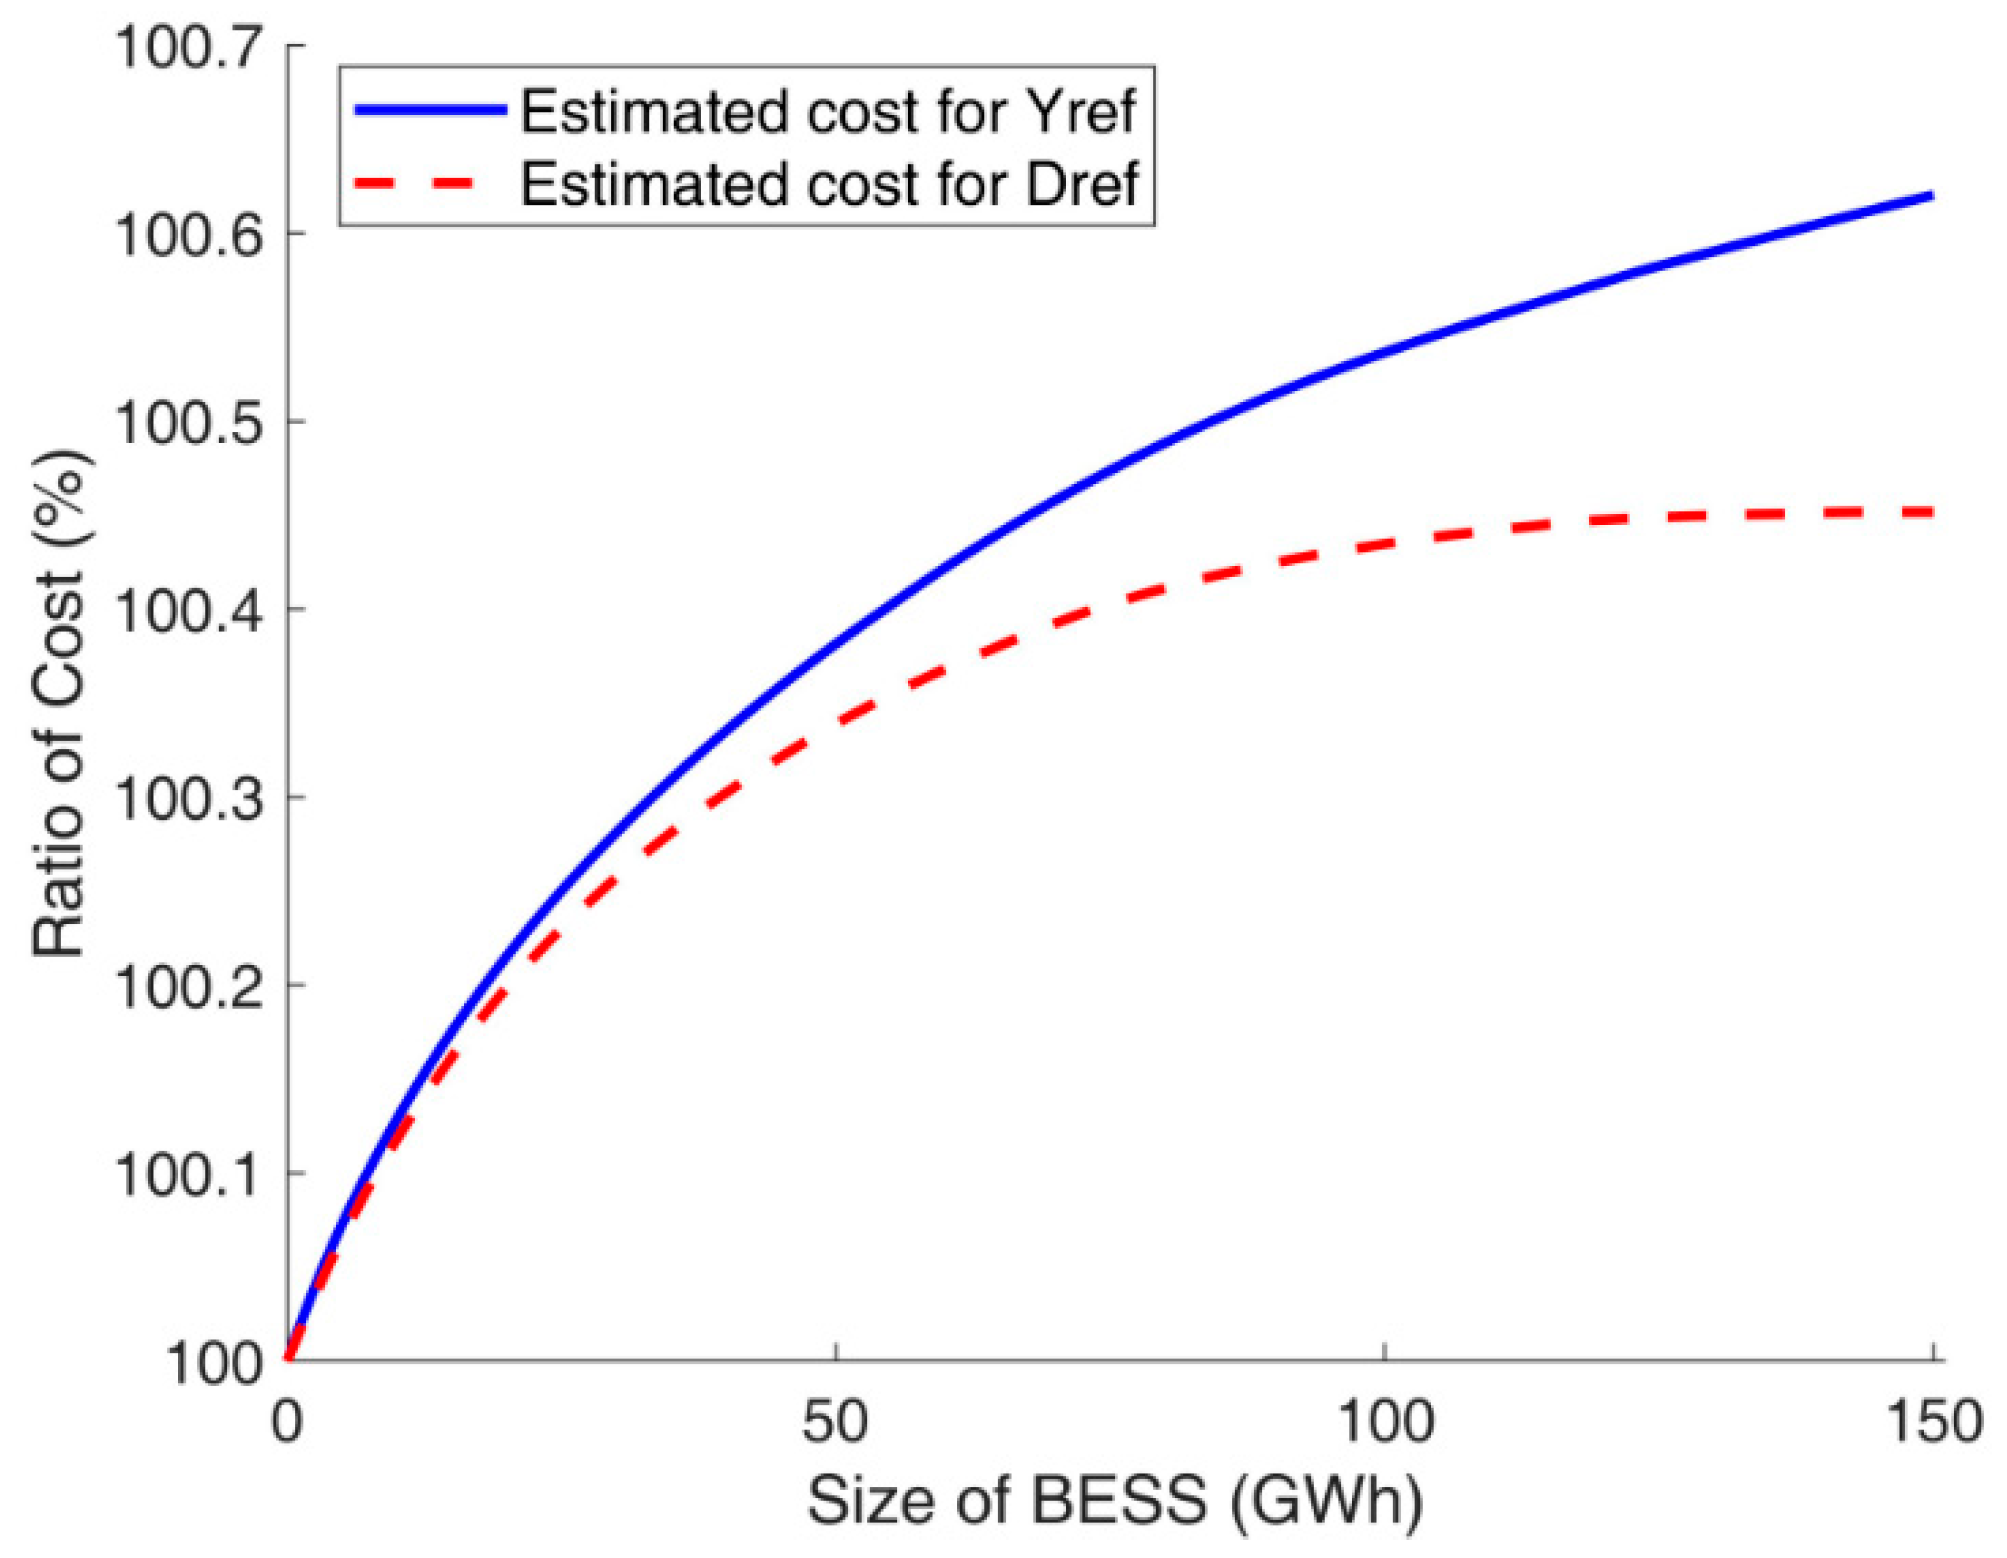
First, the accuracy of the fitted electricity price function is examined in terms of the total cost. The total cost for the original prices and loads is calculated as 50,776 billion KRW and the total cost for the fitted prices and original loads is also equal to 50,776 billion KRW. This is evidence of the suitability of the fitted price function. The estimated costs after load leveling with the BESS are shown in
Figure 9 as a percentage of the total cost of 50,776 billion KRW for the original prices and loads without BESS.
Figure 9 shows that, regardless of whether the load leveling is performed for Yref or Dref, the total cost monotonically increases as BESS size increases. Based on the expectation that an economic benefit should accrue from load leveling due to the reduction in peaks, this result seems counterintuitive at first. However, closer inspection of
Figure 7 indicates that this should nevertheless be the natural result because electricity prices increase fast in the range of small loads, but they increase slowly in the range of high loads. As a result, the increased cost due to upward leveling of small loads is greater than the decreased cost from downward leveling of high loads. Consequently, the total cost increases after load leveling with BESS. In addition,
Figure 7 shows that the total cost for Yref is greater than that for Dref. This implies that more effort is required to flatten the loads over a longer time period, resulting in a greater cost increase.
The results suggest that we need to rethink the purpose of load leveling. If the price function is a quadratic one based on the cost of the physical operation of generators [
41], the total cost will monotonically decrease as BESS size increases, although the extent of the decrease will gradually become smaller. Then, it should be a natural decision to use BESS for load leveling, and the problem is essentially reduced to deciding on a suitable BESS size by comparing the cost decrease from the leveled loads against the cost increase from the BESS. However, as
Figure 9 indicates, the costs which are physically incurred by generators is not the only factor to be considered in deciding on electricity prices or bidding prices in a market environment. For example, under some bidding strategies, bid prices for low loads could be set much higher than the actual generation costs and those for high loads could be set at a level comparable to the actual generation cost. In this case, the electricity prices shown in
Figure 7 would result. Consequently, without other benefits, such as improved reliability and stability due to the leveled load, one cannot simply assume that load leveling is a worthwhile grid application of BESS from an economic standpoint, particularly in an electricity market environment.
5.4. BESS Operation for Reducing the Cost
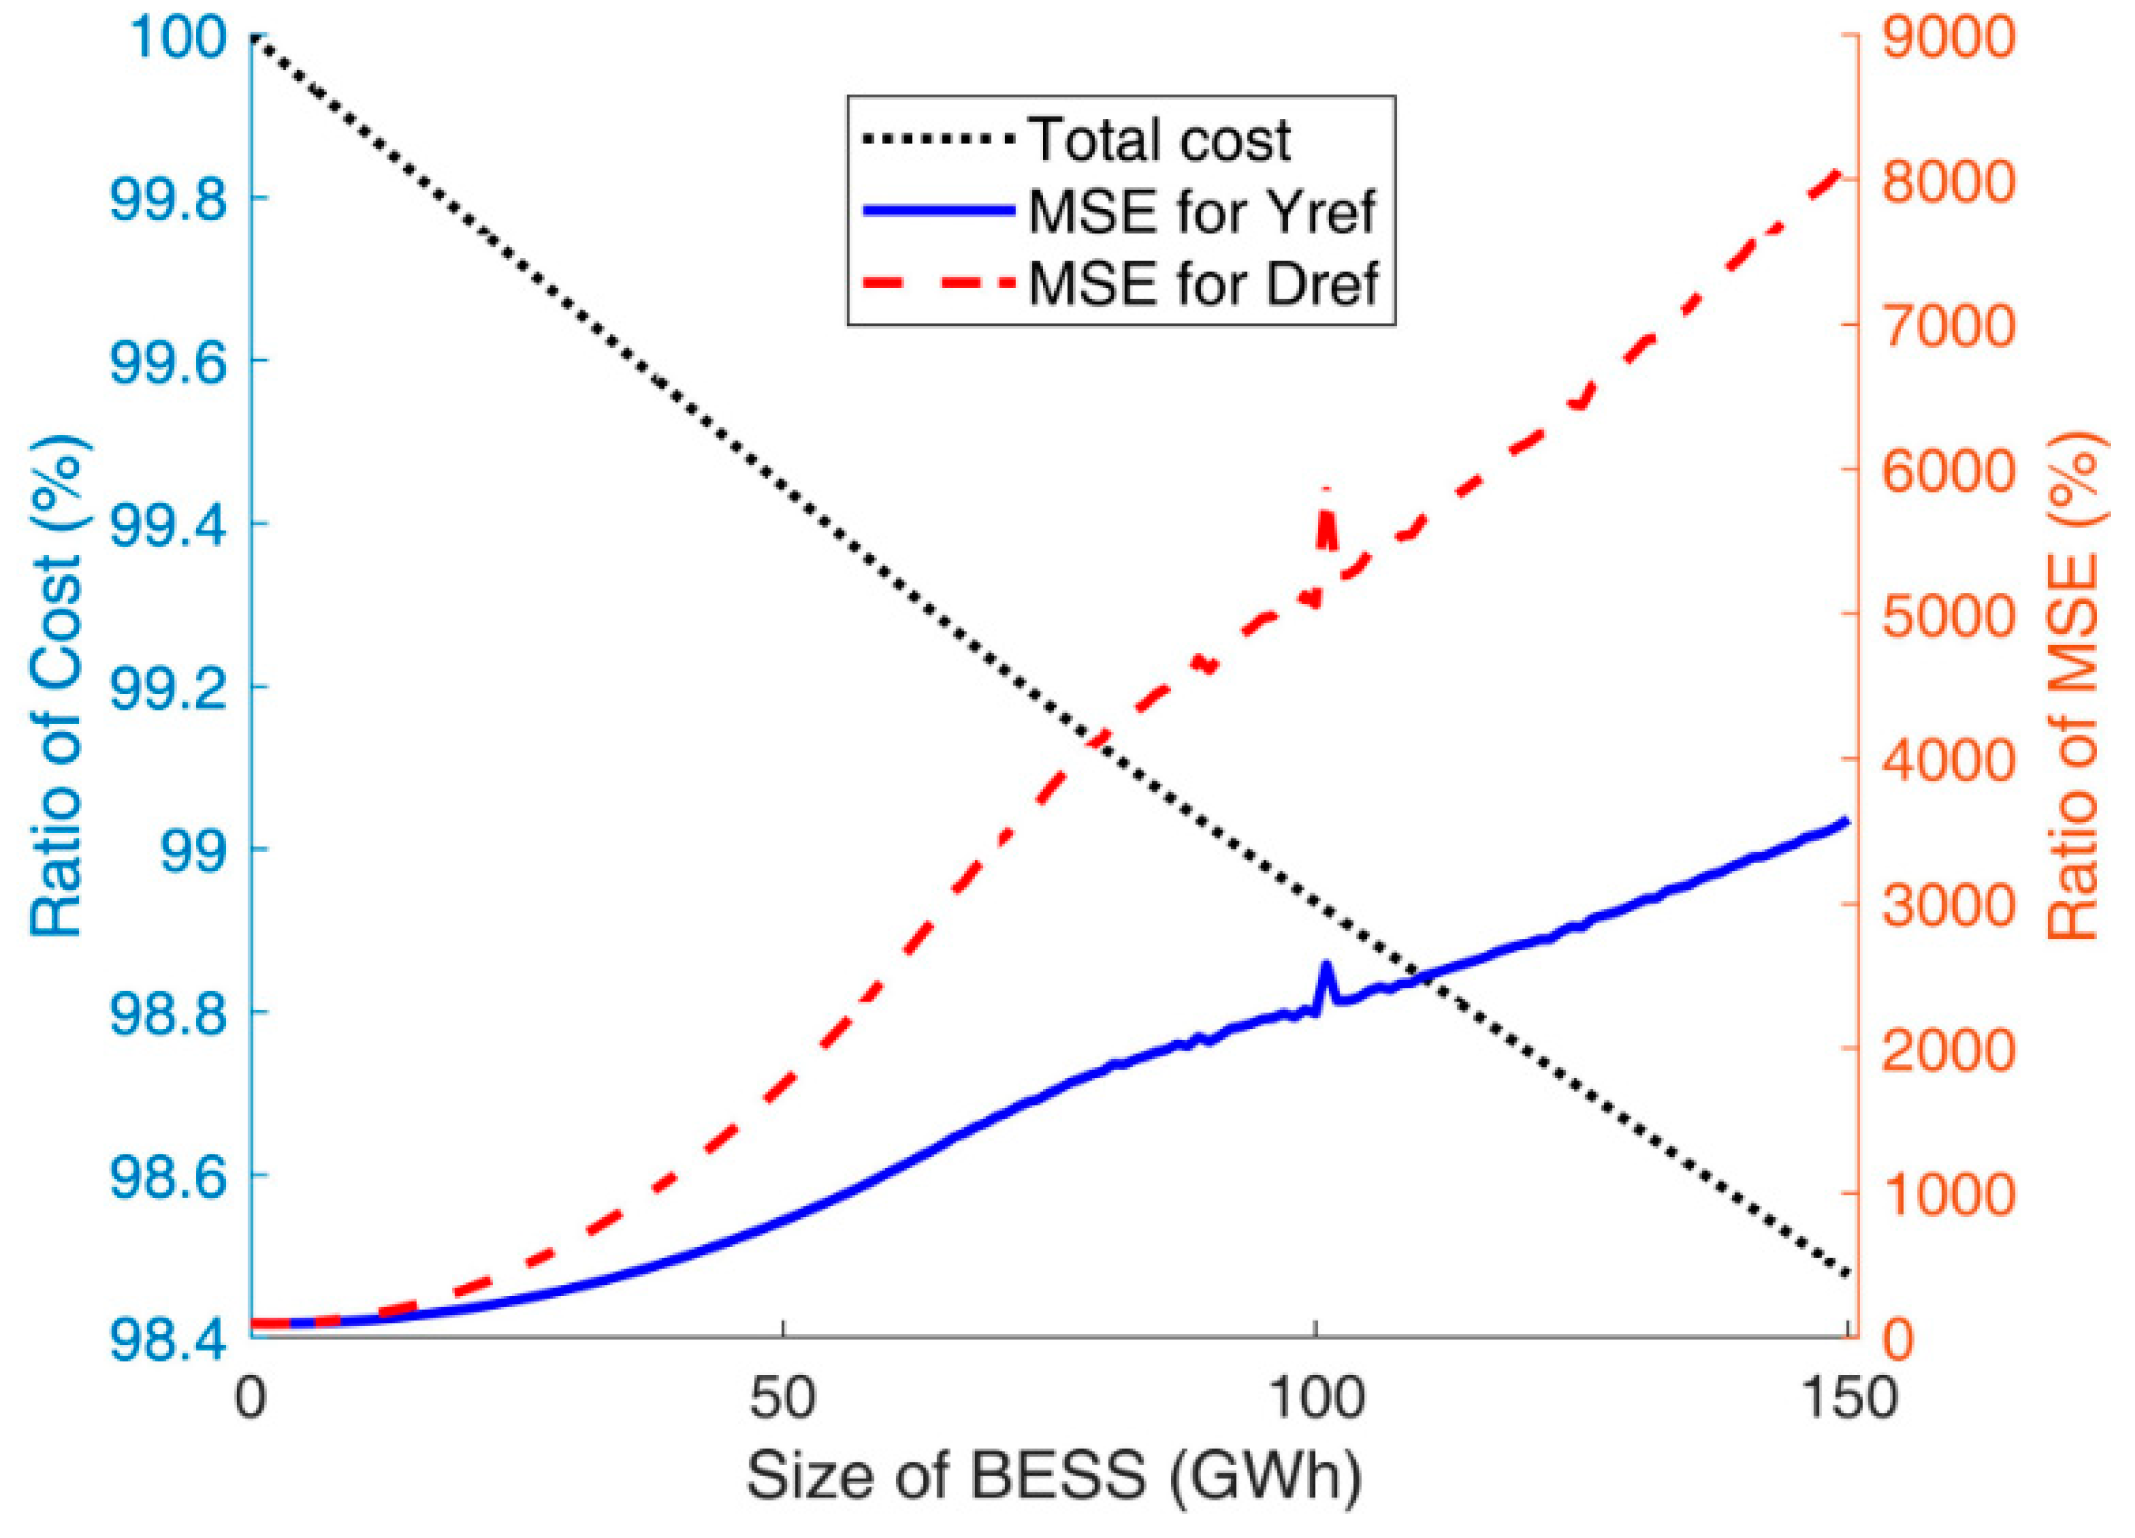
The results of the second scenario, the cost minimization scenario, are shown in
Figure 10. Like
Figure 9, the total cost and the MSE are represented in
Figure 10 as the percentage of the corresponding results for the original prices and loads without BESS.
Figure 10 shows that the total cost decreases linearly as the BESS size increases because BESS are operated to minimize the total cost. However, the MSEs for Yref and Dref increase rapidly to tens of times the MSE without BESS, which is completely against the purpose of load leveling. This is because, in the process of minimizing the cost, the loads greater than the reference value are increased and the loads less than the reference value are decreased. This means that the loads can be changed to deviate further from the reference value to reduce the cost.
6. Discussion
The results of load leveling in
Section 5.1 indicate that loads can be flattened more as BESS size increases. However, it should be noted that the extent of load leveling performance is gradually reduced, while the costs of BESS remain high. Therefore, if the total cost of electricity consumption decreases due to the leveled loads, it may be necessary to compare the marginal reduction in the total cost reduction with the marginal increase in the investment for the unit increase in BESS size. Then, the optimal BESS size can be determined. However, as presented in
Section 5.3, the total cost rather monotonically increases as the BESS size increases and the load is correspondingly flattened more. This suggests that the load leveling with BESS may not necessarily lead to economic benefits for a utility company, particularly in a competitive electricity market environment. Subsequently, it becomes meaningless to discuss how much the economic benefit is as the BESS size increases and which BESS size is optimal for the load leveling application in terms of economic benefit. What is the reason for these counterintuitive results? It can be inferred from
Figure 7 that the complex strategic decisions of the participants in an electricity market may result in a complex pattern of electricity prices, whereby prices increase quickly in the range of small loads but increase slowly in the range of high loads. In this case, it may be simply incorrect to state that the utility’s investment in BESS can be recovered after some years through the reduced purchasing cost of electricity.
This conflict between the economic benefit and the load leveling application with BESS can be verified more clearly by reviewing the results of the second scenario. In order to reduce the total cost, BESS are charged during the periods of low electricity price and discharged during high price periods. However, this means that operating BESS with the goal of reducing electricity costs actually widened the variation of the resulting loads. Consequently, in a certain electricity market environment, the economic operation of BESS to recover investment costs will increase the fluctuation of net loads. As a result, the side costs of maintaining the reliability and stability of electricity networks may undermine the utility company’s profit.
The results in this study lead to some guidelines for designing a policy related to the BESS for load leveling. First, it should not simply be assumed that BESS with a high cumulative capacity is always economically beneficial even if the investment cost in BESS is low enough. Second, load leveling with the BESS may rather increase the total cost of electricity provision, particularly in a competitive electricity market environment. In this case, the load leveling needs to be linked to other purposes than economic benefit to justify the validity of using the BESS. Third, when a large number of distributed BESS are integrated into the power system, the pricing mechanism of electricity should be elaborately designed to prevent the synchronized operation of the BESS. This is necessary to ensure systems remain sufficiently profitable and that the power system is reliable.
7. Conclusions
BESS, alongside renewable energy sources, are expected to become a major component of future power systems. However, an analysis of their economic feasibility is essential because, at present, the costs of investing in BESS are significant. Among the various grid applications of BESS, this study focused on load leveling and analyzed its economic benefits in an electricity market environment. For economic analysis, load leveling is formulated as a constrained optimization problem, which is then solved using mixed integer quadratic programming. Additionally, the electricity prices are represented as a function of the load using the polynomial regression method to estimate the adjusted prices for the leveled loads.
The results of the economic analysis using Korean data show that the degree of reduction in the MSEs of the leveled loads decreases as BESS size increases. The problem that MSE reduction decreases with the increase in BESS size is more severe for the yearly reference because load leveling is performed for the same constant reference over a longer time period. Further, the results show that, contrary to the simple expectation that load leveling will result in decreased cost of electricity generation, the total cost monotonically increases as the BESS size increases and accordingly, the loads are flattened more. By contrast, if BESS are operated to minimize the cost, the variation of net loads severely increases, which is the opposite to what load leveling is intended to achieve.
The results suggest some guidelines for designing policy related to BESS for load leveling. First, it should not be assumed that a large cumulative capacity of BESS is always economically beneficial if its price is low enough. Second, load leveling with BESS may actually increase the total cost of electricity provision, particularly in a competitive electricity market environment. In this case, the justification for pursuing load leveling needs to be based on some purpose other than economic benefit to ensure the validity of using BESS. Finally, when a large number of distributed BESS are integrated into the power system, the electricity pricing scheme should be elaborately designed to prevent the synchronized operation of BESS and thereby, ensure the power system remains reliable.
Meaningful further research could consider the following topics: First, it is assumed that GENCOs’ bids do not change for utilities’ application of load leveling with BESS. That is, the price function itself may change with leveled loads, which results in another iterative process. Thus, defining this iterative mechanism becomes a research issue, which will be very difficult to be addressed because it involves strategic, not just technical, decisions on behalf of GENCOs. Second, if the leveled loads improve reliability and stability of power systems, a different kind of economic analysis can be done by translating the improved reliability into monetary value. Third, it is assumed in this study that BESS are operated only for load leveling. Thus, it may be necessary to consider that BESS are utilized partly for load leveling and partly for another purpose, and to determine an optimal proportion between the applications of BESS.


