Article

Optimization of the Energy Consumption of a Carbon Capture and Sequestration Related Carbon Dioxide Compression Processes

Instituttet for ingeniørvitenskap og sikkerhet IVT, UiT Norges Arktiske Universitet, 9019 Tromsø, Norway
*
Author to whom correspondence should be addressed.
Energies 2019, 12(9), 1603; https://doi.org/10.3390/en12091603
Submission received: 26 March 2019 / Revised: 16 April 2019 / Accepted: 25 April 2019 / Published: 26 April 2019
(This article belongs to the Special Issue Carbon Capture, Storage and Utilization)

Abstract

:
It is likely that the future availability of energy from fossil fuels, such as natural gas, will be influenced by how efficiently the associated CO2 emissions can be mitigated using carbon capture and sequestration (CCS). In turn, understanding how CCS affects the efficient recovery of energy from fossil fuel reserves in different parts of the world requires data on how the performance of each part of a particular CCS scheme is affected by both technology specific parameters and location specific parameters, such as ambient temperature. This paper presents a study into how the energy consumption of an important element of all CCS schemes, the CO2 compression process, varies with compressor design, CO2 pipeline pressure, and cooling temperature. Post-combustion, pre-combustion, and oxyfuel capture scenarios are each considered. A range of optimization algorithms are used to ensure a consistent approach to optimization. The results show that energy consumption is minimized by compressor designs with multiple impellers per stage and carefully optimized stage pressure ratios. The results also form a performance map illustrating the energy consumption for CO2 compression processes that can be used in further study work and, in particular, CCS system models developed to study performance variation with ambient temperature.

Graphical Abstract

1. Introduction

Carbon capture and sequestration (CCS) is recognized as an important strategy for reducing CO2 emissions, but its wide spread adoption is held-back by uncertainty over the energy consumption and cost impact implied by the additional infrastructure required because of this, the optimization of CCS processes to reduce their energy and cost impacts represents an important field of study.
The capture element of most CCS schemes is generally accepted to have the greatest impact on energy efficiency and cost. Lucquiaud et al. [1] report that for an “nth of a kind CCS plant with current state-of-the-art solvent technology” the energy needed by the capture plant will be 250–300 kWh of electrical energy per tonne CO2 captured (kWhe/tCO2), whereas estimates of the energy consumption for CO2 compression lie typically in the range 80–120 kWhe/tCO2 [2]. CO2 compression is also a mature technology, with conventional multi-stage centrifugal CO2 compressor designs widely used in the fertilizer and petroleum industries [3]. Suppliers of large-capacity multi-stage centrifugal CO2 compressors include Dresser-Rand, General Electric (GE), and MAN Turbo and Diesel (MAN). Common industrial applications include enhanced oil recovery (EOR), fertilizer production, and CCS. MAN, for example, has operating references including an 8-stage compressor used for EOR with a discharge pressure of 187 bara and a capacity of 36 kg/s; a 10-stage compressor used in fertilized production with a discharge pressure of 200 bara and a capacity of 13 kg/s; and offers designs for capacities of up to 110 kg/h [4]. Given that a 600 MW natural gas combined cycle power plant with 90% CO2 capture requires a CO2 compression capacity of approximately 56 kg/h [5], the scale-up of current industrial designs to CCS applications is generally considered unproblematic. As a result, fewer studies have been made into the optimization of the CO2 compression process than have been made for the capture processes.
Some studies have studied the optimization of CO2 compression in the context of a particular CCS capture technology. Romeo et al. [6] and Luo et al. [7] studied the optimum design for CO2 compression in the context of heat recovery into a steam cycle. Posch et al. [8] and Font-Palma et al. [9] studied the optimization of the oxyfuel flue gas purification process where the early parts of the CO2 compression process are integrated with the CO2 separation process. Other studies have looked at optimization from the perspective of comparing conventional compression approaches to newer unconventional approaches. Alabdulkarem et al. [10] studied the potential benefit of liquefaction and pumping. Harkina et al. [11] and Luo et al. [7] studied the benefits of using shockwave type compression. Pei et al. [12] studied the benefits of heat recovery using ORC. A small number of studies such as Calado [13] and Jackson et al. [14] have considered the optimum number of CO2 compression stages, but these have had a limited focus and do not apply their conclusions to the full set of operating parameters that could be expected in a range of typical CCS scenarios. Overall, most CO2 compressor optimization studies are limited to one specific CCS scenario and focus on the capture process rather than the compression process in itself. Many do not optimize stage pressure ratios or the number of compression stages. None have been identified that consider optimization of compressor design for a wide set of operating cases.
The aim of this study is to generate a set of CO2 compressor performance data that is based on the optimum number of compressor stages and stage pressure ratios for a wide range of operating cases. The specific intention is that this data can be used to support the development of a system model capable of comparing energy consumption of a wide variety of CCS scenarios.

2. Method

The compressor model used in this study was developed in MATLAB (2018a, The MathWorks, Natick, MA, United States) utilizing properties predictions from the TREND package (Thermodynamic Reference and Engineering Data 3.0., Lehrstuhl für Thermodynamik, Ruhr-Universität Bochum, Bochum, Germany). A literature review was conducted to identify a set of realistic CO2 compressor design parameters; the operating parameters for the three principle CO2 capture alternatives: Post-combustion, pre-combustion and oxyfuel; and the appropriate range of cooling temperatures and discharge pressures to be studied. Optimization of the compressor model for each set of parameters was carried out using algorithms available in MATLAB. Each of these elements of the study method are set out in Nomenclature.

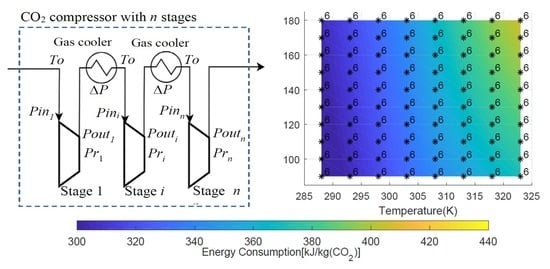
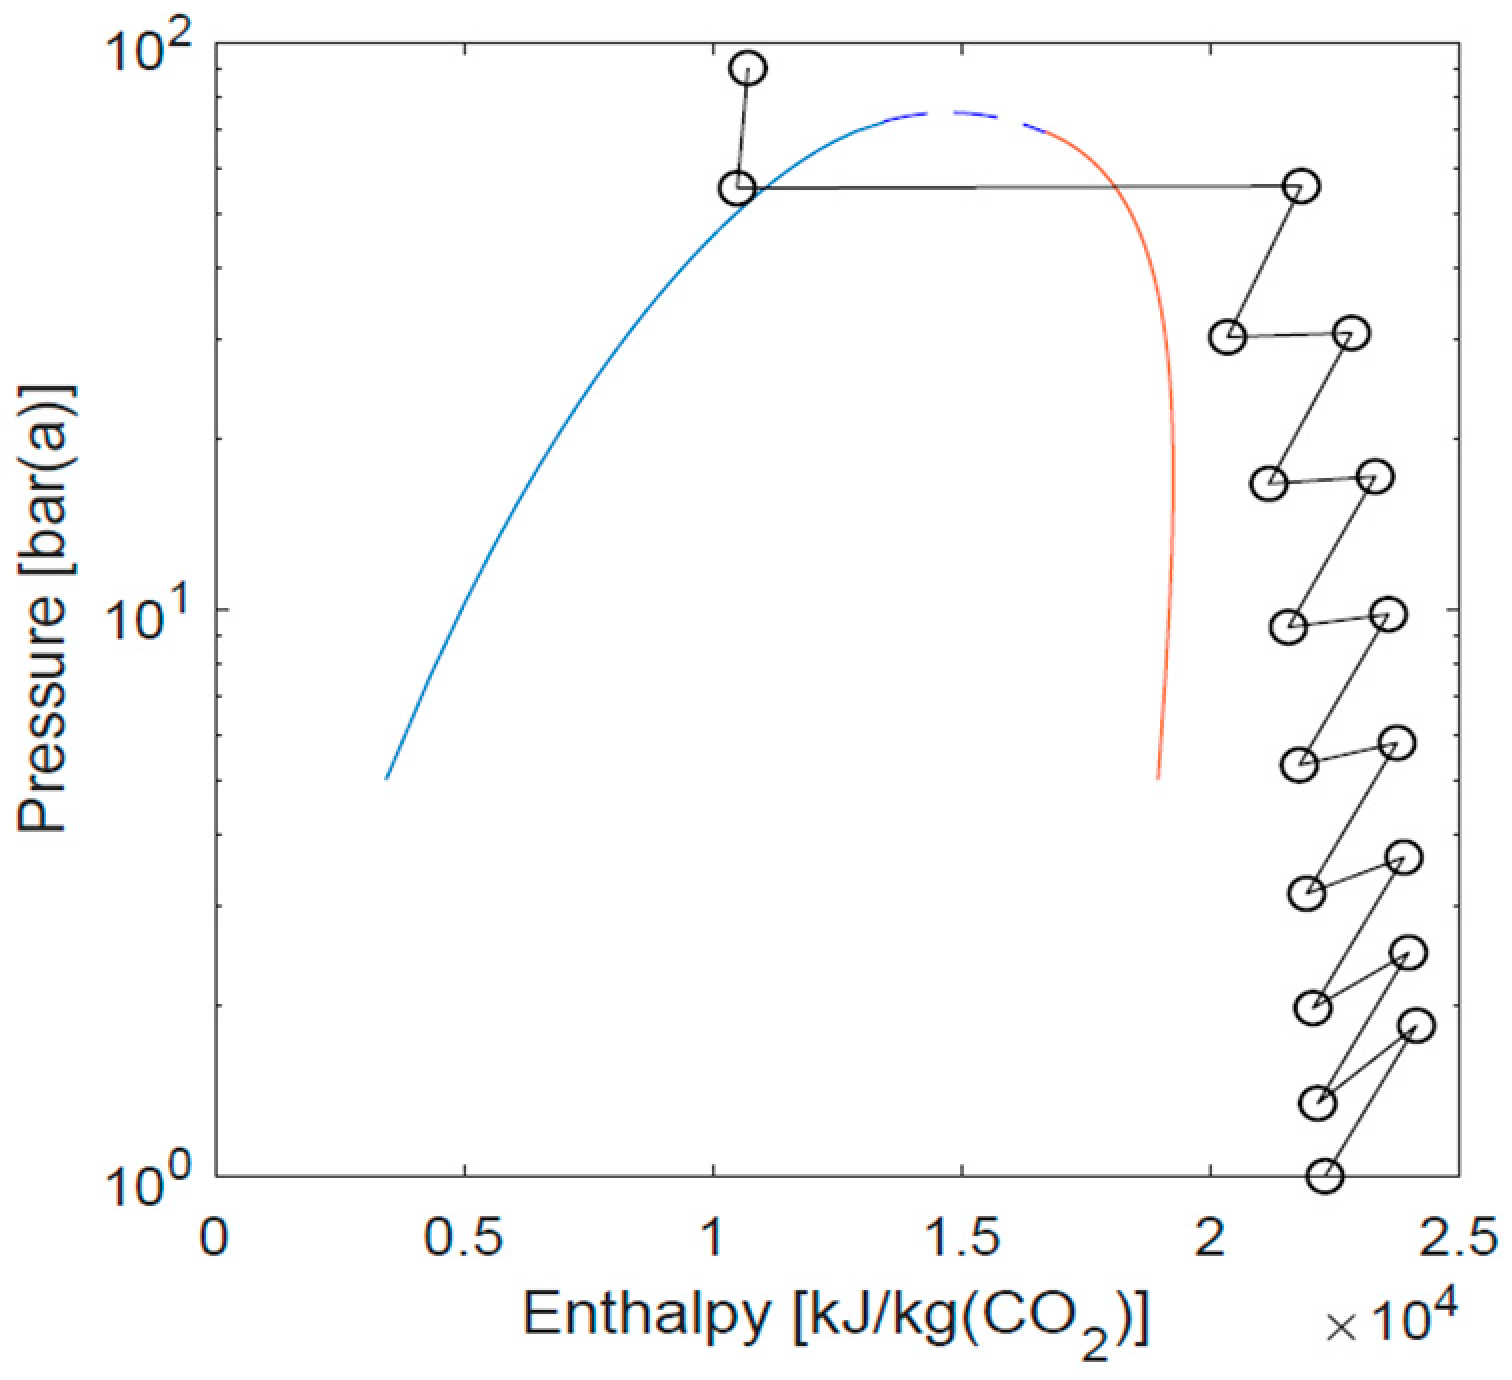
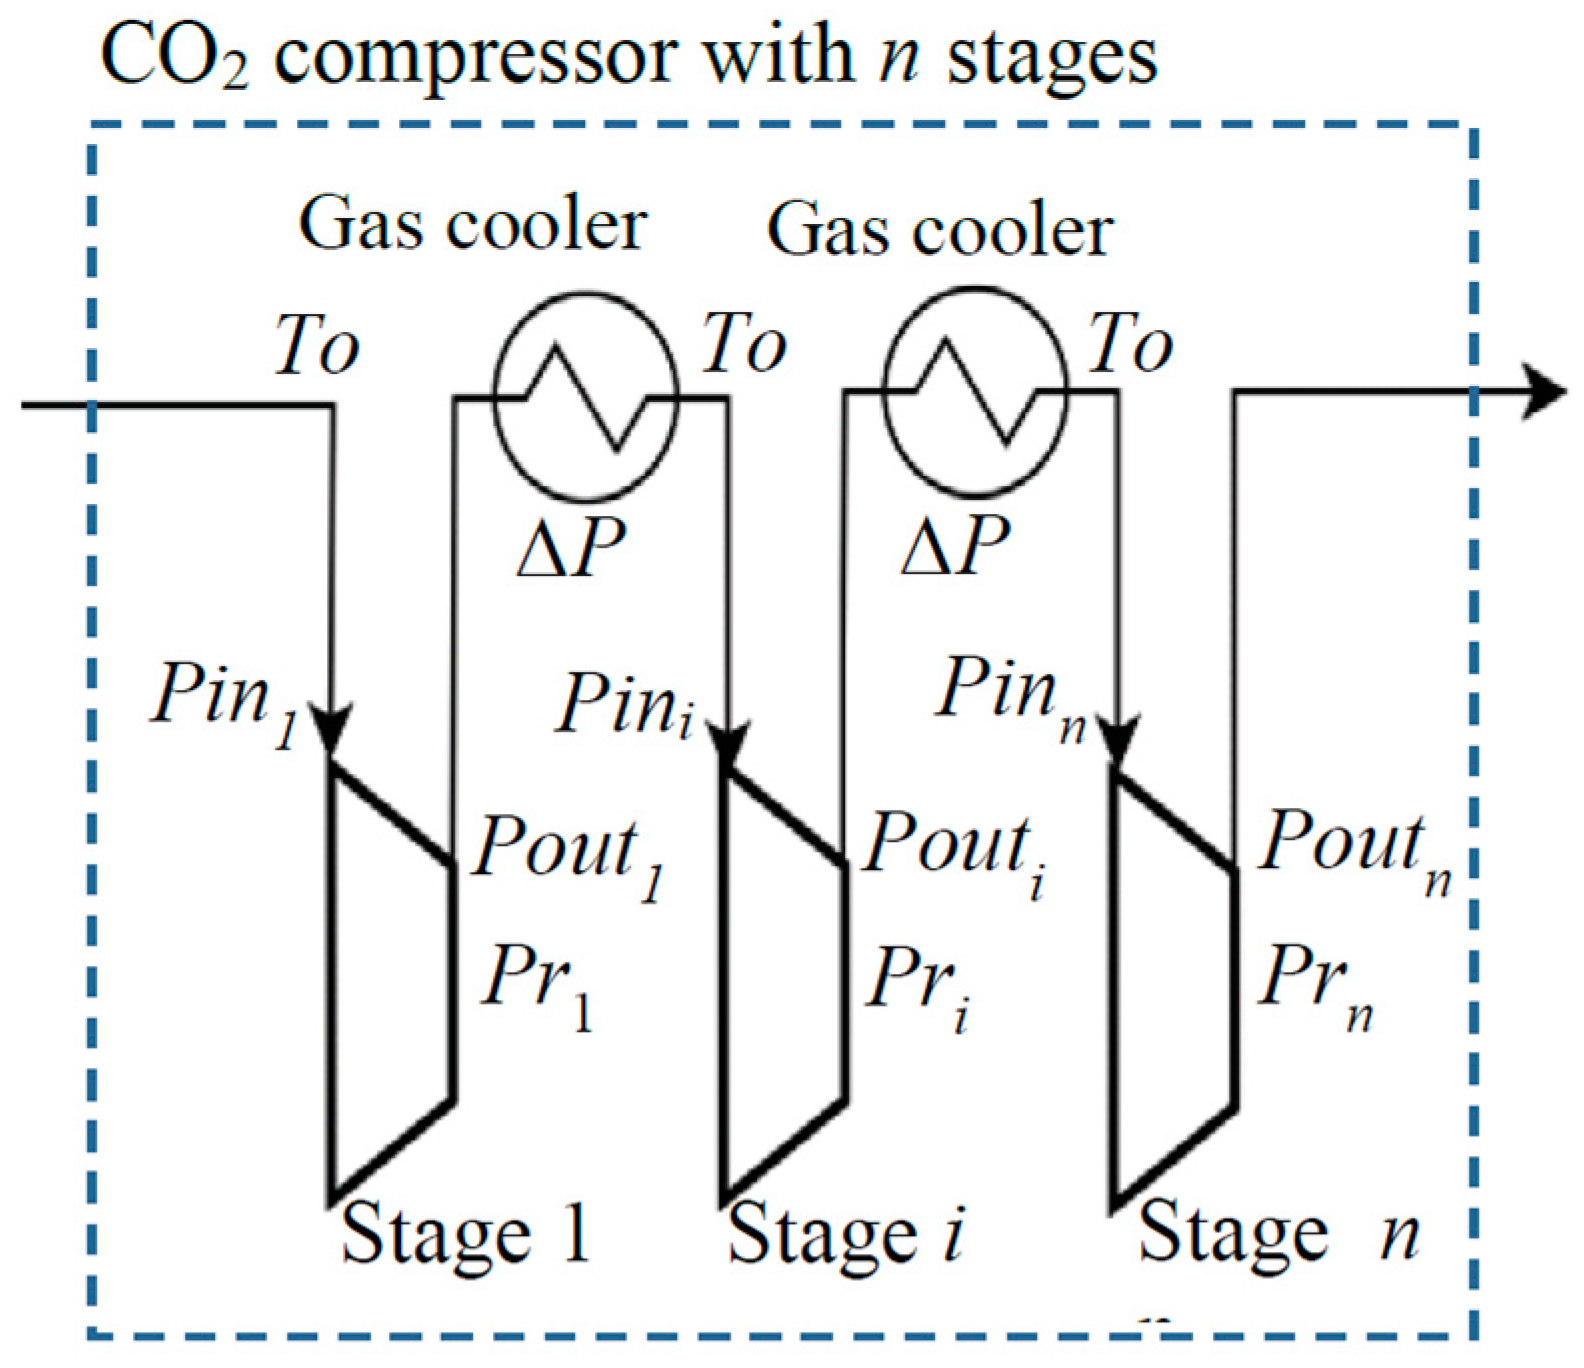
2.1. Compressor Modeling

Conventional CO2 compressor designs can either be integrally geared type, with one impeller and one gas cooler per stage; or barrel type, with multiple impellers and one gas cooler per stage [3]. In both designs the pressure ratio per impeller is limited to around 2 for CO2 service and because of this, it is common to model CO2 compressors with a pressure ratio per stage limit, P r < 2 [6]. In this study, the cases following this convention are called the constrained cases. In a barrel type compressor design it is common to use several impellers per stage, and with an integrally geared design this is also possible, although less common. When multiple impellers are used per stage, P r can be greater than 2, and in some studies, unconventional compressor designs with a P r of up to 10 have been investigated [7,11], although these compressor designs are still under development. In this study, all cases where P r > 2 are referred to as unconstrained cases.
Figure 1 and Figure 2 provides an illustration of a CO2 compressor design with n stages, where P i n 1 is the compressor feed pressure and P o u t n is the compressor discharge pressure. Each stage is assigned a sequential number, i = { 1 ,   , n } . P i n i is the inlet pressure for stage i; P r i is the pressure ratio for stage i; and P o u t i is the outlet pressure for stage i. The gas cooler pressure drop, ΔP, and the gas cooler outlet temperature, To, are both equal for all stages. In all cases, Δ P is fixed at 0.5 bar and To is studied over a range.
The objective of the optimization study was to minimize the energy consumption required for compression, Wc, which was calculated in the model as follows:
W c = i = 1 n H o u t S i H i n i η ,
where H o u t S i is the enthalpy at the outlet of an isentropic compression stage; H i n i is the enthalpy at the compression stage inlet; and η is the compressor stage isentropic efficiency. In the literature, compressor stage isentropic efficiencies in the range 80% to 90% have been used [2,6,8,12,15,16]. In this study η is fixed at 85%.
Stage enthalpy and entropy values, H o u t S i = f ( S i , P o u t i , x i ) , H i n i = f ( T o , P i n i , x i ) , and S i = f ( P i n i , T o ) were calculated using the TREND properties package, where S i is the entropy at the inlet to stage i and x i is the composition at the inlet to stage i. In the oxyfuel study cases the CO2 stream is dry and x i is therefore fixed. In the other cases, the CO2 stream is saturated with water below 30 bar(a) and, therefore, the water content and x i varies with temperature and pressure. In these cases, x i = f ( T o , P i n i , ) was also calculated using TREND.
When a liquid phase is possible at To, the final stage inlet pressure, P i n n , is fixed 5 bar above the mixture dewpoint pressure, P D P ; when it is not, P i n n is fixed 5 bar above the crycondenbar pressure for the CO2 mixture,   P C R . The final stage of the compressor represents a pump when the CO2 stream is in the liquid phase.
A summary of the main compressor modelling parameters is provided below in Table 1.

2.2. Study Parameters

Three CO2 capture scenarios were modeled: Pre-combustion capture, post-combustion capture, and oxyfuel. In all of the three scenarios the compressor discharge pressure, P n , is studied in the range 90 bar(a) to 180 bar(a). Each compressor aftercooler has an outlet temperature, T o , which is studied in the range 288 K to 323 K. The scenario specific parameters for each of the three capture cases are described below and summarized at the end of this section in Table 2.

2.2.1. Post-Combustion Capture

A typical post-combustion capture processes is represented by an amine based solvent absorption unit. This type of process produces a relatively pure stream of CO2 at atmospheric pressure that is saturated with water. Typically, CO2 streams that are to be transported in a pipeline are dried part-way through the compression process to take advantage of water drop-out in the early stages of compression [2]. In this study the break point for dehydration was taken as 30 bar(a): All stages below 30 bar(a) were modeled with a feed stream that was saturated with water; all above were modeled as dry. The dry stream composition used in this study, 99.99 mole% CO2 and 0.01 mole% nitrogen, was based on an assessment of data published by DNV [17] and the TRENDS project [18].

2.2.2. Pre-Combustion Capture

There are a wide variety of competing pre-combustion capture processes [19]. Based on a review of [20,21] the basis for this study is a stream of CO2 originating from steam-methane reformer that is captured using an MDEA solvent. As in the post combustion cases, the feed stream will be at atmospheric pressure and saturated with water below 30 bar(a). The dry composition, 99.5 mole% CO2 and 0.5 mole% methane, was, again, based on an assessment of data published by DNV [17] and the TRENDS project [18].

2.2.3. Oxyfuel Capture

Within a normal oxyfuel flue gas purification process the operating pressure for the initial stages of the CO2 compressor are set to optimize the performance of the purification process. This type of optimization falls outside of the scope of this study and, therefore, the feed pressure for the CO2 compression process studied here is taken as the highest product stream pressure resulting from the oxyfuel purification process, i.e., de-coupled from the optimization of the purification process. The CO2 stream from the purification process is dry, the main impurities being N2, O2, and argon [17]. The level of these impurities is not limited by technical barriers [9] and technologies for high and low purity has been investigated [8,15]. In this study, the highest pressure of the CO2 feed stream leaving the purification unit is taken as 16.5 bar(a) and its composition 96.16 mole% CO2, 2.45 mole% nitrogen, 0.96 mole% argon, and 0.43 mole% oxygen based on Posch et al. [8].

2.3. Optimization of Compressor Energy Consumption

Optimization of the compressor stage pressure ratios, P r n , was carried in MATLAB using the functions GA, Fmincon, and Fminsearch. Fminsearch uses a simplex algorithm that is suitable for unconstrained, multi-variable, non-linear optimization problems. A benefit of this method is that it will usually quickly converge to a solution, a downside is that in some cases a local minimum may be obtained. Fmincon is a gradient-based method that is designed to work on problems where the objective and constraint functions are both continuous and have continuous first derivatives. GA can solve smooth or non-smooth optimization problems with or without constraints. It is a stochastic, population-based algorithm. GA is generally slower to reach a solution than Fminsearch and Fmincon, but it is more reliable in solving for the global minimum. All of these algorithms were used with MATLAB default options unless stated below.

2.3.1. Variables, Initial Guesses, and Constraints

Since the final stage inlet pressure, P i n n , is fixed in the compressor model, the final stage pressure ratio, P r n , is not a variable in the optimization problem. In addition, since the penultimate stage pressure ratio, P r n 1 , is calculated from the product of the other pressure ratios and P i n n , P r n 1 is not a variable in the optimisation problem either. The result is that for an n stage compressor, n − 2 pressure ratios are variables.
The initial guesses for the stage pressure ratios were generated by assuming that all the stage pressure ratios were equal. The subsequent initial guesses used by the optimization algorithms were selected from previous optimization runs when available. The Fminsearch and Fmincon algorithms were generally used to improve initial guesses before GA was used.
In constrained cases, bound constraints are specified for all the variable pressure ratios such that P r i < 2 . In both the constrained and unconstrained cases, a minimum pressure ratio bound constraint P r i > 1.2 was also used to avoid problematic optimization solutions, e.g., where P o u t i Δ P < P i n i .

2.3.2. Objective Function

Since the pressure ratio for the next to last compression stage, P r n 1 , was calculated within the compressor model and was not a variable in the optimization problem, an additional constraint was applied in the form of a penalty function, P 1 , to ensure that P r n 1 > 1.2 for all cases, and P r n 1 < 2 in the constrained cases. The form of the penalty function was:
if   1.2   <   P r n 1   <   2 ,   P 1 = 0 ,   else   P 1 = 100 · ( P r n 1 1.5 ) 2 .
An additional penalty function, P 2 , was included to avoid two-phase conditions at any stage inlet conditions. This second penalty function had the form:
if   T o T D P > 5 ,   P 2 = 0 ,   else   P 2 = i = 1 n [ 0.01 + ( 5 T o T D P ) 2 ] ,  
where T D P = f ( P i , x i ) is the dewpoint temperature of the gas mixture,   x , at stage i .
The objective of the optimization problem was to minimize an objective function, X, which included contributions from the two penalty functions:
X = W c + P 1 + P 2 .

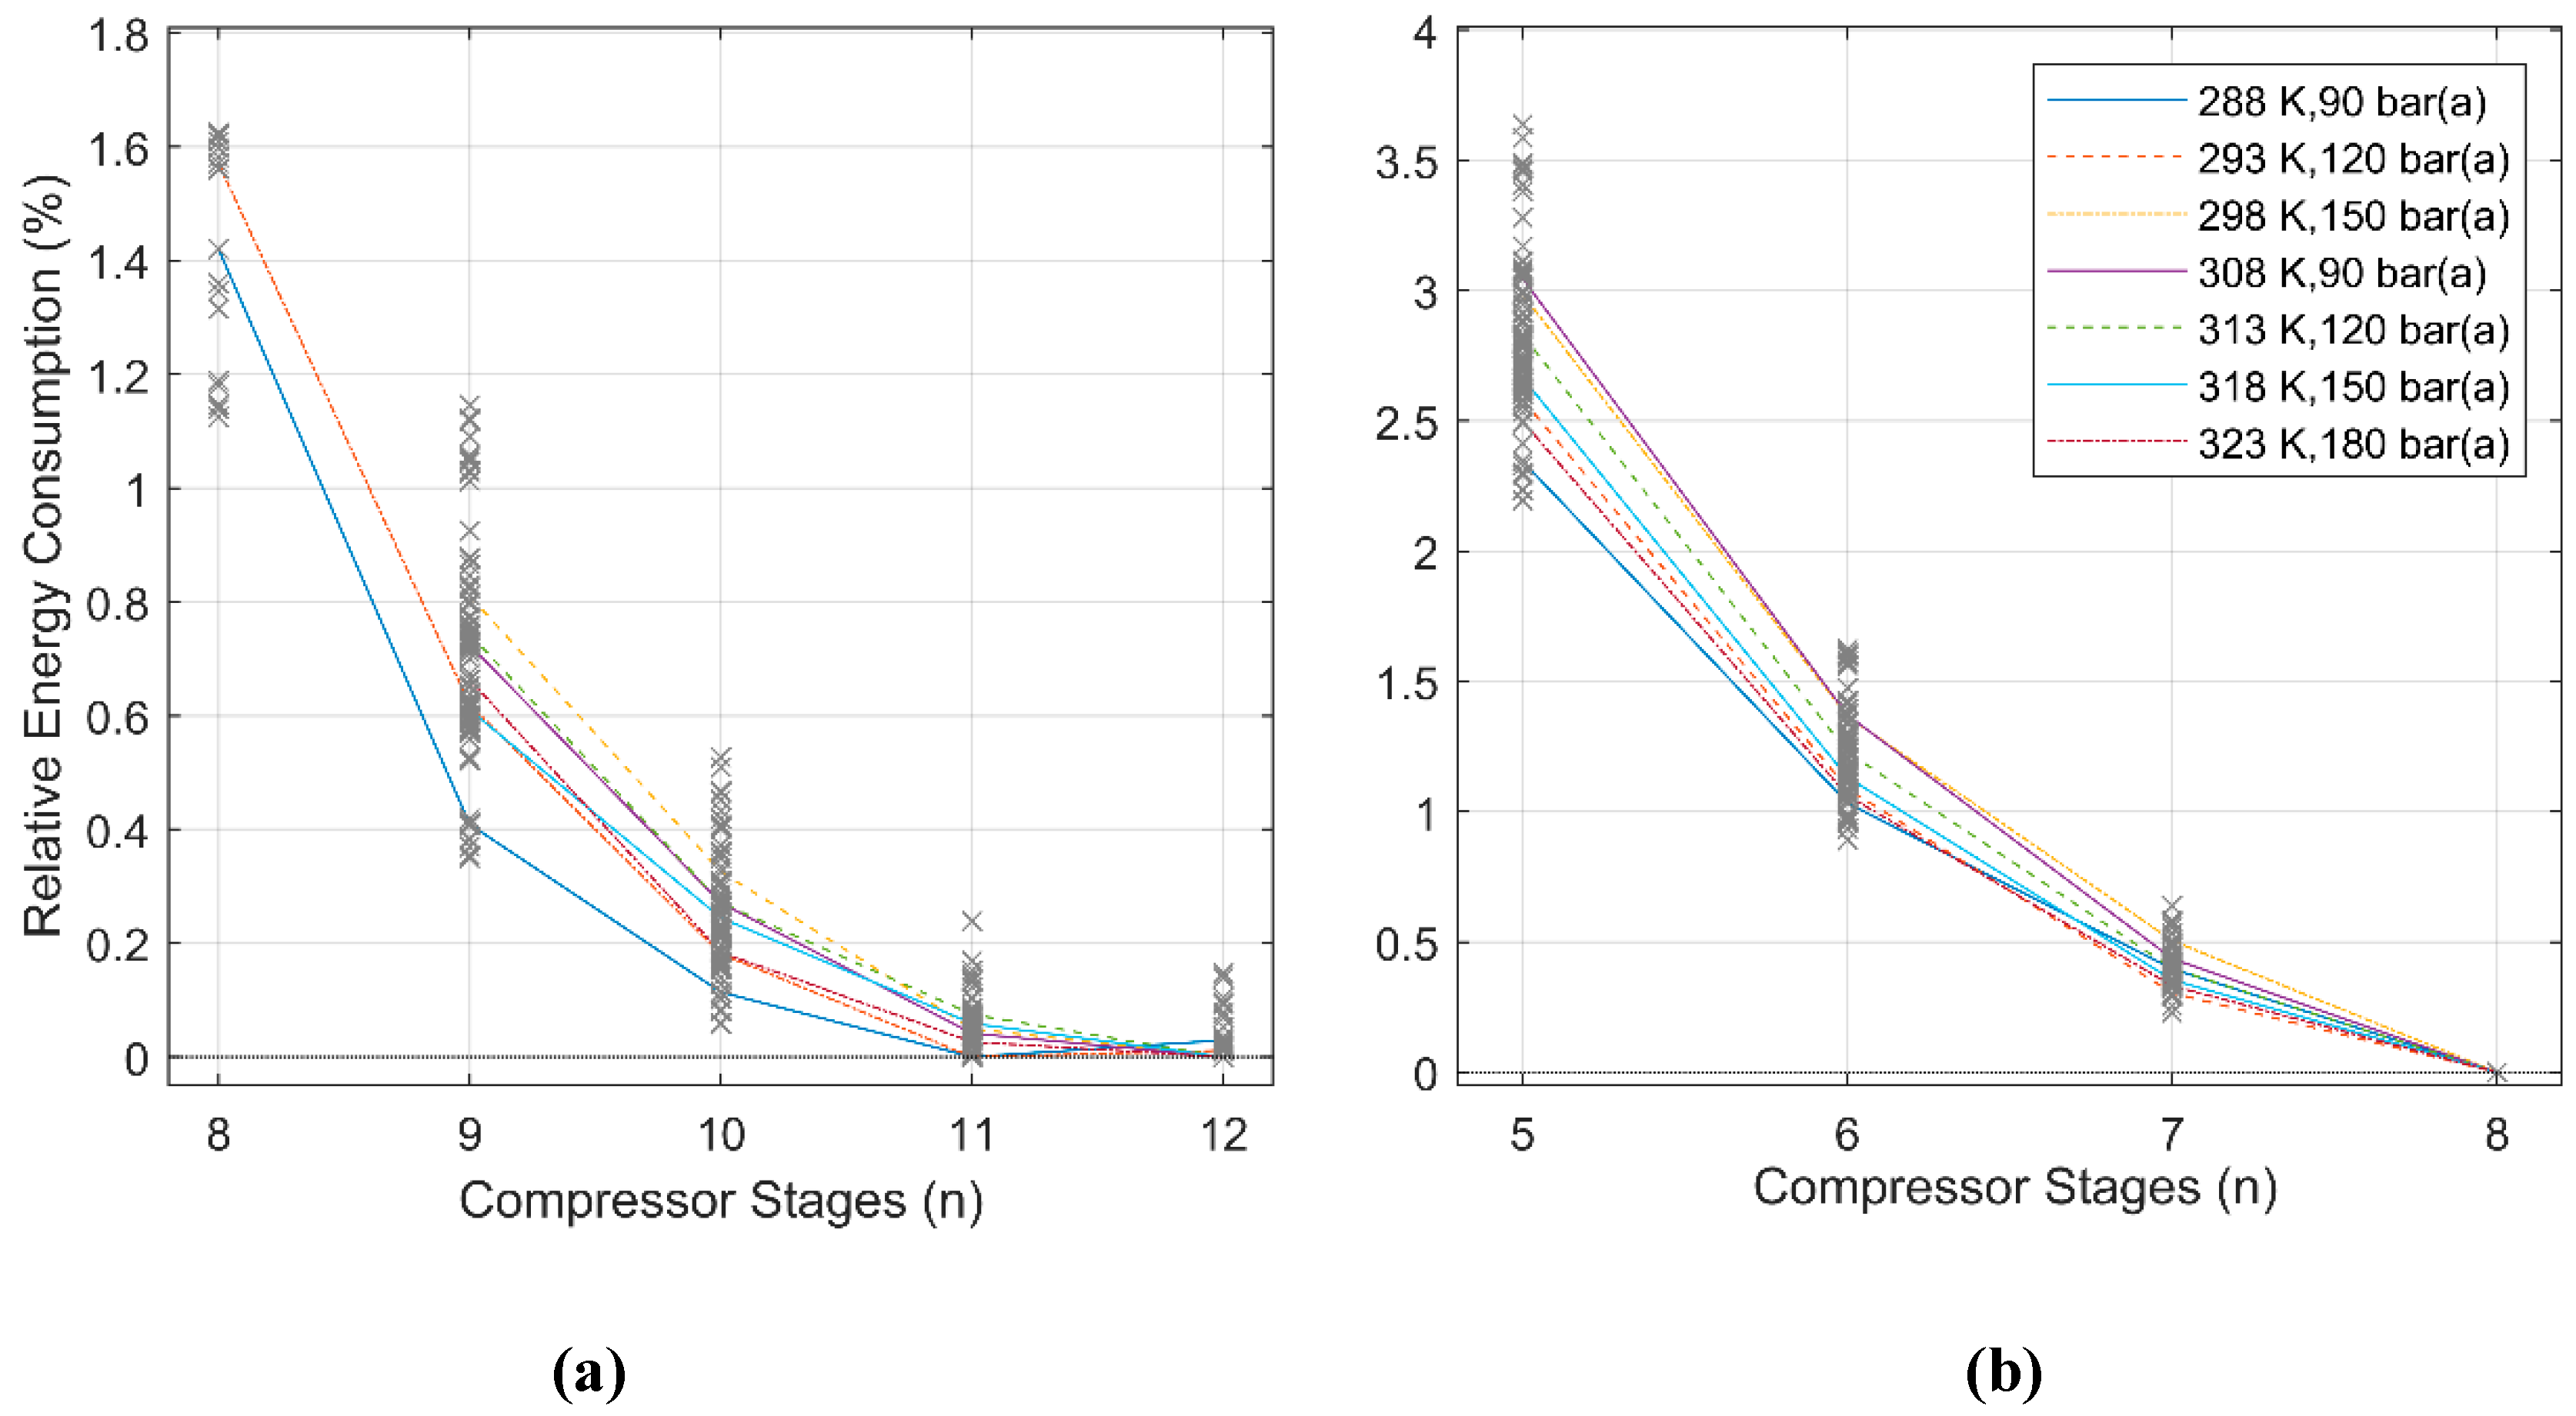
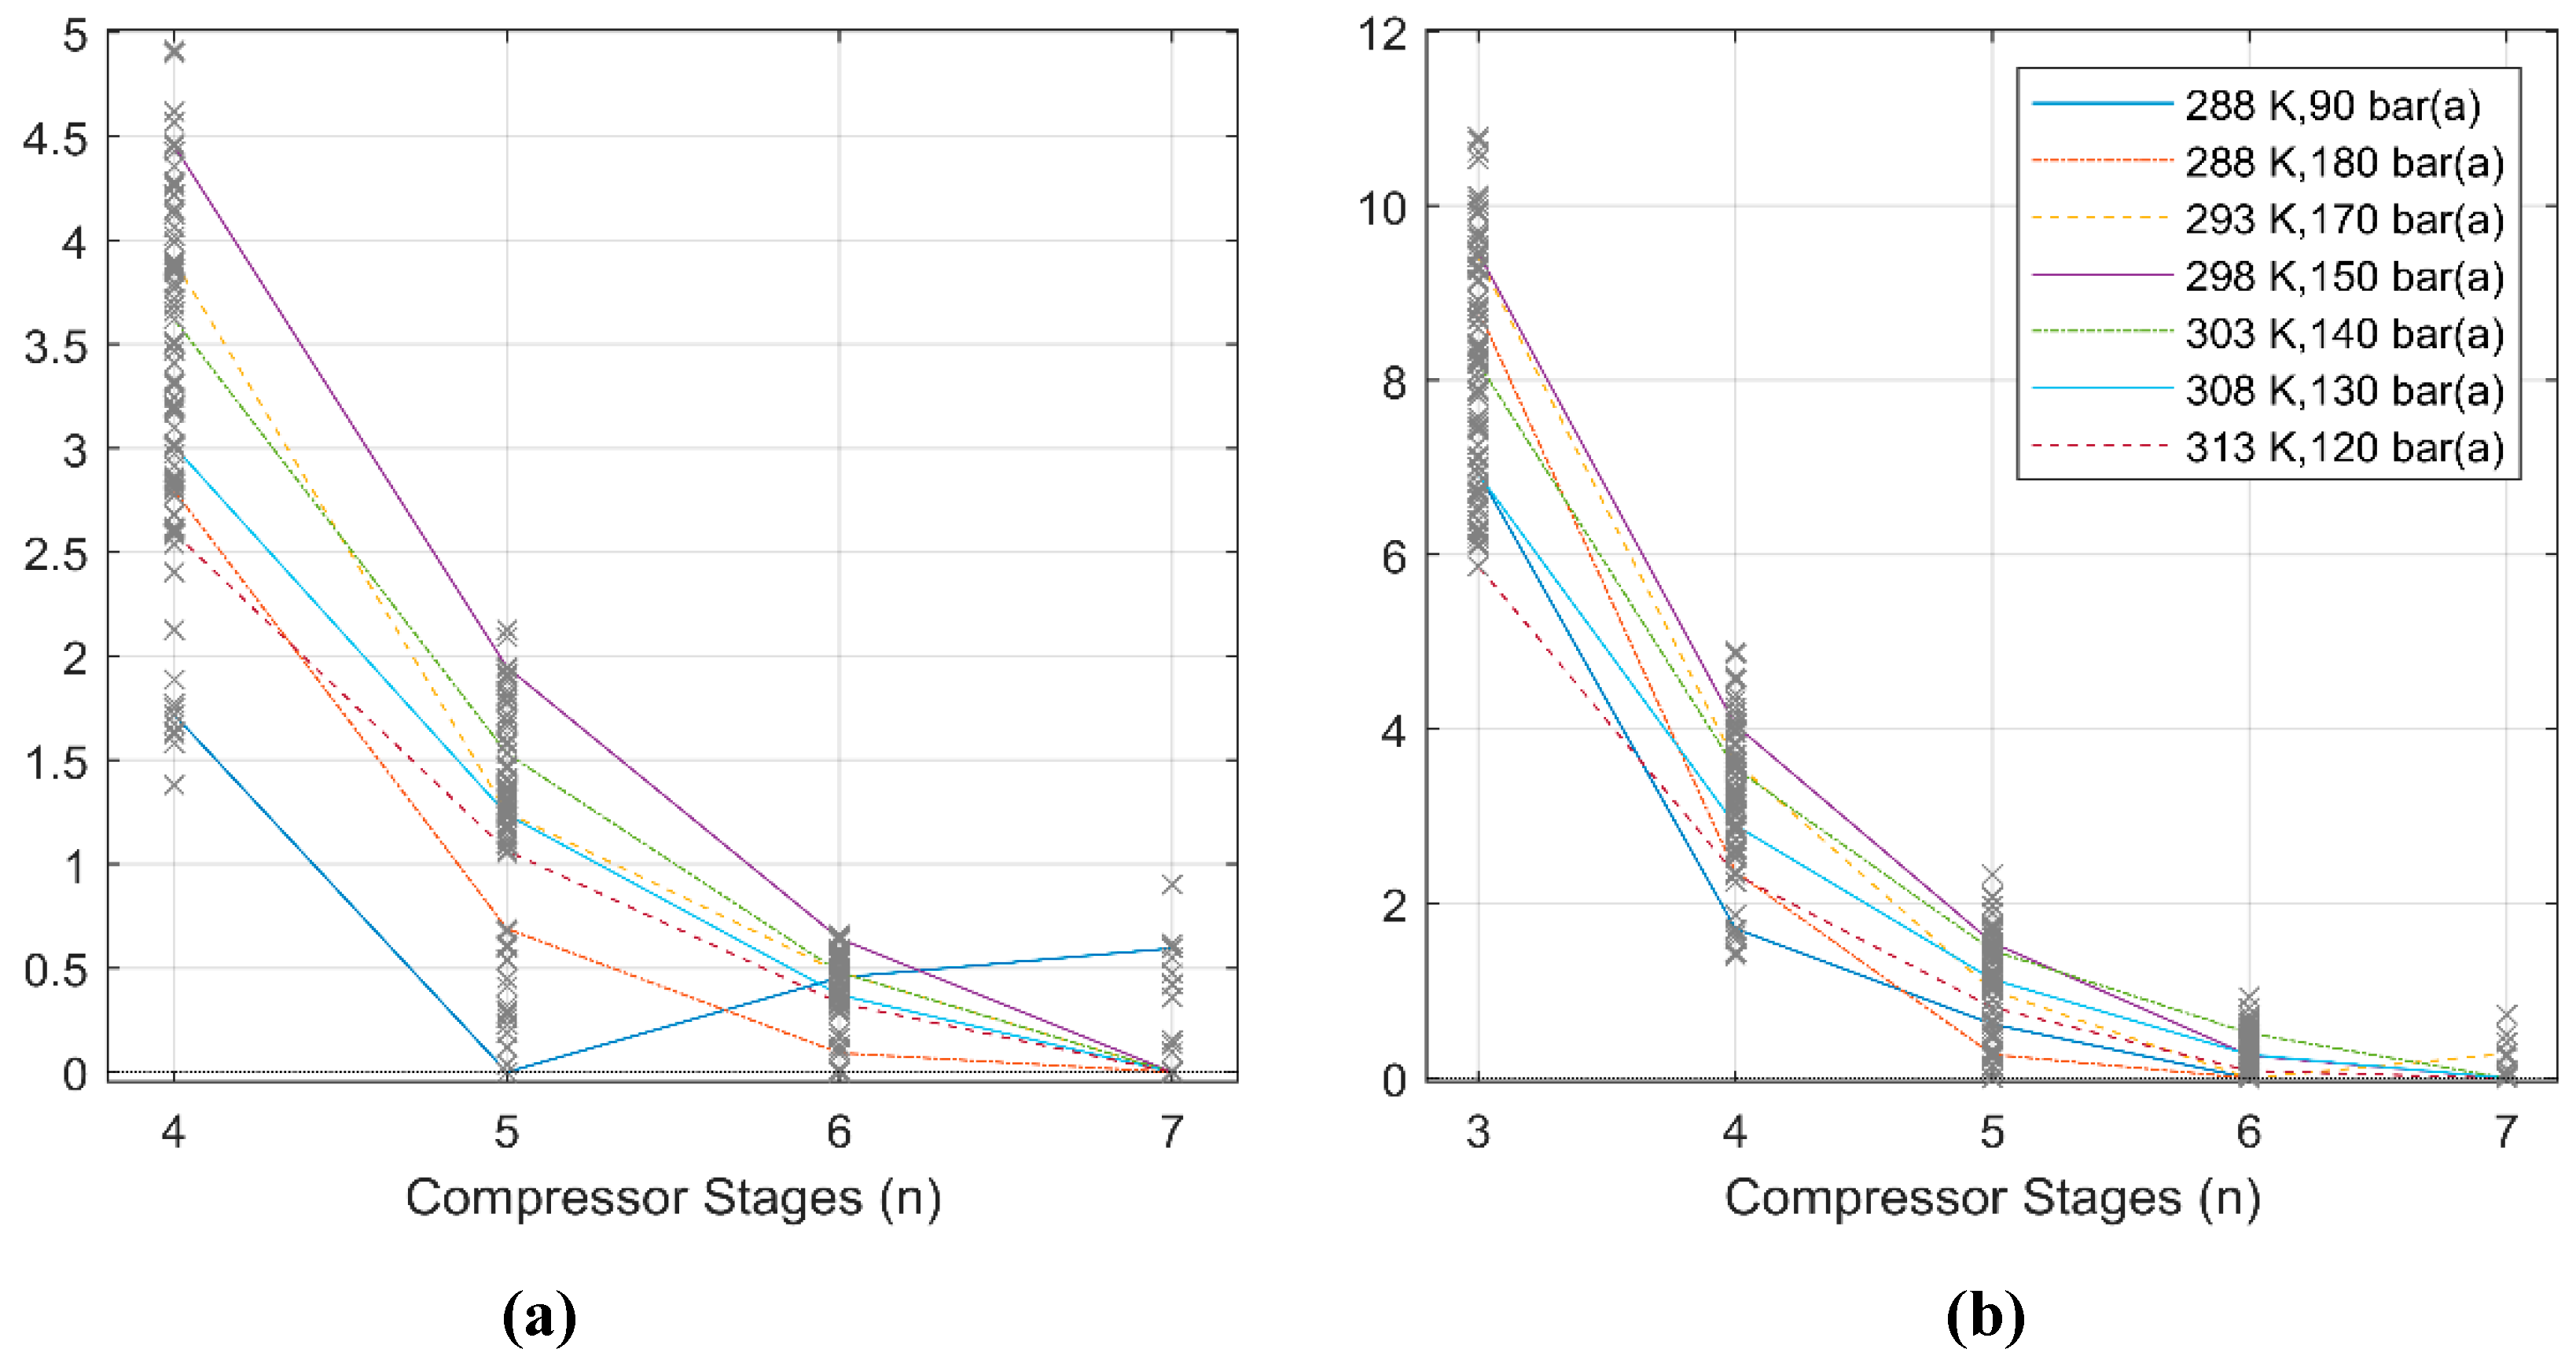
2.4. Identifying the Optimum Number of Compression Stages

Although the overall optimum number of compression stages is the one that corresponds with the minimum energy consumption, the percentage gain per additional compression stage is also important because of the additional costs implied. To acknowledge this, the overall optimum number of stages is defined in this study as the number of stages above which the percentage decrease in energy consumption falls below 2%. This is an arbitrary breakpoint based on a review of the optimization data.

3. Results and Discussion

The main results of the optimization work are presented below. In addition, links to the full set of data generated by this study are presented towards the end of this article under the heading Supplementary Materials.

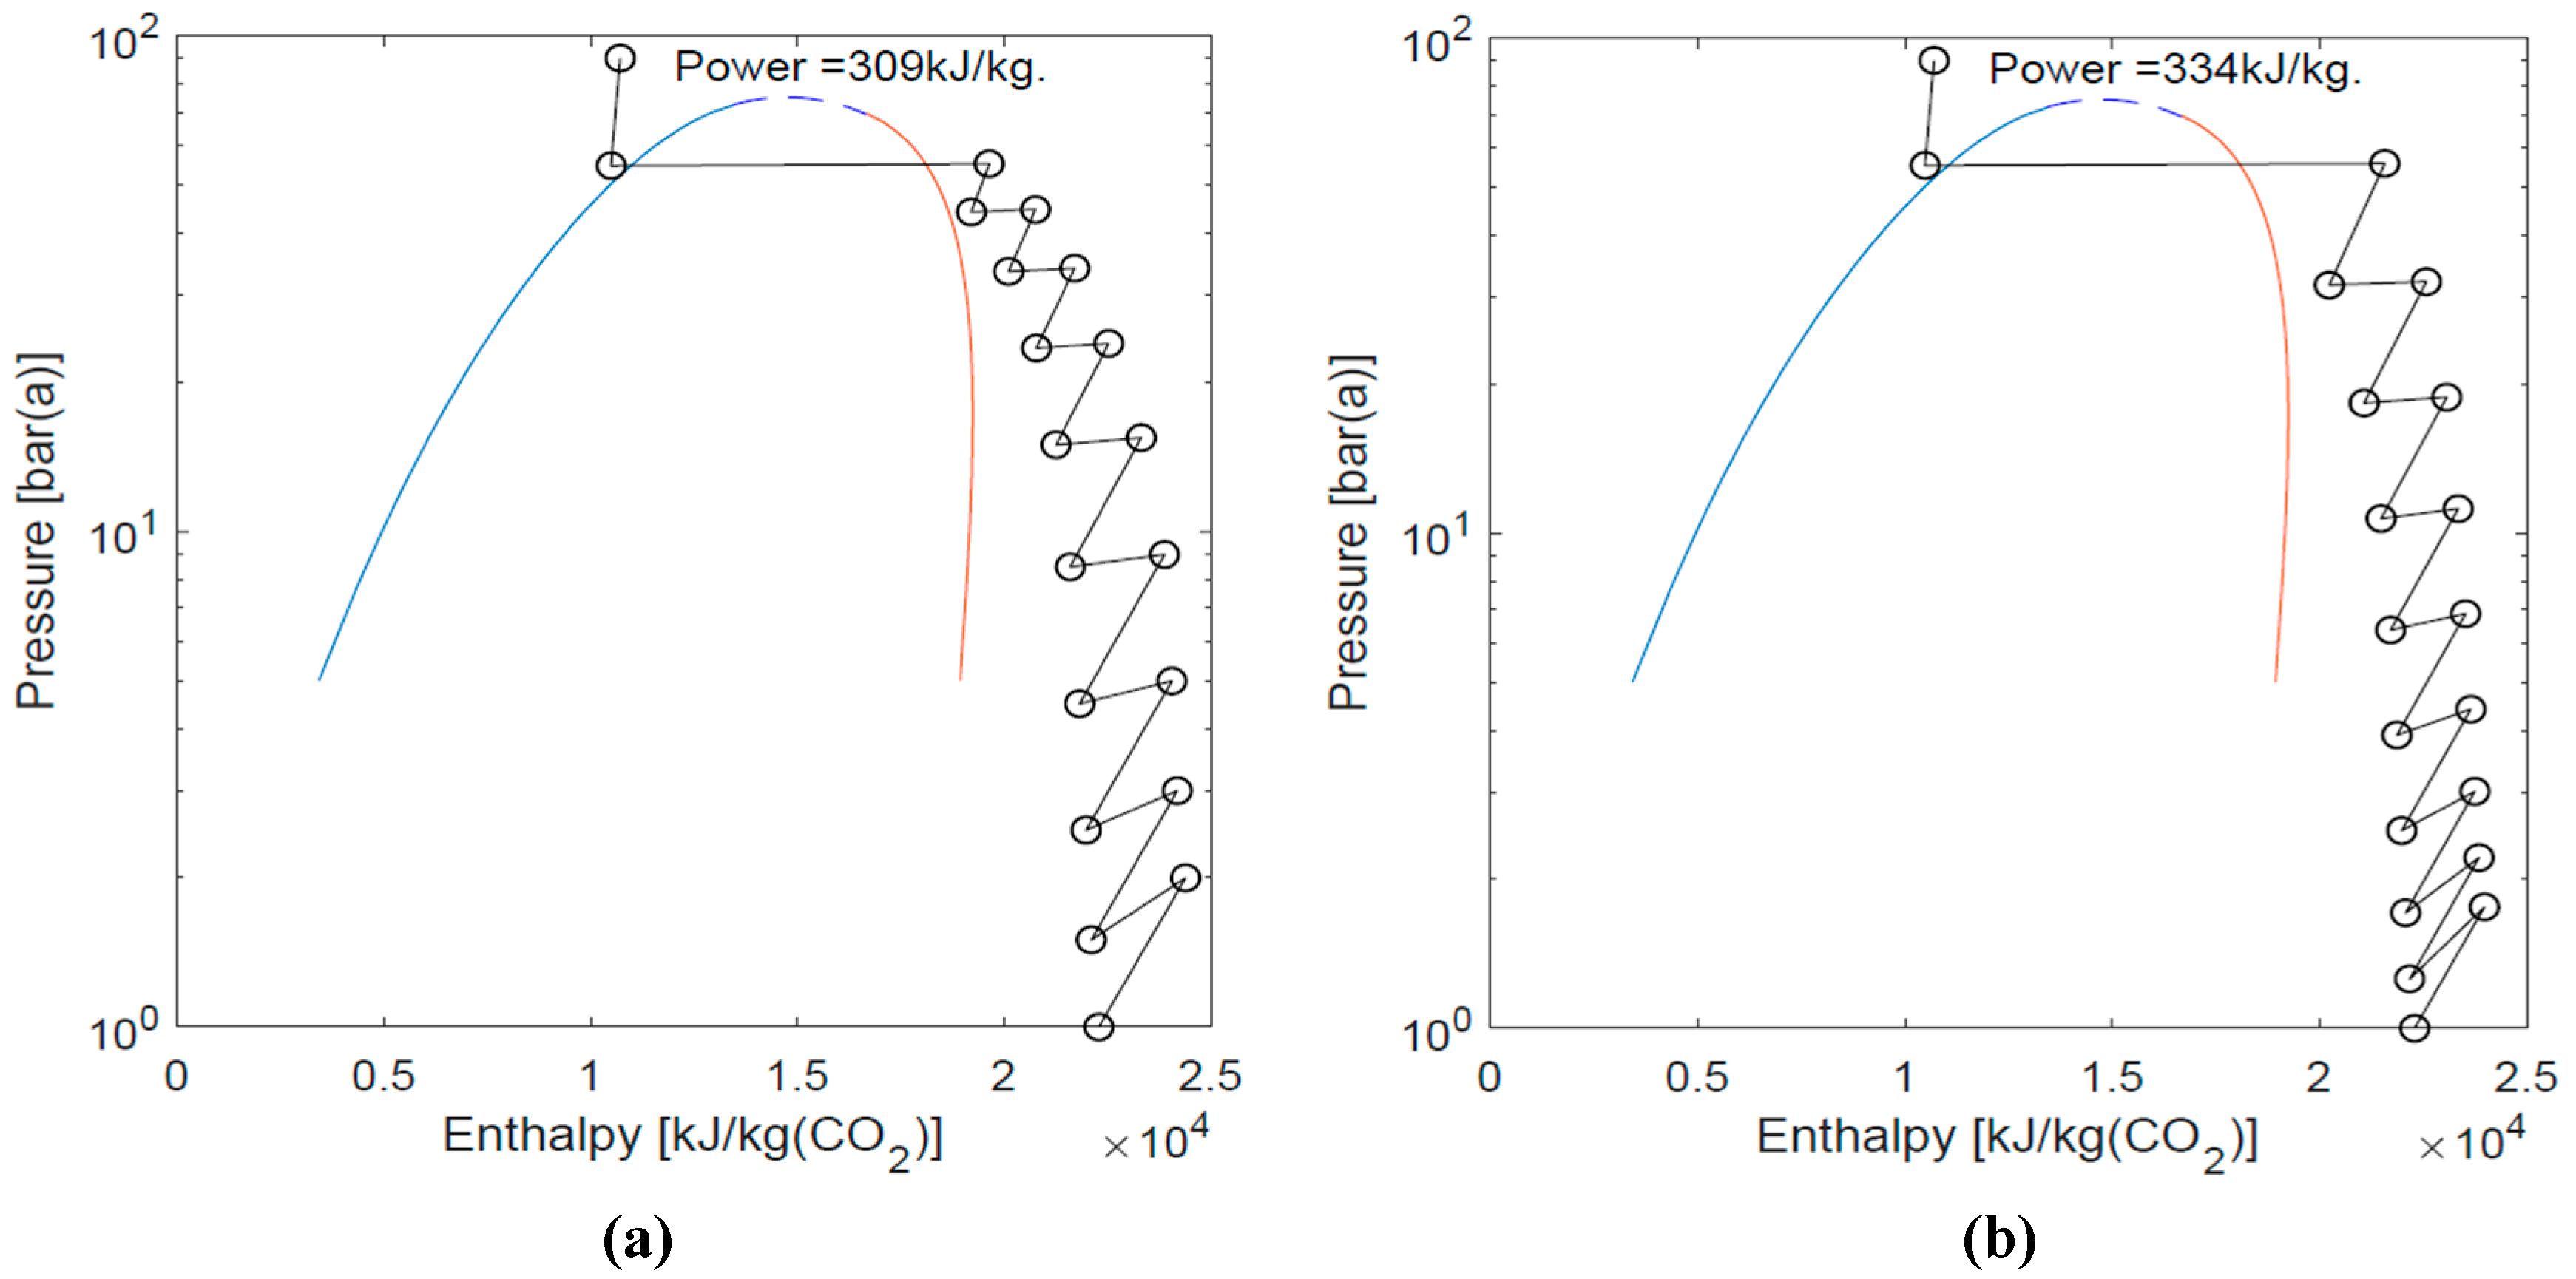
3.1. The Benefits of Optimization

The amount of energy that is saved through the optimization of stage pressure ratios will vary from cases to case. Figure 3 illustrates that the gain could be as much as 10% of the total compression energy consumption, although in some cases it was much less.

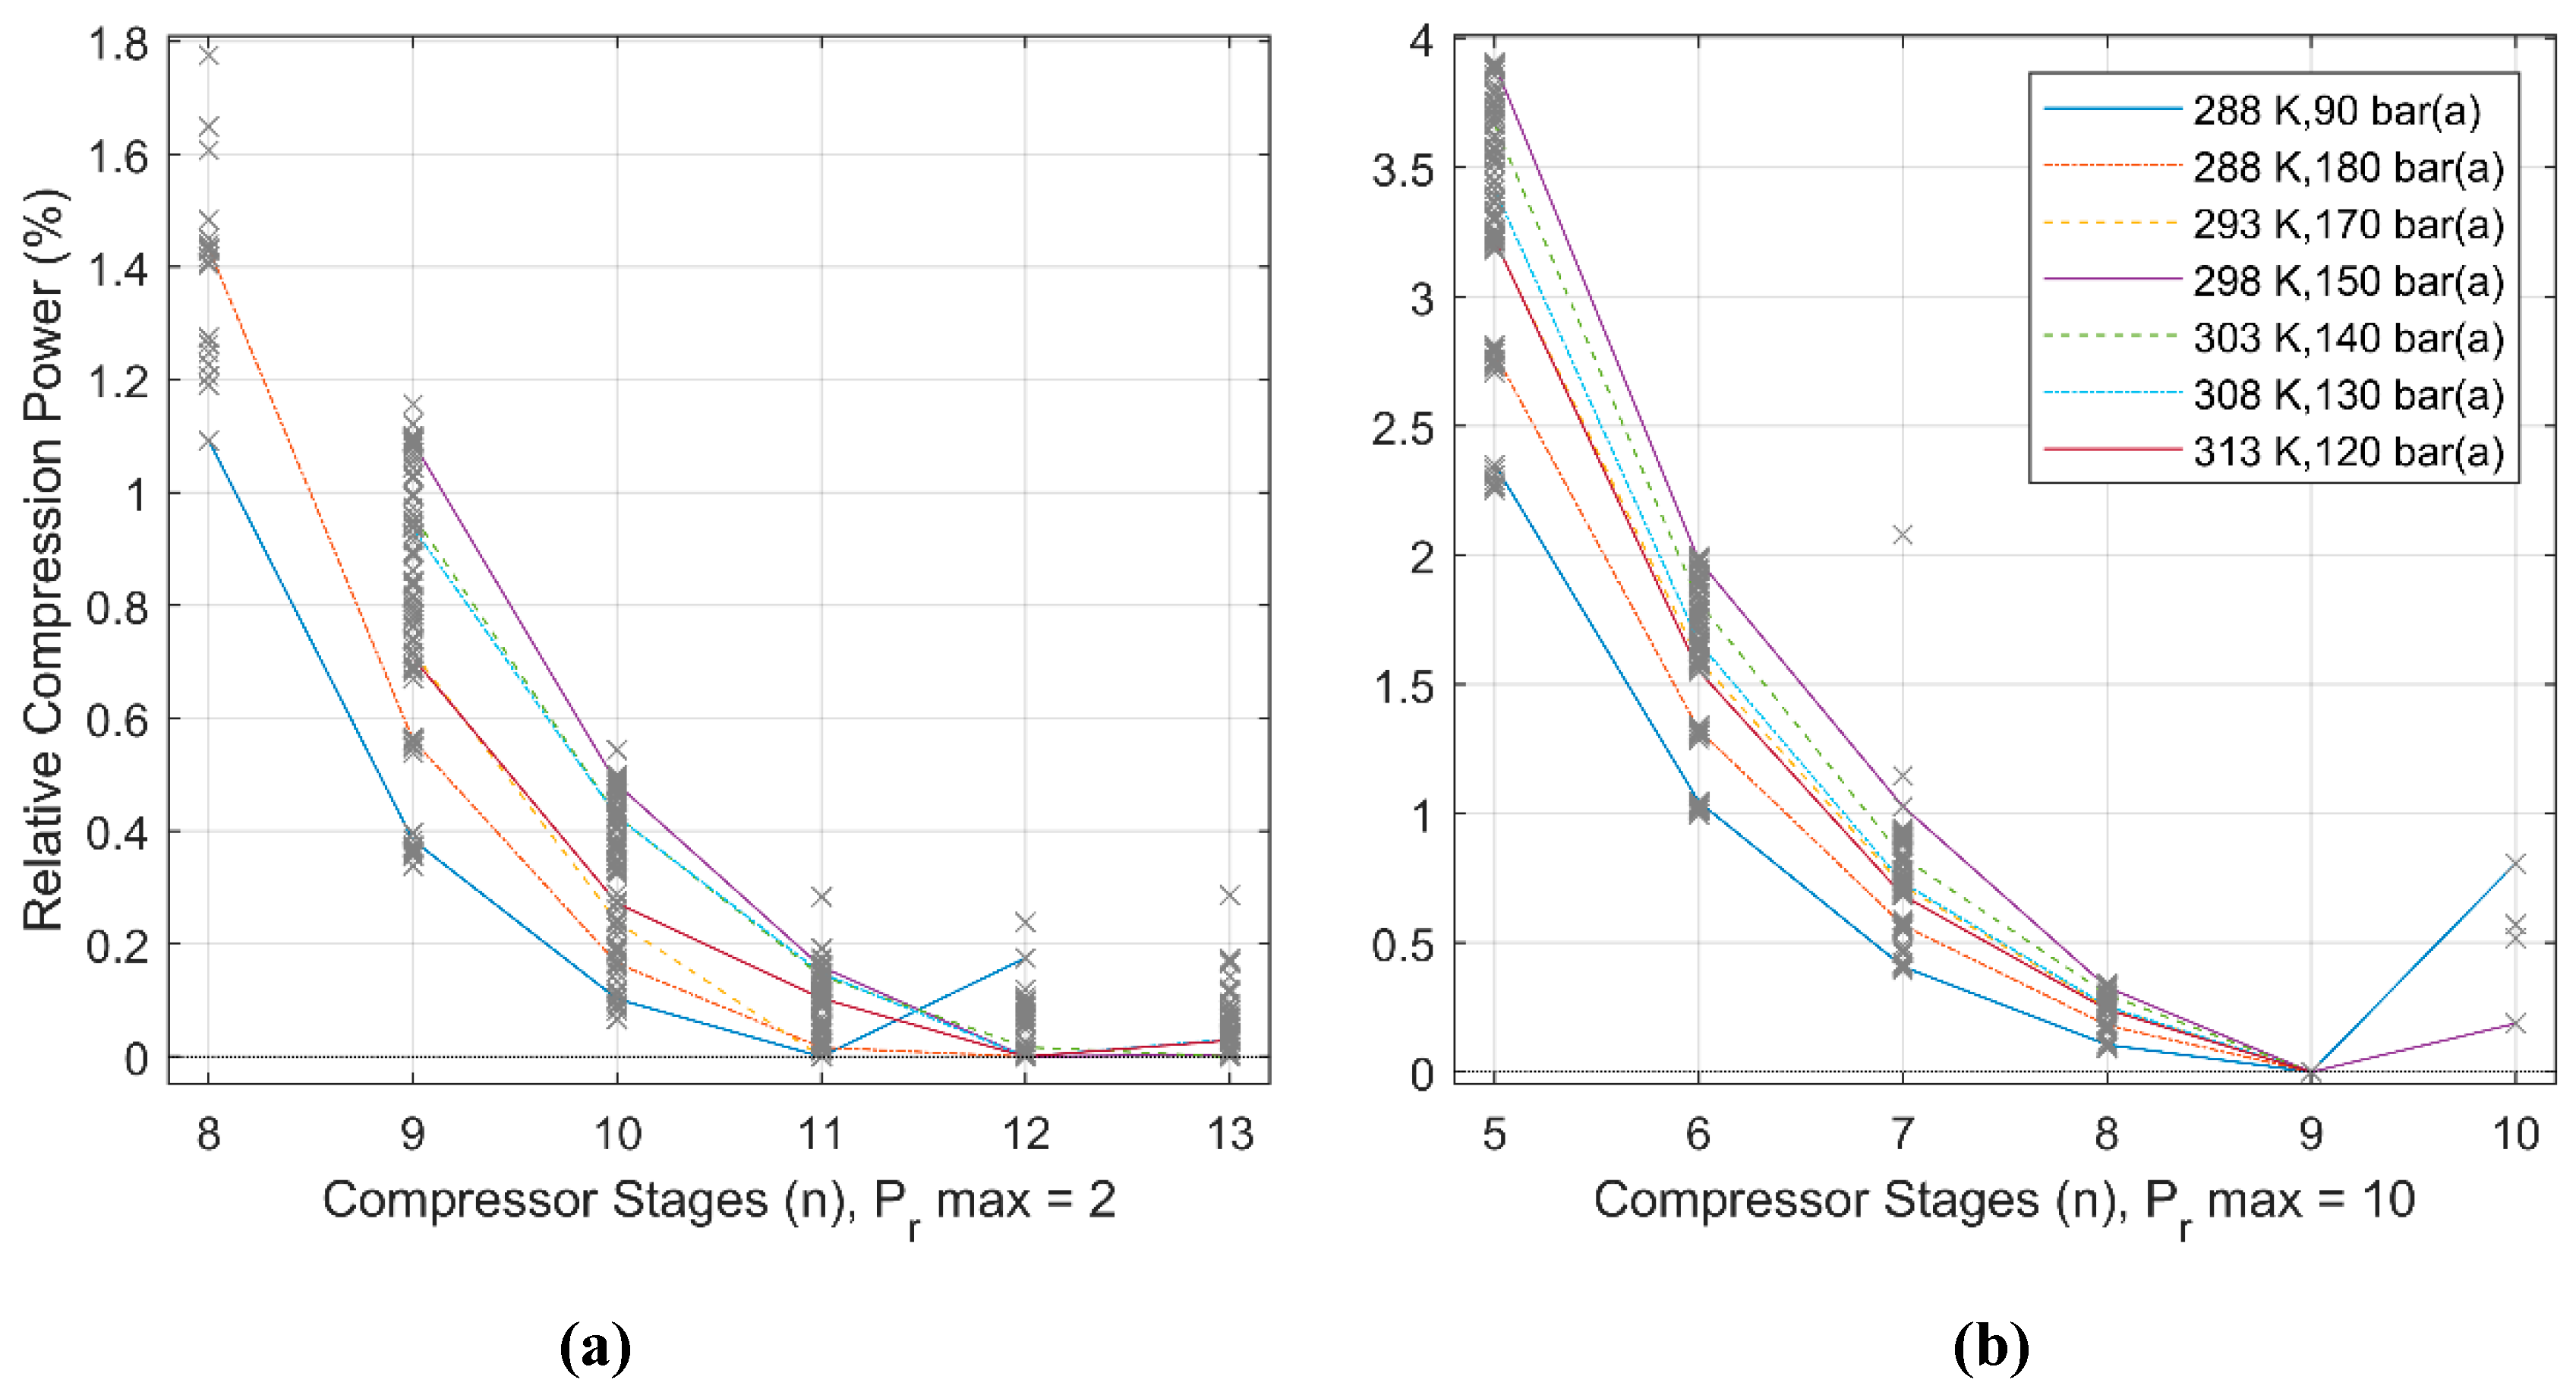
3.2. Consistency Checking and Optimum Stages

In Figure 4, the relative compression energy consumption vs. number of compression stages is plotted for all of the results from the post-combustion capture cases (grey crosses). Seven sets of data are highlighted to help illustrate trends. Data for the pre-combustion capture cases and the oxyfuel cases are presented in Figure 5 and Figure 6, respectively.
Figure 4, Figure 5, and Figure 6 show that the energy consumption of the compression process often varied by less than 1% for compressor designs either side of the optimum number of stages, because of this, the optimization must be of high quality to accurately identify the optimum number of stages.
In many cases the fminsearch and fmincon algorithms did not give the required level of accuracy to show these trends and all the data presented here was generated by the GA algorithm, albeit, in many cases, from guesses provided by the other algorithms.
Although the trends visible in Figure 4, Figure 5 and Figure 6 show a couple of examples of counter-intuitive behavior, overall they illustrated good consistency in the results of the study, indicating consistent and reliable level of optimization.

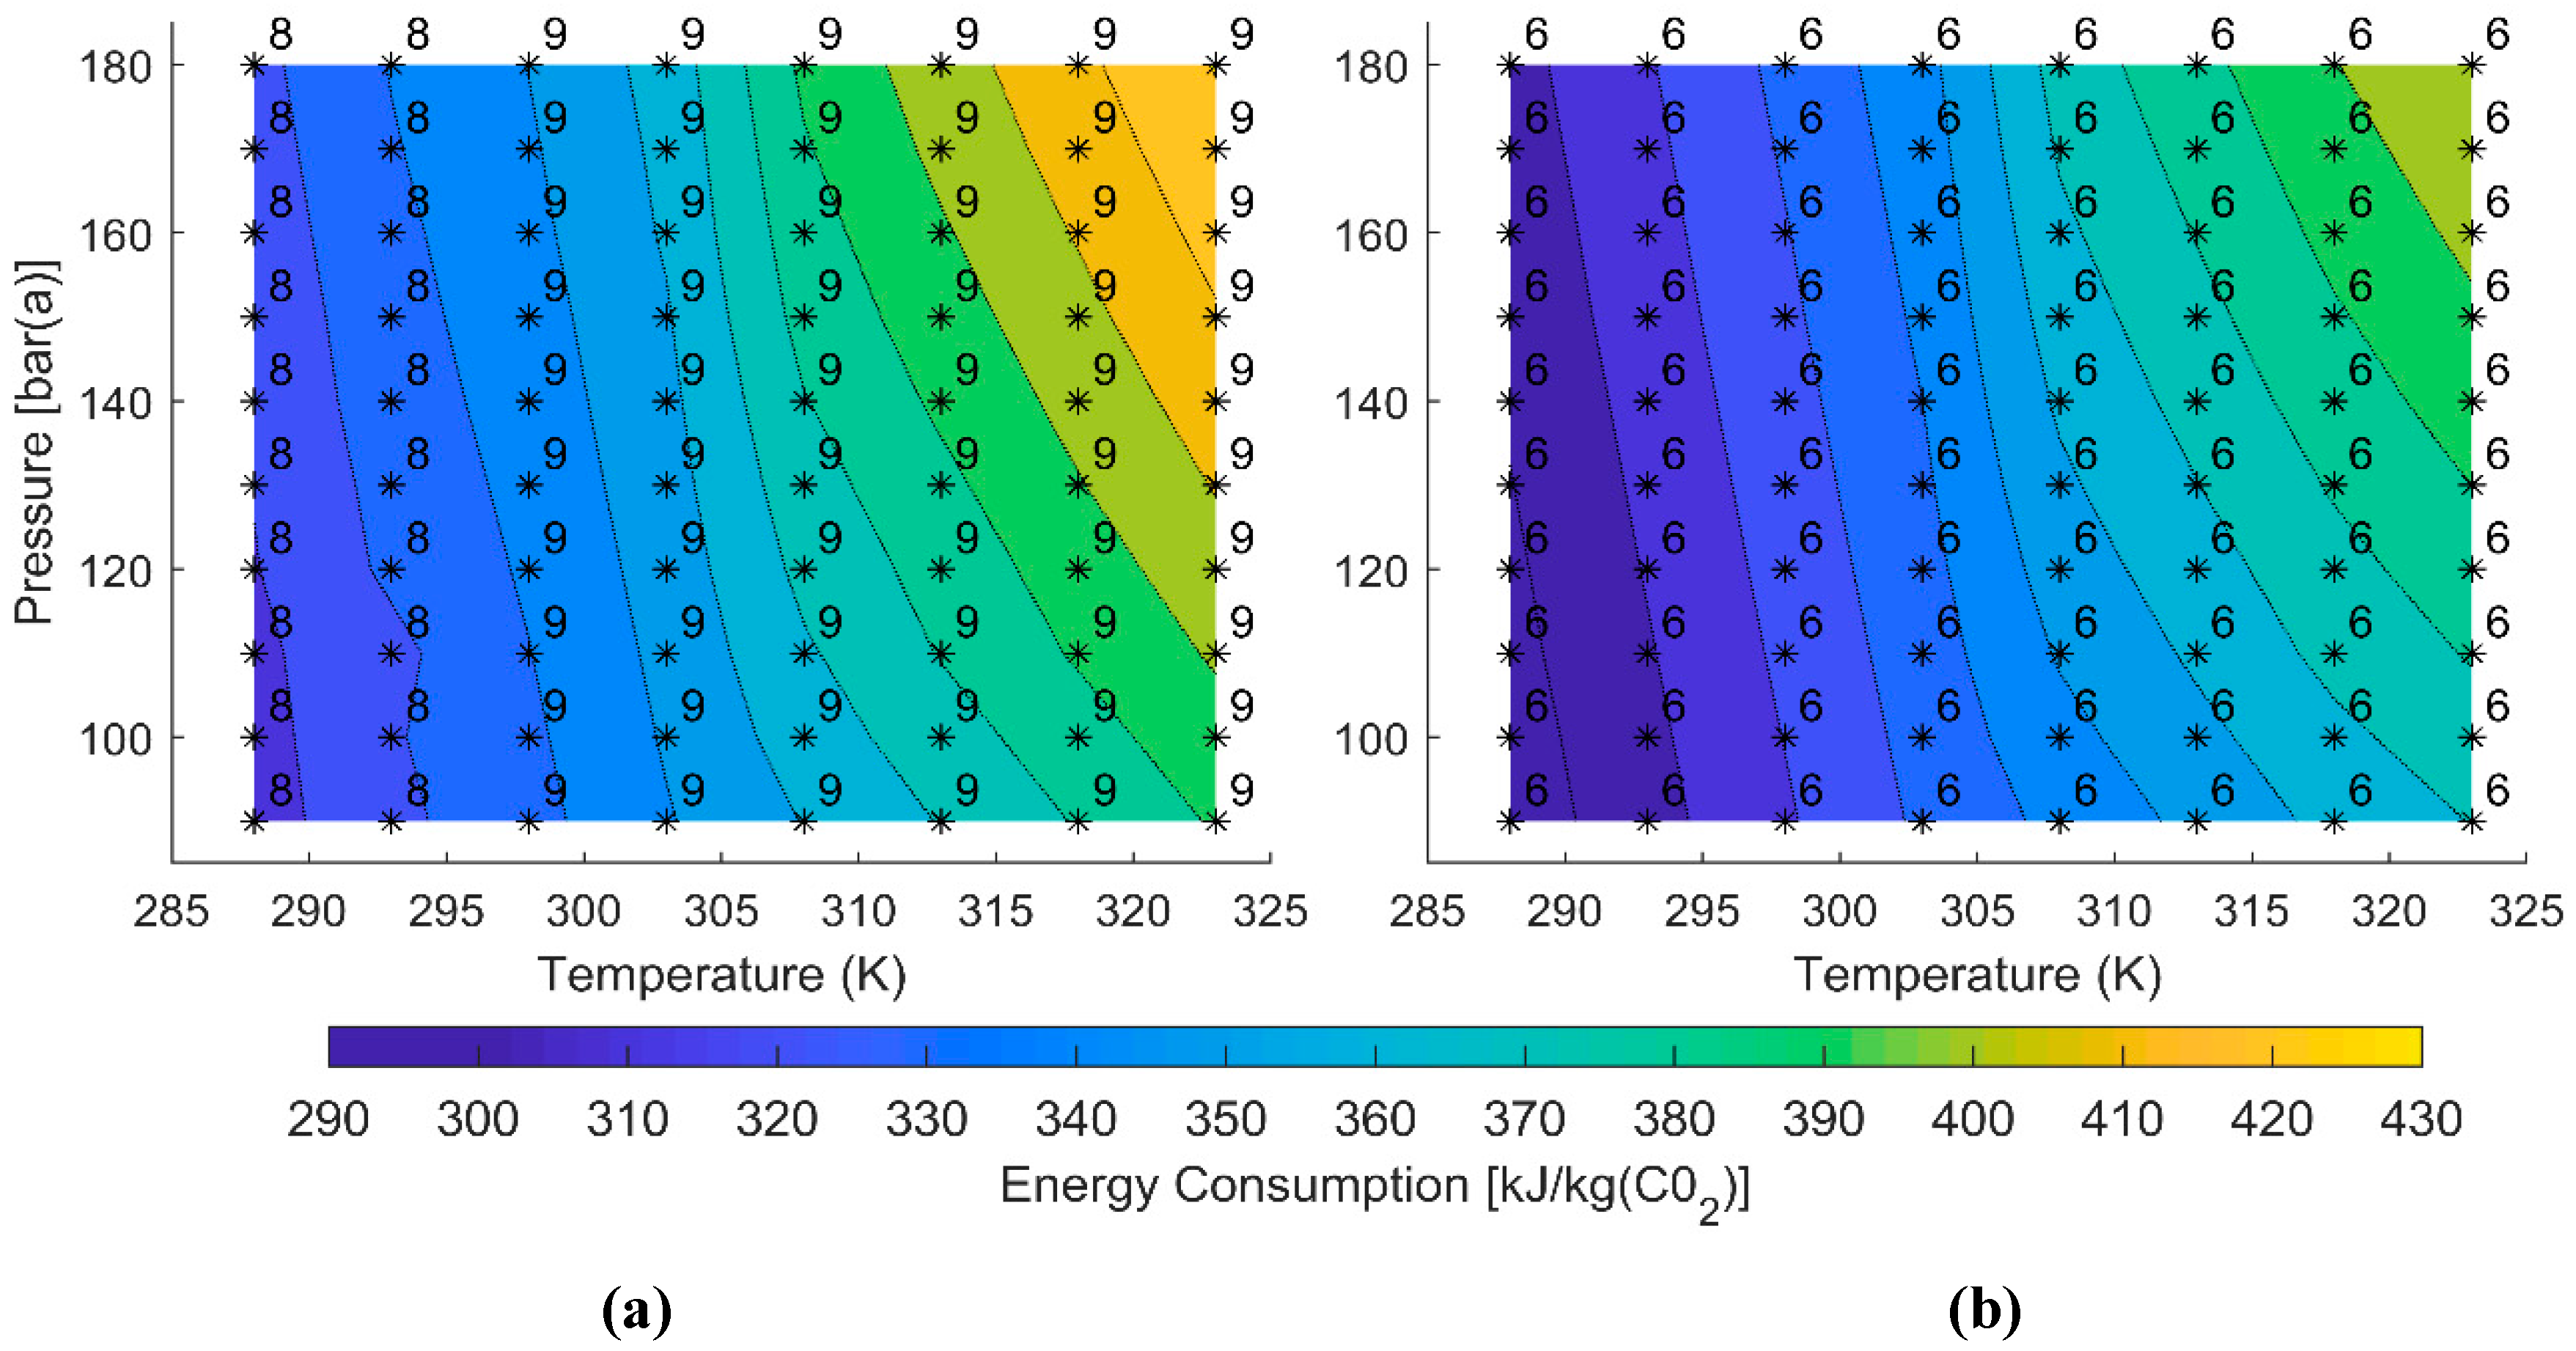
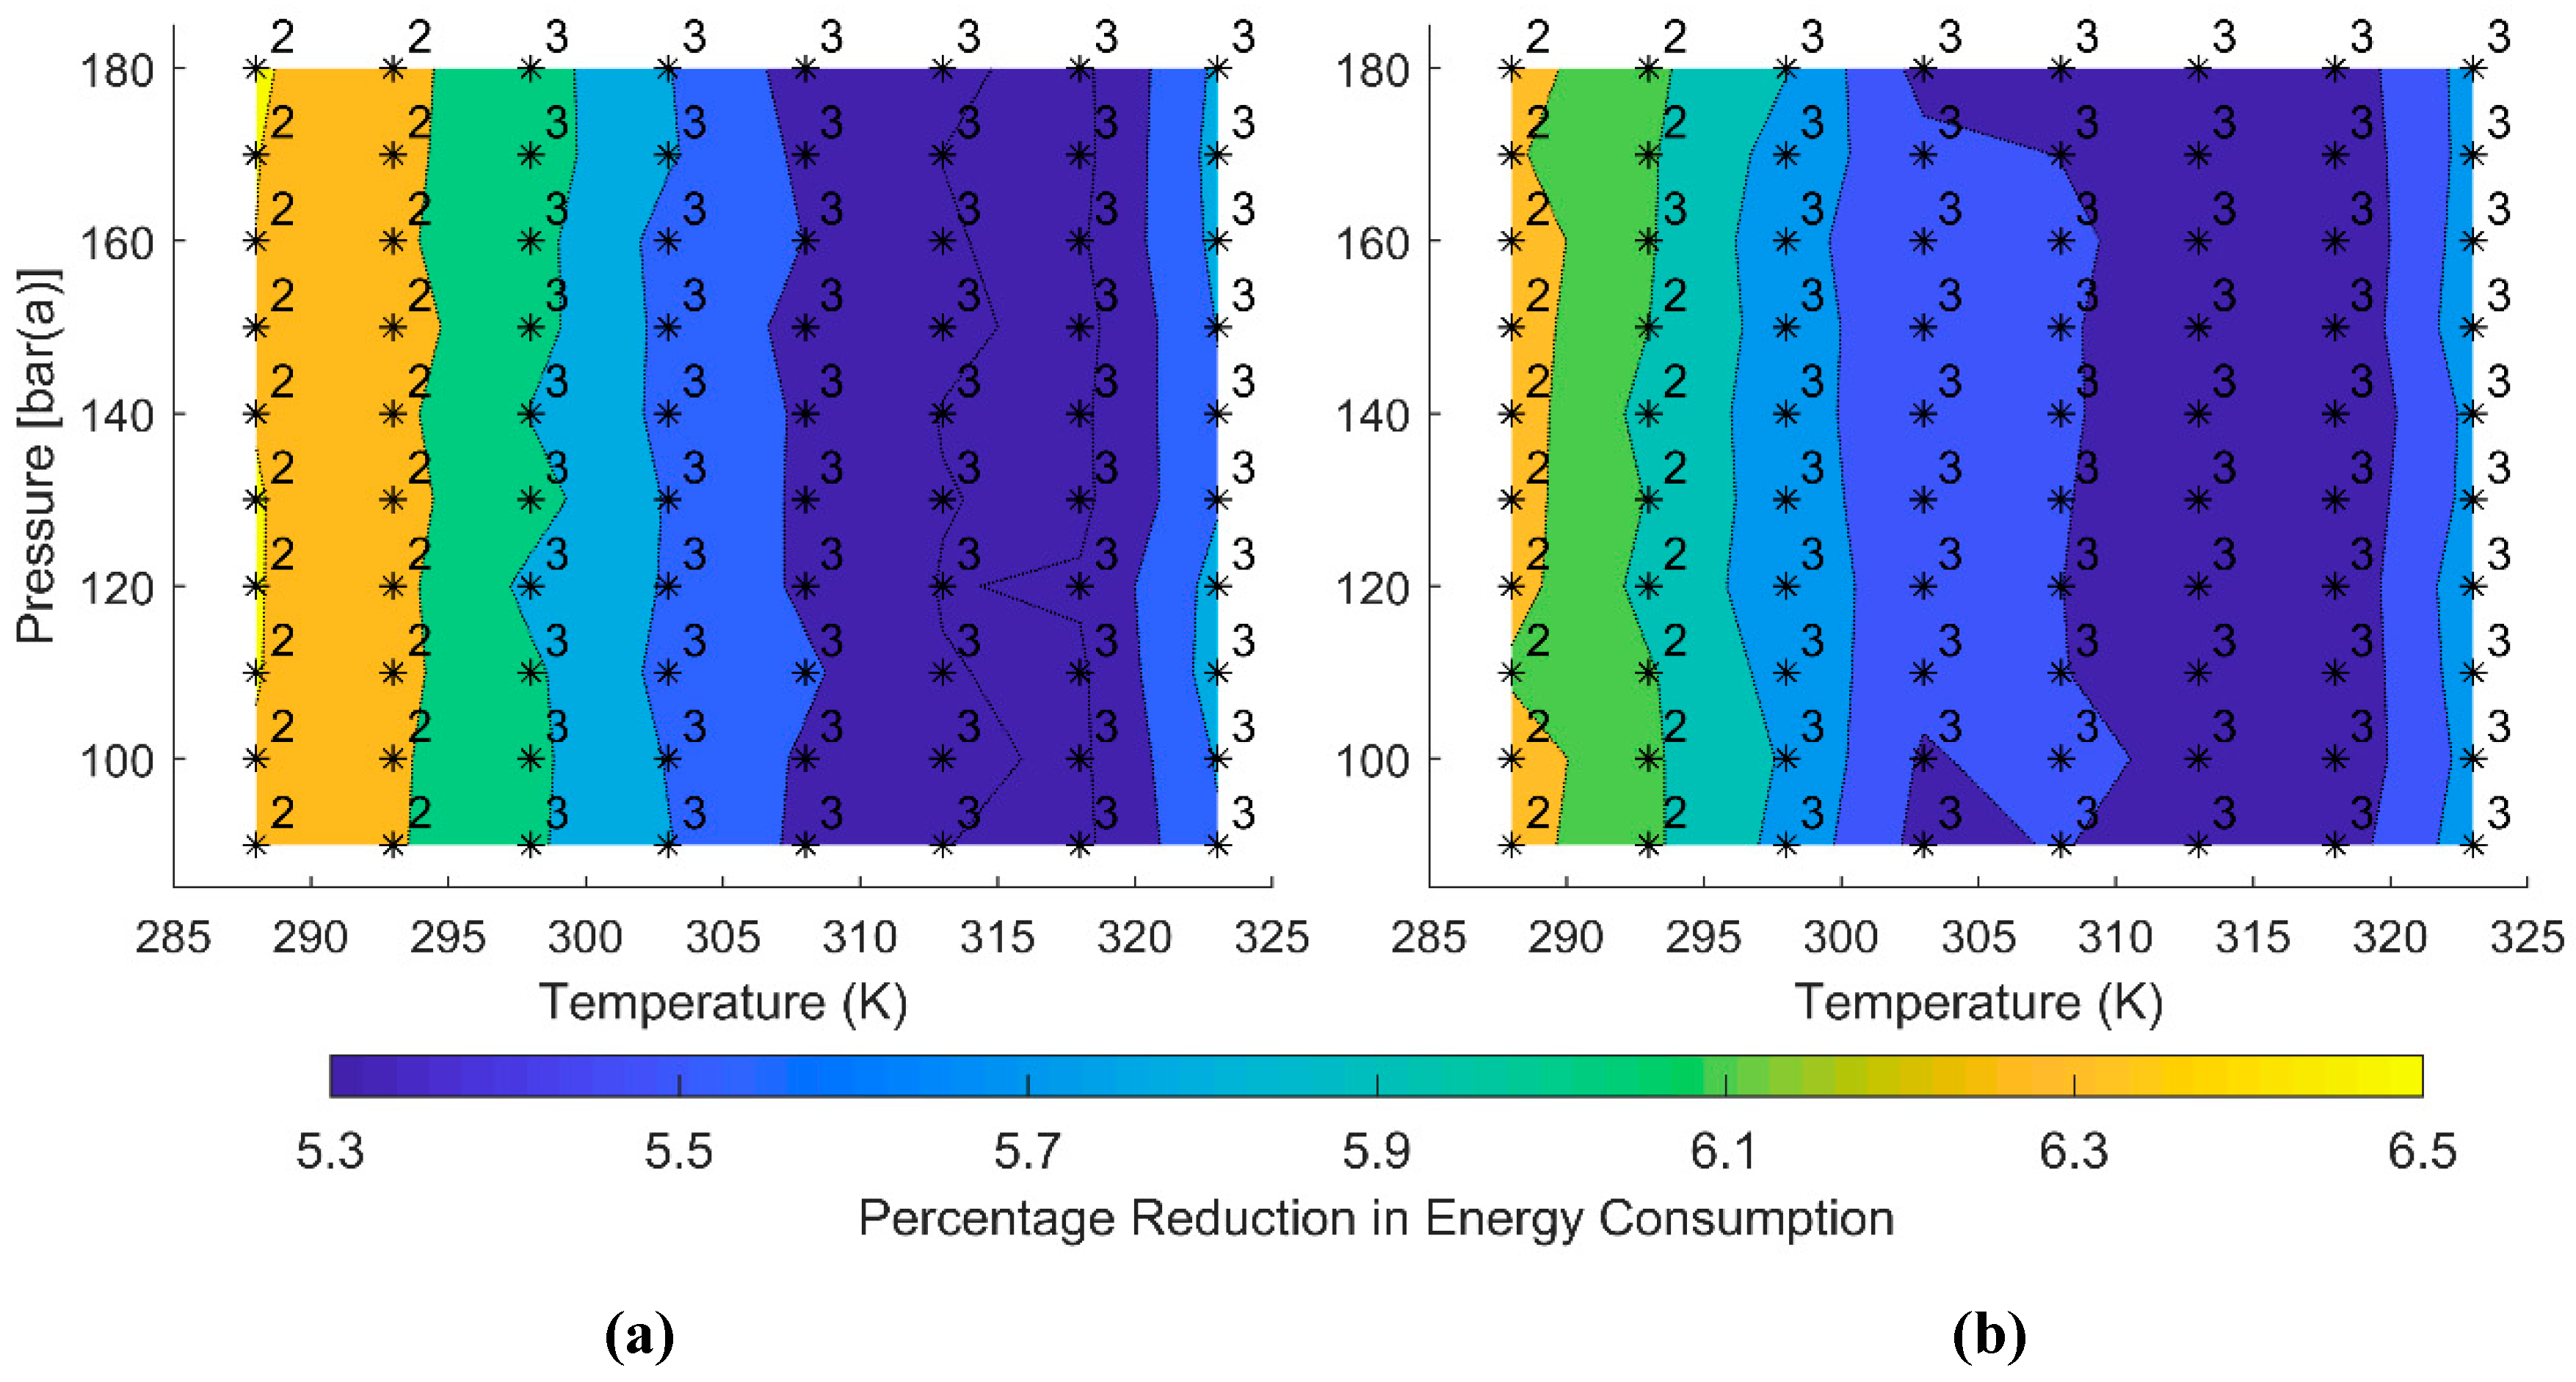
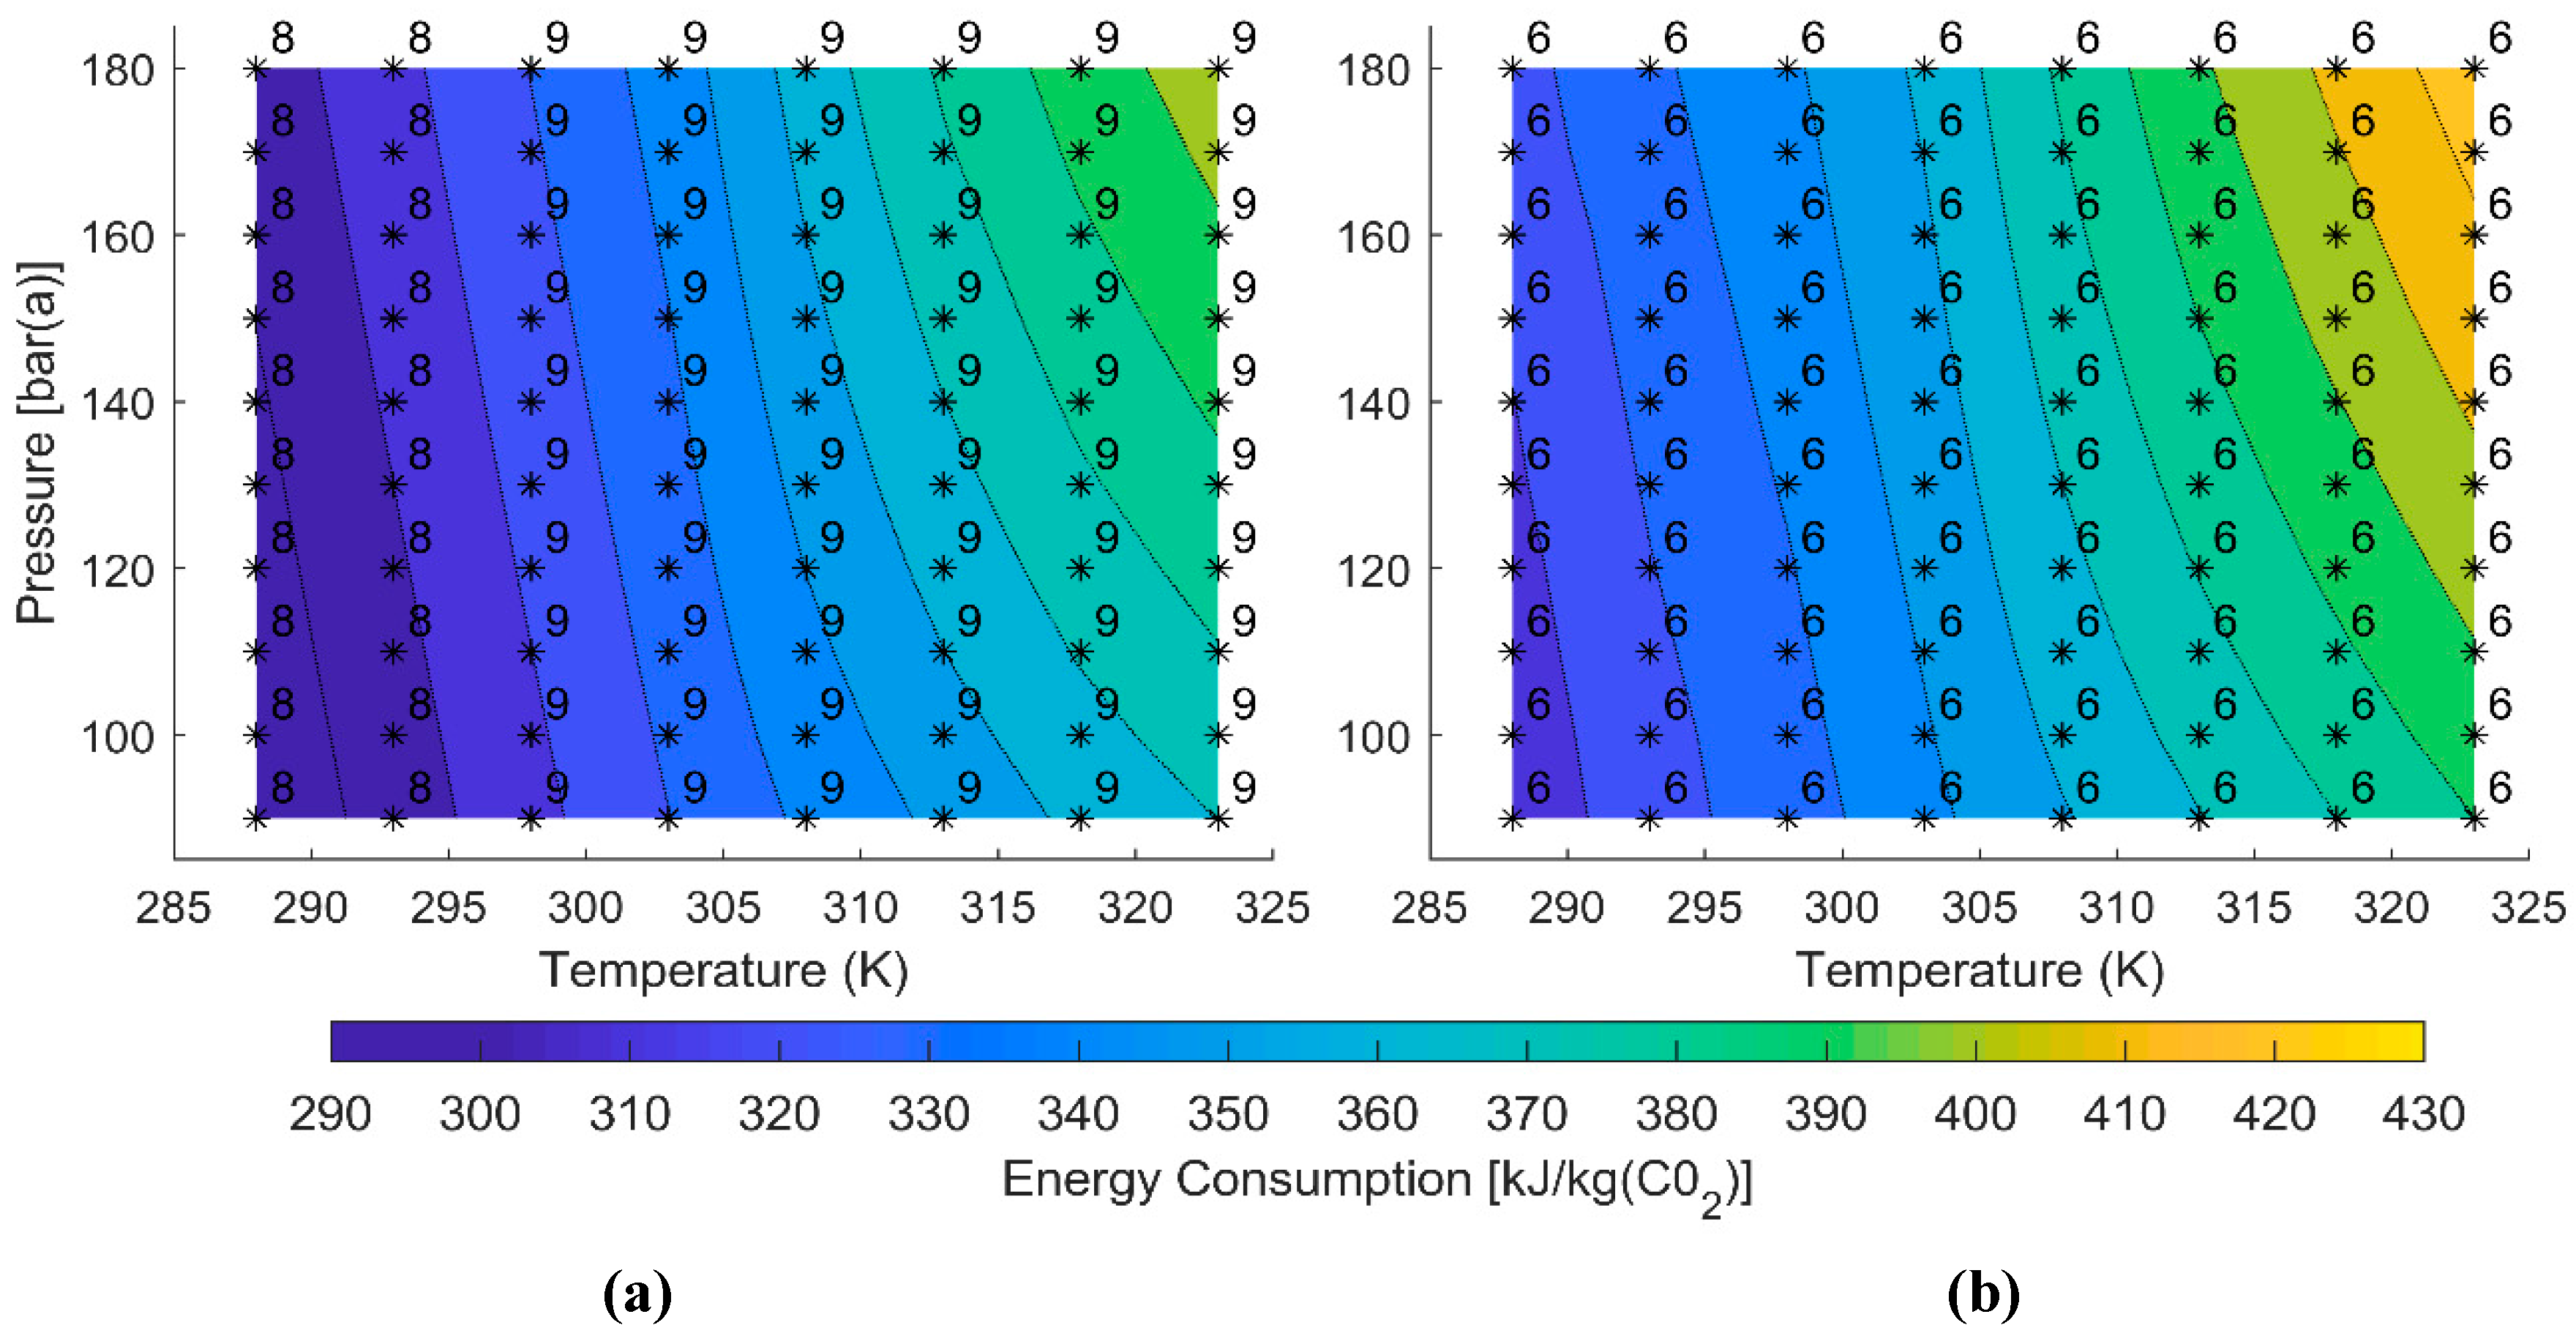
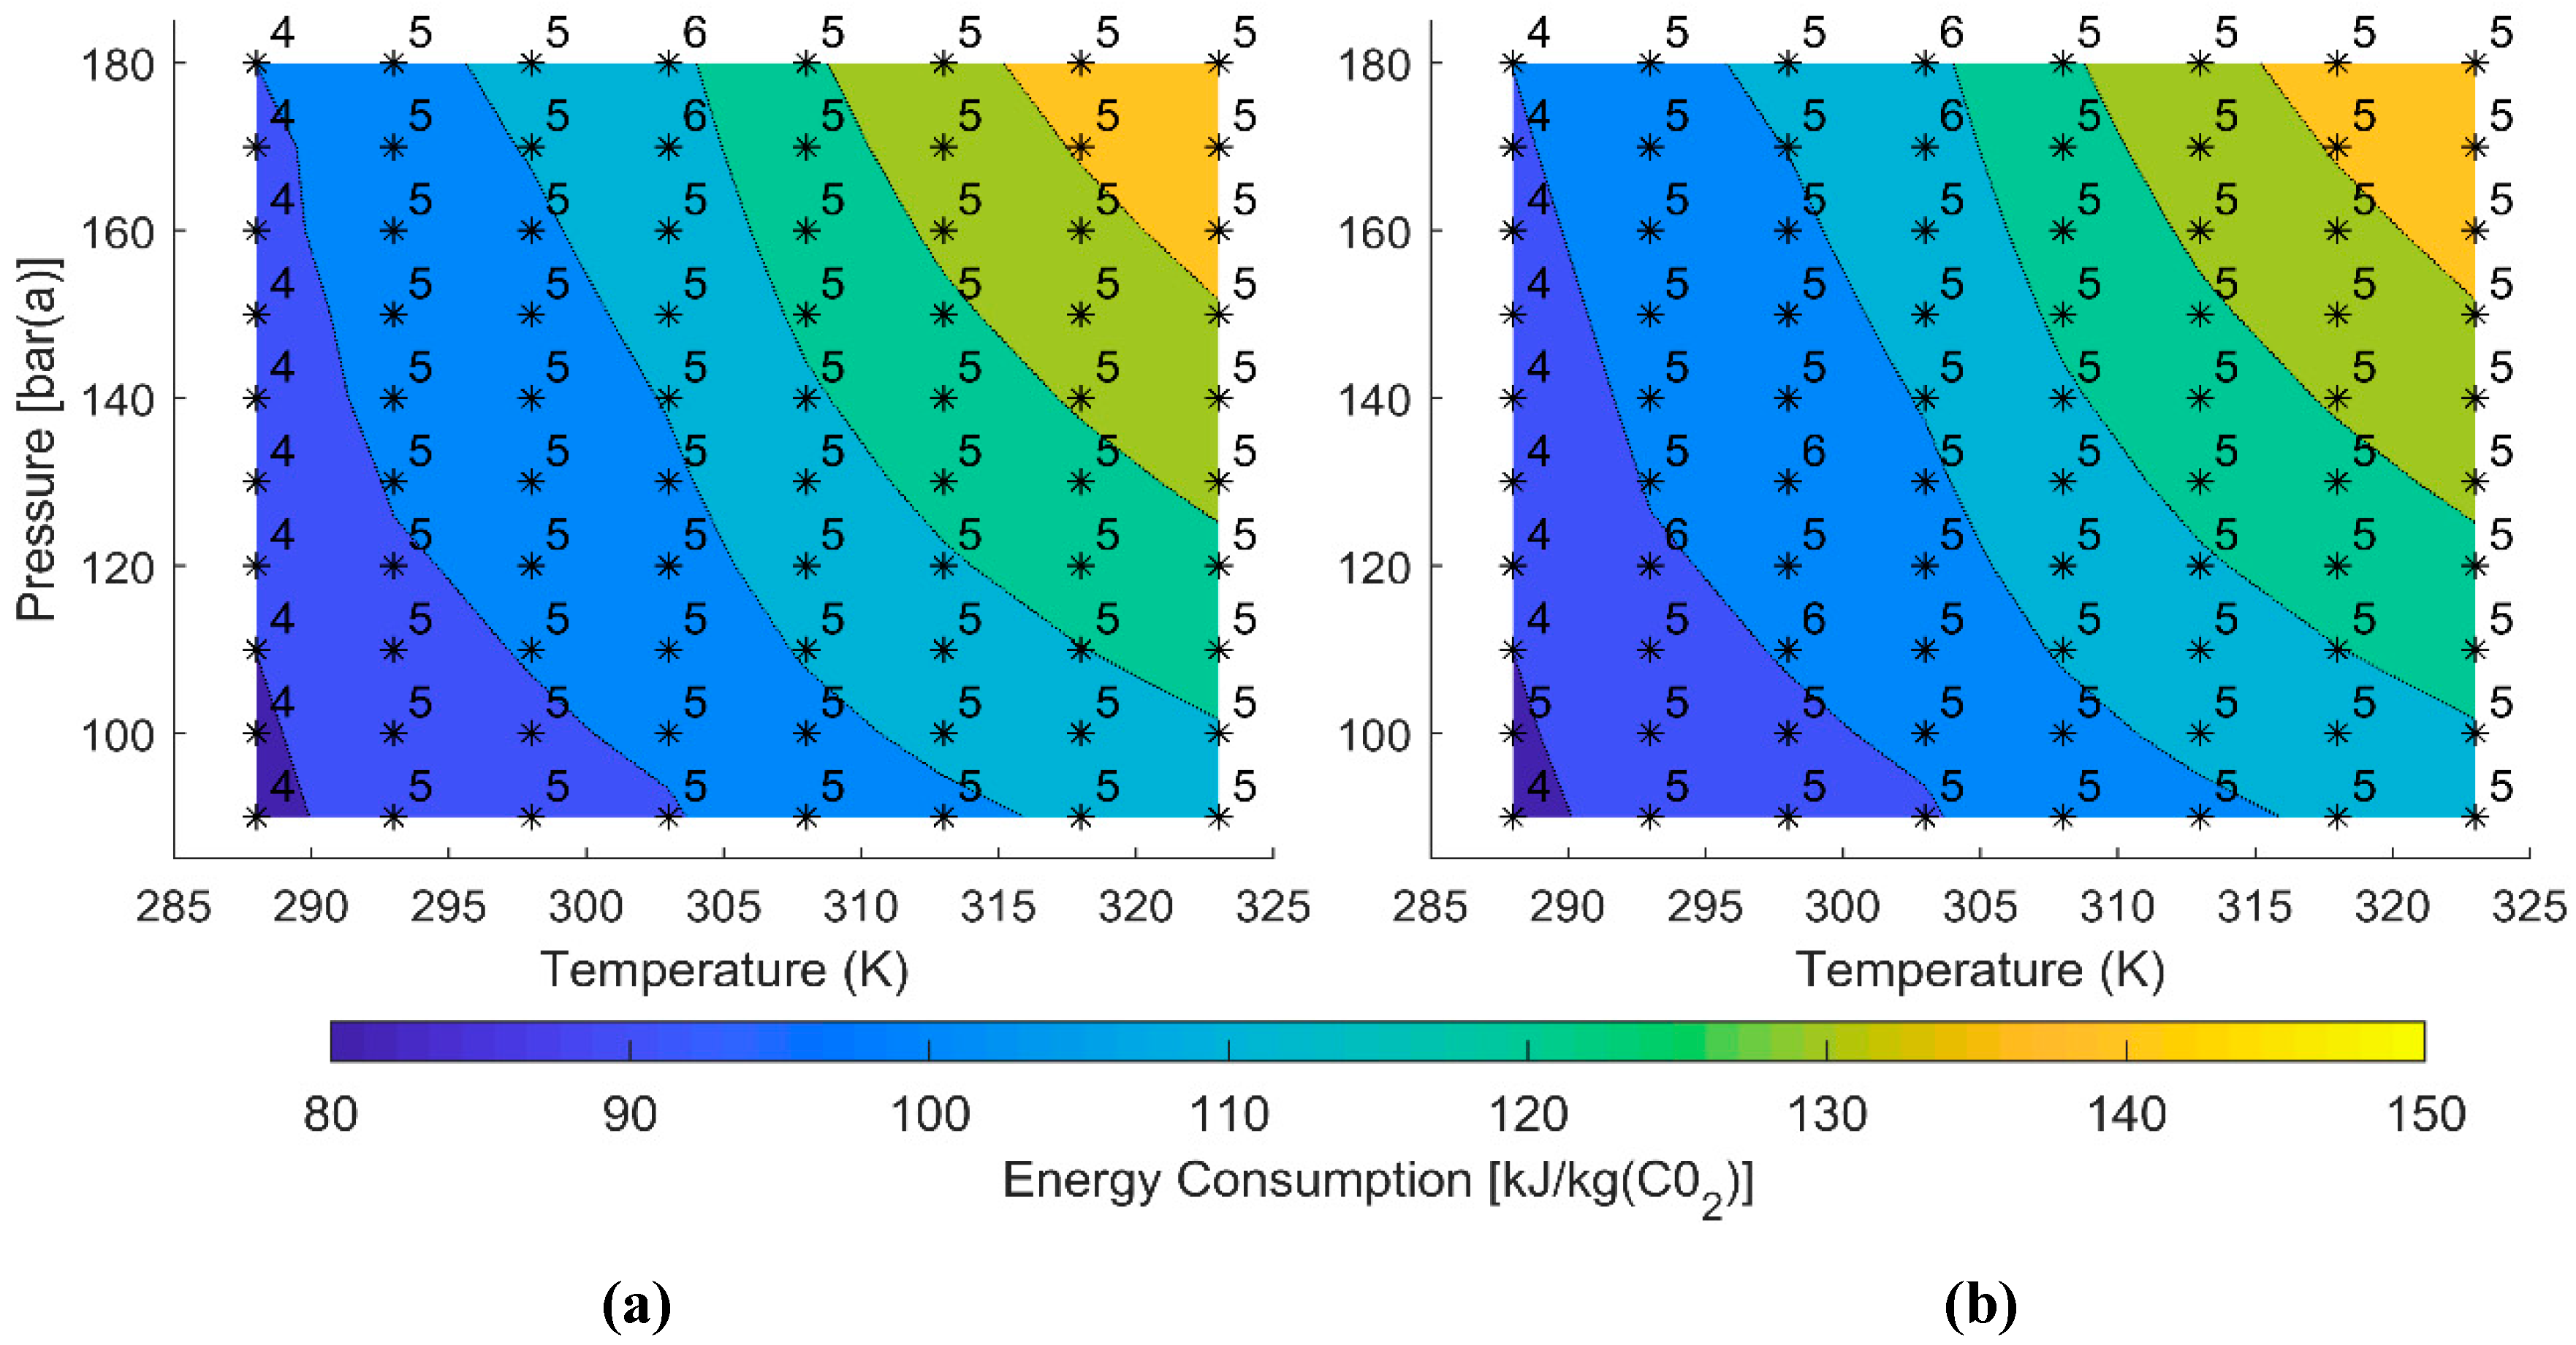
3.3. Variation of Energy Consumption with Cooling Temperature and Pressure

Figure 7, Figure 8, and Figure 9 show how compression energy consumption varied with cooling temperature and compressor discharge pressure for the three CO2 capture scenarios. The optimum number of compression stages was overlaid.
The results show that optimum energy consumption was more strongly dependent on the cooling temperature than discharge pressure. This reflects the fact that the energy consumption for the final, pumped, stage was lower than the other compressor stages. The results also show that there was little difference between the energy consumption for the post and pre-combustion cases, which was because the composition of these two streams was very similar.

3.4. Constrained vs. Unconstrained Cases

Figure 10 presents results for the percentage reduction in energy consumption for the unconstrained cases relative to the constrained cases, Figure 10a shows this for post-combustion cases and 10b for pre-combustion cases. The corresponding reduction in the number of compression stages required was overlaid. The oxyfuel cases were not shown here because the percentage reduction was close to zero in all cases.
The results in Figure 10 show that in all cases considered the unconstrained cases (those representing a design with multiple impellers per stage) had an optimum number of stages that was 2 to 3 fewer than the constrained cases (those assuming one impeller per stage). This represents a potentially significant saving in compressor cost. In addition, the unconstrained cases offered an average 6% saving in the energy required for compression.

4. Discussion

Table 3 summarizes the results from Figure 7, Figure 8, and Figure 9 for all constrained (const.) and unconstrained (u.const.) cases. In Table 3 we see that the energy consumption for the post combustion CO2 compression cases varies in the range 292 kJ/kg CO2 to 425 kJ/kg CO2. This compares well with the range of 80–120 kWhe/tCO2 (equal to 288–432 kJ/kgCO2) reported by Jordal et al. [2].
Comparing some more specific cases from the literature, we see that for a post combustion case with 110 bar(a) discharge and 30 °C cooling, Amorllahi et al. [18] reported an energy consumption of 330 kJ/kg, which is practically identical to the value found in this study as presented in Figure 7a. Alhajaj et al. [22] reported the energy consumption for a 5 stage CO2 compressor with a 14 MPa discharge pressure and 50 °C cooling (representing warm climates) to be 104.6 kWh per ton of CO2 (= 380 kJ/kg of CO2), which compares well with 390 kJ/kg of CO2 found in this study, Figure 7a. Alhajaj et al. [22] also reported an energy consumption of 82.4 kWh/ton of CO2 (= 297 kJ/kg of CO2) for the same compressor with a 20 °C cooling temperature (representing colder climates), which also compares well with 311 kJ/kg of CO2 found in this study from Figure 7a.
For the constrained post and pre-combustion cases the practical minimum number of stages varies between eight and nine depending on T o . When T o   293 K it is possible to reach a pressure where the CO2 stream will condense in seven stages and, hence, the overall minimum stages is eight. When T o > 293 K, nine stages are required. Since the energy consumption for the eight and nine stage cases also falls within 2% of the overall minimum, as illustrated in Figure 4a and Figure 5a, they also satisfy the criteria for the optimum number of compression stages used in this study. This means that the optimum number of stages presented in Figure 7a and Figure 8a is dictated by the practical minimum number of stages for these cases.
For the unconstrained post and pre-combustion cases, Figure 4b and Figure 5b show that the six stage cases all fall just within the 2% limit and therefore represent the optimum number of stages for this study presented in Figure 7b and Figure 8b.
For the oxyfuel cases, the picture is less clear and Figure 6 shows that either four or five stages represent the optimum based on the definition used here. Figure 8 also shows the quality of the optimization is slightly less consistent for these cases, which is reflected in Figure 9. Figure 9 also shows that there is very little difference between the energy consumption for the constrained and unconstrained cases. This reflects the lost benefit that the use of pressure ratios greater than 2 provides to the unconstrained pre and post-combustion cases in the early stages of the compression process.

5. Conclusions

The comparison of the results from this study with other published data indicates that the energy consumptions predicted are reliable and can support the development of a system model capable of comparing energy consumption of a wide variety of CCS scenarios, which was the aim of this work.
In all cases studied here, the cooling temperature has a more substantial impact on optimum energy consumption than the compressor discharge pressure, because of this, it is concluded that the comparison of different CCS schemes and operating scenarios should consider the important role ambient temperature plays in determining the energy consumption.
This study also found that compressor designs with multiple impellers per stage have an advantage in terms of energy consumption and the optimum number of stages required compared to designs where one impeller per stage is used. Because of this, the performance maps for the unconstrained cases presented in Figure 7b, Figure 8b, and Figure 9b should be used as the basis for further study work.

Nomenclature

H i n i Enthalpy at the inlet to stage i
H o u t S i Enthalpy at the outlet if stage i (isentropic basis)
nNumber of compressor stages
P C R Crycondenbar pressure
P D P Dew point pressure
P i n i Inlet pressure pressure for stage i
P o u t i Outlet pressure pressure for stage i
P r i Pressure ratio for stage i
∆PAftercooler pressure drop
S i Entropy for stage i
ToAftercooler outlet temperature
WcEnergy used in compression
x i Gas composition stage i
η Isentropic efficiency

Supplementary Materials

The following are available online at https://www.mdpi.com/1996-1073/12/9/1603/s1, Figure S1: Post-combustion capture cases, compression energy consumption with fixed (un-optimized) stage pressure ratios, (a) constrained cases and (b) unconstrained cases. Figure S2: Pre-combustion capture cases, compression energy consumption with fixed (un-optimized) stage pressure ratios, (a) constrained cases and (b) unconstrained cases. Figure S3: Oxy-combustion capture cases, compression energy consumption with fixed (un-optimized) stage pressure ratios, (a) constrained cases and (b) unconstrained cases. All data from Figure 7, Figure 8, Figure 9 and Figures S1–S3 in CSV .txt format.

Author Contributions

Conceptualization, S.J.; methodology, S.J.; formal analysis, S.J.; writing—original draft preparation, S.J.; writing—review and editing, E.B.; supervision, E.B.

Funding

This research received no external funding. The APC was funded by a grant from the publication fund of UiT The Arctic University of Norway.

Conflicts of Interest

The authors declare no conflict of interest.

References

  1. Lucquiaud, M.; Liang, X.; Errey, O.; Chalmers, H.; Gibbins, J. Addressing technology uncertainties in power plants with post-combustion capture. Energy Procedia 2013, 37, 2359–2368. [Google Scholar] [CrossRef]
  2. Jordal, K.; Aspelund, A. Gas conditioning—The interface between CO2 capture and transport. Int. J. Greenh. Gas Control. 2007, 1, 343–354. [Google Scholar]
  3. Dittmer, R.; Strube, R. Integrally-geared compressors as state-of-the-art technology. Carbon Capture J. 2015, 47, 15–18. [Google Scholar]
  4. Habel, R.; Wacker, C. Innovative and proven CO2 compression technology for CCS and EOR. Carbon Capture J. 2009, 11, 15–18. [Google Scholar]
  5. Irlam, L. Global Costs of Carbon Capture and Storage, 2017 Update; Global CCS Institute: Docklands, Australia, 2017. [Google Scholar]
  6. Romeo, L.M.; Bolea, I.; Lara, Y.; Escosa, J.M. Optimization of intercooling compression in CO2 capture systems. Appl. Therm. Eng. 2009, 29, 1744–1751. [Google Scholar] [CrossRef]
  7. Luo, X.; Wang, M.; Chen, J. Heat integration of natural gas combined cycle power plant integrated with post-combustion CO2 capture and compression. Fuel 2015, 151, 110–117. [Google Scholar] [CrossRef]
  8. Posch, S.; Haider, M. Optimization of CO2 compression and purification units (CO2CPU) for CCS power plants. Fuel 2012, 101, 254–263. [Google Scholar] [CrossRef]
  9. Font-Palma, C.; Errey, O.; Corden, C.; Chalmers, H.; Lucquiaud, M.; Sanchez Del Rio, M.; Jackson, S.; Medcalf, D.; Livesey, B.; Gibbins, J.; et al. Integrated oxyfuel power plant with improved CO2 separation and compression technology for EOR application. Process. Saf. Environ. Prot. 2016, 103, 455–465. [Google Scholar] [CrossRef]
  10. Alabdulkarem, A.; Hwang, Y.; Radermacher, R. Development of CO2 liquefaction cycles for CO2 sequestration. Appl. Therm. Eng. 2012, 33, 144–156. [Google Scholar] [CrossRef]
  11. Harkina, T.; Hoadley, A.; Hooper, B. A comparison of the Process Integration of Shockwave CO2 compression with conventional turbo machinery into PCC power station design. Energy Procedia 2011, 4, 1339–1346. [Google Scholar] [CrossRef]
  12. Pei, P.; Barse, K.; Gil, A.J.; Nasah, J. Waste heat recovery in CO2 compression. Int. J. Greenh. Gas Control. 2014, 30, 86–96. [Google Scholar] [CrossRef]
  13. Calado, M. Modeling and design synthesis of a CCS compression train system via MINLP optimization. Instituto Superior Técnico, Universidade de Lisboa. 2012. Available online: https://fenix.tecnico.ulisboa.pt/downloadFile/395144614662/ExtendedAbstract_MarioCalado_12Outubro2012.pdf (accessed on 26 April 2019).
  14. Jackson, S.; Brodal, E. A comparison of the energy consumption for CO2 compression process alternatives. Available online: https://iopscience.iop.org/article/10.1088/1755-1315/167/1/012031/pdf (accessed on 26 April 2019).
  15. Pipitone, G.; Bolland, O. Power generation with CO2 capture: Technology for CO2 purification. Int. J. Greenh. Gas Control. 2009, 3, 528–534. [Google Scholar] [CrossRef]
  16. Amrollahi, Z.; Ystad, P.A.M.; Ertesvåg, I.S.; Bolland, O. Optimized process configurations of post-combustion CO2 capture for natural-gas-fired power plant—Power plant efficiency analysis. Int. J. Greenh. Gas Control. 2012, 8, 1–11. [Google Scholar] [CrossRef]
  17. D.N.V. Recommended Practice, DNV-RP-J202, Design and Operation of CO2 Pipelines. DNV, 2010. Available online: https://rules.dnvgl.com/docs/pdf/DNV/codes/docs/2010-04/RP-J202.pdf (accessed on 26 April 2019).
  18. Eickhoff, C.; Neele, F.; Hammer, M.; DiBiagio, M.; Hofstee, C.; Koenen, M.; Fischer, S.; Isaenko, A.; Brown, A.; Kovacs, T. IMPACTS: Economic Trade-offs for CO2 Impurity Specification. Energy Procedia 2014, 63, 7379–7388. [Google Scholar] [CrossRef]
  19. Damen, K.; Troost, M.v.; Faaij, A.; Turkenburg, W. A comparison of electricity and hydrogen production systems with CO2 capture and storage. Part A: Review and selection of promising conversion and capture technologies. Prog. Energy Combust. Sci. 2006, 32, 215–246. [Google Scholar] [CrossRef]
  20. IEA Greenhouse Gas R&D Programme. Techno-Economic Evaluation of SMR Based Standalone (Merchant) Hydrogen Plant with CCS. 2017. Available online: https://ieaghg.org/exco_docs/2017-02.pdf (accessed on 26 April 2019).
  21. Tanaka, Y.; Sawada, Y.; Tanase, D.; Tanaka, J.; Shiomi, S.; Kasukawa, T. Tomakomai CCS Demonstration Project of Japan, CO2 Injection in Process. Energy Procedia 2017, 114, 5836–5846. [Google Scholar] [CrossRef]
  22. Alhajaj, A.; Mac Dowell, N.; Shah, N. A techno-economic analysis of post-combustion CO2 capture and compression applied to a combined cycle gas turbine: Part I. A parametric study of the key technical performance indicators. Int. J. Greenh. Gas Control. 2016, 44, 26–41. [Google Scholar] [CrossRef]
Figure 1. Illustration of a CO2 compressor design with n stages.
Energies 12 01603 g001
Figure 2. Illustration of a conventional nine-stage compressor in a pressure-enthalpy diagram.
Energies 12 01603 g002
Figure 3. Energy consumption for a 10 stage CO2 compressor, post-combustion capture case, P n = 90 bar(a) and T o = 288 K with (a) constant P r and (b) optimized P r .
Energies 12 01603 g003
Figure 4. Relative energy consumption vs. stages for post-combustion capture, (a) constrained cases and (b) unconstrained cases (right).
Energies 12 01603 g004
Figure 5. Relative energy consumption vs. stages for pre-combustion capture, (a) constrained cases and (b) unconstrained cases.
Energies 12 01603 g005
Figure 6. Relative energy consumption vs. compressor stage, oxyfuel cases, (a) constrained cases and (b) unconstrained cases.
Energies 12 01603 g006
Figure 7. Post-combustion capture cases, optimized compression energy consumption and number of stages, (a) constrained cases and (b) unconstrained cases.
Energies 12 01603 g007
Figure 8. Pre-combustion capture cases, optimized compression energy consumption and number of stages, (a) constrained cases and (b) unconstrained cases.
Energies 12 01603 g008
Figure 9. Oxyfuel cases, optimized compression energy consumption and number of stages, (a) constrained cases and (b) unconstrained cases.
Energies 12 01603 g009
Figure 10. Reduction in energy consumption (%) for the unconstrained cases relative to the constrained cases with reduction in the number of compression stages overlaid, (a) post-combustion cases, (b) pre-combustion cases.
Energies 12 01603 g010
Table 1. Summary of compressor modelling parameters.
ParameterConstrained CasesUnconstrained Cases
Pressure Ratio, P r <2<10
Efficiency, η 85%
Stage pressure drop, Δ P 0.5 bar
Final stage inlet pressure, P i n n Minimum of P D P + 5 bar and, P C R + 5 bar
Table 2. Summary of compressor modeling parameters.
ParameterPostPreOxyfuel
Cooling temperature,   T o 288 K to 323 K288 K to 323 K288 K to 323 K
Discharge pressure, P n 90 bar(a) to 180 bar(a)90 bar(a) to 180 bar(a)90 bar(a) to 180 bar(a)
Inlet pressure,   P i n 1 1.01 bar(a)1.01 bar(a)16.5 bar(a)
Dry stream compositionCO2 99.99 mole%
N2 0.01 mole%
CO2 99.5 mole%
CH4 0.5 mole%
CO2 96.16 mole%
N2 2.45 mole%
Ar 0.96 mole%
O2 0.43 mole%
Table 3. Summary of the range of optimized energy consumption and number of stages.
ParameterPost
const.
Post
u.con.
Pre
const.
Pre
u.con.
Oxy
const.
Oxy
u.con.
Energy, Wc [kJ/kg(CO2)]292 to 406312 to 425316 to 431294 to 14087 to 15087 to 150
Stages, n (-)8 to 968 to 964 to 54 to 6

