Article

Operation Testing of an Advanced Personalized Ventilation System

Faculty of Engineering, University of Debrecen, 4032 Debrecen, Hungary
*
Author to whom correspondence should be addressed.
Energies 2019, 12(9), 1596; https://doi.org/10.3390/en12091596
Submission received: 5 April 2019 / Revised: 24 April 2019 / Accepted: 25 April 2019 / Published: 26 April 2019
(This article belongs to the Special Issue Heat and Mass Transfer in Building Energy Performance Assessment)

Abstract

:
Using personalized ventilation systems in office buildings, important energy saving might be obtained, which may improve the indoor air quality and thermal comfort sensation of occupants at the same time. In this paper, the operation testing results of an advanced personalized ventilation system are presented. Eleven different air terminal devices were analyzed. Based on the obtained air velocities and turbulence intensities, one was chosen to perform thermal comfort experiments with subjects. It was shown that, in the case of elevated indoor temperatures, the thermal comfort sensation can be improved considerably. A series of measurements were carried out in order to determine the background noise level and the noise generated by the personalized ventilation system. It was shown that further developments of the air distribution system are needed.

1. Introduction

In European countries, buildings account for 40% of the total energy consumption [1]. The sector is expanding and the comfort needs of occupants are increasing. According to Vorsatz et al., the share of heating and cooling in the building energy balance is variable between 18% and 73% [2]. Therefore, energy saving in the building sector is primordial in the European Union. According to 2020 energy goals, the energy efficiency should increase by 20%. The share of renewable energy sources should increase by 20% and the CO2 emissions should be reduced with 20% or even 30%. [3]. Climate change does not help in achieving the goals. It was proven by different scholars that, in European countries, future summers are getting warmer and the number and amplitude of heat waves will increase in the future [4,5]. According to Isaac and van Vuuren, climate change has little net effect on the global energy use because the increase of the outdoor temperature leads to the decrease of heating energy use. However, at the same time, it induces the increase of the cooling energy consumption [6]. However, if the heating and cooling energy are analyzed separately, the impact of climate change is significant. According to their scenario, by 2100, the heating energy needs will decrease by 34%, while the cooling energy needs are going to increase by 72%. Levesque et al. demonstrated that, without new climate policies and drastic changes in the energy use, the global final energy need of buildings could increase from 116 EJ/yr in 2010 to anywhere from 120 to 378 EJ/yr in 2100 [7]. According to their results, buildings’ energy demand will be dominated by the energy use of appliances, lighting, and space cooling, while the share of heating and cooking decrease. Santamouris analyzed the energy use of buildings assuming three different scenarios: based on low, average, and high future development [8]. He predicted a range of the expected cooling energy demand in 2050 assuming various boundary conditions. His results show that the average cooling energy demand of the residential and commercial buildings in 2050 will increase up to 750% and 275%, respectively. The decrease of heating share and increase of cooling needs in the building energy balance are influenced by the severe requirements related to thermal properties of the buildings’ envelope. New insulating materials are tested in order to meet the requirements related to opaque building elements with thin layers [9,10]. However, in the case of properly insulated buildings, even small heat loads may lead to high indoor air temperatures and the cooling energy need increases while the heating energy demand decreases. To optimize the facade and building shell solutions, such as window areas and physical properties, external wall insulation type and thickness, window-to-wall ratio, and external shading simulations and cost optimal calculations were performed [11]. In the case of free running office or educational buildings with large glazed areas, in spite of the relatively high air change rates provided through natural ventilation, extreme high indoor temperatures may appear [12,13]. Jakubcionis and Carlsson estimated the total potential space cooling demand of the EU to be 292 TW h for the residential sector in an average year [14]. They estimated the additional electrical capacity needed for 79 GW. They stated that, with proper energy system development strategies, the stresses on electricity system from increasing cooling demand can be mitigated.
Air leakage represents an important factor in the energy balance of buildings and influences the indoor air quality as well. Chan et al. analyzed more than 70,000 air leakage measurements in houses across the United States to obtain information about the relation between air leakage area–considered as the effective size of all penetrations of the building shell–and available building characteristics such as building size, year built, geographic region, and various construction characteristics [15]. They presented the regressions of normalized leakage for three house classifications: low-income households, energy program houses, and conventional houses. D’Ambrosio et al. presented the results of a survey on residential buildings located in southern Italy using the fan pressurization method [16]. They found that the average air change rate n50 value is fairly high, particularly for the buildings built before the 1970s. Thus, the air tightness of new buildings is better and the air leakage is reduced considerably. However, Sinnott and Dyer highlighted the importance of workmanship and construction detailing in order to achieve the required air tightness [17]. In the case of new buildings, the improved air tightness of the envelope may lead to the increase of carbon dioxide concentration and humidity content of the indoor air [18]. Low ventilation rates in dwellings increase the risk of allergic symptoms among children [19]. In order to choose the appropriate ventilation strategy in buildings, complex studies have to be performed [20]. Local or personalized ventilation may be the optimal solution providing proper air quality in the occupational zone with minimal energy use. Cao et al. concluded in their study that the combination of different types of ventilation, like displacement ventilation and mixing ventilation, personalized ventilation, and displacement ventilation might have a better performance than using only one method [21]. According to Melikov, the focus must be shifted from total volume air distribution to advanced air distribution based on the following principles [22]:
  • involve each occupant in creating his/her own preferred microenvironment;
  • remove/reduce the air pollution and generated heat (when not needed) locally;
  • make possible active control of the air distribution;
  • provide clean air as well as heating and cooling as much as needed in any location and at any point in time.
At the Building Services and Building Engineering Department, University of Debrecen, an advanced personalized ventilation equipment was developed (ALTAIR), which provides the air jet around the head and chest of the occupants alternatively from different directions (left-front-right), [23]. Numerous measurements were carried out and it was proven that ALTAIR improves the thermal comfort of occupants in environments with elevated operative temperatures [24,25,26,27]. However, the equipment needs to be improved further.
The air terminal device plays a key role in the operation of personalized ventilation equipment. Conceiçao et al. drew the attention about the local thermal discomfort conditions, associated to the draught risk index and to the air velocity fluctuation equivalent frequency [28]. Tham and Pantelic concluded in their study that the risk of draft caused by intensive cooling of small areas of the body can be reduced by cooling when it is more evenly distributed across the whole body surface [29]. According to Melikov et al., performance of personalized ventilation systems depends largely on the supply air terminal device (ATD) [30]. They developed, tested, and evaluated five ATD’s. They stated that the personal exposure effectiveness increased with the increase of the airflow rate from the ATDs to a constant maximum value, which was not affected by a further increase of the airflow.
Another challenge of the ALTAIR personalized ventilation system is to reduce the noise to an acceptable level. According to Kjellberg, noise is probably the most widespread problem in the physical work environment [31]. He revealed that the noise level is raised in offices because of ventilation systems, computers, printers, and other machines. He drew the attention on noise annoyance and its possible behavioral and physiological consequences. The study of Barclays et al. illustrated the importance of an integrated approach to noise exposure and ventilation performance in urban buildings [32].
The aim of the present paper is to present the results of measurements related to an analysis of different air terminal devices and noise level created by the ALTAIR advanced personalized ventilation equipment.

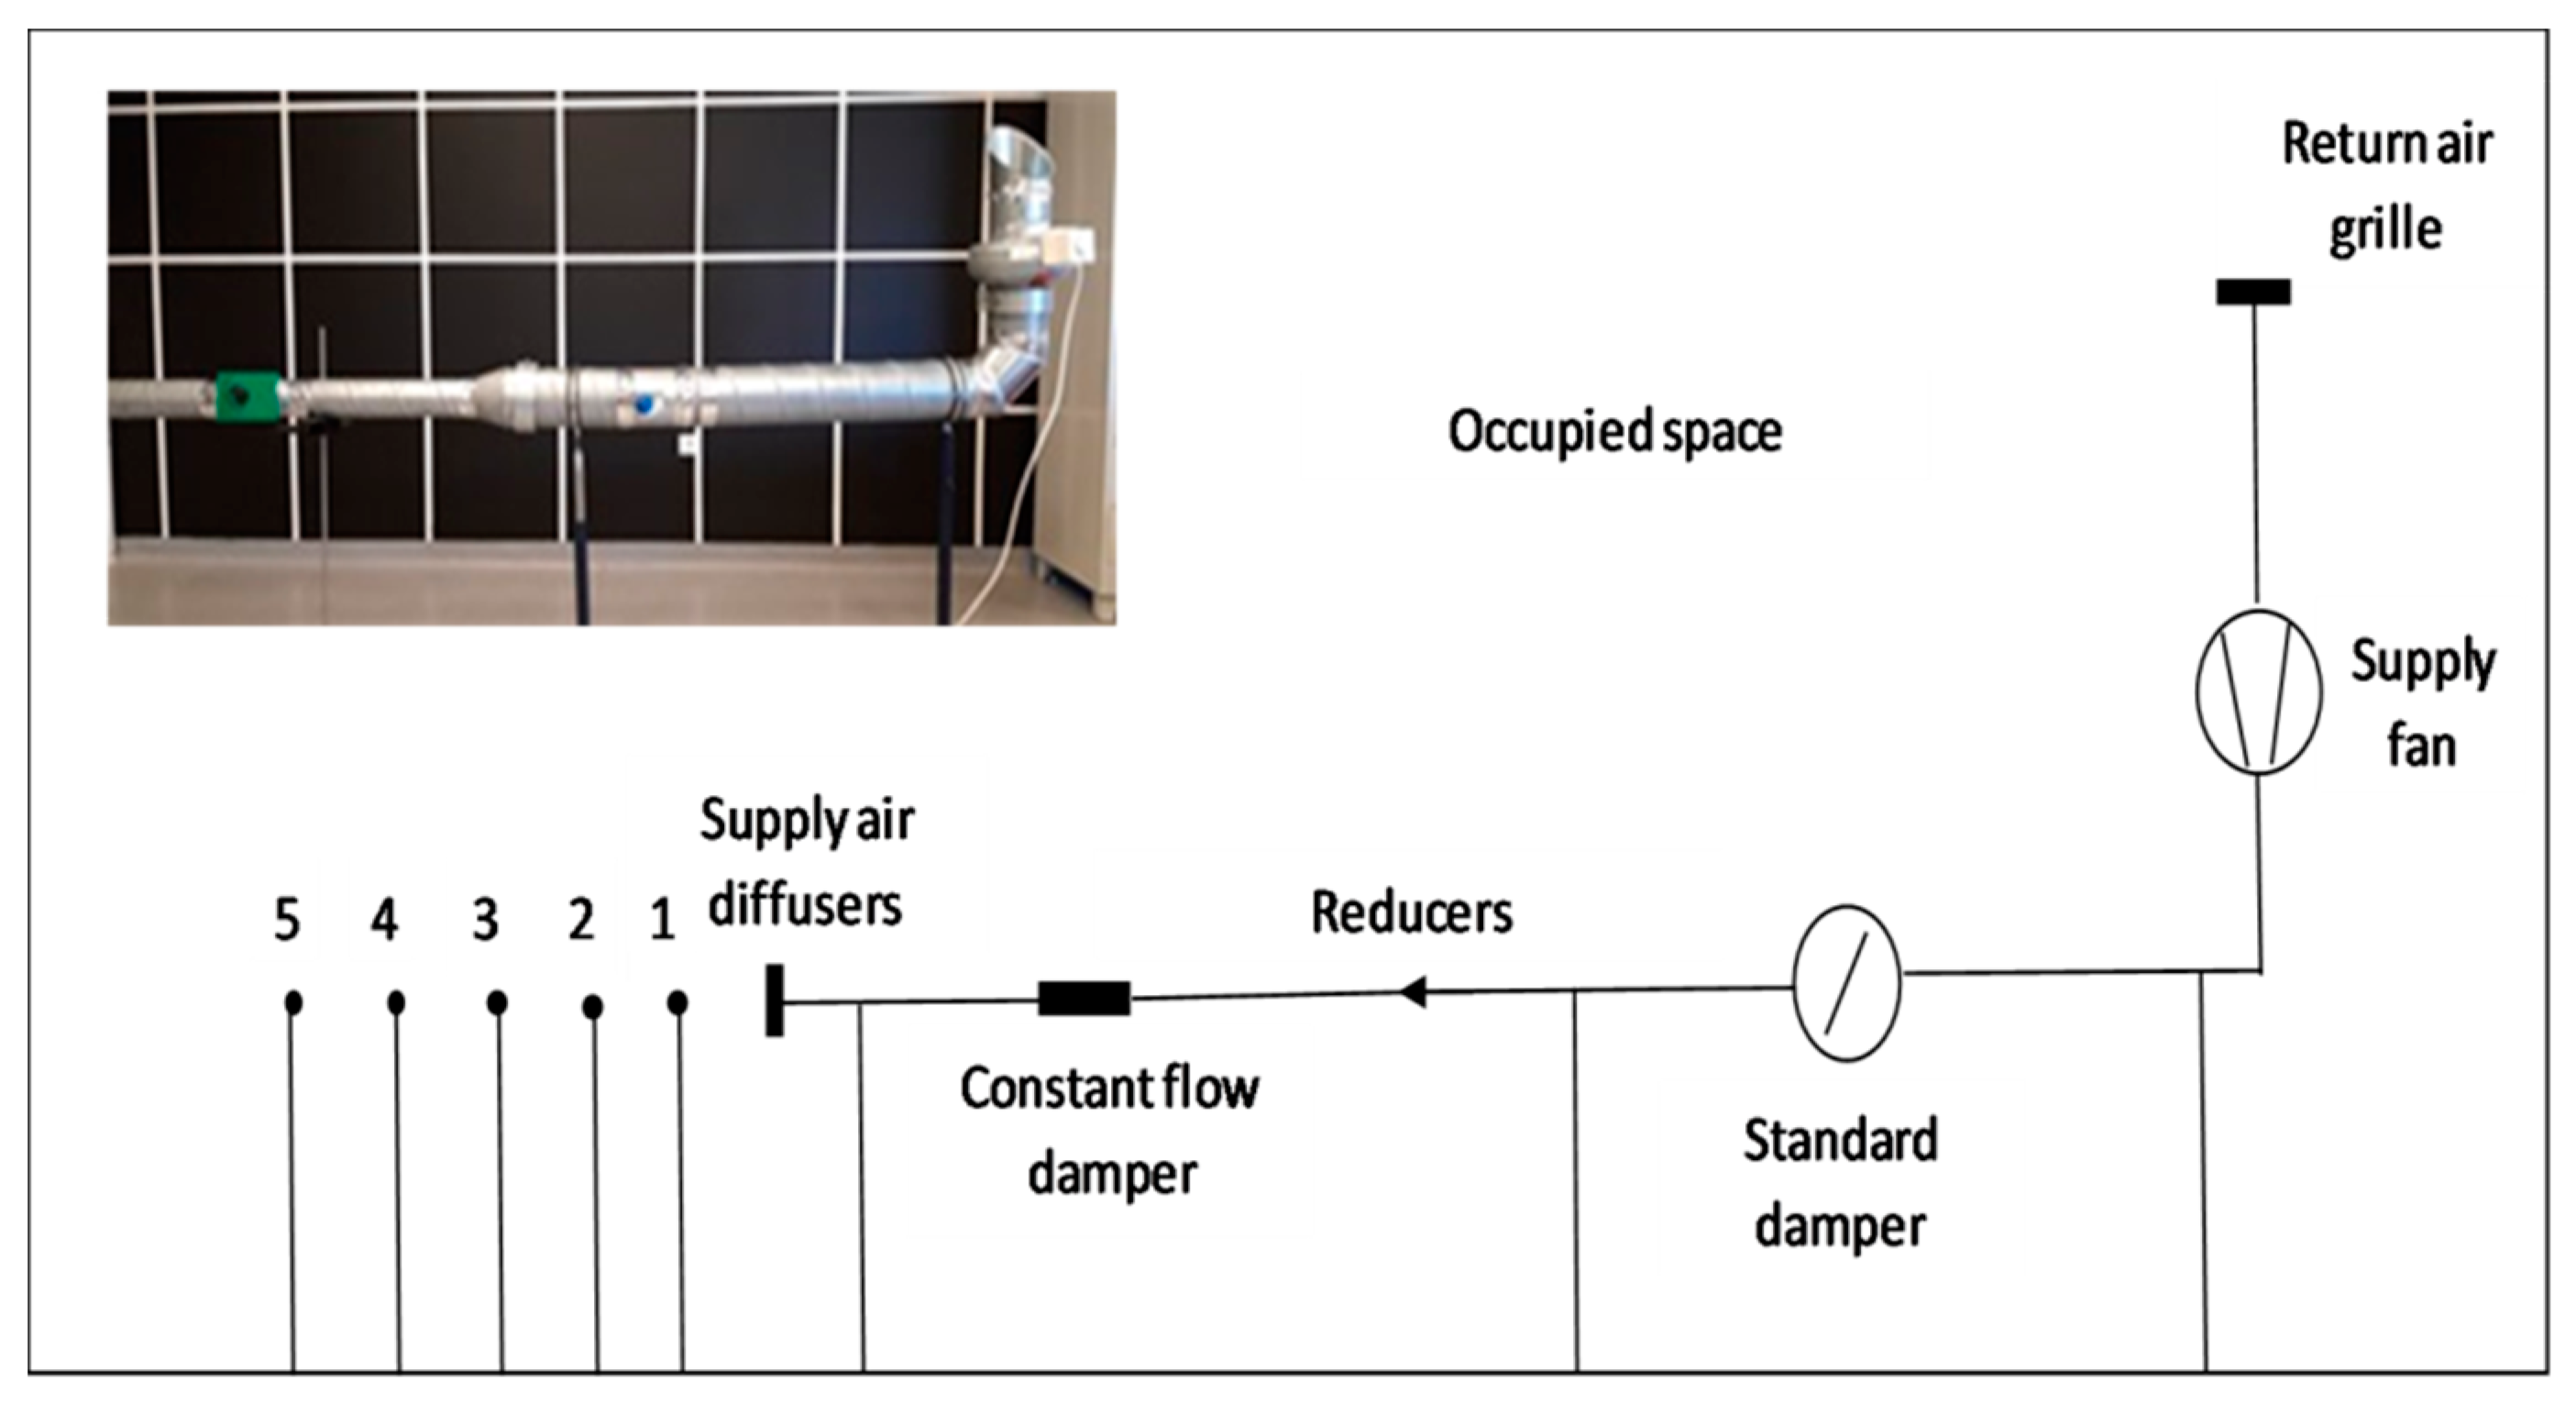
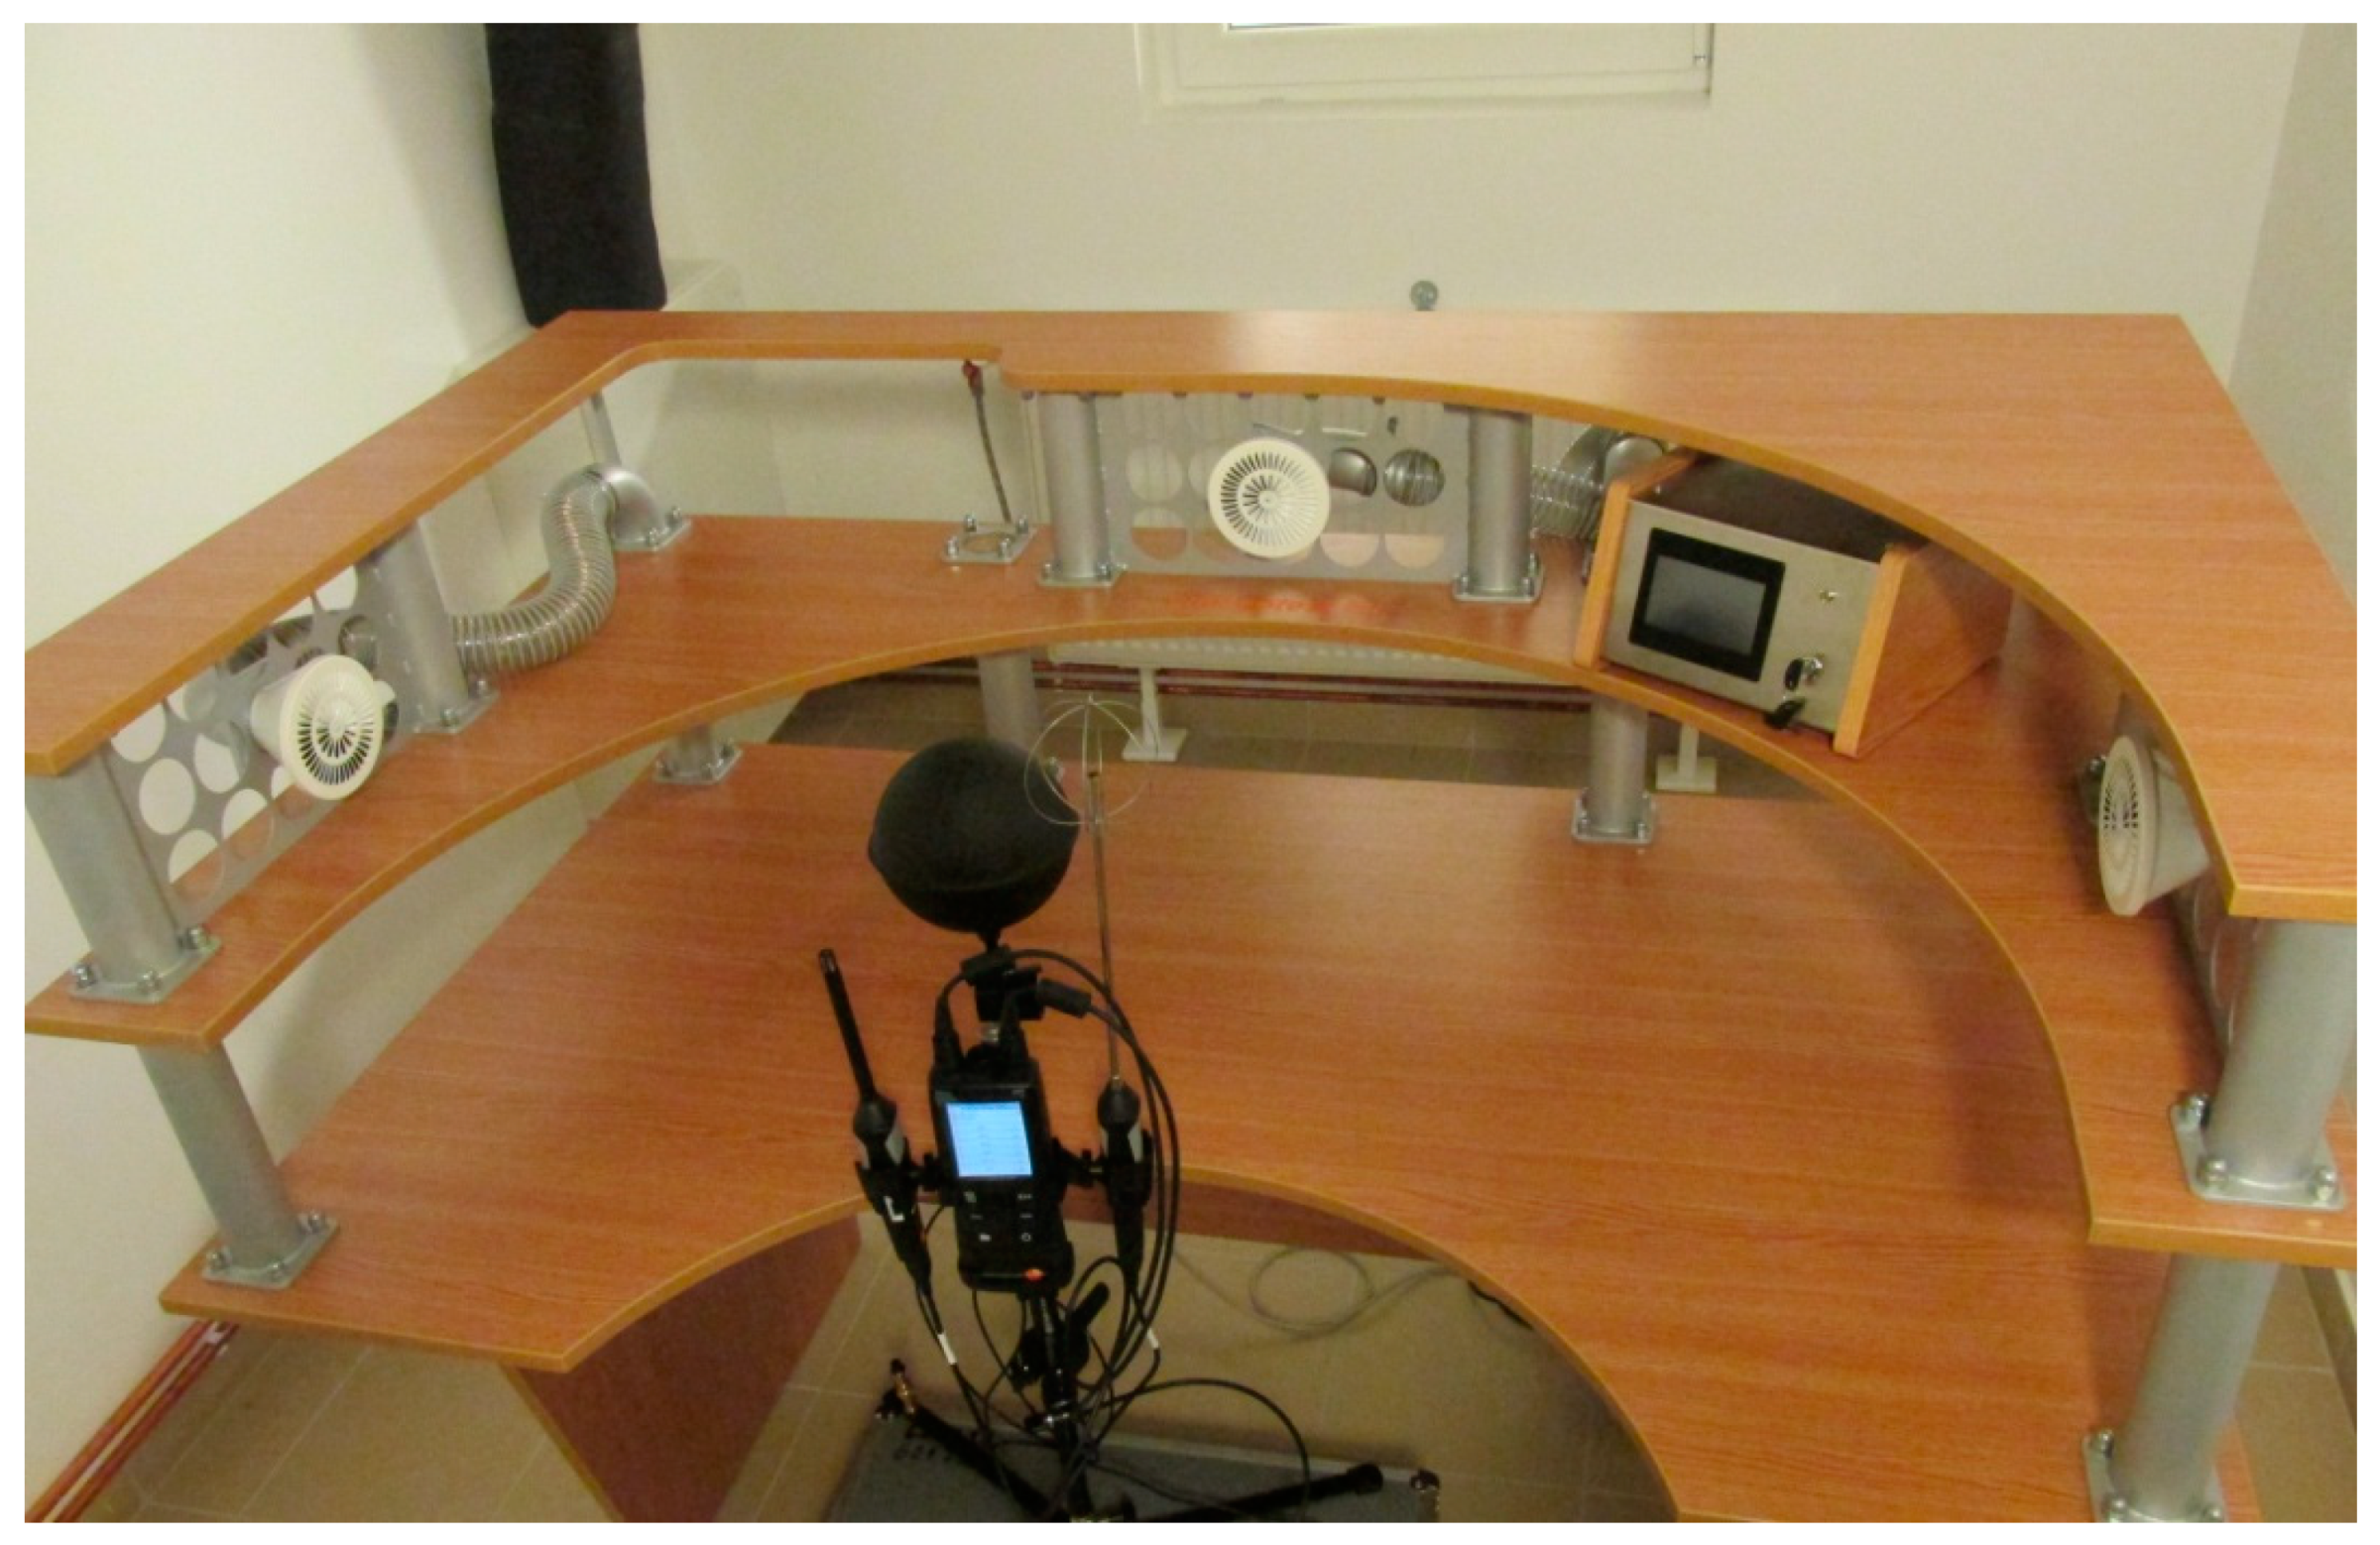
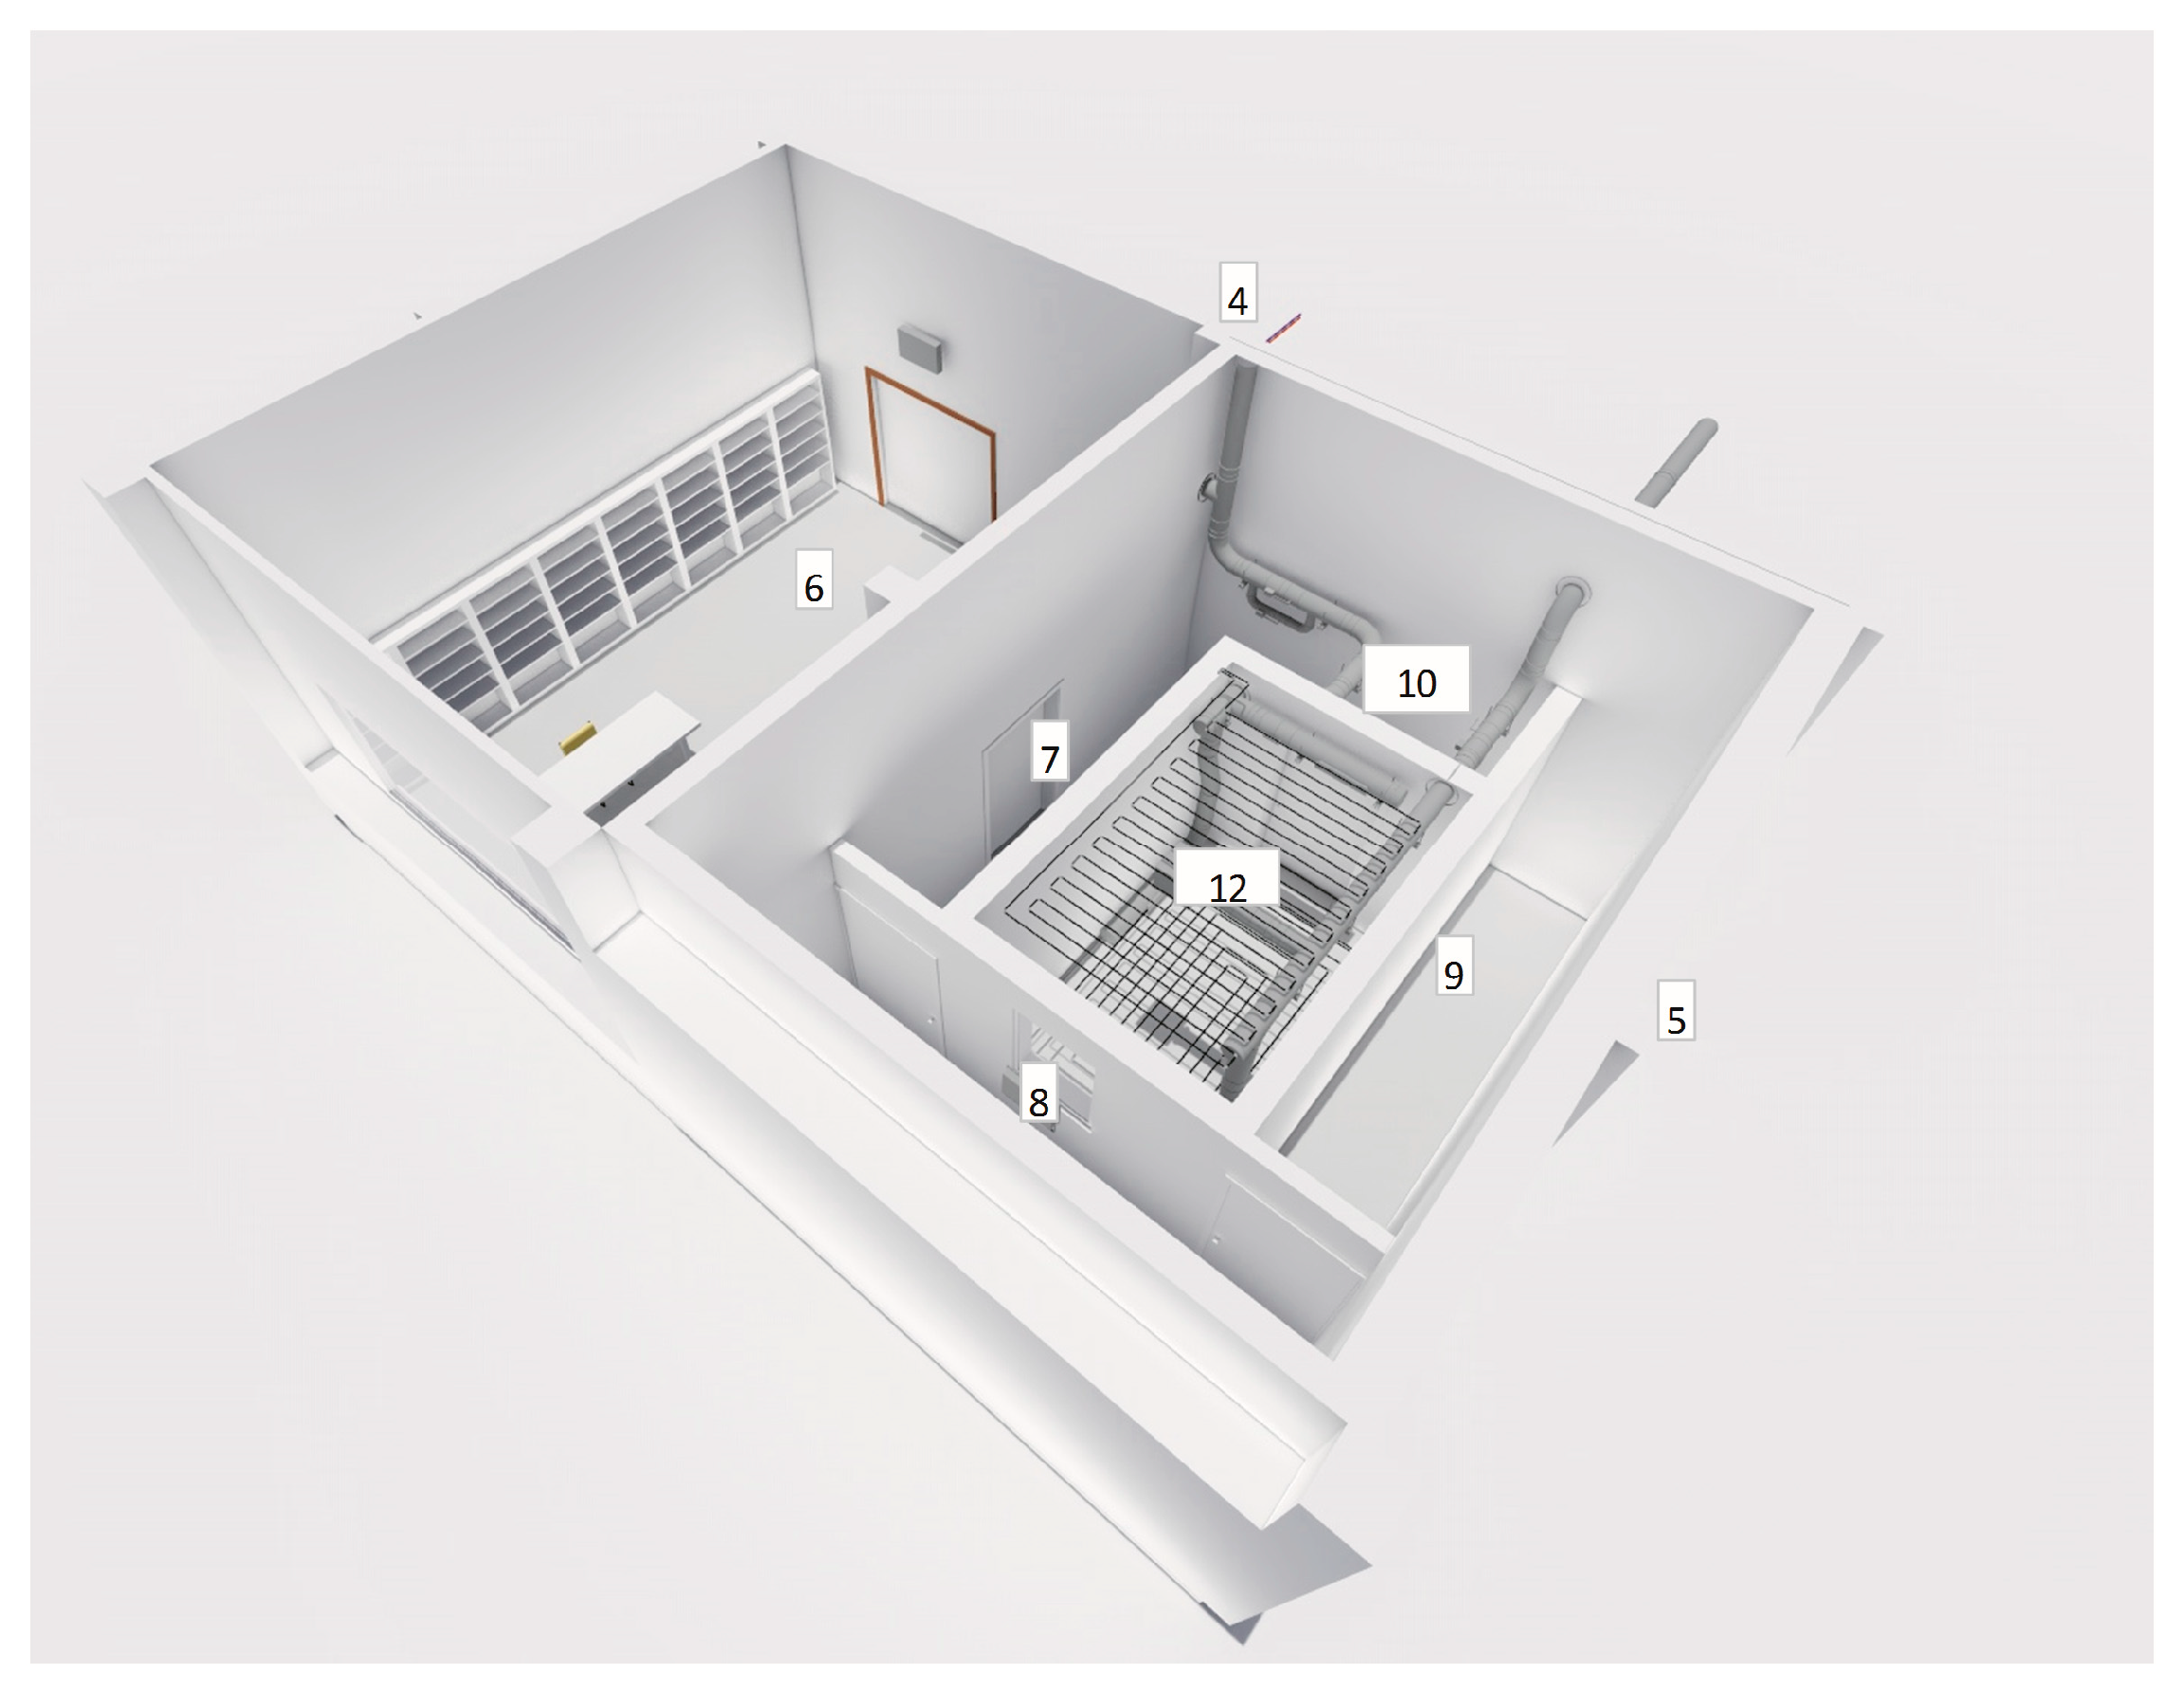
2. ALTAIR PV Equipment

The ALTAIR advanced personalized ventilation equipment is practically integrated in a desk and provides a possibility to introduce the air around the occupants from three different directions (Figure 1).
The ventilated air flow, the air velocity, and the time step of the air jet direction changing is chosen by the occupant. Thus, a comfort bulb is created around the occupant according to her or his needs.

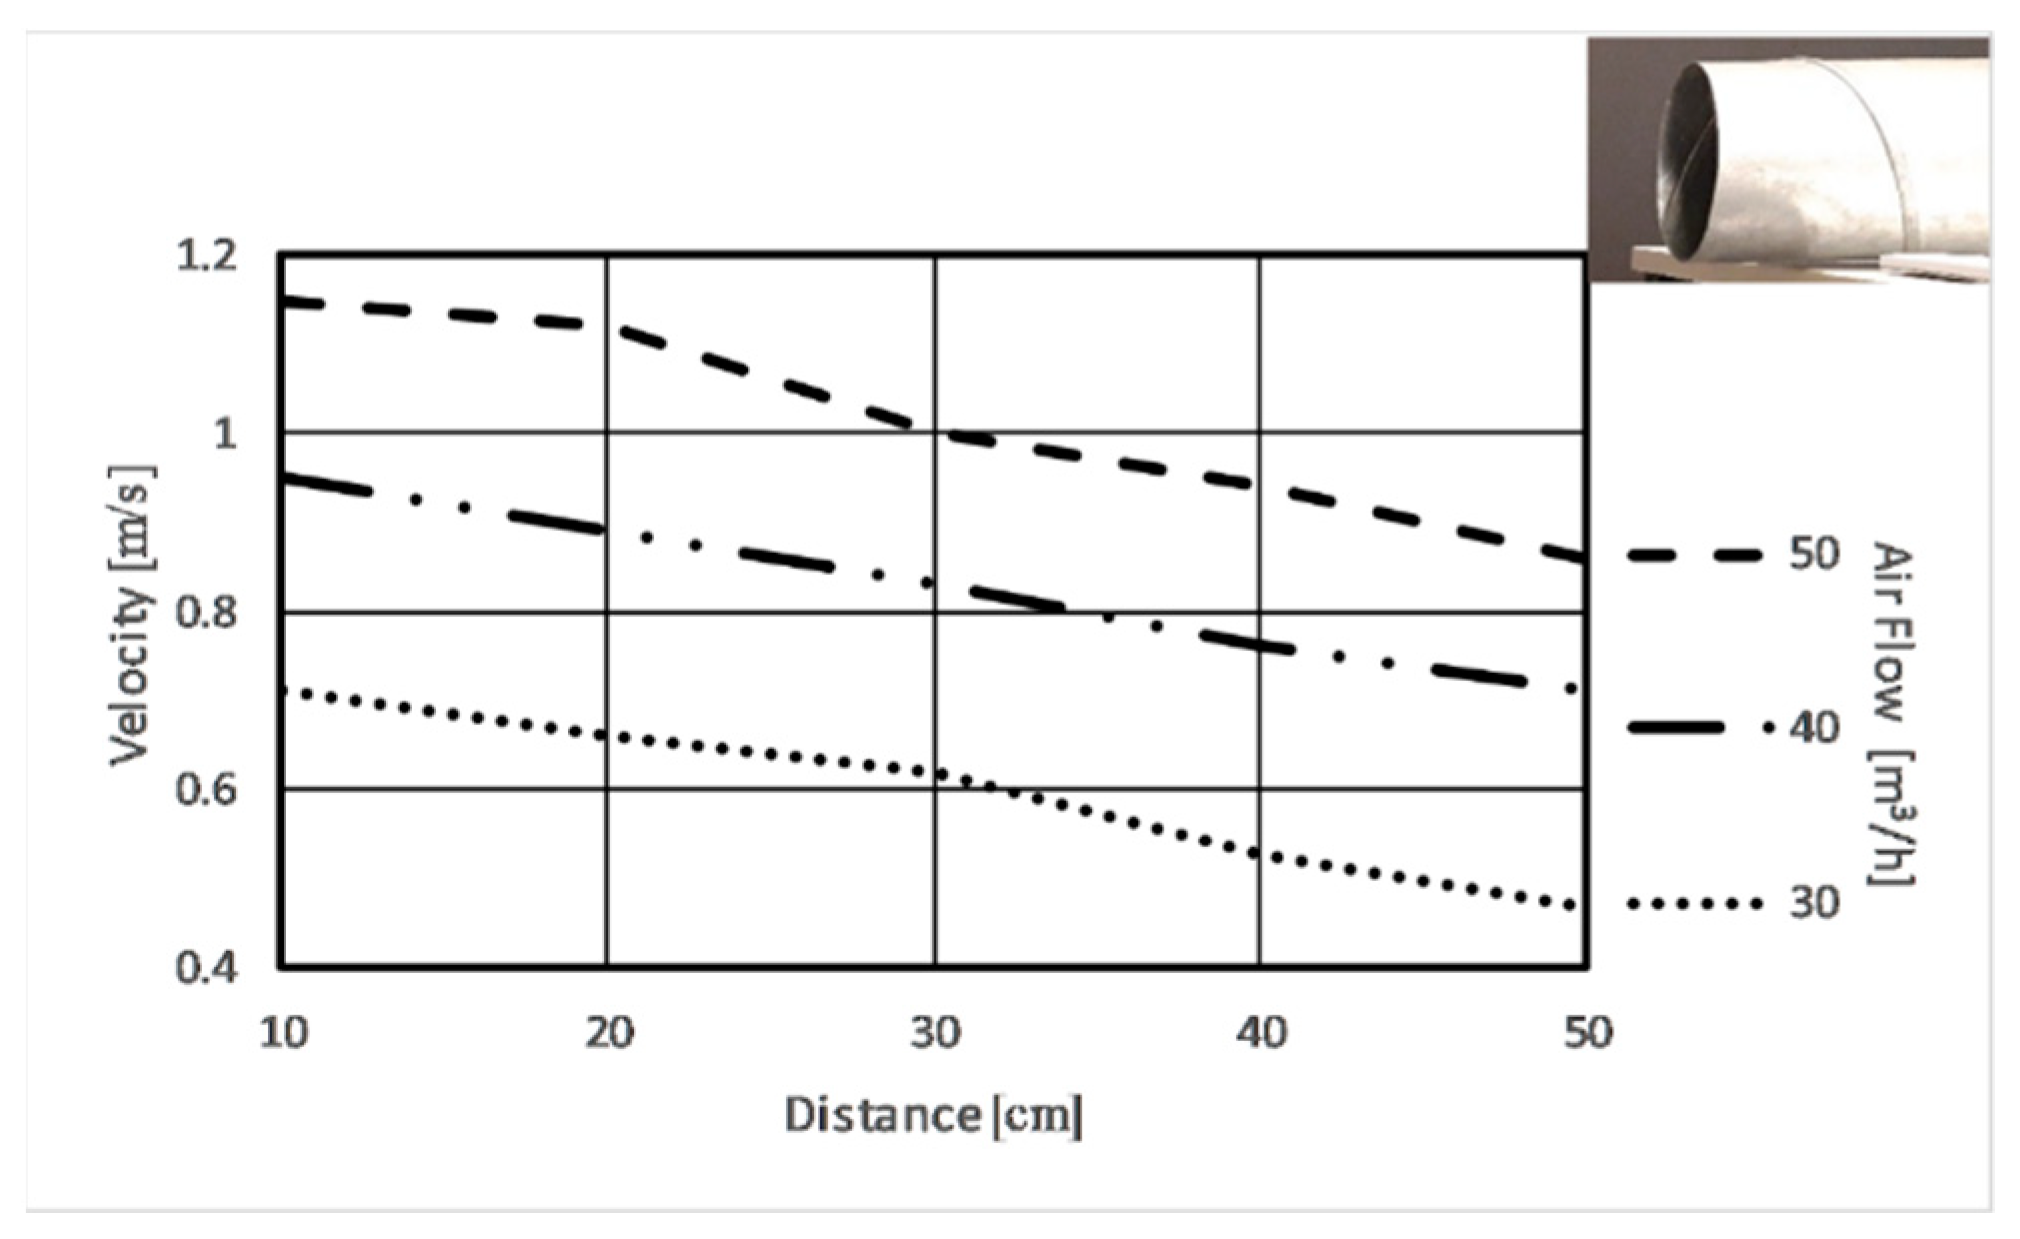
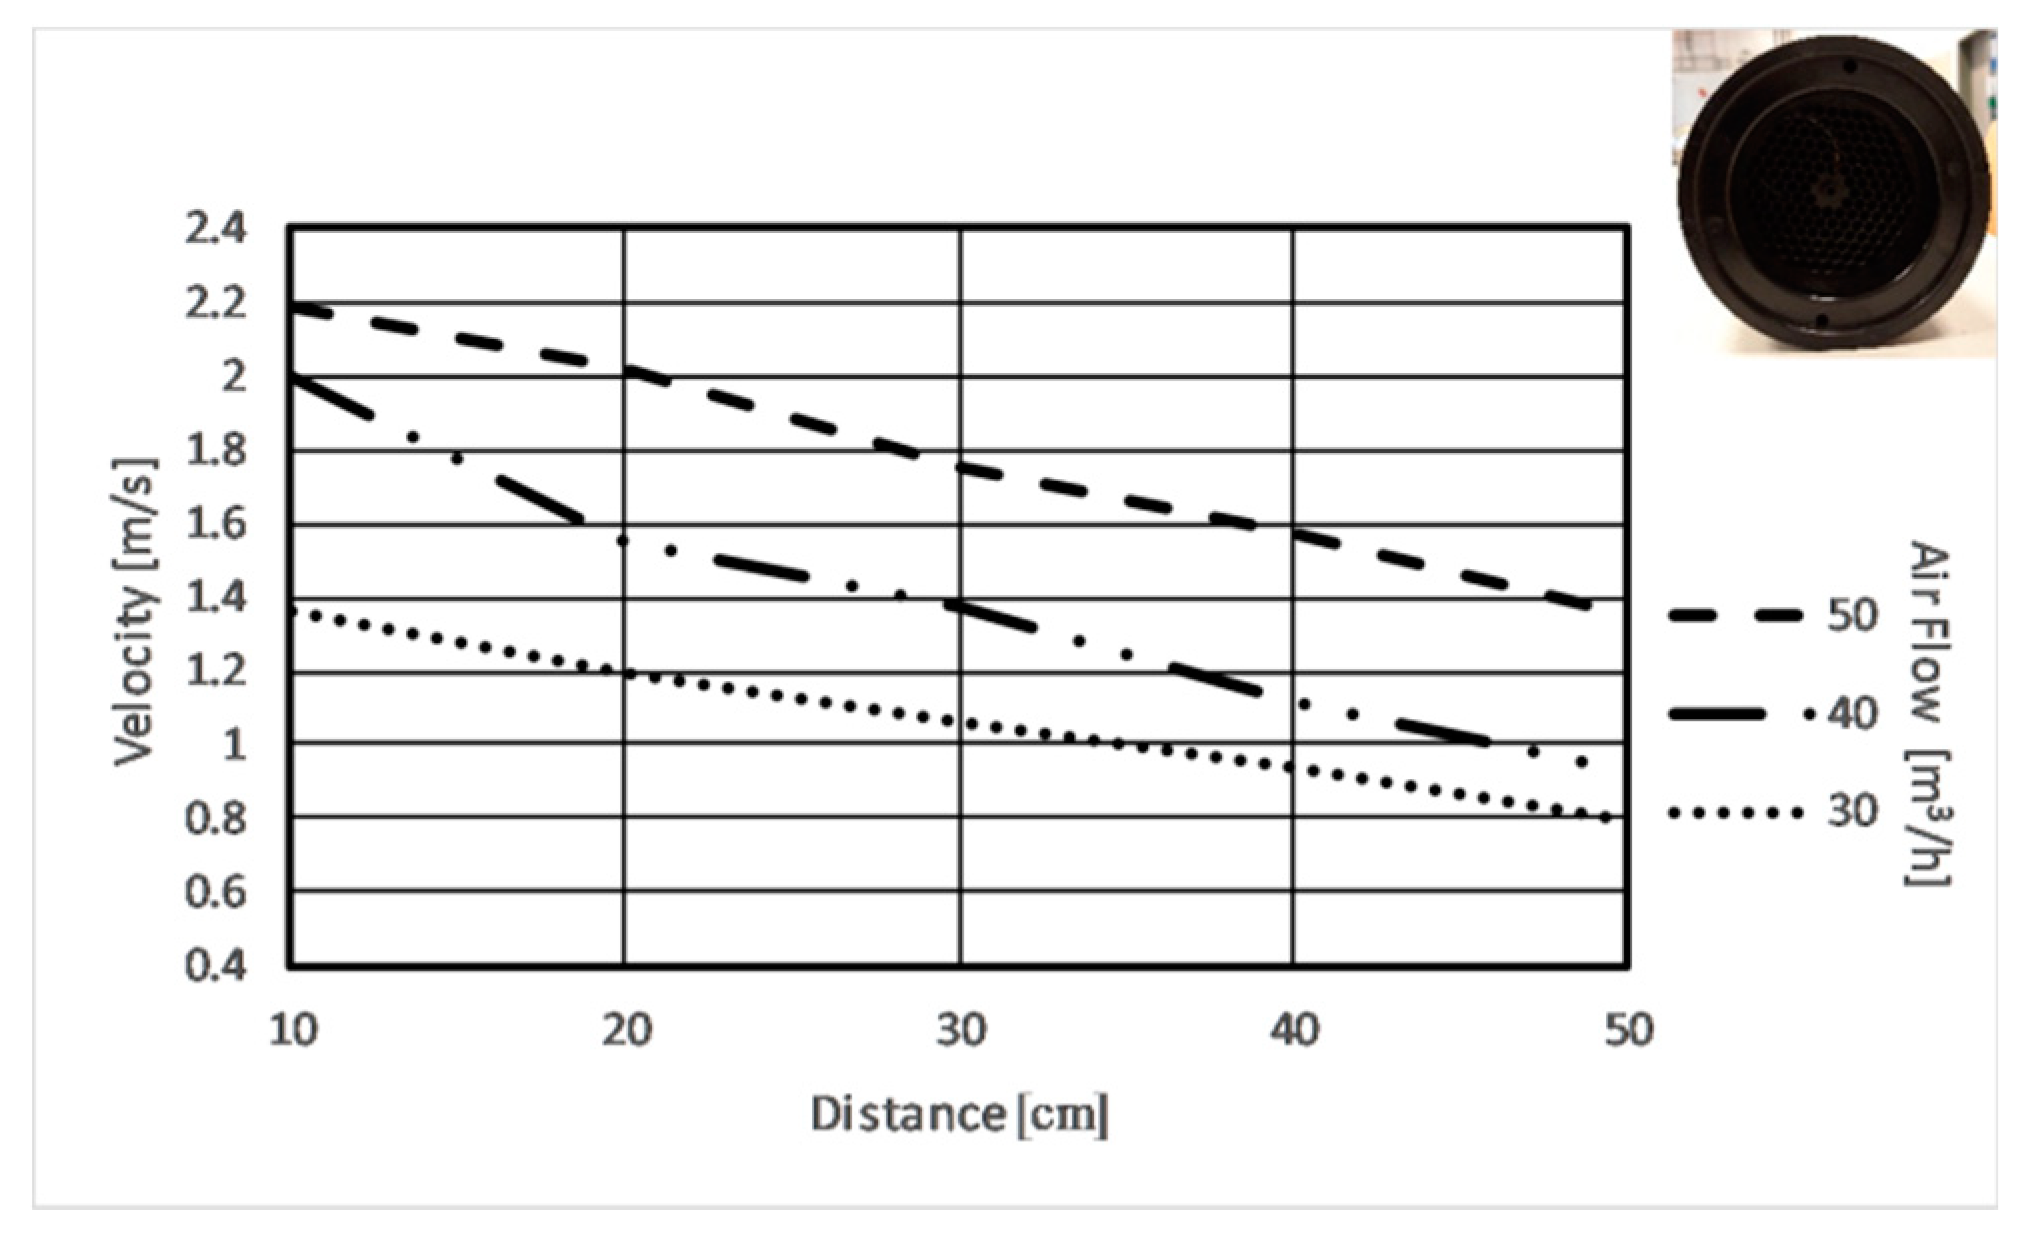
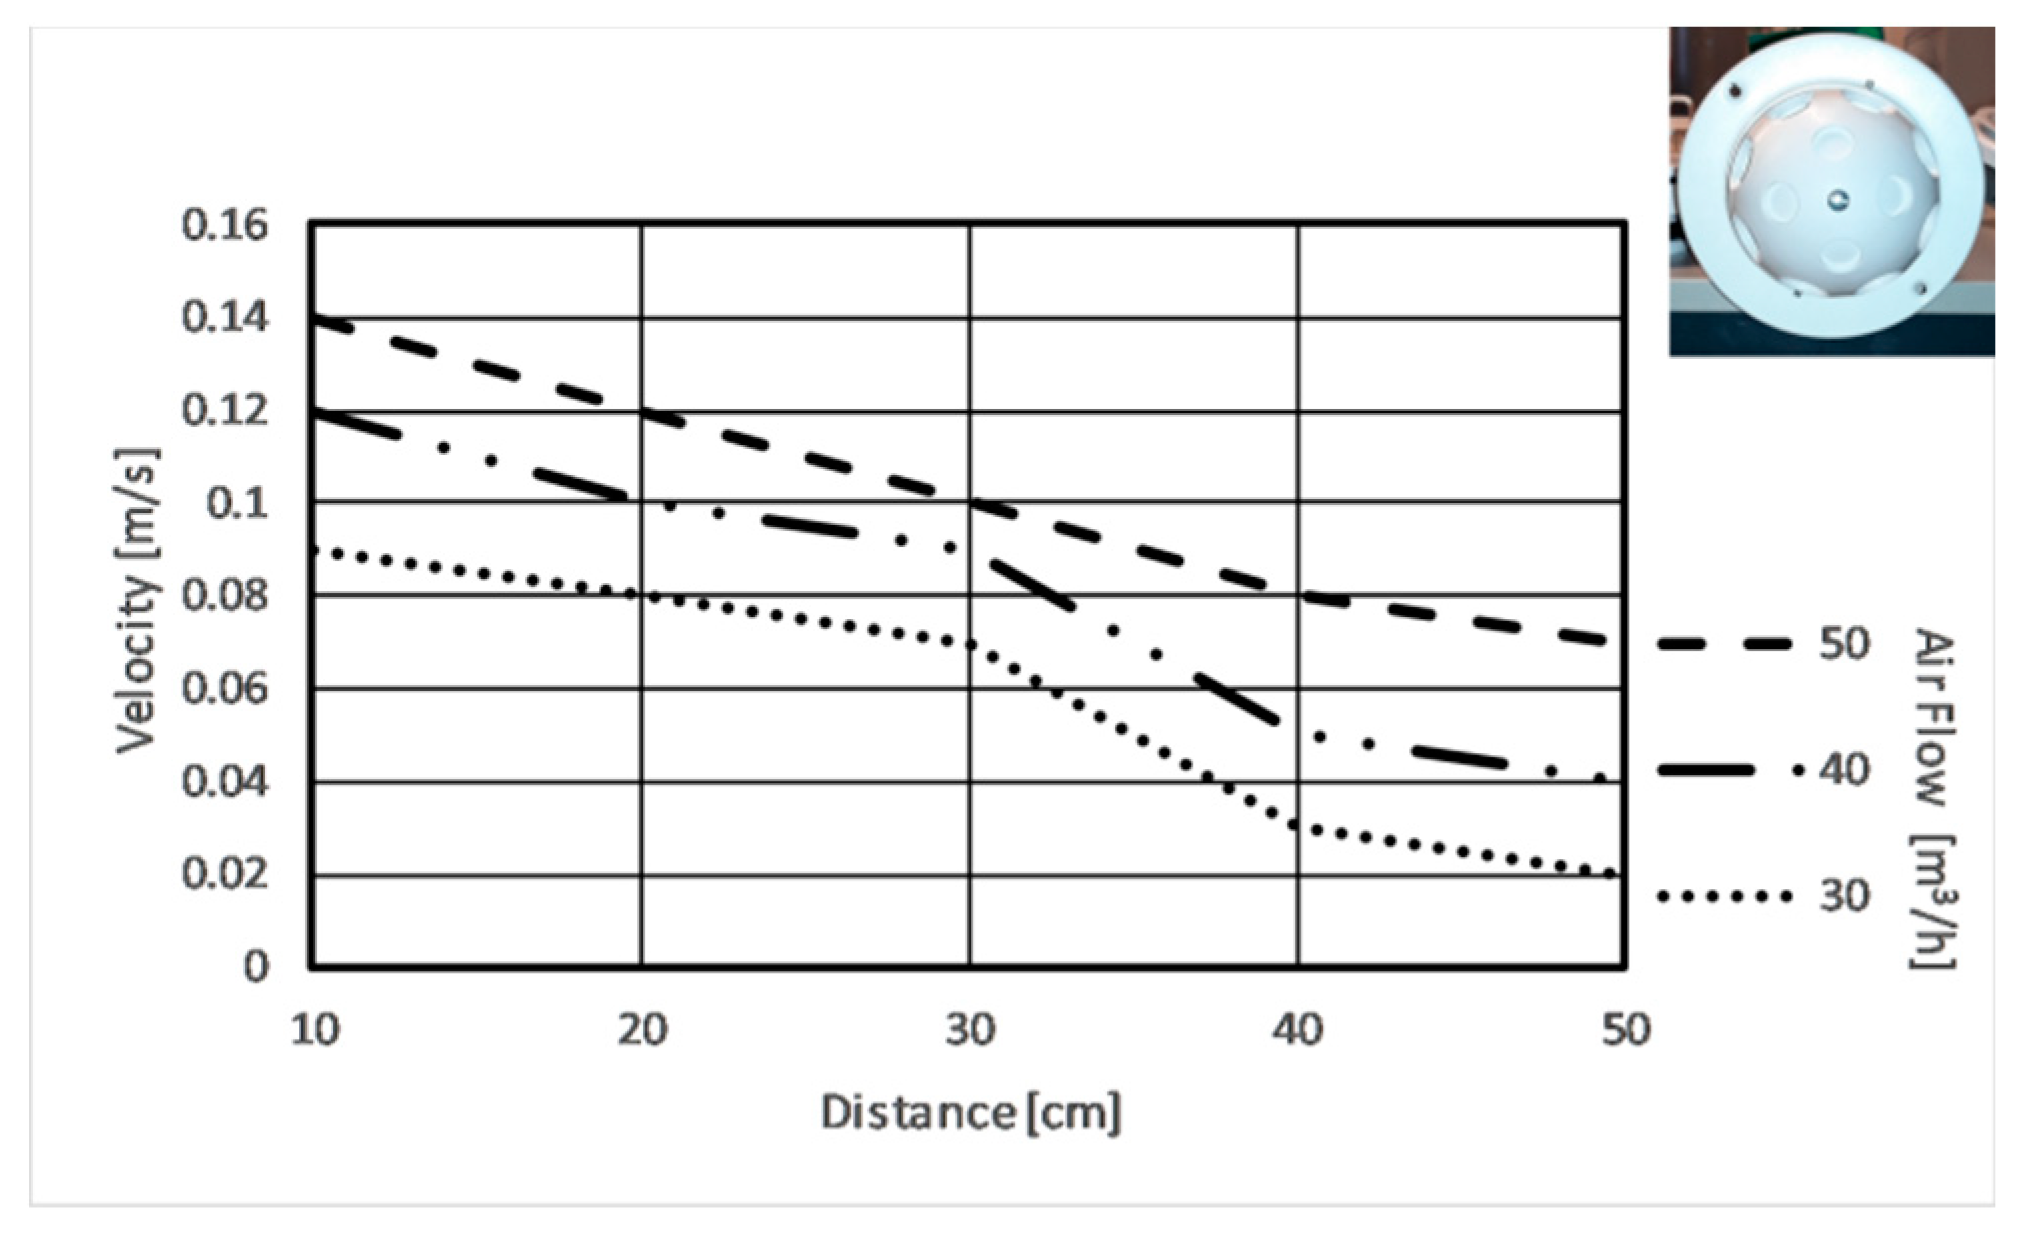
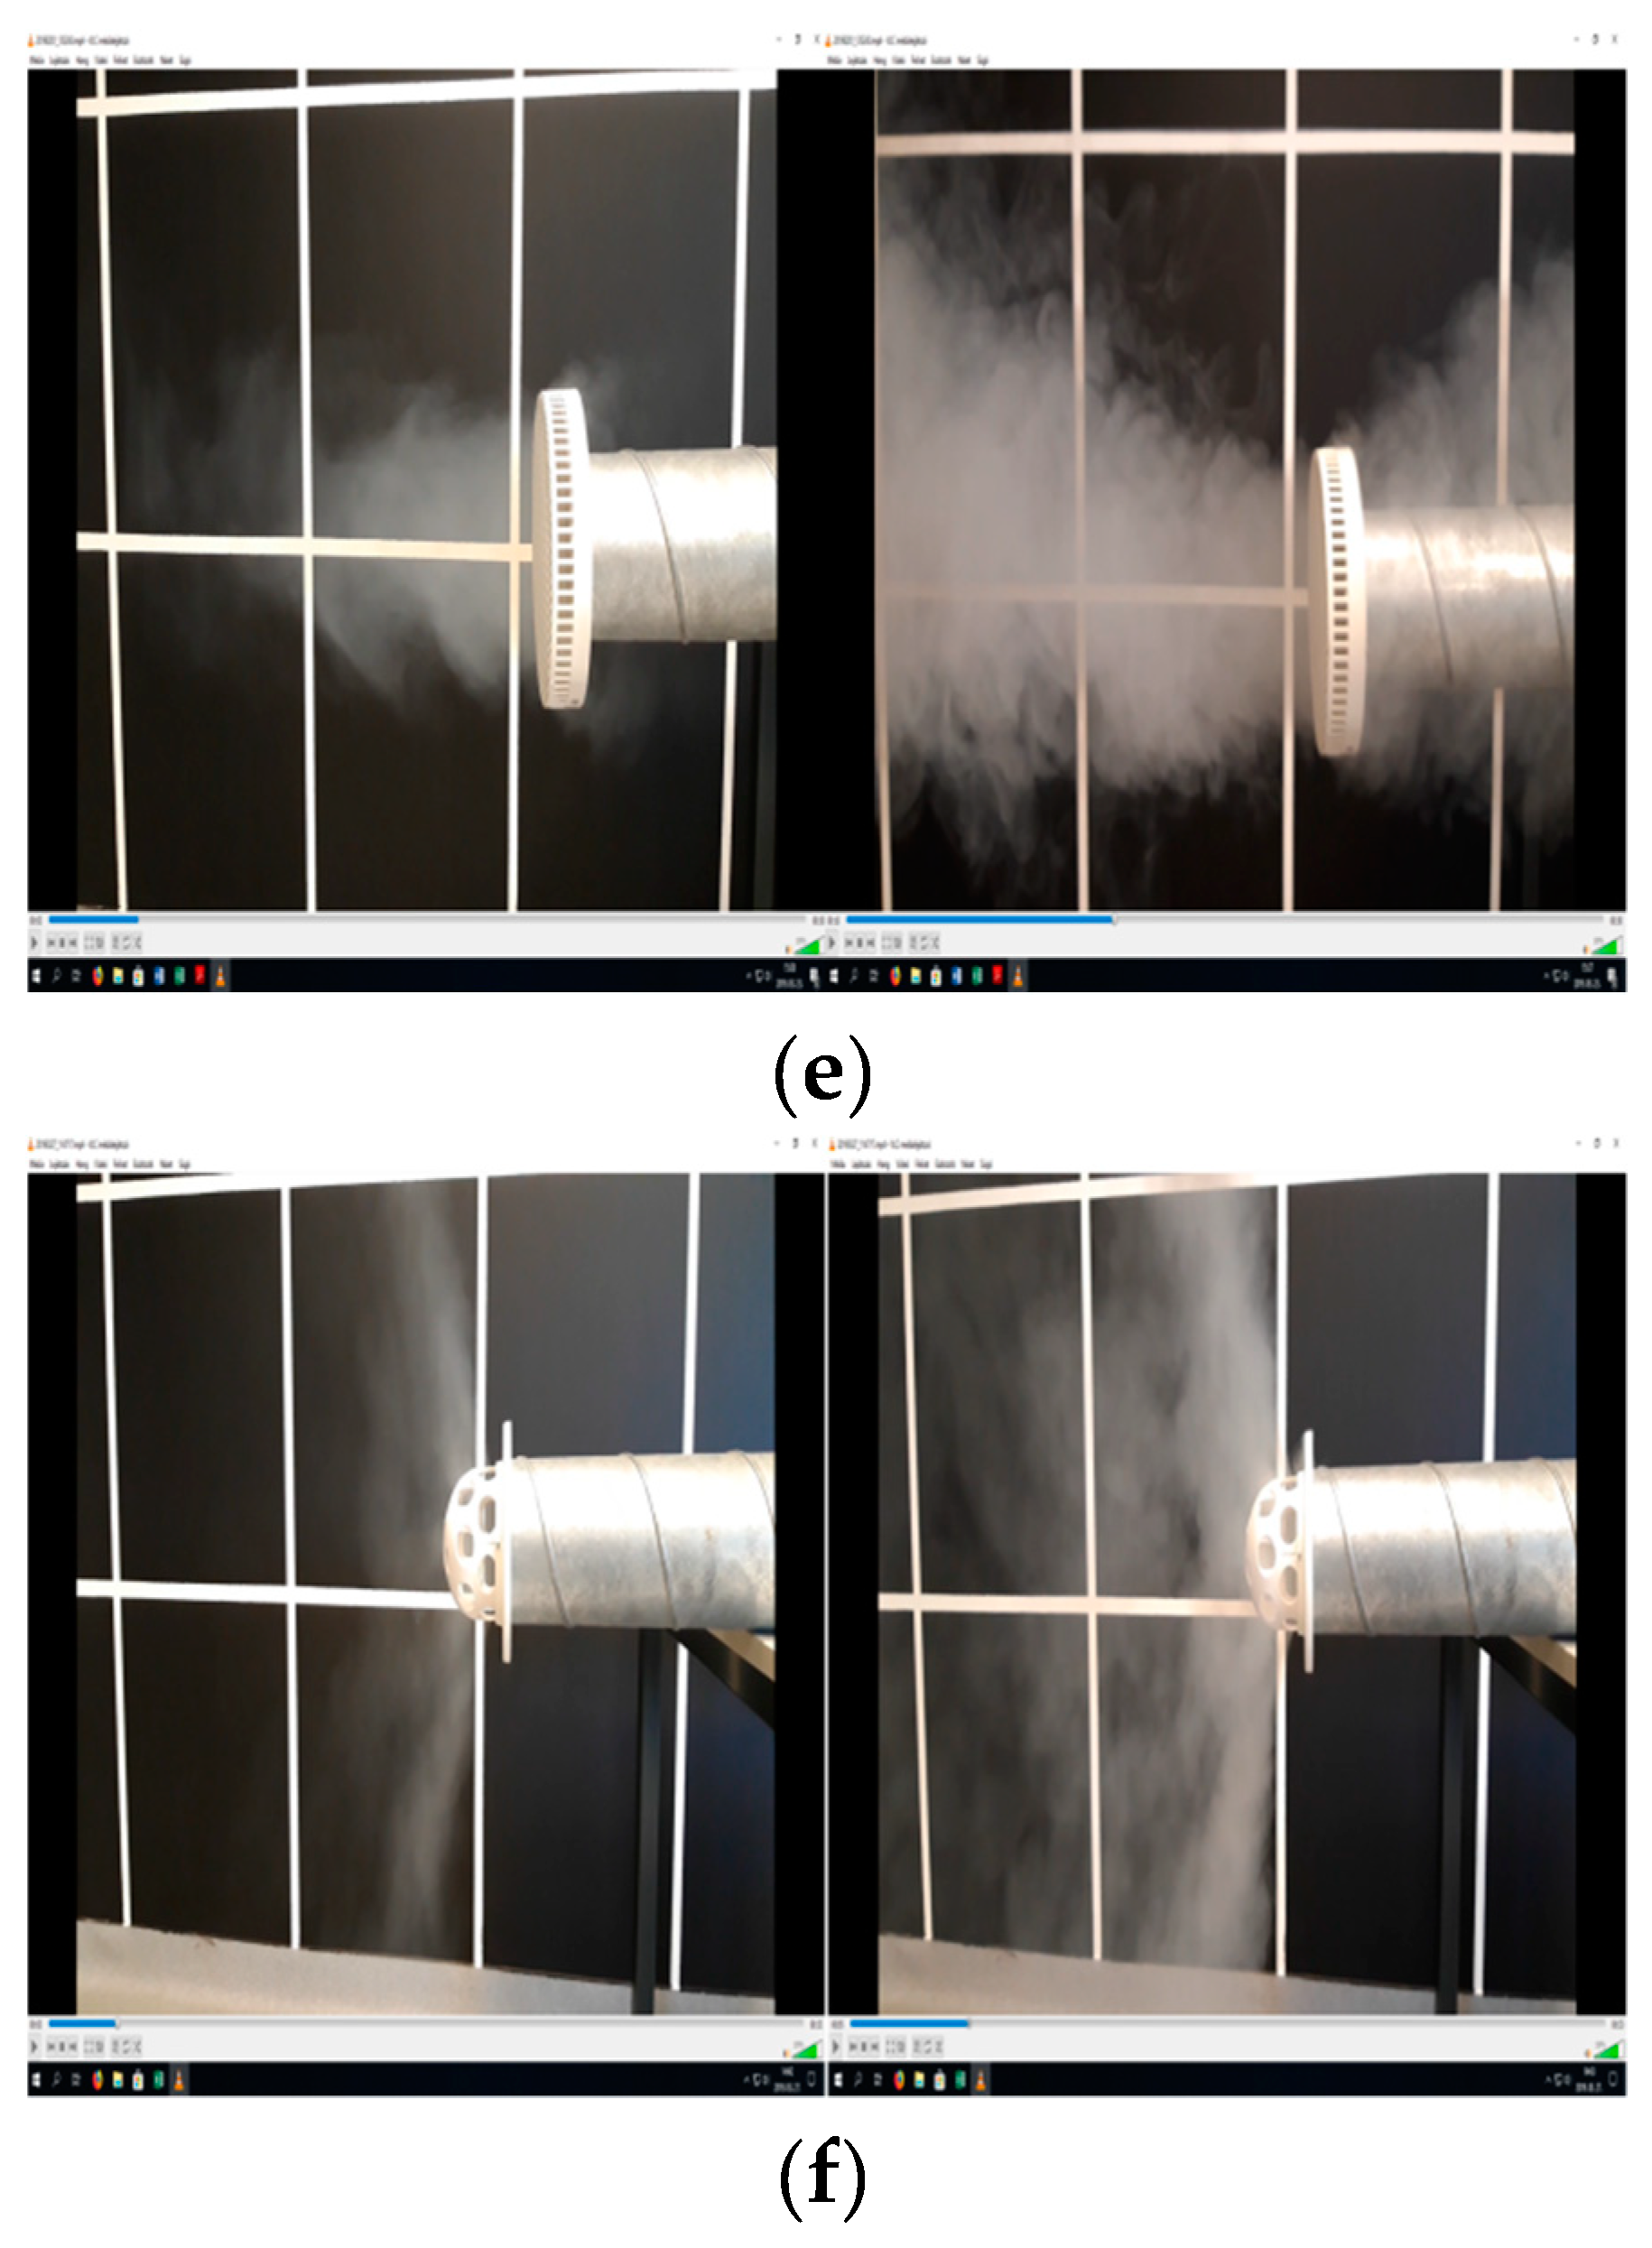
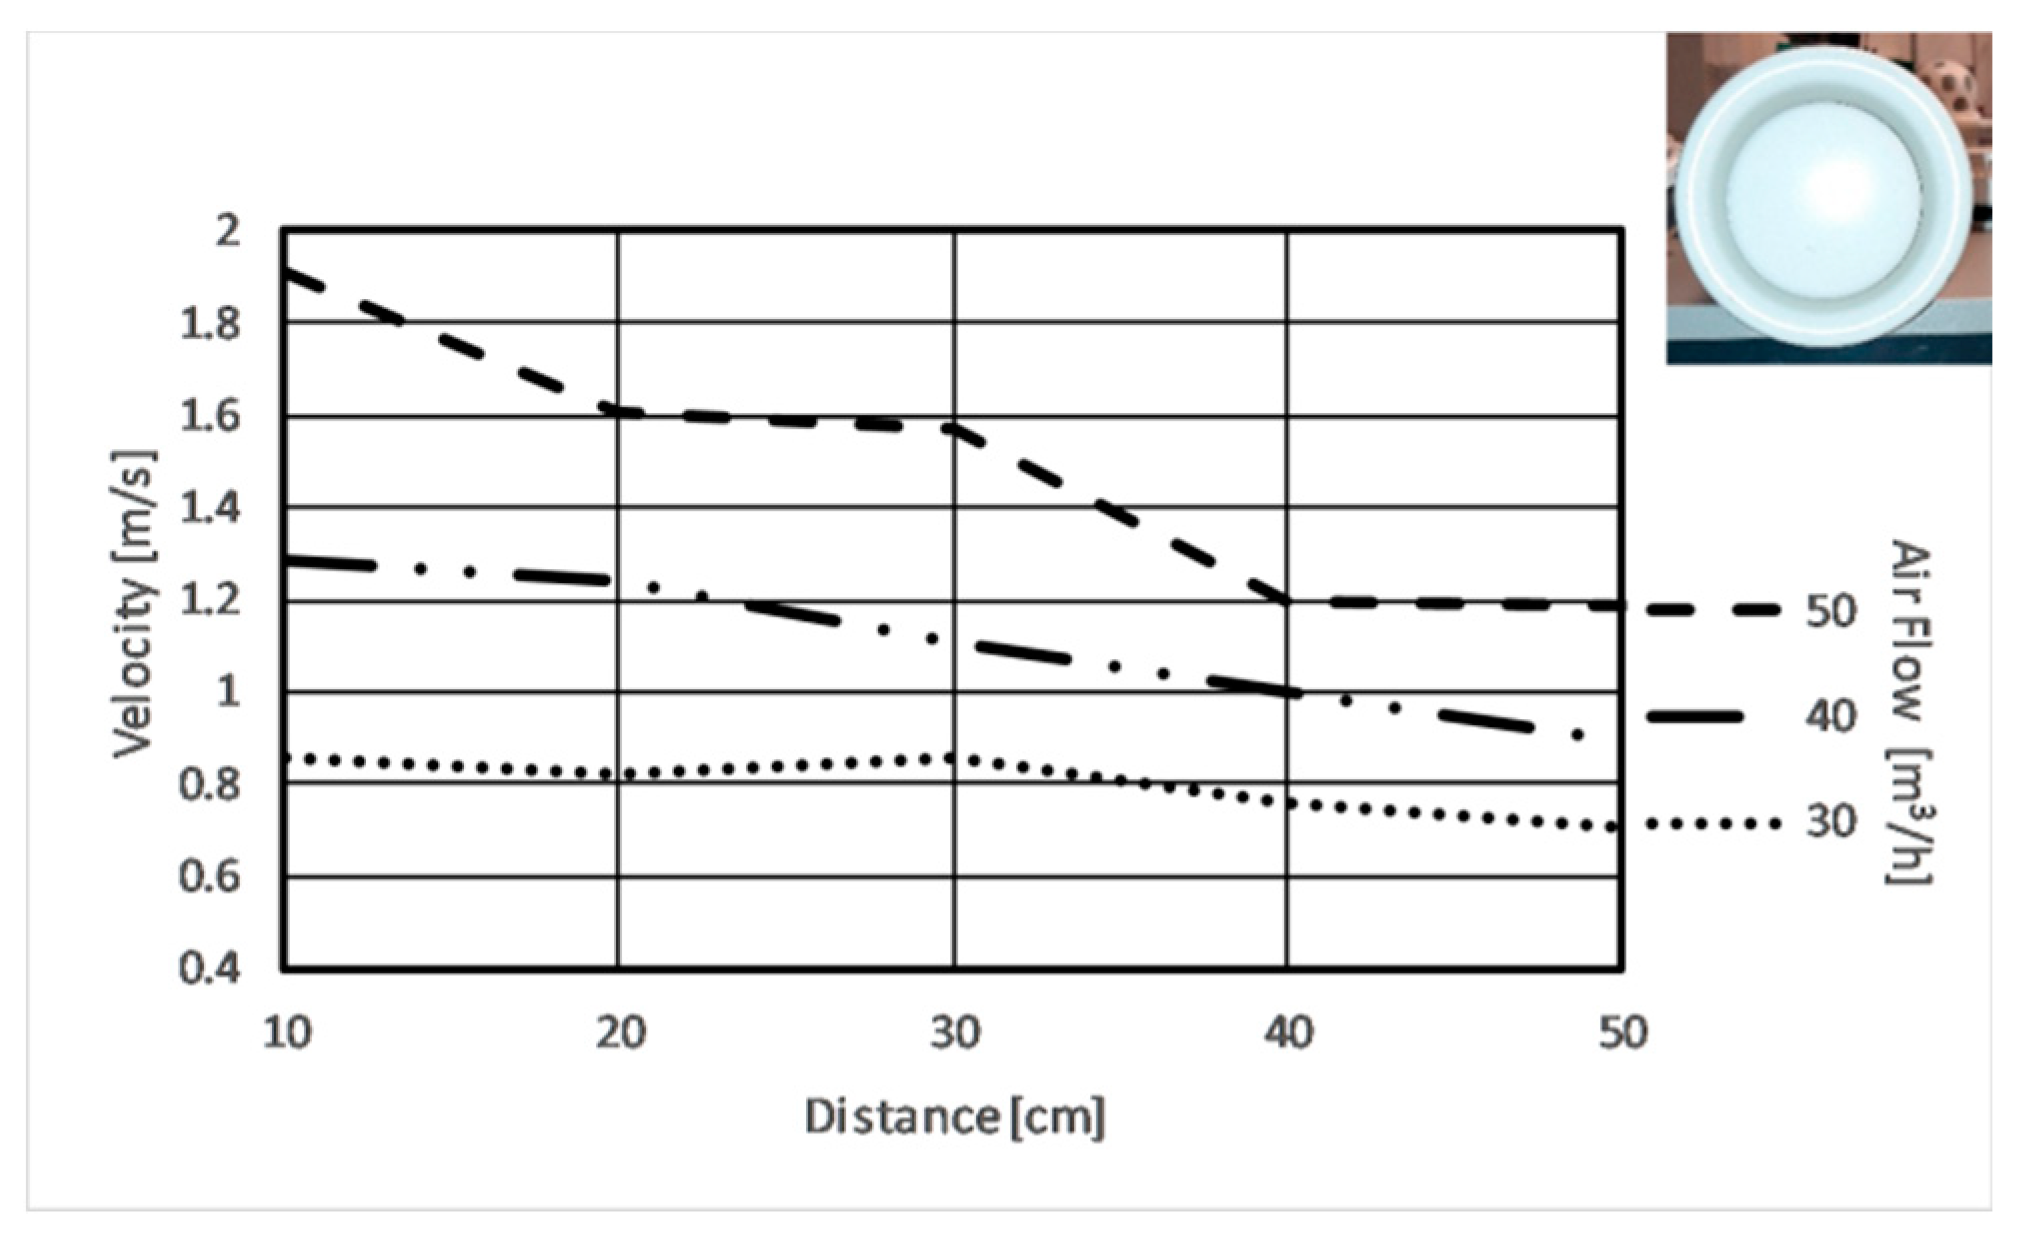
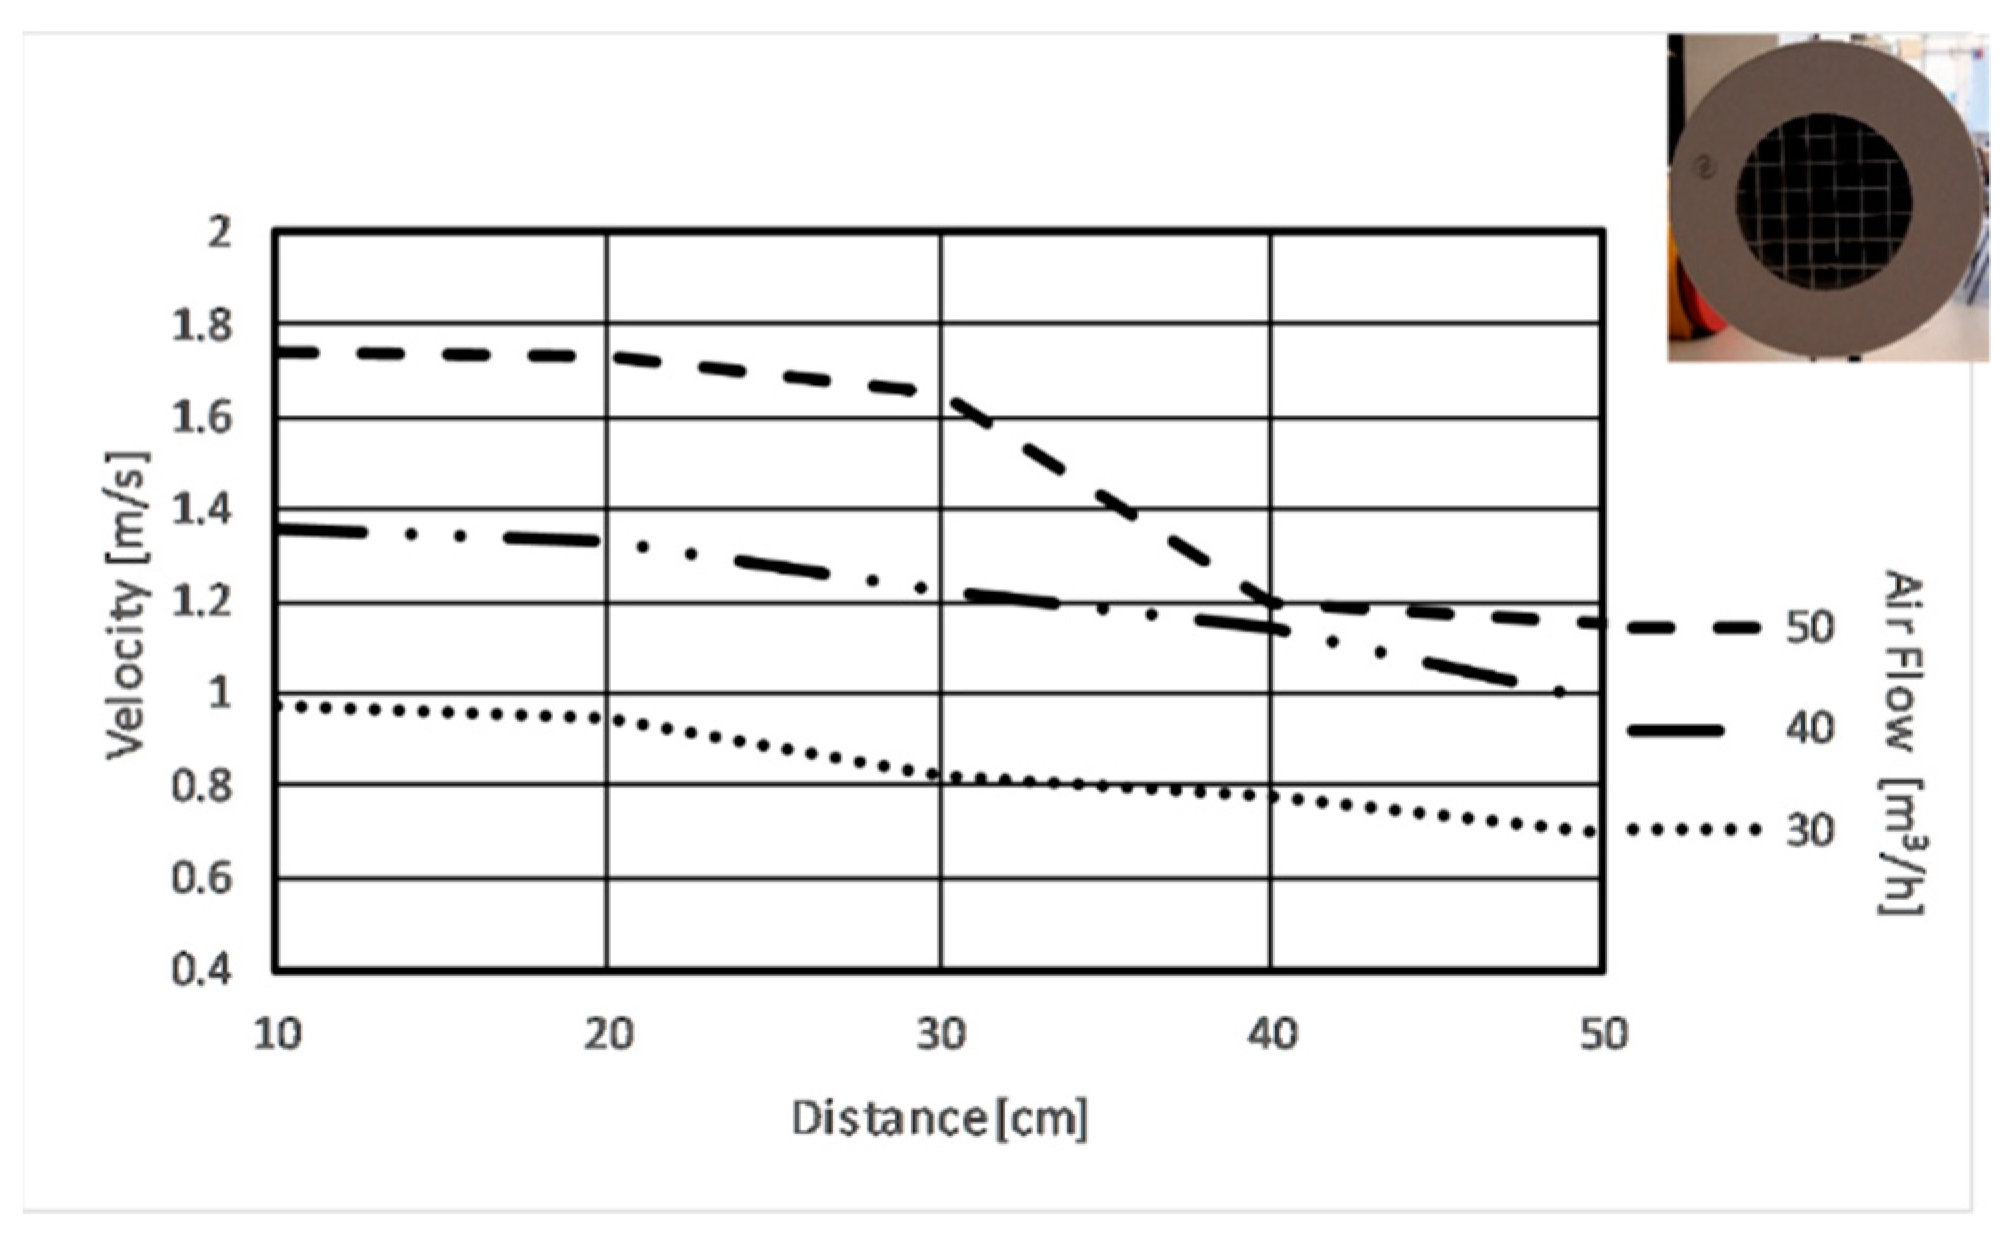
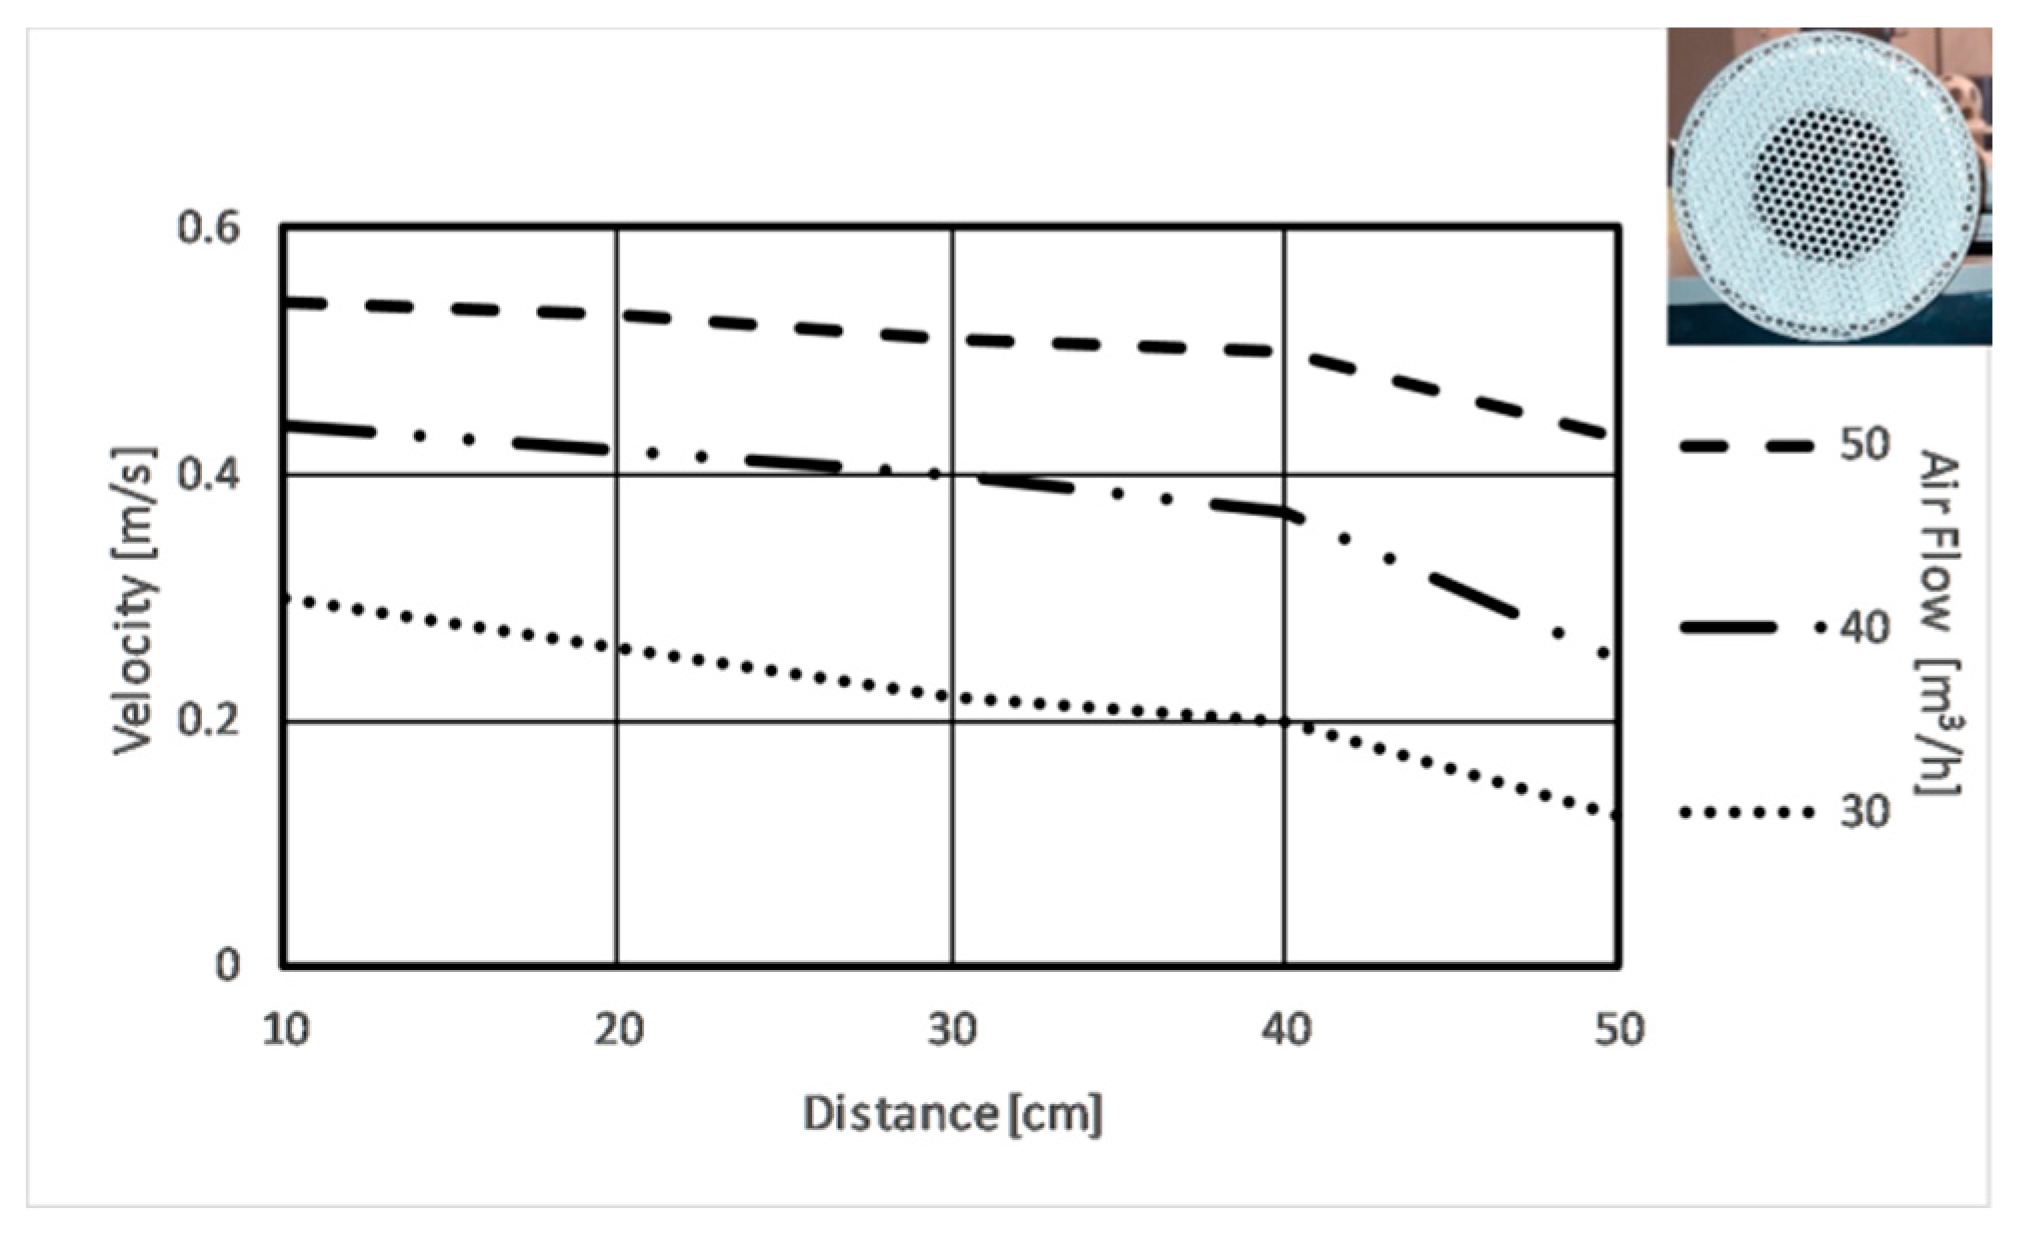
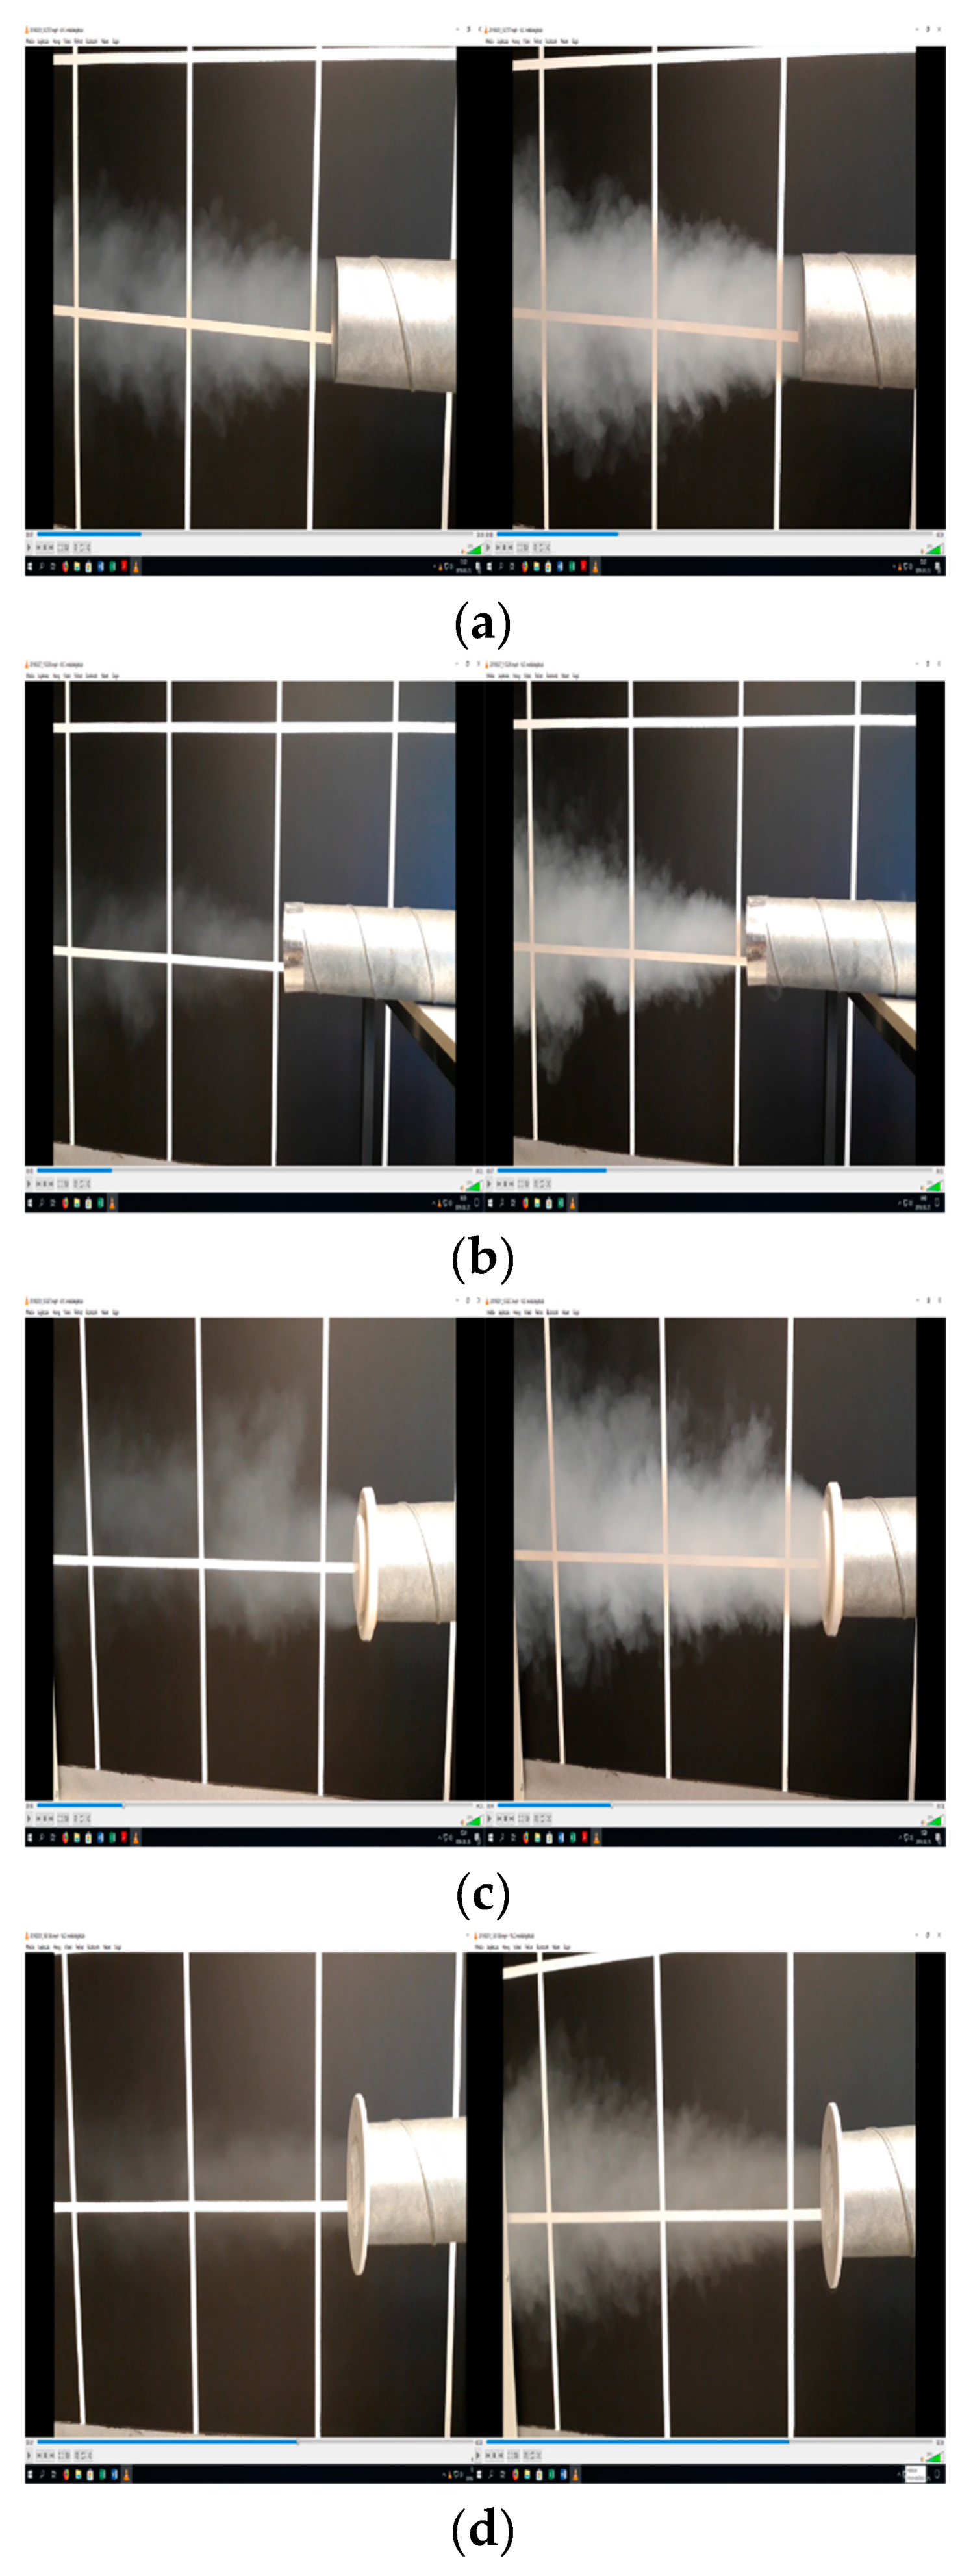
3. Analysis of Air Terminal Devices

In order to improve the air distribution around the occupant and reduce the risk of draught sensation, 11 different air terminal devices were tested. The main analyzed characteristics were the air jet profile, mean air velocity, and turbulence. Taking into account that the fresh air demand depends on the activity level, new testing equipment was built in order to perform measurements on a larger scale of the airflow. The equipment has a ∅160 duct fan with continuous speed control (Figure 2). The air duct diameter was reduced from 160 mm to 100 mm in order to provide the connection possibility for the air terminal devices.
The air velocities and the turbulence were measured with calibrated TESTO 480 instrument at 10, 20, 30, 40, and 50 cm from the ATD’s. According to the calibration certificate, the uncertainty of measured velocities is 0.02 m/s (coverage factor k = 2, 95% confidence). The airflow was set to 30, 40, and 50 m3/h. In Figure 3, the air velocities can be seen in the case of the simple air duct with a 100-mm diameter.
Analyzing the results obtained for 11 ATD’s, in light of our goals, only five gave acceptable results. The mean air velocities are presented in Figure 4, Figure 5, Figure 6, Figure 7 and Figure 8.
The mean turbulence intensities for these ATD types were: 7.52% (50 m3/h), 7.36% (40 m3/h), and 15.56% (30 m3/h). For the other six ATD’s, the turbulence was quite high: 68.04% (50 m3/h), 59.52% (40 m3/h), and 74.72% (30 m3/h). We decided to work with the air terminal devices, which provide low turbulence intensities.
For air flow visualization, smoke tests were carried out (50 m3/h air flow). The results are presented in Figure 9.
In the following, the SAR circular perforated ATD was used for experiments.

4. Energy Aspects of ALTAIR PV Equipment

The results of 2.0 h long measurements carried out in a closed space (ALTAIR in operation) with 30 °C air and mean radiant temperatures show that the actual mean vote of male subjects (age: 55.2 ± 3.6 year) was 0.78, while the actual mean vote of female subjects (age: 59.1 ± 3.0 year) was 0.52. The ventilated airflow was 20 m3/h and the air jet was isothermal. In comparison, providing 50 m3/h fresh air, with displacement ventilation, assuming activity: 1.2 met, clothing: 0.5 clo, and the PMV measured with TESTO 480 instrument was 1.44. With the ALTAIR PV system in operation, the air velocity was 0.48 m/s (the turbulence was Tu10 = 20.6% at 10-s time step of the air jet direction changing, Tu20 = 19.1% at 20-s time step and Tu30 = 18.8% at 30-s time step). The PMV measured with TESTO 480 instrument was 0.84. The air terminal device was an SAR perforated plastic circular element (D = 75 mm). The distance between ATD’s and occupants’ head was 0.6 m. The energy consumed by the ALTAIR’s fan during a one-hour operation was 12 Wh.
Assuming the occupant in the closed space includes 0.1 m/s air velocity (va), 50% relative humidity (RH), and 30 °C mean radiant temperature (MRT), the 0.78 and 0.52 actual mean votes could be obtained providing cool air in the room (Figure 10).
Assuming cooling with compressors (SEER = 3.6), the energy used in one hour will be 92 Wh and 64 Wh, respectively. It can be observed that important energy savings can be obtained using the ALTAIR PV equipment. However, to reduce as much as possible (or eliminate) the draught sensation and risk and to decrease the noise level, further research was carried out.

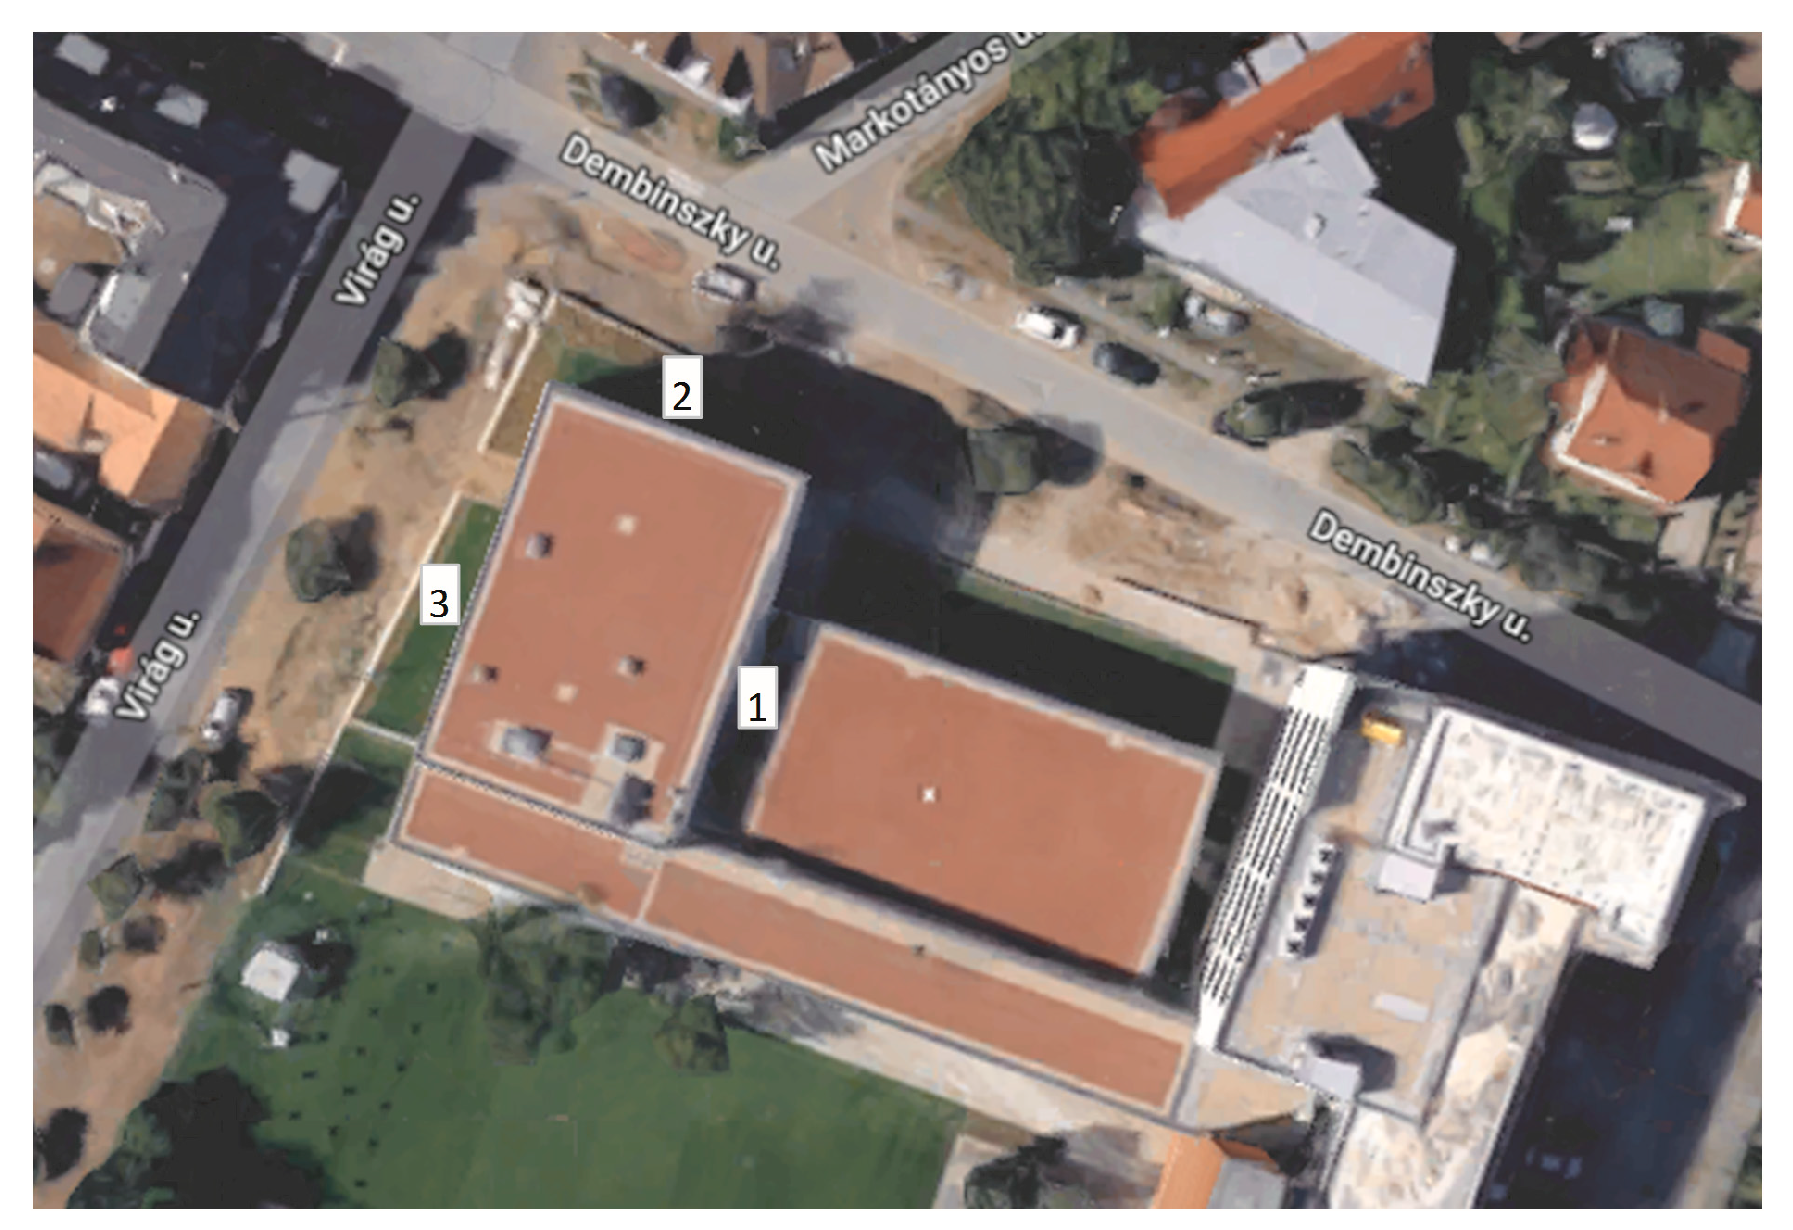
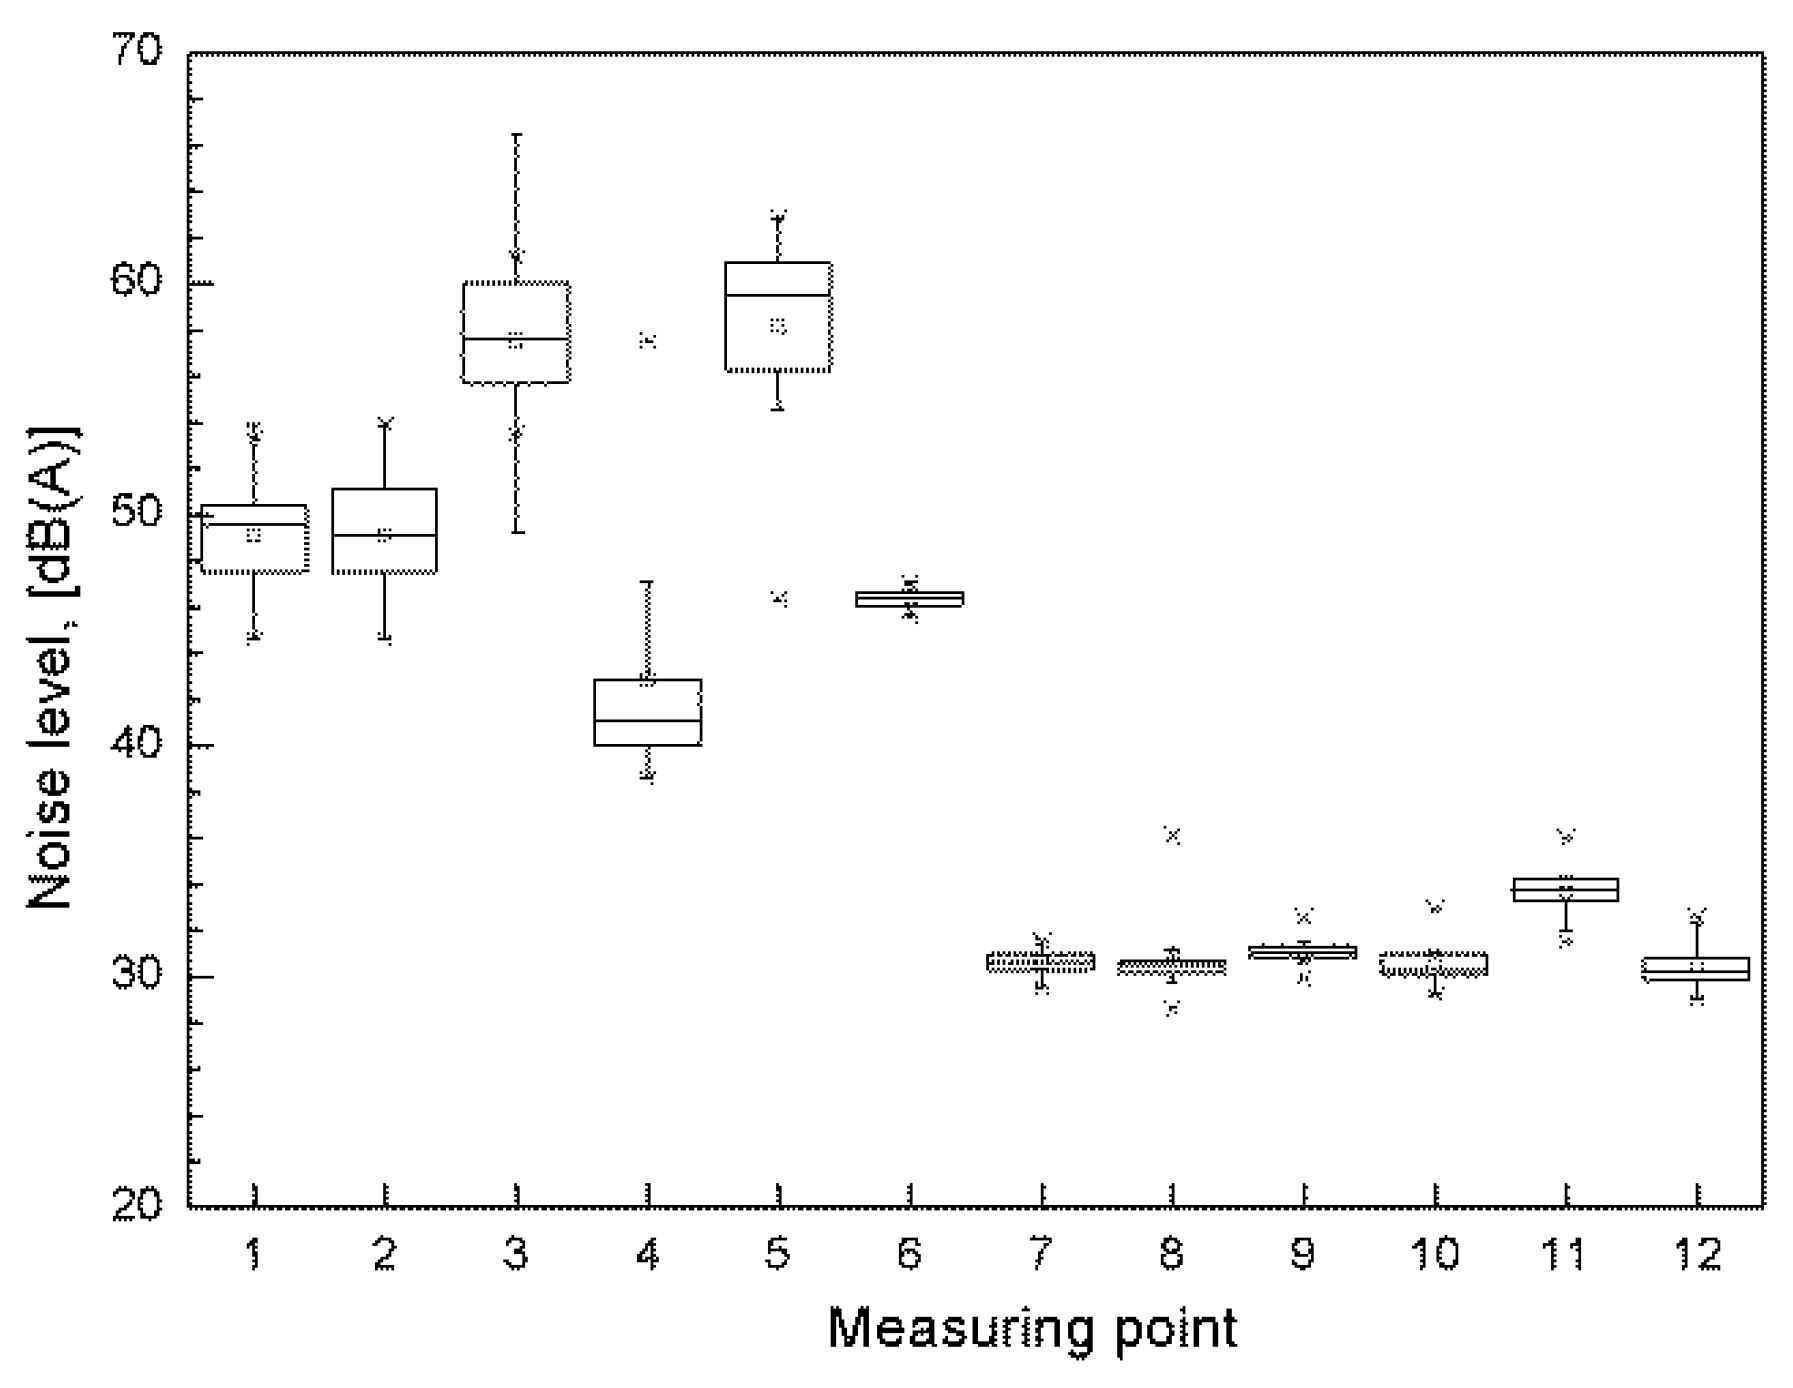
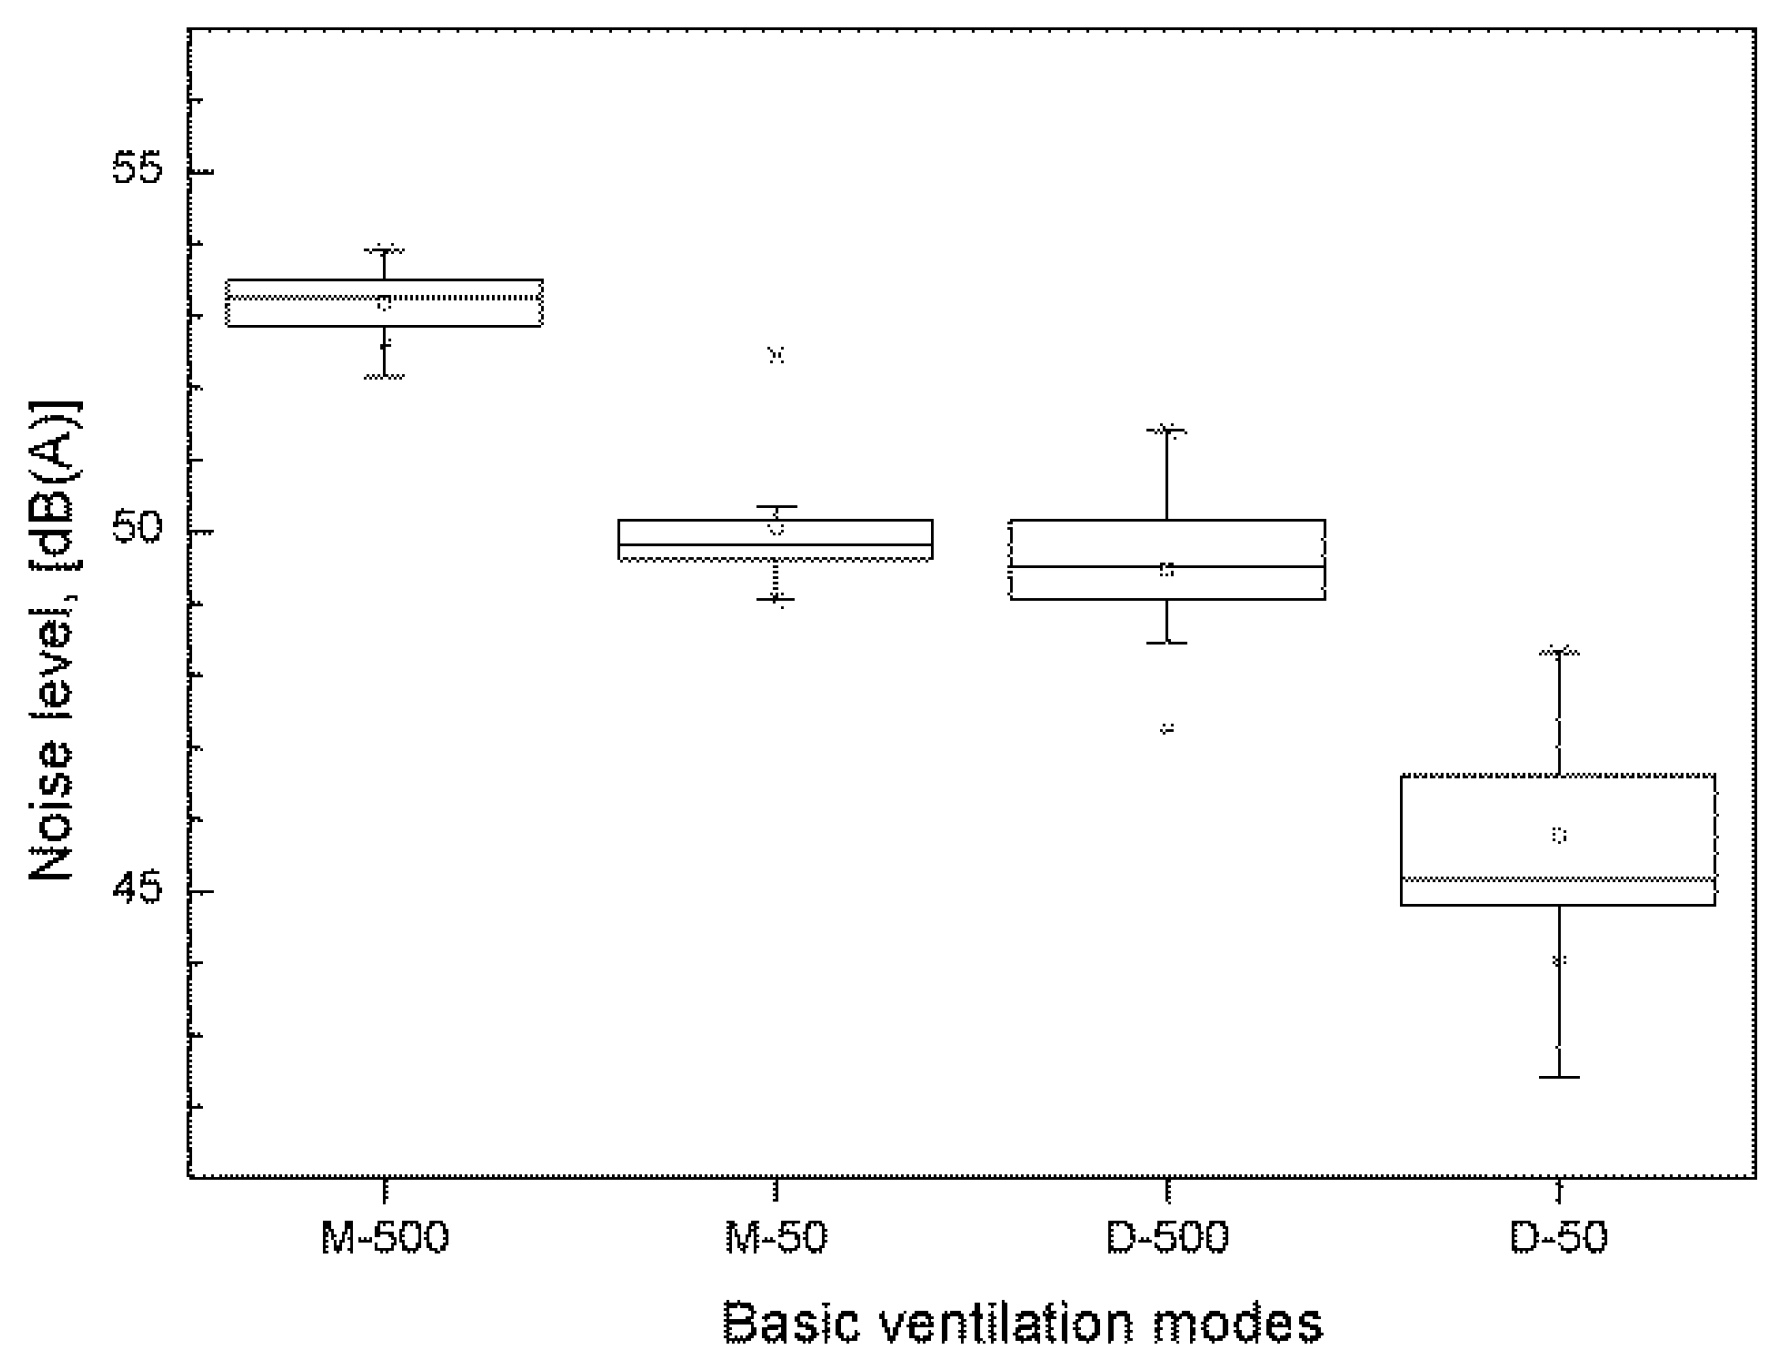
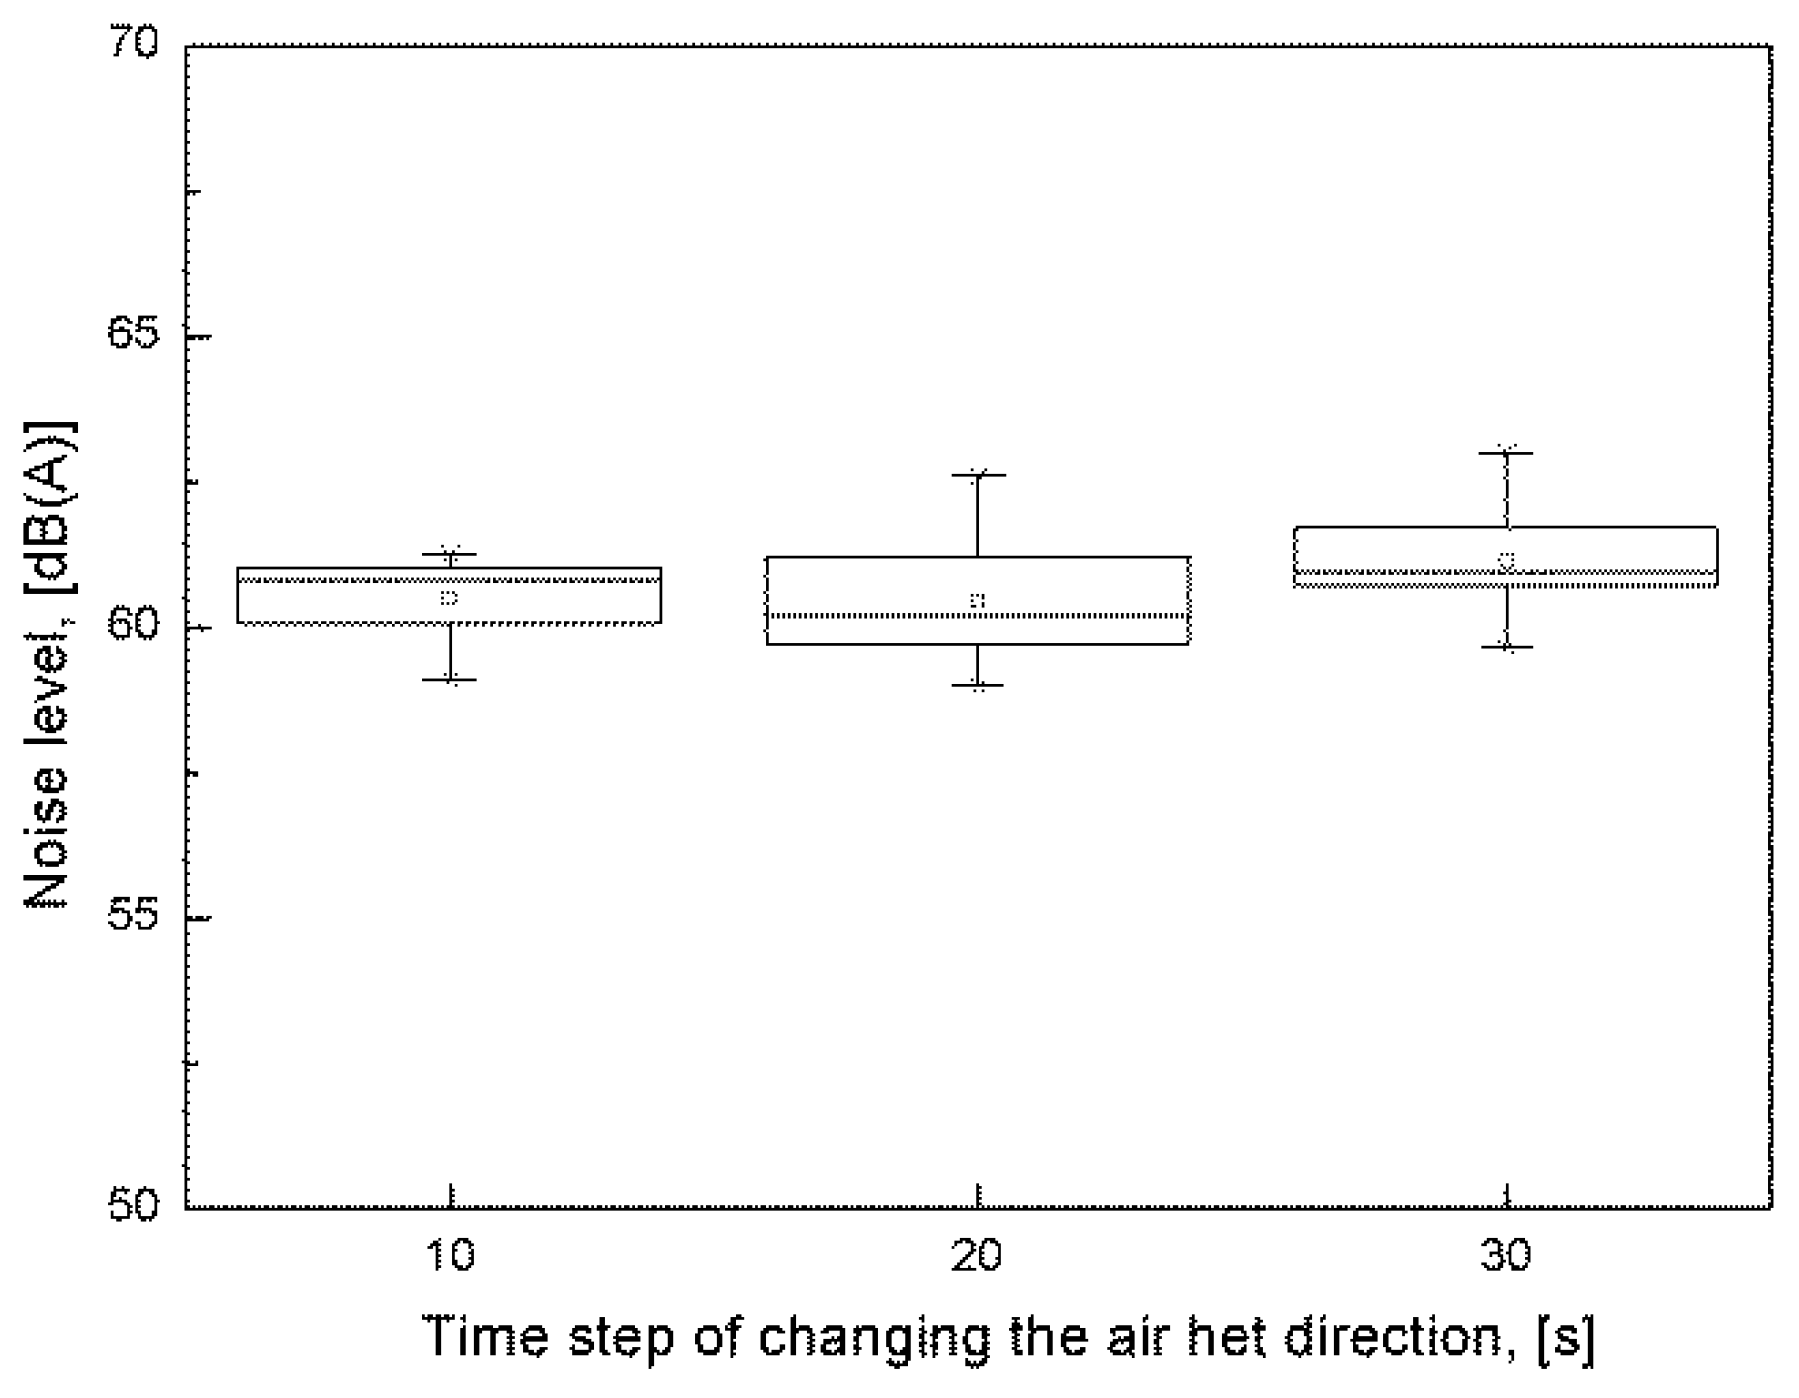
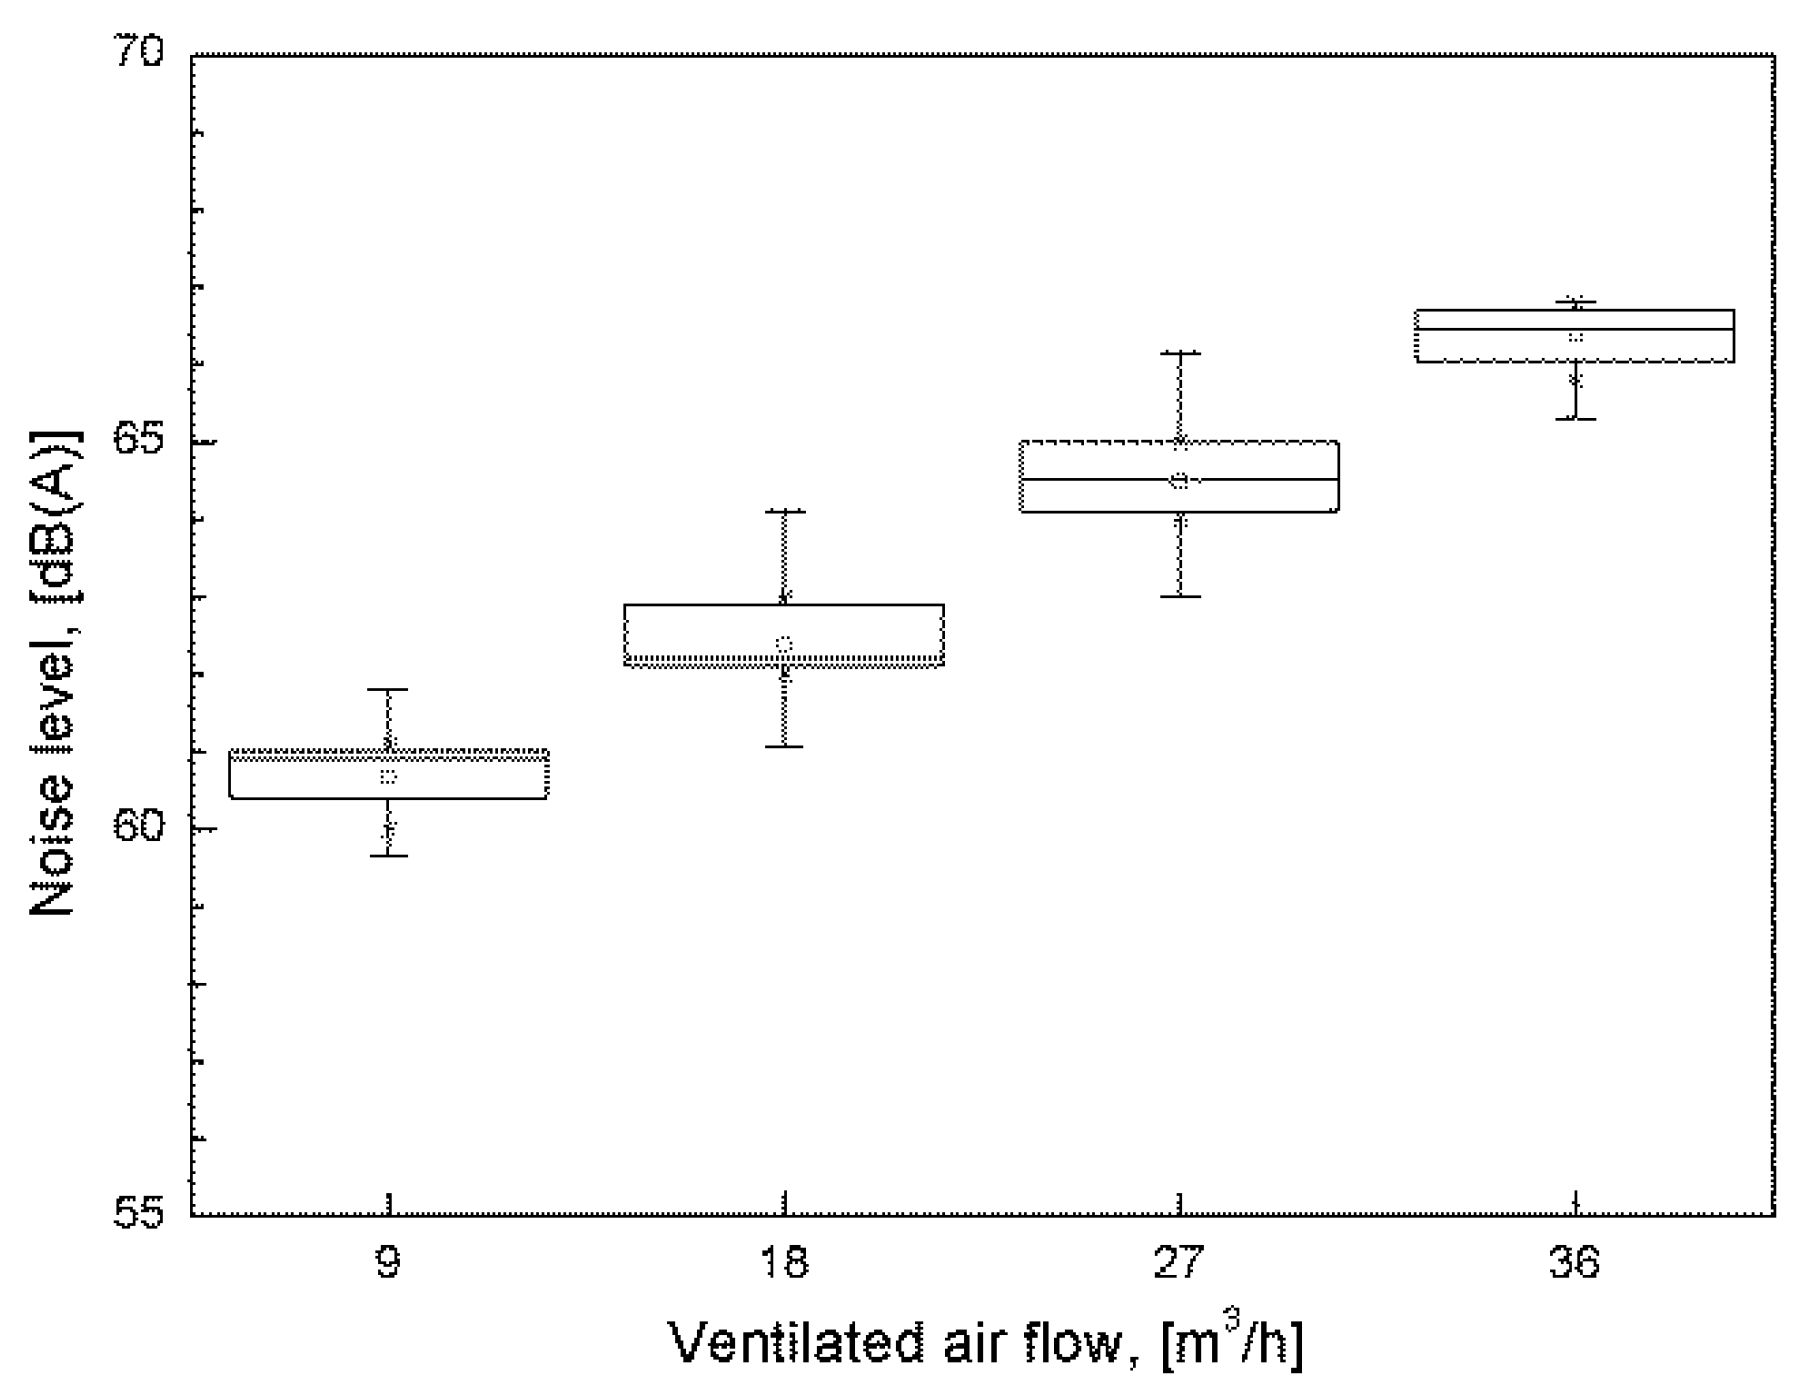
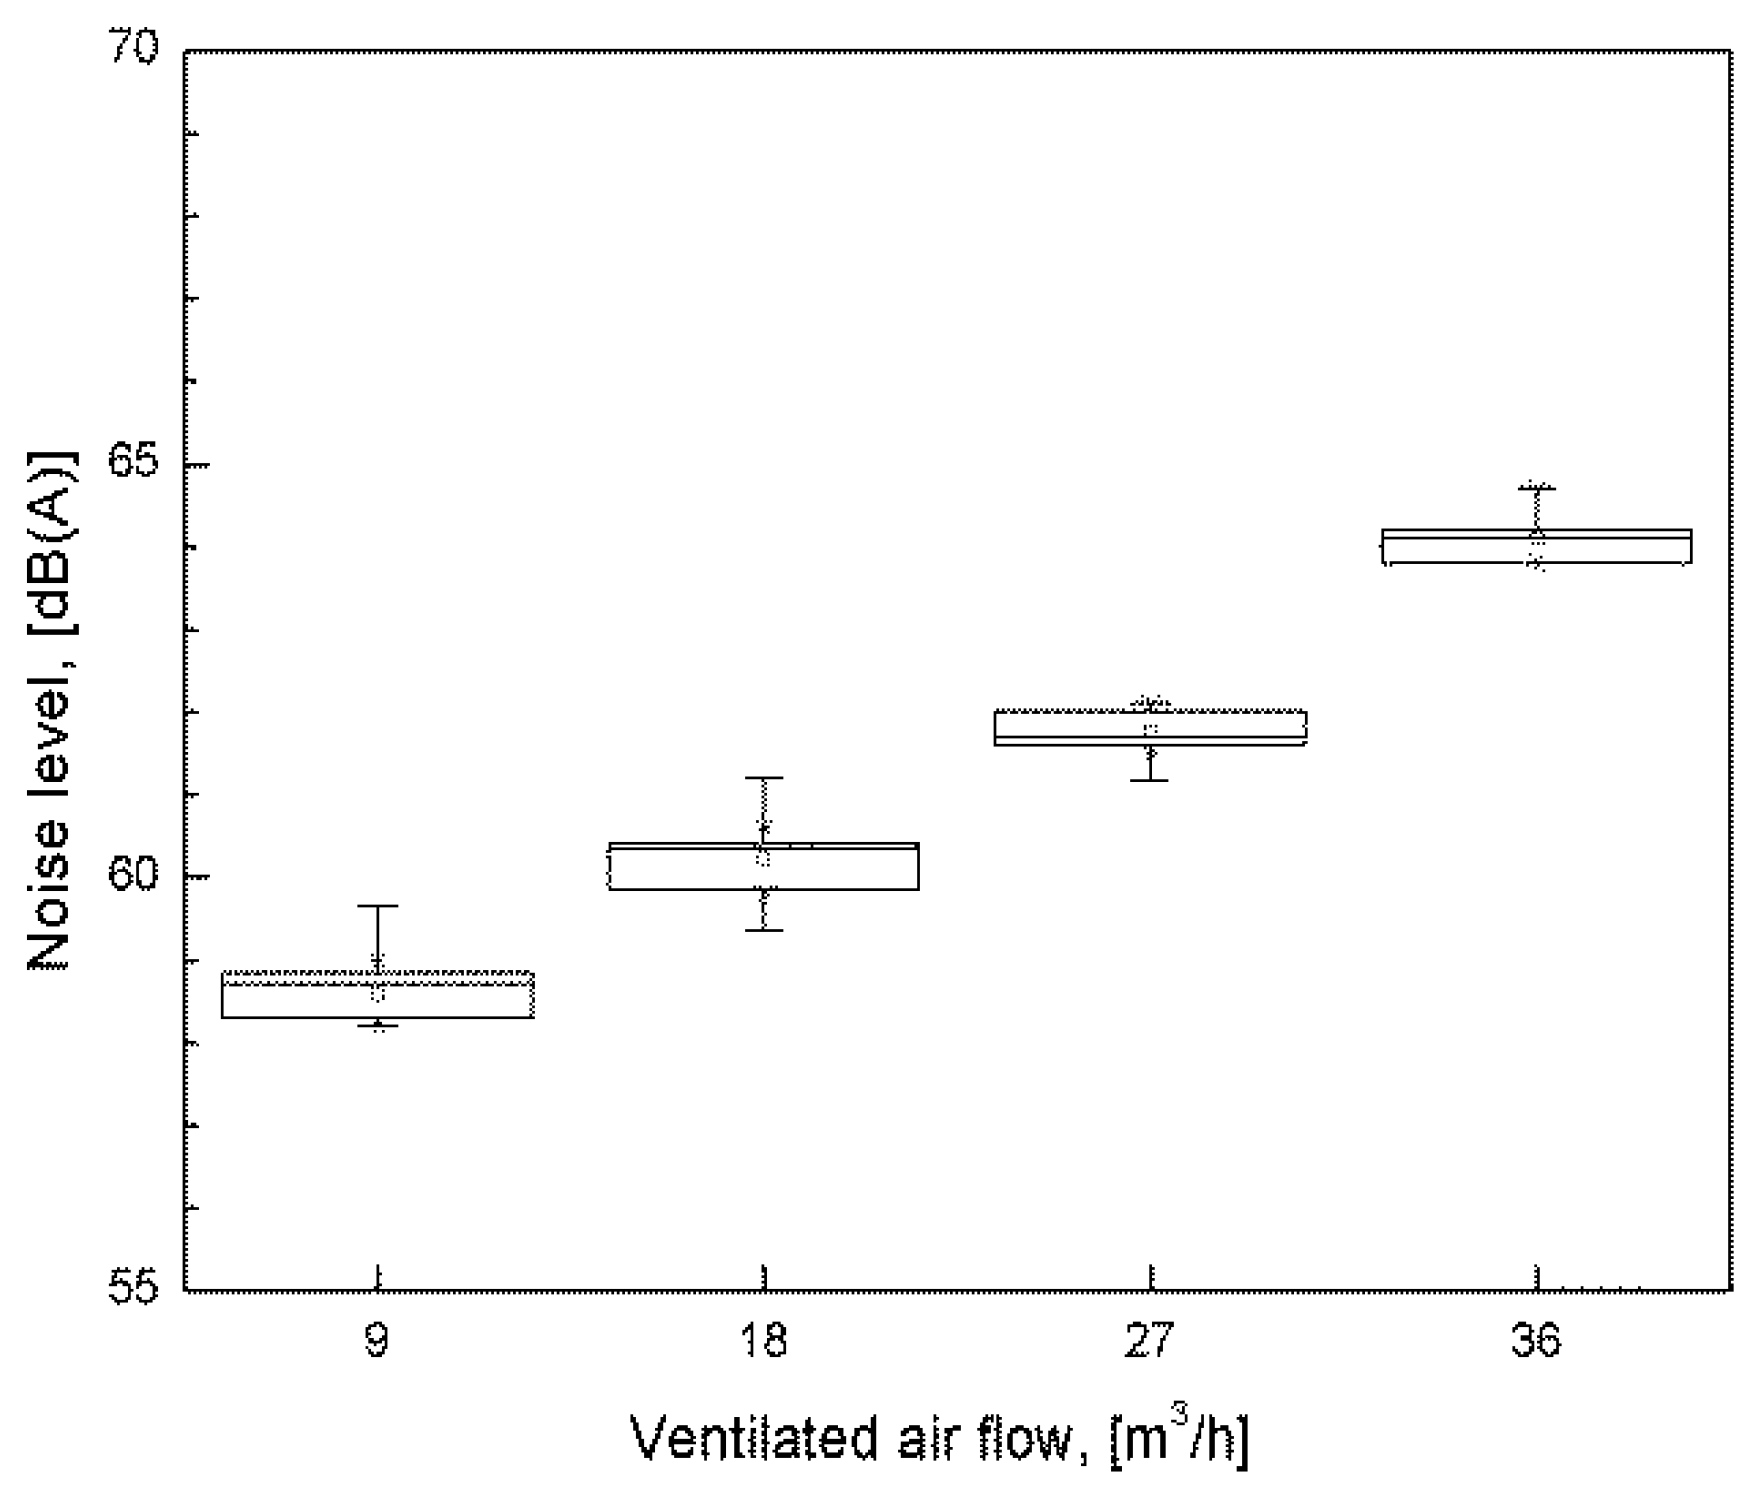
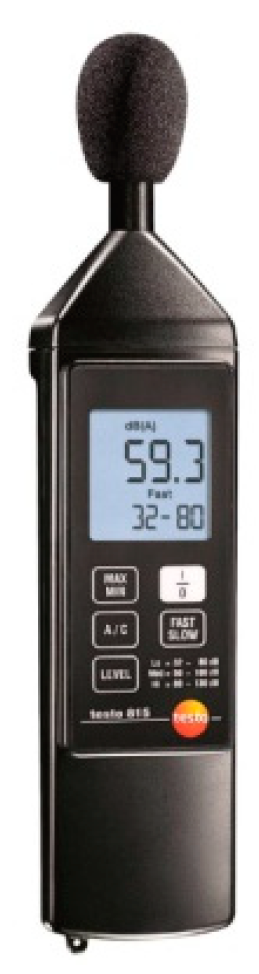
5. Noise Measurements

The laboratory building of the faculty of Engineering, University of Debrecen (Figure 11) has a reinforced frame structure and has two levels. The external walls are built from gas silicate blocks (36 cm) and are covered on the external side with 8-cm mineral wool.
The Indoor Environment Quality laboratory is placed at the second level. The height of the floor level is 6.8 m and the height of the second level is 4.5 m. The internal height of the 3.65 m × 2.5 m test room is 2.4 m and is placed in a climate chamber inside the building (Figure 12). Between the test room walls and climate chamber panels, there is a space with the same internal height as the test room has. The width of this space is 1.5 m. The climate chamber is built from 15-cm thick polyurethane panels.
The noise level was measured in three points outside the building (Figure 11), in the test room (point 12), and seven points around the test room (Figure 12).
To determine the noise levels, a calibrated TESTO 815 sound level meter was used (Figure 13). The measuring range is +32 to +130 dB and de accuracy is ±1.0 dB. The noise levels measured around the building, around the test room, and in the test room without any ventilation are presented in Figure 14. The duration of one measurement was 1.0 h. The data were gathered every 5.0 min.
It can be observed that, in the climate chamber, the noise level was about 32 to 35 dB(A). In the test room, the ventilation can be realized in mixing mode or displacement mode. The noise level was measured for both types of background ventilation for 50 m3/h ventilated airflow and 500 m3/h ventilated airflow (Figure 15).
During the measurements with ALTAIR in operation, the 50 m3/h displacement ventilation was chosen as background ventilation (D-50). This ventilation mode leads to 42 to 48 dB(A) noise levels in the test room. The ALTAIR PV system can be connected to the fresh air ducts or can blow on the occupant of the indoor air from the closed space. In the case of our measurements, the air source for ALTAIR PV system was the closed space. Furthermore, the occupant can choose the airflow rate and the time step of the changing air jet direction. It was decided to measure the noise levels at four different airflows: 9.0 m3/h, 18 m3/h, 27 m3/h, and 36 m3/h. The highest airflow is practically 10 l/s (often used in the indoor air quality standards). The time steps of changing the air jet directions were: 10 s, 20 s, and 30 s. The noise levels measured at different time steps for 9.0 m3/h airflow are presented in Figure 16.
By measuring different airflows, it was found that changing the time step of the air jet had no effect on the noise level. In the following information, the results for a 10-s time step are shown.
In Figure 17, it is observed that the air flow chosen at the ALTAIR PV system has an important effect on the noise level in the room. The noise level increases from 61 dB(A) to 66 dB(A), if the air flow is risen from 9 m3/h to 36 m3/h.
In order to reduce the noise level in the test room, an Audimin-DW-S sound absorber panel [33] was placed near the fan of the ALTAIR PV system. The measured noise levels are presented in Figure 18.

6. Discussion

The air blown on the chest and head of the occupant besides proper indoor air quality should provide slight cooling sensation without draught perception. After analyzing the air velocities and airflow distributions obtained for different air terminal devices with low turbulence intensities, it was stated that four might be used for the ALTAIR PV system: SAR circular perforated ATD, KV 100, E50/100, and TSP 100. Thermal comfort measurements were performed with SAR circular perforated ATD. In indoor environments with elevated air and mean radiant temperatures (30 °C), the actual mean votes were reduced from 1.44 to anywhere from 0.51 to 0.78. However, 20% to 30% of subjects felt draught (0.48 m/s air velocity and 20% turbulence). Even though the percentage of dissatisfied persons was lower (because at elevated air and mean radiant temperatures draught might improve the thermal comfort), new air terminal devices have to be tested and developed in the future. Practice has shown that the noise level of an air conditioner is about 60 dB(A) [34]. The displacement ventilation in the test room generates a 60 dB(A) – 61 dB(A) noise level. The noise level generated by the ALTAIR PV system with background displacement ventilation (50 m3/h) ranges from 61 dB(A) to 66 dB(A), depending on the air flow chosen by the occupant. Experiments show that these noise levels can be reduced with sound absorbers under 60 dB(A). However, the air distribution system of ALTAIR PV equipment has to be improved in order to further reduce the noise level.

7. Conclusions

The developed ALTAIR PV system improves the thermal comfort sensation of occupants in indoor environments with an elevated mean radiant and air temperatures. At the same time, important cooling energy can be saved in comparison with traditional cooling systems with mechanical compressors. By testing eleven different air terminal devices, it was proven that only five devices provide turbulence intensities below 20%. At elevated air velocities, the low turbulence is indispensable in order to avoid draught sensation. The obtained results show that, in order to obtain the optimal air velocity and flow distribution around the occupants, new air terminal devices have to be developed. Furthermore, special attention has to be paid to the air distribution system of the ALTAIR PV equipment in order to reduce the generated noise level.

8. Limitation

Measurements were performed in the laboratories of the Faculty of Engineering, University of Debrecen. The size of the test room, the building materials, and the surfaces of building elements of the test room as well as the type and location of air terminal devices of mixing and displacement ventilation were considered as given boundary conditions.

Author Contributions

Conceptualization, F.K. Methodology, T.K., I.C., and F.K. Investigation, I.C., T.K., and F.K. Resources, I.C. and F.K. Data curation, I.C. and T.K. Writing—original draft preparation, I.C., T.K., and F.K. Writing—review and editing, F.K. Visualization, I.C. and T.K. Supervision, F.K. Project administration, F.K.

Funding

The Higher Education Institutional Excellence Program of the Ministry of Human Capacities in Hungary, within the framework of the Energetics thematic program of the University of Debrecen, financed the research.

Conflicts of Interest

The authors declare no conflicts of interest.

References

  1. Directive 2010/31/EU of the European Parliament and of The Council of 19 May 2010 on the Energy Performance of Buildings. Available online: https://eur-lex.europa.eu/LexUriServ/LexUriServ.do?uri=OJ:L:2010:153:0013:0035:en:PDF (accessed on 18 March 2019).
  2. Ürge-Vorsatz, D.; Cabeza, L.F.; Serrano, S.; Barreneche, C.; Petrichenko, K. Heating and cooling energy trends and drivers in buildings. Renew. Sustain. Energy Review. 2015, 41, 85–98. [Google Scholar] [CrossRef]
  3. RECS International. Available online: http://www.recs.org/glossary/european-20-20-20-targets (accessed on 18 March 2019).
  4. Luterbacher, J.; Dietrich, D.; Xoplaki, E.; Grosjean, M.; Wanner, H. European seasonal and annual temperature variability, trends, and extremes since 1500. Science 2014, 303, 1499–1503. [Google Scholar] [CrossRef] [PubMed]
  5. Schar, C.; Vidale, P.L.; Lüthi, D.; Frei, C.; Haberli, C.; Liniger, M.A.; Appenzeller, C. The role of increasing temperature variability in European summer heatwaves. Nature 2004, 427, 332–336. [Google Scholar] [CrossRef] [PubMed]
  6. Isaac, M.; van Vuuren, D.P. Modeling global residential sector energy demand for heating and air conditioning in the context of climate change. Energy Policy 2009, 37, 507–521. [Google Scholar] [CrossRef]
  7. Levesque, A.; Pietzcker, R.C.; Baumstark, L.; De Stercke, S.; Grübler, A.; Luderer, G. How much energy will buildings consume in 2100? A global perspective within a scenario framework. Energy 2018, 148, 514–527. [Google Scholar] [CrossRef]
  8. Santamouris, M. Cooling the buildings – past, present and future. Energy Build. 2016, 128, 617–638. [Google Scholar] [CrossRef]
  9. Umberto, B.; Lakatos, Á. Thermal Bridges of Metal Fasteners for Aerogel-enhanced Blankets. Energy Build. 2019, 185, 307–315. [Google Scholar]
  10. Lakatos, Á. Stability investigations of the thermal insulating performance of aerogel blanket. Energy Build. 2019, 185, 103–111. [Google Scholar] [CrossRef]
  11. Thalfeldt, M.; Pikas, E.; Kurnitski, J.; Voll, H. Facade design principles for nearly zero energy buildings in a cold climate. Energy Build. 2013, 67, 309–321. [Google Scholar] [CrossRef]
  12. Kalmár, F. Interrelation between glazing and summer operative temperature in buildings. Int. Rev. Appl. Sci. Eng. 2016, 7, 53–62. [Google Scholar] [CrossRef]
  13. Kalmár, F. Summer operative temperatures in free running existing buildings with high glazed ratio of the facades. J. Build. Eng. 2016, 6, 236–242. [Google Scholar] [CrossRef]
  14. Jakubcionis, M.; Carlsson, J. Estimation of European Union residential sector space cooling potential. Energy Policy 2017, 101, 225–235. [Google Scholar] [CrossRef]
  15. Chan, W.R.; Nazaroff, W.W.; Price, P.N.; Sohn, M.D.; Gadgil, A.J. Analyzing a database of residential air leakage in the United States. Atmos. Environ. 2005, 39, 3445–3455. [Google Scholar] [CrossRef]
  16. d’Ambrosio Alfano, F.R.; Dell’Isola, M.; Ficco, G.; Tassini, F. Experimental analysis of air tightness in Mediterranean buildings using the fan pressurization method. Build. Environ. 2012, 53, 16–25. [Google Scholar] [CrossRef]
  17. Sinnott, D.; Dyer, M. Air-tightness field data for dwellings in Ireland. Build. Environ. 2012, 51, 269–275. [Google Scholar] [CrossRef]
  18. Zemitis, J.; Borodinecs, A.; Frolova, M. Measurements of moisture production caused by various sources. Energy Build. 2016, 127, 884–891. [Google Scholar] [CrossRef]
  19. Fanger, P.O. What is IAQ? Indoor Air 2006, 16, 328–334. [Google Scholar] [CrossRef]
  20. Baranova, D.; Sovetnikov, D.; Semashkina, D.; Borodinecs, A. Correlation of energy efficiency and thermal comfort depending on the ventilation strategy. Procedia Eng. 2017, 205, 503–510. [Google Scholar] [CrossRef]
  21. Cao, G.; Awbi, H.; Yao, R.; Fan, Y.; Sirén, K.; Kosonen, R.; Zhang, J. A review of the performance of different ventilation and airflow distribution systems in buildings. Build. Environ. 2014, 73, 171–186. [Google Scholar] [CrossRef]
  22. Melikov, A.K. Advanced air distribution: improving health and comfort while reducing energy use. Indoor Air 2016, 26, 112–124. [Google Scholar] [CrossRef]
  23. Kalmár, F. Innovative method and equipment for personalized ventilation. Indoor Air 2015, 25, 297–306. [Google Scholar] [CrossRef] [PubMed]
  24. Kalmár, F.; Kalmár, T. Alternative personalized ventilation. Energy Build. 2013, 65, 37–44. [Google Scholar] [CrossRef]
  25. Kalmár, F. An indoor environment evaluation by gender and age using an advanced personalized ventilation system. Build. Serv. Eng. Res. Technol. 2017, 38, 505–521. [Google Scholar] [CrossRef]
  26. Kalmár, F. Impact of elevated air velocity on subjective thermal comfort sensation under asymmetric radiation and variable airflow direction. J. Build. Phys. 2017, 42, 173–193. [Google Scholar] [CrossRef]
  27. Kalmár, F.; Kalmár, T. Study of human response in conditions of surface heating, asymmetric radiation and variable air jet direction. Energy Build. 2018, 179, 133–143. [Google Scholar] [CrossRef]
  28. Conceiçao, E.Z.E.; Lúcio, M.M.J.R.; Rosa, S.P.; Custódio, A.L.V.; Andrade, R.L.; Meira, M.J.P.A. Evaluation of comfort level in desks equipped with two personalized ventilation systems in slightly warm environments. Build. Environ. 2010, 45, 601–609. [Google Scholar] [CrossRef]
  29. Tham, K.W.; Pantelic, J. Performance evaluation of the coupling of a desktop personalized ventilation air terminal device and desk mounted fans. Build. Environ. 2010, 45, 1941–1950. [Google Scholar] [CrossRef]
  30. Melikov, A.K.; Cermak, R.; Majer, M. Personalized ventilation: evaluation of different air terminal devices. Energy Build. 2002, 34, 829–836. [Google Scholar] [CrossRef]
  31. Kjellberg, A. Subjective, behavioral and psychophysiological effects of noise. Scand. J. Work Environ. Health 1990, 16, 29–38. [Google Scholar] [CrossRef]
  32. Barclay, M.; Kang, J.; Sharples, S. Combining noise mapping and ventilation performance for non-domestic buildings in an urban area. Build. Environ. 2012, 52, 68–76. [Google Scholar] [CrossRef]
  33. Schako. Available online: http://audimin.schako.cz/Audimin.pdf (accessed on 18 March 2019).
  34. Noise Help. Available online: https://www.noisehelp.com/noise-level-chart.html (accessed on 18 March 2019).
Figure 1. ALTAIR PV equipment.
Energies 12 01596 g001
Figure 2. Testing equipment for air terminal devices.
Energies 12 01596 g002
Figure 3. Mean air velocities in the case of D = 100 mm air duct.
Energies 12 01596 g003
Figure 4. Mean air velocities in the case of the SAR circular perforated ATD.
Energies 12 01596 g004
Figure 5. Mean air velocities in the case KV 100 type ATD.
Energies 12 01596 g005
Figure 6. Mean air velocities in the case of E50/100 type ATD.
Energies 12 01596 g006
Figure 7. Mean air velocities in the case of TSP 100 type ATD.
Energies 12 01596 g007
Figure 8. Mean air velocities in the case of closed ZMD type ATD.
Energies 12 01596 g008
Figure 9. Visualization of air flow with smoke tests: (a) D = 100 mm air duct. (b) SAR circular perforated ATD, (c) KV 100, (d) E50/100, (e) TSP 100, and (f) closed ZMD type ATD.
Energies 12 01596 g009aEnergies 12 01596 g009b
Figure 10. PMV depending on the air temperature(MRT = 30 °C. RH = 50%. va = 0.1 m/s).
Energies 12 01596 g010
Figure 11. Measuring points outside the building (Source: https://www.google.com/maps/place/Debrecen).
Energies 12 01596 g011
Figure 12. Schema of the Indoor Environment Quality laboratory, University of Debrecen.
Energies 12 01596 g012
Figure 13. Testo 815 sound level meter.
Energies 12 01596 g013
Figure 14. Basic measurements.
Energies 12 01596 g014
Figure 15. Noise levels in the test room (with background ventilation).
Energies 12 01596 g015
Figure 16. Noise levels in the test room (with background ventilation and ALTAIR in operation – 9.0 m3/h).
Energies 12 01596 g016
Figure 17. Noise levels in the test room (with background ventilation and ALTAIR in operation – 10 s time step).
Energies 12 01596 g017
Figure 18. Noise levels in the test room (with background ventilation, ALTAIR with sound absorber – 10 s time step).
Energies 12 01596 g018

