Abstract
In this work, we provide a cost comparison of micro-photosynthetic power cells (µPSC) with the well-established photovoltaic (PV) cells for ultra-low power and low power applications. We also suggest avenues for the performance improvement of µPSC. To perform cost comparison, we considered two case studies, which are development of energy systems for: (i) A typical mobile-phone battery charging (low power application) and (ii) powering a humidity sensor (ultra-low power application). For both the cases, we have elucidated the steps in designing energy systems based on PV and µPSC technologies. Based on the design, we have considered the components needed and their costs to obtain total cost for developing energy systems using both PV and µPSC technologies. Currently, µPSCs based energy systems are costlier compared to their PV counterparts. We have provided the avenues for improving µPSC performance, niche application areas, and aspects in which µPSCs are comparable to PV cells. With a huge potential to develop low-cost and high performing technologies, this emerging technology can share the demand on PV technologies for ultra-low power applications.
1. Introduction
With the advent of Internet of Things (IoT), wireless sensors and their networks became more prevalent [1]. Importance of self-sustained sensors that can function using the energy harvested from the renewable energy resources is ubiquitous for IoT applications [2]. Micro photosynthetic power cell (µPSC) is one of such energy harvesting technologies that has been gaining interest in recent years. µ-PSCs were first developed by the Chiao M et al and Siu, C.P.B et al. [3,4], as a potential power source for low power and ultra-low power applications. The typical µPSC can generate an open circuit voltage (OCV) in the range of 100–900 mV and current density in the order of 100s of µA/cm2. Typical power produced by a µPSC varies in the range of 10–100 mW [3,5,6,7,8,9]. Power density values of µPSC have witnessed an increase of approximately two orders of magnitude since their origin [10]. Figure 1 shows the potential applications of µPSCs for IoT sensors.
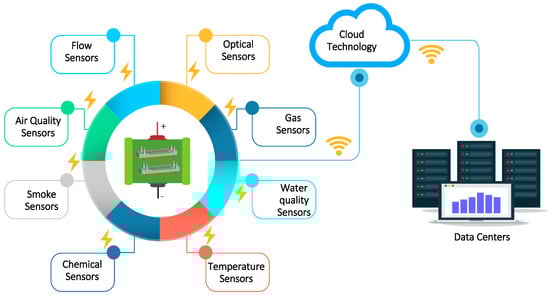
Figure 1.
Micro-photosynthetic power cell powering the Internet of Things (IoT) sensors.
The improvement in the performance of µPSC technology is promising and several studies have already demonstrated the use of µPSC technology for several practical applications [2,11,12]. Currently, the research focus is on the development of lower cost and better performing µPSCs. A very recent article by Tanneru [10] provides a brief history and state of the art of µPSC technology. Mathematical modeling as a tool to understand the performance improvement possibilities by design optimization has also been attempted [13,14,15,16].
In this work, we are attempting to compare the µPSC technology with the PV to understand where the former stands with respect to the later in terms of cost and performance. We have considered two case studies to perform cost analysis of µPSC technology with respect to PV technology. We have organized this paper as follows. Section 2 introduces PV technology and µPSCs working by considering a dual chamber µPSC as developed by [6,7]. Section 3 presents the case studies: (i) development of an energy system for mobile-phone battery charging (low power application) and (ii) development of an energy system for humidity sensor (ultra-low power application). Section 4 provides a discussion on cost of µPSC technology and avenues for performance enhancement. In Section 5, we have summarized the results and provided the conclusions.
2. Photovoltaic Cells (PV) and µPSC
2.1. Photovoltaic Cells
PV are one of the important and most widely used solar energy harvesting devices. The solar panels of different ratings (low, high, and very high) are available in the market for all possible applications. To understand the basics on working of PV, we redirect the reader to the following excellent resources [17,18].
2.2. Micro Photosynthetic Power Cells
µPSC is one of the emerging technologies for the low and ultra-low power energy harvesting applications. One niche advantage of μPSC is their ability to generate power both in light and dark conditions. Researchers [3,6,7] have proposed several designs of µPSCs. In this work, we have considered the dual chamber μPSC developed by Shaparnia et al. [6] and Arivind et al. [7].
A µPSC consists of the anode and the cathode chambers, and membrane electrode assembly (MEA) sandwiched between them. The anode chamber consists of photosynthetic microorganisms such as cyanobacteria blue-green algae, which releases electrons during both photosynthesis and respiration processes. An electron mediator in the anode chamber diffuses into algae, siphons the electrons and protons from electron transport chains of photosynthesis respiration, and transfers them to the anode surface through the reduction and oxidation processes. The released electrons travel through an external resistance generating electricity from the µ-PSC. The membrane electrode assembly (MEA) separates the anode and cathode chambers. Furthermore, the proton exchange membrane in MEA blocks the electrons and only allows protons to pass through it. At the cathode surface, the catholyte accepts the electrons and forms reduced catholyte. The diffused protons across the proton exchange membrane combine with oxygen and electrons to regenerate catholyte and release water in the cathode chamber. The chemical equations of photosynthesis and respiration are given below.
Photosynthesis
Respiration
The working principle of the µPSC is presented in the Figure 2.
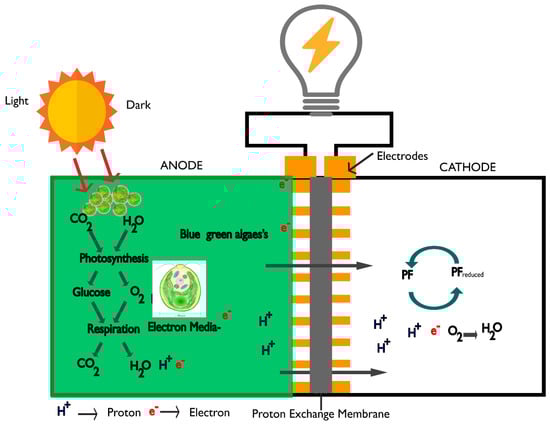
Figure 2.
Working principle of the micro-photosynthetic power cells (µ-PSC).
For details on fabrication of the chip readers can refer to the publications, Shaparnia et al. [6] and Ramanan et al. [7].
In 1985, Tanaka et al. [19] utilized Cyanobacterium Anabaena as the photosynthetic agent and HNQ (2-hydroxy-l,4-naphthoquinone) as the redox mediator. In 1993, T. Yagishita et al. [20] performed tests with various microorganisms in different PSCs in which they used 2-hydroxy-1,4-naphthoquinone (HNQ) as the mediator. An open circuit voltage of 800 mV and a current density of 320 μA/cm2 were reported. Conversion efficiencies were reported to vary from 0.2% to 3.3% when PSCs were tested in the cycles of dark and light respectively [20]. From 1997 to 1999, T. Yagishita et al. [20,21] studied the influence of the concentration of the micro-organism, the effect of light intensity and glucose addition on the performance of PSCs.
In one of the recent publications in 2006, Chiao et al. [3] used bulk silicon micromachining technology for fabricating the compartments of the µPSC. Two different micro-organisms—baker’s yeast (Saccharomyces Cerevisiae) and blue-green algae (Phylum Cyanophyta) were used. The cell which has blue-green algae was named as a photosynthetic power cell, whereas the cell with baker’s yeast was named a microbial fuel cell considering the catabolic nature of the yeast cells. Power densities of 2.3 nW/cm2 and 0.04 nW/cm2 were reported when a load of 10 Ω was applied to photosynthetic and microbial fuel cells respectively. The OCV for both cells were reported to be in the range of 300–400 mV. B Lam et al. claims that a maximum current density of 9.6 mA/cm2 can be obtained from a PSC, under an irradiation of 2000 μmol m−2s−1 [22]. However, a current density of only 1 μA/cm2 was obtained experimentally. OCVs of 470 and 330 mV were reported for µPSC under the light and dark conditions, respectively. In another work recently [23], authors had extracted photosystem-I from the spinach cells and high dense photosystem-I of spinach cells were placed on the electrode surface to increase the photocurrent generation in the PSC. In the presence of appropriate electron mediators, rinsing the extracted photosystem-I of spinach cells with the water, the PSC produced a current density of 100 nA/cm2. In work of Mirvakili et al. [24] photosynthetic protein complexes were deposited by electro spraying reaction centers of Rhodobacter sphaeroides on to graphite electrodes to obtain a current density of 7 µA/cm2. Charge separation with the photosystem and reaction center complexes of photosynthetic plants and photosynthetic microorganisms have power conversion efficiency of approximately 18% and 12%, respectively [24].
Among the photosynthetic power cells, the highest performing µPSC was reported by Shahparnia et al. [6]. Under the light irradiance of 15 μmol m−2s−1 (lux-652) [25], with the active electrode surface area of 4.84 cm2, the author reported an open circuit voltage (OCV) of 0.85 V, a short circuit current (SSC) of 0.8 mA, which corresponds to 17.56 V/m2 of OCV and 16.5 mA/m2 of SSC respectively. At this operating condition, a maximum power density of 362 mW/m2 is reported at 850 Ω. These performance metrics of the µPSC are under consideration.
Performance Parameters of the Micro-Photosynthetic Power Cells µPSC
The electrical performance of the µPSC is expressed usually based on their Open Circuit Voltage (OCV), Current Density (CD), Power Density (PD) and Voltage–Current (V-I) characteristics.
Open Circuit Voltage (OCV): OCV is the voltage of the µ-PSC at zero current. The standard reduction potential of the anolyte and catholyte contribute to the OCV. Furthermore, photosynthetic microorganisms contribute to the OCV of the cell. Theoretically, OCV should be the Nernst reversible voltage, however, because of various losses, such as ohmic losses, concentration losses, and activation losses, the OCV is lesser. For more details on the OCV, readers are directed to References [10,13]. In Reference [3] OCV was 330 mV after 4 min of the operating time, and when it was subjected to a direct light intensity of 2000 µmole photons m−2s−1, OCV sharply increased to 470 mV and stabilized within a short period of 2 min.
Current Density (CD): CD is the current generated due to the flow of electrons through the external resistor with respect to the electrode surface area. Ideally, the current should be high for less electrode surface area. The current density can be represented by the equation as
where iμPSC–current generated by the µPSC and AμPSC is the active electrode surface area of the µPSC.
Chiao et al. [3] estimates the maximum current that can be produced by the micro level electrochemical cell with simple first order model. Electrons generated during the photosynthesis and respiration process contribute to the electricity. However, not all the electrons produced will reach the electrode surface area. Under light illumination of 2000 µmole m−2s−1, a theoretically maximum current density of 9.6 mA/cm2 can only be produced [22]. However, practically no µPSC has generated up to this value. The main reasons for the losses in the current generations are (i) low diffusion rate of electron carrying mediators and (ii) Savaging the electrons by oxygen from photosystem-I and reduced electron mediator.
By introducing the enzymatic catalysts into the anodic chamber, the electron mediators will help produce more electricity from the cell. Thus, to increase the electron capture, electron mediators are essential to achieve higher current generation from the photosynthetic power cell.
Power Density (PD): Power density is the product of voltage and current produced by the µPSC normalized to the surface area of the cell. The power output is normalized to the projected electrode surface area. Thus, the power density is calculated on the basis of the electrode surface area
V—Voltage of the cell in Volts
A—Area of the electrode surface in m2
Rext—External resistance connected to the ends of electrodes.
V-I Characteristics: The voltage-current (V-I) characteristics is essential to understand the behavior of any power-generating device. This data will help in designing suitable and efficient power converters for any power generating device. V-I characteristics are obtained by connecting the load to µPSC and varying it continually from OCV to short circuit current. Shaparnia et al. [7] reported the OCV of 0.87 V and short circuit current of approximately 0.82 mA, by varying the load from 1 Ω to 10 kΩ for V-I characteristics. It generated a peak power of 179.36 µW of power, which corresponds to 370.58 mW/m2 when connected to a load of 850 Ω under the irradiance of 15 μmol m−2s−1 (which is 652 lux), and electrode surface area was 4.84 cm2. The author of Reference [7] studied the effect of different light irradiances on the VI characteristics and no considerable effects were observed.
3. Cost Analysis on Micro-Photosynthetic Power Cells (µPSC) and Photovoltaic (PV) Technologies
In this section, we present two case studies to perform cost analysis of µPSC technology in comparison with PV. For each case study, we provide the problem under consideration, design an energy system, identify the components needed, and calculate the total cost needed for developing the energy system. We followed the same approach for both PV and µPSC technologies.
3.1. Case Study 1: Design of Energy System for Battery Charging
3.1.1. Design of the Battery Charging Using Photovoltaic (PV) Technology
A typical commercially available mobile phone battery with a capacity of 1100 mAh and a nominal voltage of 3.7 V [26] has been selected for the charging application by low power solar panel. We have chosen a solar panel of 0.1 W rating, since this falls under the comparable range of µPSCs power rating. Suitable DC/DC boost converter has been selected to charge the battery. The size of the solar panel is 60 mm × 30 mm, therefore the area of the solar panel is 18 cm2. The solar panel has voltage rating (Vmp) of 2 V and the current rating (Imp) of 50 mA for the area of 18 cm2 which corresponds to 11.1 V/m2 of voltage rating and 277.7 mA/m2 of current rating respectively [27]. To reduce the time required for the battery charging, current rating of the PV panels is increased to 100 mA by connecting two PV panels in parallel. A MPPT control unit is installed to extract the maximum power. Maximum power extracted from this unit is fed to the DC/DC boost converter, which increases the output voltage of the PV panel to the desired voltage. In addition, DC/DC boost converter also regulates the output voltage. As the nominal voltage of the battery under consideration is 3.7 V, a 10% higher voltage i.e., 4 V has to be fed to the battery for charging. In any power converter, the input power will always be equal to output power at ideal conditions. Neglecting all the losses in the intermittent stages of the conversion, output current of the boost converter will reduce to 50 mA and the voltage will increase to 4 V. Figure 3 shows the schematics of the battery charging design-using PV cells.
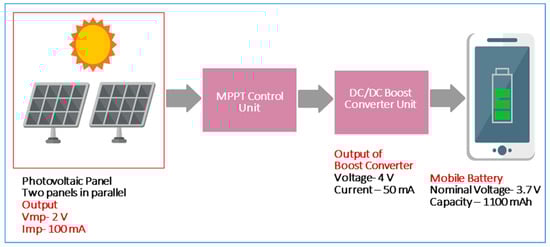
Figure 3.
Photovoltaic (PV) charging mobile schematics.
It is important to understand that the time required for charging the battery to the full capacity to understand the performance of the energy system developed.
Full battery charge time (hr) = battery capacity/Charging Current = 1100 mAh/50 mA = 22 h.
Therefore, with the designed energy system, it takes 22 h to charge the mobile phone battery completely, considered in this study. A solar insolation of 800–1000 W/m2 is assumed for all the time on PV cells.
An approximate cost incurred for the designing of the complete charging system is shown in the Table 1.

Table 1.
Approximate cost of the complete photovoltaic (PV) technology for a mobile battery charging.
The total cost of energy system based on PV technology is $86 and it takes 22 h of time for complete charging. The specifications of the PV panel [27] selected for the battery charging are provided in Table 2. The efficiency is 17–19% under solar irradiation of 1000 W/m2 [27] and with air mass of 1.5 [28]. For more details on the air mass authors recommend to read the article [28].
Table 2.
Specification of the typical Solar Panel.
3.1.2. Design of Battery Charging Using Micro-Photosynthetic Power Cells (µ-PSC)
Figure 4 shows the Voltage–Current (VI) and Power-Voltage (P-V) characteristics of µPSC [7] under consideration. Maximum power produced by the single µPSC is 0.18 mW. This rating corresponds to the µPSC at an irradiance of 15 μmol m−2s−1 (which is-652 lux) [25] and surface area of 4.84 cm2. For more details on the effects of the light irradiance, authors recommend to read Reference [7]. From the P-V and V-I curve, rating of the µPSC is calculated. From the V-I and P-V characteristics, it is evident that the voltage rating of the µPSC is 0.4 V and the current rating is 0.45 mA [7] under the light irradiances of 15 μmol m−2s−1 at the load of 850 Ω.
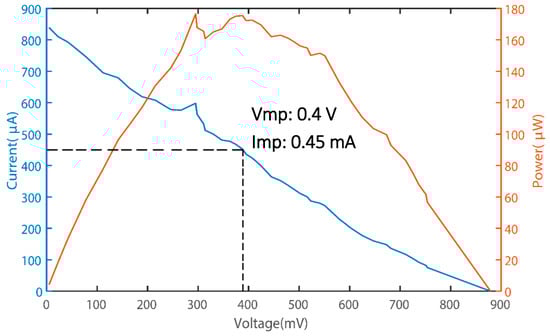
Figure 4.
Voltage-current (VI), photovoltaic (P-V) characteristics and operating parameters of micro-photosynthetic power cells (µPSC).
Currently, µ-PSCs have low power densities in comparison to PV cells. Current rating of the single µPSC is 0.45 mA, which is two orders of magnitude less than PV cells. To compare the cost of PV and µPSC technologies, we have first selected the PV panels with similar range of rating of µPSCs, and second, we placed a constraint of same charging time required for full capacity of battery (22 h) while designing the energy system based on µPSCs. With this constraint, the problem of designing the µPSC energy system manifests into the calculation of number of µPSCs required to charge the battery under consideration for full capacity in the same time as the PV technology. We have used other components, such as Maximum Power Point Tracking (MPPT) control unit and DC/DC boost power converter, demonstrated earlier in PV system design. For the chosen power converter, the minimum input voltage is 0.3 V [29]. In practical situations, when µ-PSC are connected in series, the voltage increases, and there will be resistive losses and connection losses. Since the voltage input to the DC/DC power converter is to be higher than 0.3 V, two PSCs are connected in series, to increase the voltage rating. The new voltage rating will now be 0.8 V and current will be 0.45 mA. We called this configuration as the one µ-PSC panel. It means the one µ-PSC panel has two µ-PSC cells connected in series connection. The typical µ-PSC panel, where two cells are connected in series is shown in the Figure 5.
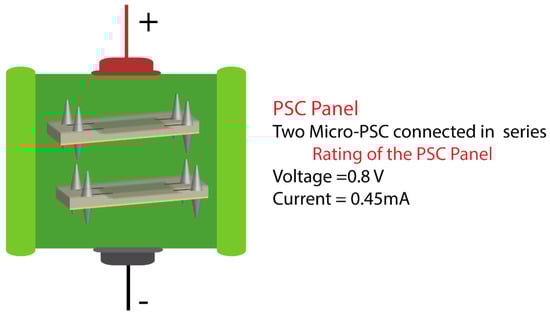
Figure 5.
Micro-photosynthetic power cell (µ-PSC) panel.
As a single µ-PSC panel has a rating of 0.8 V and 0.45 mA, we need to calculate the number of µ-PSC panels required to charge the battery of 3.7 V, which has the capacity of 1100 mAh in 22 h (same as the PV design), as mentioned earlier. The detailed schematic design of the battery charging using the µPSC technology is shown in the Figure 6.
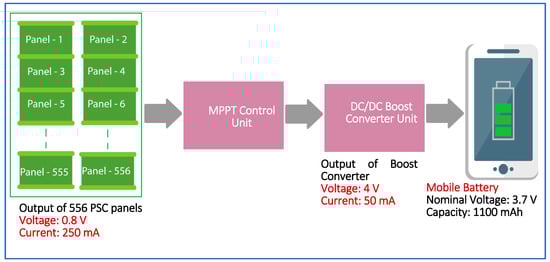
Figure 6.
Schematic of the mobile battery charging using micro-photosynthetic power cell (µ-PSC) technology.
To respect the constraint of 22 h full charging time for both PV and µPSC, many µPSC panels are to be connected in parallel to increase the current obtained from them. Calculation shows that 556 panels are required to increase the current to 250 mA, with 0.8 V. We have implemented MPPT control unit to extract the maximum power similar to PV technology. With 0.8 V and 250 mA of voltage and current respectively, the DC/DC boost converter increases the voltage to 4 V to charge the battery and the current decreases to 50 mA for the ideal conditions. Hence, a current of 50 mA and a voltage of 4 V is used to charge a battery to the full capacity in 22 h.
The cost incurred for the designing of the complete charging system using µ-PSC technology is shown in the Table 3.
Table 3.
Approximate cost of the complete micro-photosynthetic power cell (µ-PSC) technology for the battery charging.
For the selected 3.7 V, 1100 mAh battery, two PV panels (in parallel) of power rating 100 mW are required to charge the battery to the full capacity in 22 h. Solar insolation of 800–1000 W/m2 is assumed throughout the charging time. Further, all the losses are neglected for the design calculations. The energy system for the battery charging costs $86 using low power PV panels.
To charge the battery completely in same time of 22 h µPSC technology, costs $3418. High cost of the µ-PSC technology is due to their low power densities. It is to be kept in mind that µPSC technology is at research stage, whereas PV technology is a well-established one.
3.2. Case Study 2: Design of Energy System to Power Real Time Internet of Things (IoT) Humidity Sensors
3.2.1. Powering Real Time Internet of Things (IoT) Humidity Sensor Using Photovoltaic (PV)
Many of the IoT sensors require ultra-low power (nW to mW). The schematic to power these sensors from PV technology is shown in Figure 7. The same low power PV panel, which is used to charge the mobile battery, is used for the easy comparison with the µ-PSC technology. The selected PV panel operates at 2 V and 50 mA current. To extract the maximum power, an MPP control unit is required. To provide the necessary controlled and regulated voltage to the sensor, a DC/DC converter is essential. A DC/DC Buck-Boost converter is suitable for this application as the humidity sensor requires is 1.8 V. The DC/DC Buck-Boost converter receives 2 V and 50 mA as an input and provide an output of 1.8 V and 55.5 mA that suits the operating parameters of humidity sensor to function continuously, provided we have solar insolation of at least 800–1000 W/m2 all the time.
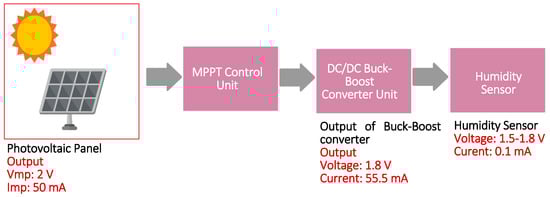
Figure 7.
Schematic of powering the Internet of Things (IoT) sensor (Humidity Sensor) using photovoltaic (PV) technology.
The cost for the designing of the complete system for powering ultra-low power IoT humidity sensor using PV technology is given in the Table 4.
Table 4.
Cost of the photovoltaic (PV) technology for powering the Ultra-low power Internet of Things (IoT) sensor (Humidity Sensor).
The specifications of the selected humidity sensor are given in the Table 5.
Table 5.
Specifications of the humidity sensor [30].
3.2.2. Powering Real Time Internet of Things (IoT) Humidity Sensor Using Micro-Photosynthetic Power Cells (µPSC) Technology
IoT humidity sensor requires power of 0.18 mW. Therefore, one µPSC panel will be sufficient to power this sensor. One µPSC panel generates power of 0.36 mW with the voltage rating of 0.8 V and current rating of 0.45 mA. To extract the maximum power at any given time, a MPPT control unit is required. DC/DC boost converter will boost the voltage to the desired level of 1.8 V, which in turn reduces the current to 0.2 mA. Losses are being neglected for these calculations. Few of the applications such as humidity sensor, temperature sensor, and various other weather monitoring sensors, require to send the data once for every half an hour or more. Therefore, the energy generated by the µPSC can be stored in the supercapacitors, such as the fast charging micro super capacitor fabricated from Niobium nanowire array [31,32] and other micro supercapacitors. The schematic of powering a humidity sensor using µPSC technology is shown in Figure 8. The cost required for the designing of energy system using µPSC to power ultra-low power IoT sensor is given in the Table 6.
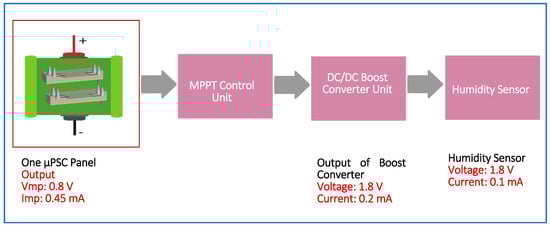
Figure 8.
Schematics of powering an Internet of Things (IoT) sensor (Humidity Sensor) using micro-photosynthetic power cells (µ-PSC) technology.
Table 6.
Cost of the micro-photosynthetic power cell (µ-PSC) technology for powering an Ultra-low power Internet of Things (IoT) sensor.
4. Discussion and Conclusions
4.1. Discussion
The initial cost of any revolutionary technology will be high. The cost gradually decreases with time owing to various research outcomes in the technology. For illustration, the PV technology since its inception has grown tremendously. The cost of PV technology was $76 per watt in 1976, whereas currently the price is less than $1 after a drastic reduction of approximately 76 times [33].
µPSC are currently in the early stage of research and costs approximately $2500 to generate 1 W of power [7]. However, the performance of µPSCs has improved and the cost can be further decreased. A few avenues to increase the performance and reduce the cost are discussed next.
4.2. Avenues for Cost Reduction of the Micro-Photosynthetic Power Cell (µPSC)
Currently, the highest power densities among the µPSC technology reported is 362 mW/m2 [6] under the irradiance of 15 μmol m−2s−1 (which is 652) [25] with an active surface area of 4.84 cm2. However, compared to photovoltaic technology, these values are very low. Therefore, low power densities and high cost are the major challenges that are hindering the commercialization of µPSC technology at present. Power density is dependent on many factors, such as high quantum yield of the algae cells in the anode chamber, optimized electrode design, suitable electron mediators, and electron acceptors, design of the anode and cathode chambers, carbon dioxide, etc. The high cost is due to use of noble materials as electrodes/current collectors and the proton exchange membrane Nafion. A recent work by Tanneru et al. [10] provides a detailed possibilities for performance enhancement and cost reduction.
5. Conclusions
From case study 2, the cost of development of energy system for powering a humidity sensor using PV technology is $69, whereas µPSC technology is $73 as shown in Table 7. With this number, it is evident that for the ultra-low power applications, the cost of µPSC technology is comparable to the PV technology.
Table 7.
Comparison of the photovoltaic (PV) and Micro-photosynthetic (µPSC) technology.
From case study 1, the cost of development of energy system for charging a mobile battery (3.7 V, 1100 mAh) using PV technology is $84, and using µPSC technology is $3418. Even though µPSC technology is approximately 40 times costlier than PV technology currently, with the advancement in technology, the cost of µPSC technology will enhance the performance and decrease the cost, which makes it also suitable for low power applications.
With enormous scope for the cost reduction and performance enhancement possibilities, this technology will serve as a power source for the wireless sensors and their networks, which are key components in the IoT era.
Author Contributions
H.K.T. and K.K. have conceptualized the idea, prepared the manuscript paper and P.P., R.R. and M.P. supervised the work and provided suggestions and corrections.
Funding
This work is funded by NSERC Canada, FRQNT Canada, Concordia Research Chair, Concordia University, Canada and NSERC Hydro-Quebec Chair, Concordia University, Montreal, Canada.
Conflicts of Interest
The authors declare no conflict of interest.
References
- Sun, H.; Yin, M.; Wei, W.; Li, J.; Wang, H.; Jin, X. MEMS Based Energy Harvesting for the Internet of Things: A Survey; Springer: Berlin/Heidelberg, Germany, 2018; Volume 0123456789. [Google Scholar]
- Zhang, F.; Tian, L.; He, Z. Powering a wireless temperature sensor using sediment microbial fuel cells with vertical arrangement of electrodes. J. Power Sources 2011, 196, 9568–9573. [Google Scholar] [CrossRef]
- Chiao, M.; Lam, K.B.; Lin, L. Micromachined microbial and photosynthetic fuel cells. J. Micromech. Microeng. 2006, 16, 2547–2553. [Google Scholar] [CrossRef]
- Siu, C.P.B.; Chiao, M. A microfabricated PDMS microbial fuel cell. J. Microelectromech. Syst. 2008, 17, 1329–1341. [Google Scholar] [CrossRef]
- Lam, K.B.; Irwin, E.F.; Healy, K.E.; Lin, L. Bioelectrocatalytic self-assembled thylakoids for micro-power and sensing applications. Sens. Actuators B Chem. 2006, 117, 480–487. [Google Scholar] [CrossRef]
- Shahparnia, M.; Packirisamy, M.; Juneau, P.; Zazubovich, V. Micro photosynthetic power cell for power generation from photosynthesis of algae. Technology 2015, 03, 119–126. [Google Scholar] [CrossRef]
- Ramanan, A.V.; Member, S.; Pakirisamy, M. Advanced Fabrication, Modeling, and Testing of a Microphotosynthetic Electrochemical Cell for Energy Harvesting Applications. IEEE Trans. Power Electron. 2015, 30, 1275–1285. [Google Scholar] [CrossRef]
- Lee, H.; Choi, S. A micro-sized bio-solar cell for self-sustaining power generation. Lab Chip 2015, 15, 391–398. [Google Scholar] [CrossRef] [PubMed]
- Mink, J.E.; Qaisi, R.M.; Logan, B.E.; Hussain, M.M. Energy harvesting from organic liquids in micro-sized microbial fuel cells. NPG Asia Mater. 2014, 6, e89. [Google Scholar] [CrossRef]
- Tanneru, H.K.; Kuruvinashetti, K.; Pillay, P.; Rengaswamy, R.; Micro, M.P. Perspective—Photosynthetic Power Cells. J. Electrochem. Soc. 2019, 166, B1–B5. [Google Scholar] [CrossRef]
- Tender, L.M.; Gray, S.A.; Groveman, E.; Lowy, D.A.; Kauffman, P.; Melhado, J.; Tyce, R.C.; Flynn, D.; Petrecca, R.; Dobarro, J. The first demonstration of a microbial fuel cell as a viable power supply: Powering a meteorological buoy. J. Power Sources 2008, 179, 571–575. [Google Scholar] [CrossRef]
- Tommasi, T.; Chiolerio, A.; Crepaldi, M.; Demarchi, D. A microbial fuel cell powering an all-digital piezoresistive wireless sensor system. Microsyst. Technol. 2014, 20, 1023–1033. [Google Scholar] [CrossRef]
- Masadeh, M.A.; Kuruvinashetti, K.; Shahparnia, M.; Pillay, P.; Packirisamy, M. Electrochemical Modeling and Equivalent Circuit Representation of a Microphotosynthetic Power Cell. IEEE Trans. Ind. Electron. 2017, 64, 1561–1571. [Google Scholar] [CrossRef]
- Tanneru, H.K.; Suresh, R.; Rengaswamy, R. On modeling and optimization of micro-photosynthetic power cells. Comput. Chem. Eng. 2017, 107, 284–293. [Google Scholar] [CrossRef]
- Kumar, T.H.; Suresh, R.; Ramanan, A.V.; Shahparnia, M.; Packirisamy, M.; Pillay, P.; Williamson, S.; Juneau, P.; Rengaswamy, R. Integrated bio-electrochemical model for a micro photosynthetic power cell. J. Microelectromech. Syst. 2016, 1–9. [Google Scholar] [CrossRef]
- Tanneru, H.K.; Suresh, R.; Ramanan, A.V.; Mehdi, S.; Packirisamy, M.; Pillay, P.; Williamson, S.; Juneau, P.; Rengaswamy, R. Micro photosynthetic cell for power generation from algae: Bio-electrochemical modeling and verification. Technology 2016, 04, 249–258. [Google Scholar] [CrossRef]
- Green, M.A. Third generation photovoltaics: Solar cells for 2020 and beyond. Phys. E Low-Dimens. Syst. Nanostructures 2002, 14, 65–70. [Google Scholar] [CrossRef]
- Gul, M.; Kotak, Y.; Muneer, T. Review on Recent Trend of solar Photovoltaic Technology. Energy Explor. Exploit. 2016, 34, 485–526. [Google Scholar] [CrossRef]
- Tanaka, K.; Tamamushi, R.; Ogawa, T. Bioelectrochemical fuel-cells operated by the cyanobacterium, Anabaena variabilis. J. Chem. Technol. Biotechnol. Biotechnol. 1985, 35, 191–197. [Google Scholar] [CrossRef]
- Yagishita, T.; Horigome, T.; Tanaka, K. Effects of light, CO2 and inhibitors on the current output of biofuel cells containing the photosynthetic organism Synechococcus sp. J. Chem. Technol. Biotechnol. 1993, 56, 393–399. [Google Scholar] [CrossRef]
- Yagishita, T.; Sawayama, S.; Tsukahara, K.I.; Ogi, T. Effects of intensity of incident light and concentrations of Synechococcus sp. and 2-hydroxy-1,4-naphthoquinone on the current output of photosynthetic electrochemical cell. Sol. Energy 1997, 61, 347–353. [Google Scholar] [CrossRef]
- Lam, K.B.; Johnson, E.A.; Chiao, M.; Lin, L. A MEMS photosynthetic electrochemical cell powered by subcellular plant photosystems. J. Microelectromech. Syst. 2006, 15, 1243–1250. [Google Scholar] [CrossRef]
- Faulkner, C.J.; Lees, S.; Ciesielski, P.N.; Cliffel, D.E.; Jennings, G.K. Rapid Assembly of Photosystem I Monolayers on Gold Electrodes. Langmuir 2008, 24, 8409–8412. [Google Scholar] [CrossRef] [PubMed]
- Mirvakili, S.M.; Slota, J.E.; Usgaocar, A.R.; Mahmoudzadeh, A.; Jun, D.; Mirvakili, M.N.; Beatty, J.T.; Madden, J.D.W. Photoactive Electrodes Incorporating Electrosprayed Bacterial Reaction Centers. Adv. Funct. Mater. 2014, 24, 4789–4794. [Google Scholar] [CrossRef]
- Convert PPFD to Lux-Online Calculator | Waveform Lighting. Available online: https://www.waveformlighting.com/horticulture/convert-ppfd-to-lux-online-calculator (accessed on 11 April 2019).
- Batterymart. Available online: https://www.batterymart.com/c-samsung-a8-cell-phone-battery.html (accessed on 1 March 2019).
- Alibaba.com. Available online: https://www.alibaba.com/product-detail/Epoxy-resin-customized-0-1W-2V_60356175919.html?spm=a2700.7724857.normalList.14.7e3c75cbcmVSkW&s=p (accessed on 26 February 2019).
- Wikipedia Air Mass. Available online: https://en.wikipedia.org/wiki/Air_mass_(solar_energy) (accessed on 8 April 2019).
- Fuelcellstore. Available online: https://www.fuelcellstore.com/mini-dcdc-converter (accessed on 26 February 2019).
- Digital Humidity Sensor SHTW2 (RH/T). Available online: https://www.sensirion.com/en/environmental-sensors/humidity-sensors/digital-humidity-sensor-for-iot-applications/ (accessed on 22 March 2019).
- Mirvakili, S.M.; Hunter, I.W. Vertically Aligned Niobium Nanowire Arrays for Fast-Charging Micro-Supercapacitors. Adv. Mater. 2017, 29, 1700671. [Google Scholar] [CrossRef] [PubMed]
- Mirvakili, S.M.; Mirvakili, M.N.; Englezos, P.; Madden, J.D.W.; Hunter, I.W. High-Performance Supercapacitors from Niobium Nanowire Yarns. ACS Appl. Mater. Interfaces 2015, 7, 13882–13888. [Google Scholar] [CrossRef] [PubMed]
- Petr Diamandis Solar Energy Revolution: A Massive Opportunity. Available online: https://www.forbes.com/sites/peterdiamandis/2014/09/02/solar-energy-revolution-a-massive-opportunity/#7c20f50c6c90 (accessed on 22 March 2019).
© 2019 by the authors. Licensee MDPI, Basel, Switzerland. This article is an open access article distributed under the terms and conditions of the Creative Commons Attribution (CC BY) license (http://creativecommons.org/licenses/by/4.0/).