Article

Slurry Flow and Erosion Prediction in a Centrifugal Pump after Long-Term Operation

1
State Key Laboratory of Hydroscience and Engineering & Department of Energy and Power Engineering, Tsinghua University, Beijing 100084, China
2
Key Laboratory of Fluid and Power Machinery (Xihua University), Ministry of Education, Sichuan 610039, China
3
China Three Gorges Corporation, Beijing 100038, China
*
Author to whom correspondence should be addressed.
Energies 2019, 12(8), 1523; https://doi.org/10.3390/en12081523
Submission received: 11 April 2019 / Revised: 19 April 2019 / Accepted: 19 April 2019 / Published: 23 April 2019
(This article belongs to the Section I: Energy Fundamentals and Conversion)

Abstract

:
After long-term operation, the material loss due to slurry erosion often leads to significant changes in the impeller geometry. This change can, in turn, affect the flow characteristics and the erosion mechanism in a centrifugal pump. To investigate this matter, we consider two geometric models based on a prototype stainless steel impeller, which failed due to huge erosion problems from the pulp slurry. These two models are different in the degree of wear, with one model at the pre-erosion stage and the other with worn blades. For both models, the flow characteristics have been obtained in the Eulerian reference frame by means of the SST k-ω model. Then, in order to determine the erosion patterns, the particles have been tracked in the Lagrangian reference frame. In this way, the influence of the flow characteristics on the erosion patterns has been analyzed. Results show that the geometric variations greatly affect the flow characteristics, and consequently the erosion patterns. Particularly, it has been found that the clearance flow plays a significant role in defining erosion characteristics, such as erosion distribution, areas, and rates. Interestingly, the simulation results for current study show that the erosion rates after long-term operation greatly decrease near both the outlet edge and the blade bottom. It follows also that for accurate erosion predictions, these geometric variations have to be considered in the numerical model. This paper provides a better understanding of the complex erosion mechanism in centrifugal pumps, which can help to reduce the wear in future designs.

1. Introduction

Centrifugal pumps are a type of rotating machinery and widely used in hydropower, dredging, petroleum, mining, and other related industries [1,2]. A large number of centrifugal pumps are being used for slurry pipeline transportation systems. Erosion is a common problem for these pumps, which often leads to a reduction of the hydraulic performance, an increase in the noise and vibration level, and even worse, sometimes failure of the pumps [3,4]. The failure not only leads to the replacement of the defective parts but may also cause the shutdown of the whole transportation system. Therefore, the investigation of erosion characteristics has always been a major research topic in pumping systems. Unfortunately, the erosion predictions for centrifugal pumps still have difficulties in not only experimental but also numerical approaches. Therefore, in order to provide some guidance to reduce pump erosion, prediction methods considering the flow mechanism inside the pump have to be improved.
Prediction of particle trajectories is sometimes limited in the qualitative analysis, since the particles move in complex turbulent flow fields. The quantitative analysis usually requires higher accuracy levels. Therefore, it is essential to thoroughly understand the turbulent flow mechanism inside the pump before analyzing the particle trajectories. For all kinds of flows inside the pump, the leakage flow from the impeller clearances can have a considerable effect on the pump performance [5,6,7]. Cao et al. [2,3] have numerically investigated the pressure fluctuations for the leakage flow inside a centrifugal pump and found that the interaction between the main flow and leakage flow is strong and cannot be neglected. Furthermore, with the variation of the axial clearances, the main flow characteristic can be greatly affected. Pei et al. [8], Daily et al. [9], and Zhao et al. [10] also indicated the importance of leakage flow for centrifugal pumps.
The erosion is usually related to the particle velocity, particle impingement angle, and frequency of particle impact on the surfaces [11]. The particle behaviors can be converted into material damage by the erosion equations. A lot of efforts has been made to establish reliable erosion prediction models, including those proposed by Finnie et al. [12], Tabakoff et al. [13], Oka et al. [14], and McLarury et al. [15,16]. These kinds of erosion models are usually built based on some impinging tests on certain materials. Based on the curve-fitting method, the material removal amounts are then fitted in terms of the particle velocity, impinging angles, and other related factors. Nevertheless, these also often limit the application of the erosion models to certain conditions similar to the experiments. The comparison of different models is complex and requires a lot of erosion data from experiments, which is beyond the scope of current research. This paper aims to further evaluate the applicability for one of the most popular erosion models, the Finnie model, for centrifugal pumps.
A large number of CFD practices have been conducted in evaluating the applications for different erosion models. Messa et al. [17] evaluated the related parameters when conducting erosion predictions. Zhang et al. [18] compared different mesh configurations for erosion predictions in elbows. They checked the accuracy of simulation results by experiments and suggested the suitable meshing strategy for the erosion prediction. Badr et al. [19] investigated the particle sizes and flow velocity effects on the erosion rates for a heat exchanger. They reported that the erosion rate increases exponentially with flow velocity. Nemitallah et al. [20] numerically studied the erosion characteristics after an orifice. The results showed that there are two critical erosion regions. The first region is near the orifice and the second is located in the flow reattachment zone. Habib and his group thoroughly investigated the erosion problems related to orifices [11] and pipes with sudden contractions [19,21,22]. In the last few years, a few researchers have started to pay attention to the evolution of surfaces on the erosion patterns for simple models [23,24,25], indicating that geometry variations can be an important factor affecting the erosion process.
The erosion predictions have also been extensively studied for hydraulic machines [26]. Most studies focus on developing numerical methods to better estimate the erosion of hydraulic components under different operating conditions. Zhong et al. [27] built a test rig and came up with an empirical formula to correlate the erosion model for the coefficients. The erosion model with the proposed coefficients was then applied to the wear prediction in the pump casing. They showed that a larger particle diameter would cause a greater erosion rate. Noon et al. [28,29] adopted the Finnie model to the erosion prediction of the pump casing and Francis turbine components, and the calculation results were compared with the site tests. Peng et al. [30] numerically and experimentally investigated erosion characteristics on a Francis turbine. The results showed that the erosion rate on the blades is higher than that on the guide vanes. Zeng et al. [31] simulated the needle erosion characteristics under the water-air two-phase flow. Similarly, Messa et al. [32] conducted an erosion analysis of turbine injectors combined with the VOF (Volume of fraction) model and two different erosion models. It was reported that needle erosion strongly increases when the valve closes. Based on erosion prediction methodology, Khanal et al. [33] conducted blade optimization tests by changing the blade outlet angle. The results showed a significant improvement in reducing the erosion level and efficiency, based on this methodology.
The aforementioned studies show that erosion problems in centrifugal pumps are quite common and that the erosion mechanism is only partially understood. Nevertheless, many pumps operate after initial erosion or with slightly eroded components. The material loss due to erosion can affect pump performance and even further the erosion process. Knowing the evolution of erosion patterns could contribute to a better understanding of the erosion process and causes of erosion failure for pumps. Unfortunately, the further erosion characteristics with previously worn components have rarely been considered before for centrifugal pumps. Some of the previous works focus on the optimization of the blade profiles to reduce the erosion, without considering the actual shape of the worn blades after operation and the effect this has on the later erosion characteristics. Moreover, only a few research studies have compared the erosion patterns of numerical results and actual worn components, especially for centrifugal pumps.
In this paper, a systematic numerical procedure to evaluate how the changes in impeller geometry due to slurry erosion can, in turn, affect the flow and erosion patterns is presented. The flow in a model at the pre-erosion stage and in a model with worn blades were both obtained in a Eulerian reference frame. Particles are tracked in a Lagrangian reference frame in order to predict the erosion patterns. By comparing both models, the changes in the flow characteristics and in the erosion patterns produced by small geometry variations are analyzed.

2. Mathematical Model

For many engineering problems, the slurry flow can be treated as a diluted flow, as some of them do not possess a very high volume fraction of particles. For the model in this study, the collisions between particles are ignored. However, the two-way coupled method is adopted, where the particle motion in the fluid is considered by the momentum exchange between the discrete and continuous phases. The Eulerian method is used for the liquid in the slurry, while the Lagrange method is used to calculate the particle velocities and positions. When particles are impacted against the impeller surface, erosion happens.

2.1. Mathematical Model for Liquid Phase

u i x i = 0
( ρ u i ) t + ( ρ u i u j ) x j = p x i + x j [ ( μ + μ t ) ( u i x i + u j x i ) ] + S u i p + ρ g i
where the u is the liquid velocity, ρ is the liquid density, μ t is the turbulent viscosity, μ is the fluid viscosity, and p is the mean pressure. The phase interactions are considered by the additional source terms S u i p , which are incorporated in the in the Navier-Stokes equations and calculated implicitly.

2.2. Mathematical Model for Particles

The particles are treated in the Lagrangian framework, where every particle is tracked independently according to Newton′s second law. The velocities and movement of the particles in the flow can be calculated by the equations proposed by Clift [34]. Taking the main hydrodynamic forces into consideration, the governing equation for particle motion can be modified as follows:
m p d U P d t = F D + F P + F V M
where mp and U P are the particle mass and velocities. F D , F P , and F V M are the drag force, pressure gradient force, and virtual mass force for the particles.
The drag force is usually considered to be the most important force affecting particles and can be calculated by the equations below:
F D = 1 2 C D ρ P A F | U s | U s
where C D , ρ P , A F , and U s are the drag force coefficient, particle density, effective particle cross-sections, and the slip velocity, respectively.
Pressure gradient force is also considered due to the rapid changes of velocity inside the impeller and the relatively low density of the particles. The pressure gradient force can be expressed as follows:
F P = m l ρ l p
As the fluid mass is higher than the solid mass for each control volume, the forces accelerating the volume occupied by the particles can be significant and cannot be neglected. To estimate the virtual mass force, the following equation is adopted:
F V M = 1 2 m F ( d U L d t d U P d t )
The particle motion due to the turbulent dispersion is considered based on the theory from Gosman and Ioannides [35], which assume the particle will always be within a single turbulent eddy and affected by the fluctuating velocity from the eddy.
Other forces, such as lift force, Basset force, and gravity force, contribute little to the particle motion under certain circumstances [22,32], and are not considered in this study.
After the particle properties, such as the locations and velocities, are determined, the erosion can be calculated. The Finnie model adopted for the current study correlates the erosion rate with the impact angle and particle velocities, which can be expressed below [12].
E = k V P n f ( γ )
f ( γ ) = { 1 3 cos 2 γ                     if   tan γ > 1 3 sin ( 2 γ ) 3 sin 2 γ     if   tan γ 1 3
where E is the dimensional mass defined by the ratio of target material mass removal to the impact particles mass, and γ is the impact angle between the particles and the surface.

3. Numerical Methods
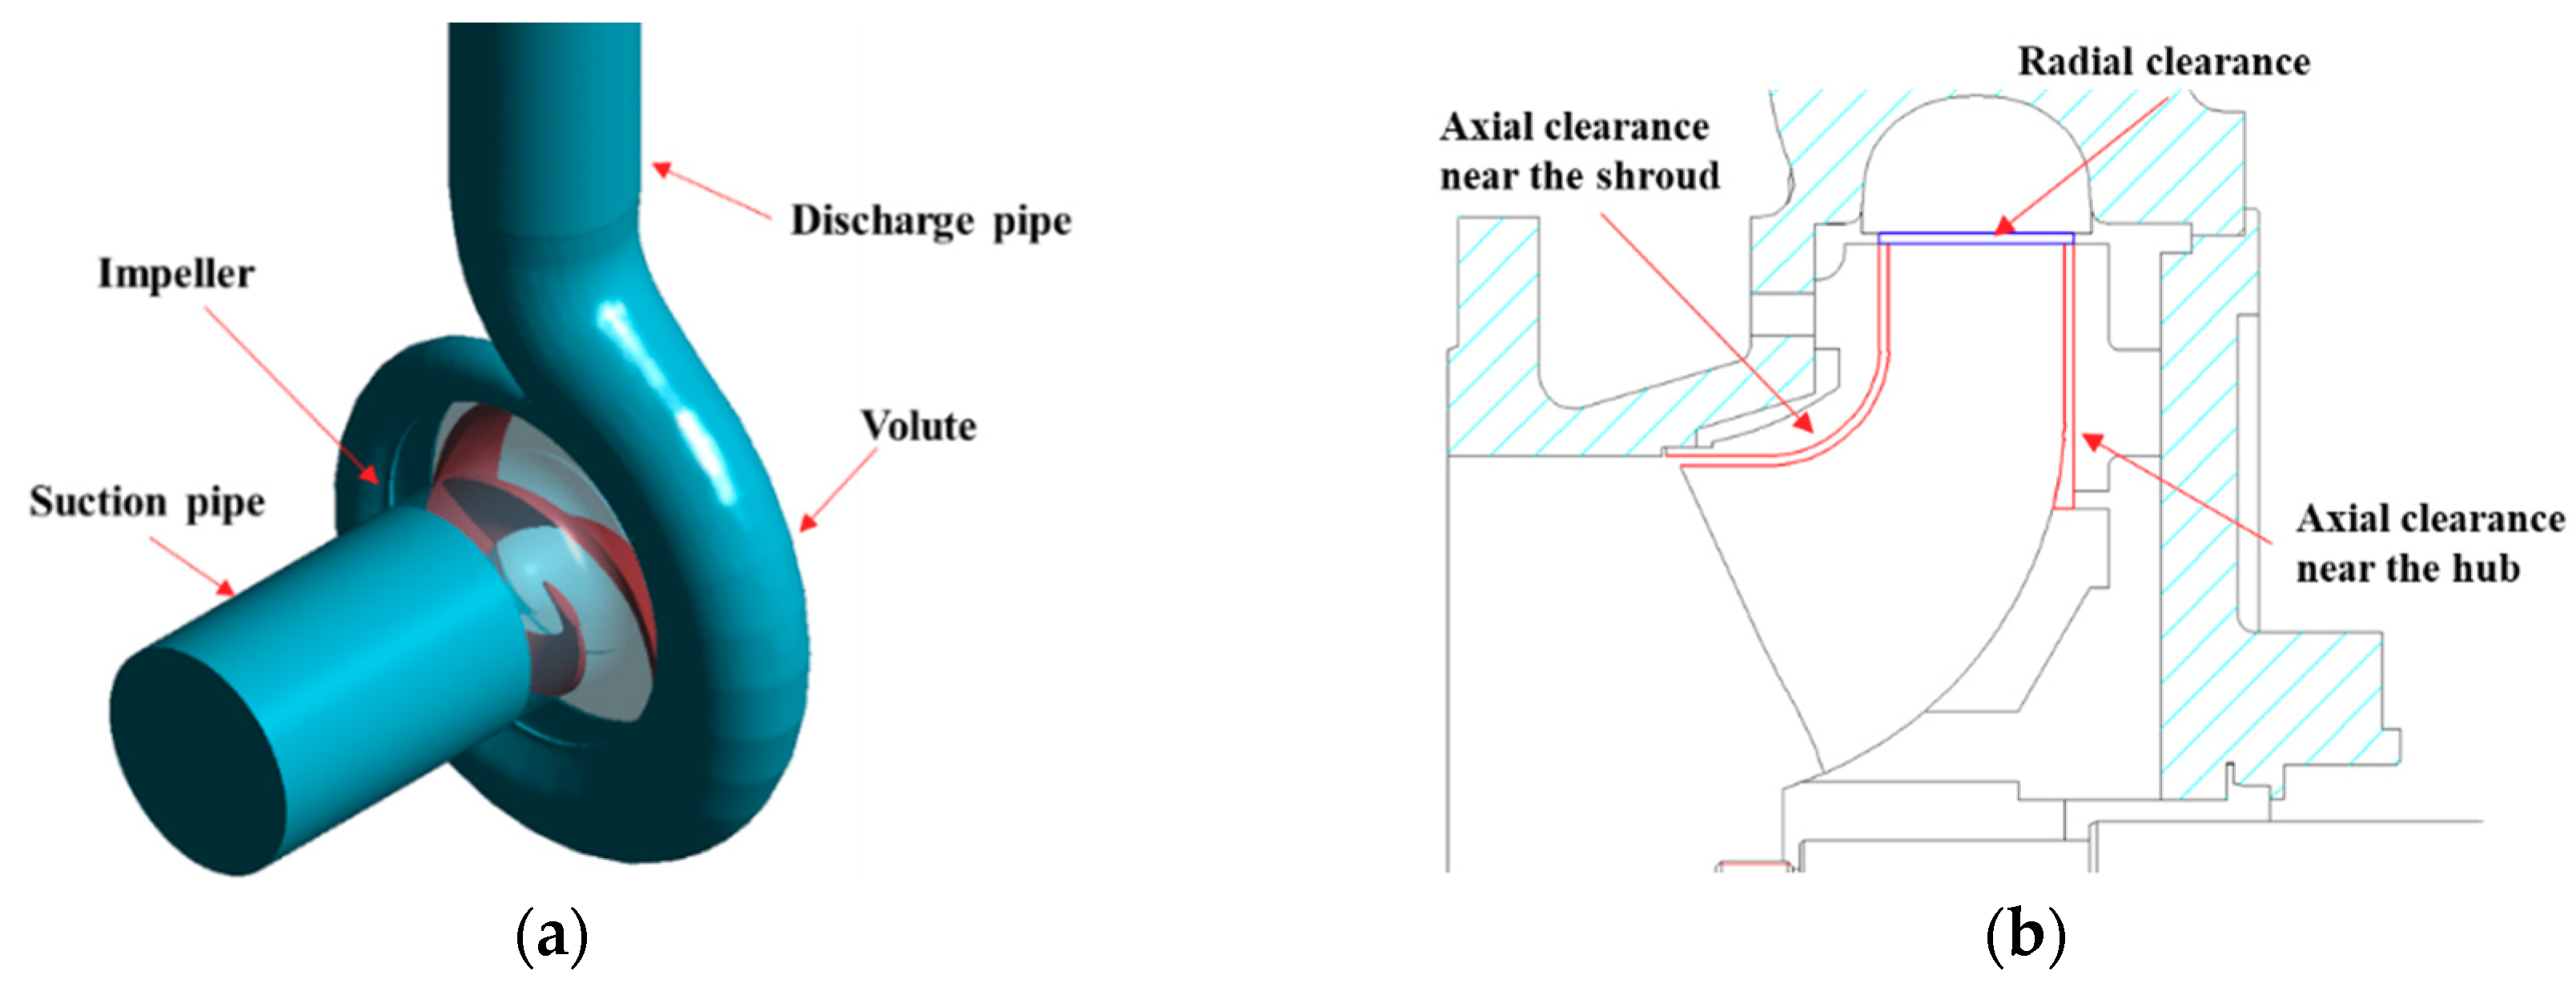
3.1. Pump Model

The centrifugal pump investigated in this paper is used to transport the slurry pulp flow in a paper mill. The volume concentration of the paper pulp is as low as about 5%. The pulp is milled into small fibers. Since the fiber can be characterized as of smaller scale in comparison to the pump impeller, it was assumed to be an isotropic particle of finite size with a diameter of 0.5 mm. This slurry pulp flow is very damaging to the impeller. The pump impeller needs to be replaced approximately every 6 months.
The physical properties of the slurry flow are shown in Table 1. The pump operates under a rated flow rate of 690 m3/h for the fluid, where the volume concentration for the particles is 5% under this condition. The flow components consist of a semi-open type impeller and a volute. The rotating speed is 1450 rpm, with a specific speed of 172. The Stokes number is defined as S t = ρ f d p 2 V s / ( 18 μ f L s ) , where the characteristic length L s and velocity V s are the diameter of the impeller and the circumferential velocity at the impeller outlet in centrifugal pumps, respectively [36]. The particle Stokes number for the centrifugal pump is 0.0675, much smaller than 1, implying that the particles follow water closely. The flow is at a highly turbulent level, and the flow Reynolds number for the current pump is 5.08 × 10⁵.
When establishing the calculation domain, the suction pipe and discharge pipe were also included and extended to stabilize the inlet and outlet flows. As the impeller is a semi-open type, there are two kinds of clearances, known as the axial clearance and radial clearance. They are both included in the impeller model, as shown in Figure 1.

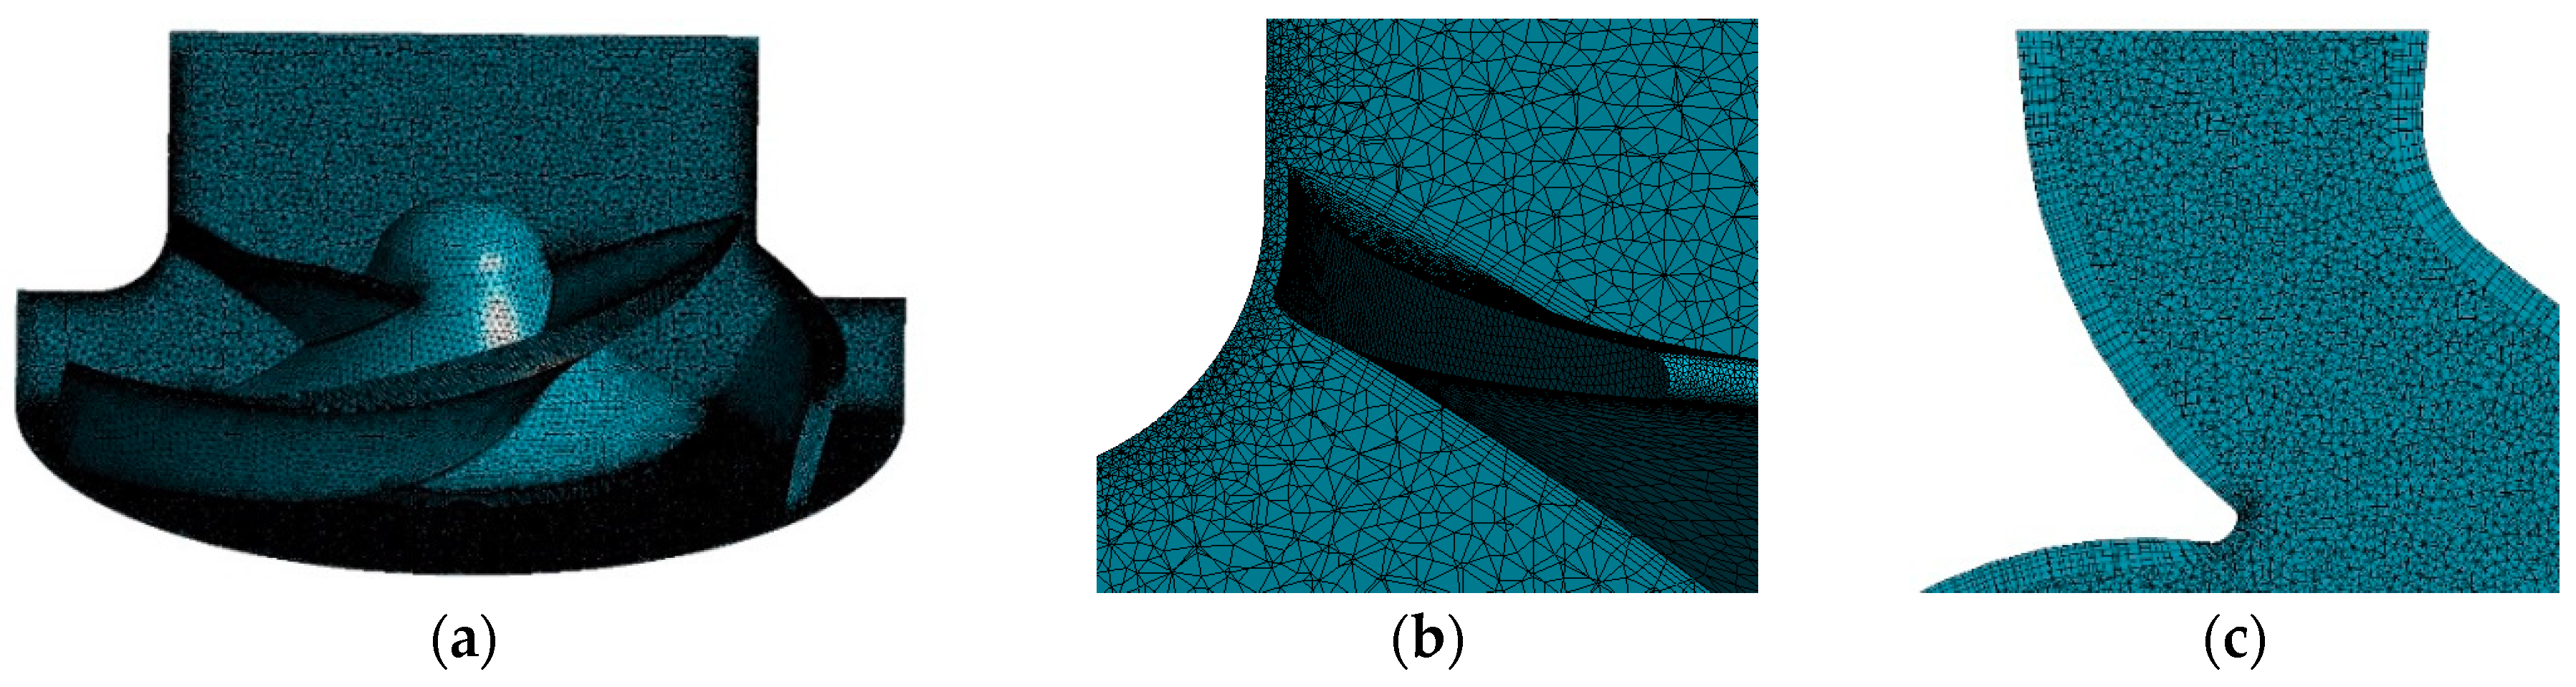
3.2. Mesh Generation

The unstructured mesh was generated for the domains, where the tetrahedral, prism, and pyramid cells were all adopted. To obtain the precise and reliable flow details near the surface, the walls for the blade and volute were imposed with inflation layers, with a total layer number of 5 and a growth rate of 1.2. In addition, the mesh in the axial clearances was refined to better capture the flow nearby. Grid independence studies were carried out to choose a suitable mesh. Five grid systems have been created: 540,000, 660,000, 800,000, 1,090,000, 1,690,000, and 2,120,000 nodes. The predicted head variation among the grid systems of 800,000, 1,090,000, 1,690,000, and 2,120,000 nodes is less than 0.14%. Finally, the grid of 2,120,000 nodes is used for the simulations, as shown in Figure 2.

3.3. Numerical Scheme and Boundary Conditions

The Navier-Stokes equations have been solved for the full three-dimensional incompressible flow inside the pump, where the commercial CFD code CFX 17.0 (ANSYS Inc., Pittsburgh, PA, USA) was employed. The turbulence model was chosen to be SST k-ω to predict the onset and flow separations with adverse pressure gradient [37]. Multiphase simulations require a good initial estimation to reach convergence. Therefore, the condition of pure water was simulated first to obtain the initial fields. Boundary conditions should also be chosen specifically to match the actual operating conditions. The inlet and outlet of the pump were set as total pressure and mass flow, respectively. The wall surfaces were assumed as a no-slip condition, where the wall functions were adopted to process the flow near the wall.
As the volute casing is asymmetrical and the rotor-stator interactions between the impeller and the volute can be strong [2,38], calculations have been performed at 3 different angular locations, namely, 40 degrees each time. The performance calculations adopt the arithmetic mean value under these 3 conditions as the final result.
For simulations with particles, the particle flow rate was also set according to the volume concentration and density. Current methods consider both the one-way coupled and two-way coupled particles. For two-way coupled particles, the fluid affects its motion and the particles, in turn, affect the surrounding liquid. Therefore, these particles are referred to as the two-way coupled particles [39]. The main differences between them are that only the momentum sources from two-way coupled particles are extracted to affect the surrounding fluids. To better statistically represent the trajectories of particles in actual pumps, the number of one-way coupled method particles was set as a larger value of 10,000. The two-way coupled particles, which are usually more computationally expensive, were set to be a smaller value of 5000. The Finnie model [12] was adopted for the erosion calculations.

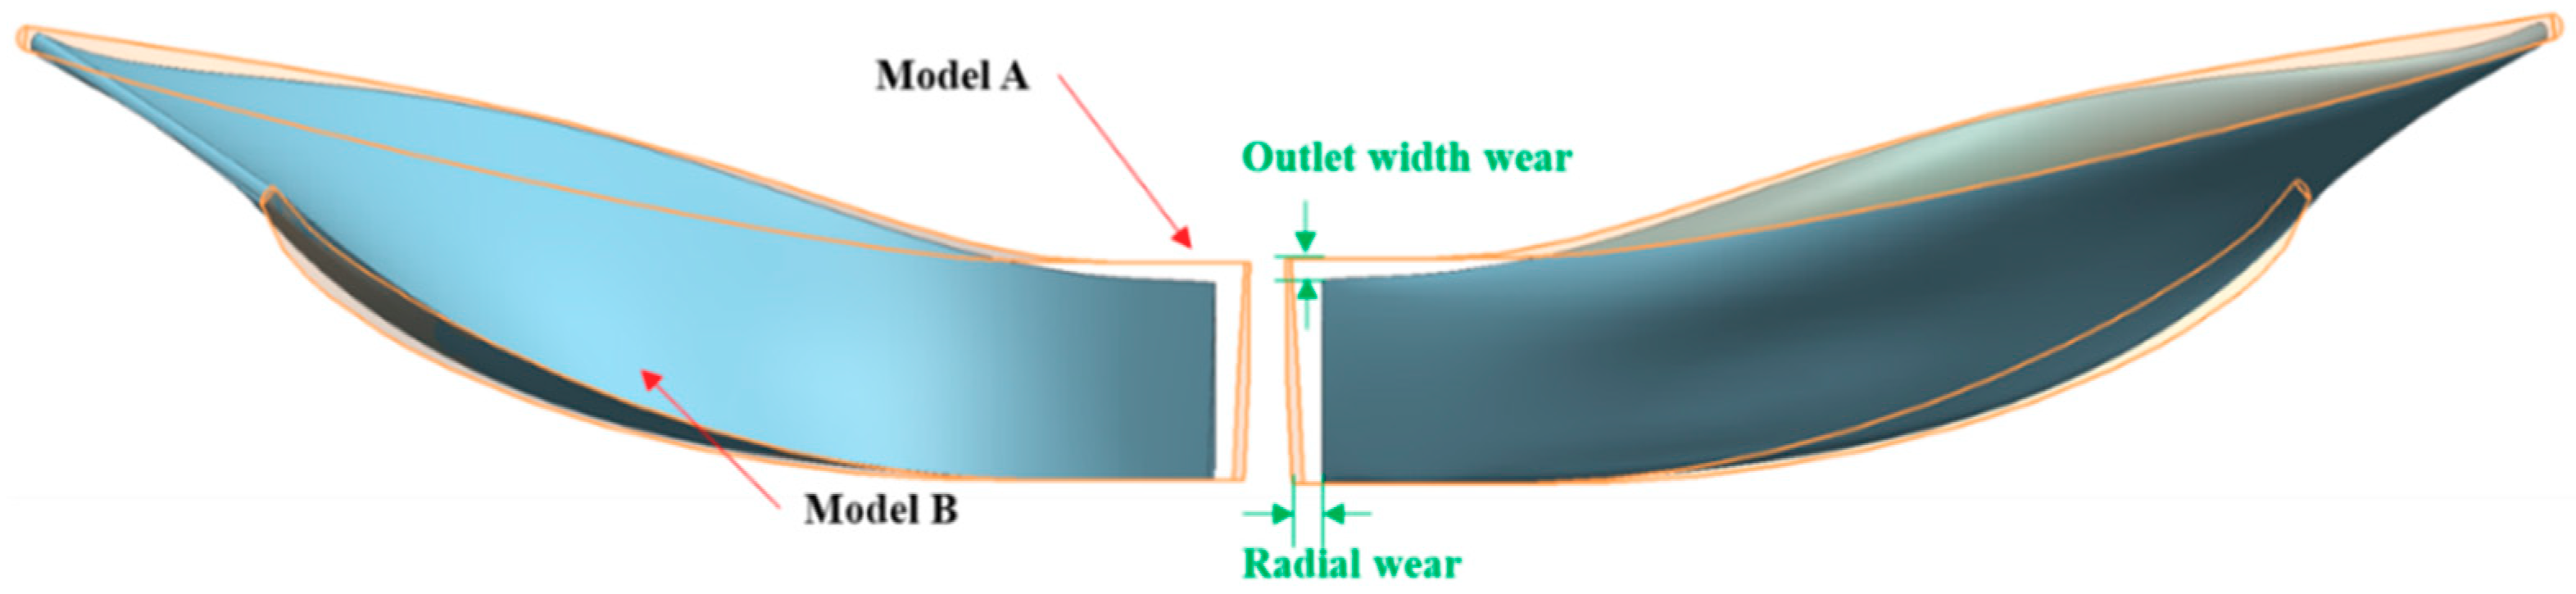
3.4. Numerical Models with Eroded Blades

In order to study the changes in erosion patterns for the pump, it is first necessary to establish a numerical model for the eroded impeller. The radius of the worn impeller, the width of the outlet, and the thickness of the blade can be easily measured, and they were eroded away by the particles at 6, 24, and 7 mm, respectively. Therefore, these three parameters were used as the main control variables to establish the geometry model for the eroded impeller.
Depending on the degree of wear, the worn impeller can be divided into three distinct wear stages, namely, mild wear, moderate wear, and severe wear. However, this article only considers the unworn impeller (model A) and the mildly worn impeller (model B). The main parameters are shown in Table 2. Subsequently, based on model A, the erosion patterns for the unworn impeller were predicted, detailed presented in the following Section 4.3.1.
Based on the blade profile, as well as the predicted erosion area of model A, model B was established qualitatively. After both models were built, the profiles of the unworn impeller, the slightly worn impeller, and the actually failed impeller were compared, as shown in Figure 3 and Figure 4. Basically, the blade profile of model B is similar to that of model A and the actually failed impeller, and the profile size is in between these two values.

4. Results and Discussions

4.1. Pump Performances

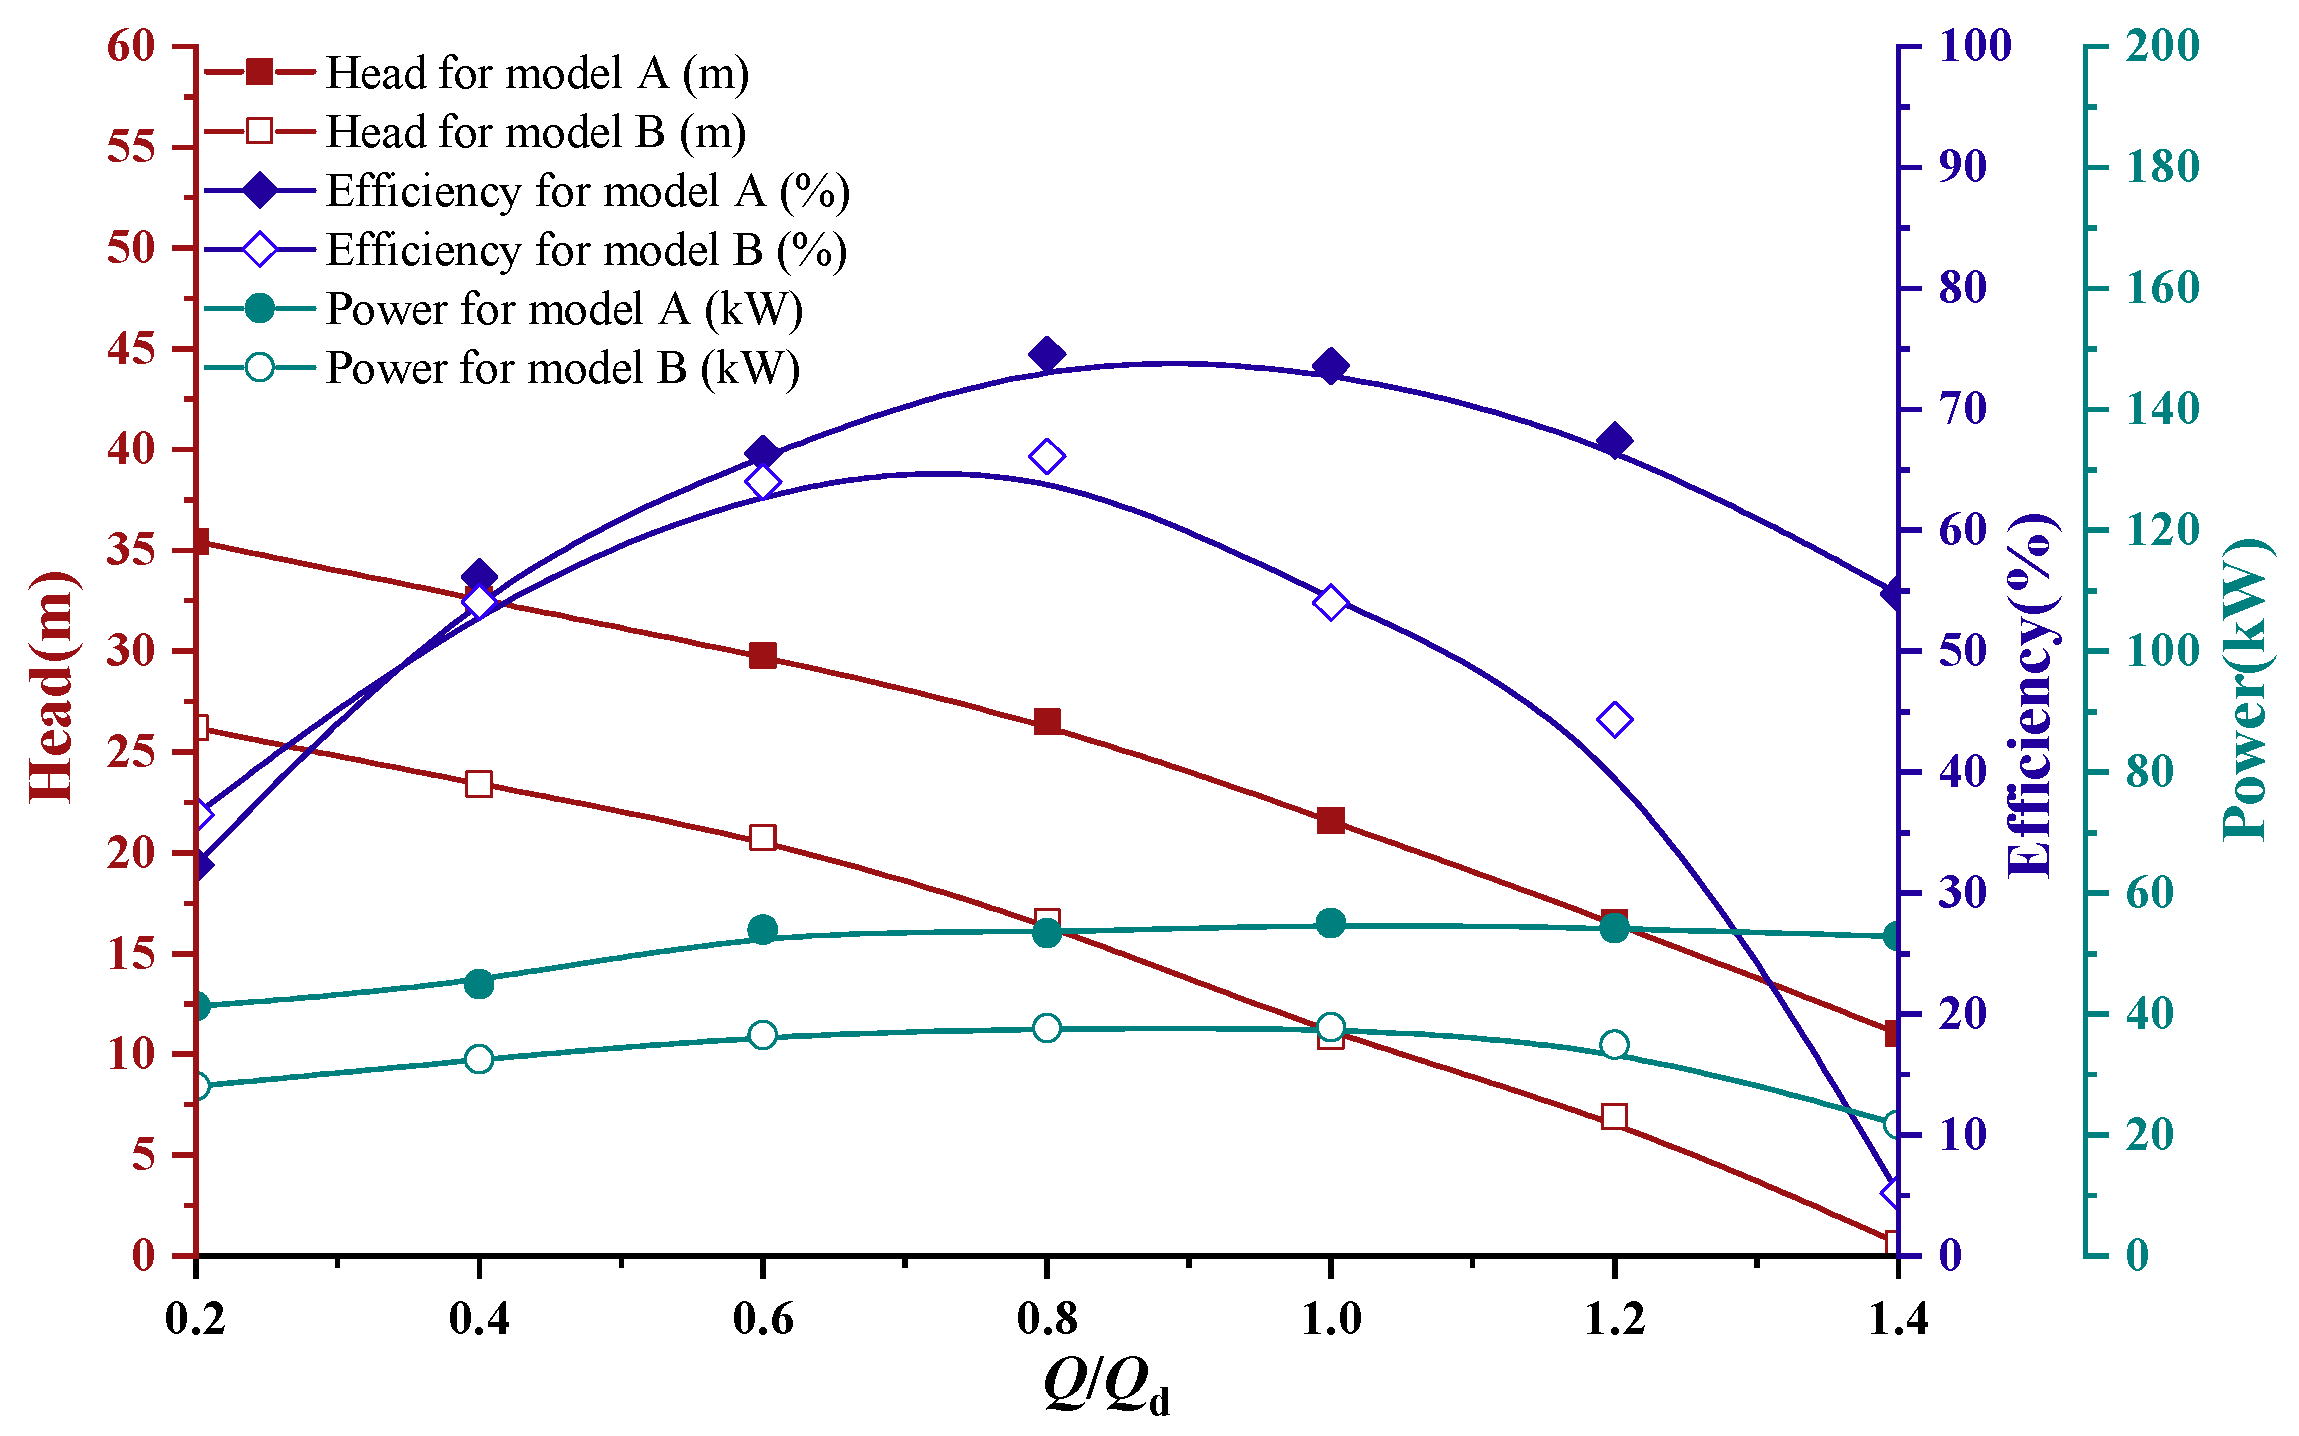
4.1.1. Pump Performances under Pure Water Conditions

Figure 5 gives the predicted performances under pure-water conditions from 0.2 to 1.4Qd for model A and model B. As illustrated in the graph, the performance of the pump is greatly reduced after the impeller wears, with a significant drop for the head and efficiency.
The trend for the head with the flow rate is similar for both models and the slopes of these two curves are basically the same. In addition, the head difference between the two models under the same condition remains almost constant as the discharge increases.
On the contrary, the efficiency difference between the two models become larger as the flow rate increases. Under the rated flow rate, the efficiency drops by 19.05%. At the best efficiency point, the difference in efficiency is 8.43%, which is much lower than that at the rated flow rate. Moreover, the high-efficiency area for the pump with the intact impeller has a wide range of 0.6–1.2Qd. In contrast, after the impeller is worn, the efficiency drops sharply after 0.8Qd. This is because the shape of the blade after wear is deteriorated, therefore changing the efficiency curve.

4.1.2. Pump Performance under Two-Phase Conditions

It is well known that particles will introduce additional momentum sources to the fluid, and consequently affect the pump performance. In order to study the effect of the particles on the pump performance, calculations were carried out under the conditions with and without particles, respectively. The predicted pump performance at the rated flow rate is shown in Table 3. For both model A and B model, the performance of the pump improves slightly when particles are involved.
In order to explain the change in pump performance, the distribution of turbulent intensities for model A under both the pure-water and particle-included conditions was compared. As indicated in Figure 6, the turbulence intensity decreases as the particles are involved. This observation is consistent with the experimental results of Shi [40]. According to his research, the turbulence intensity of the fluid is reduced when the particle concentration is low, thereby inhibiting the development of small-scale vortices, which reduces the loss from flow separation and consequently increases the efficiency of the pump. The consistency also proves the effectiveness of the Lagrangian tracking method in the current study, for which the effect of the particles on the continuous phase can be qualitatively captured by this two-way coupling method.

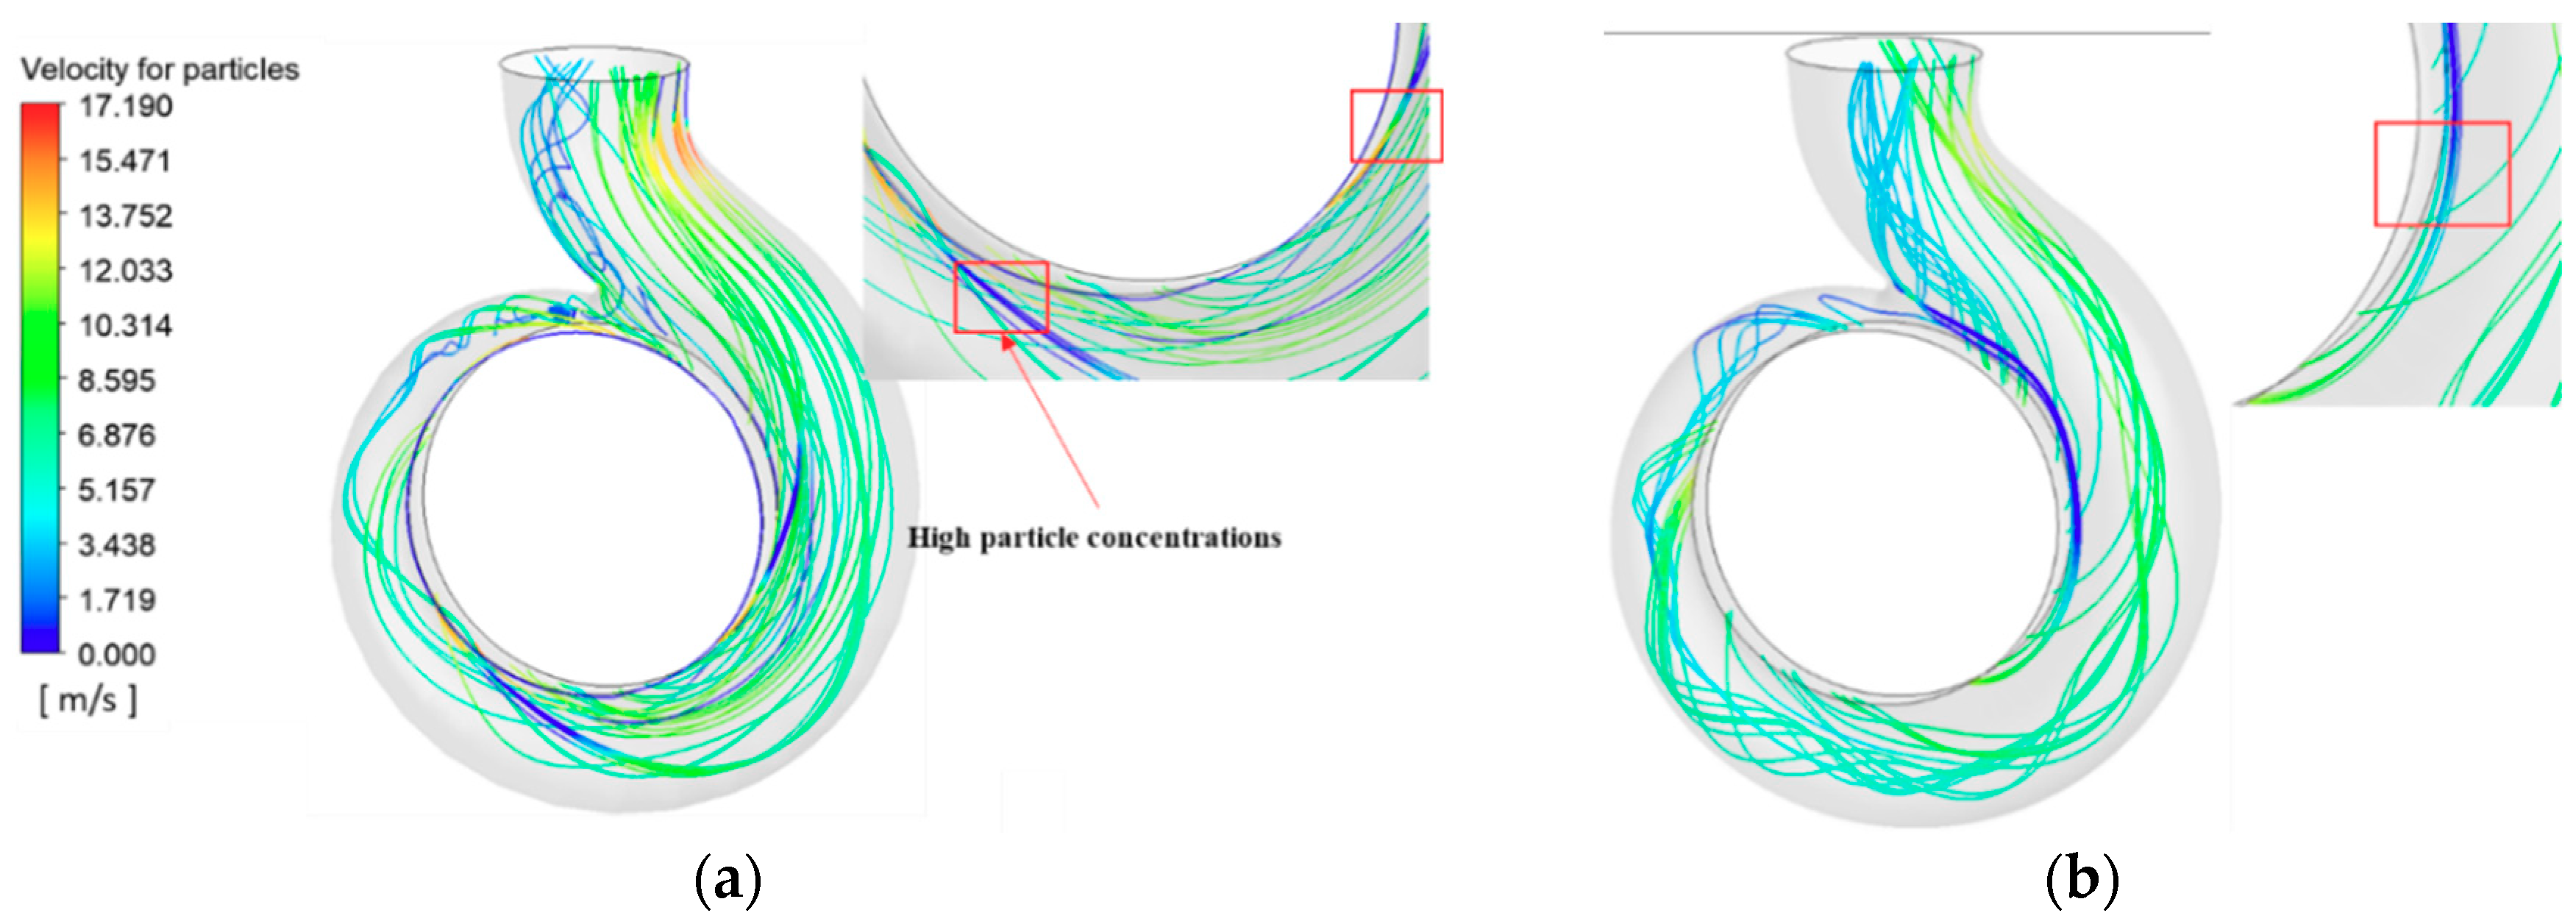
4.2. Particle Trajectories

In order to calculate the erosion rate, the positions of the particles have to be determined. In this paper, the Lagrangian tracking method is adopted to obtain the trajectories of the particles.
Figure 7a,b, show the particle trajectories of model A and model B, respectively, in a top view. For both models, the particle velocity increases from inlet to outlet, which means that the particles gain kinetic energy as they pass through the impeller.
In addition, the velocity of the particles begins to decrease after the impeller is worn. For model A, the magnitude of velocity is mainly in the range of 11–24 m/s, but for model B, the magnitude of velocity is reduced to a range of 6–21 m/s.
Furthermore, it can be observed that some of the particle trajectories formulate into vortices, and the onset of the vortices is on the pressure side of the blade. The velocity of the particles near the vortices is higher than that in other regions. Moreover, after the impeller gets worn, the vortices propagate toward the inlet side of the impeller.
Figure 7c,d show side views of the particle trajectories inside the impeller. It is found that the particle velocity near the shroud of both models is higher than that near the hub. In addition, most of the particles are concentrated near the hub, and tend to remain in a single impeller passage until they enter the volute. However, it has also been found that some of the particles enter other impeller passages through the axial clearance near the shroud. More particles near the inlet side will “climb” to the top of the blade and reach another impeller passage after the impeller gets worn.
In order to determine the relationship between the continuous phase and the discrete phase, Figure 8 present the particle trajectories inside the impeller and the fluid streamlines on different meridional planes.
As shown in Figure 8, the recirculation zone for the fluid is mainly concentrated near the shroud and the hub. After the impeller becomes worn, the area of the recirculation zone increases, leading to a higher energy loss and consequently contributing to the significant drop in the pump performances for model B.
The formation of the particle vortices is closely related to the recirculation phenomenon of the fluid as the particle locations and velocities are greatly affected by this phenomenon. It can be easy to find that the trajectories of the particle vortices move in the vicinity of the core of the recirculation zone. This tendency may result from the rotational velocity component of water, and therefore the particles are compelled to move to the core by this component. In addition, this velocity component also leads to a local higher velocity for particle vortices compared to other areas.

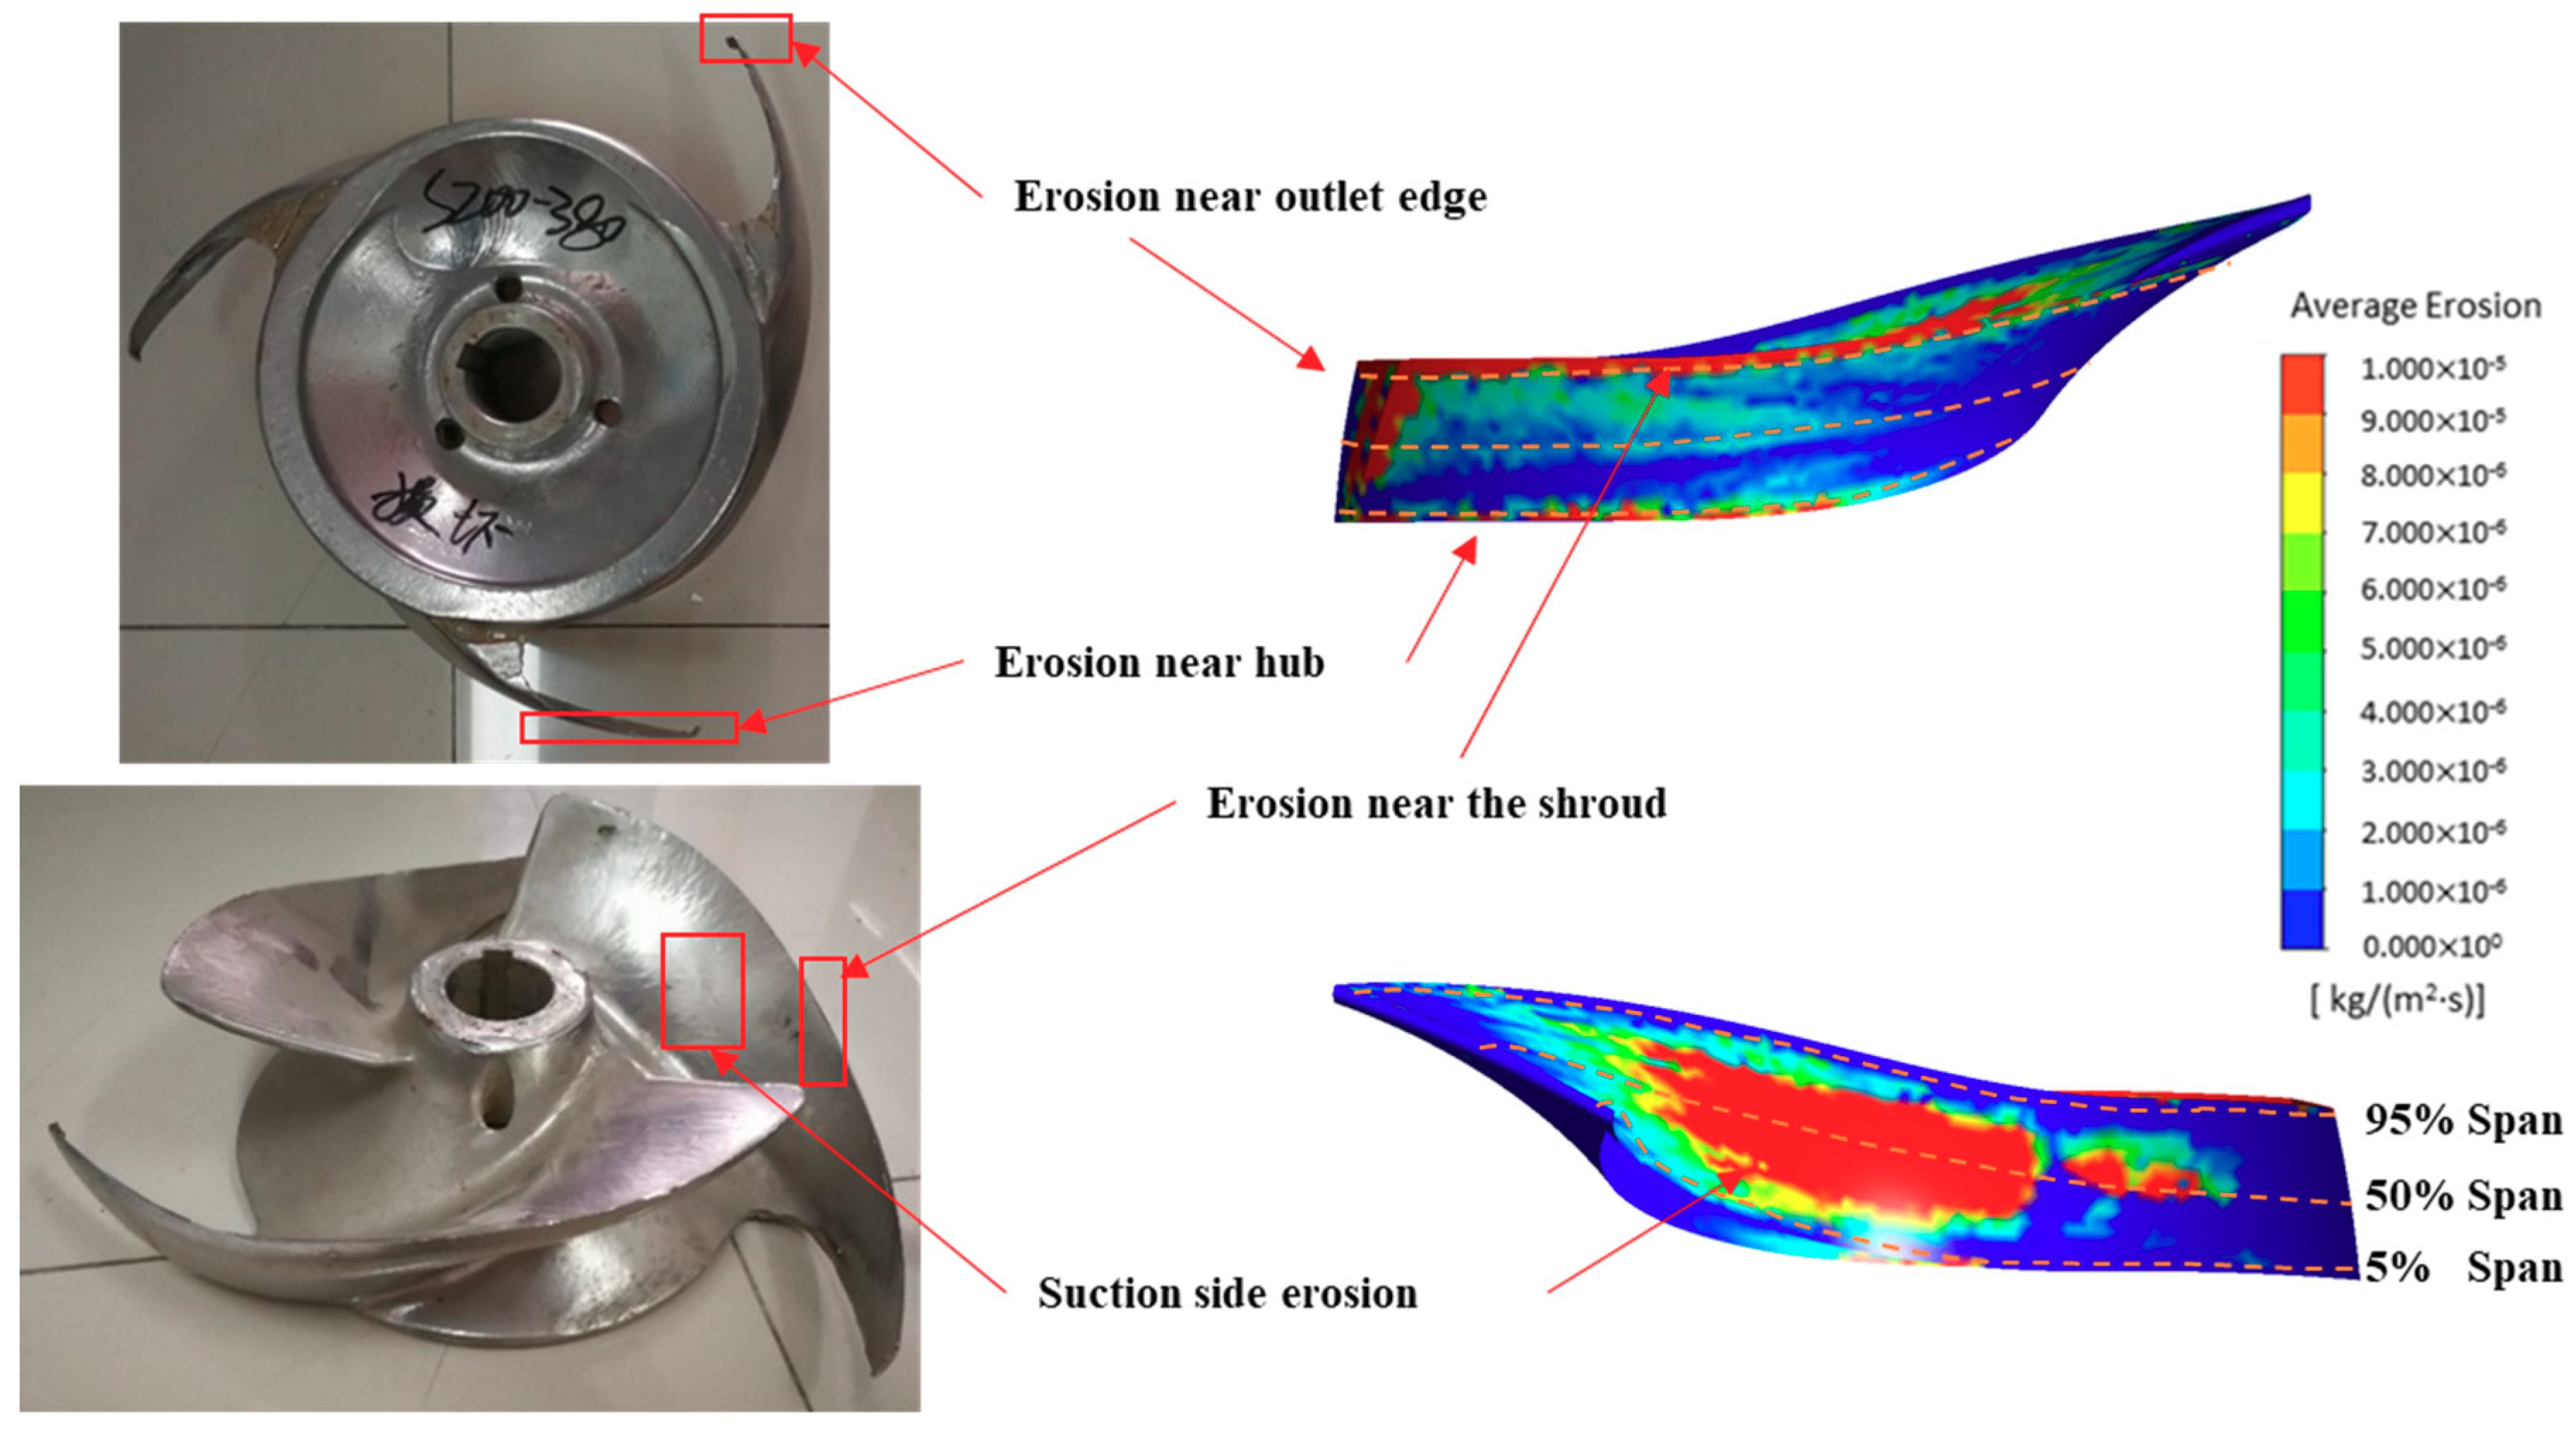
4.3. Erosion Patterns for the Pump

4.3.1. Verification of Numerical Methods

In order to evaluate the accuracy of the simulation results, the erosion pattern of the actual failed impeller was compared with that from the numerical results. Due to the interaction of the rotor and the stator [41], the flow characteristics of the pump vary with time and phase, and consequently affect the erosion patterns. In order to minimize this effect, the erosion rate of the three different circumferential positions was extracted and averaged, and the erosion contour of the blades was redrawn according to the mean value.
Firstly, according to the erosion patterns from the actual worn impeller, as shown in the left part of Figure 9, the erosion areas are classified into four main regions: erosion near the outlet edge, erosion near the shroud, erosion near the hub, and erosion on the suction side.
The predicted results for erosion are presented in the right part of Figure 9. Qualitatively, the simulation results agree well with the erosion patterns from the actual failed impeller. All of the four high worn regions for erosion have been captured. Serious erosion happens at the top and the outlet edge, corresponding to the high erosion-rate area in the simulation results. The shape of the blade top for the actual failed impeller is rounded, corresponding to the high erosion-rate area in the simulation results. The erosion areas at the suction side and the bottom of the pressure side of the actual failed impeller have also been captured by simulations.
In order to further quantitatively analyze the erosion patterns on the blades, the erosion rate distributions along the blade surface at different spans (spans of 5%, 50%, and 95%, which represent the blade bottom, middle, and top, respectively) were extracted. The erosion rate for both the pressure side and the outlet edge is shown in Figure 10a, while that on the suction side is shown in Figure 10b. Overall, the highest erosion rate happened at the outlet edge, while the pressure side was second, and the suction side was the lowest. The reason for the outlet edge (R ≈ 0.2 m) showing the highest erosion rate can be attributed to the relatively high particle velocity in the radial clearances.
In addition, the erosion rate at the 95% span is much higher than other areas on the pressure side, indicating that the top of the blade erodes faster. This is consistent with the erosion patterns of the actual failed impeller in Figure 9, which could be clearly seen from the axial direction; the top of the blade is half worn out, while the bottom of the blade is almost intact. This abnormal phenomenon can be attributed to the locally higher velocity of particles in the axial clearance. As the impeller has a semi-open shape, narrow axial clearances will be formed at both the top and the bottom of the blade, which force the particles to move faster than other regions.
Moreover, it can be found that a peak of erosion rates appears at R = 0.16 m, located at the onset of the particle vortices. It is very likely this peak results from the high-velocity particles near the vortices due to fluid recirculation, as shown in Figure 8. This phenomenon indicates that the particle vortices generated by the fluid recirculation greatly increases the erosion rate of the blades.
Compared to the pressure side, the erosion rate on the suction side is much smaller, but the affected area is much larger. The erosion rates near the top and bottom of the blade are negligible, however, the rate of erosion near the middle span (span = 50%) is much larger, as shown in Figure 10b.

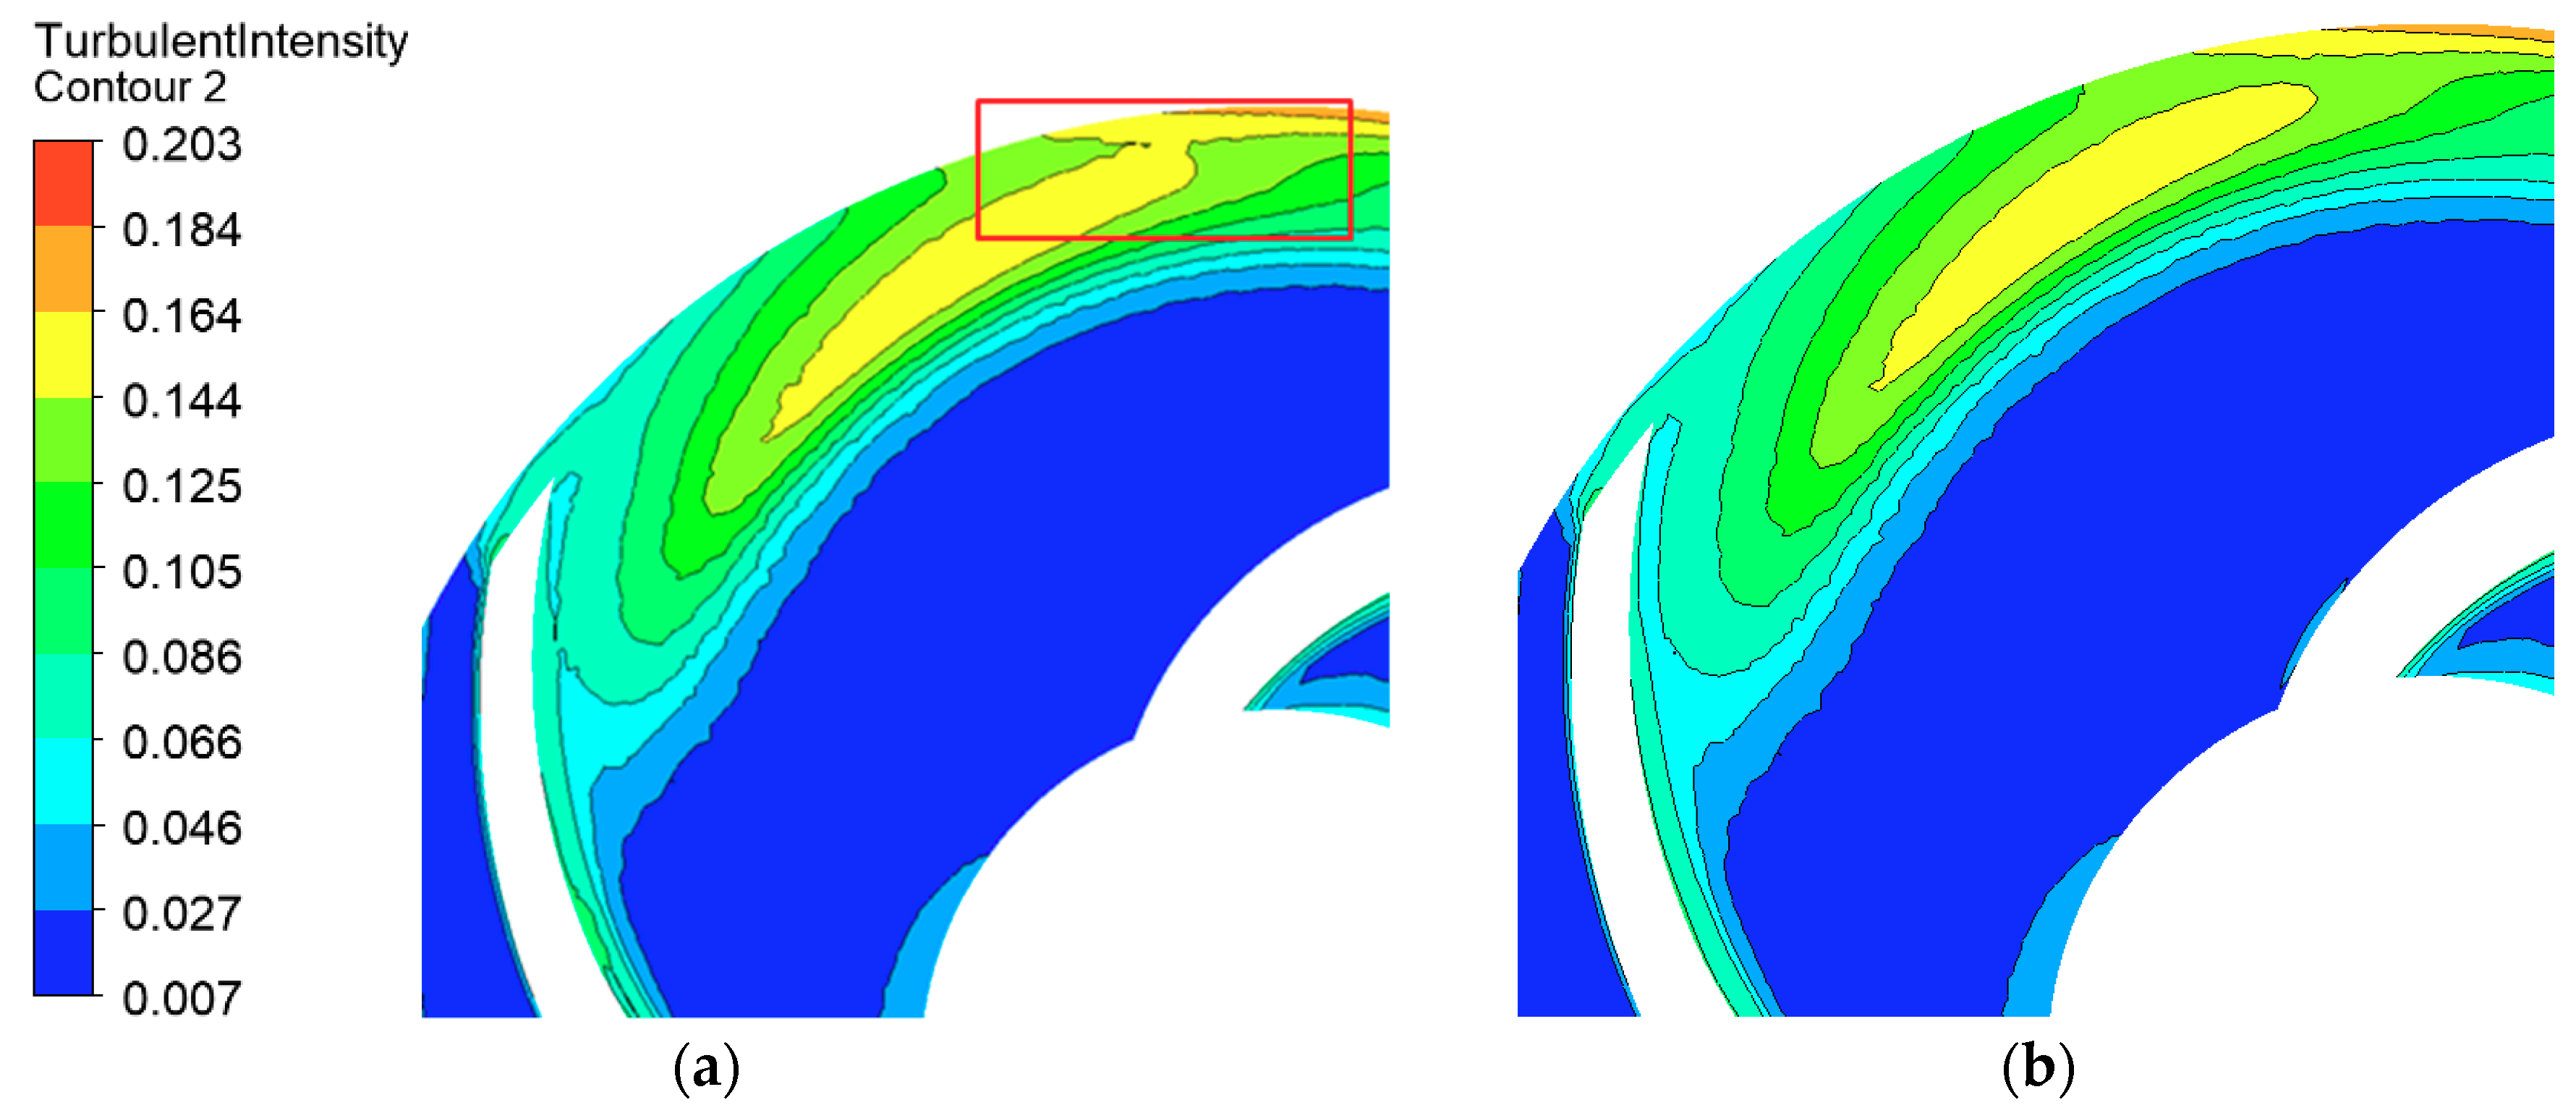
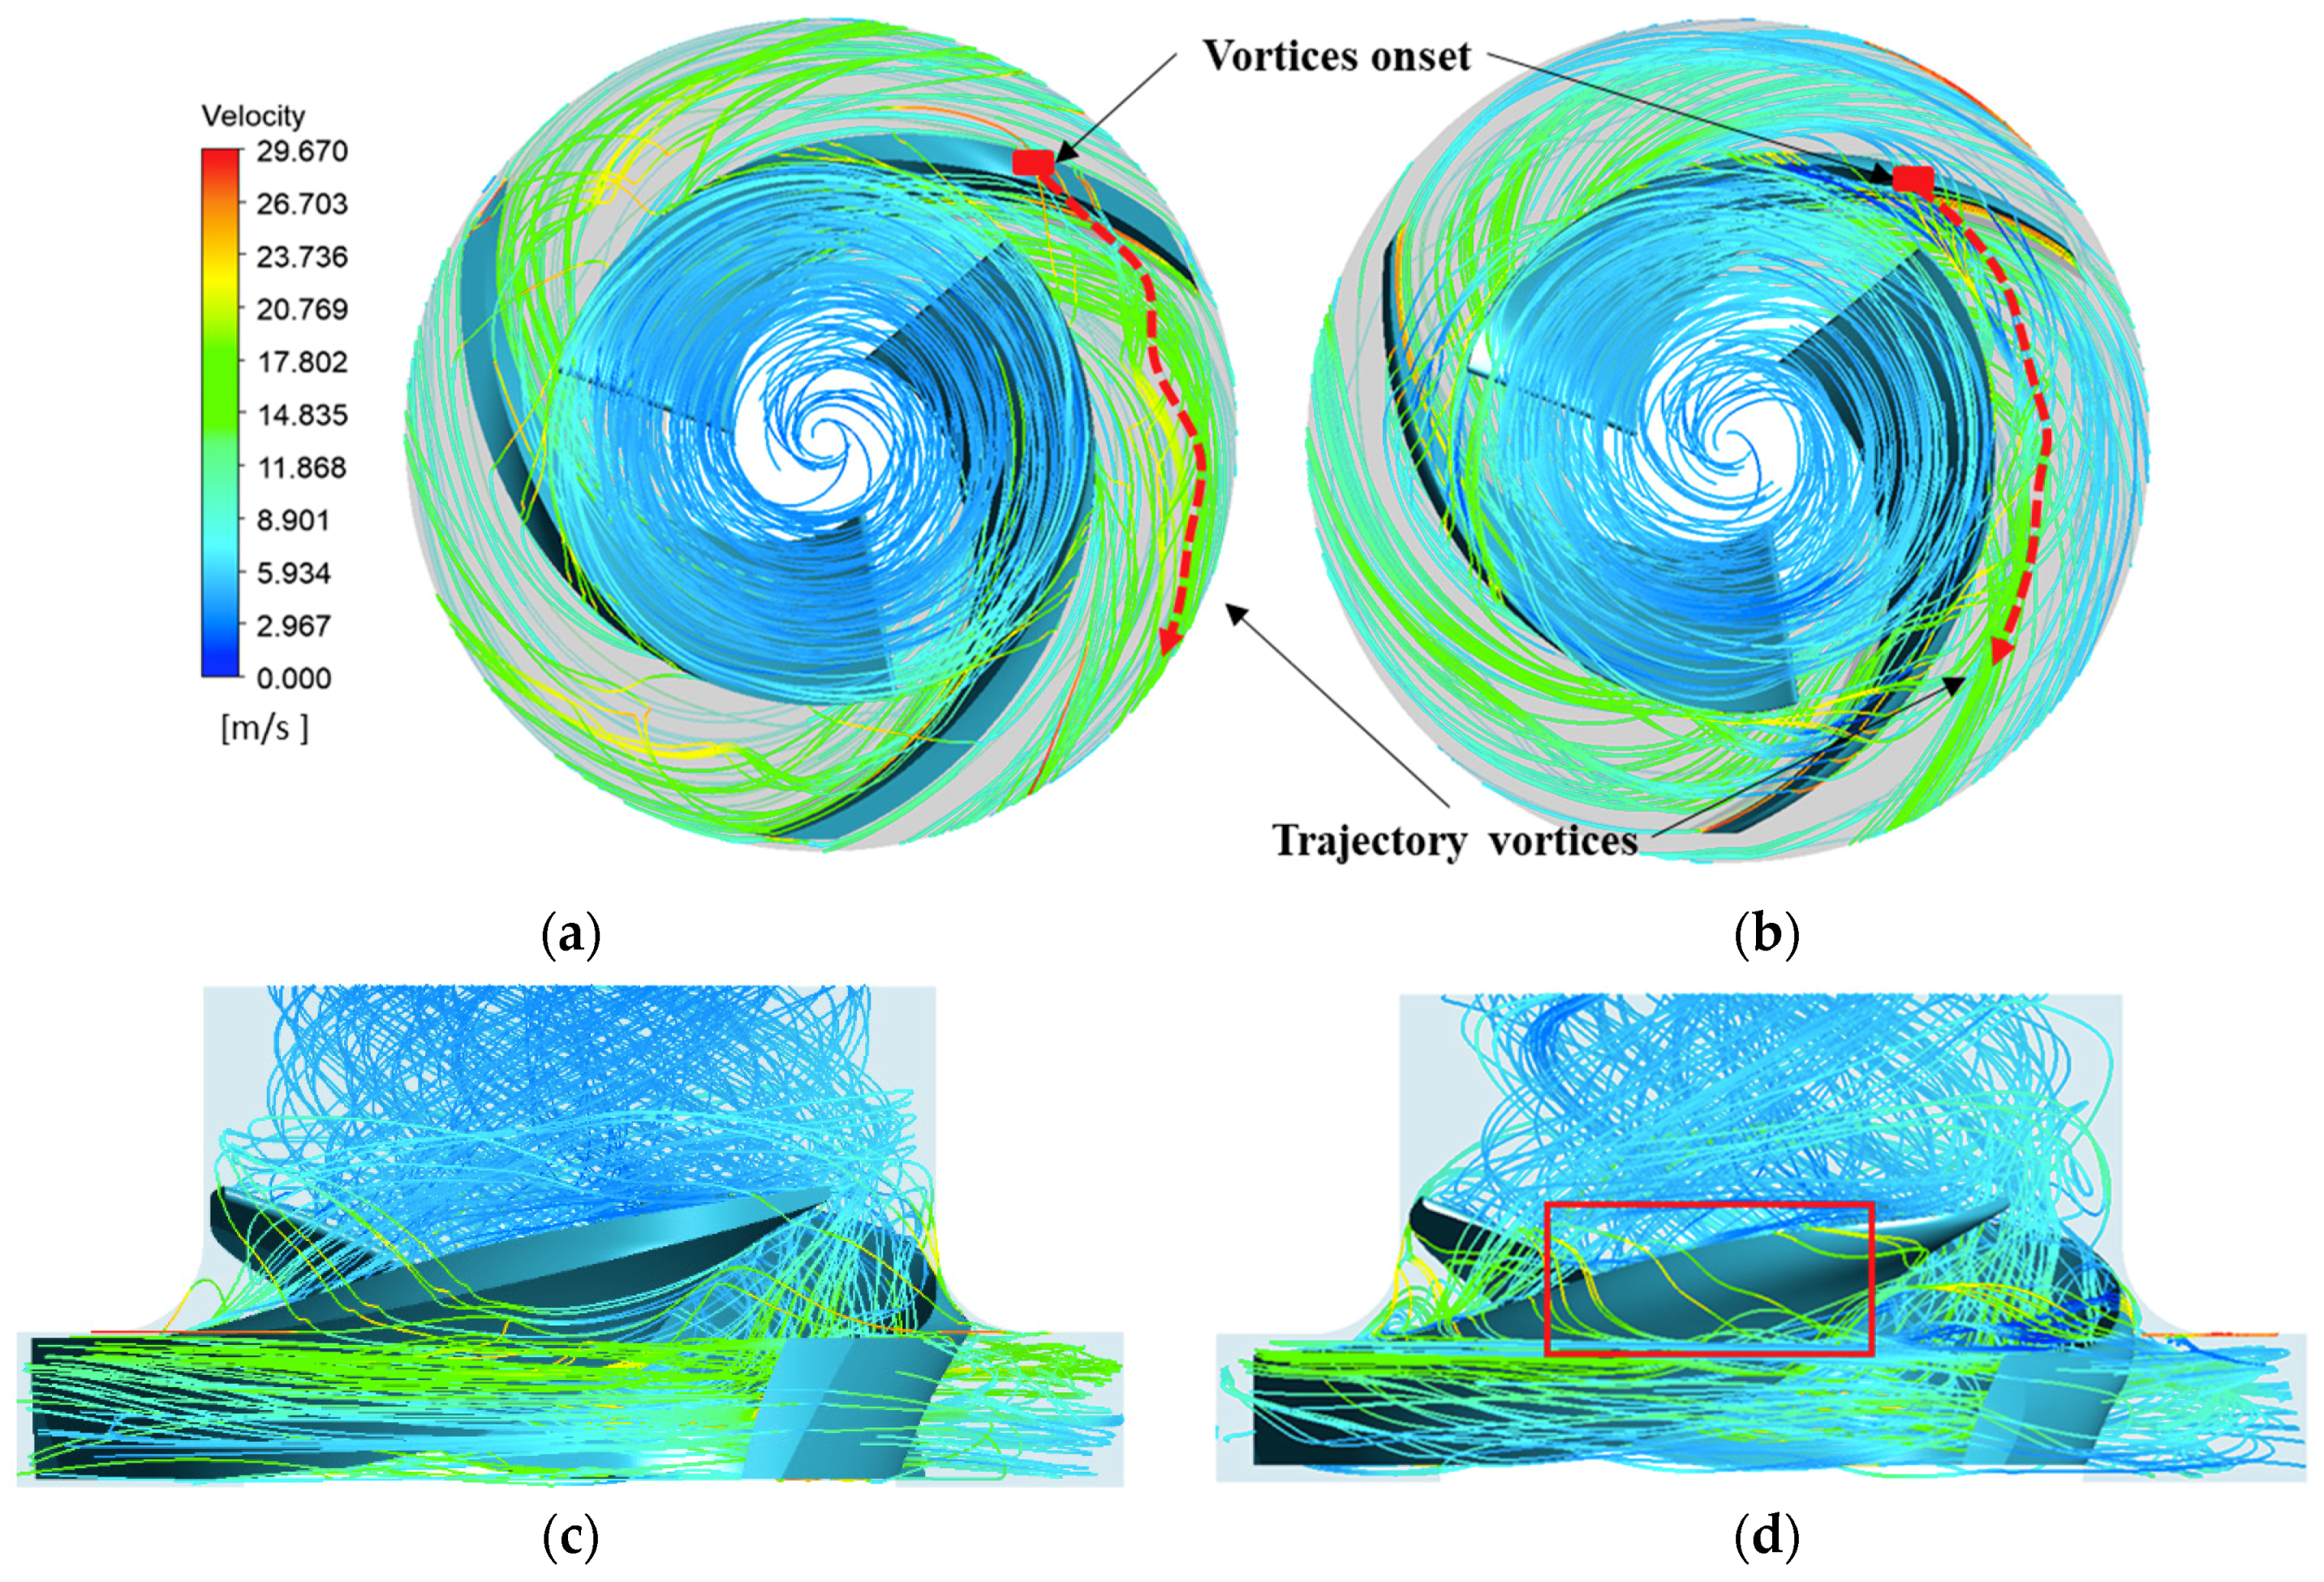
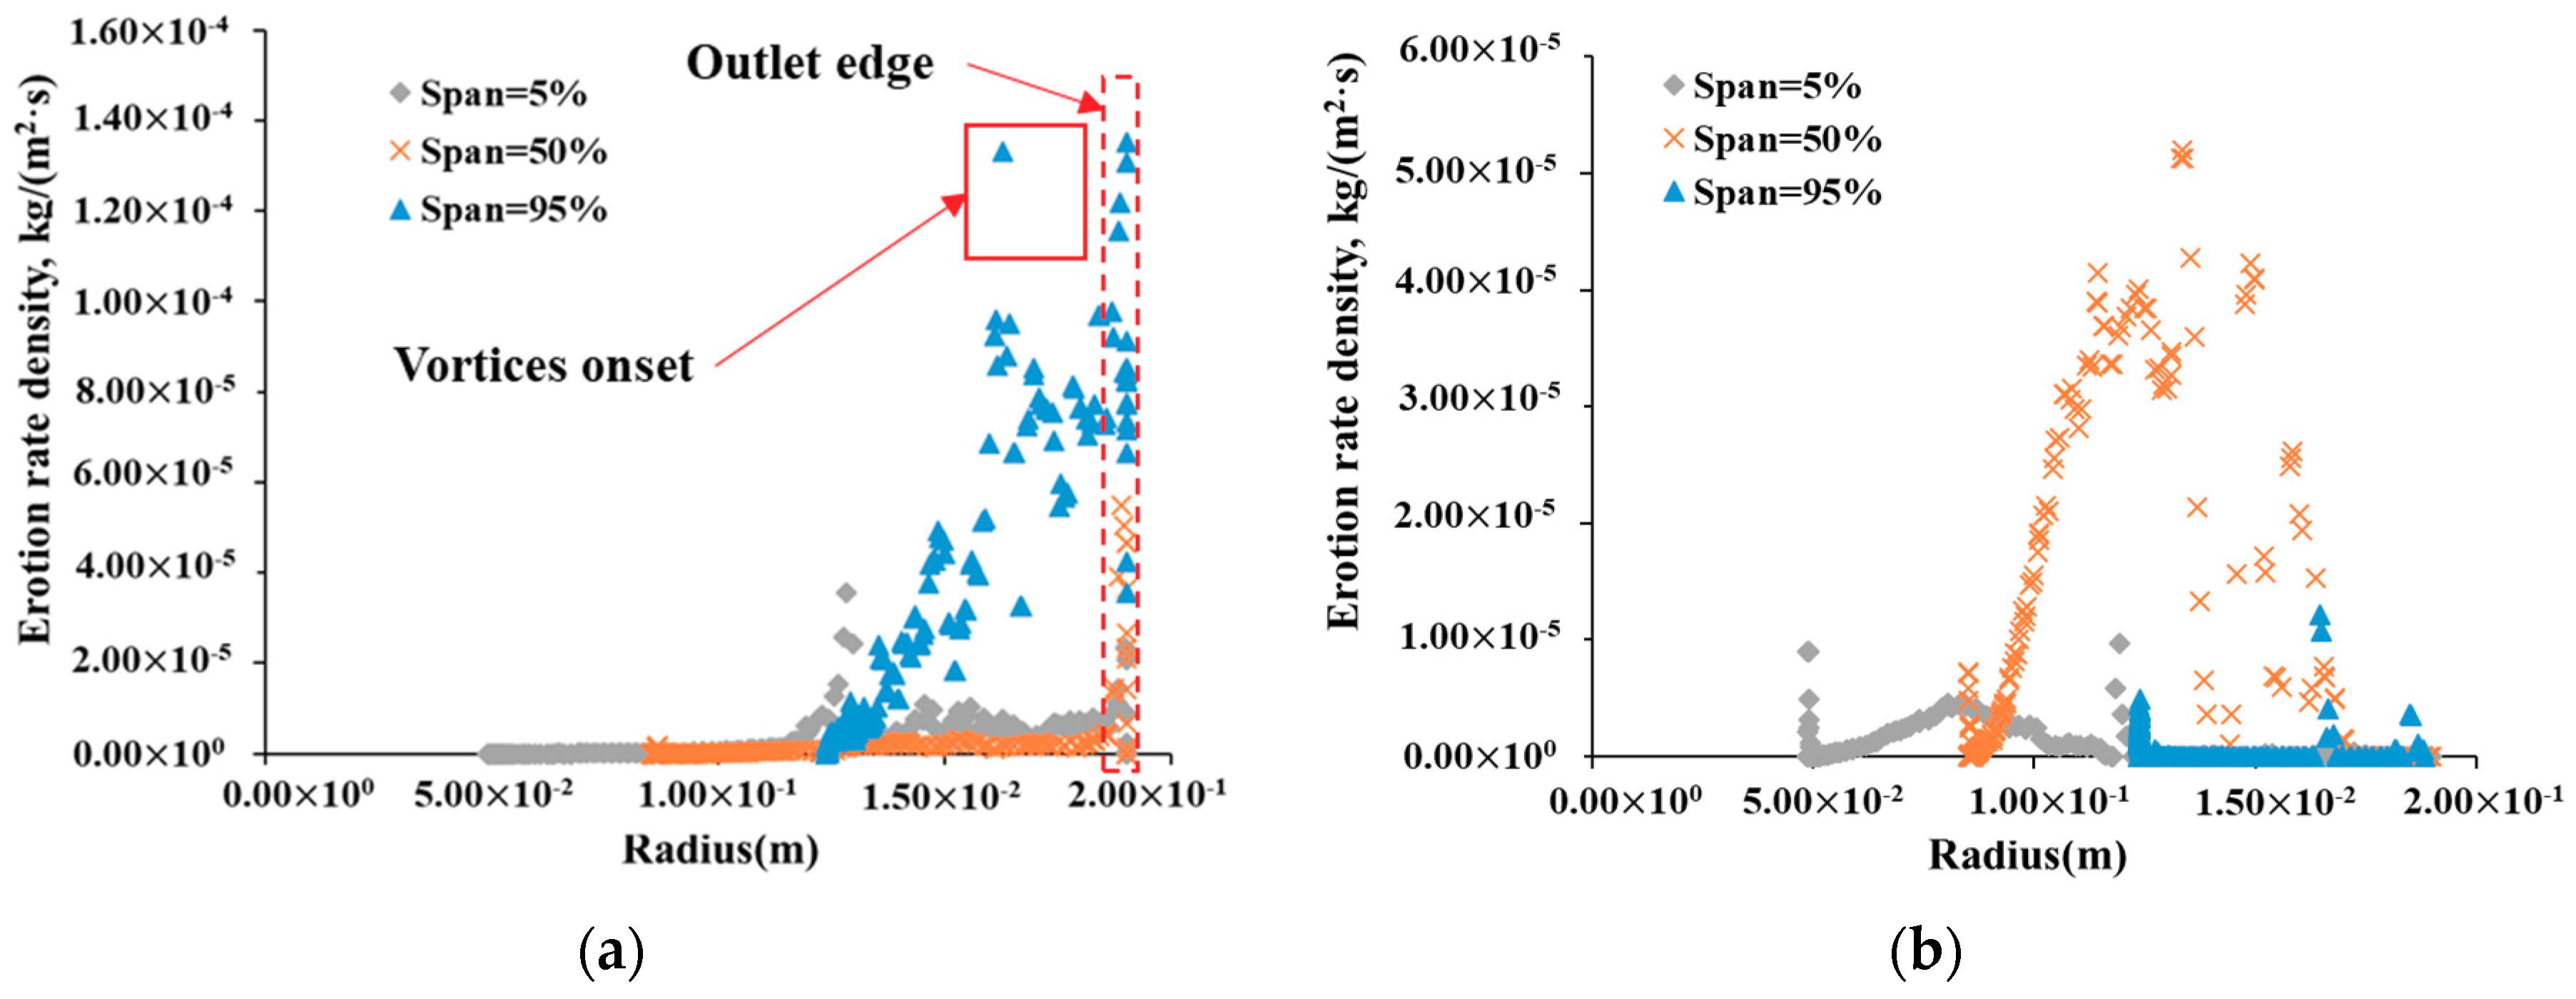
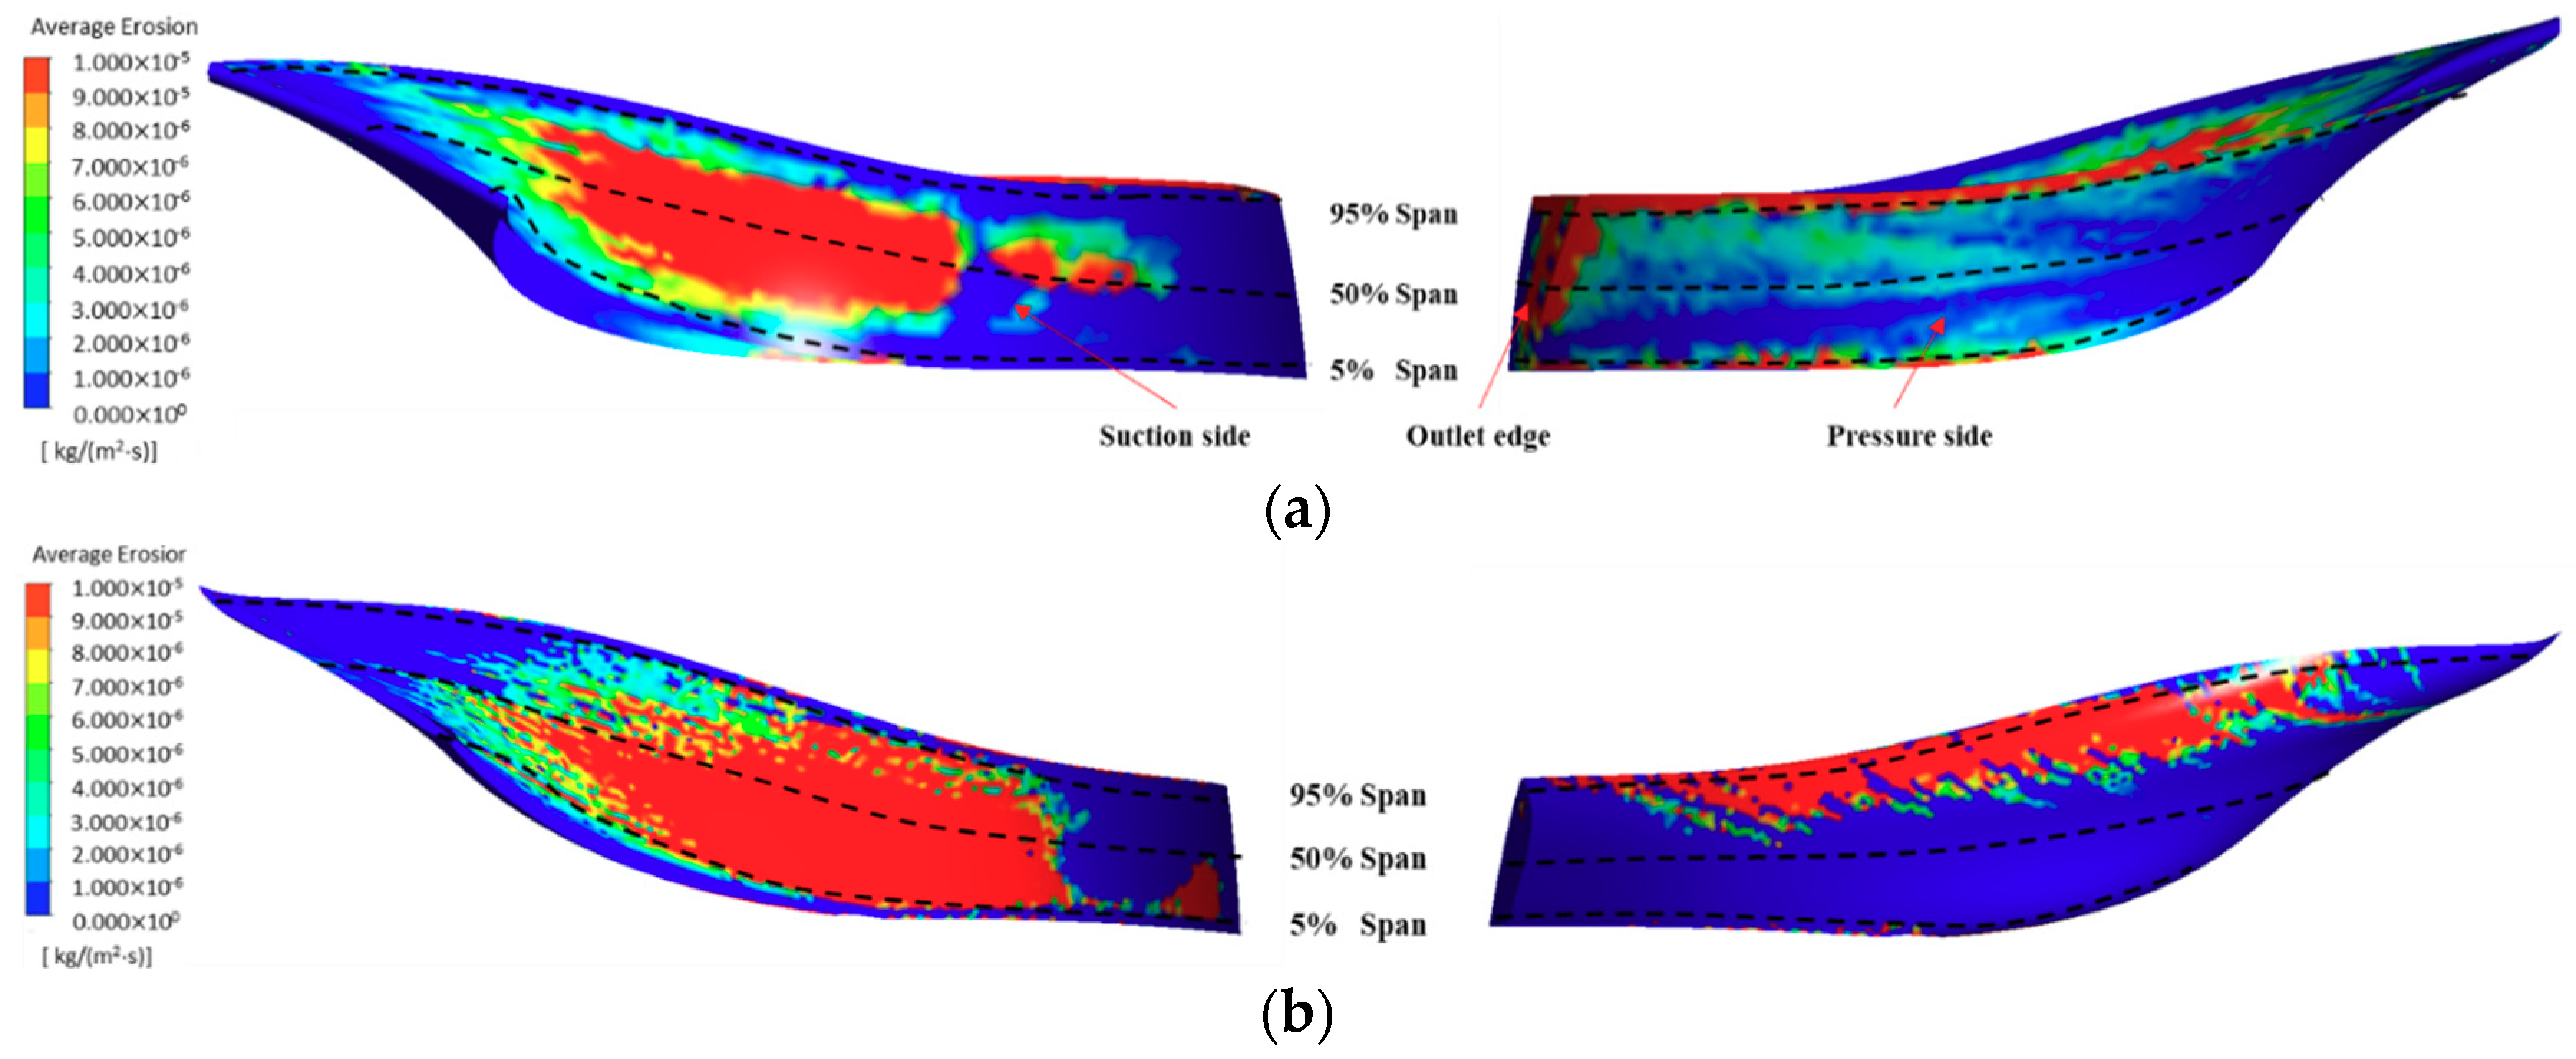
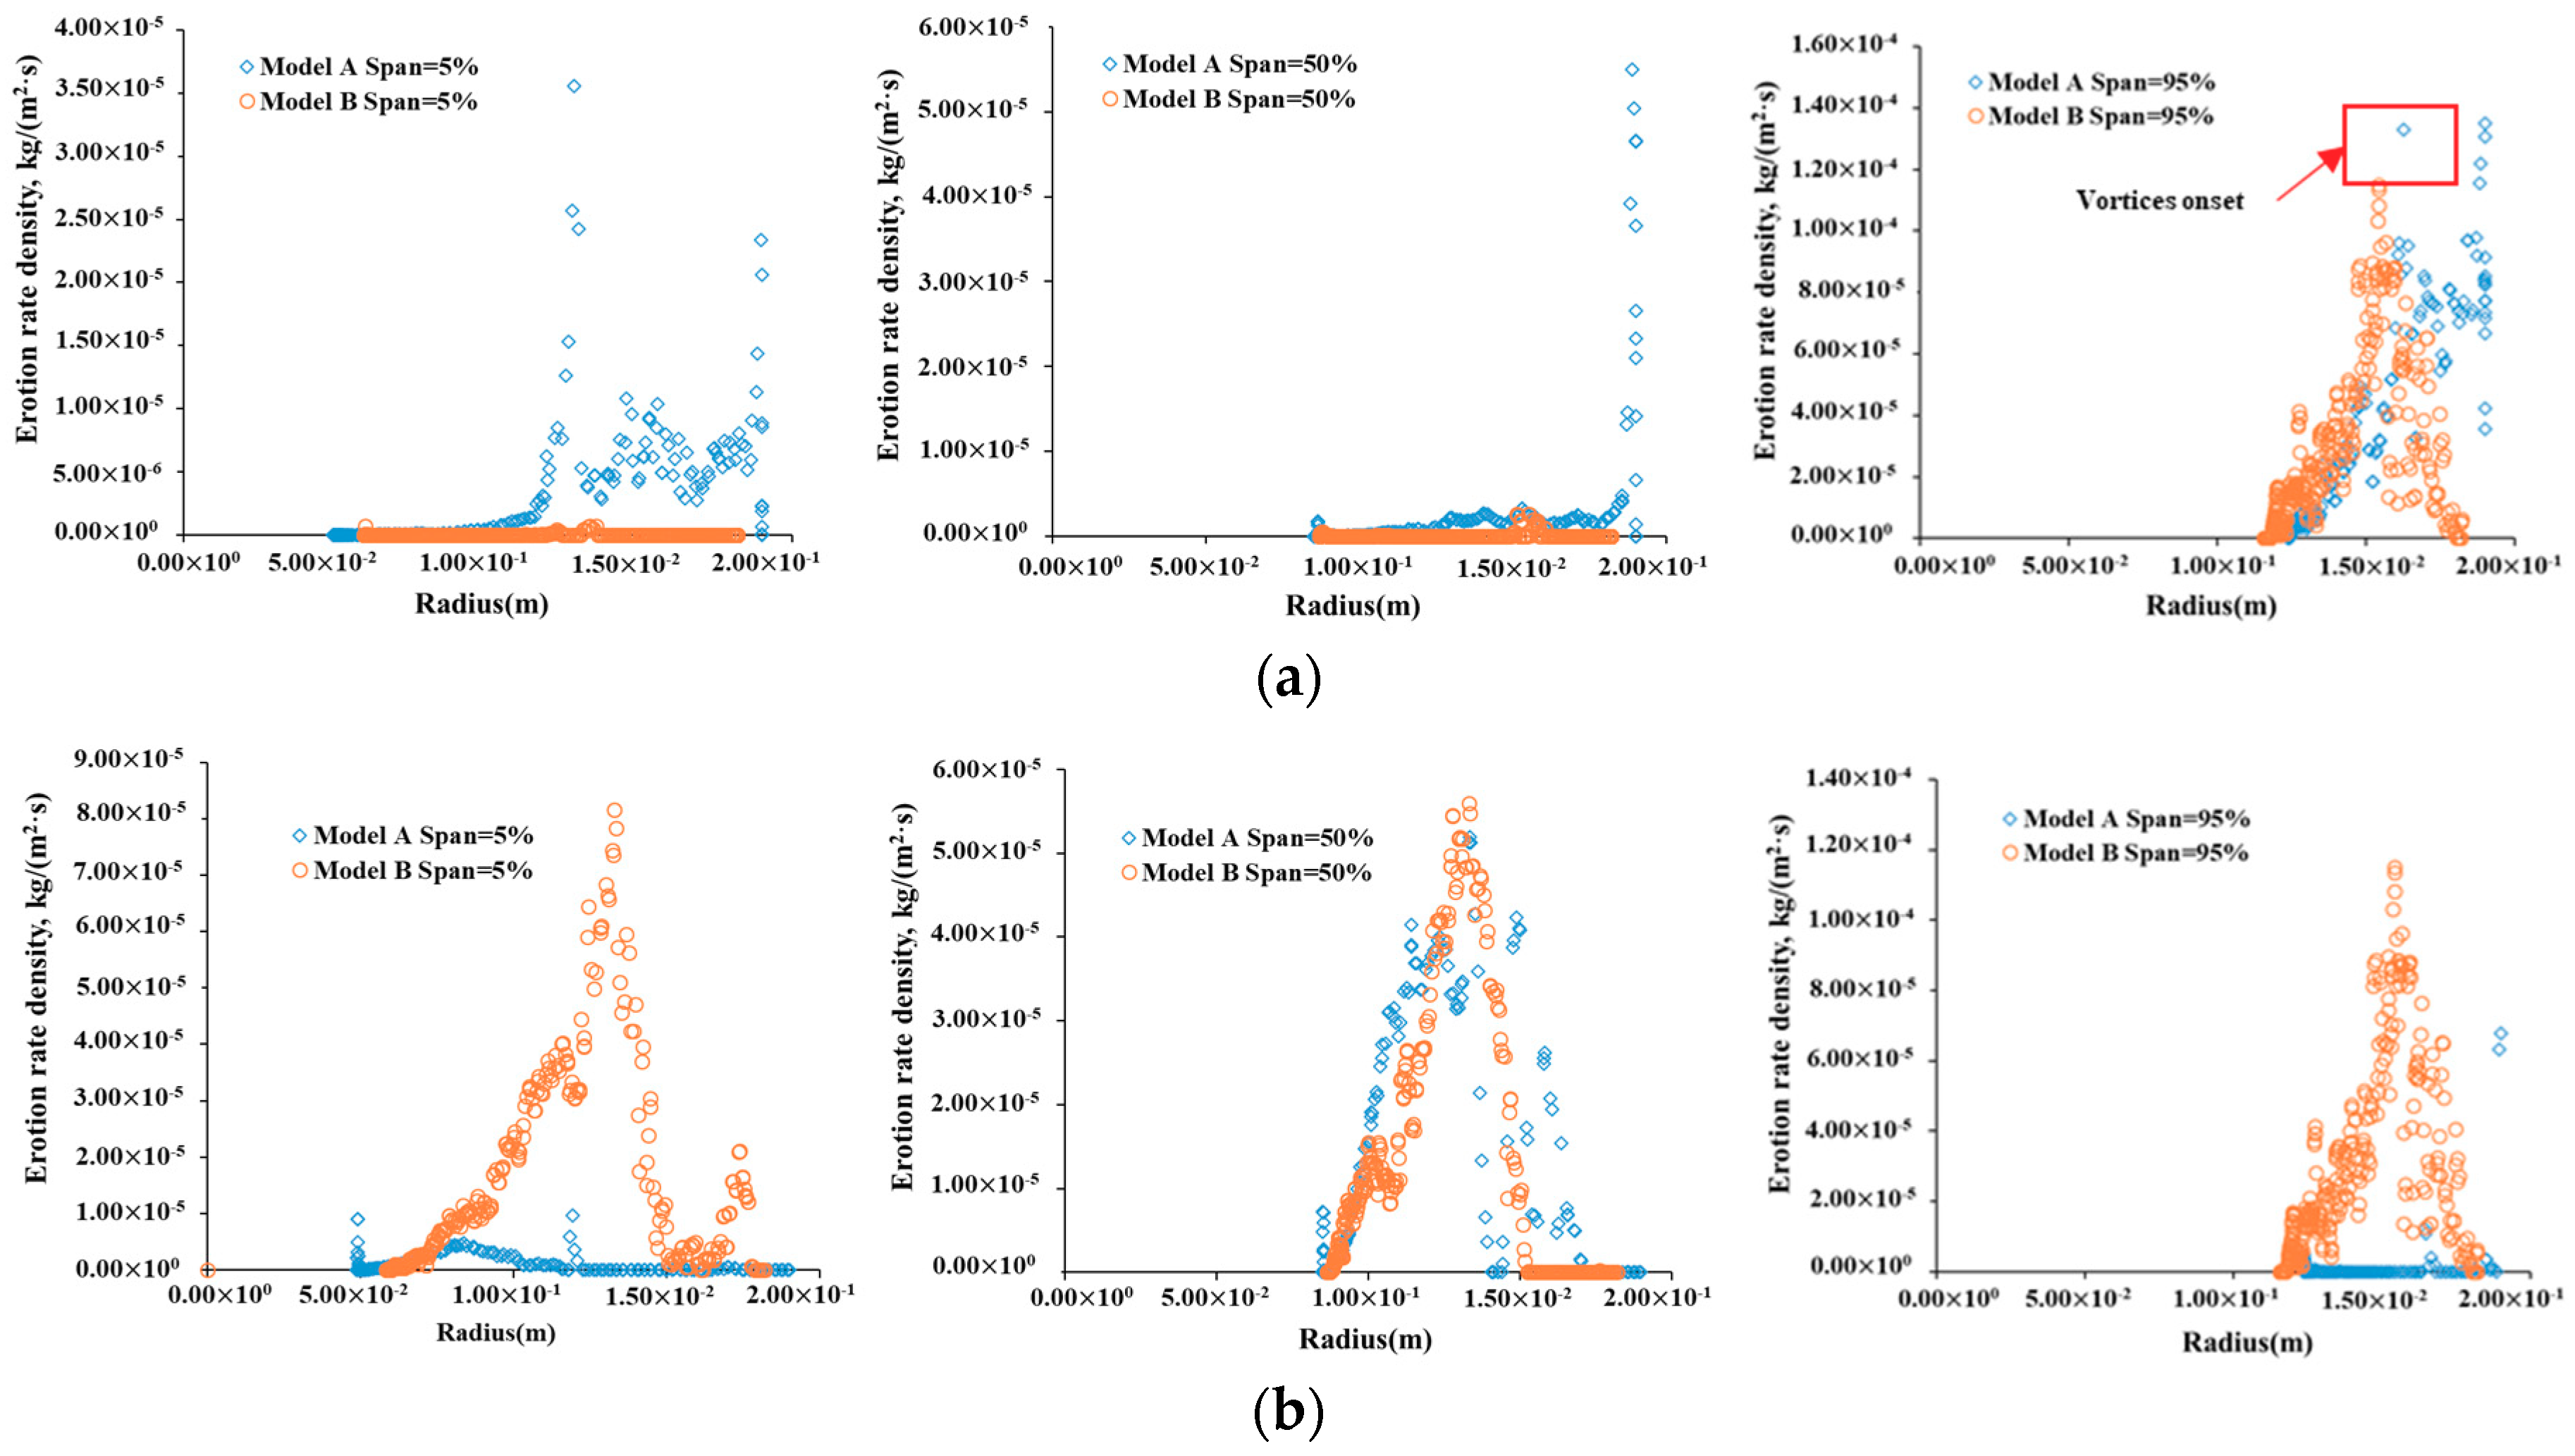
4.3.2. Evolution of Erosion Patterns for the Impeller

Similar to model A, the erosion rate of model B was averaged over three circumferential positions. The erosion patterns predicted for both models are depicted in Figure 11. After the impeller wears, the erosion area at the top of the blade begins to expand in the axial direction on the pressure side. However, the erosion area near the bottom and outlet of the blade shrinks significantly. For the suction side, the erosion area also expands significantly, reaching close to the top and bottom of the blade.
To quantitatively demonstrate the change in erosion patterns for the impeller, the erosion rates of different blade spans were compared between model A and model B, as shown in Figure 12.
The erosion rate near the impeller outlet (R ≈ 0.2 m) is greatly reduced, as shown in Figure 12a. This reduction can be partly explained on the basis that the local particle velocity decreases after the impeller wears, which results from the increased radial clearances and the deterioration of pump performance. Also, the shift of particle trajectories away from the outlet edge is a major factor for this reduction. As shown in Figure 8, the recirculation is enhanced after the wear of the impeller, which means the particles tend to stay away from the outlet edge. Consequently, the number of particles impacting on the impeller outlet decreases. As for other parts on the pressure side, the erosion rates near the middle (Span = 50%) and the bottom (Span = 5%) of the blades also decrease significantly, as shown in Figure 12a. The reduction in these areas can be accounted for due to similar reasons as those stated above.
In contrast, the erosion rate at the top of the blade (Span = 95%) is slightly reduced, as shown in Figure 12a, whereas the affected region near the blade top is enlarged, as shown in Figure 11. The erosion reduction should be attributed to the lower particle velocity. In the meantime, the enlarged erosion region can mainly be accounted for by the larger scope of particle movements due to enhanced recirculation of water near the blade top. As shown in Figure 8, more particles cross the blade top, which leads to a larger number of particle impacts near the top of the blades, resulting in a larger erosion area. Meanwhile, it can also be found that the peak for the erosion rate on the blade top (95%) has shifted from R = 0.16 m to R = 0.14 m, corresponding to the position change for vortices onset in Figure 7.
Figure 12b shows the comparisons for the erosion rates on the suction side. The erosion rates at 5% and 95% of blade spans rise greatly due to the larger scope for particle movements and reduced axial clearances near the shroud. However, for the 50% span, the erosion rate shows a similar distribution in both cases.
From the above discussion, it can be seen the fluid characteristics and erosion patterns are closely related. Particularly, the flow in both the axial and radial clearances, as well as the recirculation of fluid in the impeller, is found to affect the evolution of erosion patterns significantly.

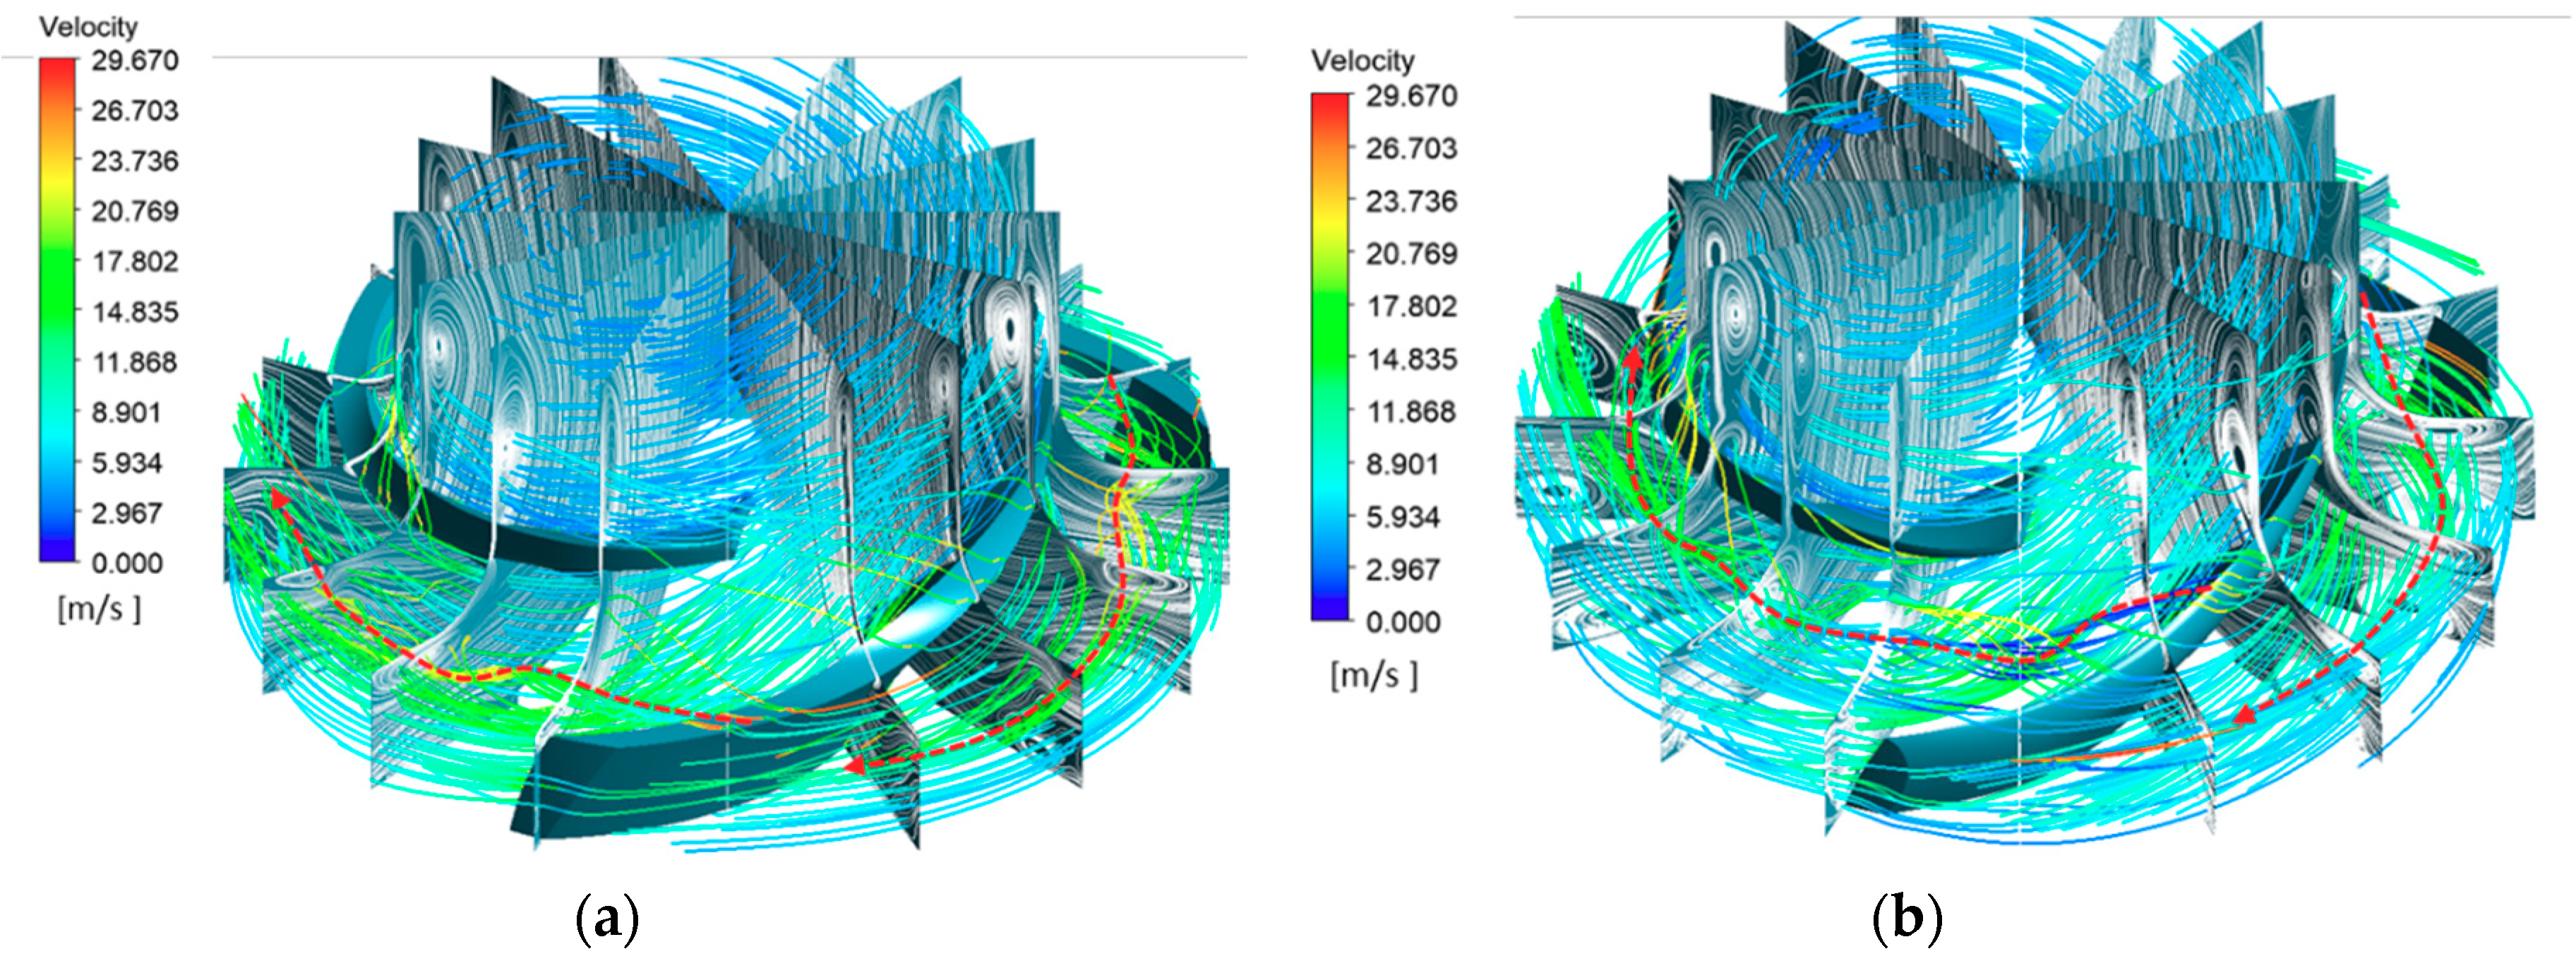
4.3.3. Evolution of Erosion Patterns for the Volute

The trajectory of the particles is first displayed to compare the changes in particle velocity between model A and model B, as shown in Figure 13. For both models, there is a low-velocity zone near the inlet and a high-velocity zone near the outside of the volute. In addition, as shown in Figure 13b, the magnitude of velocity for model A is smaller, which may be due to the lower head after the impeller wears. Moreover, it can also be found that strong vortices have been generated near the volute tongue for both cases.
Angular averaging and redrawing of the erosion patterns of the two models are shown in Figure 14. It can be seen that the main regions for the volute erosion are concentrated near the inlet of the volute, corresponding to the low-velocity area shown in Figure 13. This would seem to stem from the local high particle concentration due to the asymmetry of the volute. After the impeller is eroded, the position of the erosion area moves toward the tongue and the erosion rate also decreases.
Since there is no actual worn volute to verify the simulation results, the predicted erosion of the volute is compared with Noon’s work [28]. This is because his centrifugal pump model is similar to the structure of the research model, as shown in Figure 13c. Reasonable agreement of erosion patterns has been achieved. The erosion occurs in the vicinity of the volute inlet, and the erosion pattern is sheet-like.

5. Conclusions

In this paper, based on the Euler-Lagrangian two-way coupled method, the change of erosion patterns for the centrifugal pump associated with the evolution of flow fields has been discussed. The main innovative aspect of this paper is that by considering the geometrical changes in models, a systematic approach to predict the erosion under different wear stages is developed. Numerical results qualitatively agree with the actual erosion patterns from field cases.
The pump performance has been calculated under the pure-water and the slurry flow conditions, respectively. The efficiency is slightly higher under the slurry flow conditions, which can be explained by the fact that the particles reduce the turbulence intensity of the water in the slurry flow. These results are consistent with experimental results from the literature, which proves that the Euler-Lagrangian two-way coupled method can simulate the effect of the discrete phase on the continuous phase.
The erosion patterns predicted for the impeller in the pre-erosion state and with worn blades have been compared. It is found that after the surface of the blade wears, the erosion rate decreases at the impeller outlet, the bottom of the blade, and the volute. These changes in erosion patterns are mainly due to the enhanced recirculation and increased clearances, leading to the shift of the particle trajectories and the decrease of the local particle velocities, indicating the important role that the flow near the radial and axial clearances plays in defining the erosion patterns.
The numerical results also show that the areas of maximum erosion have expanded both on the suction side and at the blade top on the pressure side, since the recirculation has been enhanced after the impeller wears, enabling a larger scope for the particle movements, and therefore causing a larger affected area.
This study indicates that a small change of blade profiles resulting from erosion could in turn affects the later erosion patterns by changing the flow characteristics, and subsequently the particle trajectories, demonstrating the paramount importance of considering the geometric variation of the numerical model when evaluating the erosion patterns. As many centrifugal pump impellers continue to operate after being slightly worn, the conclusions obtained in this paper are of special relevance and can be helpful to optimize future designs, especially of the blade shape and impeller chambers, to reduce operating costs.

Author Contributions

Y.X. and Z.W. conceived the idea, cases and analysis; B.G. performed the simulations and prepared the manuscript; S.-H.A. and Y.L. reviewed and edited the manuscript; G.S. visualised some figures; Y.L. provided some funding and data for current studies. Besides, although not listed as the author, many thanks were given to Alexandre Presas for the suggestions on the manuscript.

Funding

This research was funded by National Natural Science Foundation of China (No. 51479093), the National Key Research and Development Program of China (Grant No. 2017YFC0404202), the Key Laboratory of Fluid and Power Machinery (Xihua University) Ministry of Education (Grant No. SZJJ-2018-125), and the Research Fund Program of State key Laboratory of Hydroscience and Engineering (sklhse-2018-KY-02).

Conflicts of Interest

The authors declare no conflict of interest.

References

  1. Liu, X.; Luo, Y.; Wang, Z. A review on fatigue damage mechanism in hydro turbines. Renew. Sustain. Energy Rev. 2016, 54, 1–14. [Google Scholar] [CrossRef]
  2. Cao, L.; Zhang, Y.; Wang, Z.; Xiao, Y.; Liu, R. Effect of Axial Clearance on the Efficiency of a Shrouded Centrifugal Pump. J. Fluids Eng. 2015, 137, 071101. [Google Scholar]
  3. Cao, L.; Xiao, Y.; Wang, Z.; Luo, Y.; Zhao, X. Pressure fluctuation characteristics in the sidewall gaps of a centrifugal dredging pump. Eng. Comput. 2017, 34, 1054–1069. [Google Scholar] [CrossRef]
  4. Ge, J.G.; Li, C.M.; Bao, S.B.; Zhao, W.Y. Vibration analysis of large centrifugal pump rotors. Langenbecks Arch. Surg. 2013, 395, 963–967. [Google Scholar]
  5. Brennen, C.E. Hydrodynamics of Pumps; Concepts Nrec & Oxford University Press: New York, NY, USA, 1994. [Google Scholar]
  6. Hao, Y.; Tan, L. Symmetrical and unsymmetrical tip clearances on cavitation performance and radial force of a mixed flow pump as turbine at pump mode. Renew. Energy 2018, 127, 368–376. [Google Scholar] [CrossRef]
  7. Liu, Y.; Tan, L. Tip clearance on pressure fluctuation intensity and vortex characteristic of a mixed flow pump as turbine at pump mode. Renew. Energy 2018, 129, 606–615. [Google Scholar] [CrossRef]
  8. Pei, J.; Yuan, S.; Benra, F.K.; Dohmen, H.J. Numerical Prediction of Unsteady Pressure Field Within the Whole Flow Passage of a Radial Single-Blade Pump. J. Fluids Eng. 2012, 134, 101103. [Google Scholar] [CrossRef]
  9. Daily, J.W.; Nece, R.E. Chamber Dimension Effects on Induced Flow and Frictional Resistance of Enclosed Rotating Disks. J. Basic Eng. 1960, 82, 217. [Google Scholar] [CrossRef]
  10. Zhao, X.; Xiao, Y.; Wang, Z.; Luo, Y.; Cao, L. Unsteady Flow and Pressure Pulsation Characteristics Analysis of Rotating Stall in Centrifugal Pumps under off Design Conditions. J. Fluids Eng. 2017, 140, 021105. [Google Scholar] [CrossRef]
  11. Araoye, A.A.; Badr, H.M.; Ahmed, W.H.; Habib, M.A.; Alsarkhi, A. Erosion of a multistage orifice due to liquid-solid flow. Wear 2017, 390–391, 270–282. [Google Scholar] [CrossRef]
  12. Finnie, I. Erosion of surfaces by solid particles. Wear 1960, 3, 87–103. [Google Scholar] [CrossRef]
  13. Grant, G.; Tabakoff, W. Erosion Prediction in Turbomachinery Resulting from Environmental Solid Particles. J. Aircr. 1975, 12, 471–478. [Google Scholar] [CrossRef]
  14. Oka, Y.I.; Okamura, K.; Yoshida, T. Practical estimation of erosion damage caused by solid particle impact: Part 1: Effects of impact parameters on a predictive equation. Wear 2005, 259, 102–109. [Google Scholar] [CrossRef]
  15. Chen, X.; Mclaury, B.S.; Shirazi, S.A. Effects of Applying a Stochastic Rebound Model in Erosion Prediction of Elbow and Plugged Tee. In Proceedings of the ASME 2002 Joint U.S.-European Fluids Engineering Division Conference, Mentreal, QC, Canada, 14–18 July 2002; pp. 247–254. [Google Scholar]
  16. Forder, A.; Thew, M.; Harrison, D. A numerical investigation of solid particle erosion experienced within oilfield control valves. Wear 1998, 216, 184–193. [Google Scholar] [CrossRef]
  17. Messa, G.V.; Malavasi, S. The effect of sub-models and parameterizations in the simulation of abrasive jet impingement tests. Wear 2017, 370–371, 59–72. [Google Scholar] [CrossRef]
  18. Zhang, J.; McLaury, B.S.; Shirazi, S.A. Modeling sand fines erosion in elbows mounted in series. Wear 2018, 402–403, 196–206. [Google Scholar] [CrossRef]
  19. Badr, H.M.; Habib, M.A.; Ben-Mansour, R.; Said, S.A.M.; Al-Anizi, S.S. Erosion in the tube entrance region of an air-cooled heat exchanger. Int. J. Impact Eng. 2006, 32, 1440–1463. [Google Scholar] [CrossRef]
  20. Nemitallah, M.A.; Ben-Mansour, R.; Habib, M.A.; Ahmed, W.H.; Toor, I.H.; Gasem, Z.M.; Badr, H.M. Solid Particle Erosion Downstream of an Orifice. J. Fluids Eng. 2014, 137, 021302. [Google Scholar] [CrossRef]
  21. Badr, H.M.; Habib, M.A.; Ben-Mansour, R.; Said, S.A.M. Numerical investigation of erosion threshold velocity in a pipe with sudden contraction. Comput. Fluids 2005, 34, 721–742. [Google Scholar] [CrossRef]
  22. Habib, M.A.; Ben-Mansour, R.; Badr, H.M.; Kabir, M.E. Erosion and penetration rates of a pipe protruded in a sudden contraction. Comput. Fluids 2008, 37, 146–160. [Google Scholar] [CrossRef]
  23. Blau, P.J. A multi-stage wear model for grid-to-rod fretting of nuclear fuel rods. Wear 2014, 313, 89–96. [Google Scholar] [CrossRef]
  24. Blau, P.J. How common is the steady-state? The implications of wear transitions for materials selection and design. Wear 2015, 332–333, 1120–1128. [Google Scholar] [CrossRef]
  25. Nguyen, V.B.; Nguyen, Q.B.; Liu, Z.G.; Wan, S.; Lim, C.Y.H.; Zhang, Y.W. A combined numerical–experimental study on the effect of surface evolution on the water–sand multiphase flow characteristics and the material erosion behavior. Wear 2014, 319, 96–109. [Google Scholar] [CrossRef]
  26. Chitrakar, S.; Neopane, H.P.; Dahlhaug, O.G. Study of the simultaneous effects of secondary flow and sediment erosion in Francis turbines. Renew. Energy 2016, 97, 881–891. [Google Scholar] [CrossRef]
  27. Yuan Zhong, K.M. Measurement of erosion due to particle impingement and numerical prediction of wear in pump casing. Wear 1996, 199, 36–44. [Google Scholar] [CrossRef]
  28. Noon, A.A.; Kim, M.-H. Erosion wear on centrifugal pump casing due to slurry flow. Wear 2016, 364–365, 103–111. [Google Scholar] [CrossRef]
  29. Aslam Noon, A.; Kim, M.-H. Erosion wear on Francis turbine components due to sediment flow. Wear 2017, 378–379, 126–135. [Google Scholar] [CrossRef]
  30. Guangjie, P.; Zhengwei, W.; Yexiang, X.; Yongyao, L. Abrasion predictions for Francis turbines based on liquid–solid two-phase fluid simulations. Eng. Fail. Anal. 2013, 33, 327–335. [Google Scholar] [CrossRef]
  31. Chongji, Z.; Yexiang, X.; Wei, Z.; Yangyang, Y.; Lei, C.; Zhengwei, W. Pelton turbine Needle erosion prediction based on 3D three- phase flow simulation. Iop Conf. Ser. Earth Environ. Sci. 2014, 22, 052019. [Google Scholar] [CrossRef] [Green Version]
  32. Messa, G.V.; Mandelli, S.; Malavasi, S. Hydro-abrasive erosion in Pelton turbine injectors: A numerical study. Renew. Energy 2019, 130, 474–488. [Google Scholar] [CrossRef]
  33. Khanal, K.; Neopane, H.P.; Rai, S.; Thapa, M.; Bhatt, S.; Shrestha, R. A methodology for designing Francis runner blade to find minimum sediment erosion using CFD. Renew. Energy 2016, 87, 307–316. [Google Scholar] [CrossRef]
  34. Clift, R.; Grace, J.R.; Weber, M.E. Bubbles, Drops, and Particles; Academic Press: New York, NY, USA, 1978; pp. 263–264. [Google Scholar]
  35. Gosman, A.; Ioannides, E. Aspects of computer simulation of liquid-fuelled combustors. J. Energy 1983, 7, 482–490. [Google Scholar] [CrossRef]
  36. Gulich, J.F. Effect of reynolds number and surface roughness on the efficiency of centrifugal pumps. J. Fluid Eng. 2003, 125, 670–679. [Google Scholar] [CrossRef]
  37. Yexiang, X.; Zhengwei, W.; Zongguo, Y.; Mingan, L.; Ming, X.; Dingyou, L. Numerical analysis of unsteady flow under high-head operating conditions in Francis turbine. Eng. Comput. 2010, 27, 365–386. [Google Scholar] [CrossRef]
  38. Tan, M.; Guo, B.; Liu, H.; Wu, X.; Wang, K. Investigation of radial force and hydraulic performance in a centrifugal pump with different guide vane outlet angle. J. Vibroeng. 2015, 17, 3247–3260. [Google Scholar]
  39. ANSYS-CFX. ANSYS CFX-Solver Theory Guide; ANSYS Inc.: Canonsburg, PA, USA, 2017. [Google Scholar]
  40. Shi, B.; Wei, J.; Zhang, Y. A novel experimental facility for measuring internal flow of Solid-liquid two-phase flow in a centrifugal pump by PIV. Int. J. Multiph. Flow 2017, 89, 266–276. [Google Scholar] [CrossRef]
  41. Rodriguez, C.G.; Egusquiza, E.; Santos, I.F. Frequencies in the Vibration Induced by the Rotor Stator Interaction in a Centrifugal Pump Turbine. J. Fluids Eng. 2007, 129, 1428. [Google Scholar] [CrossRef]
Figure 1. (a) Calculation domains; (b) meridional sectional view for the model.
Energies 12 01523 g001
Figure 2. Generation (a) Impeller, (b) enlarged view of the impeller and (c) volute.
Energies 12 01523 g002
Figure 3. Model comparisons: (a) Model A; (b) comparisons between the failed impeller and model B; (c) Model B.
Energies 12 01523 g003
Figure 4. Model comparisons for a single blade from the side view (the yellow wireframe represents model A while the solid body is model B).
Energies 12 01523 g004
Figure 5. Performance comparisons (curves were fitted by B-Spline method)
Energies 12 01523 g005
Figure 6. Turbulent intensities for model A: (a) pure water; (b) with particles.
Energies 12 01523 g006
Figure 7. Particle trajectories in the impeller (a), (c) model A, and (b,d) model B (the red dash line qualitatively represents the location for the particle vortices).
Energies 12 01523 g007
Figure 8. Particle trajectories and the fluid streamlines of the continuous phase (a) for model A and (b) model B (the white line represents the fluid streamlines; the red dash line qualitatively represents the location for the particle vortices).
Energies 12 01523 g008
Figure 9. Results for model A with the actually worn impeller (the orange dashed line represent the positions for different blade spans).
Energies 12 01523 g009
Figure 10. Erosion rates of the impeller for model A. (a) Pressure side and outlet edge (the outlet edge are near the position of R ≈ 0.2 m); (b) suction side.
Energies 12 01523 g010
Figure 11. Comparisons of erosion patterns for (a) model A and (b) model B.
Energies 12 01523 g011
Figure 12. Erosion rates of the impeller for both models. (a) Pressure side and outlet edge (the outlet edge is near the position of R ≈ 0.2m); (b) suction side.
Energies 12 01523 g012
Figure 13. Particle trajectories for the volute for (a) model A and (b) model B.
Energies 12 01523 g013
Figure 14. Erosion development for the volute for (a) model A and (b) model B. (c) Erosion pattern for the actual volute (Noon, 2017 [28]).
Energies 12 01523 g014
Table 1. Properties for the slurry flow and pump.
ParametersDescriptions
SlurryPulp and water (5% volume fraction)
Slurry density75 kg/m3
Particles to fluids density ratio0.075
Mean diameter of particles0.5 mm
Pump materialStainless steel
Table 2. Main parameters for the eroded models.
ModelDescriptionRadius/mmOutlet Width/mmBlade Thickness/mm
AModel with unworn blades1905013
BModel with slightly worn blades1884210
Table 3. Performance comparisons at the rated discharge with and without particles.
ModelMethodEfficiency/%Head/mPower/kW
Model AWith particle73.7421.8855.30
Pure water73.5621.5954.98
Model BWith particle57.4511.3836.92
Pure water54.0110.8937.77

