1. Introduction
Biomass gasification is a promising renewable energy generation technology for a cleaner and sustainable future. Gasification can play a crucial role as an alternative to current energy technologies, which are mostly fossil-based fuels; moreover, it reduces the dependence on energy from petroleum sources [
1,
2]. There are various types of biomass that are commonly used for thermal conversion purposes, however, there are challenges in selecting the adequate type of biomass, its availability in particular target area, environmental requirements for cultivation, yield, and other properties that are mostly related to potential and economy aspects. Current gasification technologies are not yet as efficient and powerful as they are expected to be. There are a number of common and technology-specific limitations that make biomass gasification a complex and sensitive process, such as instable operation, handling of residues, fuel preparation, cost of setup/ maintenance, and the proper state of the producer gas in terms of chemical and physical properties [
3]. The drawbacks are even more emphasized when dealing with an autothermal reactor because it introduces a number of further considerations related to start-up heating and preparation. The temperature in autothermal gasifiers is determined by the equivalence ratio (ER), and to ensure high temperature for gasification, air/oxygen is usually used as agent [
4]. Autothermal gasification, however, reduces a huge amount of capital and operating cost since the required heat for carbon conversion is supplied from exothermic chemical reactions within the reactor [
5].
Reactor optimization is one of the techniques in mitigation of deficiencies imposed by the autothermal process. Several operating parameters are previously identified to have significant influence on gasification such as feeding rate, equivalence ratio, and reactor temperature, while some parameters are particularly associated with fluidized bed reactors such as minimum fluidization condition, fluidizing agent, gas flow rate, interparticular interaction, and static bed height [
6,
7,
8,
9]. Any variation of those parameters may affect the quality of the producer gas as well as the performance of the operation meanwhile, different characteristics of feedstock, e.g., thermochemical properties, carbon content, bulk density, etc. may also result in different outputs [
10]. Hence, an optimum range of variation for such parameters must be determined in order to achieve the desirable products. A study conducted on a fluidized bed reactor investigated the effect of steam/biomass ratio, time of experiments, reactor temperature, and biomass particle size on hydrogen yield and tar content in producing syngas by steam gasification of wood residue. They found that an increase in steam/biomass ratio, temperature and time resulted to increase in formation of hydrogen and lowering the production of tar and the adverse effect obtained by an increase in particle size [
6]. In another study, the effect of static bed height on the higher heating value (HHV) and cold gas efficiency was investigated in air gasification of paper sludge, and it was found that SBH has almost no significant effect on enthalpy change in all conditions [
7]. The effect of equivalence ratio on gasification of rice husk in bubbling fluidized bed gasifier was evaluated in another study and observed that the higher ER (at 0.33) results in improvement of carbon conversion efficiency (CCE) and lower production of tar content in the producer gas [
8]. Furthermore, in previous studies, the effect of ER on gasification has been studied within the range of 0.15 to 0.35, and it was observed that ER had a complex effect on gasification and an ER of 0.25 was found to describe the optimum condition of the process to produce the highest H
2 and CO compositions and lowest tar content in syngas [
11]. In another study, the effect of particle size and moisture content of pine wood was investigated on biochar yield, syngas composition, and tar content in a top-lit updraft gasifier. As the result, the yield of biochar was increased from 12.2% to 12.8% when the particle size varied from 7 to 30 mm. However, the generation of tar maximized and the production of hydrogen minimized with the increase in particle size. Furthermore, the increase in moisture content from 10% to 22% resulted in the reduction of generated tar from 12.9 to 6.2 g/m
3, as well as reducing the biochar yield in about 2% [
10].
The use of fluidized bed gasifier in this study offers an almost constant temperature profile along the reactor height as well as adequate transport properties between solid and gas phases with high specific capacity as were appointed in a previous study [
12]. Since biomass gasification is mostly controlled by a highly endothermic reaction, i.e., Bouduard’s and steam methane reforming reactions, therefore heat supply becomes an important parameter that determines the overall process performance [
4]. Most of the gasification performance studies have been conducted with externally heated laboratory-scale apparatus (by electrical heater), where the heat supply is relatively stable and well distributed [
13,
14,
15,
16,
17]. Only a few studies have reported the performance of gasification in the pure autothermal gasification system [
18]. In a study of biomass gasification, a packed bed autothermal updraft reactor was used for gasification of biomass pellets by using air or an air–steam mixture as the gasifying agent. The lower hating value of the producer gas was slightly improved to 4.5 MJ/Nm
3 when using air–steam, compared to a LHV of 4.4 MJ/Nm
3 for to air gasification. The tar generation however was found higher for air-steam gasification. Moreover, the carbon conversion for air gasification and air–steam gasification was found to be 84.3% and 91.5%, respectively [
19]. In order to reduce the temperature fluctuation while the autothermal process is ongoing, higher frequency of biomass feeding is required but with lower quantity of materials for each feeding sequence. The overload of biomass in a single feeding may result in the sudden release of volatiles in high amounts and the pressure rise as the result of trapped gas inside the chamber. The high pressure in reactor may cause reduction in the temperature and cooling of the reactor furthermore, it may reduce the fluidization zone and creates back pressure against the inlet flow. The importance of autothermal gasifier is highlighted when used for the purpose of electrification in a rural area that is restricted from the access to electricity grids. In other words, an on-site autothermal gasifier built at an affordable economic scale can overcome the high costs of grid lining, supplementary resources, and the delivery of feedstock.
The objective of this work is to use an autothermal fluidized bed gasifier for syngas production from Napier Grass and the optimization of the process conditions (temperature, ER, and SBH) using the one-factor-at-a-time (OFAT) method to obtain the highest syngas yield as well as the composition of combustible species. Also, to produce a combustible syngas with high heating value which can be used in direct combustion for power generation, the highest yield of H2 and CO and lowest content of CO2 in syngas are required. Furthermore, the minimum fluidization velocity was calculated through experimental approach and biomass characterization was performed to identify the potential of Napier grass in producing high amount of combustible syngas as it undergoes gasification.
2. Materials and Methods
2.1. Feedstock Preparation and Characterization
The selected biomass for this study is Napier grass (NG, Taiwanese). The mature NG was dried at 105 °C in an oven and then shredded via the rotor beater mill (Retsch, Haan, Gemany) into particles of 0.2 to 2 mm in size and kept in air tight plastic bags. Proximate analysis was performed to evaluate the moisture content (dry basis), ash, volatile matter and fixed carbon contents. A thermogravimetric analyzer (Mettler Toledo SDTA851, OH, USA) was used for this purpose and the related experimental procedure can be found elsewhere [
20]. The ultimate analysis to evaluate the elemental composition as well as calorific value of NG was performed. A CHNS/O analyzer (LECO CHN628 and 628S, MI, USA), following the ASTM D5291-16 [
21] method, was used to determine the composition of carbon, hydrogen, nitrogen, sulfur, and oxygen contents. An oxygen bomb calorimeter (Parr 6100, IL, USA), following BS EN ISO 18125:2017 method [
22], was used to determine the calorific value of NG. The results are listed in
Table 1.
The volatile matter of 85.52% in NG (dry basis) is relatively high compared to other common feedstock sources that are widely used in Malaysian factories such as oil palm fronds (76.98%) and palm kernel shells (69.66%) [
23]. High volatile matter is a key factor in gasification because the volatiles are involved in reactions and generate synthesis gas at the final stage of the process. The selected NG has relatively low amounts of fixed carbon and ash contents of 8.17% and 6.33%, respectively, which are both considered as suitable characteristics for gasification. High ash content negatively affects the higher heating value (HHV) [
24]. The HHV of NG at 16.33 MJ/kg is an adequate energy content of biomass and ensures the higher LHV of the producer gas. The combustibility of the producer gas is a critical factor for this study and high LHV of syngas is desirable.
The predried biomass as-received was ensured to have the moisture content below 5% because higher moisture causes several issues in feeding and fluidization. Furthermore, wet biomass decreases the gasification efficiency as it drops the temperature at oxidation zone due to the energy required to evaporate the excess water which eventually results in lower carbon conversion. Although the moisture content must not exceed a certain level, however it must be ensured not to be too low as it derives the water-gas shift reaction and produces syngas as a result. The results of proximate and ultimate analysis indicate that NG is a high potential biomass for gasification, particularly as it targets for producing an energy-rich combustible syngas.
2.2. Minimum Fluidization Velocity
In fluidized bed gasification, minimum fluidization velocity (Umf) is a significant parameter to characterize the fluidization phenomena [
25]. Furthermore, Umf can be used to calculate the correlation between the superficial velocity and static bed height and their corresponding ranges of variation. To determine the minimum fluidization velocity a pressure drop, evaluation as proposed by D. Sau (2007) was followed [
26]. Prior to starting the test, the reactor was patched with solid materials and the bed heights were adjusted within the range of 0.085 m to 0.125 m. The air passed through the bed particles for 5 min to reach the stable condition of the system. The velocity of air was then started to increase slightly with the frequency of 0.006 m per second. The pressure drop values were recorded at each time step with the help of a portable manometer (EXTECH 407910, MA, USA).
2.3. Process Description and Instruments
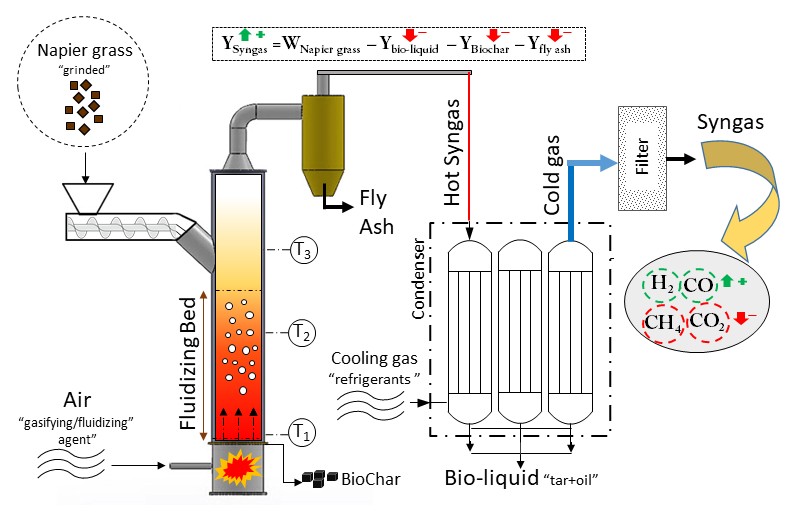
The schematic process flow diagram is illustrated in
Figure 1. The reactor chosen for this research is an autothermal bubbling fluidized bed gasifier with maximum output power of 5 kW.
The cylindrical geometry of the reactor has the diameter of 0.106 m and the total height of 1 m. The gasifier is equipped with a screw conveyor feeding system with adjustable rotational speed by a 1hp electric motor (see
Figure 2).
The feedstock can be inserted via a hopper installed at the top of the feeder. A mesh-structured grate was installed slightly above the air nozzle with the purpose of regulating the passing fluid. Three thermocouples are installed on reactor’s frame with distances of 0.1 m, 0.35 m, and 0.60 m, respectively, above the grate. A conventional air compressor supplies the required inlet air which is to be controlled and adjusted in desirable flow rate before entering the gasifier. The air plays both roles as gasifying agent and fluidization fluid.
Precombusted biomass pellets were used for start-up heating of the gasifier chamber, in which the temperature is maintained and controlled by adjusting the flow rate of inlet air. The hot gas leaving the reactor at atmospheric pressure cools down as it pass through a three-column condenser in a cocurrent flow direction with the cooling stream of fridge gas (Freon), whereby the condensates are able to be collected at the bottom of each column. The discharged gas from the condenser at 20 °C is expected to be free of particulates and carrying the least of moisture and liquid residues. Therefore the gas passes through a filter column packed with cotton fibers which is aimed to remove the tar content from the gas stream.
Due to the autothermal characteristics, the heat required for combustion of feed particles entered the gasifier is provided by the operation itself via the energy that is released from exothermic chemical reactions occurring mostly at pyrolysis stage and especially from water-gas shift reaction [
27].
2.4. Experimental Procedure
In this study, the preheating of the gasifier chamber for start-up takes 30 min, and is performed prior to each experiment by blowing air over some combusted biomass chars that have been placed inside a small container below the grate at the bottom of the gasifier. The load of start-up materials are set to raise the reactor temperature up to maximum of 600 °C. The silica sand particles (with density of 1634 kg/m3 and sieved for the particle size of 200 µm) as bed materials (control material to maintain the fluidization) were added (according to the set point of bed height) from the top of the reactor once the reactor temperature reached the temperature of 200 °C, thus the flow rate of air was adjusted to fluidize the sand granules. The volume of sand to enter the gasifier was measured in advance to determine the bed height for each experiment. The fluidizing sand particles were allowed to stay for 10 min to ensure that the fluidized bed has become stabled and the materials are completely dry. The first feeding of biomass took place when the reactor temperature was at 600 °C, and the first gas sample was collected after 2 min of feeding (according to the retention time for syngas to pass through the reactor and downstream instruments). At each experiment, ~30 min (with 6 min intervals) was taken to collect syngas, totaling 5 times, in 10 L sample bags (SKC Tedlar, CA, USA). Samples were sent for gas chromatography analyzer to determine the gas compositions. The total amount of 1 kg feedstock was used for every experiment with a constant feeding rate of 0.55 gr/s. The equivalence ratio for each experiment was adjusted by the level of air flow.
In each experiment run, after the shutdown of the operation, the trapped materials consist of bed solids, biochar, and remaining bottom ash, and were collected, separated, and weighted to be included in the mass balance. The mixture of bioliquid and tar therefore were collected at the drainage of columns of the condenser. Condensers were set to the minimum cooling degree (5 °C) for 30 min to cool down the tar which remains in vapor form and trapped inside the pipes of the condensers.
2.4.1. Product Gas Analysis
Gas chromatography (GC) was employed to determine the composition of a unit volume of the sample gas. The gas analyzer (Agilent 6890N, LabX, Ontario, Canada) was equipped with a thermal conductive detector (TCD) and a capillary column (Carboxen-1010 plot), and was used to perform the analysis. Each gas composition was determined by the help of retention time and its concentration which was calculated based on the area under the related peak.
A column of 30 m length, 530 μm diameter, and 30 μm film thickness were selected for the chromatography analysis. Argon was used as the carrier gas with the flow rate of 3 mL/min and the oven temperature was set to 35 °C. The heater temperature was set to 200 °C and the splitless inlet temperature was 60 °C. The calibration of TCD was based on the standard gas (RSS instruments sdn. bhd., Malaysia) mixture containing CO, CO2, H2, and CH4 in nitrogen at periodic intervals.
2.4.2. Uncertainty Analysis
The feeding rate of biomass in the experiments was the parameter by direct measurement; however, the reactor temperature, volumetric air flow rate, and pressure of the reactor were the parameters by indirect measurement. Uncertainty analyses of the regarded parameters are shown in
Table 2.
3. Results and Discussions
To produce a combustible syngas with a high heating value that can be used in direct combustion for power generation, the highest yield of H2 and CO and lowest content of CO2 in the syngas are required. Moreover, the performance of a suitable process is depending on a number of factors, including the products yields (gas, bio-oil, biochar, ash, and tar) and carbon conversion efficiency. The following sections are indicating the results from the minimum fluidization evaluation and the parametric studies.
3.1. Minimum Fluidization Velocity
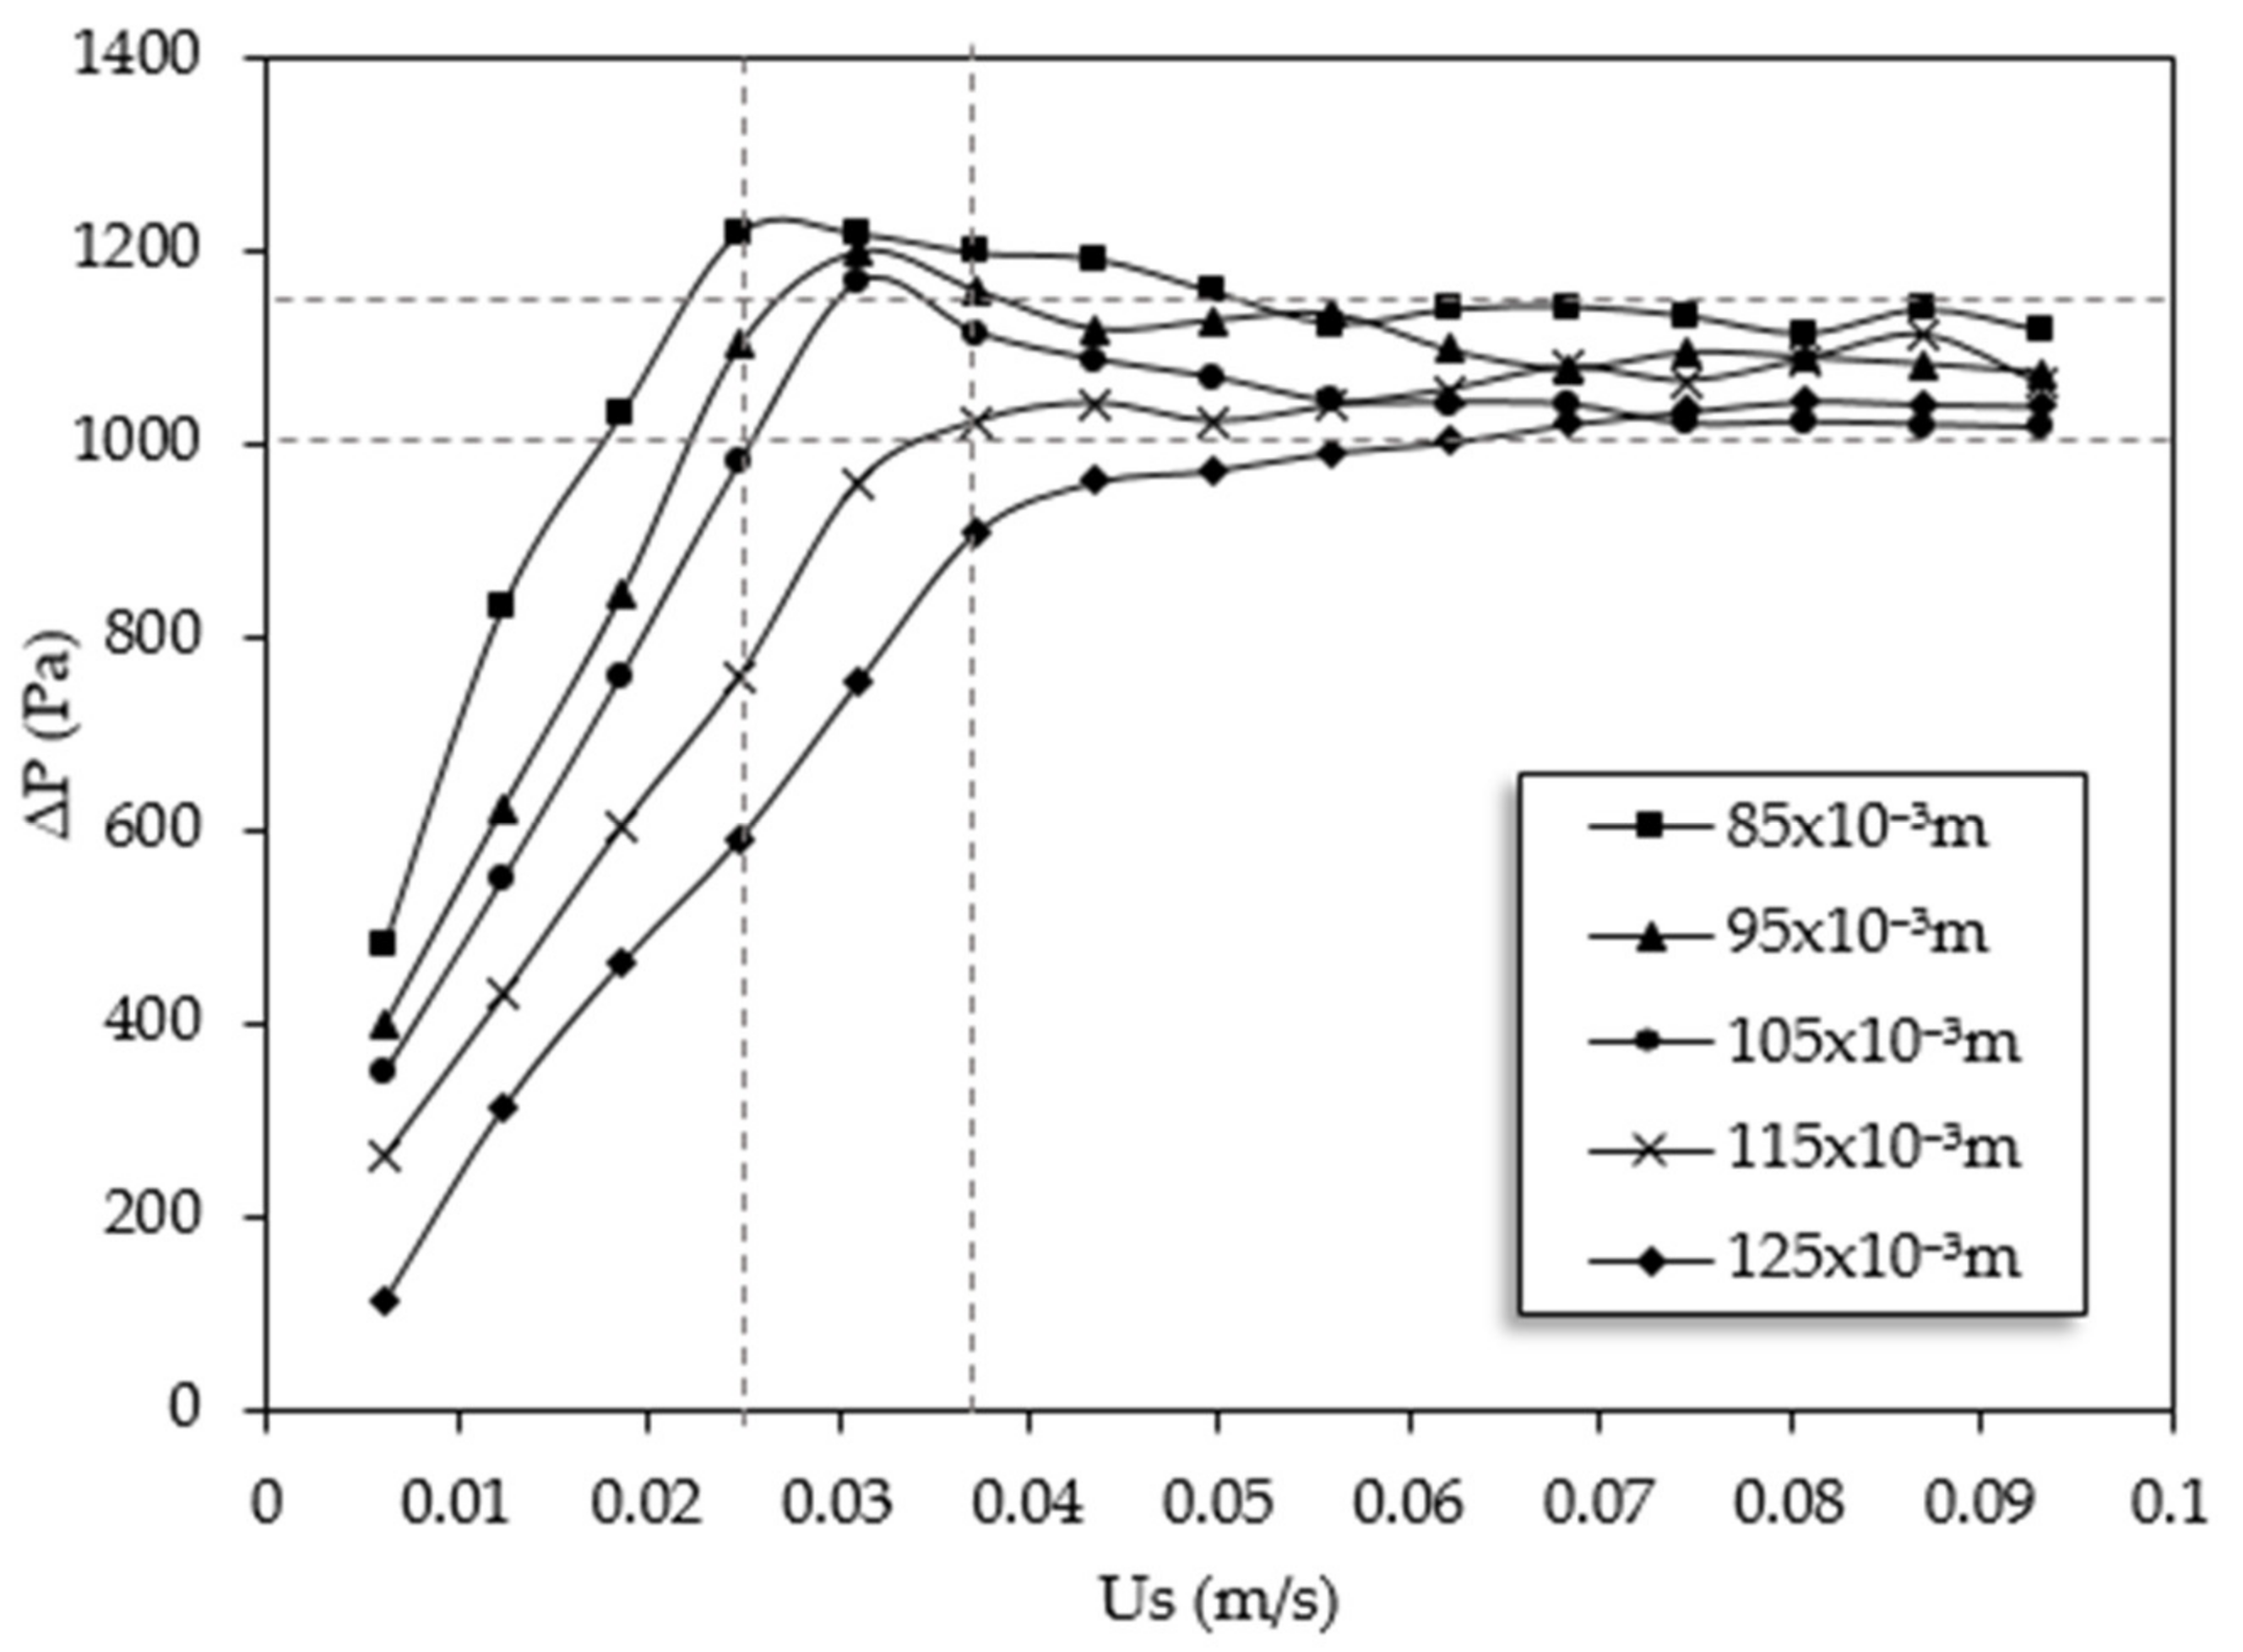
The results of pressure drop evaluation against superficial velocity are presented in
Figure 3. The variation of pressure drop values with superficial velocity is almost following the same trend at all bed heights. Firstly, it increases sharply until it gets to its maximum level which is considered as the minimum fluidization condition. The pressure drop values were then converged to a certain level when the superficial velocity surpassed the minimum fluidization. The recorded Umf are 0.025 m/s, 0.030 m/s, 0.031 m/s, 0.037 m/s, and 0.037 m/s for bed heights of 0.085 m, 0.095 m, 0.105 m, 0.115 m, and 0.125 m, respectively. Moreover, from
Figure 3 it can be seen that the sensitivity of minimum fluidized bed velocity to static bed height in low variations is not significant; a similar observation was reported in a previous study [
28]. Therefore, the average velocity of 0.032 m/s is selected as the reference Umf for the purpose of calculations in this study. The zone of which the amount of velocities are not deviated beyond 20% of the reference Umf is pointed out by vertical dotted lines in
Figure 3 and the range of bed height for this study (0.085–0.125 m) are chosen according to respective Umf located within the selected zone.
3.2. Effect of Gasification Temperature on Composition and LHV of Syngas
Temperature is the variable for this set of experiments which is determined by the average of temperature values indicated by each thermocouple recorded during the ongoing experiments. The highest temperature was controlled not to exceed 824 °C for two individual reasons: Firstly due to the observation of instable operation by the equipment at higher temperatures as it becomes hard to handle, unsafe, and inefficient. Secondly, the fluidized bed gasification is recommended to operate below 1000 °C to ensure that the agglomeration and defluidization due to ash melting does not occur [
12]. It is also noteworthy that the gasification temperature has only little impact above 950 °C.
The equivalence ratio (ER) and static bed height (SBH) remained constant at initial values of 0.33 and 0.105 m, respectively, according to the reports of best operation condition in other studies [
11,
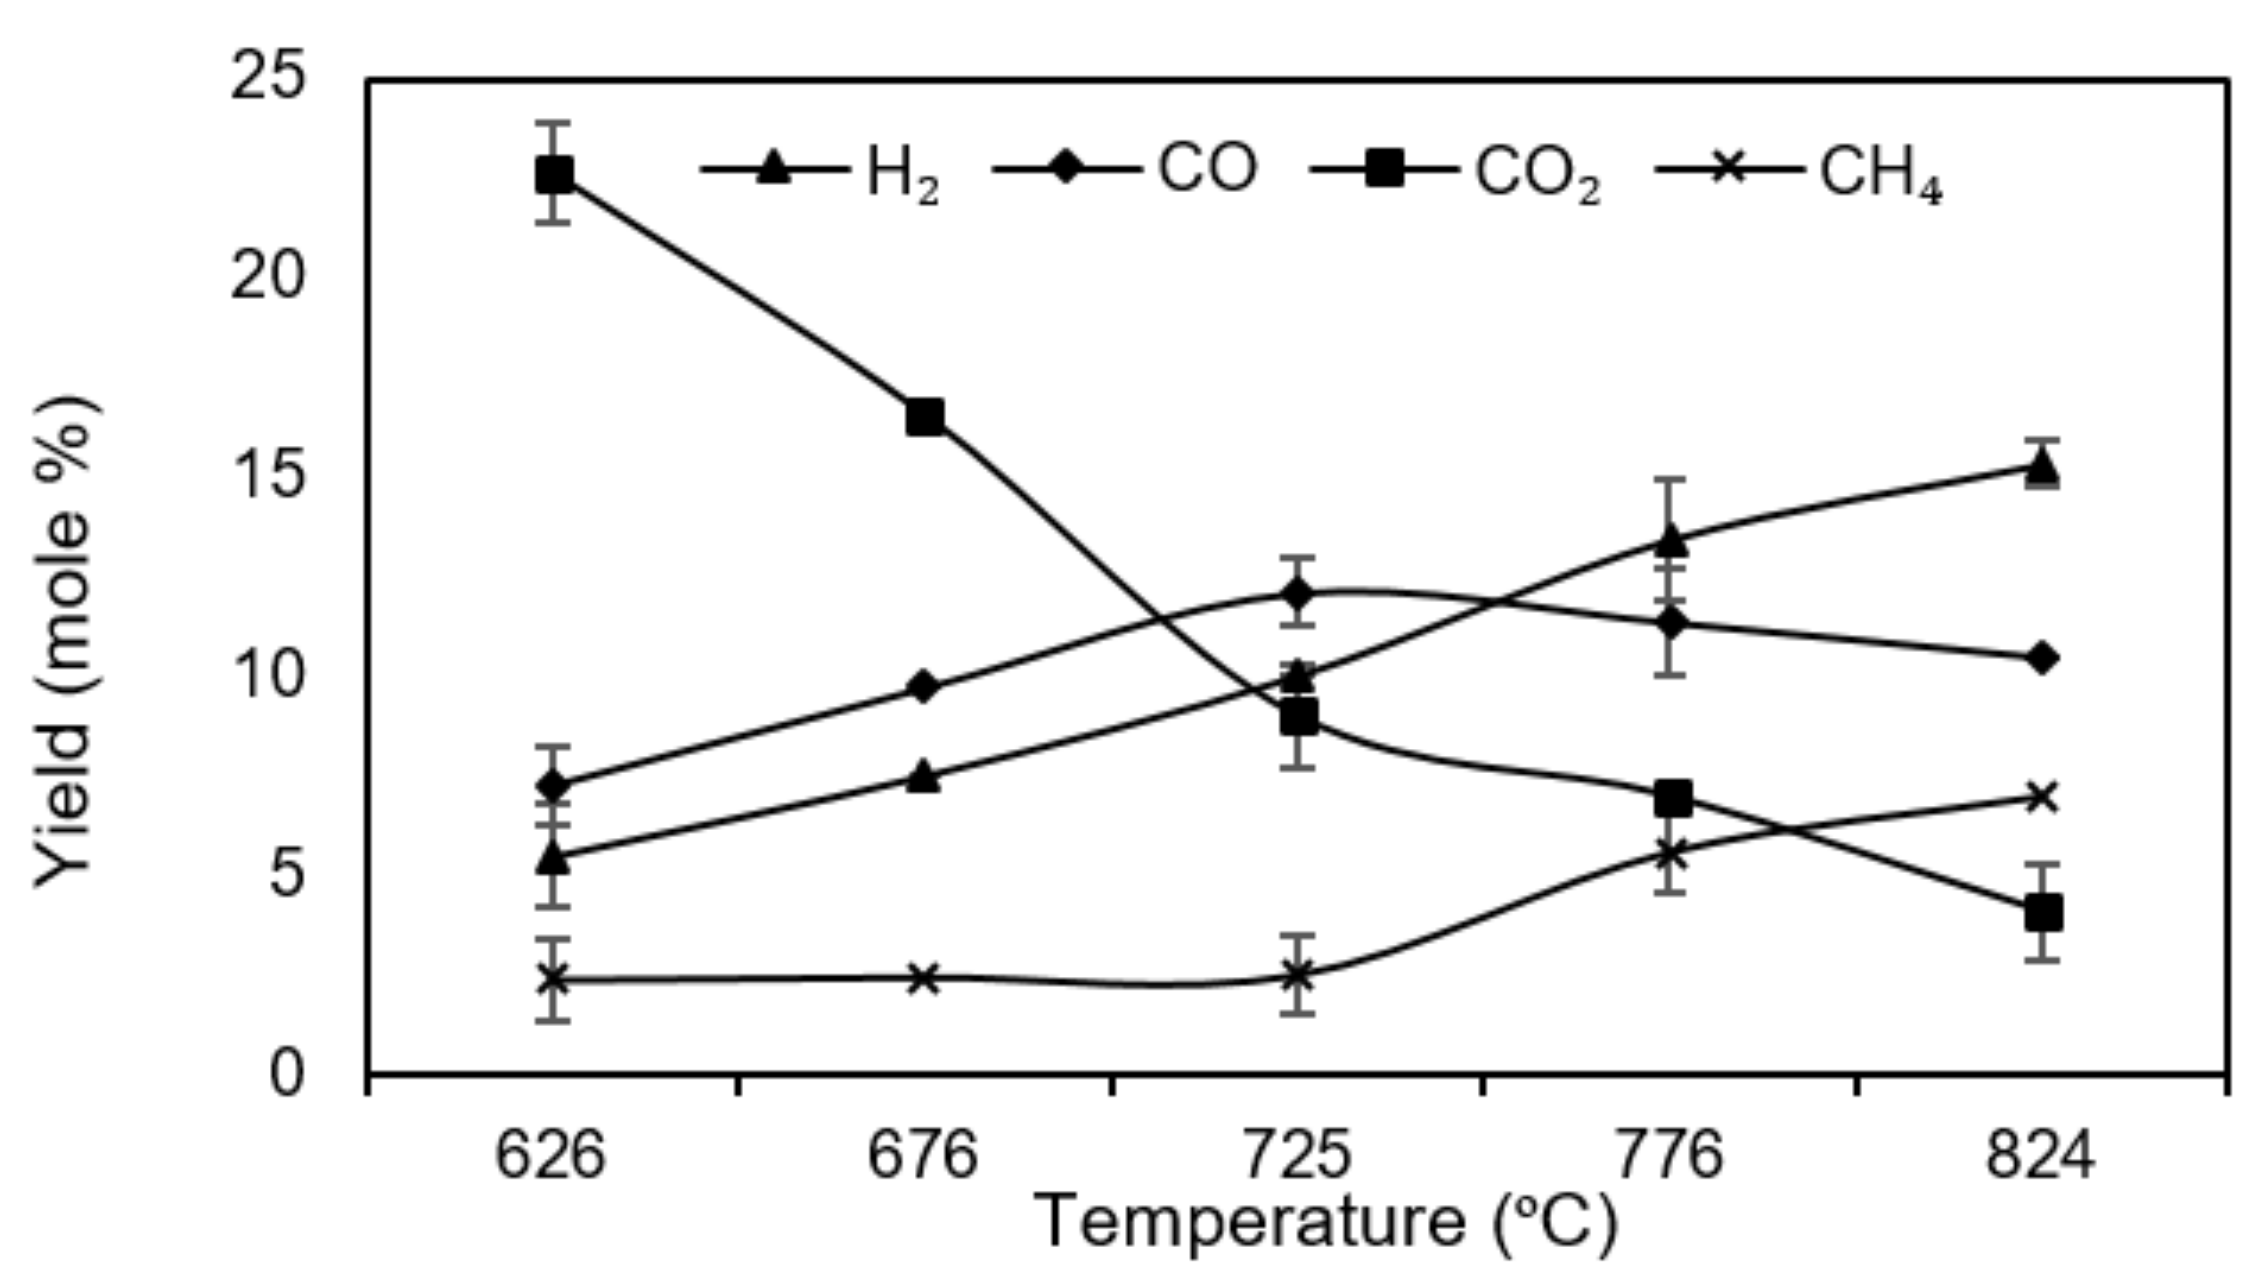
29]. Since the air was chosen as the gasifying agent, the process is expected to involve a huge amount of nitrogen, which is an inert gas that does not participate in any chemical reaction, hence it exits the gasifier with exactly the same amount as enters. The composition of each species of syngas was determined by GC analysis and the results are presented in
Figure 4. Error bars denote the deviations of outputs for the replicated experiments.
According to
Figure 4, increasing the temperature continually increases the yield of hydrogen from 5.53% at 625 °C up to 15.36% at 825 °C, which is favorable. The yield of CO also increases with temperature rise from 7.27% at 625 °C to maximum of 12.13% at 725 °C. However in higher temperatures, CO begins to drop slightly until it reaches 10.51% at 825 °C. The decline in yield of CO
2 with temperature increase is intensive until it reaches 9.04% at 725 °C. Further temperature increase leads to decrease in CO
2 content, hence decrease with a gradual slope to its minimum yield of 4.14% at 825 °C. The composition of CH
4 decreased very gradually to reach 2.48% at 725 °C. This may be due to the low reactivity of endothermic reactions (Equations (5), (6), and (9)) and dominating of exothermic reactions (Equations (7) and (8)) instead which is expected to happen in lower temperatures (
Table 3).
Moreover, according to
Figure 4, the composition of CH
4 begins to increase slightly with further temperature increase until the maximum yield of 6.99% at 825 °C is reached. Rising temperature favors the reactants of endothermic and products of exothermic reactions which results in higher H
2 and CO and lower CO
2 and water [
1]. In higher temperatures, further hydrocarbon cracking occurs to maintain the gasifier temperature. High temperature gasification sometimes deals with ash melting problems which can distract the carbon conversion, and therefore slow down the steam methane reforming reaction which can explain the slight increase in CH
4 above 725 °C.
The calculation of LHV was performed based on the mass composition of combustible species in syngas following the equation below [
25].
where Cn Hm is related to heavier hydrocarbons than CH
4 that present in the syngas.
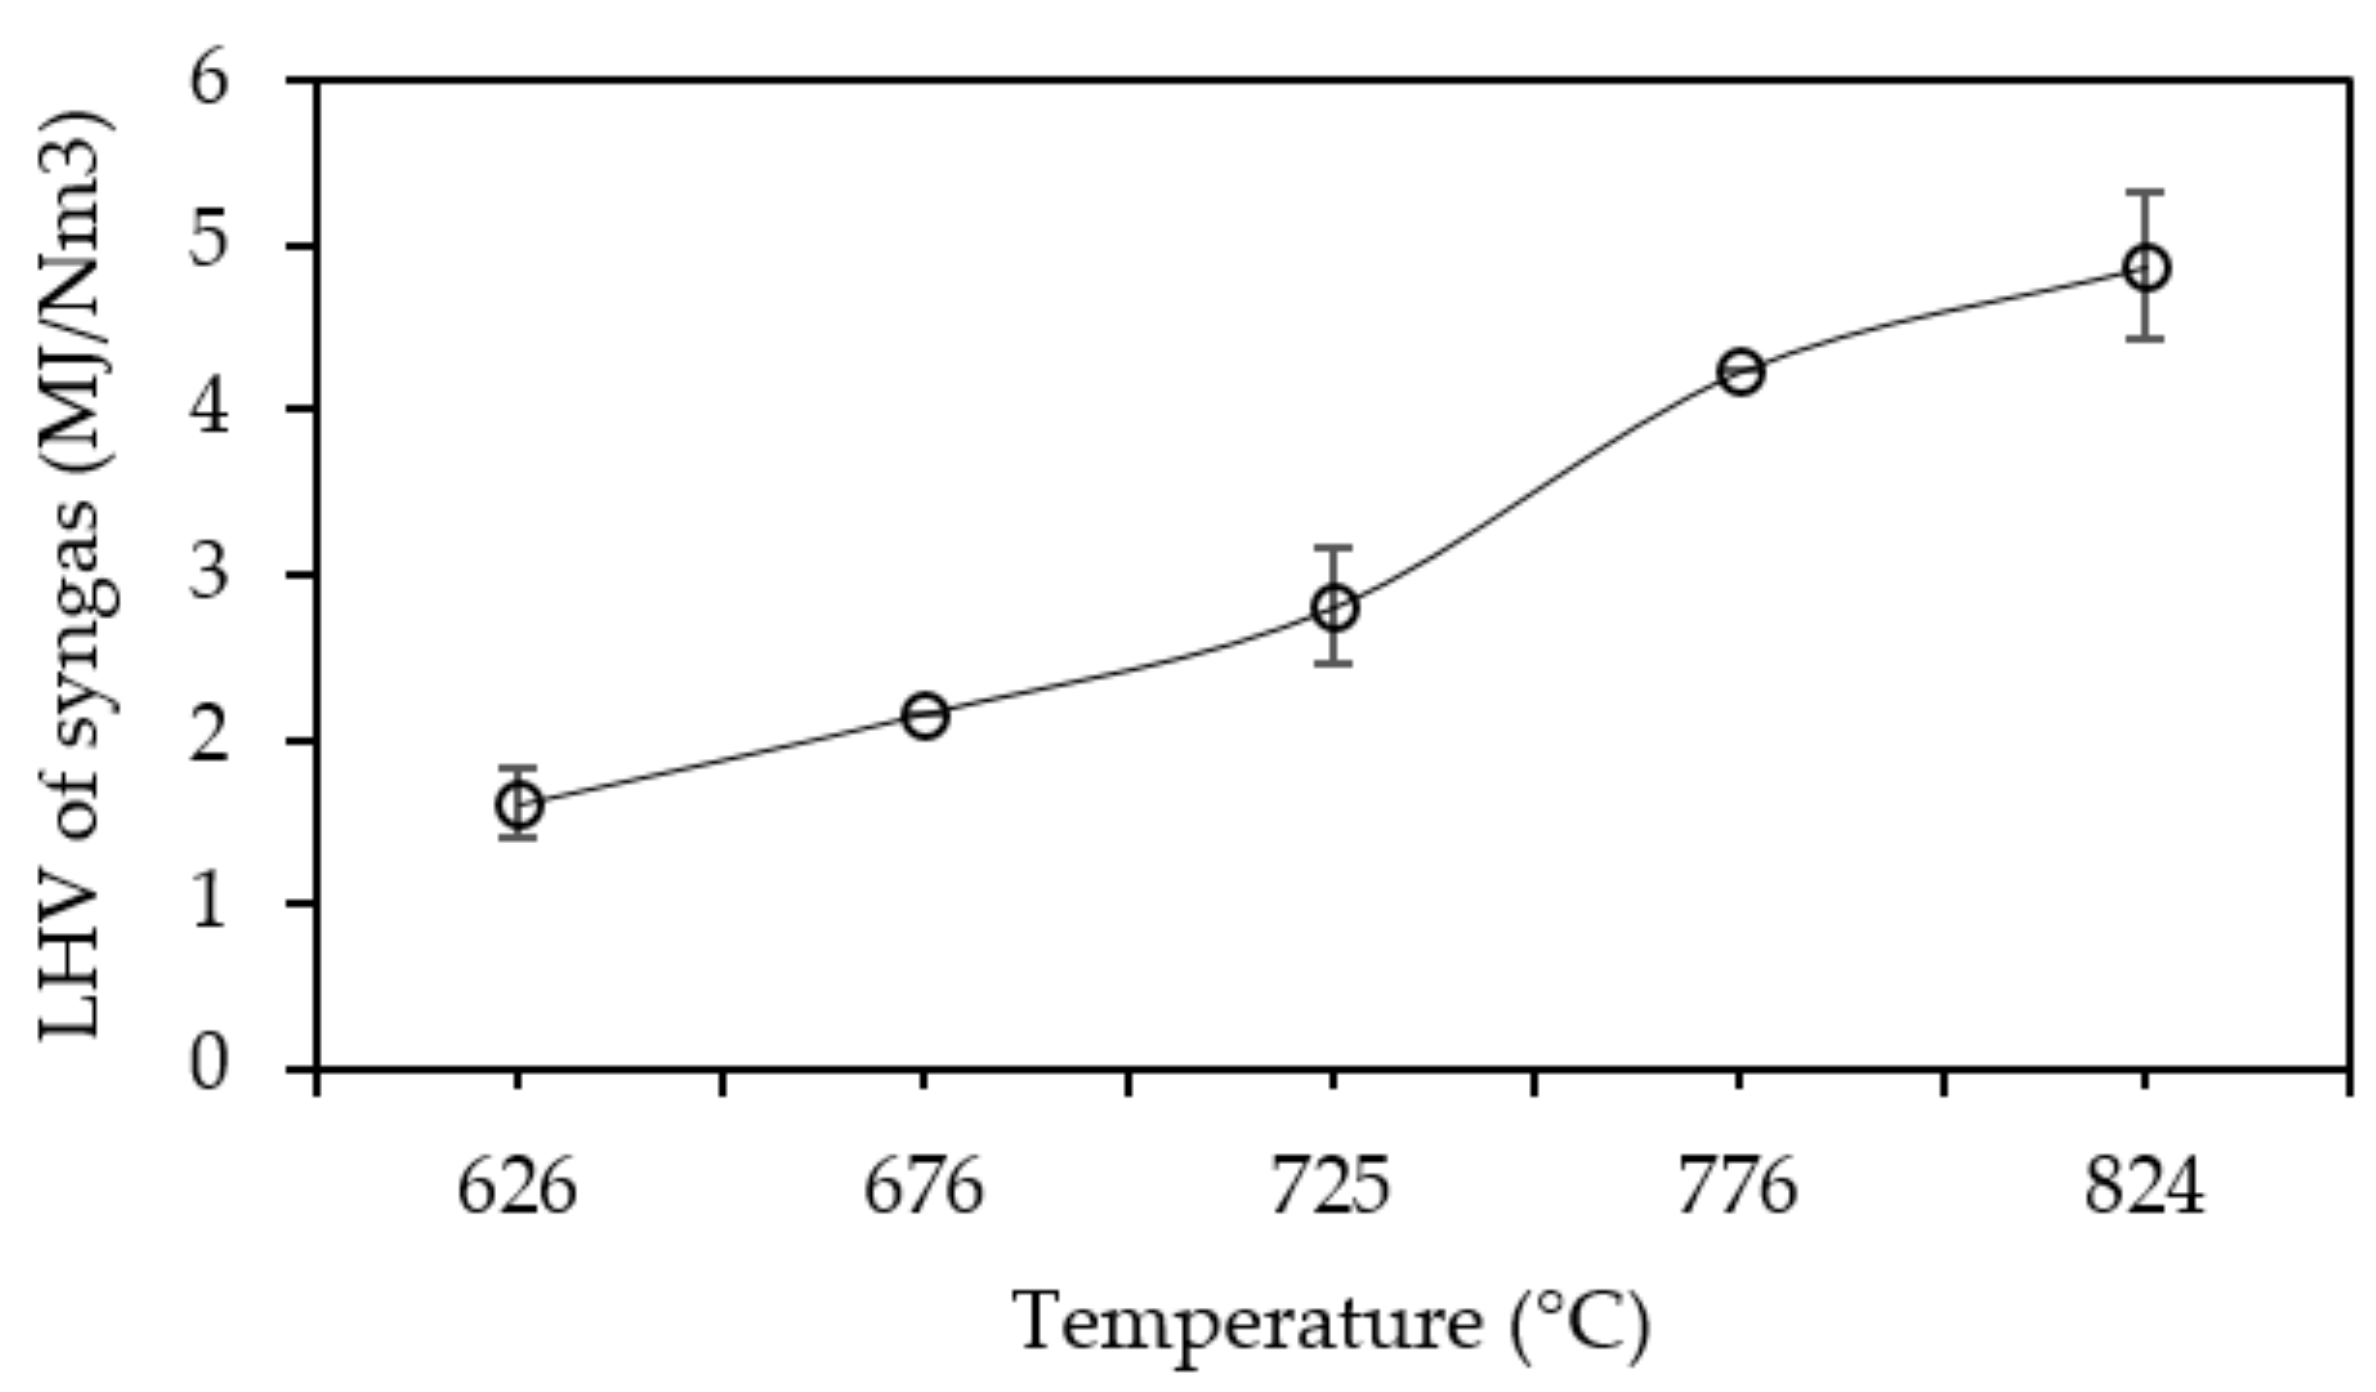
Figure 5 indicates the results for investigating the effect of temperature on the LHV of the syngas. Lower heating values increased from 1.61 MJ/Nm
3 to 4.87 MJ/Nm
3 with temperature rise from 626 °C to 824 °C due to the higher yield of combustible species (H
2 and CO) in syngas; however, the increasing trend became more intensive above 725 °C.
3.3. Effect of Equivalence Ratio on the Composition and LHV of Syngas
The effect of equivalence ratio (ER) on syngas composition was investigated. Since the amount of feedstock feeding is constant for all experiments, the calculation of ER is solely controlled by inlet air flow rate, as shown in equation below.
where W
Air,act is the actual amount of air required to perform gasification and W
biomass,act is the weight of required biomass. The value of 5.125 in Equation (11) is calculated according to the stoichiometric ratio of air to biomass for one unit of Napier grass as involved in complete combustion with presence of excess air. The elemental properties of Napier grass that has been used in calculation of stoichiometric ratio were captured from the results of ultimate analysis (see
Table 1).
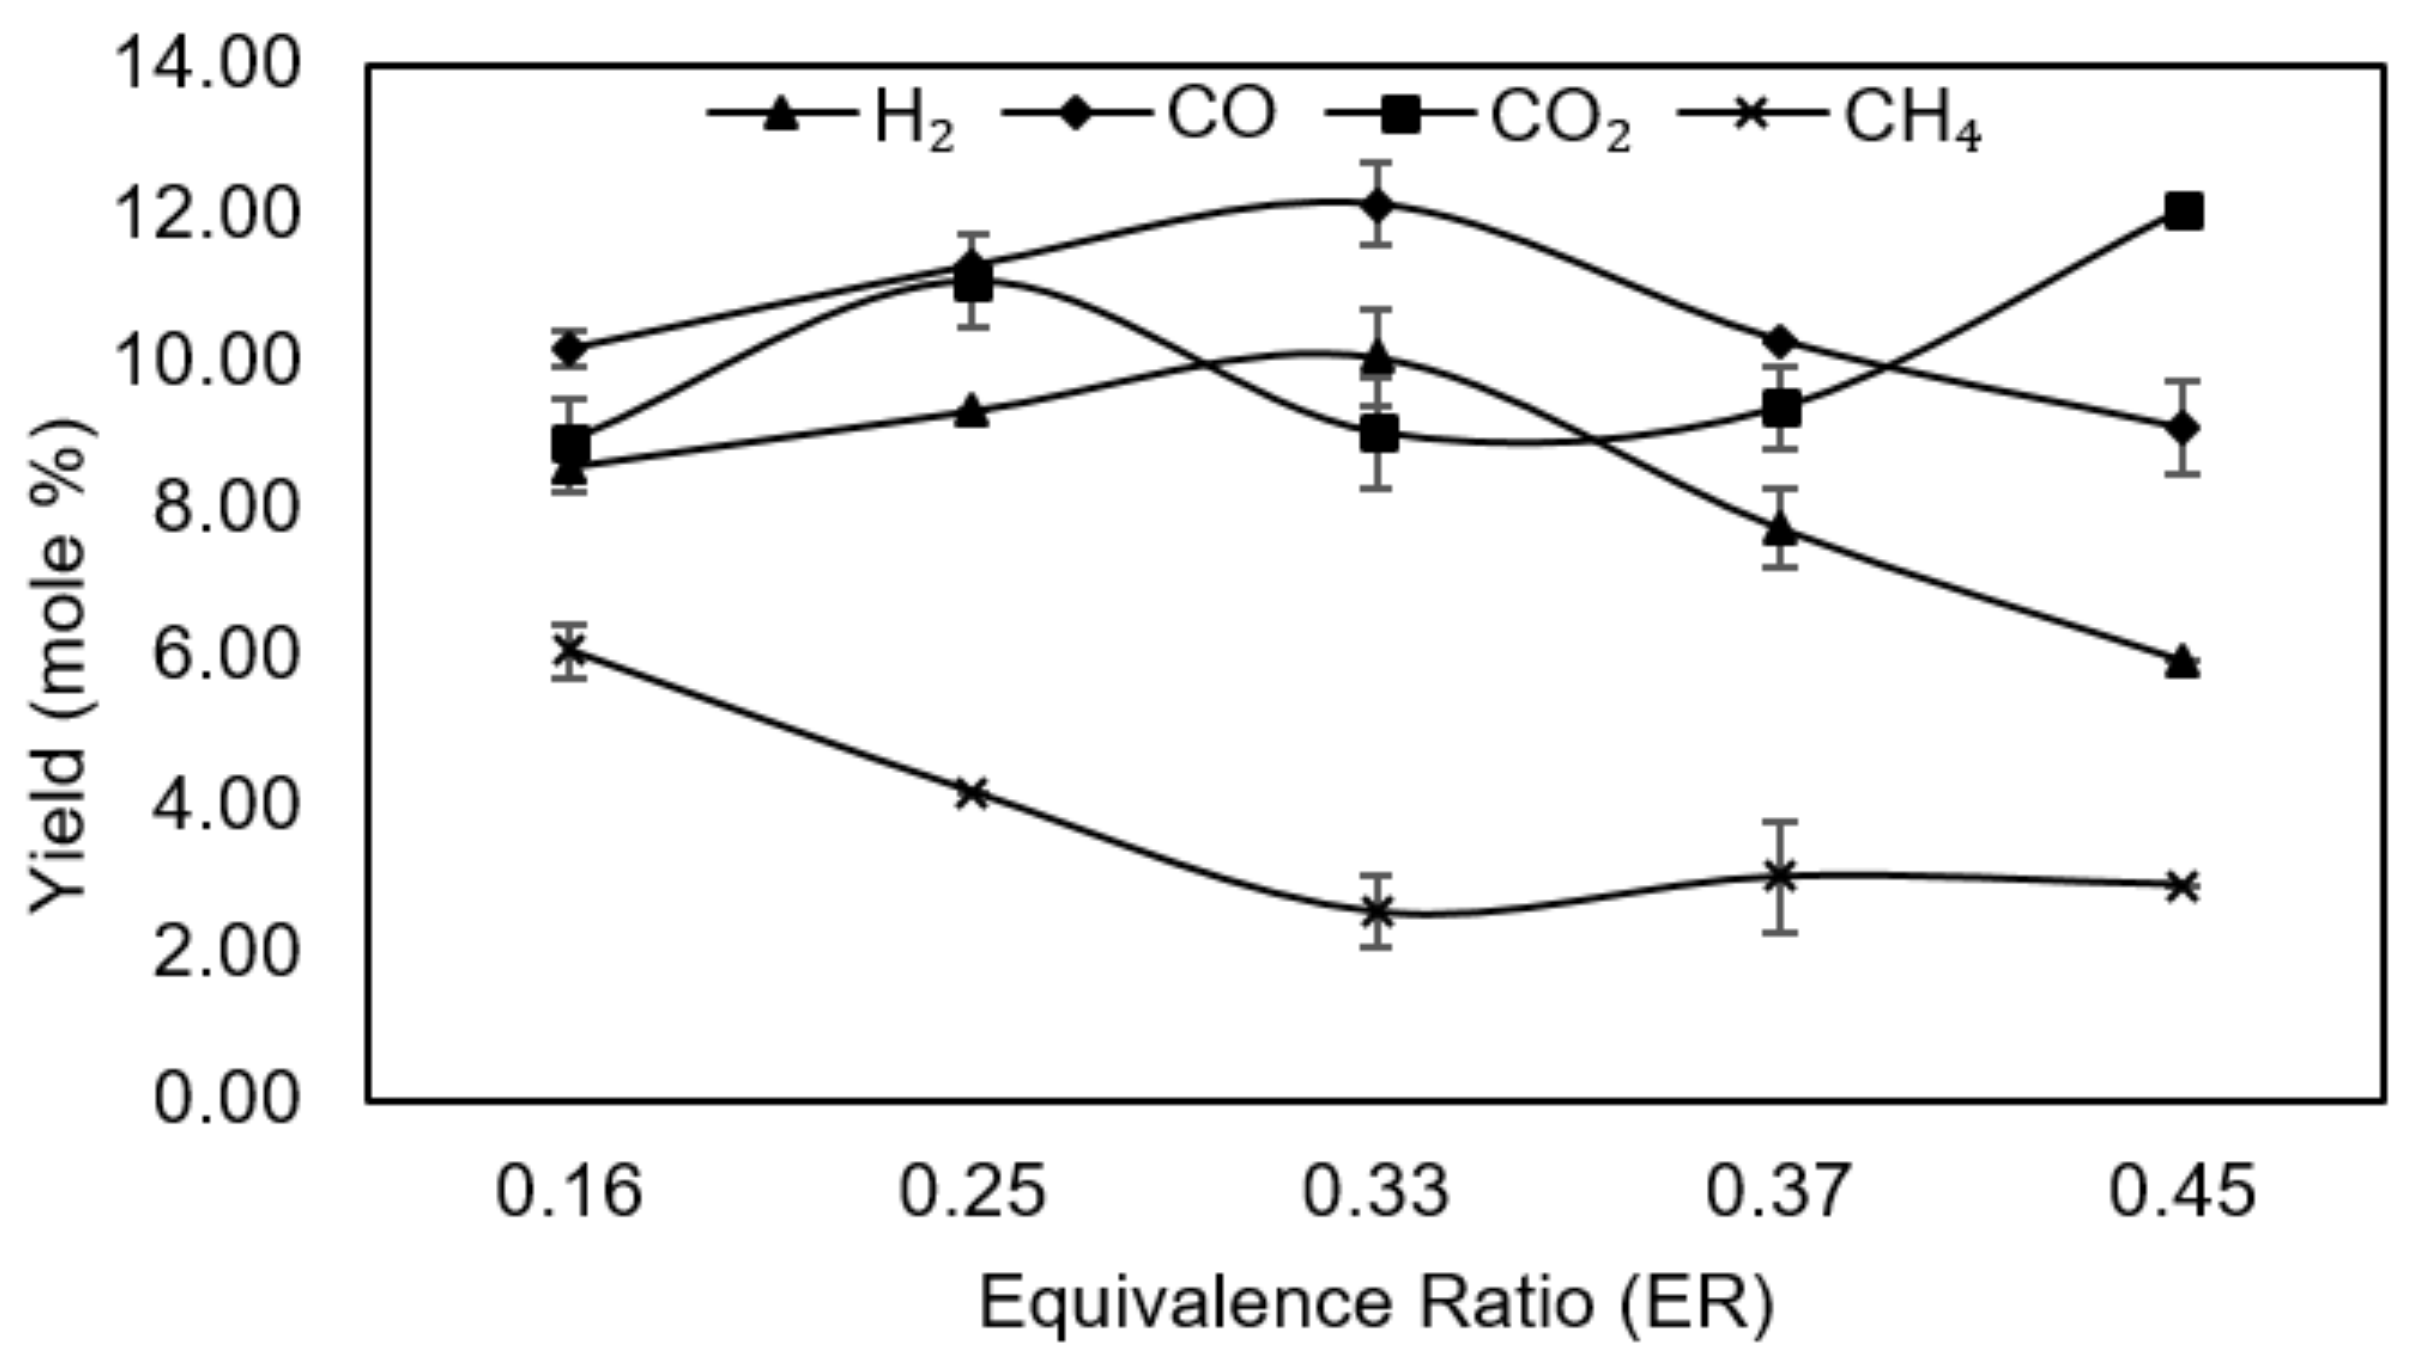
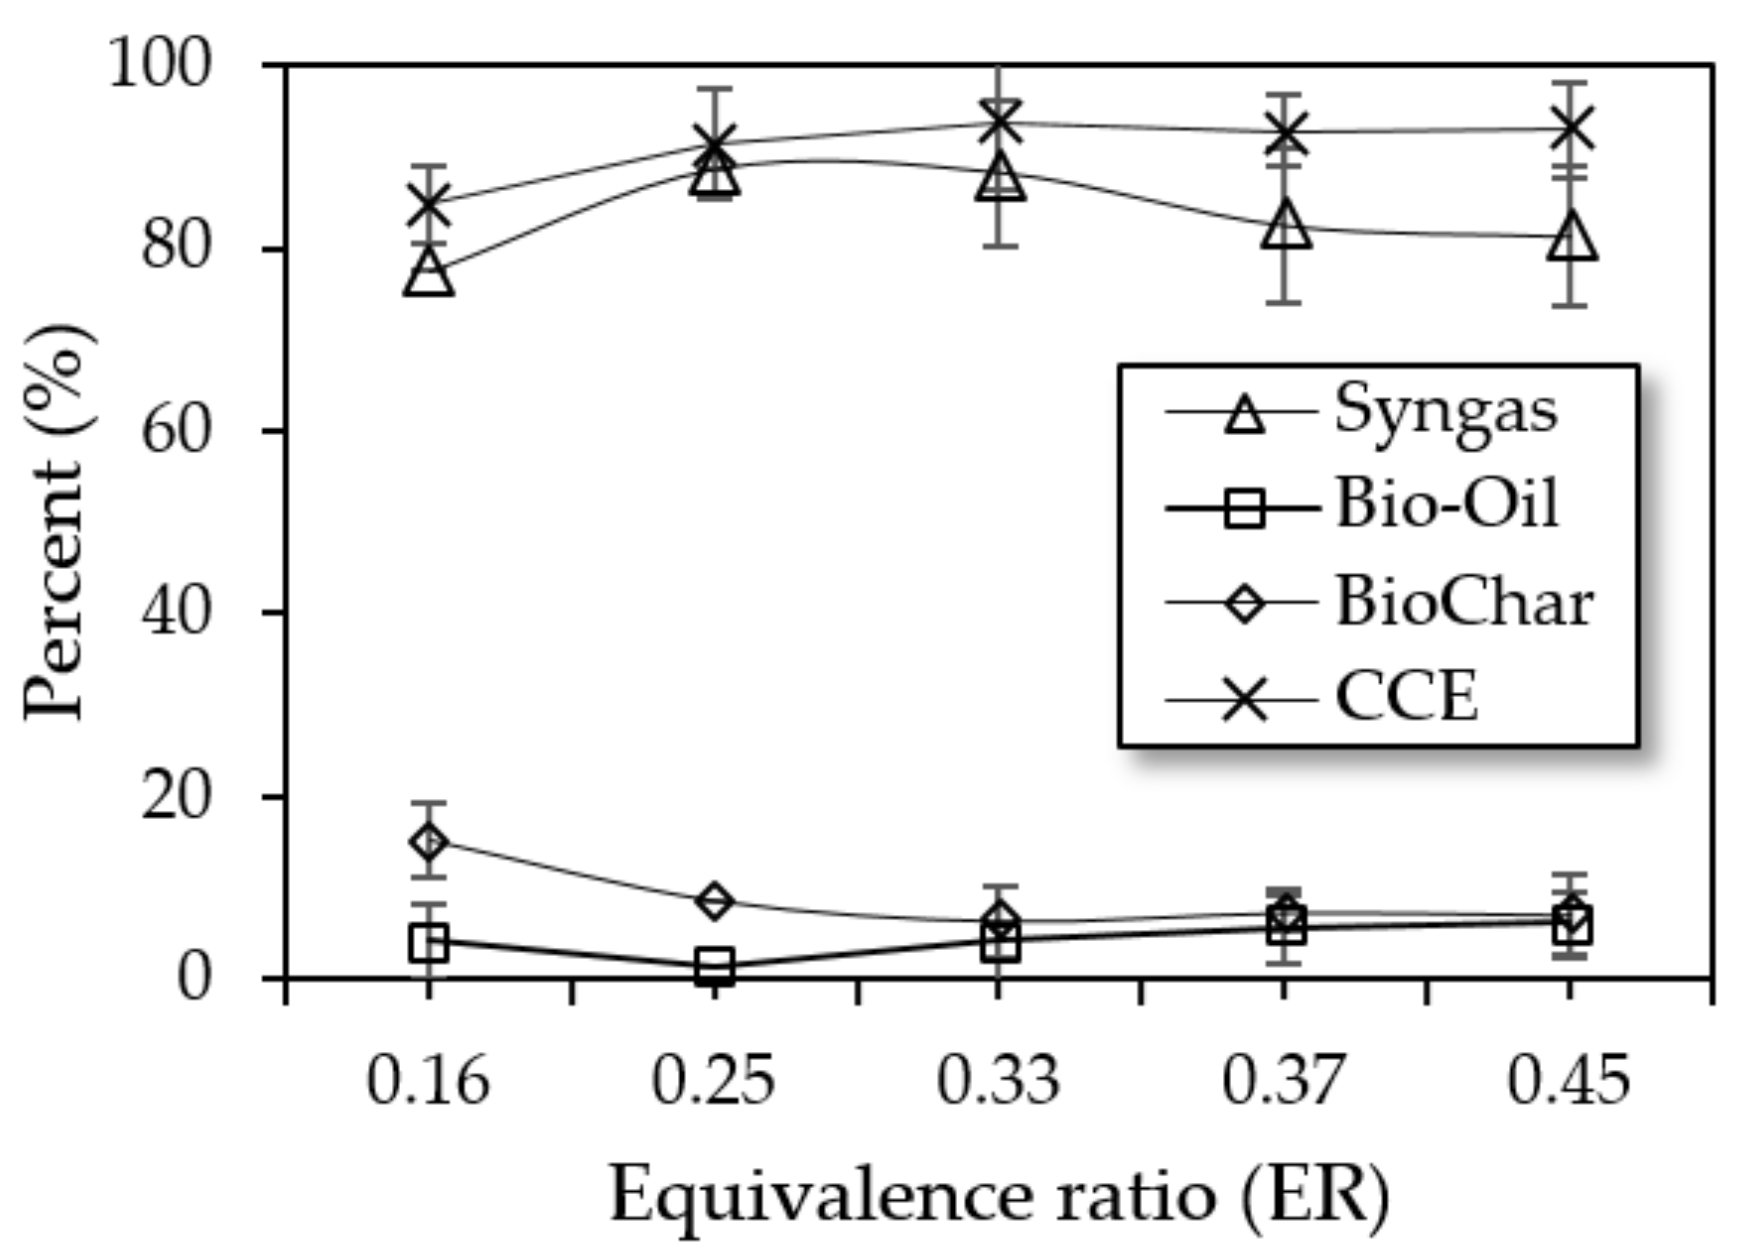
The flow rate of air was varied in such order to adjust the ER values within the range of 0.16 to 0.45, which is close to the range that proposed by a previous study [
11]. Experiments related to effect of ER has been performed at constant temperature of 725 °C and static bed height of 0.105 m. Experiment results are shown in
Figure 6. The quantity of ER is directly proportional to air flow rate, hence an increase in ER can also be interpreted as an increase in the volume of air that is introduced into the gasifier.
When the air flow rate increases more oxygen is introduced by air into the process and, therefore, the combustion rate increases and the higher release of energy takes place as the result [
30]. The presence of excess energy favors the water-gas shift reaction (endothermic) into reactants and steam methane reforming reaction (exothermic) into products, i.e., hydrogen and carbon dioxide. This observation can be seen in
Figure 6, where the yields of H
2 and CO have moderately increased from 8.56% and 10.16% at ER of 0.16 to 10.05% and 12.13% at ER of 0.33, respectively. A constant reduction in the yields of H
2 and CO from 10.05% and 12.13% to 5.94% and 9.09%, respectively, were observed as ER increases from 0.33 to 0.45. As stated earlier, an increase in ER leads to release of energy (higher combustion rate); however, it is only applicable to a limited amount of air as it scales with the stoichiometric ratio between oxygen and carbon molecules with the addition of 10% excess air [
31]. Any further increase in airflow (and ER accordingly, since the additional oxygen molecules are not involve in combustion) will lead to discharge of energy from the reactor and relatively cool down the process, which is followed by reduction in the rates of endothermic reactions and, consequently, lower production of hydrogen and CO.
The production of CO
2 is mostly governed by water-gas shift reaction and is highly dependent to the temperature and available moisture in the process [
11]. The yield of CO
2 increases from 8.92% to 11.09% as ER increases from 0.16 to 0.25, then it drops to 9.04% at ER of 0.33, and rises again to a maximum yield of 12.06% at ER of 0.45. The yield of CH
4 which is influenced by methanation and methane reforming reactions, decreased from 6.08% at ER of 0.16 to the minimum yield of 2.54% at ER of 0.33, from then it slightly started to increase until it reaches to 2.91% at ER of 0.45. According to the results, the maximum yields of H
2 and CO and minimum yields of CH
4 and CO
2 are obtained at an ER of 0.33, and hence it is considered as the most desirable ER for this set of experiments.
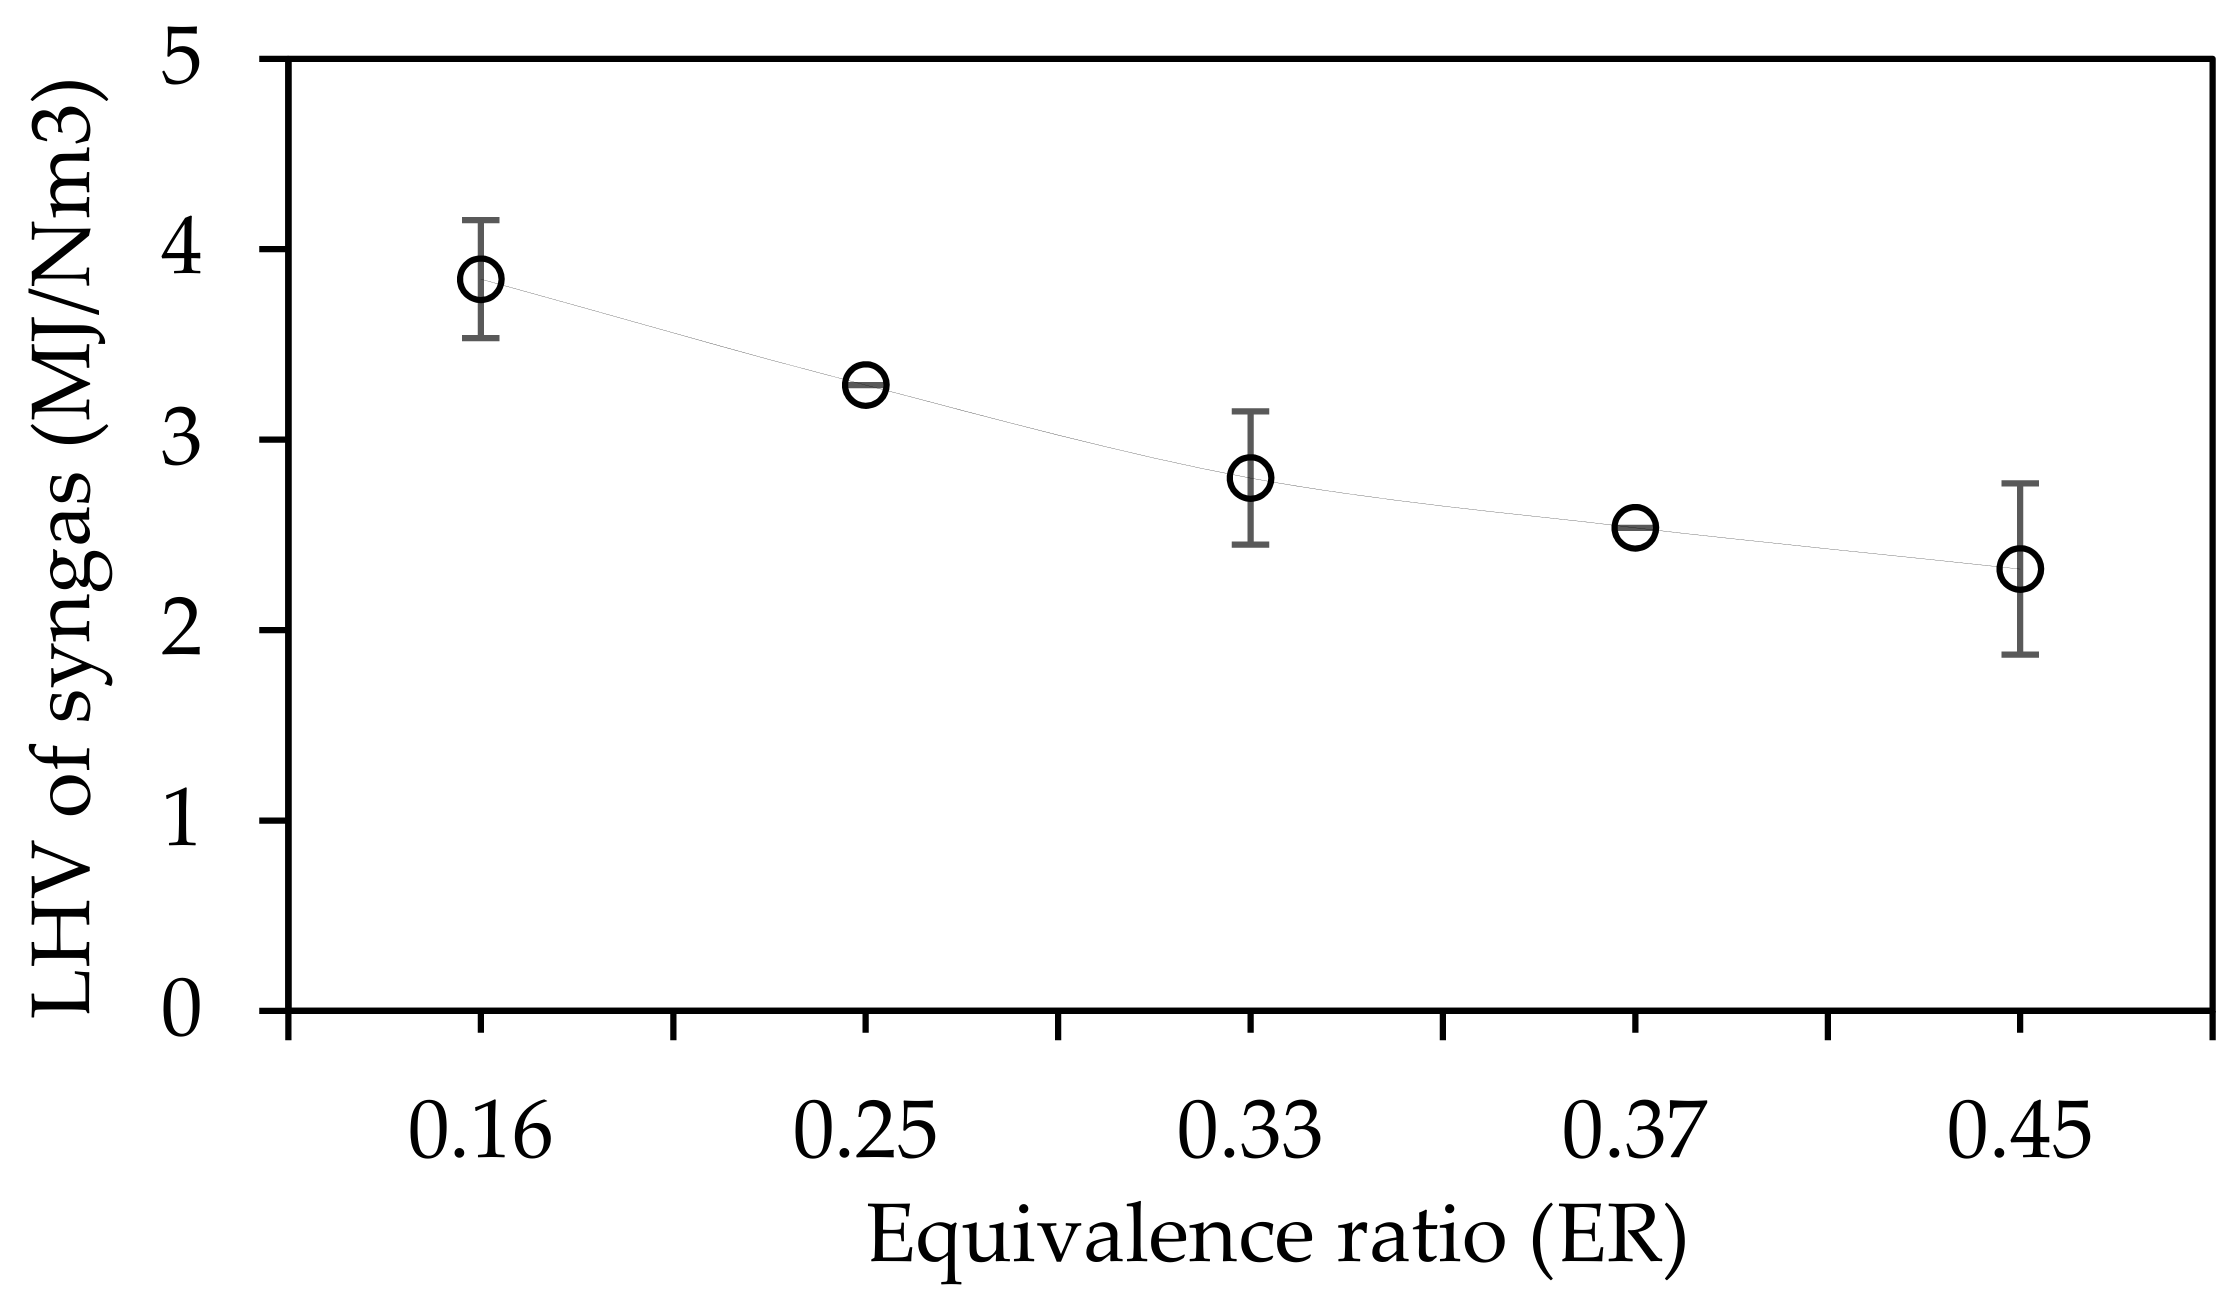
The effect of ER on syngas heating value is demonstrated on
Figure 7. It is observed that ER has not significantly effects the LHV because the slope of curve is small. The constant but slightly decrease of LHV from 3.84 at ER of 0.16 to 2.32 at ER of 0.45 can be explained with regard to the ER increases from 0.16 to 0.33; although by increasing H
2 and CO (refer to
Figure 6) at this interval, LHV is expected to rise but since the drop in CH
4 is rather intensive thus the total LHV decreased as the result. Secondly, from the ER of 0.33 to 0.45, whereby the yields of H
2 and CO decreased with similar slopes and, since the yield of CH
4 remained fairly constant, the total LHV slightly decreased.
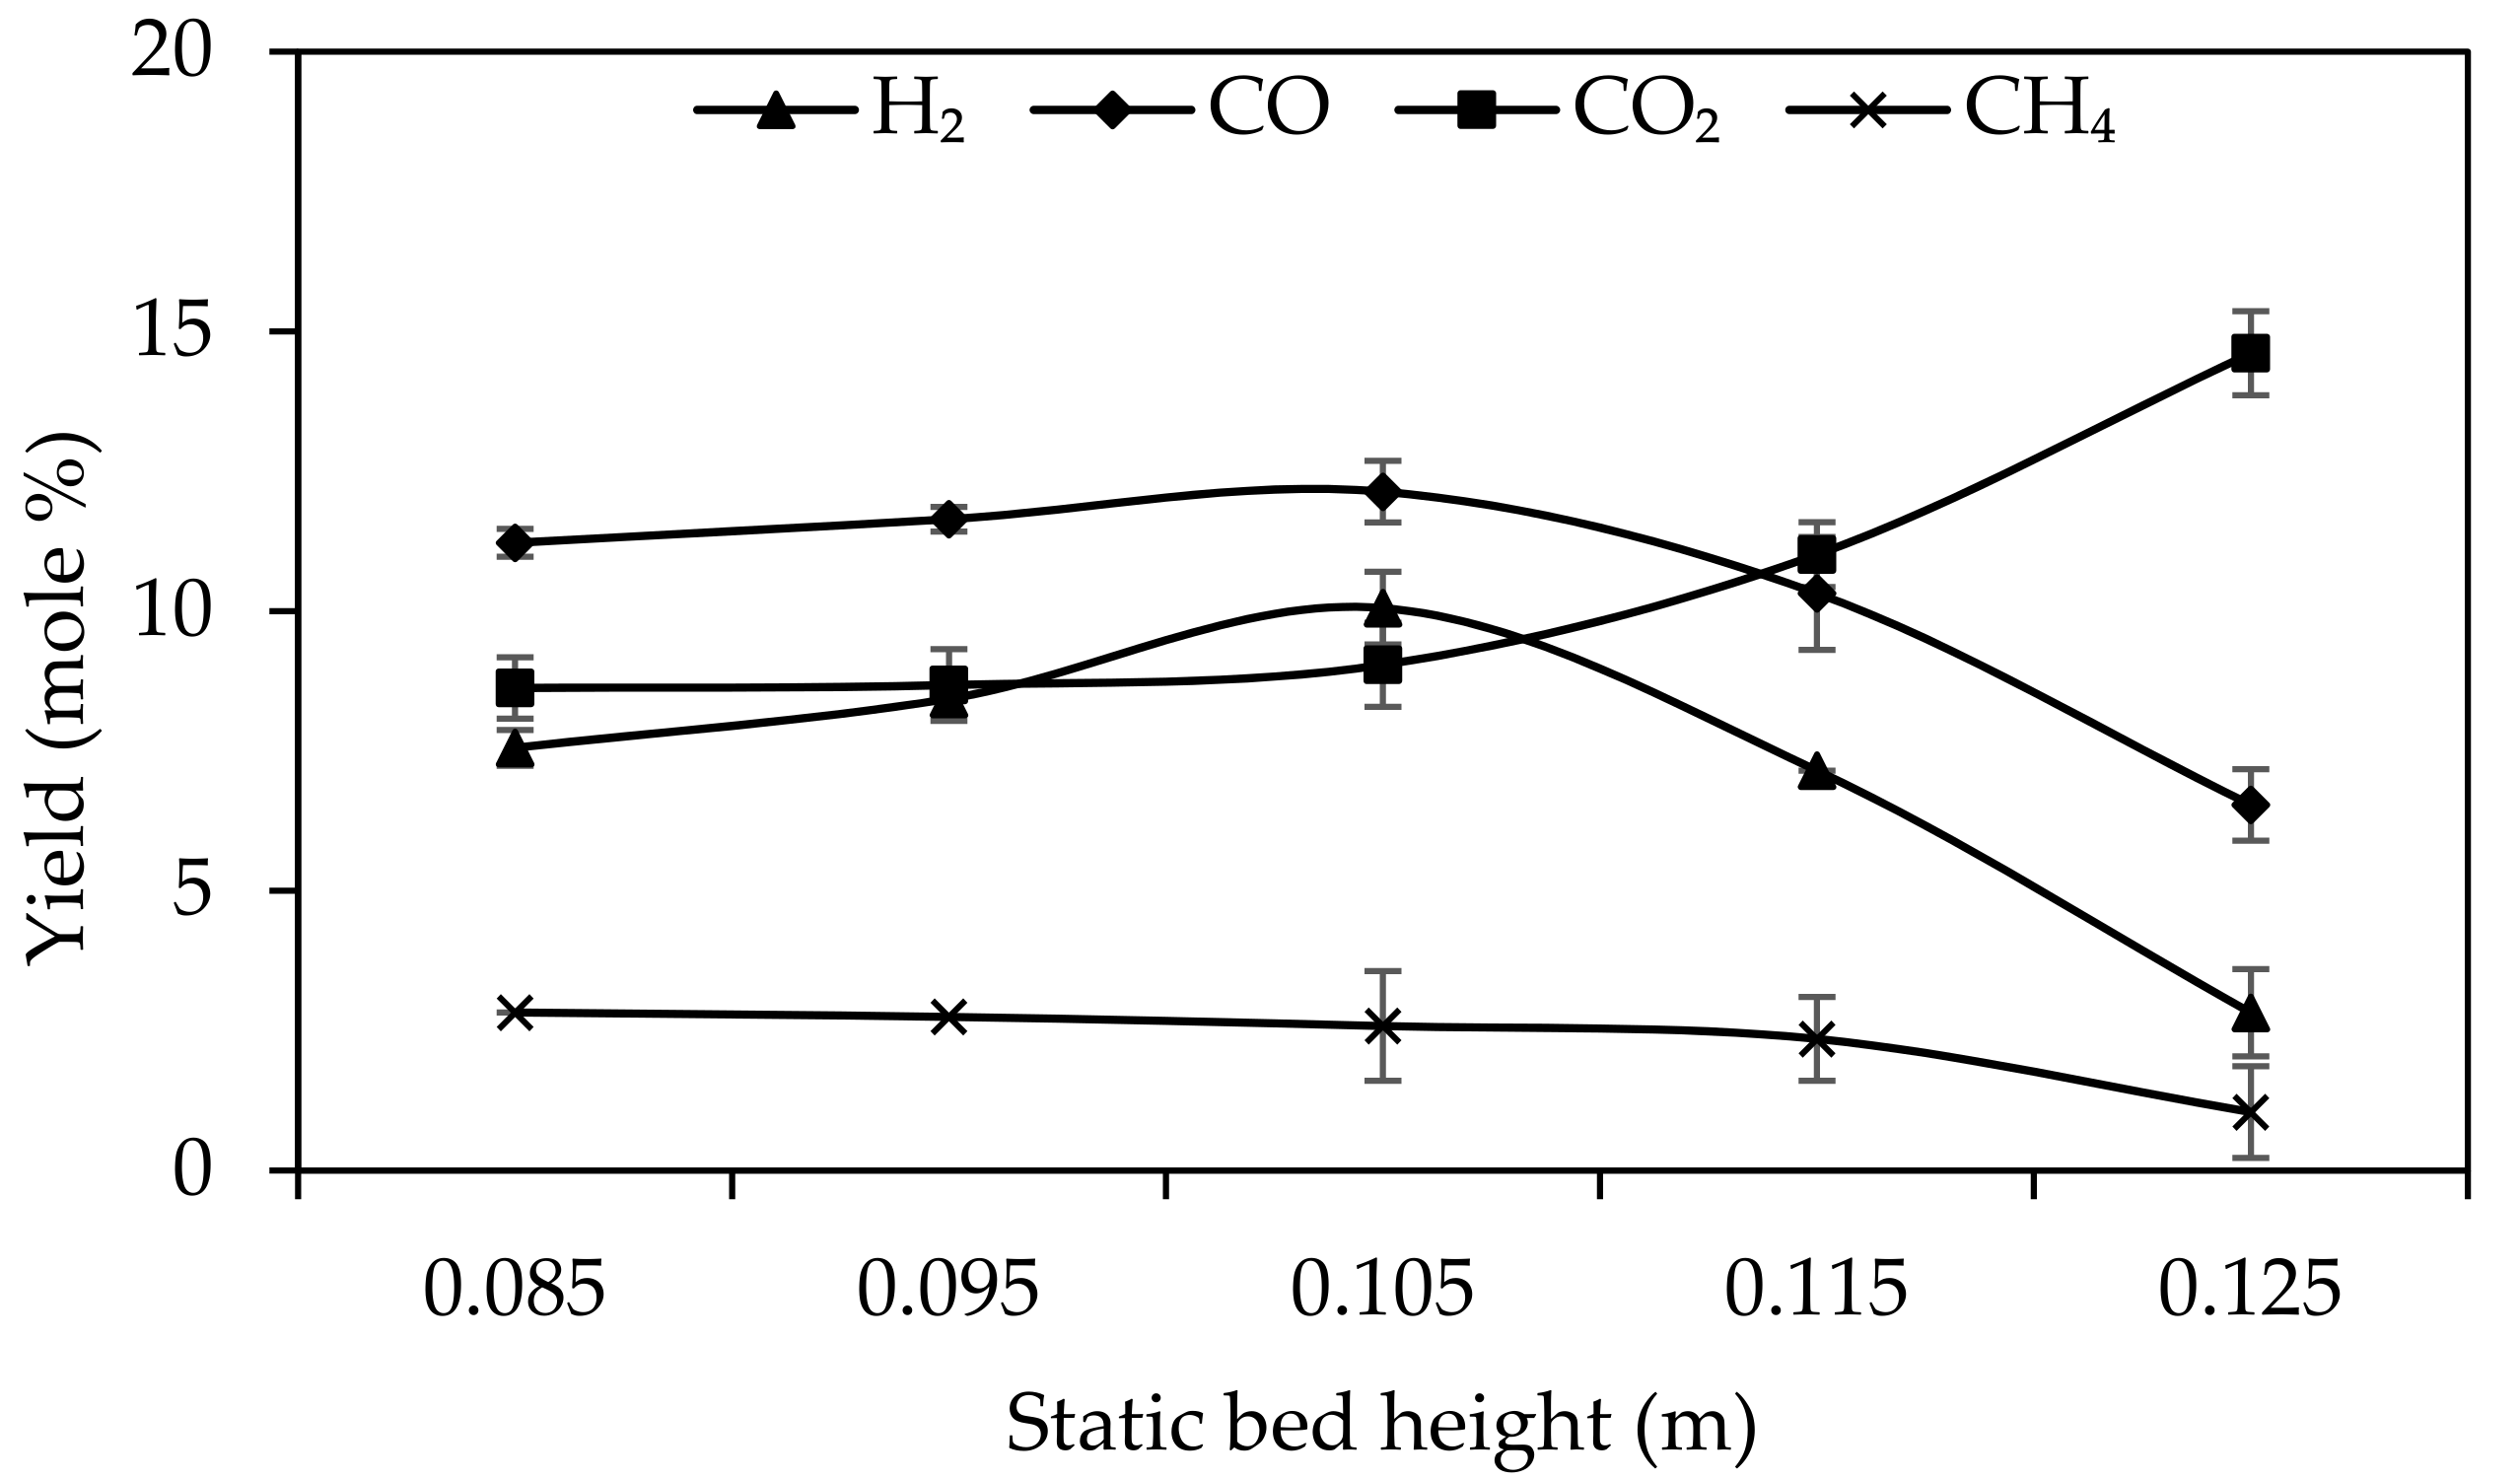
3.4. Effect of Static Bed Height on Composition and LHV of Syngas
A number of terms related to fluidization hydrodynamics, e.g., minimum fluidization velocity, fluidized bed expansion, and interaction of solid particles can be influenced by physical characteristics of solids like density and shape as well as the height of the initial solid bed. The chemical reactions on the other hand can also be influenced by the similar terms. For instance, a larger fluidized bed provides more area of interaction between the solid particles, and hence, higher involvement of particles in reactions. Another instance is the minimum fluidization velocity as with higher static bed height: one requires increased air flow rate and, therefore ER, to obtain the same bed expansion, where the effect of ER on chemical reactions has been proven earlier. The variation of SBH was restricted by the maximum air flow and the geometry of the reactor. The description of variables and the results of experiments are shown in
Figure 8.
The selection of constant T and ER was made are according to the results of previous sections for the most desired values. It is observable from the results that SBH has significant effect on syngas composition. Hydrogen production slightly increases from 7.56% to 10.05% as the solid bed height increases in 0.02 units, however it drops intensively with higher bed heights where it reaches its minimum yield of 2.82% at the bed height of 0.125 m. Similar fluctuation manners are observed for the yields of CO as slightly increases from 11.22% to 12.13% at 0.105 m, and then drops to a minimum of 6.54% at height of 0.125 m. The initial increase of yields can be explained by the increase in the amount of bed materials that ensure the homogeneous distribution of heat and less temperature gradient in fluidization zone. The decline of yields between the heights of 0.105 m and 0.125 m is due to overload of bed materials, which tends to be difficult to fluidize and hence results in a less-expanded fluidization zone with smaller contact area.
The yield of CO2 within the bed heights of 0.085 m and 0.095 m remains almost steady at 9.04%, but increases in higher heights until it reaches to maximum of 14.6% at 0.125 m. There is no significant effect of SBH on yield of CH4 observed. The maximum yields of H2 and CO and relatively minimum yields of CO2 and CH4 was observed at bed height of 0.105 m as it considered the most desirable measure for this round of experiments.
Figure 9 shows the results of syngas LHV against the SBH. The heating value of syngas is highly affected by SBH as it firstly increased from 2.58 MJ/Nm
3 to 2.90 MJ/Nm
3 when the bed height increased from 0.085 m to 0.105 m, and then dropped dramatically to 0.65 MJ/Nm
3 at SBH of 0.125 m. The reason can be explained by the fluidization hydrodynamics, whereas the extra solid particles in high SBH values (above 0.11 m) while ER remained constant, indicated difficulties for the static bed to fluidize properly and inhibited the solid particles to move freely within the fluidization zone [
26]. The aforementioned fact results in lower levels of the fluidized bed and likewise a smaller contact area for the particles, hence the distraction of chemical reactions occurs as consequence [
32]. In such situations, as the energy distributes in relatively smaller area, the complete combustion are more likely to occur and therefore the production of CO
2 increases. The higher yield of CO
2 and lower production of combustible species have severe impact on the heating value of the final syngas.
3.5. Effect of Parameters on CCE and Product Yields
Carbon conversion efficiency (CCE) is defined as the carbon proportion converted into producer gas, and was calculated from the weighing of the residue of char and ash (Wr), which have been collected after each test divided by the weight of total biomass (Wt) [
33].
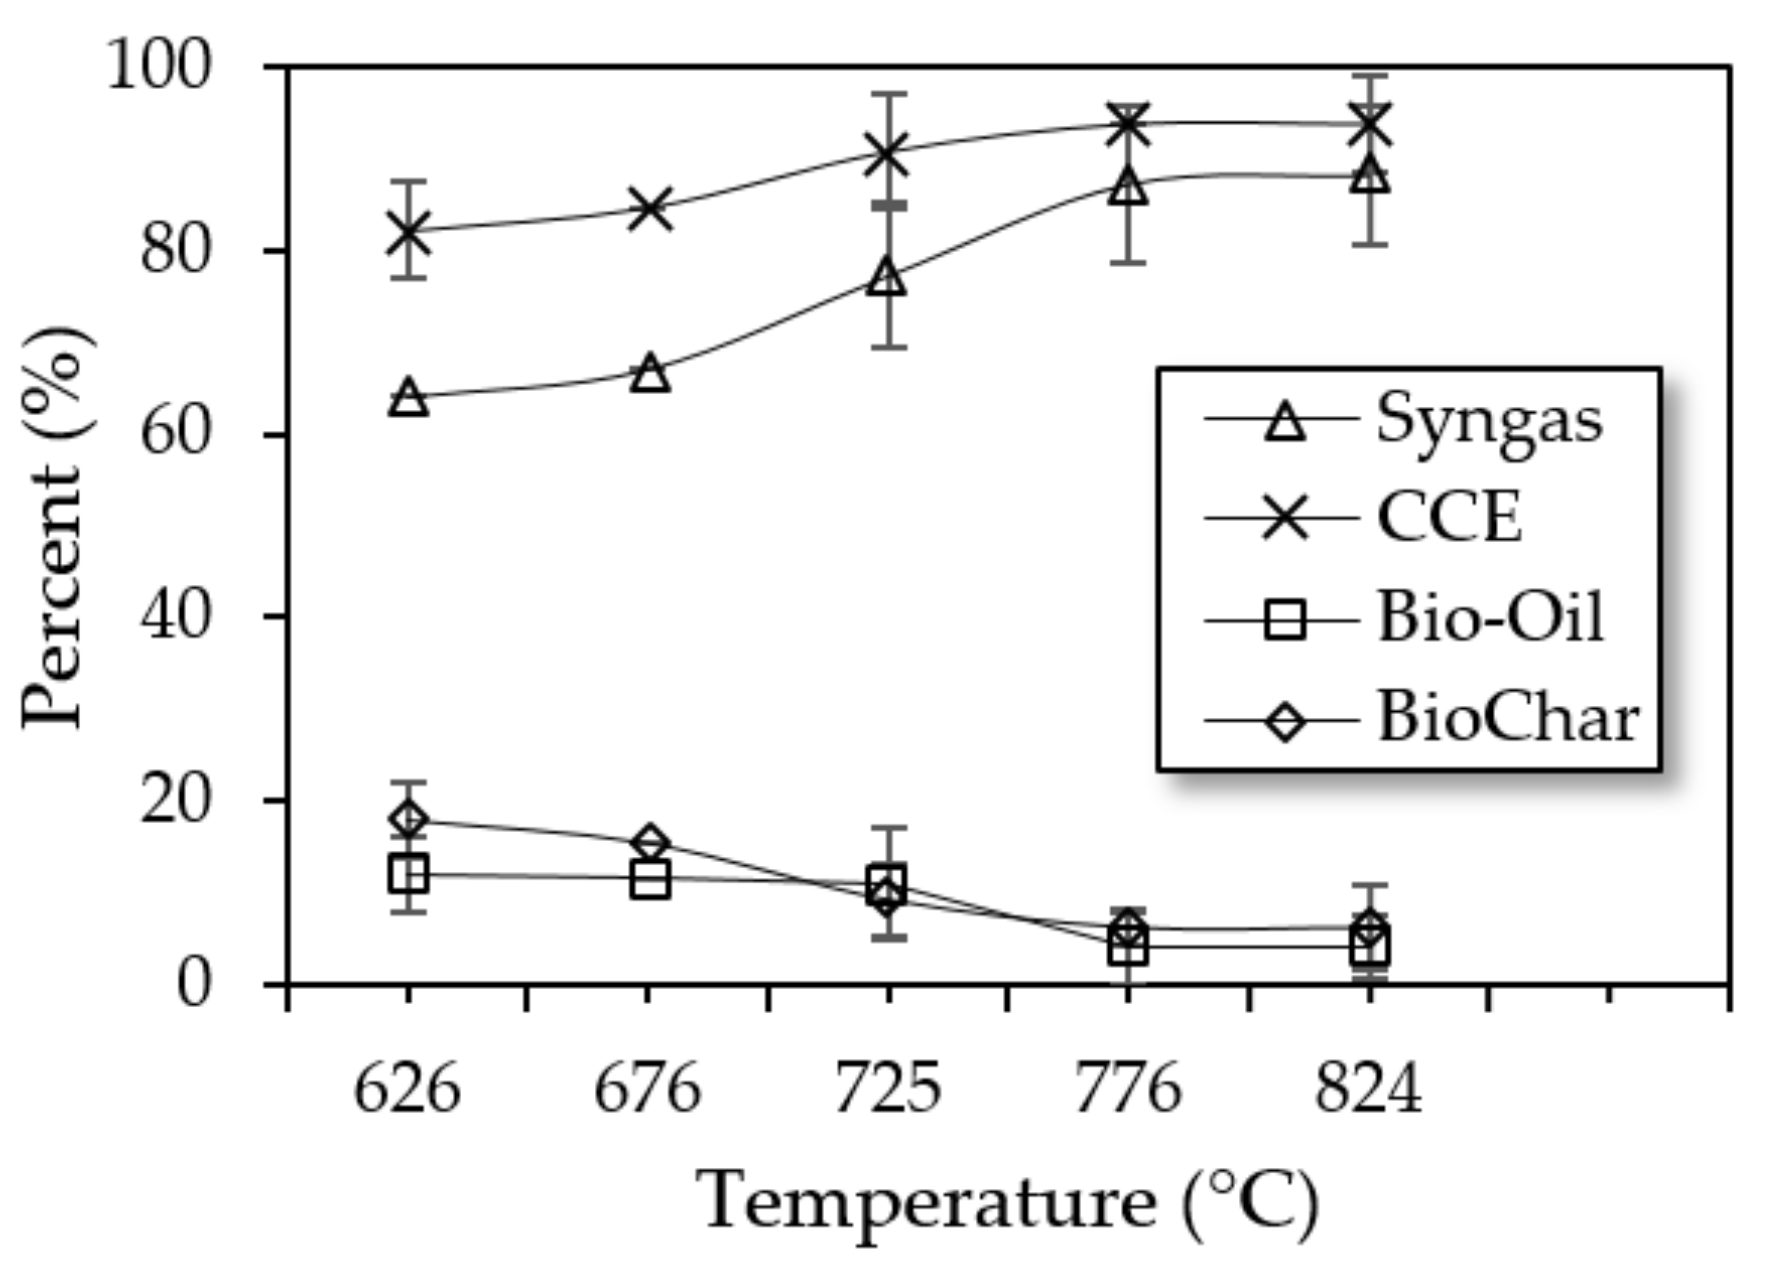
Temperature is of no doubt one of the most significant parameters to effect gasification, particularly when the target is to increase the syngas yield and carbon conversion rate [
34]. By-products (bio-oil, tar, and ash) were collected and weighted after completion of each sets of experiments and the yield of syngas was calculated by difference. The results of temperature variation are indicated in
Figure 10. Syngas yield increases with higher content of char gasified, meaning that the more hydrocarbon produce at pyrolysis zone, the more it breaks and produce syngas at gasification zone. Furthermore, carbon cracking increases with temperature rise hence higher syngas yield is expected to be achieved in higher temperatures. Moisture content has a significant effect on gasification as it increases the char split fraction and results in lower cold gas efficiency and lower syngas yield consequently [
7]; so for this experiment it was kept as low as possible. It is observable that both syngas yield and carbon conversion efficiency increased constantly from 64.1% and 82.1% to 88.28% and 93.71%, respectively, and with a temperature increase from 626 °C to 824 °C. The opposite effect of temperature was observed on the yield of residuals, whereby the solid biochars became lighter at higher temperatures due to greater hydrocarbon production, and separated from char at pyrolysis stage. The yield of biochar dropped from 17.9% at 626 °C to 4.26% at 824 °C. The similar trend observed for bio-oil and tar due to the increase in carbon conversion at higher temperatures, thus the yield of bio-oil and tar decrease from 12.1% and 5.6% at 626 °C to minimum of 4.26% and 1.15% at 824 °C, respectively. The maximum syngas yield and carbon conversion as well as minimum yield of residuals were obtained at 824 °C.
Experimental outputs related to the variation in ER are shown in
Figure 11. A rise in ER leads to push more air at a time into the gasifier and affect the gasification in two different manners in which the CCE drops in both ways.
Firstly, by reducing the temperature, the rates of endothermic reactions drops and less hydrocarbons convert to syngas as the result and secondly by reducing the resident time of solid particles to be in contact with gasifying agent, lower carbon conversion takes place. With respect to the mentioned observation, higher ER results in higher syngas yield as well. As observed, CCE fairly increased by ER from 84.8 at ER of 0.16 to 93.71 at ER of 0.33, then it decreased very slowly to 93.04 at ER of 0.45 with a slight slope that can be somewhat disregarded and considered relatively constant. The syngas yield however varied with fluctuations. Syngas slowly increased from 77.5% at ER of 0.16 to 91.45% at ER of 0.33 then it slightly dropped to 81.3%. The production of syngas scales with CCE but the trend is comparably more intensive than CCE and that’s due to the temperature drop in higher ER.
The minimum yield of biochar was obtained at ER of 0.33 (4.26%), and for bio-oil was recorded 1.25% at ER of 0.25. Both ERs of 0.25 and 0.33 seems desirable in terms of higher gas yield and carbon conversion and lower yield of residues. The focus on the effect of SBH on gasification performance is further towards to its impact on fluidization profile and interparticle interactions. Very high bed height requires higher air flow to maintain the same bed expansion. The excess air affects the temperature and hydrocarbon cracking and thus the gasification. Very low bed height on the other hand refuses to eliminate the intensive temperature gradient along the fluidization zone and hence affects the conversion of chemicals through gasification reactions [
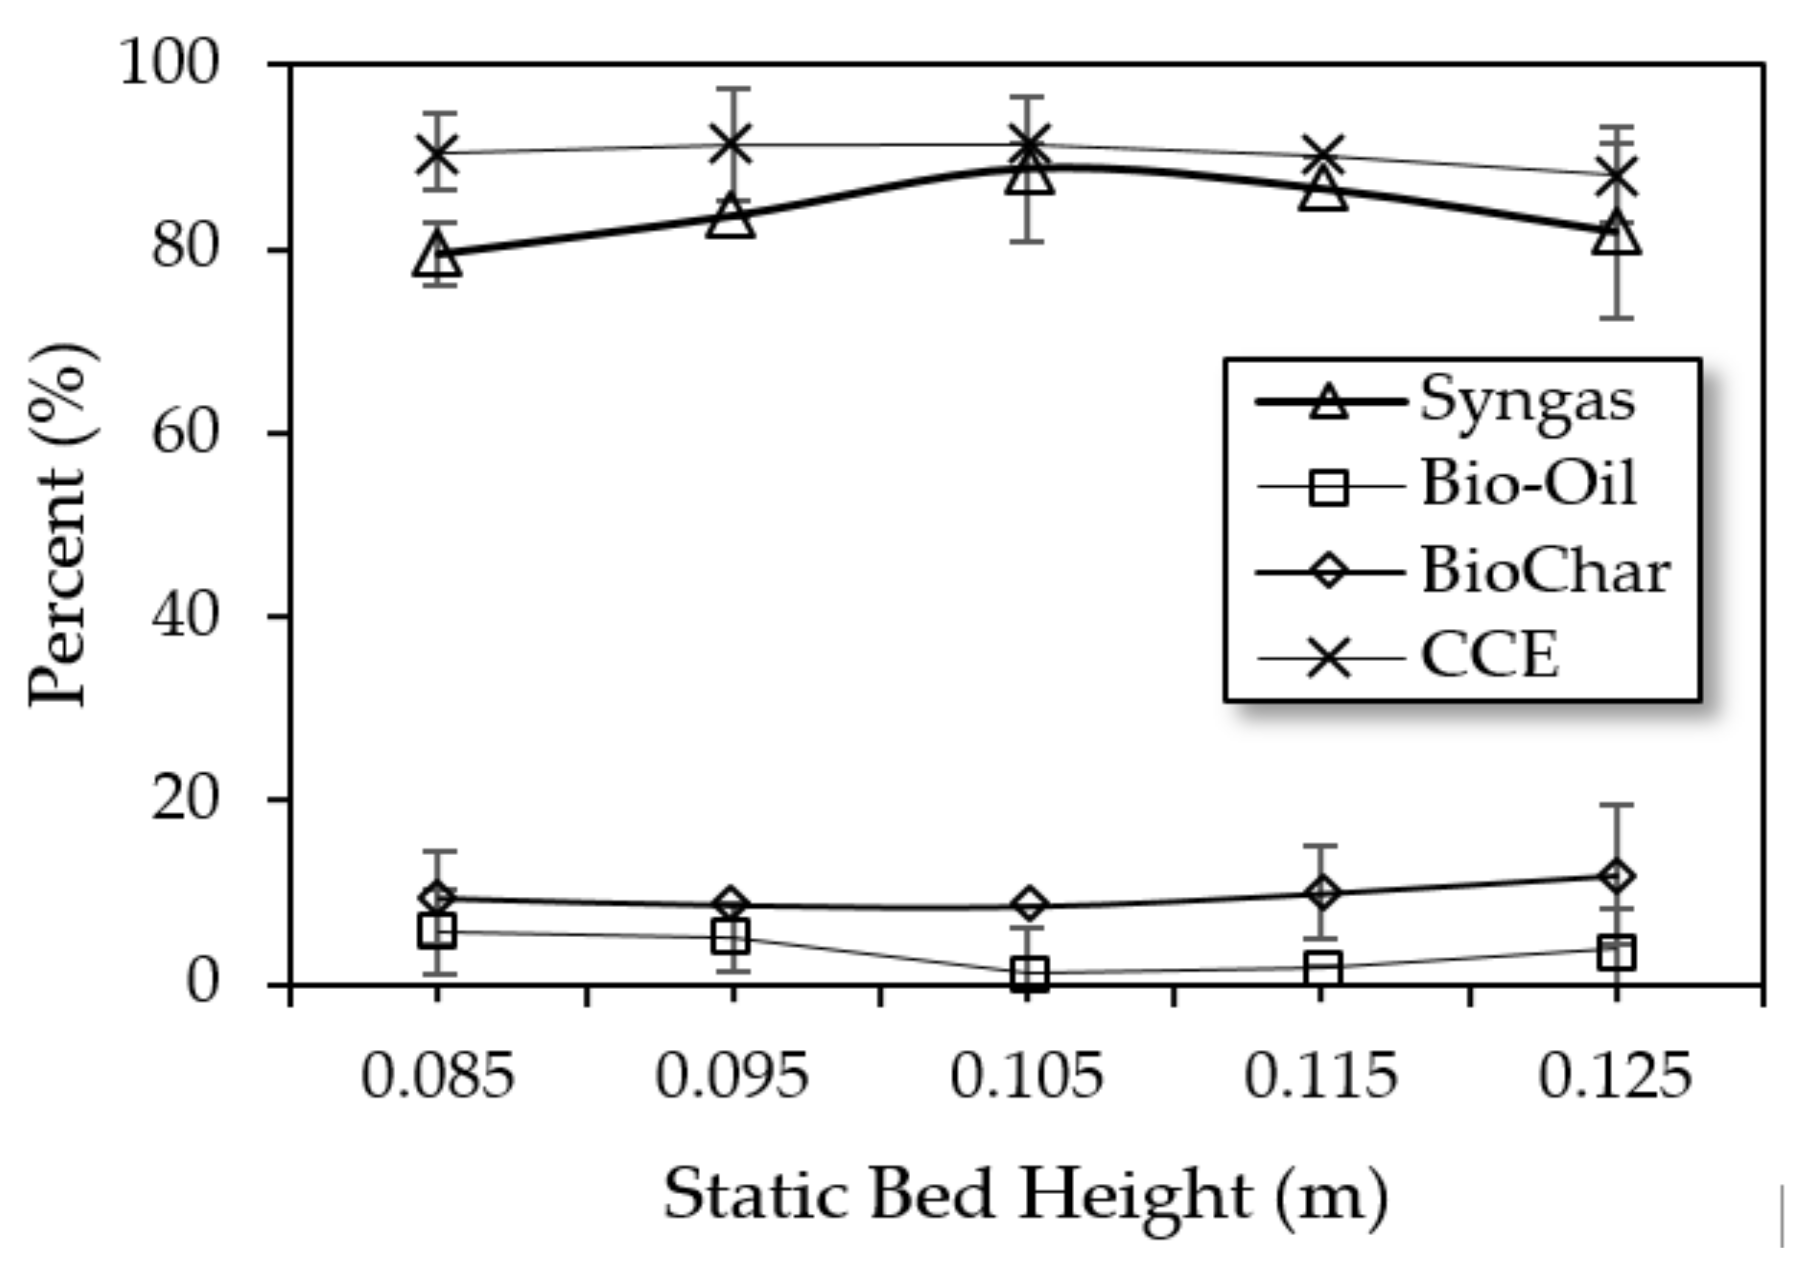
35]. In order to achieve the highest gasification performance, it is significant to find the most desirable SBH for the initial packing of reactor. The results related to the effect of SBH on gasification performance and efficiency are indicated in
Figure 12. Different SBH values were studied while the temperature was fixed at 824 °C and ER at 0.25 according to the most desirable quantities as previously discussed.
Increasing SBH from 0.085 m to 0.105 m leads to an increase in syngas yield from 79.5% to 88.68%, mostly due to the formation of maximum bed expansion for the fixed ER, which creates more available contact zone for air and solid particles. The yield of syngas began to drop gently as the bed height increases until it reached 81.9% at 0.125 m. SBH was not observed to have any significant effect on CCE, and it remains rather constant at any height. Bio-oil yield decreased by SBH and reached to its minimum of 1.25% at 0.105 m whereby the syngas reaches its maximum simultaneously. There is no significant effect of SBH observed on the production of bio char, however with very small slope it reached to its minimum of 8.55% in SBH of 0.105 m. The SBH of 0.105 m observed to be the most desirable bed height for the best gasification performance and highest efficiencies.
Optimal results from the experiments are concluded in two individual area of concern. One is focusing on syngas LHV and composition, while the other is from yields and efficiency. The results are summarized in
Table 4 and show that relatively higher gasification temperature, but lower equivalence ratio, will result in higher overall yield of syngas as well as carbon conversion. However, if the main focus is to produce syngas with higher combustible species hence, lower temperature and relatively higher ER are required. SBH was observed to have similar effect on both aspects.
4. Verification of Results
The optimal results from this study (base case) are compared to the results obtained from selected literatures which have performed experimental evaluation on biomass gasification in bubbling fluidized bed reactors. A small-scale 1 kW fluidized bed gasification of Napier grass was reported by Tan et al. (2017) [
36] (case-a). The study used a reactor with 0.37 m height and 0.054 m internal diameter and was equipped with two individually controlled electric furnaces were used to heat up purpose. Silica sand was used as bed material with particle size in the range of 90 to 125μm. The gasification was performed at optimal temperature of 850 °C, ER of 0.2, and static bed height of 0.054 m [
36]. Air gasification of rice husk was conducted by Makwana et al. (2015) [
8] (case-b) in a bench-scale autothermal fluidized bed gasifier having 0.21 m and 1.60 m of diameter and height respectively. Silica sand was chosen as bed material and was filled into the reactor to the height of 0.30 m. The optimal operating condition reported in the study was included the temperature of 816 °C and ER of 0.30 [
8]. Xue et al. (2014) [
37] (case-c) in an experimental study, performed air gasification of
Miscanthus x giganteus using an electrical heating fluidized bed gasifier (3.30 m height, 0.13 m inner diameter) and magnesite as bed material filled to the height of 0.33 m. The optimum temperature and ER of 645 °C and 0.26, respectively, were reported as the results of the study [
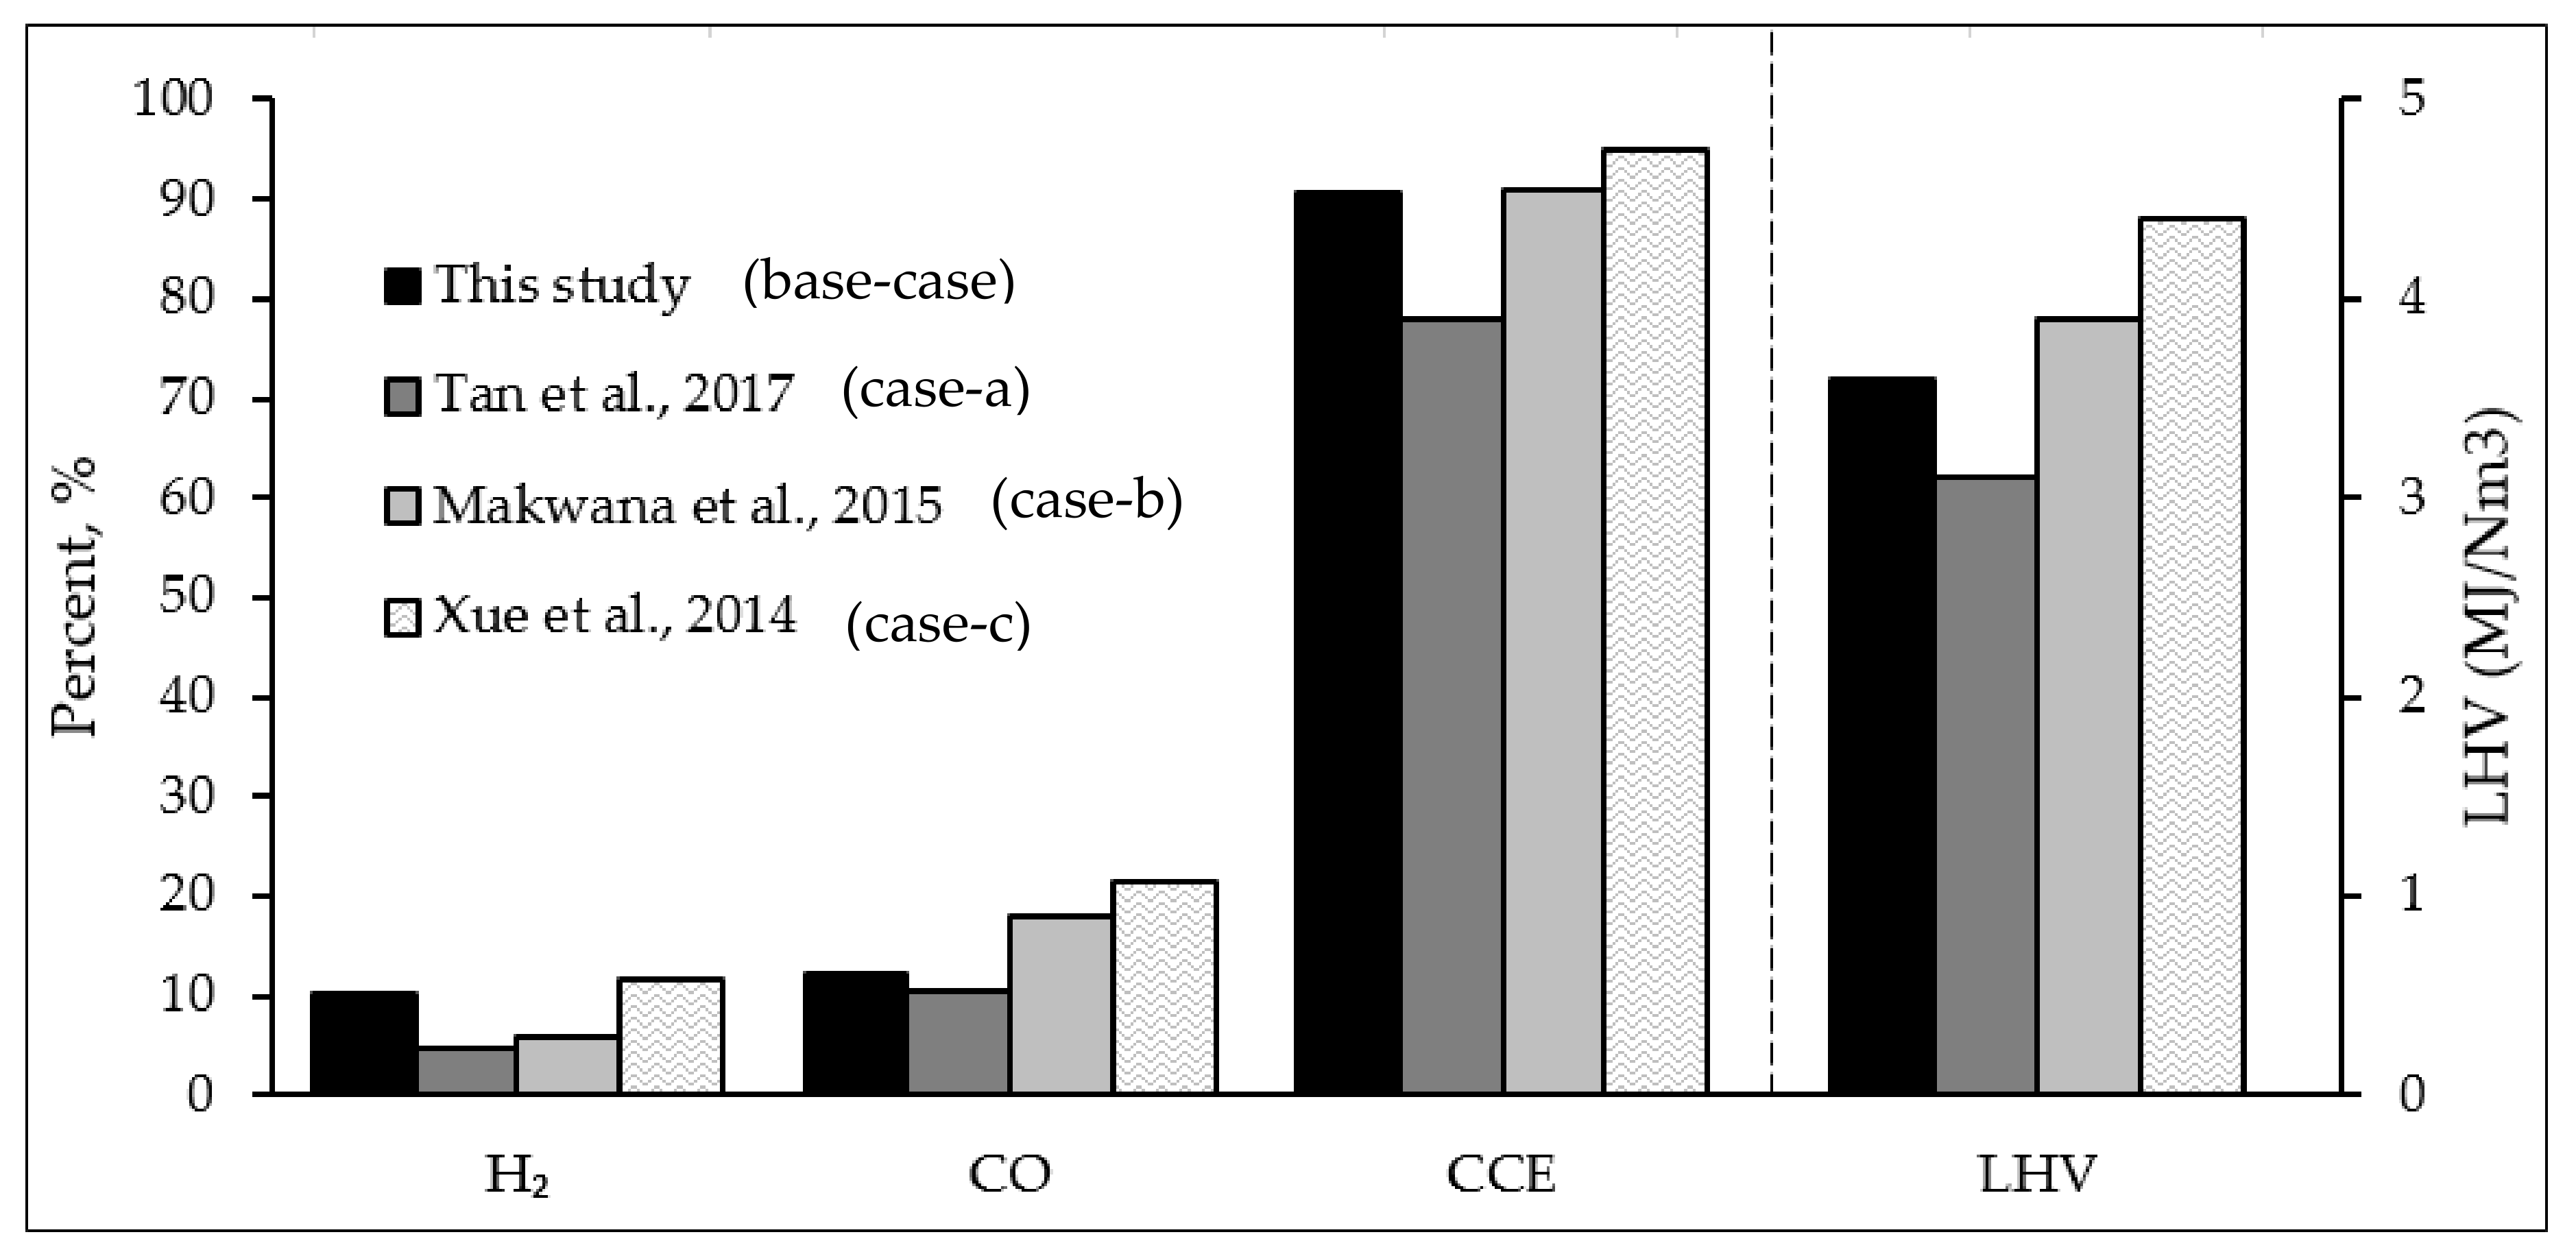
37]. All gasification studies were conducted with almost similar environmental condition. The results of comparison are presented in
Figure 13.
With regards to autothermal process used in this study, due to the instability of operation and insufficient source of energy to derive endothermic reactions, the process is expected to yield in lower combustible species as well as lower calorific value of syngas than the allothermal operation, which benefits from electrical heating. However, according to the results comparison, the yields of H2 and CO, as well as the LHV of the syngas and the carbon conversion efficiency for the gasification of 5 kW reactor in this study are relatively higher than that of electrical heating reactor reported by case-a. This can probably be attributed to the larger scale of reactor used or may be as a result of the accuracy of the optimization performed in this study which was able to minimize the possible noises and instabilities involved in the operation. The compositions of H2 in syngas for the current study (10.05%) is significantly larger than those reported by case-a (4.62%) and case-b (5.80%); however, the composition of CO is 12.13%, which is lower than 18% and 21.30% as reported in case-b and case-c, respectively. The value of CCE in current study (90.70%) is significantly higher than 78% (case-a), which is fairly close to 91% (case-b) and slightly lower than 94.81% (case-c). Similar observation is found for the syngas LHV, which is reported as 3.59 MJ/Nm3 in the current study while 3.10, 3.90, and 4.40 MJ/Nm3 are found in case-a, case-b and case-c respectively.
The large-scale equipment and bigger capacity of the reactor creates a more expanded interaction surface between the solid materials. Furthermore, the larger volume capacity provides higher solid–gas mixing zone whereby the carbon cracking takes place and the chemical reactions related to conversion of carbon to syngas are dominated [
38]. However, the larger scales of reactor is impactful on the final products only to some extent, where if the reactor volume exceeds the particular amount, the regarded effect becomes less significant due to many uncertainties and pitfalls as the result of scaling-up which may drastically deteriorate the reactor’s performance and economy [
39]. The similar fact is noticeable when comparing the autothermal reactor of this study to the larger reactor proposed by case-b, where there is no significant improvement in carbon conversion efficiency that has been obtained as the result of scale-up although the LHV and CO content of syngas has been increased to some extent.
5. Conclusions
A study on air gasification of Napier grass (NG) to produce combustible synthesis gas was investigated with the target of using direct combustion for power generation. A small-scale autothermal bubbling fluidized bed gasifier with 5 kW power capacity was used to investigate the effect of operating parameters, namely, reactor temperature, equivalence ratio (ER), and static bed height (SBH), on the yield and composition of syngas. Since the process is aimed to scale-up and apply for rural electrification in future, hence the standard design of the reactor and, likewise, the operating condition were selected so that to ensure the economic process far from any complexity. Minimum fluidization velocities corresponding to different bed heights were calculated and the range of SBH variation was determined. The one-factor-at-a-time (OFAT) method was used to carry out the experiments with different individual aspects towards the achievement to the highest yields of combustible species, calorific value of the gas (LHV), and to obtain the highest syngas production and carbon conversion efficiency. The results showed that the temperature and ER had the most significant effect on the yield of syngas as well as the composition of combustible species. ER had more complex effects on h2 responses, whereby the increase in ER up to 0.33 favored the yields of syngas, H2, and CO, but the inverse effect was observed for ER above 0.33. SBH was found an important factor to effect on the production of H2 and CO and the maximum yields of each were obtained at similar SBH. The highest yield of syngas (88.67%), LHV (90.70%), and CCE (3.59 MJ/Nm3) were obtained at a temperature of 824 °C, ER of 0.25, and SBH of 0.105 m. However, the highest compositions of H2 (12.13%) and CO (10.05%) and lowest yield of CO2 (9.04%) were achieved at a temperature of 725 °C, ER of 0.33, and SBH of 0.105 m. The results from this study were analytically compared to other results from the previous studies using fluidized bed gasifiers with different scales and heating characteristics. The autothermal gasification although is expected to present lower yields of combustible syngas compared to electrical heating reactors however, the composition of H2 and CO2 as well as CCE and LHV from this study were observed close to other autothermal and allothermal cases. In some cases, the results were reported to be even higher than the allothermal gasification due to the larger scale of reactor that presents higher reaction zone and better performance as a whole. In conclusion, the idea of this work can be applied to overcome the scale-up challenges and therefore the design of in situ gasifier to build in an affordable economic scale in rural area with restricted access to electrical grids.

 ,
, 


