Integrating Parametric Analysis with Building Information Modeling to Improve Energy Performance of Construction Projects

 ,
,  ,
, 
 ,
, 
Abstract
1. Introduction
2. Background
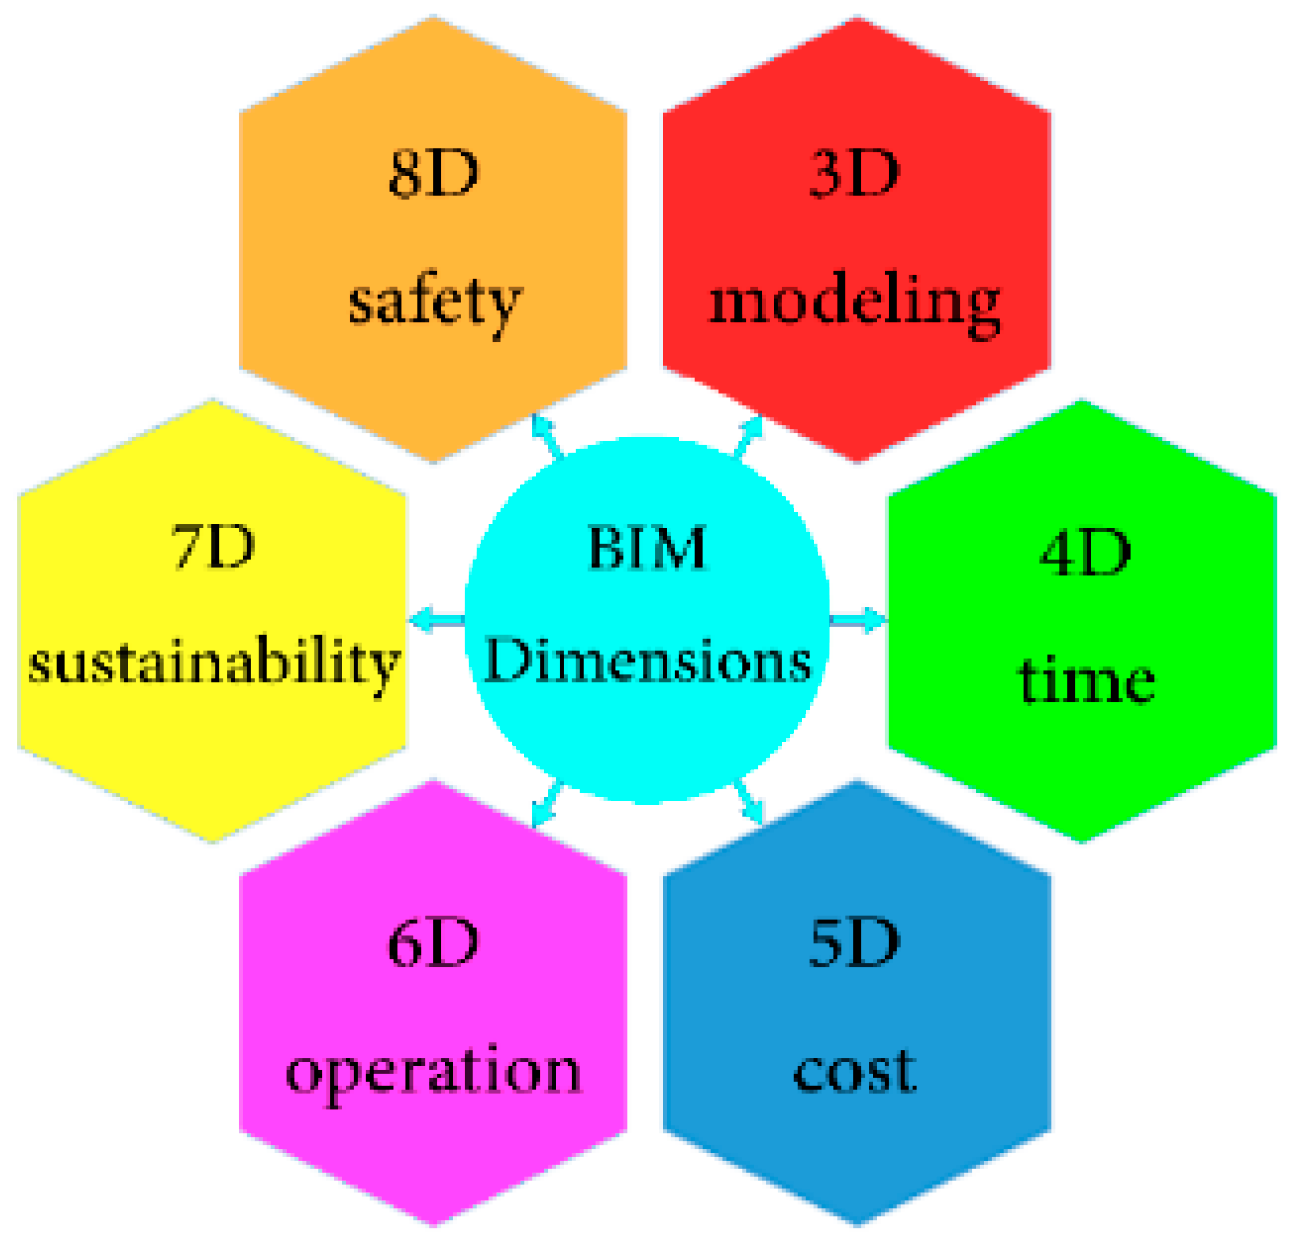
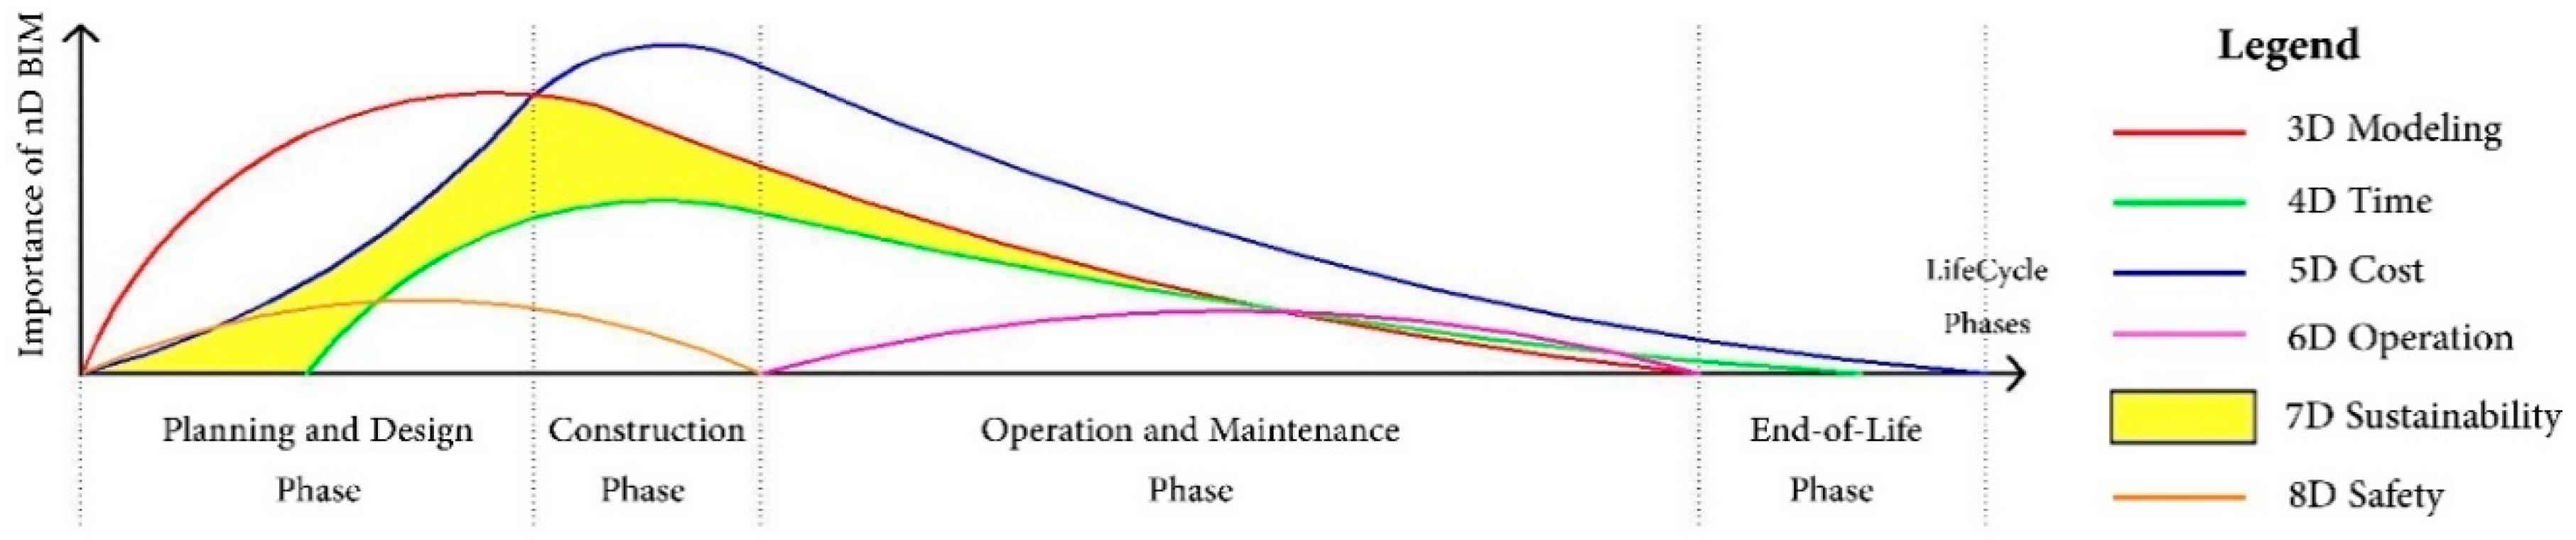
2.1. BIM Dimensions
2.2. Climate Zone Classification
- Tropical Climates, which is covering more than 20% of surface area, is subdivided into Tropical rainforest climate (Af), Tropical monsoon climate (Am) and Tropical savanna climate (Aw or As). The average temperature of the coldest month of the year for Tropical Climates is more than 18 °C.
- Dry Climates, which is covering more than 27% of surface area, is subdivided into Hot desert climate (BWh), Cold desert climate (BWk), Hot semi-arid climate (BSh) and Cold semi-arid climate (BSk). The average annual temperature for Dry Climates is between 20 and 35 °C.
- Mild Temperate Climates, which is covering more than 15% of the surface area, is subdivided into Humid subtropical climate (Cfa), Temperate oceanic climate (Cfb), Subpolar oceanic climate (Cfc), Monsoon-influenced humid subtropical climate (Cwa), Subtropical highland climate (Cwb), Cold subtropical highland climate (Cwc), Hot-summer Mediterranean climate (Csa), Warm-summer Mediterranean climate (Csb) and Cool-summer Mediterranean climate (Csc). The average annual temperature for Mild Temperate Climates is between −3 and 18 °C.
- Continental Climates, which is covering more than 21% of the surface area, is subdivided into Hot-summer humid continental climate (Dfa), Warm-summer humid continental climate (Dfb), Subarctic climate (Dfc), Extremely cold subarctic climate (Dfd), Monsoon-influenced hot-summer humid continental climate (Dwa), Monsoon-influenced warm-summer humid continental climate (Dwb), Monsoon-influenced subarctic climate (Dwc), Monsoon-influenced extremely cold subarctic climate (Dwd), Mediterranean-influenced hot-summer humid continental climate (Dsa), Mediterranean-influenced warm-summer humid continental climate (Dsb), Mediterranean-influenced subarctic climate (Dsc) and Mediterranean-influenced extremely cold, subarctic climate (Dsd). The average annual temperature is less than −3 °C.
- Polar Climates, which is covering up to 16% of the surface area, is subdivided into Tundra climate (ET) and Ice cap climate (EF). The lowest temperature ever recorded is −89.2 °C.
2.3. Related Literature
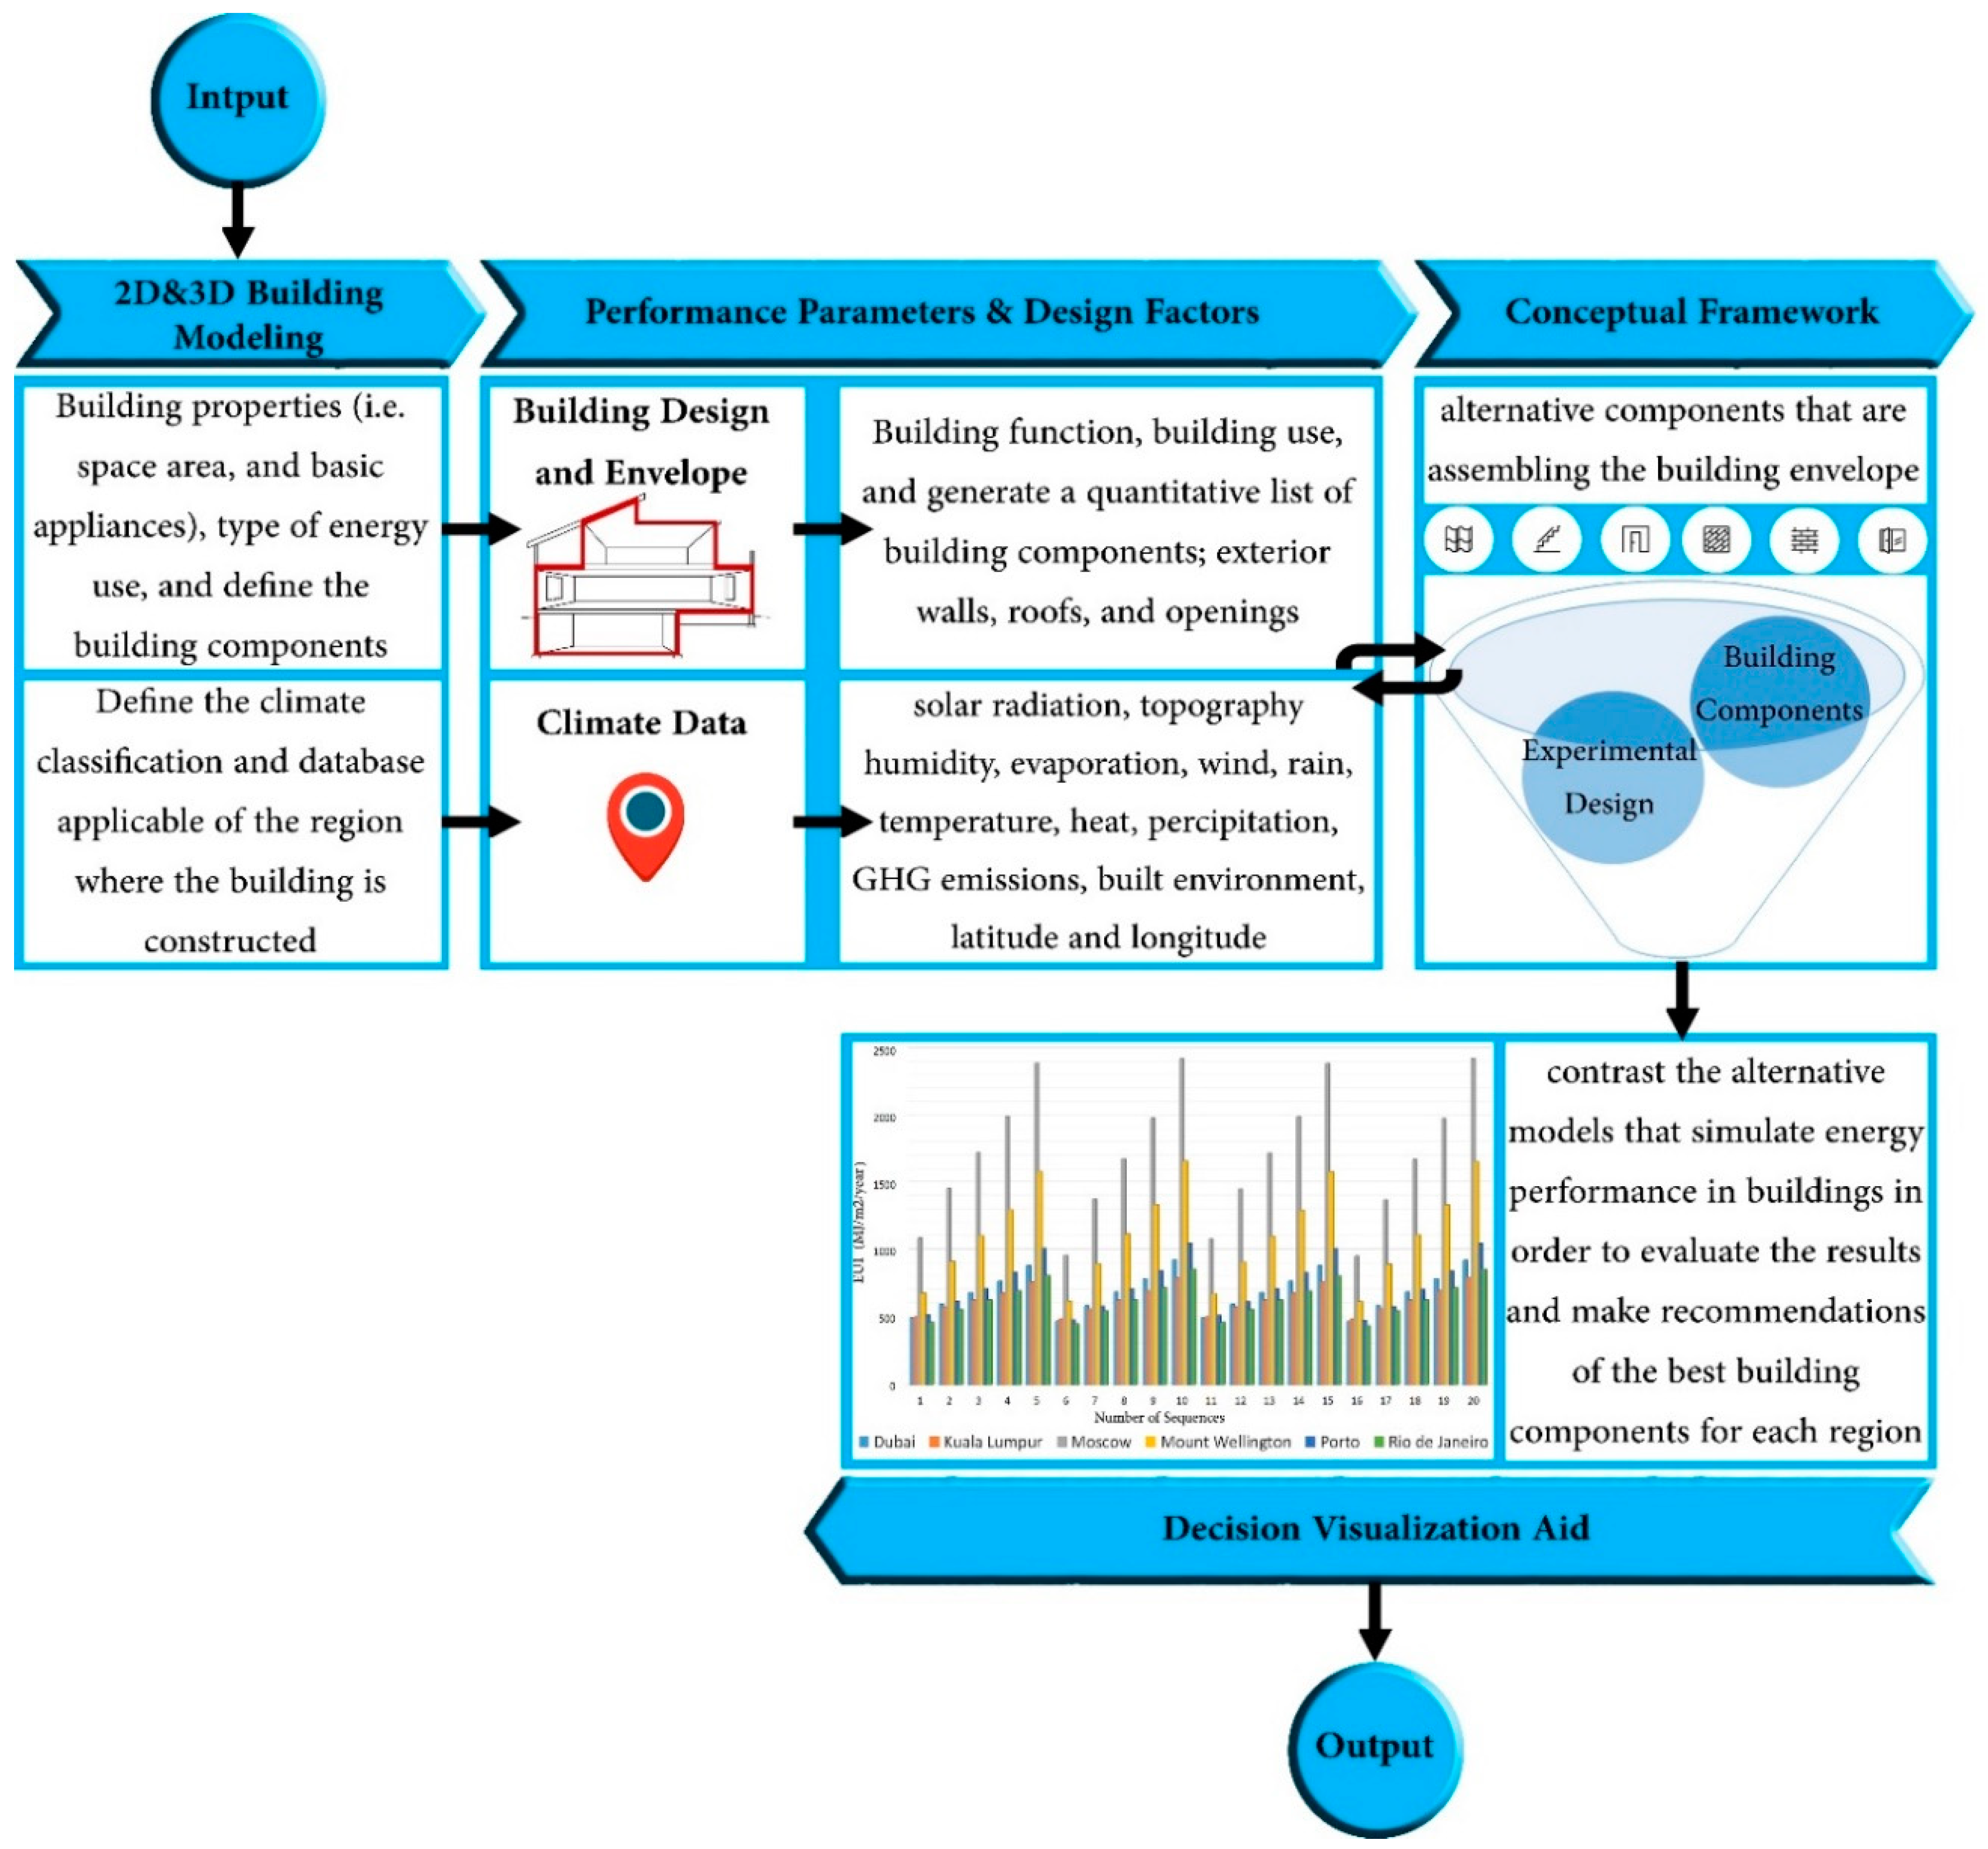
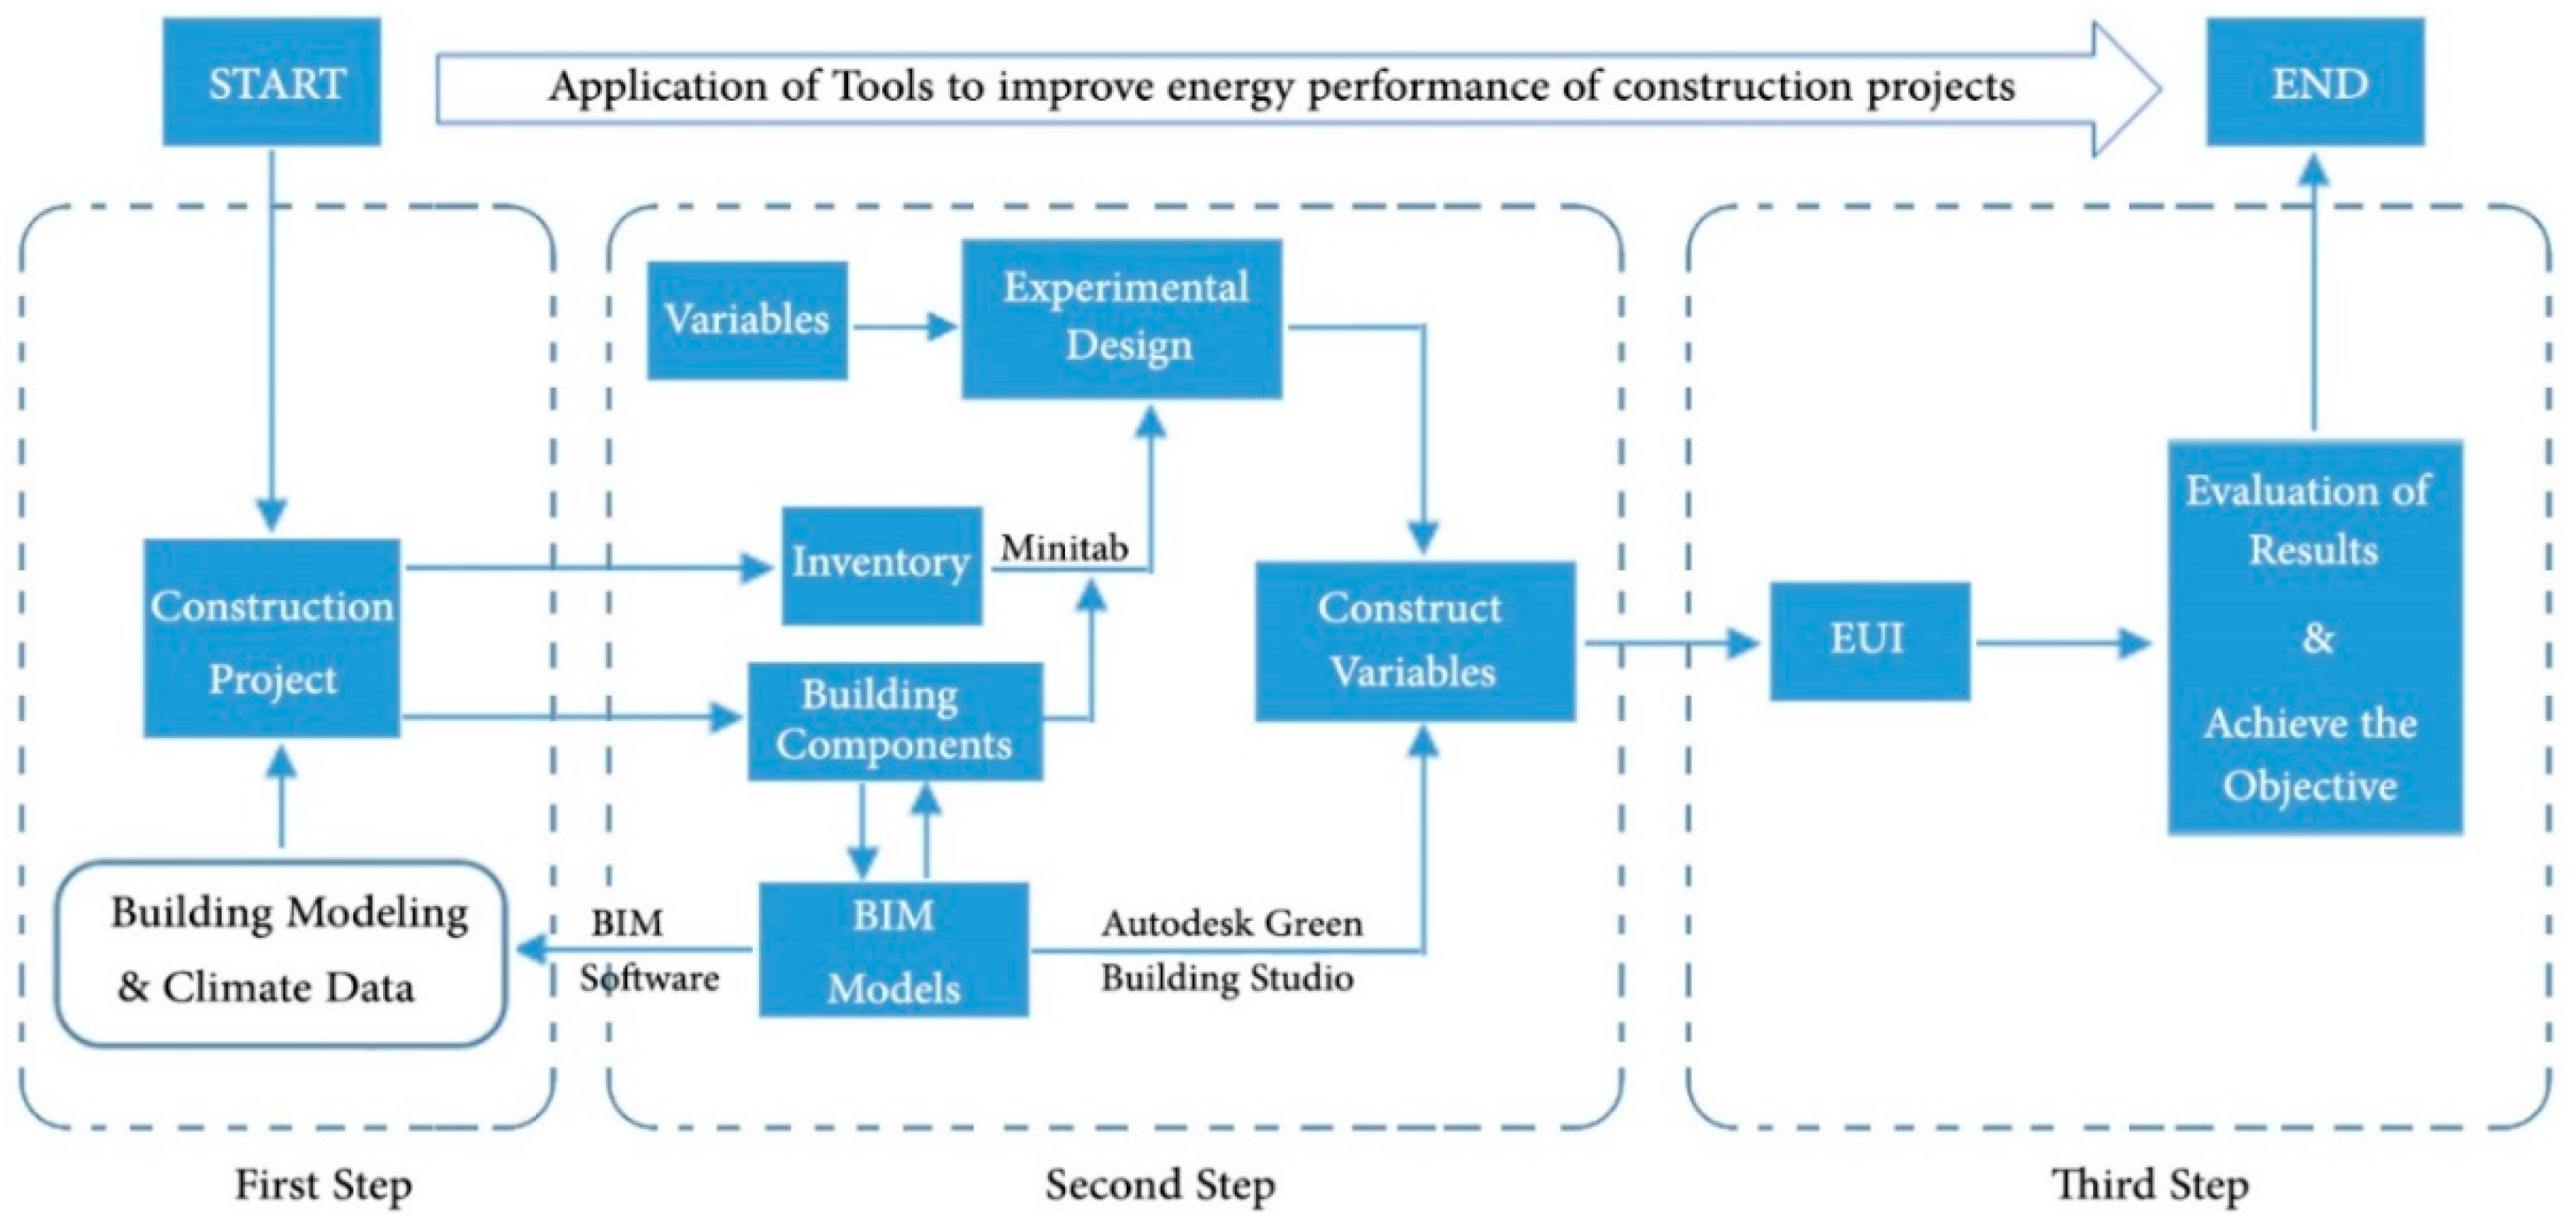
3. Materials and Methods
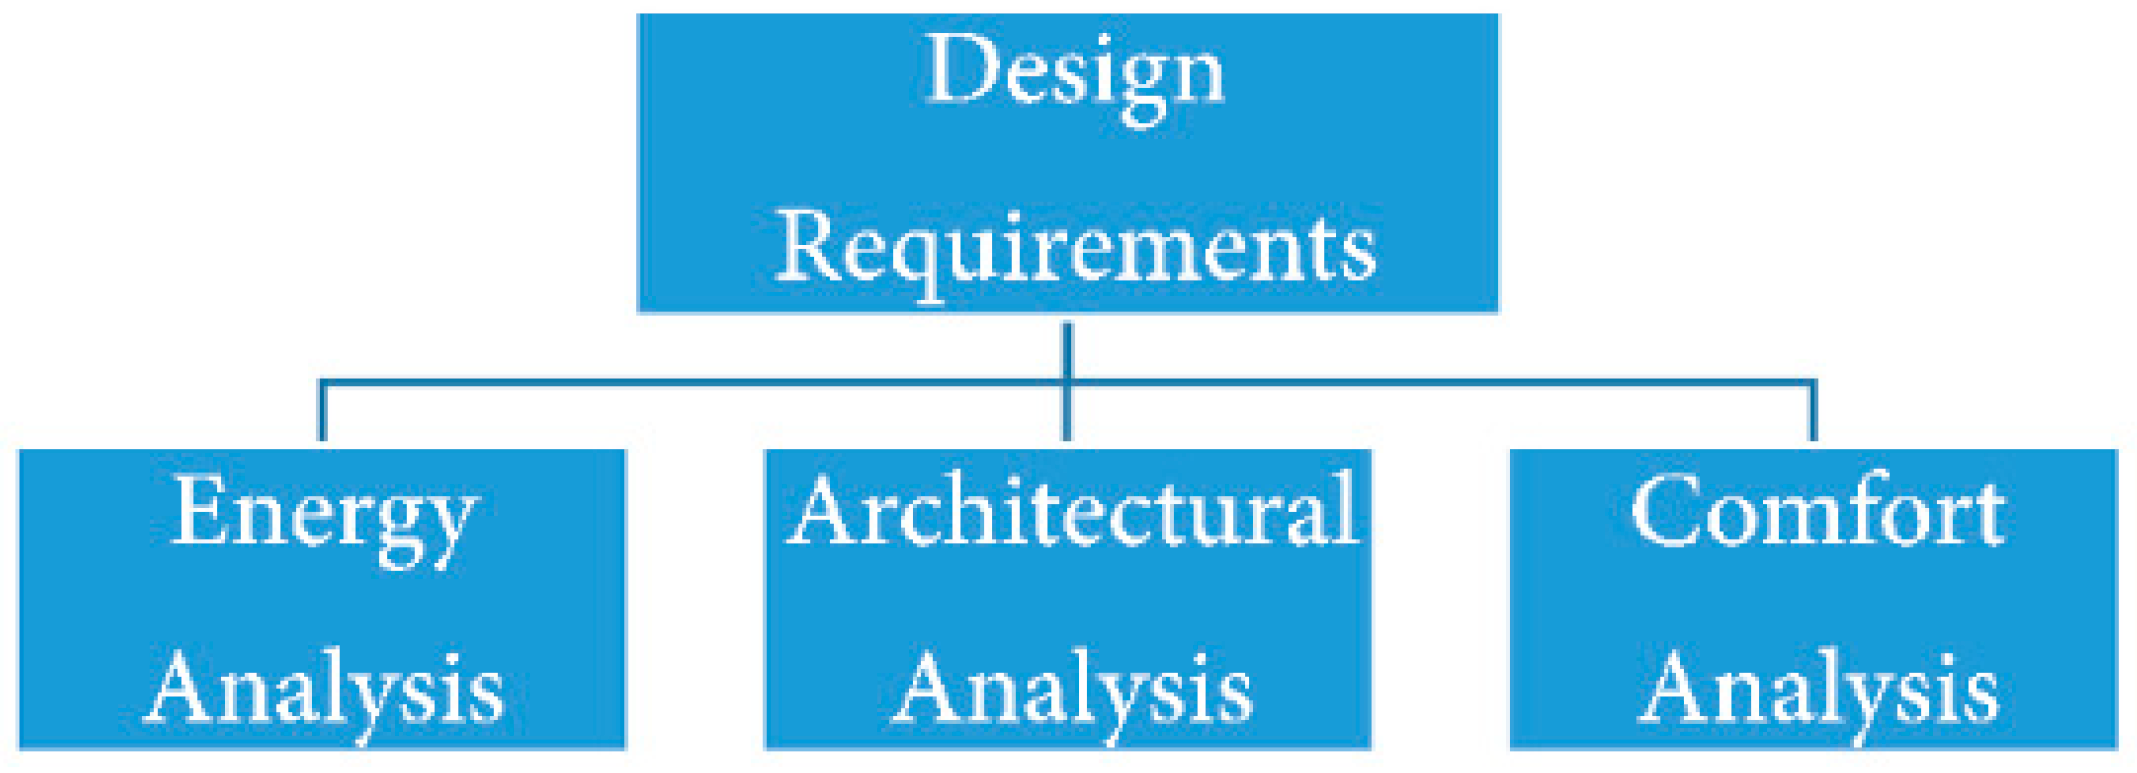
3.1. Design Requirements for Sustainable Construction
3.2. Decision Support Analysis
4. Linking Framework Components
5. Case Study: Validating the Methodological Framework in a Single-Family House
5.1. Size of the Case Study
5.2. Inventory of Database
5.3. Assessment of Design Factors
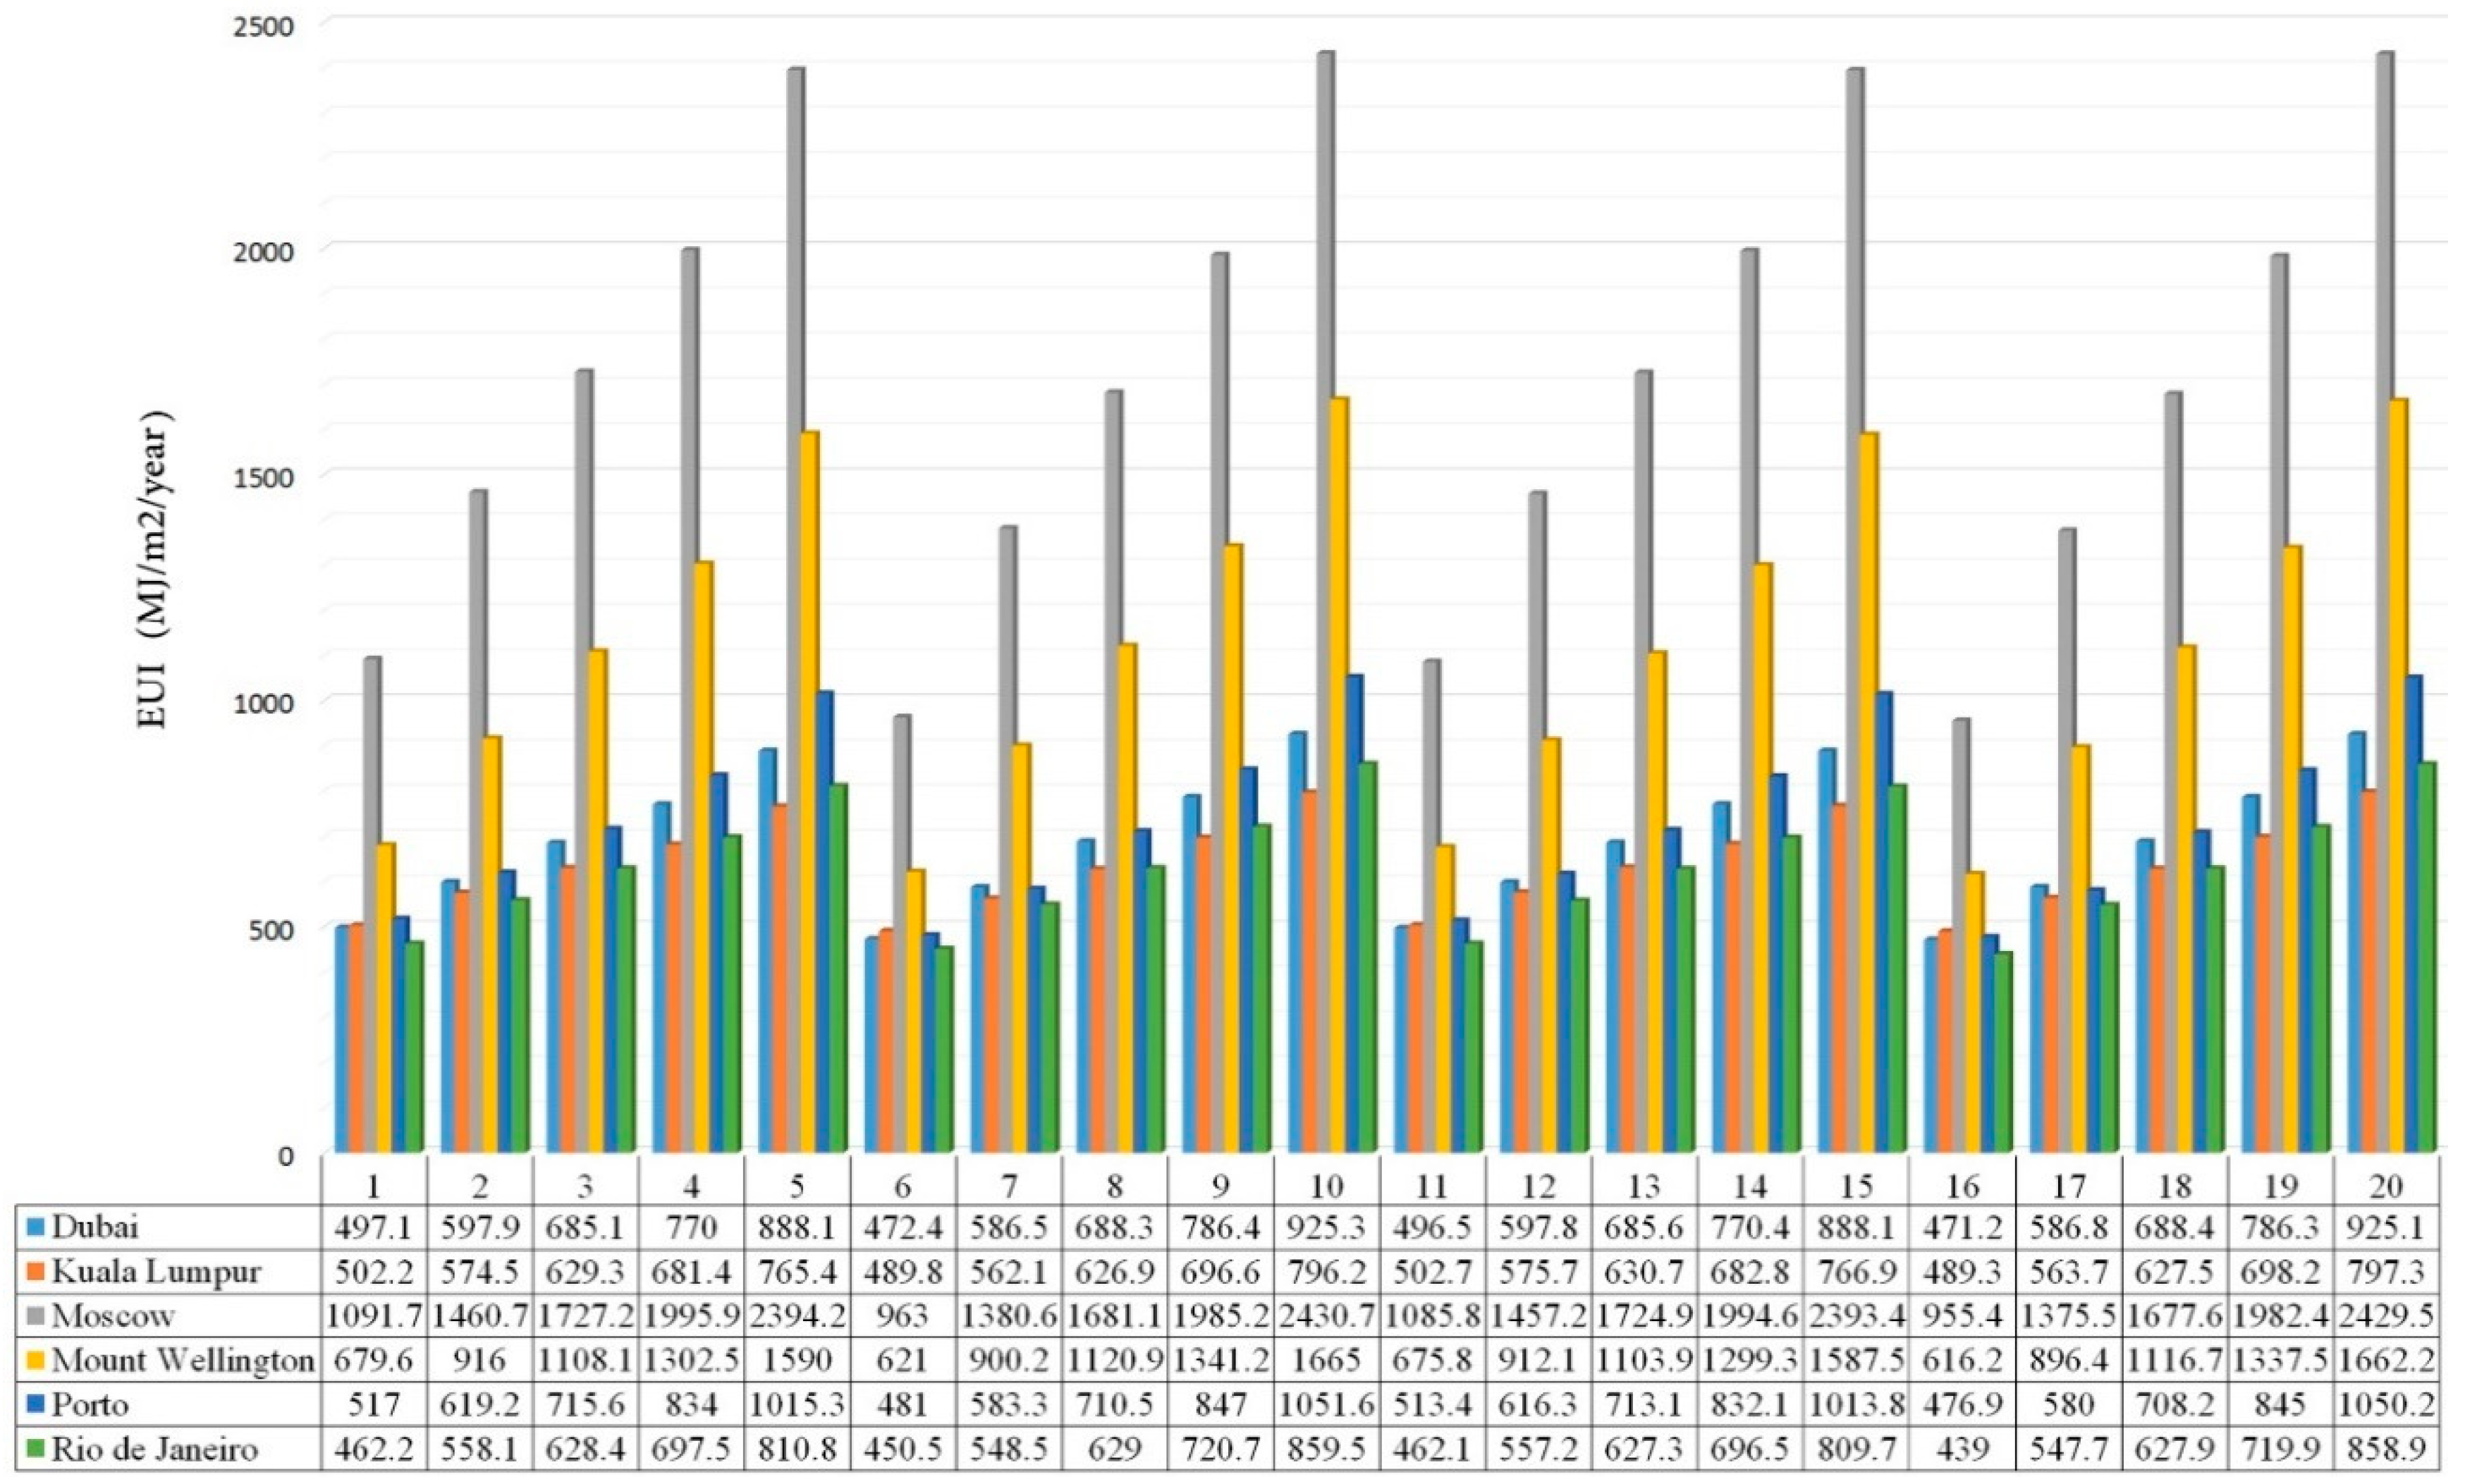
5.4. Evaluation of Results
- Adopting a building where the CRW is 30% instead of 15%, would influence the EUI in the case study by a percentage between 20.28% and 24.53% in Dubai; 14.40% and 15.20% in Kuala Lumpur; 33.80% and 43.97% in Moscow; 34.78% and 45.47% in Mount Wellington; 19.77% and 21.62% in Porto; and 20.58% and 24.76% in Rio de Janeiro.
- Adopting a building where the CRW is 40% instead of 30%, would influence the EUI in the case study by a percentage between 14.58% and 17.36% in Dubai; 9.54% and 11.53% in Kuala Lumpur; 18.24% and 21.96% in Moscow; 20.97% and 24.57% in Mount Wellington; 15.57% and 22.10% in Porto; and 12.58% and 14.68% in Rio de Janeiro.
- Adopting a building where the CRW is 50% instead of 40%, would influence the EUI in the case study by a percentage between 12.37% and 14.25% in Dubai; 8.26% and 11.27% in Kuala Lumpur; 15.56% and 18.17% in Moscow; 17.54% and 19.77% in Mount Wellington; 16.54% and 19.32% in Porto; and 10.99% and 14.65% in Rio de Janeiro.
- Adopting a building where the CRW is 65% instead of 50%, would influence the EUI in the case study by a percentage between 15.28% and 17.66% in Dubai; 12.32% and 14.30% in Kuala Lumpur; 19.95% and 22.55% in Moscow; 22.07% and 24.28% in Mount Wellington; 21.74% and 24.28% in Porto; and 16.24% and 19.31% in Rio de Janeiro.
- (a)
- 5.50% in Dubai, 2.74% in Kuala Lumpur, 14.27% in Moscow, 10.29% in Mount Wellington, 8.41% in Porto and 5.28% in Rio de Janeiro, considering a CWR of 15%.
- (b)
- 1.94% in Dubai, 2.42% in Kuala Lumpur, 6.19% in Moscow, 2.19% in Mount Wellington, 6.76% in Porto and 1.90% in Rio de Janeiro, considering a CWR of 30%.
- (c)
- 0.48% in Dubai, 0.61% in Kuala Lumpur, 2.97% in Moscow, 1.54% in Mount Wellington, 1.04% in Porto and 0.27% in Rio de Janeiro, considering a CWR of 40%.
- (d)
- 2.12% in Dubai, 2.47% in Kuala Lumpur, 0.68% in Moscow, 3.23% in Mount Wellington, 1.79% in Porto and 3.47% in Rio de Janeiro, considering a CWR of 50%.
- (e)
- 4.19% in Dubai, 4.17% in Kuala Lumpur, 1.56% in Moscow, 4.88% in Mount Wellington, 3.73% in Porto and 6.15% in Rio de Janeiro, considering a CWR of 65%.
6. Insights
7. Conclusions
Supplementary Materials
Author Contributions
Funding
Acknowledgments
Conflicts of Interest
References
- Lasvaux, S. Study of a Simplified Model for the Life Cycle Analysis of Buildings; Paris Institute de Technologie: Paris, France, 2010. [Google Scholar]
- Wong, J.K.W.; Zhou, J. Enhancing environmental sustainability over building life cycles through green BIM: A review. Autom. Constr. 2015, 57, 156–165. [Google Scholar] [CrossRef]
- Li, Y.; Zhu, N.; Qin, B. What Affects the Progress and Transformation of New Residential Building Energy Efficiency Promotion in China: Stakeholders’ Perceptions. Energies 2019, 12, 1027. [Google Scholar] [CrossRef]
- Ballarini, I.; De Luca, G.; Paragamyan, A.; Pellegrino, A.; Corrado, V. Transformation of an Office Building into a Nearly Zero Energy Building (nZEB): Implications for Thermal and Visual Comfort and Energy Performance. Energies 2019, 12, 895. [Google Scholar] [CrossRef]
- Lechner, N. Heating, Cooling, Lighting: Sustainable Design Methods for Architects; John Wiley & Sons: Hoboken, NJ, USA, 2014; Available online: https://books.google.com.br/books?hl=pt-BR&lr=&id=WjetCwAAQBAJ&oi=fnd&pg=PR11&dq=Heating,+Cooling,+Lighting+Sustainable+Design+Methods+for+Architects+4th&ots=YNKgETPI88&sig=6LA9wCMFfTyJm6opj9g6hpCHjFQ#v=onepage&q=Heating%2C Cooling%2C (accessed on 16 April 2019).
- Lundström, L.; Akander, J.; Zambrano, J. Development of a Space Heating Model Suitable for the Automated Model Generation of Existing Multifamily Buildings—A Case Study in Nordic Climate. Energies 2019, 12, 485. [Google Scholar] [CrossRef]
- Kim, S.; Song, Y.; Sung, Y.; Seo, D.; Sung, Y. Development of a Consecutive Occupancy Estimation Framework for Improving the Energy Demand Prediction Performance of Building Energy Modeling Tools. Energies 2019, 12, 433. [Google Scholar] [CrossRef]
- Najjar, M.; Figueiredo, K.; Palumbo, M.; Haddad, A. Integration of BIM and LCA: Evaluating the environmental impacts of building materials at an early stage of designing a typical office building. J. Build. Eng. 2017, 14, 115–126. [Google Scholar] [CrossRef]
- Anand, C.K.; Amor, B. Recent developments, future challenges and new research directions in LCA of buildings: A critical review. Renew. Sustain. Energy Rev. 2017, 67, 408–416. [Google Scholar] [CrossRef]
- UNEP. Buildings and Climate Change: Status, Challenges and Opportunities; UNEP: Nairobi, Kenya, 2007. [Google Scholar]
- Jrade, A.; Jalaei, F. Integrating building information modeling (BIM) and energy analysis tools with green building certification system to conceptually design sustainable buildings. J. Inf. Technol. Constr. 2014, 19, 494–519. [Google Scholar]
- Petri, I.; Kubicki, S.; Rezgui, Y.; Guerriero, A.; Li, H. Optimizing energy efficiency in operating built environment assets through building information modeling: A case study. Energies 2017, 10, 1167. [Google Scholar] [CrossRef]
- Autodesk. Building Information Modelling for Sustainable Design: Conceptual Building Performance Analysis Overview. 2011. Available online: http://www.sustainabilityworkshop.autodesk.com (accessed on 23 December 2018).
- GhaffarianHosein, A.; Zhang, T.; Nwadigo, O.; GhaffarianHosein, A.; Naismith, N.; Tookey, J.; Raahemifar, K. Application of nD BIM Integrated Knowledge-based Building Management System (BIM-IKBMS) for inspecting post-construction energy effieciency. Renew. Sustain. Energy Rev. 2017, 72, 935–949. [Google Scholar] [CrossRef]
- Succar, B. Automation in Construction Building information modelling framework: A research and delivery foundation for industry stakeholders. Autom. Constr. 2009, 18, 357–375. [Google Scholar] [CrossRef]
- Nist Sematech. Process Improvement. In: Engineering Statistics. 2012. Available online: http://www.itl.nist.gov/div898/handbook/pri/pri.htm (accessed on 28 May 2018).
- Eastman, C.; Teicholz, P.; Sacks, R.; Liston, K. BIM Handbook: A Guide to Building Information Modeling for Owners, Managers, Designers, Engineers and Contractors, 2nd ed.; Wiley: Hoboken, NJ, USA, 2011; 648p. [Google Scholar]
- Autodesk. Building Information Modeling for Sustainable Design; U.S. Department of Energy, Energy Efficiency and Renewable Energy Network (EREN), Center of Excellence for Sustainable Development: Washington, DC, USA, 2003.
- Bomfim, C.A.A.; Lisboa, B.T.W.; de Matos, P.C.C. Gestão de Obras com BIM—Uma nova era para o setor da Construção Civil Construction Management with BIM—A new era for the Construction sector Metodologia. In Proceedings of the SIGraDi 2016, XX Congress of the Iberoamerican Society of Digital Graphics, Buenos Aires, Argentina, 9–11 November 2016; pp. 556–560. [Google Scholar]
- Jupp, J. 4D BIM for Environmental Planning and Management. Procedia Eng. 2017, 180, 190–201. [Google Scholar] [CrossRef]
- Lu, Q.; Won, J.; Cheng, J.C.P. A financial decision making framework for construction projects based on 5D Building Information Modeling (BIM). Int. J. Proj. Manag. 2016, 34, 3–21. [Google Scholar] [CrossRef]
- Barrett, P.; Baldry, D. Facilities Management: Towards Best Practice, 2nd ed. 2003. Available online: https://www.amazon.com/Facilities-Management-Towards-Best-Practice/dp/0632064455 (accessed on 16 April 2019).
- Smith, P. BIM & the 5D Project Cost Manager. Procedia Soc. Behav. Sci. 2014, 119, 475–484. [Google Scholar]
- Fadeyi, M.O. Gulf Organisation for Research and Development The role of building information modeling (BIM) in delivering the sustainable building value. Int. J. Sustain. Built Environ. 2017, 6, 711–722. [Google Scholar] [CrossRef]
- Zhai, Z.J.; Helman, J.M. Implications of climate changes to building energy and design. Sustain. Cities Soc. 2019, 44, 511–519. [Google Scholar] [CrossRef]
- Waddicor, D.A.; Fuentes, E.; Sisó, L.; Salom, J.; Favre, B.; Jiménez, C.; Azar, M. Climate change and building ageing impact on building energy performance and mitigation measures application: A case study in Turin, northern Italy. Build. Environ. 2016, 102, 13–25. [Google Scholar] [CrossRef]
- Chmielewski, F.-M.; Blümel, K.; Henniges, Y.; Blanke, M.; Weber, R.W.; Zoth, M. Phenological models for the beginning of apple blossom in Germany. Meteorol. Z. 2011, 20, 487–496. [Google Scholar] [CrossRef]
- Chen, D.; Chen, H.W. Using the Köppen classification to quantify climate variation and change: An example for 1901–2010. Environ. Dev. 2013, 6, 69–79. [Google Scholar] [CrossRef]
- Arnfield, A.J. Köppen Climate Classification. Encyclopaedia Britannica. 2017. Available online: https://www.britannica.com/science/Koppen-climate-classification (accessed on 25 February 2019).
- Rubel, F.; Kottek, M. Observed and projected climate shifts 1901–2100 depicted by world maps of the Koppen-Geiger climate classifcation World Map of Köppen-Geiger Climate Classification. Meteorol. Z. 2010, 19, 135–141. [Google Scholar] [CrossRef]
- Yoo, J.; Rohli, R.V. Global distribution of Köppen–Geiger climate types during the Last Glacial Maximum, Mid-Holocene and present. Palaeogeogr. Palaeoclimatol. Palaeoecol. 2016, 446, 326–337. [Google Scholar] [CrossRef]
- Rahman, H.; Han, H. Correlation of Ventilative Cooling Potentials and Building Energy Savings in Various Climatic Zones. Energies 2019, 12, 968. [Google Scholar] [CrossRef]
- Azhar, S.; Brown, J. BIM for Sustainability Analyses. Int. J. Constr. Educ. Res. 2009, 5, 276–292. [Google Scholar] [CrossRef]
- Jeong, W.; Son, J. An Algorithm to Translate Building Topology in Building Information Modeling into Object-Oriented Physical Modeling-Based Building Energy Modeling. Energies 2016, 9, 50. [Google Scholar] [CrossRef]
- Brown, J.W.; Sattineni, A.; Azhar, S. A Case Study of Building Performance Analyses Using Building Information Modeling. In Proceedings of the 27th International Symposium on Automation and Robotics in Construction, Bratislava, Slovakia, 25–27 June 2010; pp. 213–222. [Google Scholar]
- Chong, H.-Y.; Lee, C.-Y.; Wang, X. A mixed review of the adoption of Building Information Modelling (BIM) for sustainability. J. Clean. Prod. 2017, 142, 4114–4126. [Google Scholar] [CrossRef]
- Ilhan, B.; Yaman, H. Automation in Construction Green building assessment tool (GBAT) for integrated BIM-based design decisions. Autom. Constr. 2016, 70, 26–37. [Google Scholar] [CrossRef]
- Azhar, S.; Nadeem, A.; Mok, J.Y.N.; Leung, B.H.Y. Building Information Modeling (BIM): A New Paradigm for Visual Interactive Modeling and Simulation for Construction Projects. In Proceedings of the First International Conference on Construction in Developing Countries (ICCIDC–I), Karachi, Pakistan, 4–5 August 2008; pp. 435–446. [Google Scholar]
- European Commission. Good Practice in Energy Efficiency: For a Sustainable, Safer and More Competitive Europe. 2015. Available online: https://ec.europa.eu/energy/sites/ener/files/documents/good_practice_in_ee_-web.pdf (accessed on 16 April 2019).
- Halverson, M.A.; Athalye, R.A.; Rosenberg, M.I.; Hart, P.R.; Richman, E.E.; Winiarski, D.W. ANSI/ASHRAE/IES Standard 90.1-2013 Determination of Energy Savings: Quantitative Analysis; Pacific Northwest National Lab. (PNNL): Richland, WA, USA, 2014.
- Khoshbakht, M.; Gou, Z.; Dupre, K. Energy use characteristics and benchmarking for higher education buildings. Energy Build. 2018, 164, 61–76. [Google Scholar] [CrossRef]
- Huo, T.; Cai, W.; Ren, H.; Feng, W.; Zhu, M.; Lang, N.; Gao, J. China’s building stock estimation and energy intensity analysis. J. Clean. Prod. 2019, 207, 801–813. Available online: https://linkinghub.elsevier.com/retrieve/pii/S0959652618330749. [CrossRef]
- Choi, J.-H. Investigation of the correlation of building energy use intensity estimated by six building performance simulation tools. Energy Build. 2017, 147, 14–26. [Google Scholar] [CrossRef]
- Valentin EnergieSoftware GmbH. Design and Simulation of Photovoltaic Systems; Valentin EnergieSoftware GmbH: Berlin, Germany, 2010. [Google Scholar]
- Almeida, H.S. Thermal Comfort Analysis of Buildings Using Theoretical and Adaptive Models; Universidade Técnica de Lisboa: Lisbon, Portugal, 2010. [Google Scholar]
- Scuderi, G. Designing Flexibility and Adaptability: The Answer to Integrated Residential Building Retrofit. Designs 2019, 3, 3. [Google Scholar] [CrossRef]
- Akadiri, P.O.; Chinyio, E.A.; Olomolaiye, P.O. Design of A Sustainable Building: A Conceptual Framework for Implementing Sustainability in the Building Sector. Buildings 2012, 2, 126–152. [Google Scholar] [CrossRef]
- Bueno, C.; Fabricio, M.M. Comparative analysis between a complete LCA study and results from a BIM-LCA plug-in. Autom. Constr. 2018, 90, 188–200. [Google Scholar] [CrossRef]
- Yin, B.C.L.; Laing, R.; Leon, M.; Mabon, L. An evaluation of sustainable construction perceptions and practices in Singapore. Sustain. Cities Soc. 2018, 39, 613–620. [Google Scholar] [CrossRef]
- Sharma, M. Development of a ‘Green building sustainability model’ for Green buildings in India. J. Clean. Prod. 2018, 190, 538–551. [Google Scholar] [CrossRef]
- Kissi, E.; Sadick, M.; Agyemang, D.Y. Drivers militating against the pricing of sustainable construction materials: The Ghanaian quantity surveyors perspective. Case Stud. Constr. Mater. 2018, 8, 507–516. [Google Scholar] [CrossRef]
- Zangheri, P.; Armani, R.; Pietrobon, M.; Pagliano, L.; Fernandez Boneta, M.; Müller, A. Heating and Cooling Energy Demand and Loads for Building Types in Different Countries of the EU. 2014. Available online: http://www.entranze.eu/files/downloads/D2_3/Heating_and_cooling_energy_demand_and_loads_for_building_types_in_different_countries_of_the_EU.pdf (accessed on 16 April 2019).
- Federal Office for Building and Regional Planing. Guideline for Sustainable Building; Federal Office for Building and Regional Planing: Berlin, Germany, 2001. [Google Scholar]
- De Boer, R.C.; van Vliet, H. On the similarity between requirements and architecture. J. Syst. Softw. 2009, 82, 544–550. [Google Scholar] [CrossRef]
- Brkljač, D.; Milinković, A.; Hiel, K.; Đerić, J. Role of building morphology in establishing of the urban context. In: 41th Anniversary Faculty of Civil Engineering Subotica. 2015, pp. 807–814. Available online: www.gf.uns.ac.rs/~zbornik/doc/NS2015.086.pdf (accessed on 16 April 2019).
- ANSI/ASHRAE Standard. Thermal Environment Conditions for Human Occupacy; ASHRAE: Atlanta, GA, USA, 2013. [Google Scholar]
- Autodesk. Software de Modelagem de Informações de Construção. Revit Recursos. Available online: https://www.autodesk.com.br/products/revit/features (accessed on 30 March 2019).
- Jalaei, F. Integrate Building Information Modeling (Bim) and Sustainable Design at the Conceptual Stage of Building Projects. Ph.D. Thesis, University of Ottawa, Ottawa, ON, Canada, 2015. [Google Scholar]
- Natephra, W.; Yabuki, N.; Fukuda, T. Optimizing the evaluation of building envelope design for thermal performance using a BIM-based overall thermal transfer value calculation. Build. Environ. 2018, 136, 128–145. [Google Scholar] [CrossRef]
- Gokarakonda, S.; Van Treeck, C.; Rawal, R. Influence of building design and control parameters on the potential of mixed-mode buildings in India. Build. Environ. 2019, 148, 157–172. [Google Scholar] [CrossRef]
- Benestad, R.; Parding, K.; Dobler, A.; Mezghani, A. A strategy to effectively make use of large volumes of climate data for climate change adaptation. Clim. Serv. 2017, 6, 48–54. [Google Scholar] [CrossRef]
- Chilkoti, V.; Bolisetti, T.; Balachandar, R. Climate change impact assessment on hydropower generation using multi-model climate ensemble. Renew. Energy 2017, 109, 510–517. [Google Scholar] [CrossRef]
- Žigart, M.; Kovačič Lukman, R.; Premrov, M.; Žegarac Leskovar, V. Environmental impact assessment of building envelope components for low-rise buildings. Energy 2018, 163, 501–512. [Google Scholar] [CrossRef]
- Callao, M.P. Trends in Analytical Chemistry Multivariate experimental design in environmental analysis. Trends Anal. Chem. 2014, 62, 86–92. [Google Scholar] [CrossRef]
- Autodesk. Weather Data Sources and Methodology. Autodesk Knowledge Network. 2014. Available online: https://knowledge.autodesk.com/search-result/caas/CloudHelp/cloudhelp/ENU/BPA-Help/files/GUID-DDF449B0-058E-465C-AFF4-7E45917B08EF-htm.html (accessed on 31 March 2019).
- Fegade, S.L.; Tande, B.M.; Cho, H.; Seames, W.S.; Sakodynskaya, I.; Muggli, D.S.; Kozliak, E.I. Aromatization of Propylene Over Hzsm-5: A Design of Experiments (Doe) Approach. Chem. Eng. Commun. 2013, 200, 1039–1056. [Google Scholar] [CrossRef]
- Wang, J.; Wan, W. Kinetic models for fermentative hydrogen production: A review. Int. J. Hydrogen Energy 2009, 34, 3313–3323. [Google Scholar] [CrossRef]
- National Institute of Standards and Technology (NIST SEMATECH). e-Handbook of Statistical Methods. 2006. Available online: https://www.itl.nist.gov/div898/handbook/ (accessed on 12 October 2018).
- Montgomery, D.C. Introduction to Statistical Quality Control, 6th ed.; John Wiley & Sons: Hoboken, NJ, USA, 2009. [Google Scholar]
- Taylor, J.R. Experimental Errors and Uncertainty. Measurement. 2002, 2000–2002. Available online: http://www.ece.rochester.edu/courses/ECE111/error_uncertainty.pdf (accessed on 16 April 2019).
- The Minitab Blog. Regression Analysis Tutorial and Examples. Minitab 18. 2013. Available online: http://blog.minitab.com/blog/adventures-in-statistics-2/regression-analysis-tutorial-and-examples (accessed on 25 September 2018).
- Abdulla, R.; Jrade, A. Integrating building information modeling and life cycle assessment tools to design. In Proceedings of the 29th International Conference of CIB W, Beirut, Lebanon, 17–19 October 2012. [Google Scholar]
- Autodesk. Getting Started with Autodesk Green Building Studio. Autodesk® EcotectTM Analysis. 2011, 17. Available online: http://images.autodesk.com/adsk/files/Getting_Started_with_Green_Building_Studio_4.3.pdf (accessed on 16 April 2019).
- Minitab® 18 Support. What Is a Main Effects Plot? 2017. Available online: https://support.minitab.com/en-us/minitab/18/help-and-how-to/modeling-statistics/anova/supporting-topics/basics/what-is-a-main-effects-plot/ (accessed on 22 November 2018).
- Van der Merwe, M. The Importance of External Walls in Energy Efficiency of Buildings; University of the Free State: Bloemfontein, South Africa, 2012. [Google Scholar]
- Badiee, A. The Impact of Roofing Material on Building Energy Performance. The University of Alabama at Birmingham; 2015. Available online: http://adsabs.harvard.edu/abs/2015PhDT........28B (accessed on 16 April 2019).
- Alibaba, H. Determination of optimum window to external wall ratio for offices in a hot and humid climate. Sustainability 2016, 8, 187. [Google Scholar] [CrossRef]
- Peel, M.C.; Finlayson, B.L.; McMahon, T.A. Updated world map of the Köppen-Geiger climate classification. Hydrol. Earth Syst. Sci. 2007, 11, 1633–1644. [Google Scholar] [CrossRef]
- Friedman, J.P.; Harris, J.C.; Diskin, B.A. Real Estate Handbook; Barrons Educational Series: Hauppauge, NY, USA, 2005; 764p. [Google Scholar]
- Griffin, C.W.; Fricklas, R. Manual of Low-Slope Roof Systems: Fourth Edition; McGraw-Hill: New York, NY, USA, 2006; 598p. [Google Scholar]
- European Commission. Innovative Chemistry Builds Energy Efficiency into Smart Cities; ACS: Washington, DC, USA, 2015. [Google Scholar]
- Collins, L.M.; Dziak, J.J.; Li, R. Design of Experiments with Multiple Independent Variables: A Resource Management Perspective on Complete and Reduced Factorial Designs. Psychol. Methods 2009, 14, 202–224. [Google Scholar] [CrossRef]
- Autodesk Revit. About Green Building Studio and Energy Analysis. Autodesk Knowledge Network. 2017. Available online: https://knowledge.autodesk.com/support/revit-products/learn-explore/caas/CloudHelp/cloudhelp/2016/ENU/Revit-Analyze/files/GUID-7948A714-1B97-4176-A942-D99A8ECA4786-htm.html (accessed on 22 October 2018).
- Suman, B.M.; Srivastava, R.K. Influence of thermal insulation on conductive heat transfer through roof ceiling construction. J. Sci. Ind. Res. 2009, 68, 248–251. [Google Scholar]
- Nizam, R.S.; Zhang, C.; Tian, L. A BIM based tool for assessing embodied energy for buildings. Energy Build. 2018, 170, 1–14. [Google Scholar] [CrossRef]


| City | Climate Group | Sub-Type Classification |
|---|---|---|
| Dubai | Dry Climates | Hot desert climate (BWh) |
| Kuala Lumpur | Tropical Climates | Tropical rainforest climate (Af) |
| Moscow | Continental Climates | Warm-summer humid continental climate (Dfb) |
| Mount Wellington | Polar Climates | Tundra climate (ET) |
| Porto | Mild Temperate Climates | Warm-summer Mediterranean climate (Csb) |
| Rio de Janeiro | Tropical Climates | Tropical savanna climate (Aw or As) |
| Wall (CW) | Roof (CR) | Window-to-Wall Ratio (CWR) |
|---|---|---|
| Insulated Concrete Form (ICF) wall, 10-inch-thick form. Insulated Concrete Form (ICF) wall, 14 inch thick form. | Continuous Deck Roof with Code Compliant Insulation. Continuous Deck Roof with Super High Insulation. | 15% 30% 40% 50% 65% |
| Seq. | Factorial Design | Wall | Roof | Window-to-Wall Ratio | ||
|---|---|---|---|---|---|---|
| CW | CR | CWR | ||||
| 1 | 1 | 1 | 1 | ICF wall, 10 thick form | CDR with Code Compliant Insulation | 15% |
| 2 | 1 | 1 | 2 | ICF wall, 10 thick form | CDR with Code Compliant Insulation | 30% |
| 3 | 1 | 1 | 3 | ICF wall, 10 thick form | CDR with Code Compliant Insulation | 40% |
| 4 | 1 | 1 | 4 | ICF wall, 10 thick form | CDR with Code Compliant Insulation | 50% |
| 5 | 1 | 1 | 5 | ICF wall, 10 thick form | CDR with Code Compliant Insulation | 65% |
| 6 | 1 | 2 | 1 | ICF wall, 10 thick form | CDR with Super High Insulation | 15% |
| 7 | 1 | 2 | 2 | ICF wall, 10 thick form | CDR with Super High Insulation | 30% |
| 8 | 1 | 2 | 3 | ICF wall, 10 thick form | CDR with Super High Insulation | 40% |
| 9 | 1 | 2 | 4 | ICF wall, 10 thick form | CDR with Super High Insulation | 50% |
| 10 | 1 | 2 | 5 | ICF wall, 10 thick form | CDR with Super High Insulation | 65% |
| 11 | 2 | 1 | 1 | ICF wall, 14 thick form | CDR with Code Compliant Insulation | 15% |
| 12 | 2 | 1 | 2 | ICF wall, 14 thick form | CDR with Code Compliant Insulation | 30% |
| 13 | 2 | 1 | 3 | ICF wall, 14 thick form | CDR with Code Compliant Insulation | 40% |
| 14 | 2 | 1 | 4 | ICF wall, 14 thick form | CDR with Code Compliant Insulation | 50% |
| 15 | 2 | 1 | 5 | ICF wall, 14 thick form | CDR with Code Compliant Insulation | 65% |
| 16 | 2 | 2 | 1 | ICF wall, 14 thick form | CDR with Super High Insulation | 15% |
| 17 | 2 | 2 | 2 | ICF wall, 14 thick form | CDR with Super High Insulation | 30% |
| 18 | 2 | 2 | 3 | ICF wall, 14 thick form | CDR with Super High Insulation | 40% |
| 19 | 2 | 2 | 4 | ICF wall, 14 thick form | CDR with Super High Insulation | 50% |
| 20 | 2 | 2 | 5 | ICF wall, 14 thick form | CDR with Super High Insulation | 65% |
| Seq. | Gradual Increase of the CWR | Dubai | Kuala Lumpur | Moscow | Mount Wellington | Porto | Rio de Janeiro |
|---|---|---|---|---|---|---|---|
| 1 to 5 | From 15% to 30% | 20.28% | 14.40% | 33.80% | 34.78% | 19.77% | 20.75% |
| From 30% to 40% | 14.58% | 9.54% | 18.24% | 20.97% | 15.57% | 12.60% | |
| From 40% to 50% | 12.39% | 8.28% | 15.56% | 17.54% | 16.54% | 10.99% | |
| From 50% to 65% | 15.34% | 12.33% | 19.95% | 22.07% | 21.74% | 16.24% | |
| 6 to 10 | From 15% to 30% | 24.15% | 14.76% | 43.36% | 44.96% | 21.27% | 21.75% |
| From 30% to 40% | 17.36% | 11.53% | 21.76% | 24.52% | 21.81% | 14.68% | |
| From 40% to 50% | 14.25% | 11.12% | 18.09% | 19.65% | 19.21% | 14.58% | |
| From 50% to 65% | 17.66% | 14.30% | 22.44% | 24.14% | 24.15% | 19.26% | |
| 11 to 15 | From 15% to 30% | 20.40% | 14.52% | 34.21% | 34.97% | 20.04% | 20.58% |
| From 30% to 40% | 14.69% | 9.55% | 18.37% | 21.03% | 15.71% | 12.58% | |
| From 40% to 50% | 12.37% | 8.26% | 15.63% | 17.70% | 16.69% | 11.03% | |
| From 50% to 65% | 15.28% | 12.32% | 19.99% | 22.18% | 21.84% | 16.25% | |
| 16 to 20 | From 15% to 30% | 24.53% | 15.20% | 43.97% | 45.47% | 21.62% | 24.76% |
| From 30% to 40% | 17.31% | 11.32% | 21.96% | 24.57% | 22.10% | 14.64% | |
| From 40% to 50% | 14.22% | 11.27% | 18.17% | 19.77% | 19.32% | 14.65% | |
| From 50% to 65% | 17.65% | 14.19% | 22.55% | 24.28% | 24.28% | 19.31% |
| CWR | EUI (MJ/m2/year) | Dubai | Kuala Lumpur | Moscow | Mount Wellington | Porto | Rio de Janeiro |
|---|---|---|---|---|---|---|---|
| 15% | Lowest | 471.2 | 489.3 | 955.4 | 616.2 | 476.9 | 439 |
| Highest | 497.1 | 502.7 | 1091.7 | 679.6 | 517 | 462.2 | |
| Proportional Impact | 5.50% | 2.74% | 14.27% | 10.29% | 8.41% | 5.28% | |
| 30% | Lowest | 586.5 | 562.1 | 1375.5 | 896.4 | 580 | 547.7 |
| Highest | 597.9 | 575.7 | 1460.7 | 916 | 619.2 | 558.1 | |
| Proportional Impact | 1.94% | 2.42% | 6.19% | 2.19% | 6.76% | 1.90% | |
| 40% | Lowest | 685.1 | 626.9 | 1677.6 | 1103.9 | 708.2 | 627.3 |
| Highest | 688.4 | 630.7 | 1727.2 | 1120.9 | 715.6 | 629 | |
| Proportional Impact | 0.48% | 0.61% | 2.97% | 1.54% | 1.04% | 0.27% | |
| 50% | Lowest | 770 | 681.4 | 1982.4 | 1299.3 | 832.1 | 696.5 |
| Highest | 786.4 | 698.2 | 1995.9 | 1341.2 | 847 | 720.7 | |
| Proportional Impact | 2.12% | 2.47% | 0.68% | 3.23% | 1.79% | 3.47% | |
| 65% | Lowest | 888.1 | 765.4 | 2393.4 | 1587.5 | 1013.8 | 809.7 |
| Highest | 925.3 | 797.3 | 2430.7 | 1665 | 1051.6 | 859.5 | |
| Proportional Impact | 4.19% | 4.17% | 1.56% | 4.88% | 3.73% | 6.15% | |
© 2019 by the authors. Licensee MDPI, Basel, Switzerland. This article is an open access article distributed under the terms and conditions of the Creative Commons Attribution (CC BY) license (http://creativecommons.org/licenses/by/4.0/).
Share and Cite
Najjar, M.K.; Tam, V.W.Y.; Di Gregorio, L.T.; Evangelista, A.C.J.; Hammad, A.W.A.; Haddad, A. Integrating Parametric Analysis with Building Information Modeling to Improve Energy Performance of Construction Projects. Energies 2019, 12, 1515. https://doi.org/10.3390/en12081515
Najjar MK, Tam VWY, Di Gregorio LT, Evangelista ACJ, Hammad AWA, Haddad A. Integrating Parametric Analysis with Building Information Modeling to Improve Energy Performance of Construction Projects. Energies. 2019; 12(8):1515. https://doi.org/10.3390/en12081515
Chicago/Turabian StyleNajjar, Mohammad K., Vivian W. Y. Tam, Leandro Torres Di Gregorio, Ana Catarina Jorge Evangelista, Ahmed W. A. Hammad, and Assed Haddad. 2019. "Integrating Parametric Analysis with Building Information Modeling to Improve Energy Performance of Construction Projects" Energies 12, no. 8: 1515. https://doi.org/10.3390/en12081515
APA StyleNajjar, M. K., Tam, V. W. Y., Di Gregorio, L. T., Evangelista, A. C. J., Hammad, A. W. A., & Haddad, A. (2019). Integrating Parametric Analysis with Building Information Modeling to Improve Energy Performance of Construction Projects. Energies, 12(8), 1515. https://doi.org/10.3390/en12081515