Preliminary Techno–Environment–Economic Evaluation of an Innovative Hybrid Renewable Energy Harvester System for Residential Application

 ,
,  ,
, 

 and
and
Abstract

1. Introduction
2. Existing Renewable Energy Utilization Systems
3. Economic and Environment Evaluation of Solar and Wind Power Generation
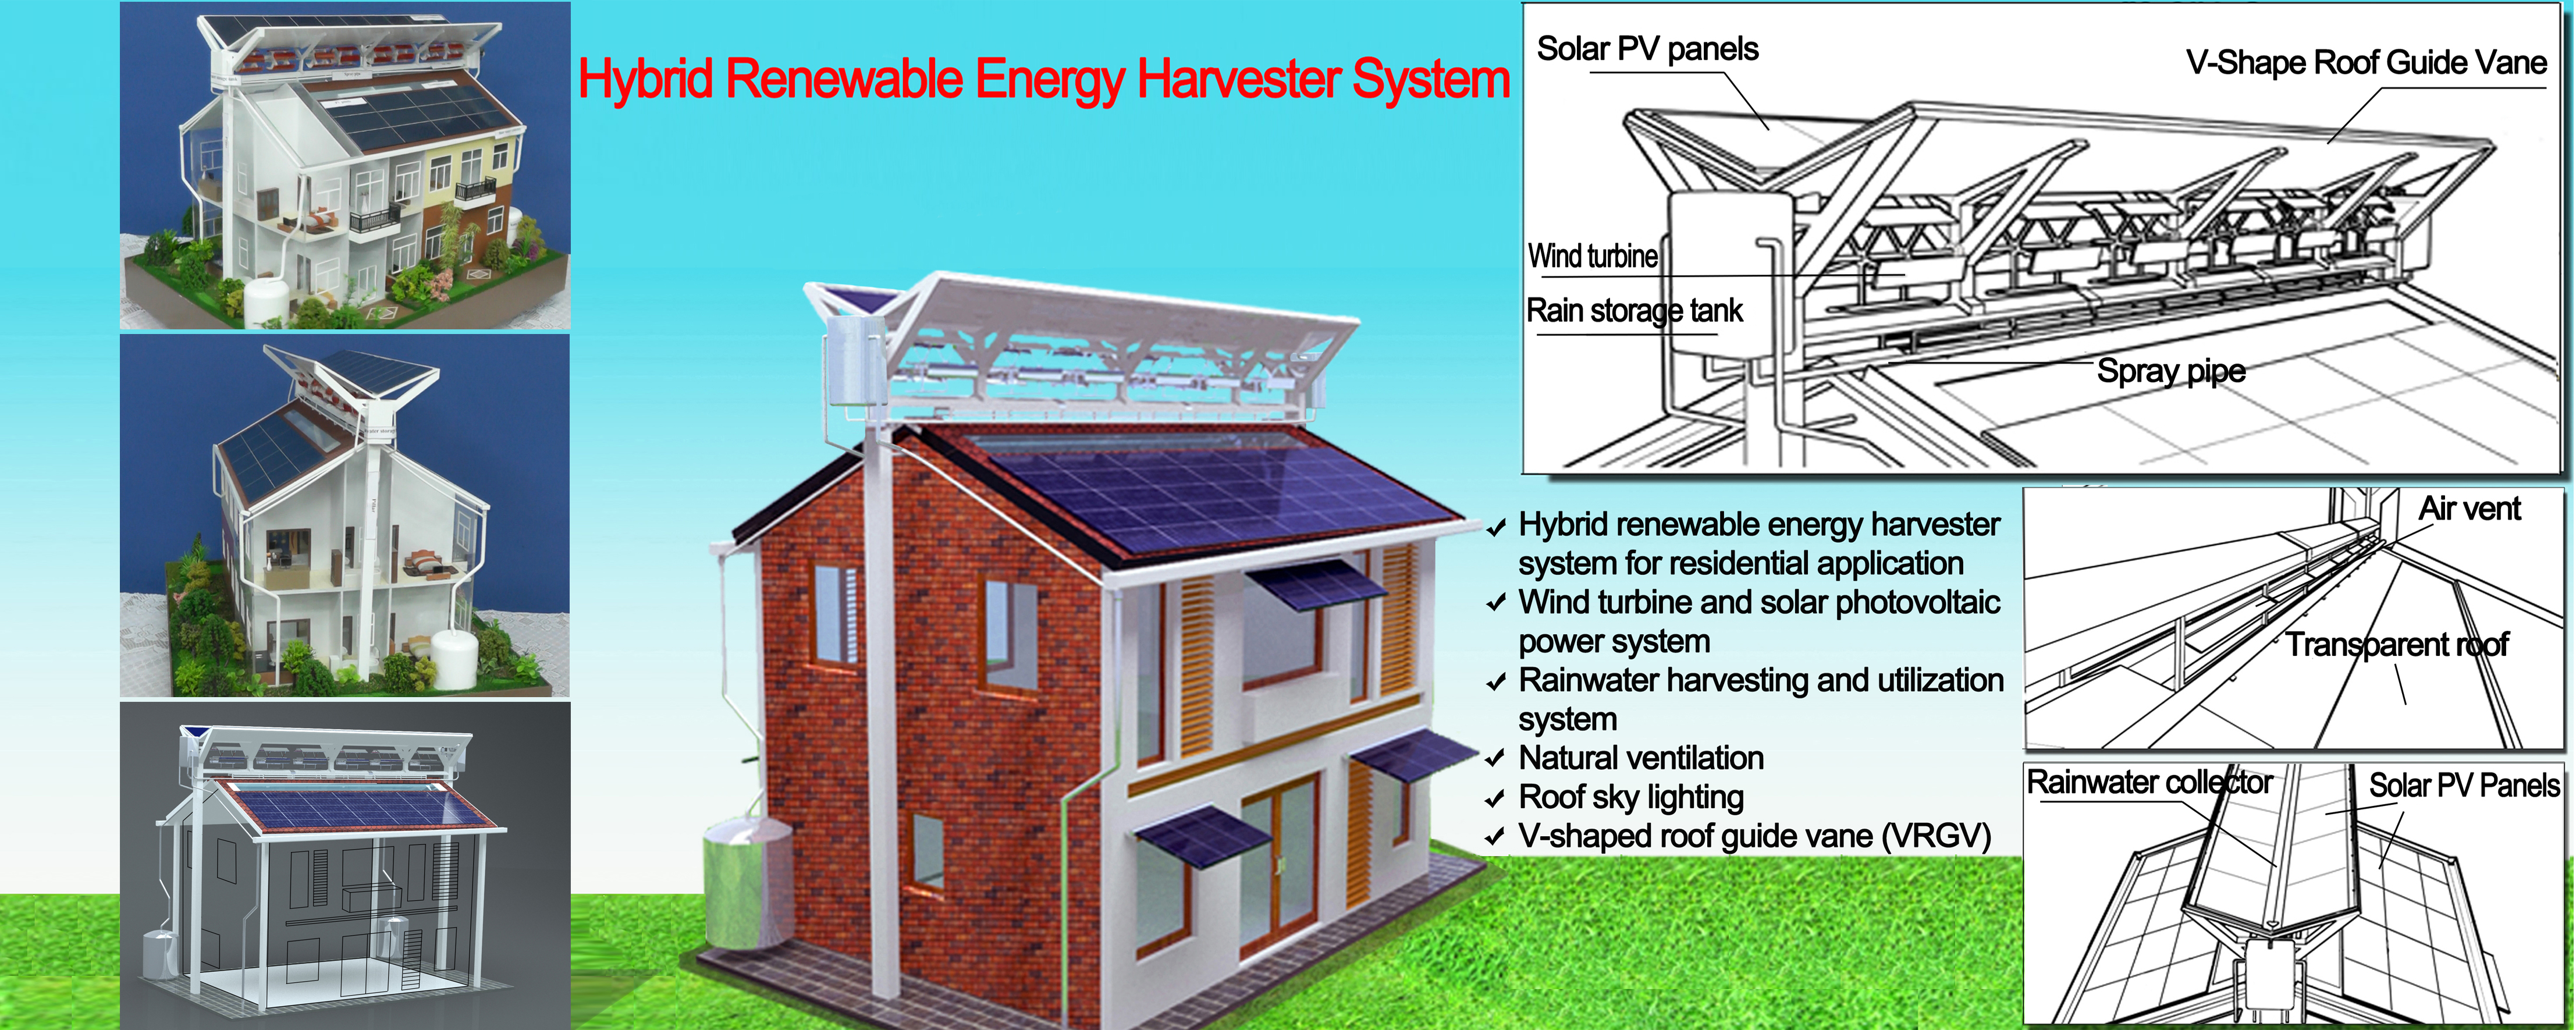
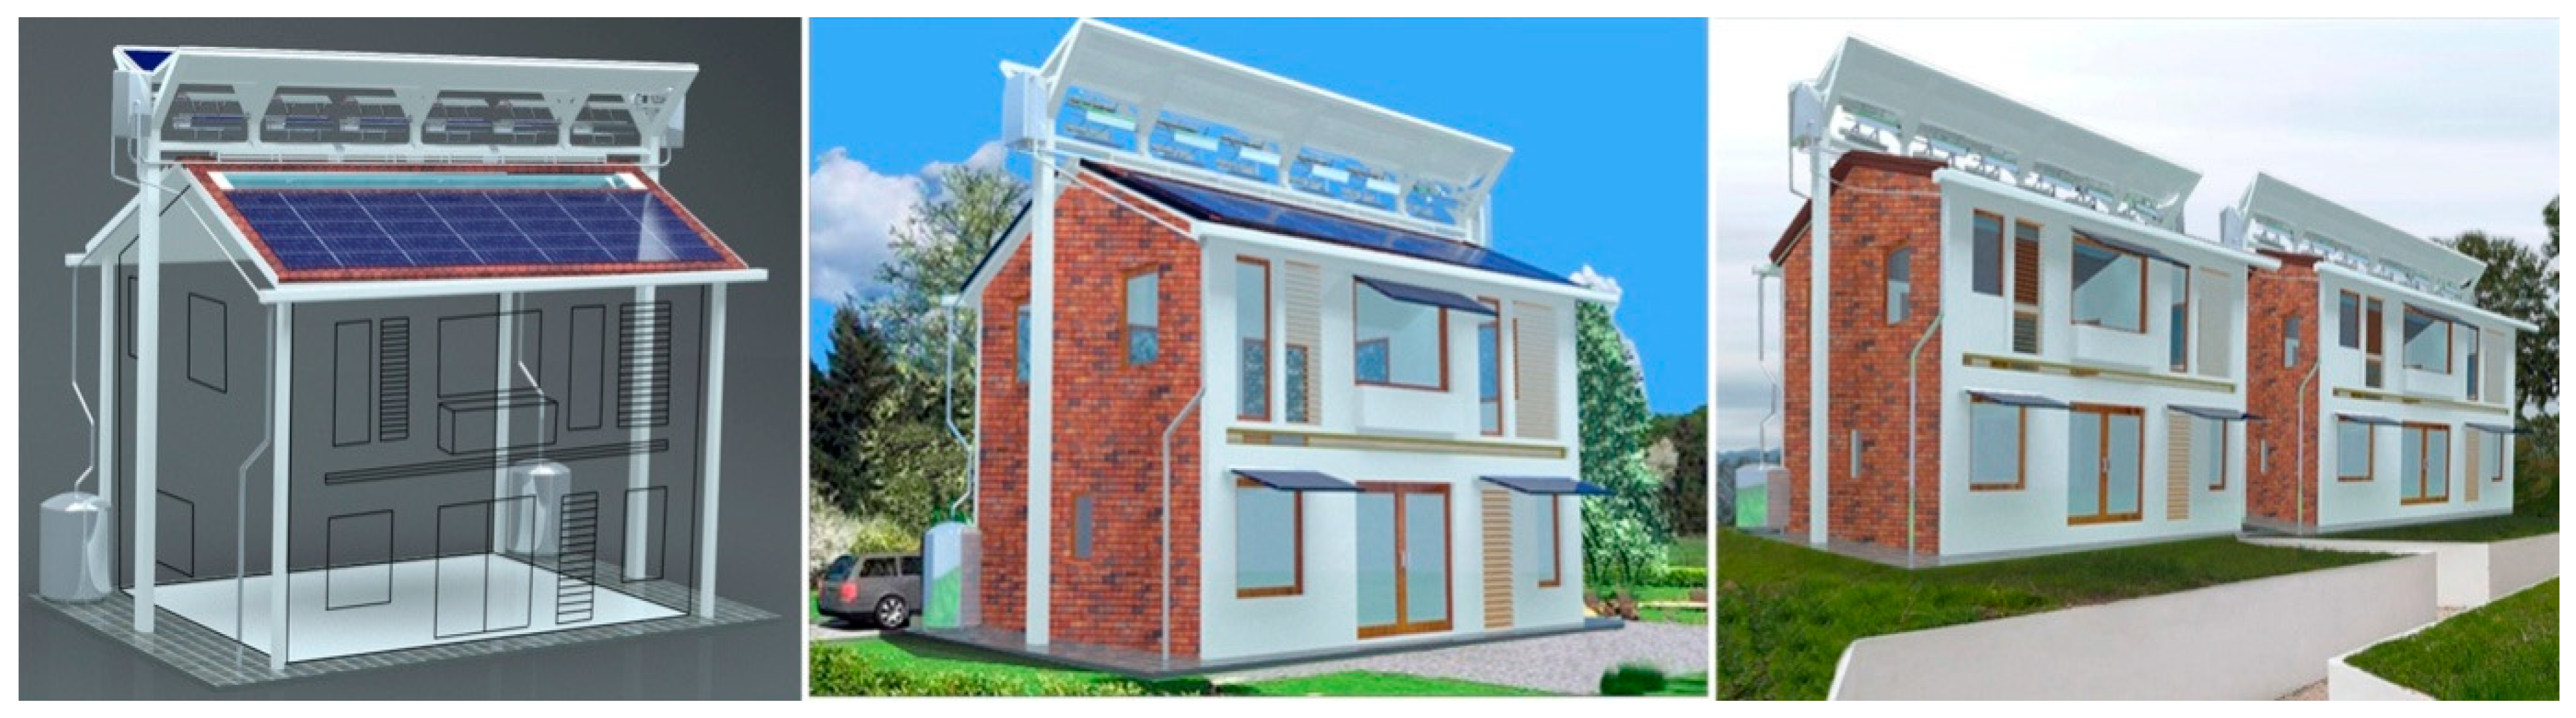
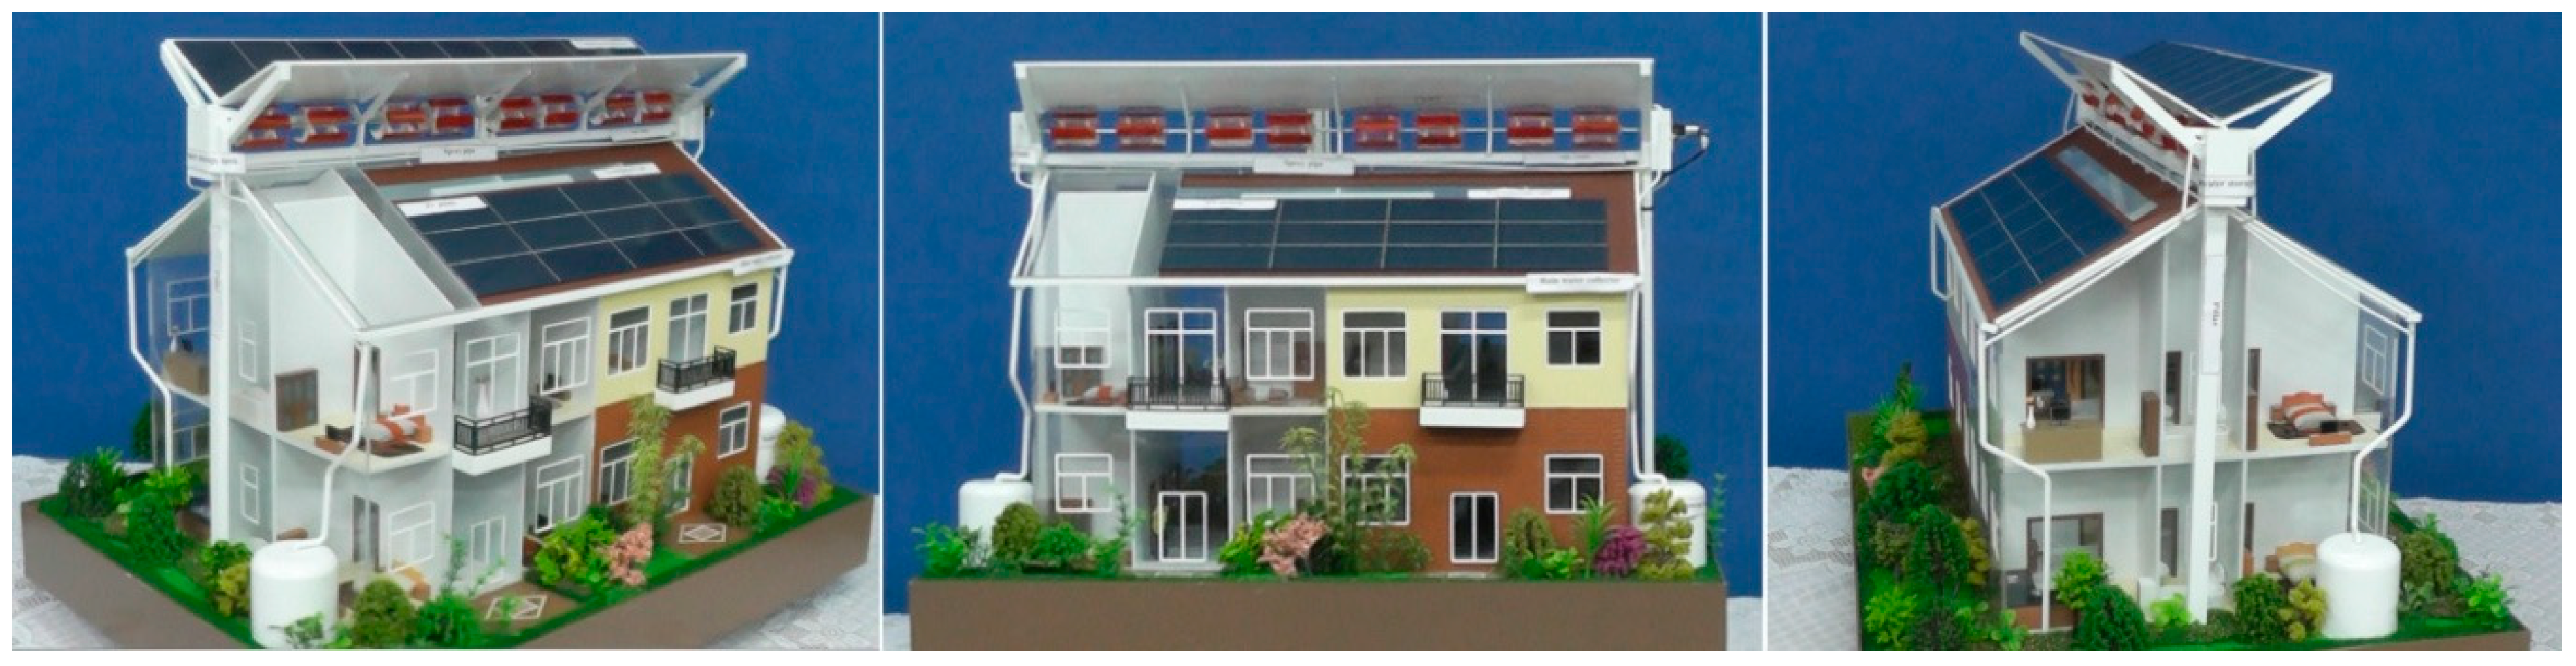
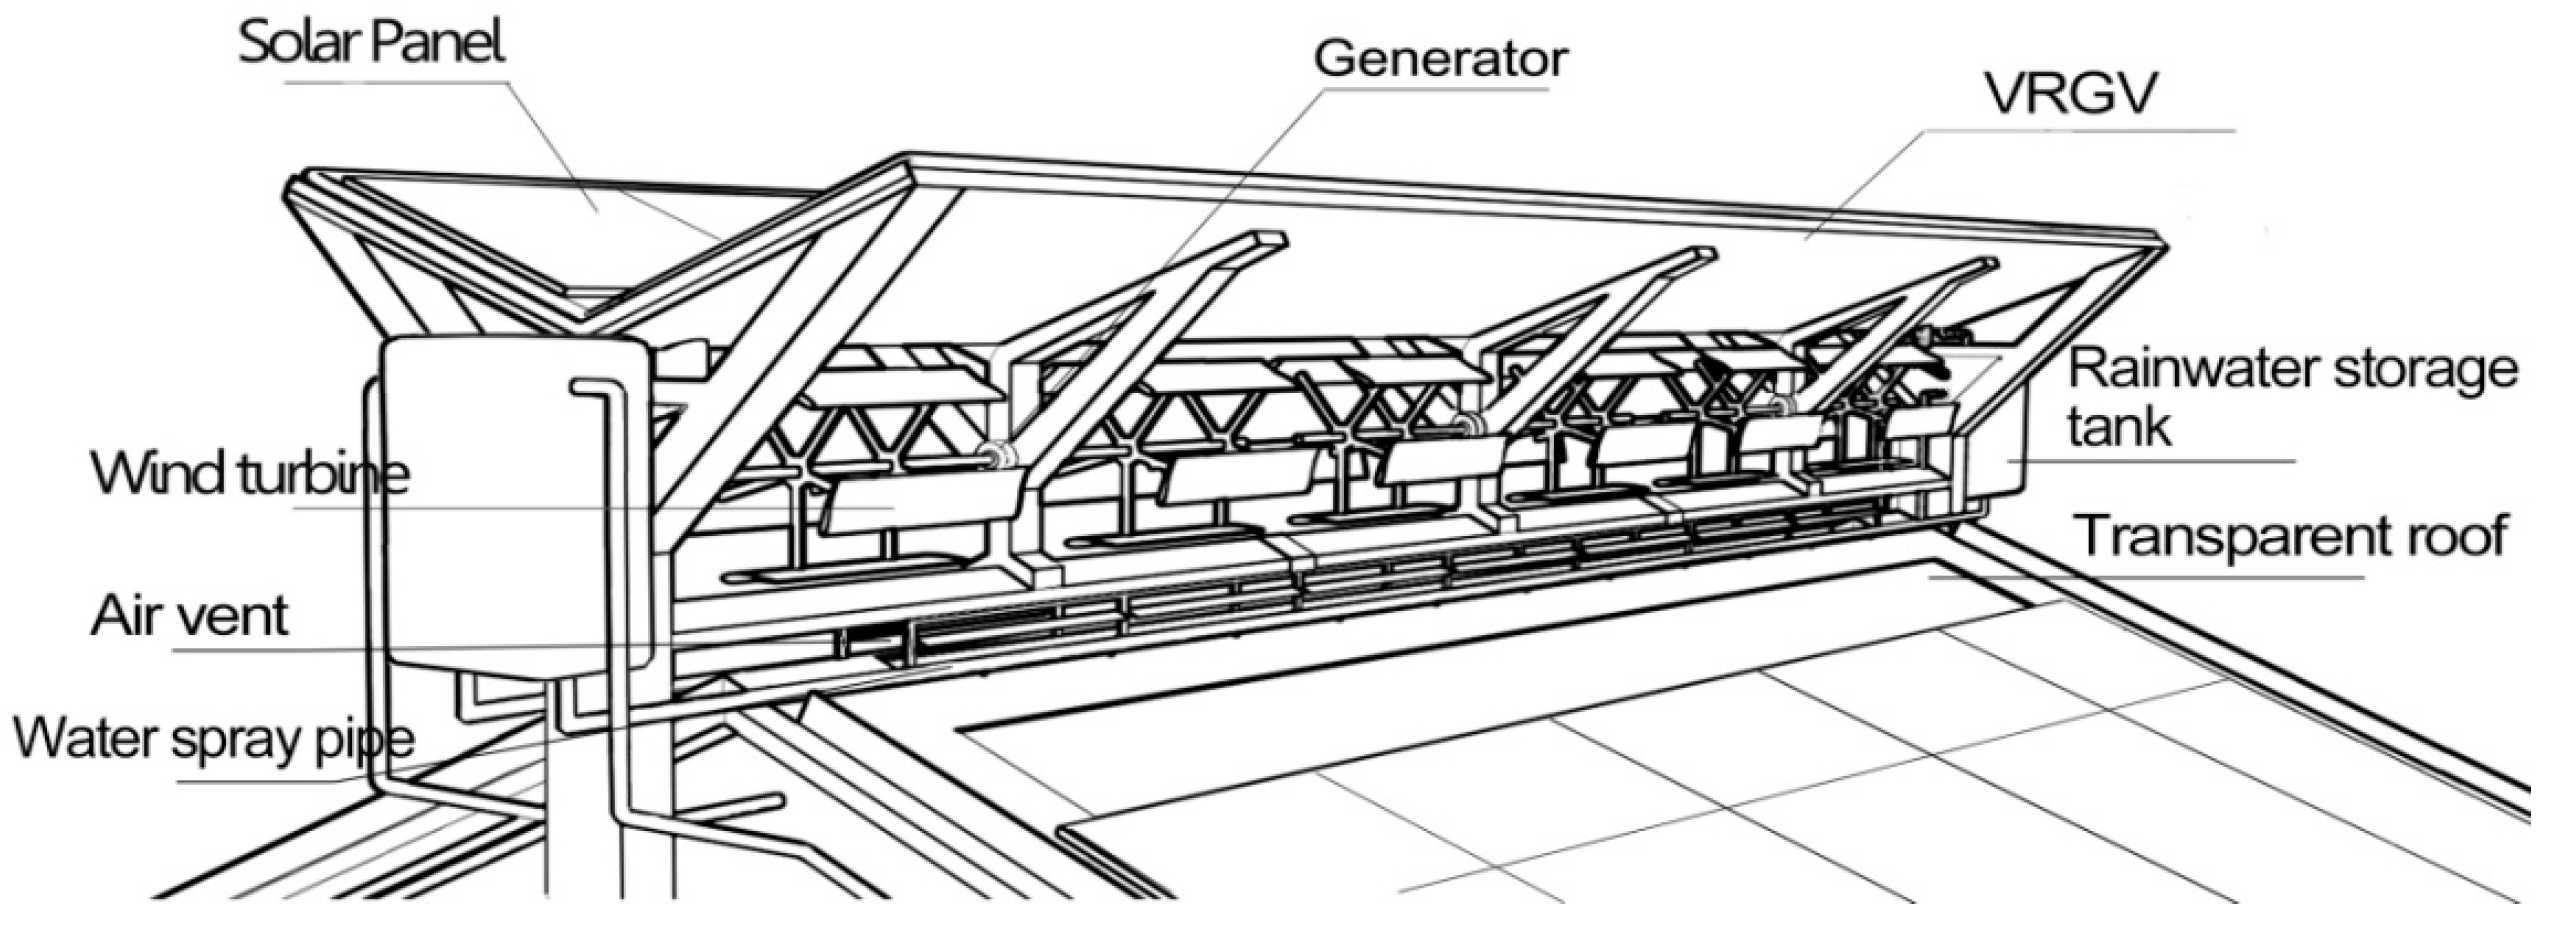
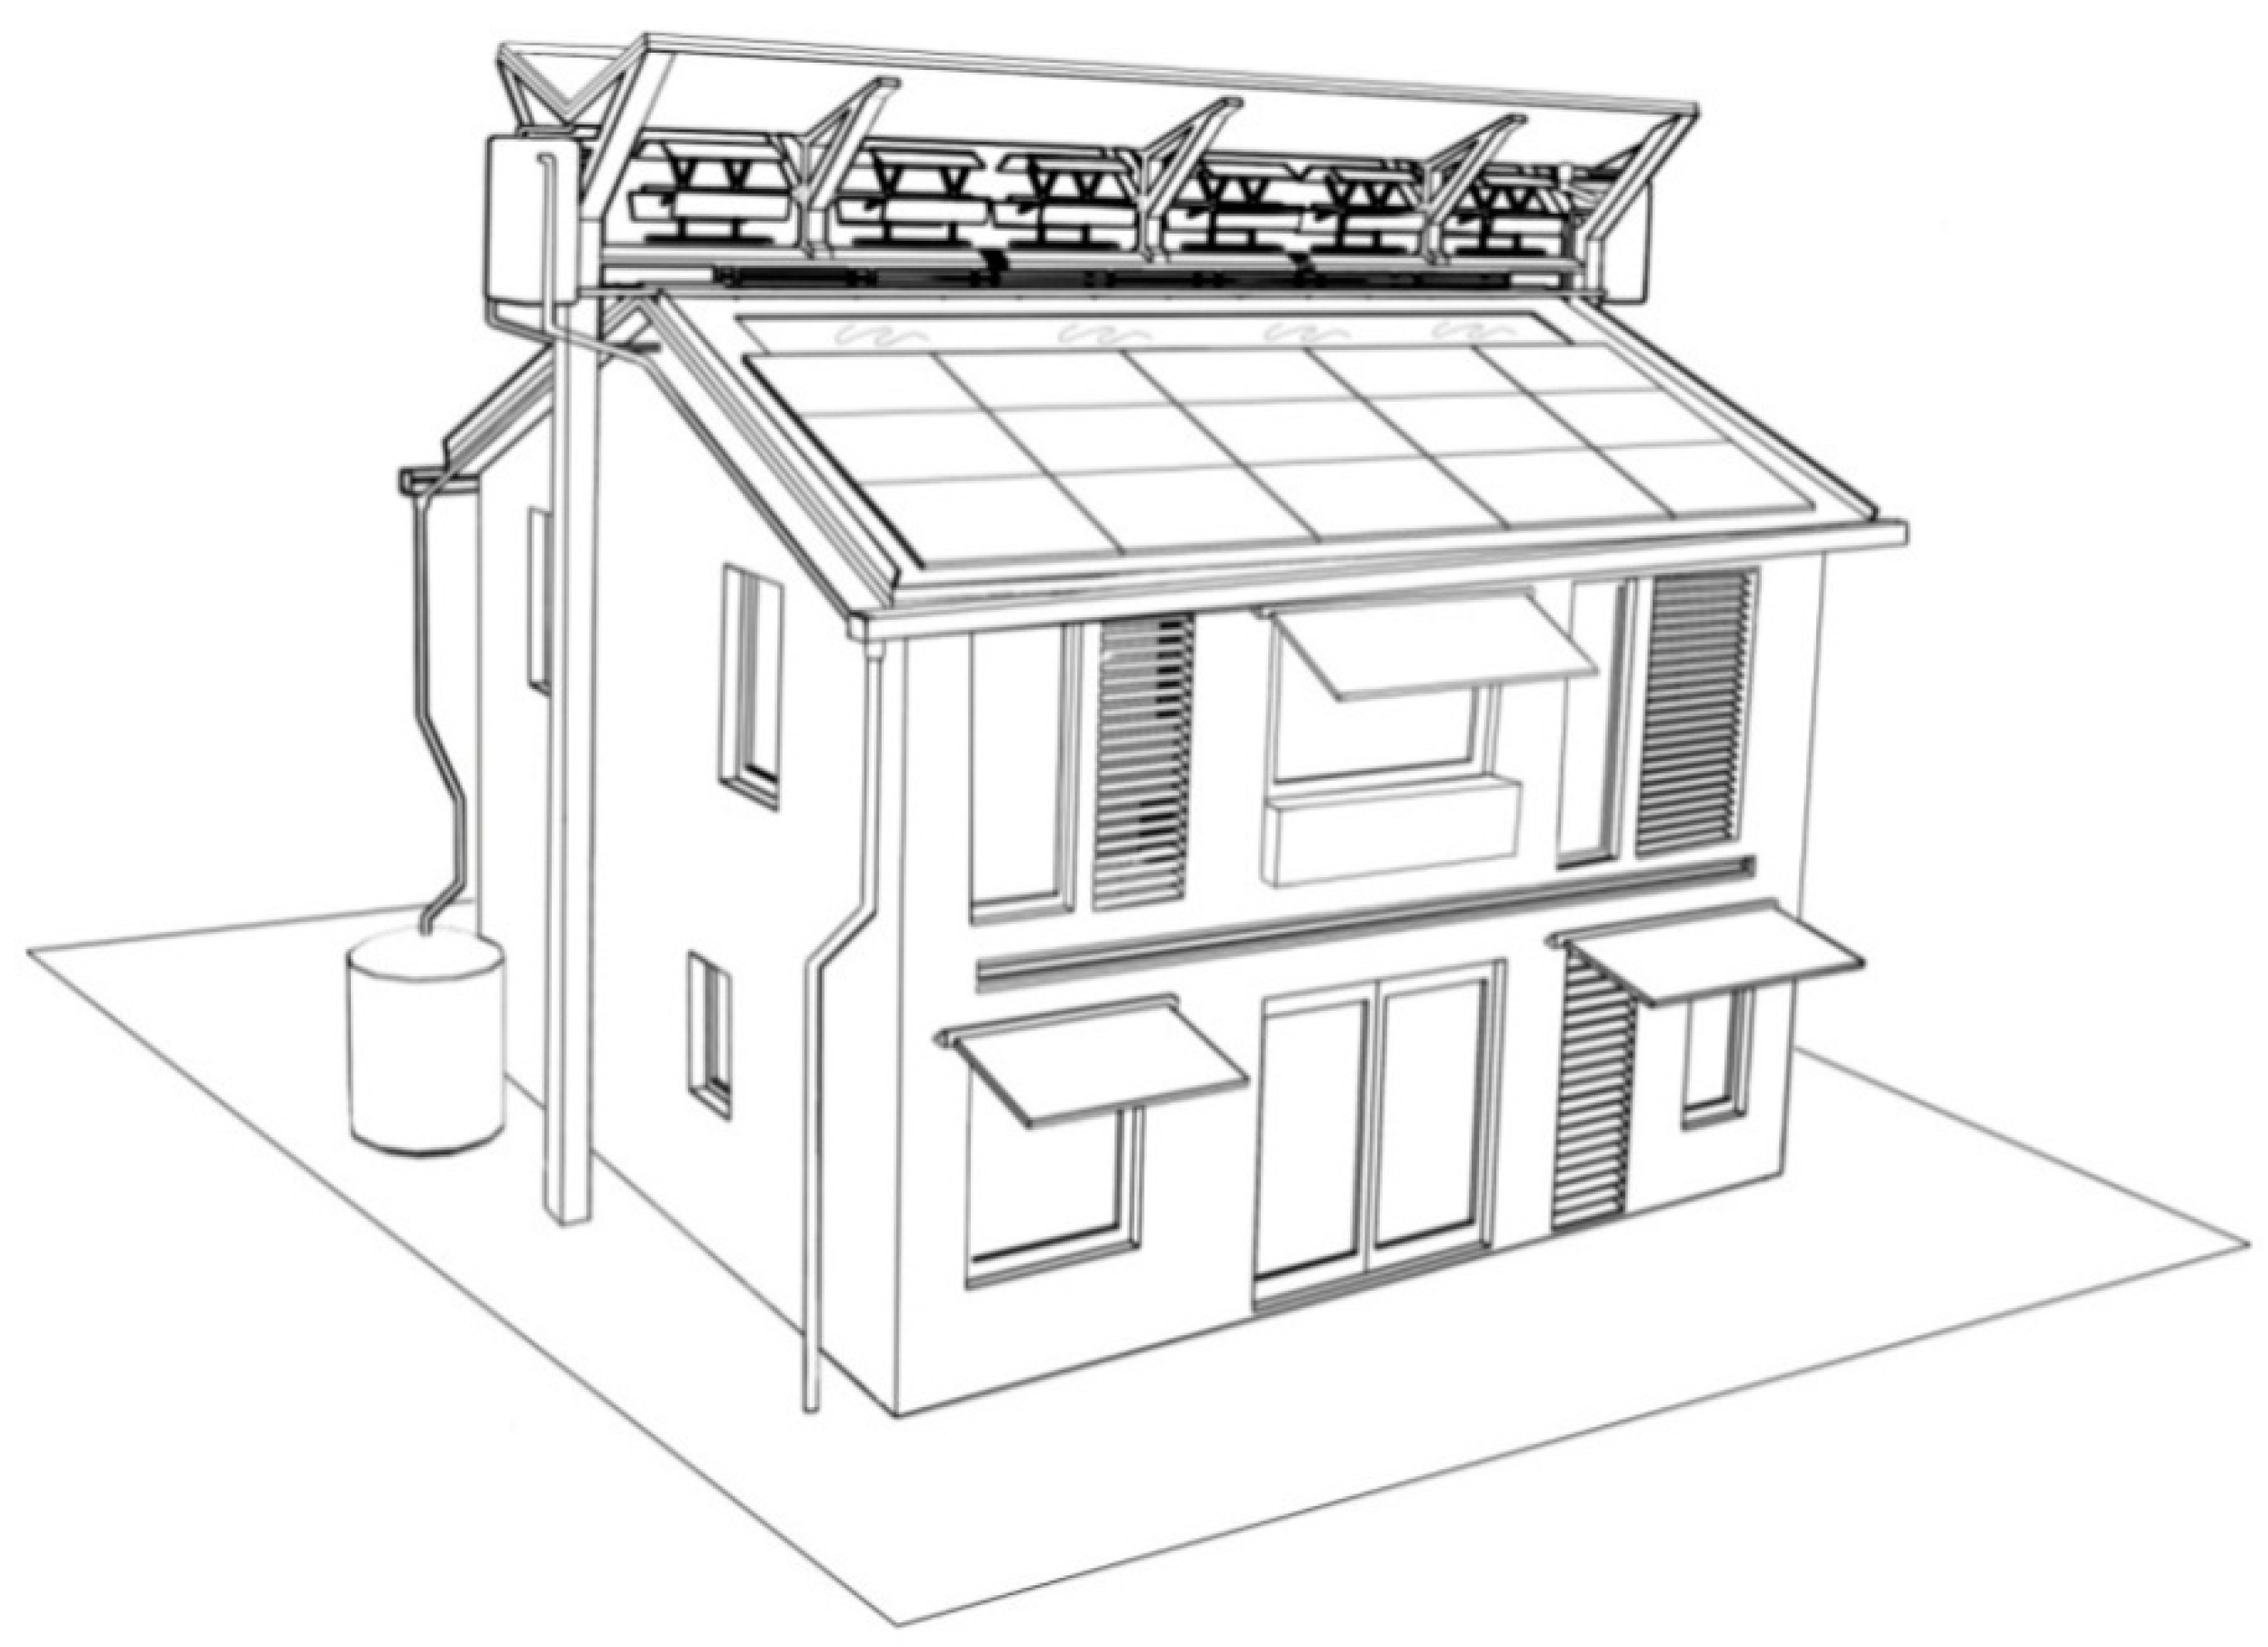
4. Design Description of the System
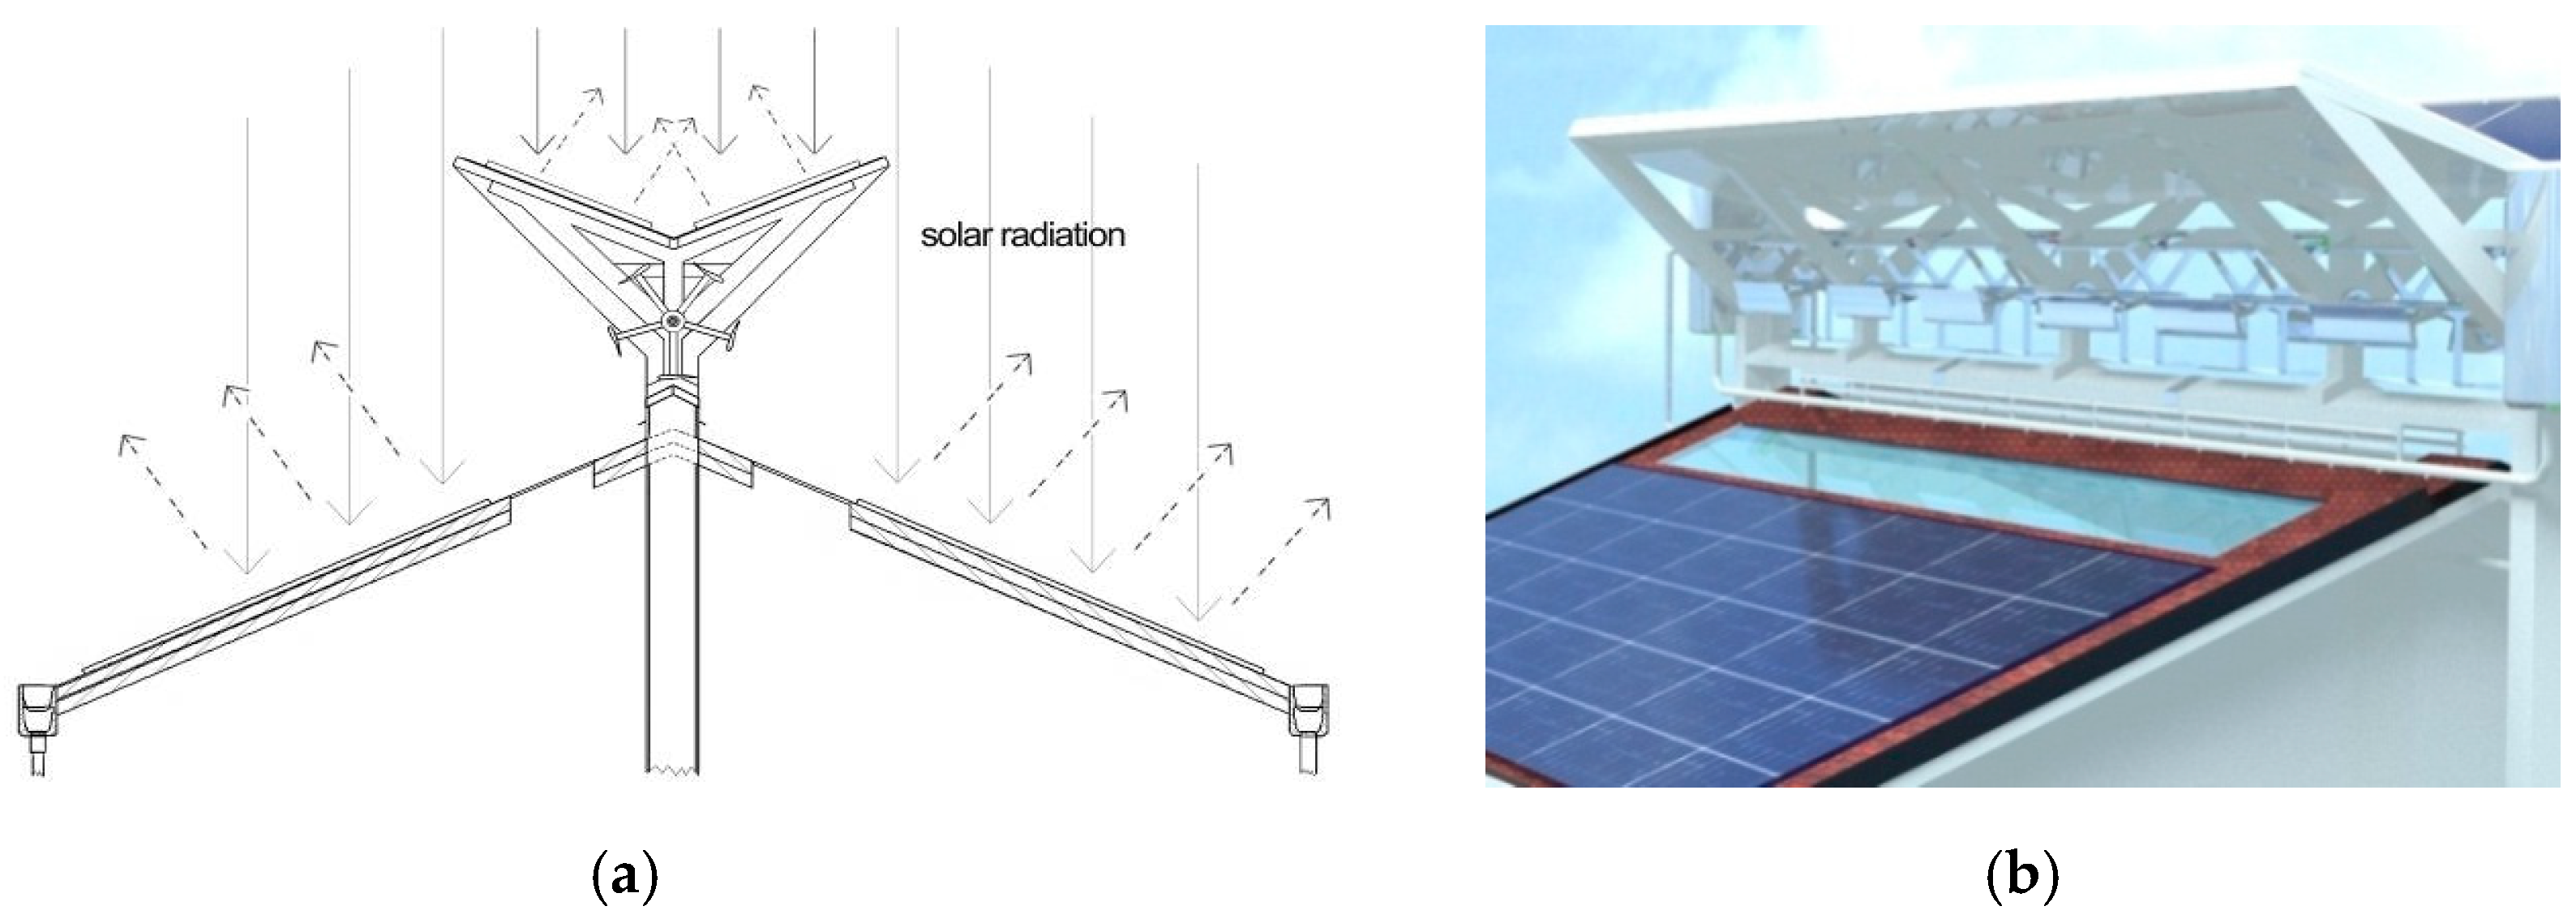
4.1. Energy Generation System
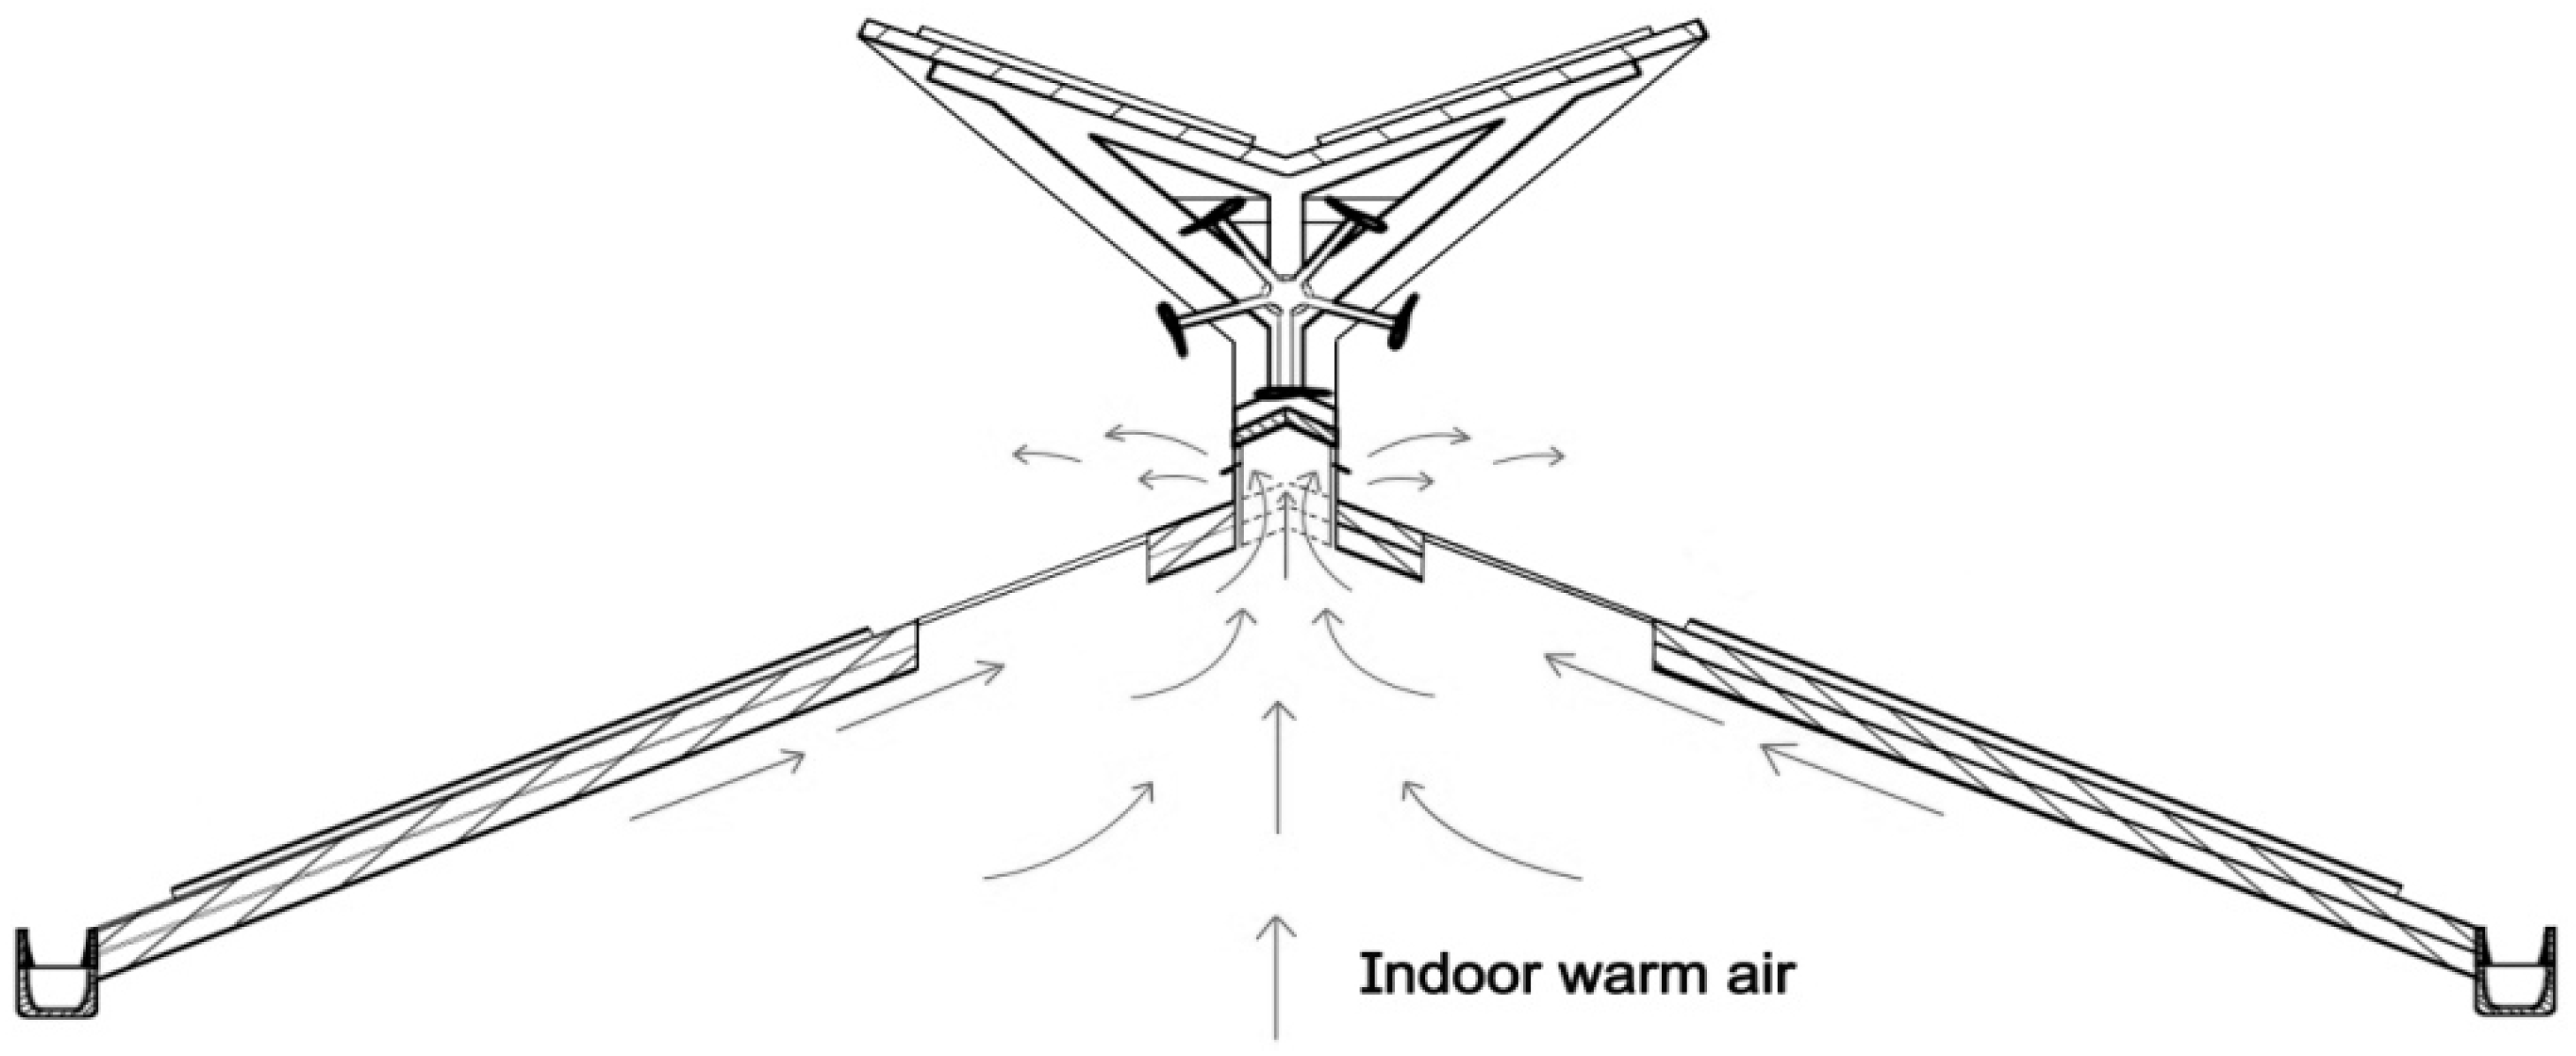
4.2. Energy Recovery System
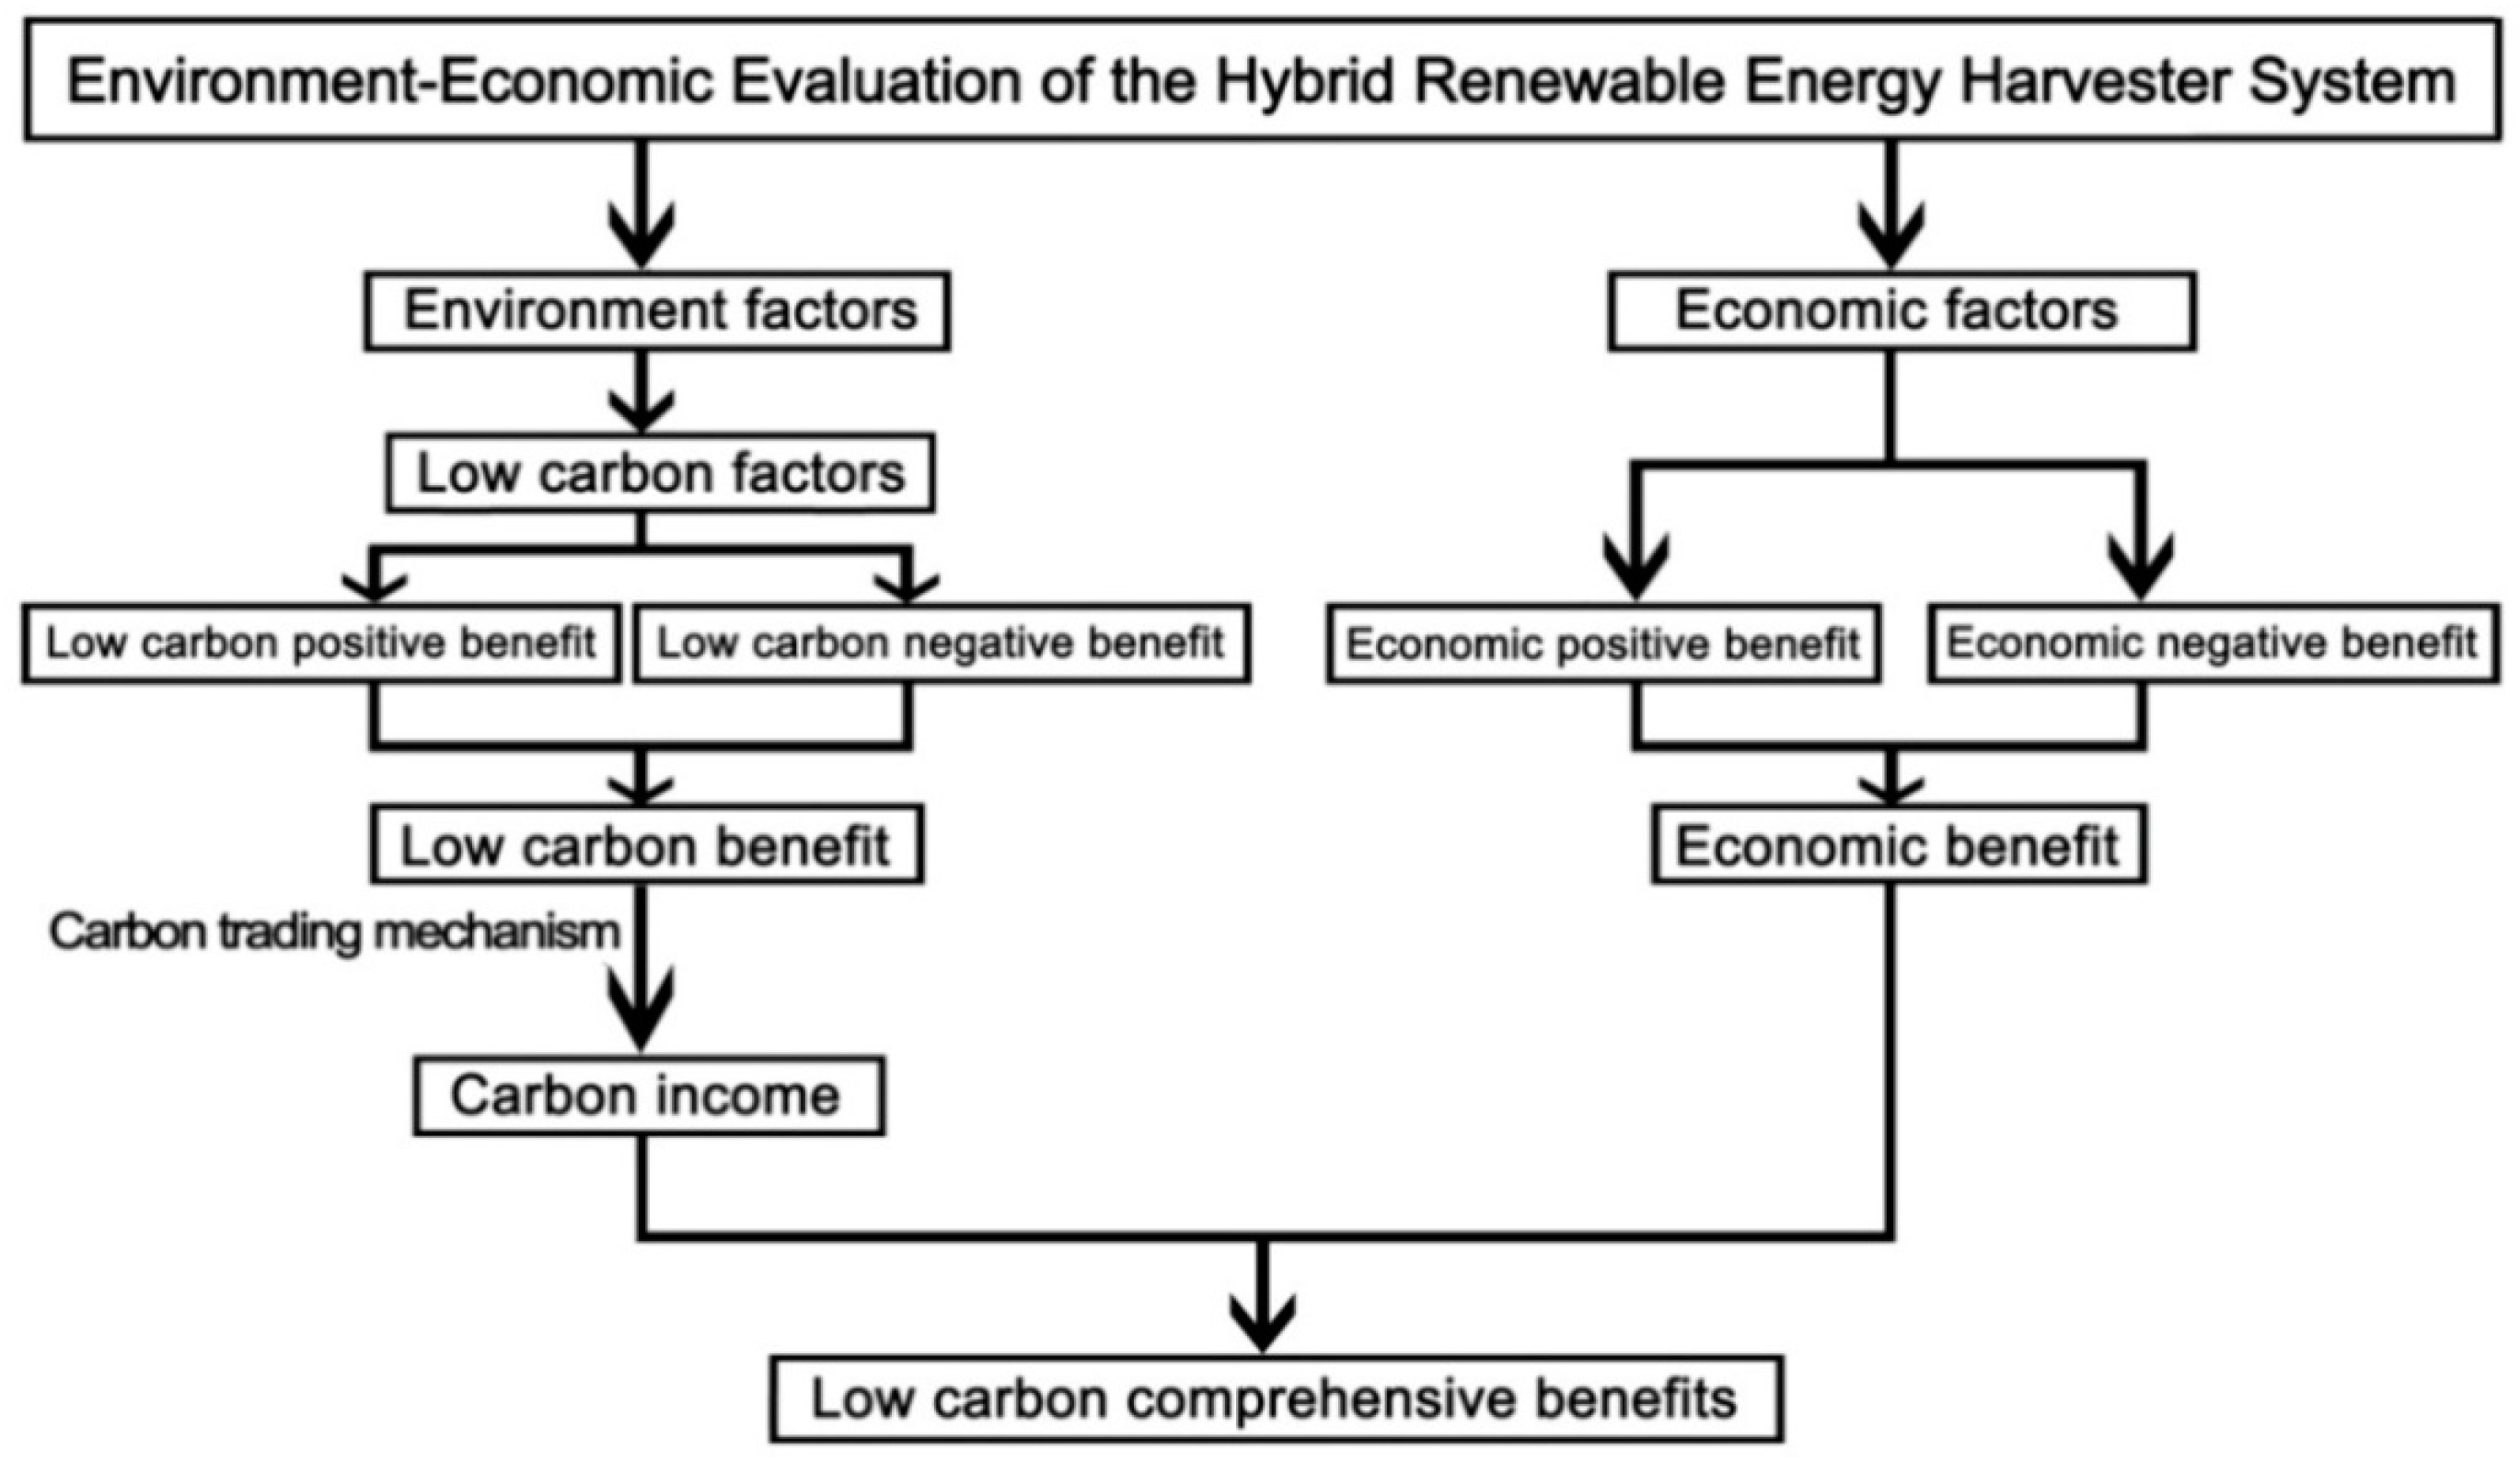
5. Methodology: Environment and Economic Evaluation
5.1. Output of the System
5.1.1. Output of the Solar Energy System
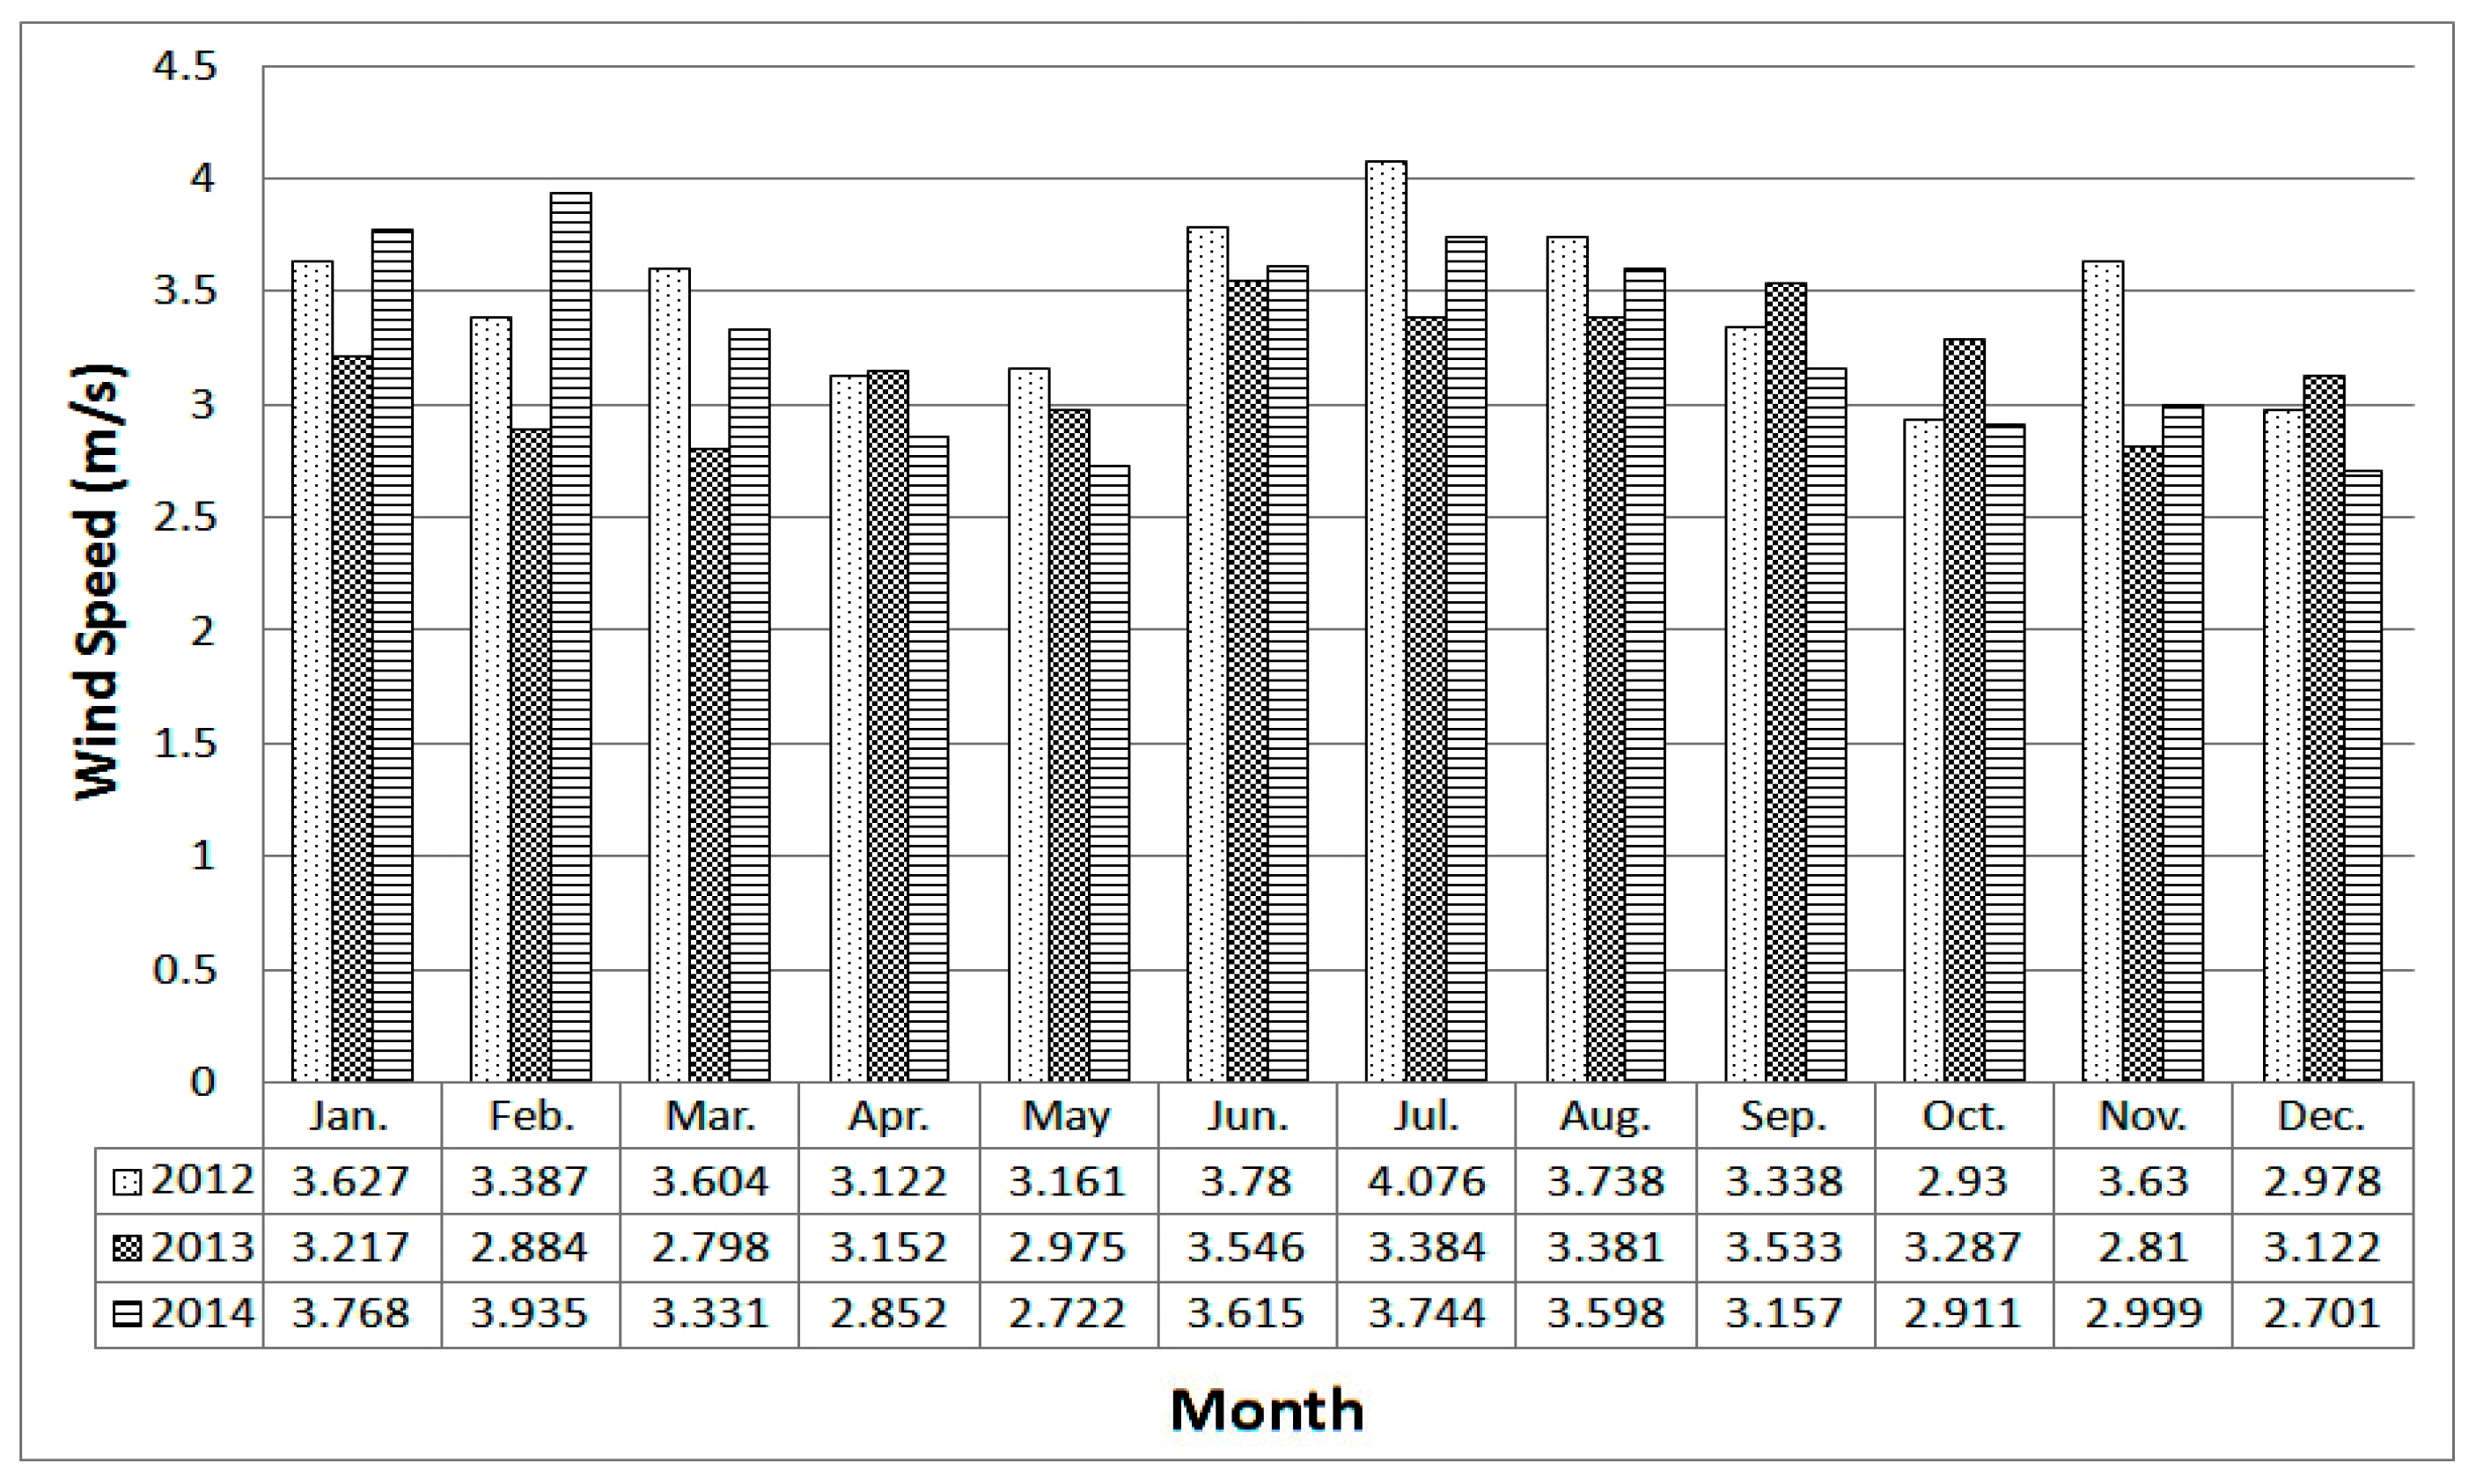
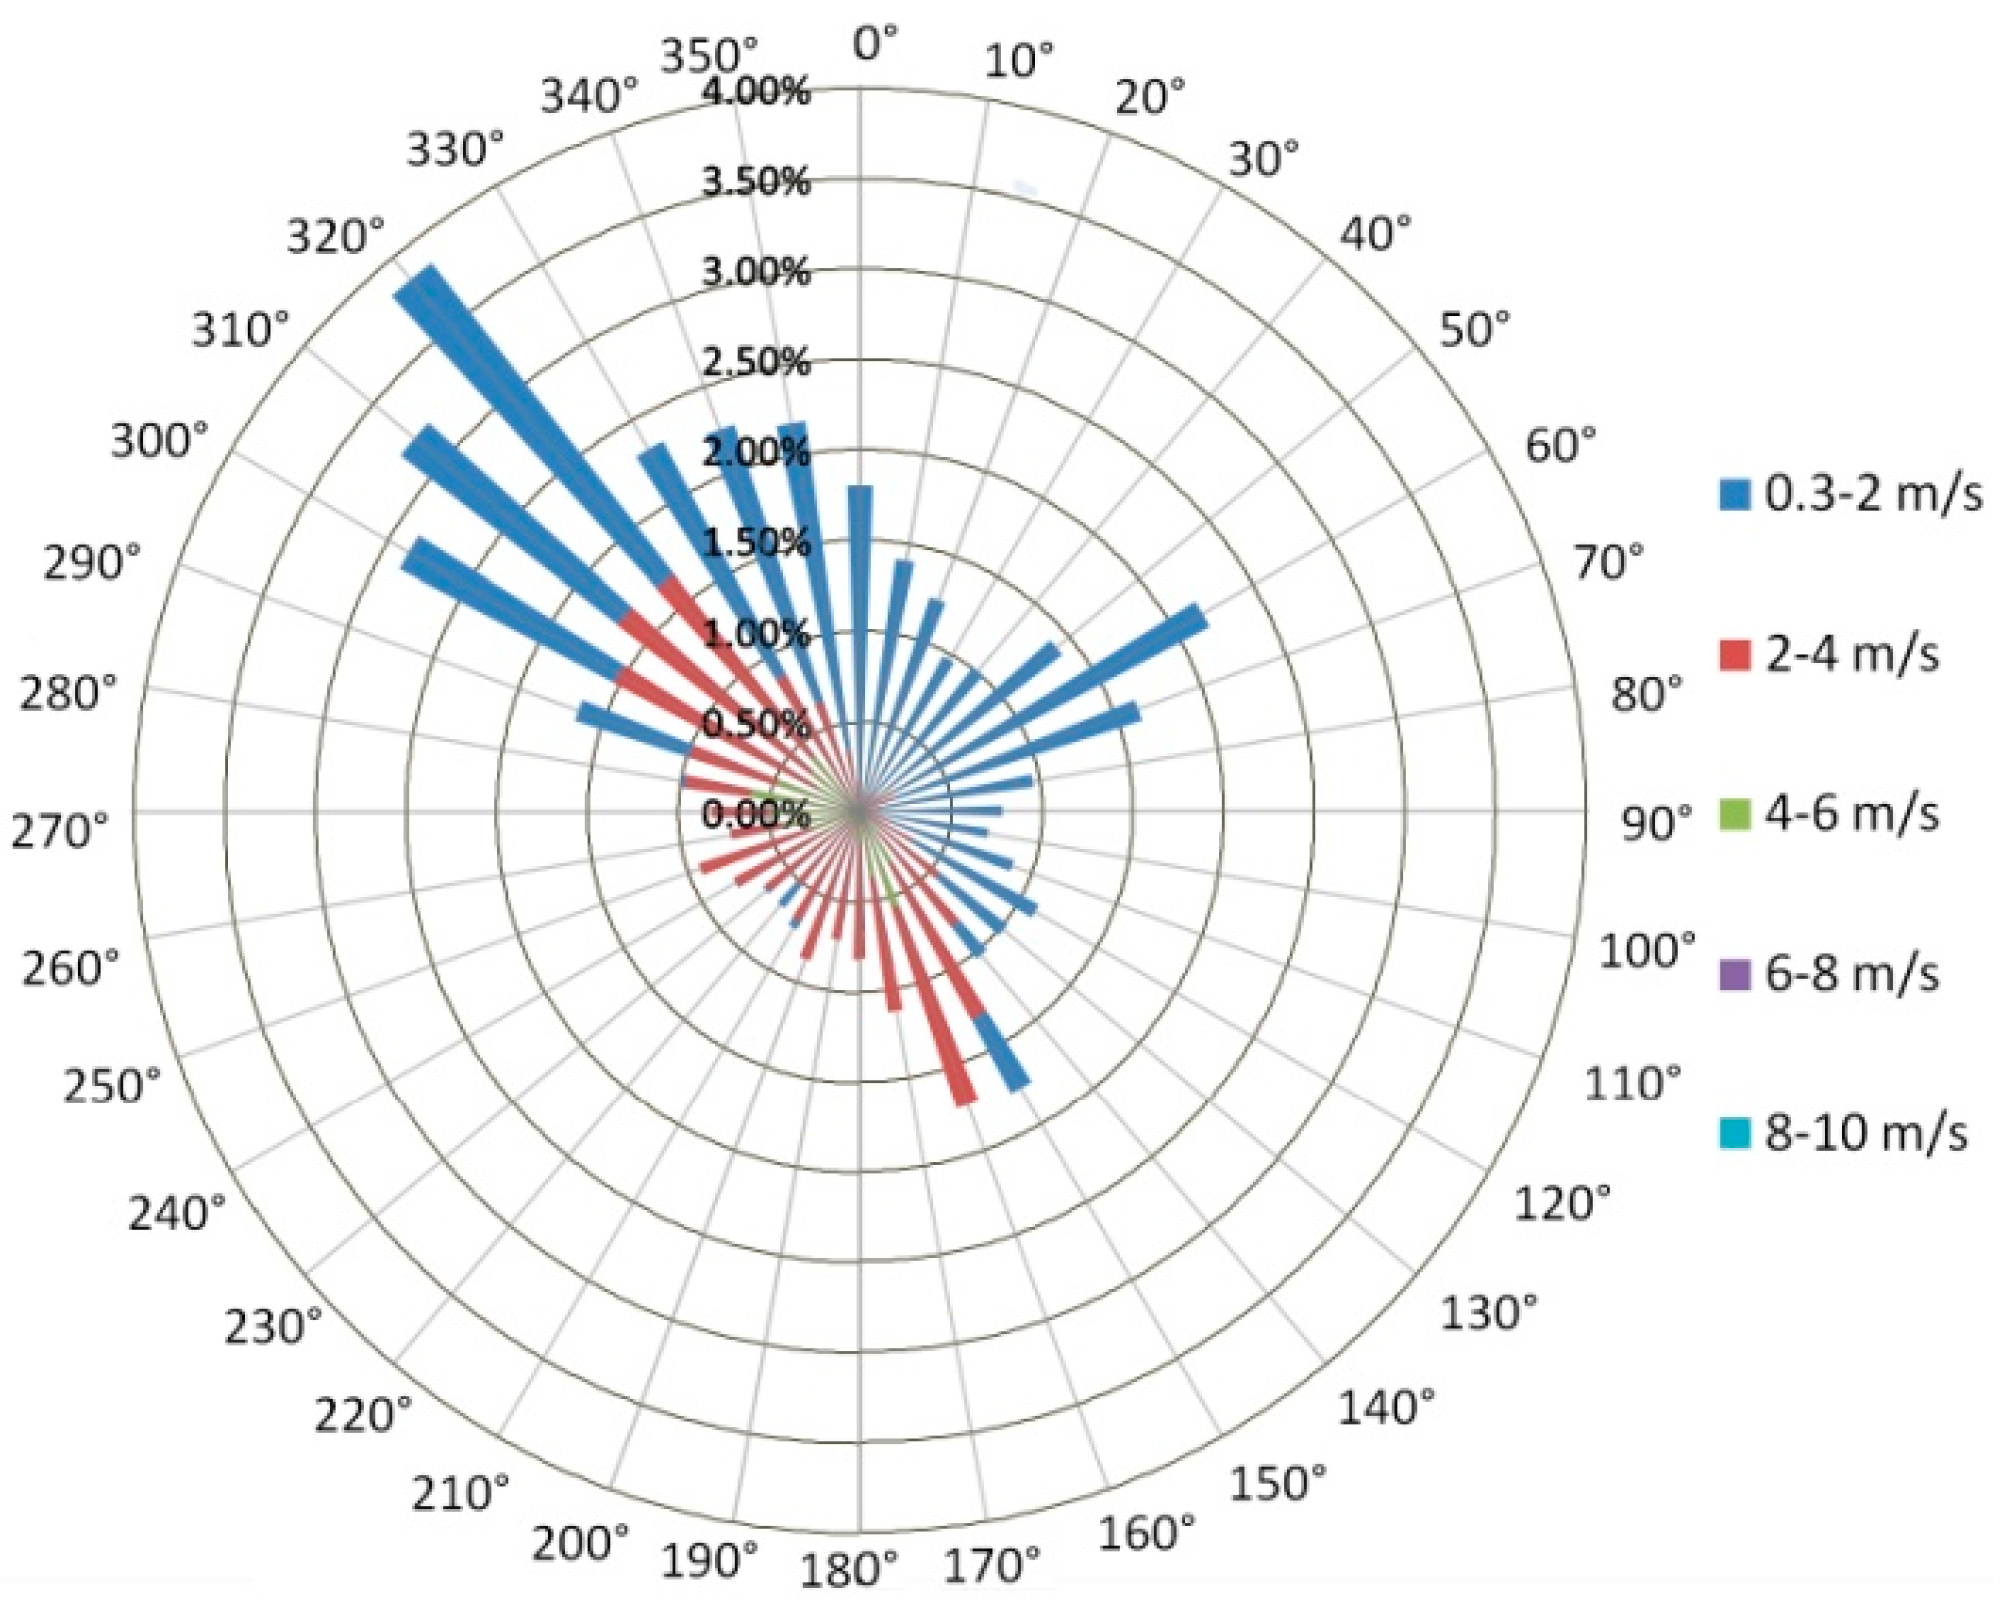
5.1.2. Output of the Wind Energy System
5.2. Low-Carbon Benefit of the System
5.2.1. The Carbon Cost of the Solar Energy System
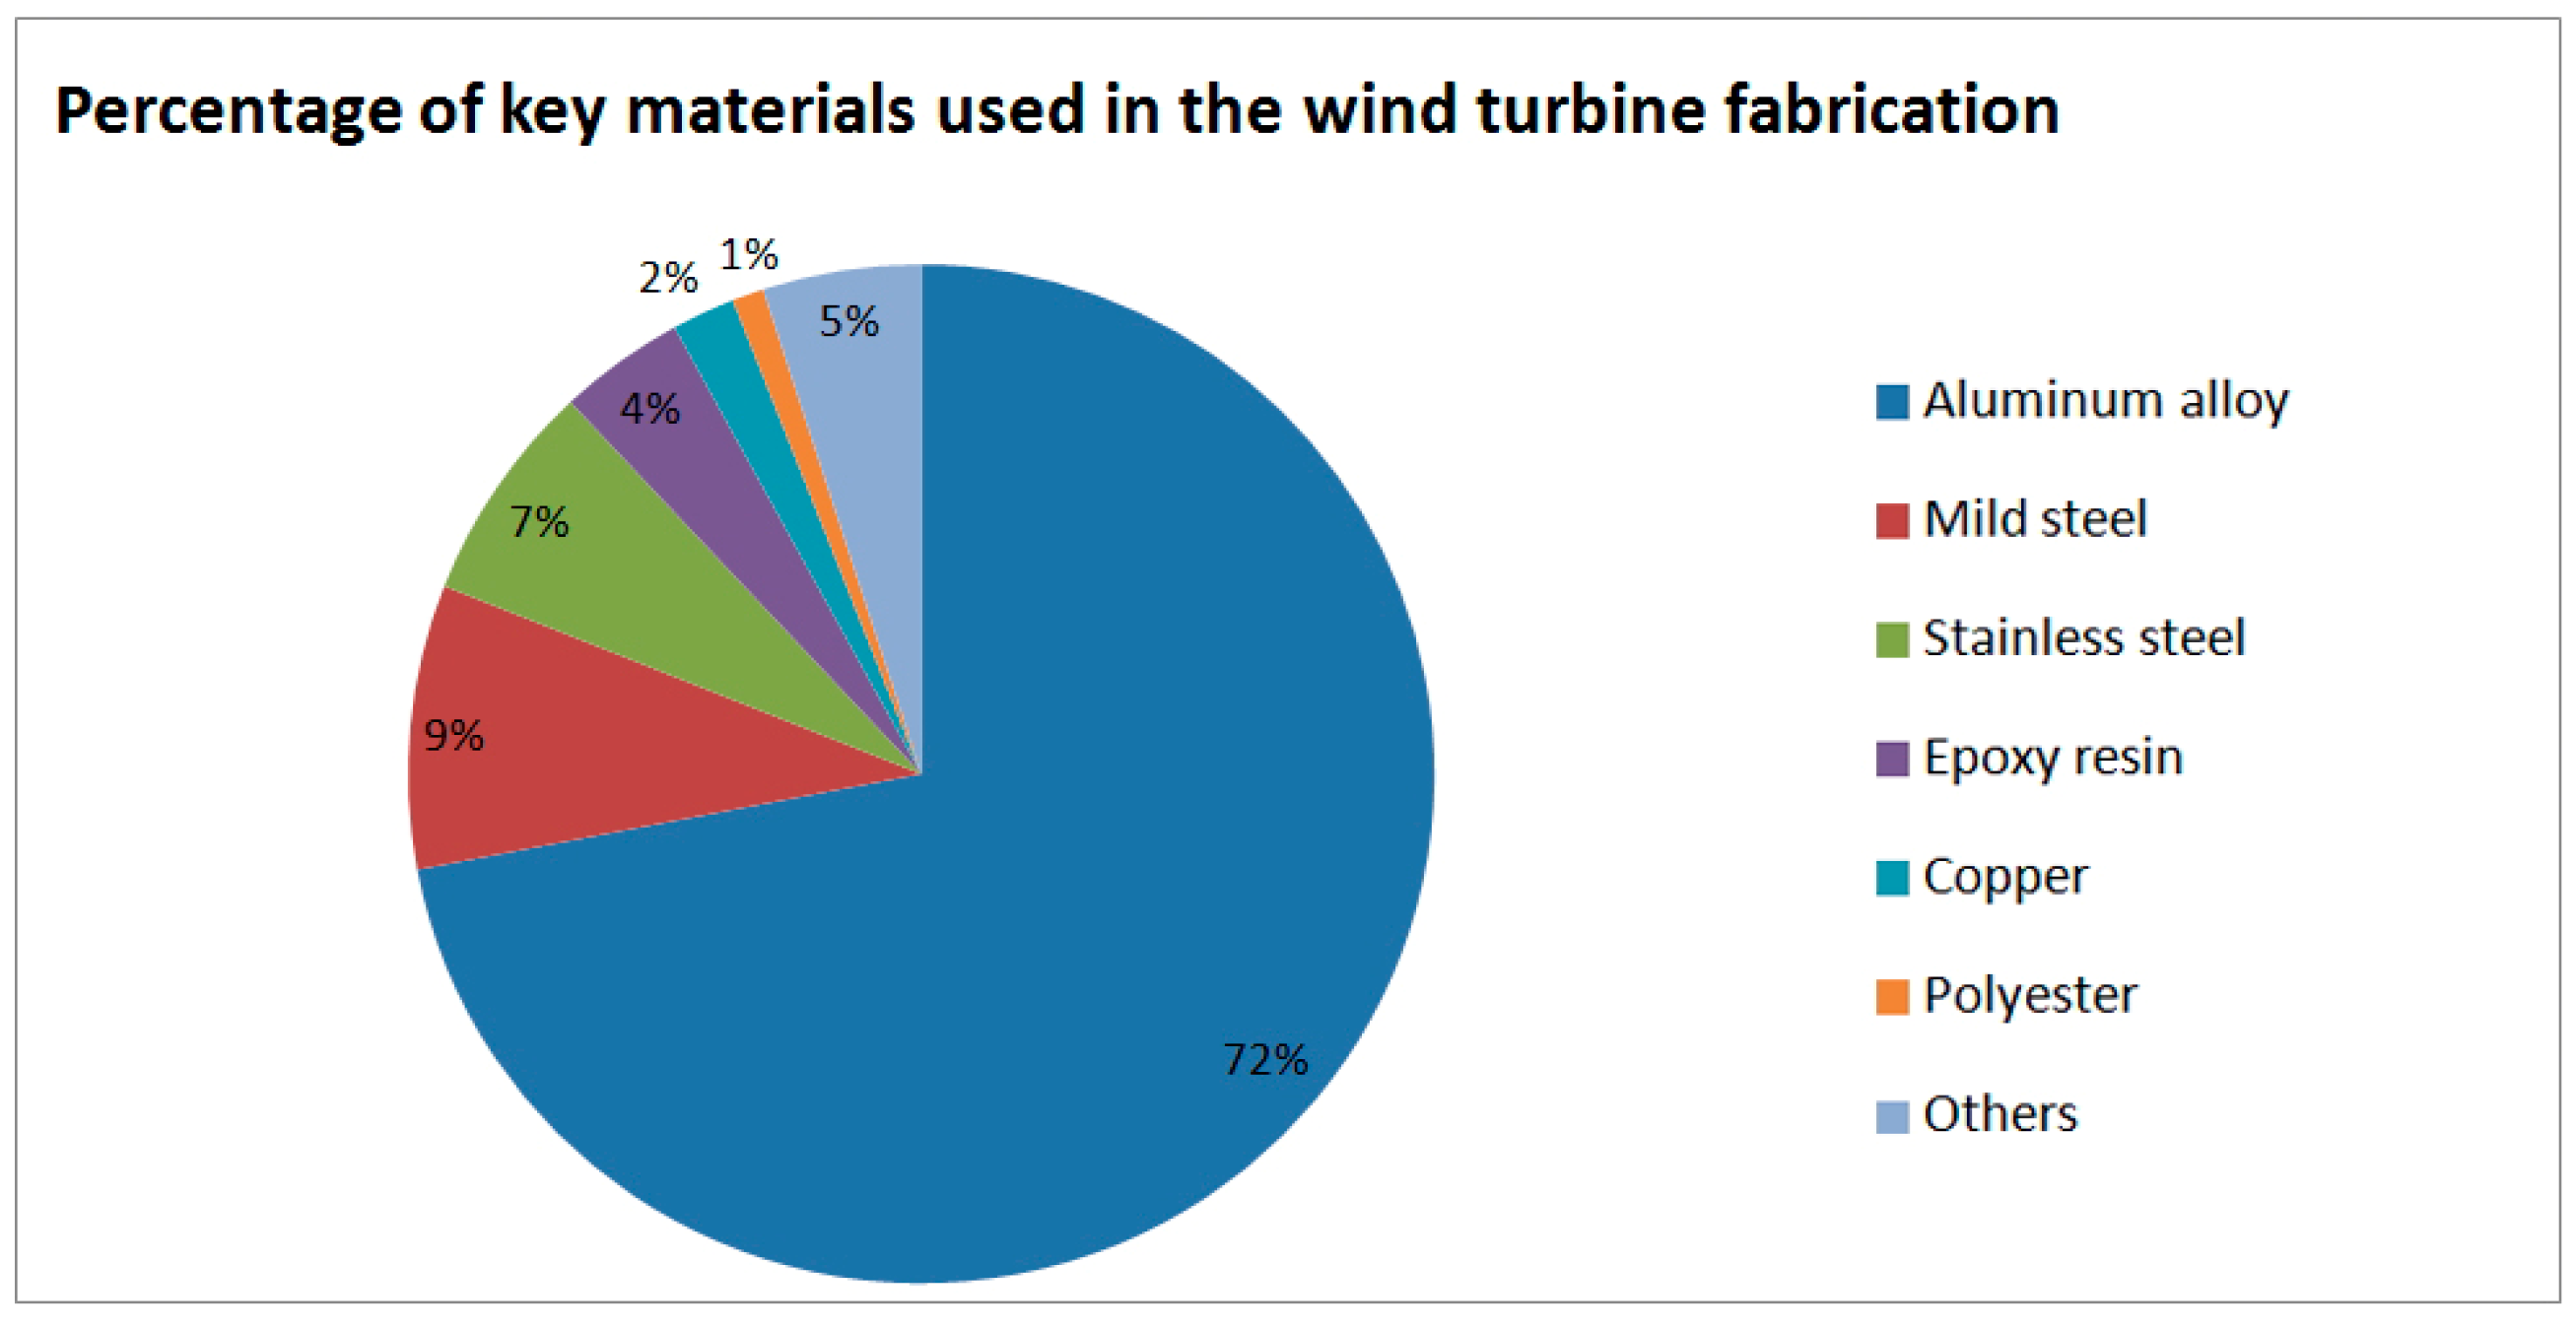
5.2.2. The Carbon Cost of the Wind Energy System
5.3. Economic Benefit of the System
5.4. Annual Comprehensive Benefit of the System
5.5. Carbon Payback Period (CPP) of the System
6. Results and Discussion
6.1. Electricity Generation by the Hybrid Renewable Energy Harvester System
6.2. Low-Carbon Benefit of the Hybrid Renewable Energy Harvester System
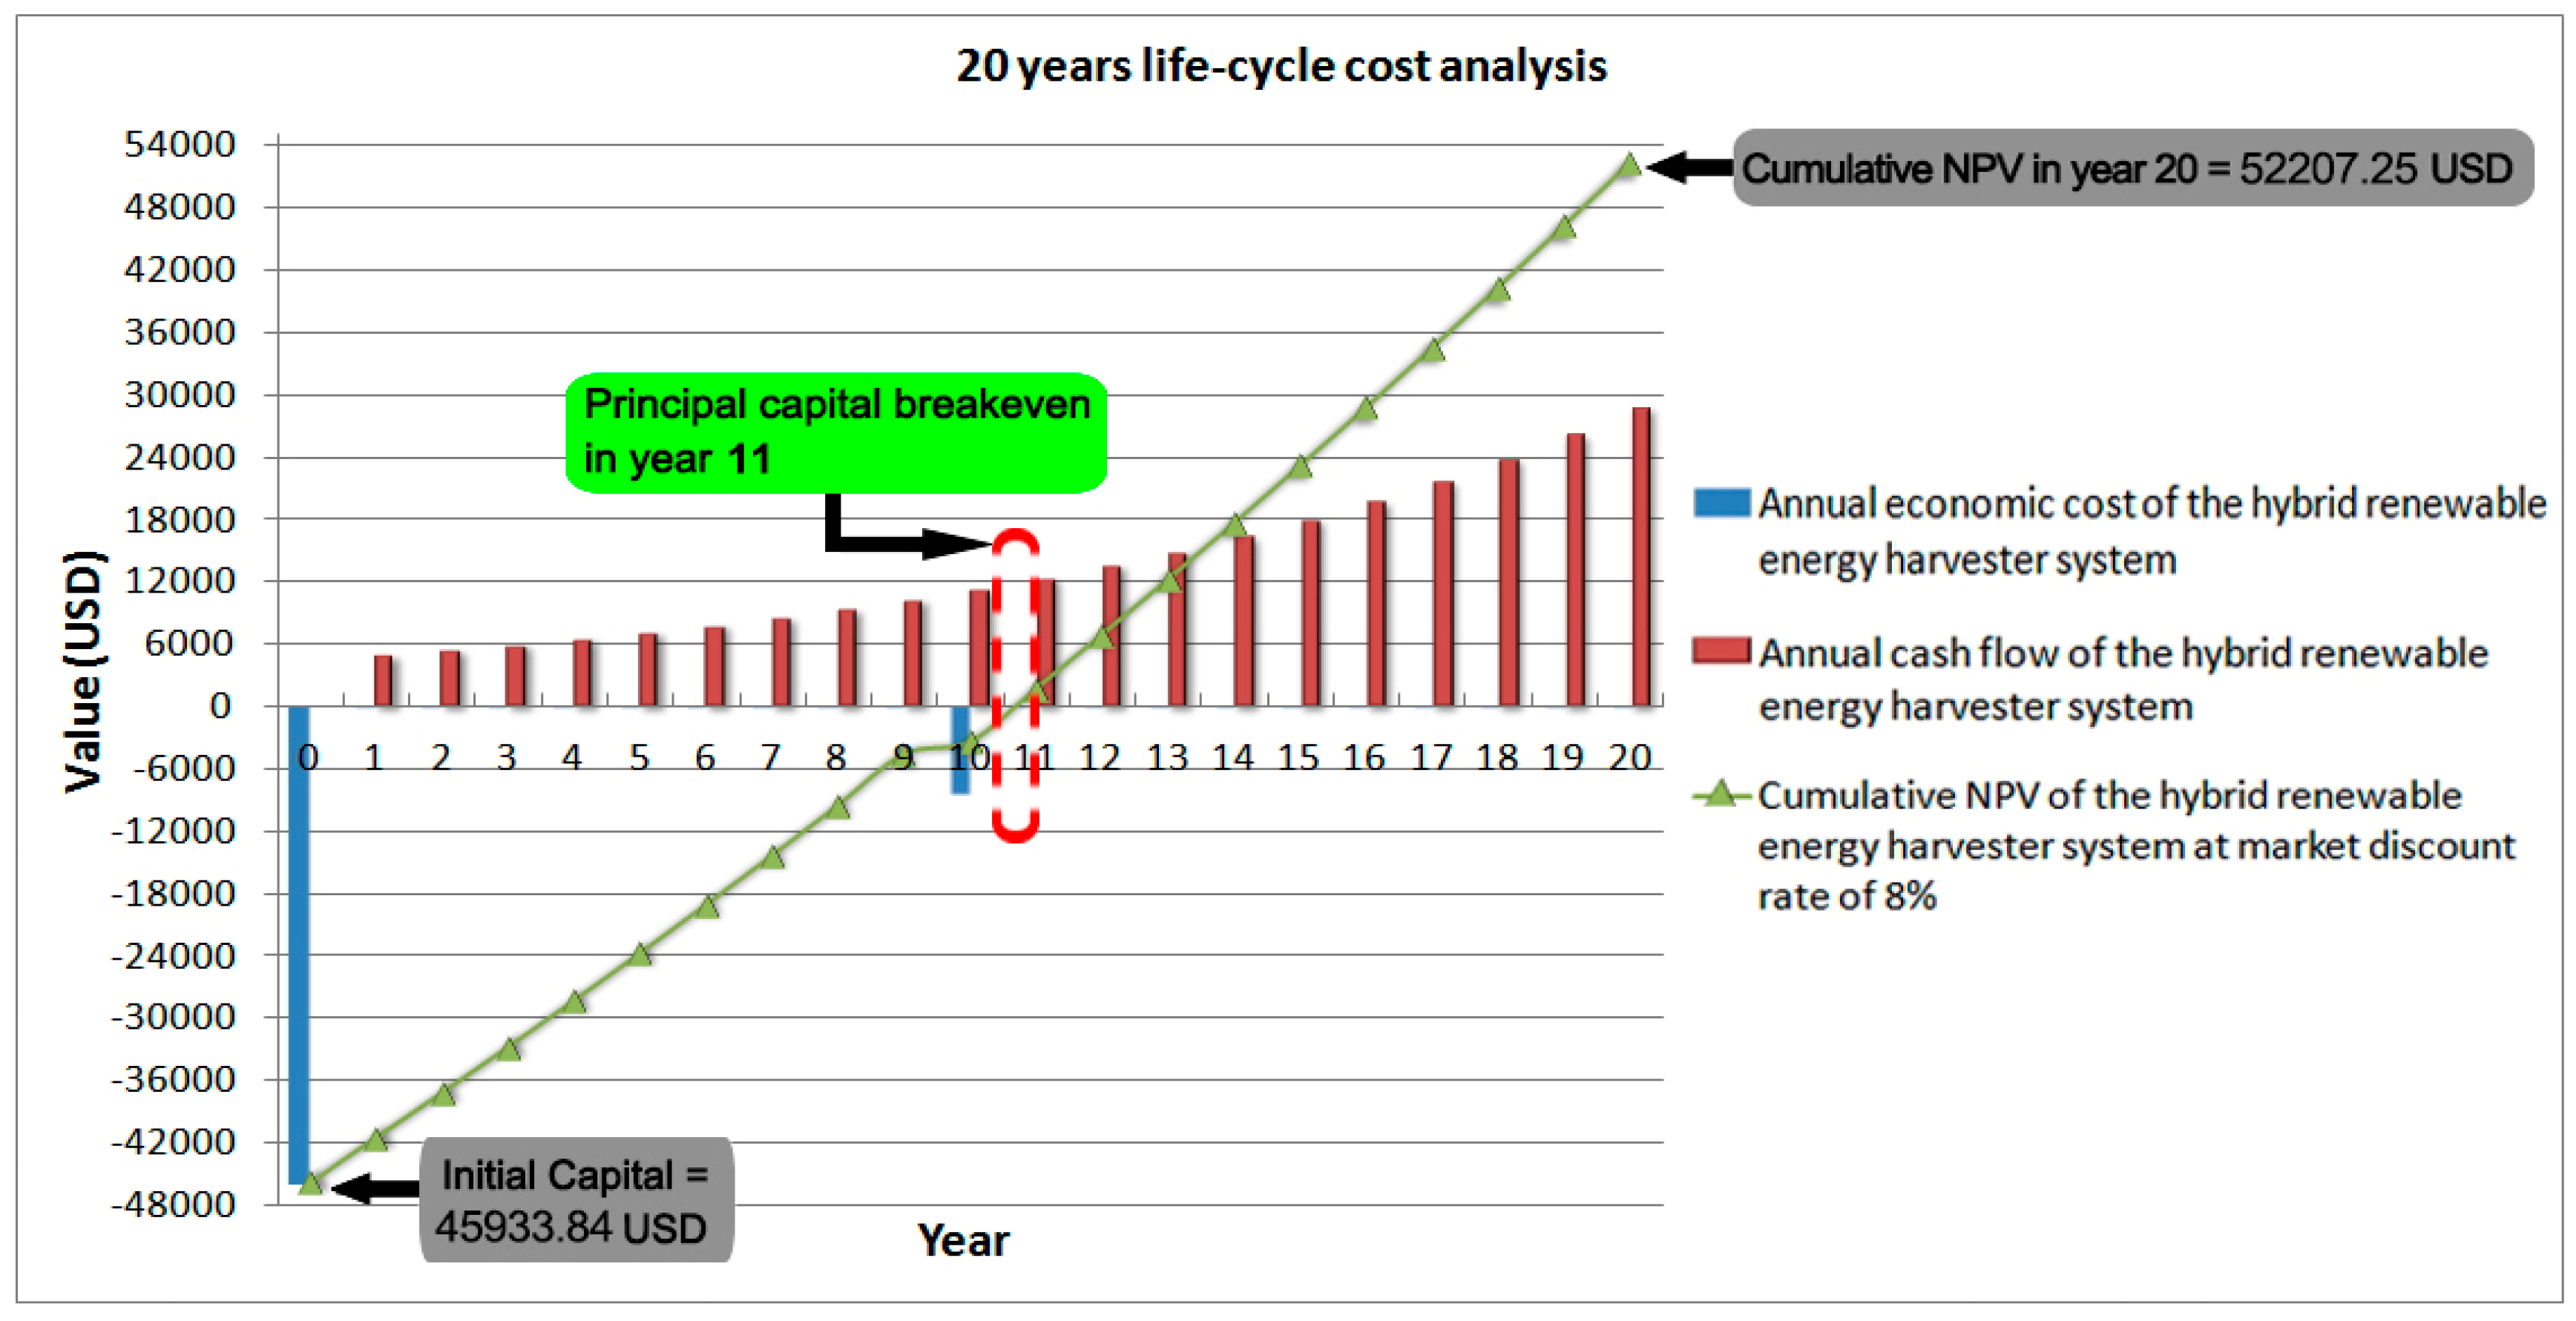
6.3. Economic Evaluation of the Hybrid Renewable Energy Harvester System
6.4. Sensitivity Analysis
6.4.1. Sensitivity Analysis of Solar Radiation
6.4.2. Sensitivity Analysis of Wind Speed
6.4.3. Sensitivity Analysis of Economic Parameter
7. Conclusions
8. Patent
Author Contributions
Funding
Acknowledgments
Conflicts of Interest
Nomenclature
| VRGV | V-shaped roof guide vane |
| LCC | Life cycle cost |
| NPV | Net present value |
| CPP | Carbon payback period |
| PV | Photovoltaic |
| PAGV | Power augmentation guide vane |
| LCA | Life cycle assessment |
| LCOE | Levelized cost of energy |
| EPBT | Energy payback time |
| ROI | Return on investment |
| BCR | Benefit to cost ratio |
| IRR | Internal rate of return |
| UEC | Unit energy cost |
| PBP | Payback period |
| VAWTs | Vertical axis wind turbines |
| CFD | Computational fluid dynamics |
| PR | Performance ratio |
| CETR | Commercial electricity tariff rate |
| CEP | Cost of energy production |
| PWF | Present worth factor |
| PVE | Present value |
| A | Coverage area of a wind turbine |
| K | Shadow influence factor |
| N | Period for the economic estimation |
| Acells | Active area of a solar photovoltaic panel |
| As | Total effective areas of the solar PV panels |
| Gs | Annual average solar radiation value |
| εpv | Influence factor of dip angle and direction of solar PV panel |
| ηps | Module conversion efficiency |
| ρ | Air density |
| Cp | Rotor efficiency |
| ηg | Wind turbine efficiency |
| ηWD | Loss factor in wind direction |
| V’ | Increased wind velocity |
| Cn | Annual low carbon benefit |
| Annual carbon dioxide emission reduction | |
| Annual carbon dioxide emission | |
| mc | Carbon dioxide emission factor for power generation |
| C0s | Initial carbon investment cost of the solar energy system |
| C0w | Initial carbon investment cost of the wind energy system |
| Cms | Maintenance carbon cost of the solar energy system |
| Cmw | Maintenance carbon cost of the wind energy system |
| k | Electric energy consumed by the producing unit power solar photovoltaic panel |
| P0 | Total capacity of the solar energy system |
| W1 | Total weight of the solar energy system |
| g | Carbon dioxide emission intensity of the transportation |
| S1 | Distance between the location of the solar PV panel manufacturer and the project site |
| m | Species of material required to install the solar PV panels |
| i | ith material required to install the solar PV panels |
| λi | Carbon dioxide emission coefficient of the ith material |
| Gi | Weight of the ith material |
| β | Ratio of operating and maintenance carbon cost of the solar energy system versus its initial carbon investment |
| n | Life of the solar PV system |
| W2 | Total weight of the wind energy system |
| S2 | Distance between the wind turbine manufacturer location and wind power plant |
| W3 | Weight of the crane |
| S3 | Distance between the location of the crane and the project site |
| mcrane | Mass of carbon dioxide emission per hour by the working crane |
| h | Working hour of the crane |
| En | Annual economic benefit |
| E1 | Annual economic income |
| Annual economic cost | |
| It | Capital investment in the tth year |
| Eopt | Operating and maintenance cost and the equipment replacement cost in the tth year |
| Pr | FiT rates of renewable energy generation |
| PT | Carbon trading price |
| d | Market discount factor |
References
- Ong, H.; Mahlia, T.; Masjuki, H. A review on energy scenario and sustainable energy in Malaysia. Renew. Sustain. Energy Rev. 2011, 15, 639–647. [Google Scholar] [CrossRef]
- Ali, R.; Daut, I.; Taib, S. A review on existing and future energy sources for electrical power generation in Malaysia. Renew. Sustain. Energy Rev. 2012, 16, 4047–4055. [Google Scholar] [CrossRef]
- Kaundinya, D.P.; Balachandra, P.; Ravindranath, N.H. Grid-connected versus stand-alone energy systems for decentralized power—A review of literature. Renew. Sustain. Energy Rev. 2009, 13, 2041–2050. [Google Scholar] [CrossRef]
- Zhang, Q.; Zhang, J.; Chemori, A.; Xiang, X. Virtual submerged floating operational system for robotic manipulation. Complexity 2018, 2018, 9528313. [Google Scholar] [CrossRef]
- Office, G.P. International Energy Outlook 2016: With Projections to 2040, 3rd ed.; Energy Information Administration: Washington, DC, USA, 2016; pp. 101–111.
- Petinrin, J.; Shaaban, M. Renewable energy for continuous energy sustainability in Malaysia. Renew. Sustain. Energy Rev. 2015, 50, 967–981. [Google Scholar] [CrossRef]
- Shafie, S.; Mahlia, T.; Masjuki, H.; Ahmad-Yazid, A. A review on electricity generation based on biomass residue in Malaysia. Renew. Sustain. Energy Rev. 2012, 16, 5879–5889. [Google Scholar] [CrossRef]
- Sulaiman, F.; Abdullah, N.; Gerhauser, H.; Shariff, A. A perspective of oil palm and its wastes. J. Phys. Sci. 2010, 21, 67–77. [Google Scholar]
- Commission, E. Peninsular Malaysia Electricity Supply Industry Outlook 2017; Energy Commission: Putrajaya, Malaysia, 2017; pp. 5–18.
- Malaysia Electricity Consumption. Available online: https://www.ceicdata.com/zh-hans/malaysia/electricity-generation-and-consumption/electricity-consumption (accessed on 15 February 2019).
- Mahlia, T. Emissions from electricity generation in Malaysia. Renew. Energy 2002, 27, 293–300. [Google Scholar] [CrossRef]
- Zeng, S.; Wang, Y. Economic Evaluation of Wind Energy Utilization for Building Integrated Wind Turbine System. Value Eng. 2015, 19, 53–56. [Google Scholar] [CrossRef]
- Mostafaeipour, A.; Bardel, B.; Mohammadi, K.; Sedaghat, A.; Dinpashoh, Y. Economic evaluation for cooling and ventilation of medicine storage warehouses utilizing wind catchers. Renew. Sustain. Energy Rev. 2014, 38, 12–19. [Google Scholar] [CrossRef]
- Bahaj, A.; Myers, L.; James, P. Urban energy generation: Influence of micro-wind turbine output on electricity consumption in buildings. Energy Build. 2007, 39, 154–165. [Google Scholar] [CrossRef]
- Beyer, H.G.; Langer, C. A method for the identification of configurations of PV/wind hybrid systems for the reliable supply of small loads. Sol. Energy 1996, 57, 381–391. [Google Scholar] [CrossRef]
- Zahnd, A.; Clark, A.; Cheung, W.; Zou, L.; Kleissl, J. Minimizing the lead-acid battery bank capacity through a solar PV-Wind turbine hybrid system for a high-altitude village in the Nepal Himalayas. Energy Procedia 2014, 57, 1516–1525. [Google Scholar] [CrossRef]
- Bekele, G.; Palm, B. Feasibility study for a standalone solar–wind-based hybrid energy system for application in Ethiopia. Appl. Energy 2010, 87, 487–495. [Google Scholar] [CrossRef]
- Jurasz, J.; Beluco, A.; Canales, F.A. The impact of complementarity on power supply reliability of small scale hybrid energy systems. Energy 2018, 161, 737–743. [Google Scholar] [CrossRef]
- Kalantar, M. Dynamic behavior of a stand-alone hybrid power generation system of wind turbine, microturbine, solar array and battery storage. Appl. Energy 2010, 87, 3051–3064. [Google Scholar] [CrossRef]
- Ekren, O.; Ekren, B.Y. Size optimization of a PV/wind hybrid energy conversion system with battery storage using response surface methodology. Appl. Energy 2008, 85, 1086–1101. [Google Scholar] [CrossRef]
- Fathy, A. A reliable methodology based on mine blast optimization algorithm for optimal sizing of hybrid PV-wind-FC system for remote area in Egypt. Renew. Energy 2016, 95, 367–380. [Google Scholar] [CrossRef]
- Yang, H.; Lu, L.; Zhou, W. A novel optimization sizing model for hybrid solar-wind power generation system. Sol. Energy 2007, 81, 76–84. [Google Scholar] [CrossRef]
- Levine, M.D.; Price, L.; Martin, N. Mitigation options for carbon dioxide emissions from buildings: A global analysis. Energy Policy 1996, 24, 937–949. [Google Scholar] [CrossRef]
- Wiel, S.; Martin, N.; Levine, M.; Price, L.; Sathaye, J. The role of building energy efficiency in managing atmospheric carbon dioxide. Environ. Sci. Policy 1998, 1, 27–38. [Google Scholar] [CrossRef]
- Ürge-Vorsatz, D.; Novikova, A. Potentials and costs of carbon dioxide mitigation in the world’s buildings. Energy Policy 2008, 36, 642–661. [Google Scholar] [CrossRef]
- Yang, H.; Wei, Z.; Chengzhi, L. Optimal design and techno-economic analysis of a hybrid solar-wind power generation system. Appl. Energy 2009, 86, 163–169. [Google Scholar] [CrossRef]
- Chong, W.T.; Naghavi, M.S.; Poh, S.C.; Mahlia, T.M.I.; Pan, K.C. Techno-economic analysis of a wind-solar hybrid renewable energy system with rainwater collection feature for urban high-rise application. Appl. Energy 2011, 88, 4067–4077. [Google Scholar] [CrossRef]
- Chong, W.T.; Fazlizan, A.; Poh, S.C.; Pan, K.C.; Ping, H.W. Early development of an innovative building integrated wind, solar and rain water harvester for urban high rise application. Energy Build. 2012, 47, 201–207. [Google Scholar] [CrossRef]
- Contino, R.; Leva, S.; Zaninelli, D. Integrated renewable sources for supplying remote power systems. WSEAS Trans. Power Syst. 2007, 2, 41–48. [Google Scholar]
- Wang, X.; Chong, W.; Wong, K.; Saw, L.; Poh, S.; Lai, S.; Wang, C.-T. Preliminary Performance Tests and Simulation of a V-Shape Roof Guide Vane Mounted on an Eco-Roof System. Energies 2018, 11, 2846. [Google Scholar] [CrossRef]
- Buker, M.S.; Mempouo, B.; Riffat, S.B. Performance evaluation and techno-economic analysis of a novel building integrated PV/T roof collector: An experimental validation. Energy Build. 2014, 76, 164–175. [Google Scholar] [CrossRef]
- Mithraratne, N. Roof-top wind turbines for microgeneration in urban houses in New Zealand. Energy Build. 2009, 41, 1013–1018. [Google Scholar] [CrossRef]
- Pereira, R.P.T.; Ribeiro, G.M.; Filimonau, V. The carbon footprint appraisal of local visitor travel in Brazil: A case of the Rio de Janeiro-São Paulo itinerary. J. Clean. Prod. 2017, 141, 256–266. [Google Scholar] [CrossRef]
- Wang, W.-C.; Teah, H.-Y. Life cycle assessment of small-scale horizontal axis wind turbines in Taiwan. J. Clean. Prod. 2017, 141, 492–501. [Google Scholar] [CrossRef]
- Ardente, F.; Beccali, M.; Cellura, M.; Brano, V.L. Energy performances and life cycle assessment of an Italian wind farm. Renew. Sustain. Energy Rev. 2008, 12, 200–217. [Google Scholar] [CrossRef]
- Riggs, B.C.; Biedenharn, R.; Dougher, C.; Ji, Y.V.; Xu, Q.; Romanin, V.; Codd, D.S.; Zahler, J.M.; Escarra, M.D. Techno-economic analysis of hybrid PV/T systems for process heat using electricity to subsidize the cost of heat. Appl. Energy 2017, 208, 1370–1378. [Google Scholar] [CrossRef]
- Ramos, A.; Chatzopoulou, M.A.; Guarracino, I.; Freeman, J.; Markides, C.N. Hybrid photovoltaic-thermal solar systems for combined heating, cooling and power provision in the urban environment. Energy Convers. Manag. 2017, 150, 838–850. [Google Scholar] [CrossRef]
- Wilson, R.; Young, A. The embodied energy payback period of photovoltaic installations applied to buildings in the UK. Build. Environ. 1996, 31, 299–305. [Google Scholar] [CrossRef]
- Zhang, X.; Shen, J.; Adkins, D.; Yang, T.; Tang, L.; Zhao, X.; He, W.; Xu, P.; Liu, C.; Luo, H. The early design stage for building renovation with a novel loop-heat-pipe based solar thermal facade (LHP-STF) heat pump water heating system: Techno-economic analysis in three European climates. Energy Convers. Manag. 2015, 106, 964–986. [Google Scholar] [CrossRef]
- Michael, J.J.; Selvarasan, I. Economic analysis and environmental impact of flat plate roof mounted solar energy systems. Sol. Energy 2017, 142, 159–170. [Google Scholar] [CrossRef]
- Herrando, M.; Markides, C.N.; Hellgardt, K. A UK-based assessment of hybrid PV and solar-thermal systems for domestic heating and power: System performance. Appl. Energy 2014, 122, 288–309. [Google Scholar] [CrossRef]
- Lenzen, M.; Munksgaard, J. Energy and CO2 life-cycle analyses of wind turbines—Review and applications. Renew. Energy 2002, 26, 339–362. [Google Scholar] [CrossRef]
- Krauter, S.; Rüther, R. Considerations for the calculation of greenhouse gas reduction by photovoltaic solar energy. Renew. Energy 2004, 29, 345–355. [Google Scholar] [CrossRef]
- Korsavi, S.S.; Zomorodian, Z.S.; Tahsildoost, M. Energy and economic performance of rooftop PV panels in the hot and dry climate of Iran. J. Clean. Prod. 2018, 174, 1204–1214. [Google Scholar] [CrossRef]
- Al Busaidi, A.S.; Kazem, H.A.; Al-Badi, A.H.; Khan, M.F. A review of optimum sizing of hybrid PV—Wind renewable energy systems in oman. Renew. Sustain. Energy Rev. 2016, 53, 185–193. [Google Scholar] [CrossRef]
- Nookuea, W.; Campana, P.E.; Yan, J. Evaluation of solar PV and wind alternatives for self renewable energy supply: Case study of shrimp cultivation. Energy Procedia 2016, 88, 462–469. [Google Scholar] [CrossRef]
- Guezuraga, B.; Zauner, R.; Pölz, W. Life cycle assessment of two different 2 MW class wind turbines. Renew. Energy 2012, 37, 37–44. [Google Scholar] [CrossRef]
- Wang, Y.; Sun, T. Life cycle assessment of CO2 emissions from wind power plants: Methodology and case studies. Renew. Energy 2012, 43, 30–36. [Google Scholar] [CrossRef]
- Kannan, R.; Leong, K.; Osman, R.; Ho, H.; Tso, C. Life cycle assessment study of solar PV systems: An example of a 2.7 kWp distributed solar PV system in Singapore. Sol. Energy 2006, 80, 555–563. [Google Scholar] [CrossRef]
- Ito, M.; Komoto, K.; Kurokawa, K. Life-cycle analyses of very-large scale PV systems using six types of PV modules. Curr. Appl. Phys. 2010, 10, S271–S273. [Google Scholar] [CrossRef]
- Siow, W.S. Formulation of Empirical Models for Solar Module by Optimisation of Its Tilt-Angle under Natural Conditions. Master’s Thesis, Universiti Putra Malaysia, Seri Kembangan, Malaysia, 2001. [Google Scholar]
- Hang, W.X.; Tong, C.W.; Hoe, W.K.; Chin-Tsan, W.; Huat, S.L.; Chew, P.S.; Hin, L.S. Preliminary Assessment of Optimized Accessorial Roof Shape for Performance of Wind Turbine Mounted on Eco-Roof System. Int. J. Pract. Eng. Manuf. Green Technol. 2018, 5, 375–385. [Google Scholar] [CrossRef]
- Silent Vertical Axis Wind Turbine. Available online: https://www.alibaba.com/product-detail/Silent1kw-48v-96v-220v-vertical-wind_60788254789.html?spm=a2700.7724838.2017203.3.4f646d361WyVvf&s=p (accessed on 29 March 2019).
- 300 W Monocrystalline Solar Panel. SingfoSolar. Available online: https://detail.1688.com/offer/521377075464.html?spm=a261b.2187593.1998088710.175.LPu4rx (accessed on 29 March 2019).
- Mondol, J.D.; Yohanis, Y.G.; Norton, B. The impact of array inclination and orientation on the performance of a grid-connected photovoltaic system. Renew. Energy 2007, 32, 118–140. [Google Scholar] [CrossRef]
- Dominguez, A.; Kleissl, J.; Luvall, J.C. Effects of solar photovoltaic panels on roof heat transfer. Sol. Energy 2011, 85, 2244–2255. [Google Scholar] [CrossRef]
- Elnozahy, A.; Rahman, A.K.A.; Ali, A.H.H.; Salam, M.A.; Ookawara, S. Performance of a PV module integrated with standalone building in hot arid areas as enhanced by surface cooling and cleaning. Energy Build. 2015, 88, 100–109. [Google Scholar] [CrossRef]
- Chong, W.T.; Wang, X.H.; Wong, K.H.; Mojumder, J.C.; Poh, S.C.; Saw, L.H.; Lai, S.H. Performance assessment of a hybrid solar-wind-rain eco-roof system for buildings. Energy Build. 2016, 127, 1028–1042. [Google Scholar] [CrossRef]
- Decker, B.; Jahn, U. Performance of 170 grid connected PV plants in northern Germany—Analysis of yields and optimization potentials. Sol. Energy 1997, 59, 127–133. [Google Scholar] [CrossRef]
- Sustainable Energy Development Authority Malaysia. Available online: http://www.seda.gov.my/?omaneg=00010100000001010101000100001000000000000000000000&s=540 (accessed on 15 February 2019).
- Knapp, K.; Jester, T. An empirical perspective on the energy payback time for photovoltaic modules. In Proceedings of the Solar 2000 Conference, Madison, WI, USA, 16–21 June 2000; American Solar Energy Society: Sacramento, CA, USA, 2000; pp. 641–648. [Google Scholar]
- DelSolar Products & Services. Available online: http://www.delsolarpv.com/products/Module.aspx?R=ww&C=en-us (accessed on 15 February 2019).
- Wu, P.; Low, S.P. Lean and Cleaner Production; Springer: Berlin, Germany, 2016; pp. 127–130. ISBN 978-3-642-42062-7. [Google Scholar]
- Technical Parameters of Industrial Aluminum Profiles MJ-6-2525. Available online: https://detail.1688.com/offer/1169735577.html?spm=a261y.7663282.commendOffer.1.44162efbF0LPBe&scm=1007.19151.114112.0 (accessed on 15 February 2019).
- Hasanbeigi, A.; Arens, M.; Cardenas, J.C.R.; Price, L.; Triolo, R. Comparison of carbon dioxide emissions intensity of steel production in China, Germany, Mexico, and the United States. Resour. Conserv. Recycl. 2016, 113, 127–139. [Google Scholar] [CrossRef]
- Cameron, C.P.; Goodrich, A.C. The levelized cost of energy for distributed PV: A parametric study. In Proceedings of the 35th IEEE Photovoltaic Specialists Conference (PVSC 2010), Honolulu, HI, USA, 20–25 June 2010; Institute of Electrical and Electronics Engineers (IEEE): Piscataway, NJ, USA, 2010; pp. 000529–000534. [Google Scholar]
- Ren, H.; Gao, W.; Ruan, Y. Economic optimization and sensitivity analysis of photovoltaic system in residential buildings. Renew. Energy 2009, 34, 883–889. [Google Scholar] [CrossRef]
- Rankine, R.K.; Chick, J.P.; Harrison, G.P. Energy and carbon audit of a rooftop wind turbine. Proc. Inst. Mech. Eng. A 2006, 220, 643–654. [Google Scholar] [CrossRef]
- Martínez, E.; Sanz, F.; Pellegrini, S.; Jiménez, E.; Blanco, J. Life cycle assessment of a multi-megawatt wind turbine. Renew. Energy 2009, 34, 667–673. [Google Scholar] [CrossRef]
- White, S.W.; Kulcinski, G.L. Birth to death analysis of the energy payback ratio and CO2 gas emission rates from coal, fission, wind, and DT-fusion electrical power plants. Fusion Eng. Des. 2000, 48, 473–481. [Google Scholar] [CrossRef]
- Schleisner, L. Life cycle assessment of a wind farm and related externalities. Renew. Energy 2000, 20, 279–288. [Google Scholar] [CrossRef]
- Giurco, D.; Stewart, M.; Suljada, T.; Petrie, J. Copper recycling alternatives: An environmental analysis. In Proceedings of the 5th Annual Environmental Engineering Research Event, Noosa, Australia, 20–23 October 2006; pp. 20–23. [Google Scholar]
- Rieradevall, J.; Domènech, X.; Fullana, P. Application of life cycle assessment to landfilling. Int. J. Life Cycle Assess 1997, 2, 141. [Google Scholar] [CrossRef]
- Markus, E. Cradle-to-Gate Life Cycle Inventory: Canadian and US Steel Production by Mill Type; Athena Soustainable Materials Institute: Ottawa, ON, Canada, 2002; pp. 3–12. [Google Scholar]
- Eisted, R.; Larsen, A.W.; Christensen, T.H. Collection, transfer and transport of waste: Accounting of greenhouse gases and global warming contribution. Waste Manag. Res. 2009, 27, 738–745. [Google Scholar] [CrossRef] [PubMed]
- White, S.W. Net energy payback and CO2 emissions from three Midwestern wind farms: An update. Nat. Resour. Res. 2006, 15, 271–281. [Google Scholar] [CrossRef]
- Couttie, R. The Embodied CO2 of a Wind farm. Master’s Thesis, University of Strathclyde, Glasgow, UK, 2014. [Google Scholar]
- Chen, C.; Huang, J.; Wu, Y.; Ma, J.; Qin, X. Low-carbon Comprehensive Benefits Analysis Of Joint Operation Of Wind Power And Pumped Storage Station. J. Phys. Conf. Ser. 2018, 1087, 042047. [Google Scholar] [CrossRef]
- Hybrid Power Inverter Price. Available online: https://www.alibaba.com/product-detail/Intelligent-10KW-15KW-20KW-30KW-Solar_60734444969.html?spm=a2700.7724857.normalList.42.9c919230gVbbBC (accessed on 29 March 2019).
- On Grid Wind Solar Hybrid Power Controller. Available online: https://www.alibaba.com/product-detail/On-grid-wind-solar-hybrid-power_60759820819.html?spm=a2700.7724838.2017115.150.3dc94236aemTuQ (accessed on 29 March 2019).
- Photovoltaic Economics. PVresources. Available online: http://www.pvresources.com/en/economics/lcoe.php (accessed on 29 March 2019).
- Renewable Energy Technologies: Cost Analysis Series. O&M Costs for Wind Projects. Available online: https://www.irena.org/documentdownloads/publications/re_technologies_cost_analysis-wind_power.pdf (accessed on 29 March 2019).
- IEA WIND 2011 Annual Report. Available online: https://community.ieawind.org/HigherLogic/System/DownloadDocumentFile.ashx?DocumentFileKey=f1931064-1e11-0286-71f9-fe70c13a84b6&forceDialog=0 (accessed on 29 March 2019).
- FiT Rates for Renewable Sources (Solar PV) (21 Years from FiT Commencement Date). Sustainable Energy Development Authority Malaysia. Available online: http://www.seda.gov.my/ (accessed on 15 February 2019).
- Carbon Trading. Available online: http://www.sda-architect.com/carbon-trading/ (accessed on 15 February 2019).
- Energy Pricing Practice. Asia Pacific Energy Research Centre (APERC). Available online: http://www.ieej.or.jp/aperc/final/pricing.pdf (accessed on 15 February 2019).
- Tan, C.; Maragatham, K.; Leong, Y. Electricity energy outlook in Malaysia. IOP Conf. Ser. Earth Environ. Sci. 2013, 16, 012126. [Google Scholar] [CrossRef]
- Life-Cycle Thinking for the Oil and Gas Exploration and Production Industry. Argonne National Laboratory. Available online: www.evs.anl.gov/pub/dsp_detail.cfm?PubID=2154 (accessed on 15 February 2019).
- Malaysia Inflation Rate. Trading Economics. Available online: https://tradingeconomics.com/malaysia/inflation-cpi (accessed on 15 February 2019).


| Item | Value |
|---|---|
| Length of the main body of the building | 15.0 m |
| Width of the main body of the building | 16.0 m |
| Elevation of the main body of the building | 13.05 m |
| Inclination angle of double-sloped roof | 15.0° [51] |
| Length of the VRGV | 15.0 m |
| Width of the VRGV | 5.0 m (both sides) |
| Elevation of the VRGV | 17.05 m |
| Tilt angle of the VRGV | 19.5° [52] |
| Length of skylight window | 12.0 m |
| Width of skylight window | 1.0 m |
| Height space for the wind turbines installation | 1.6 m |
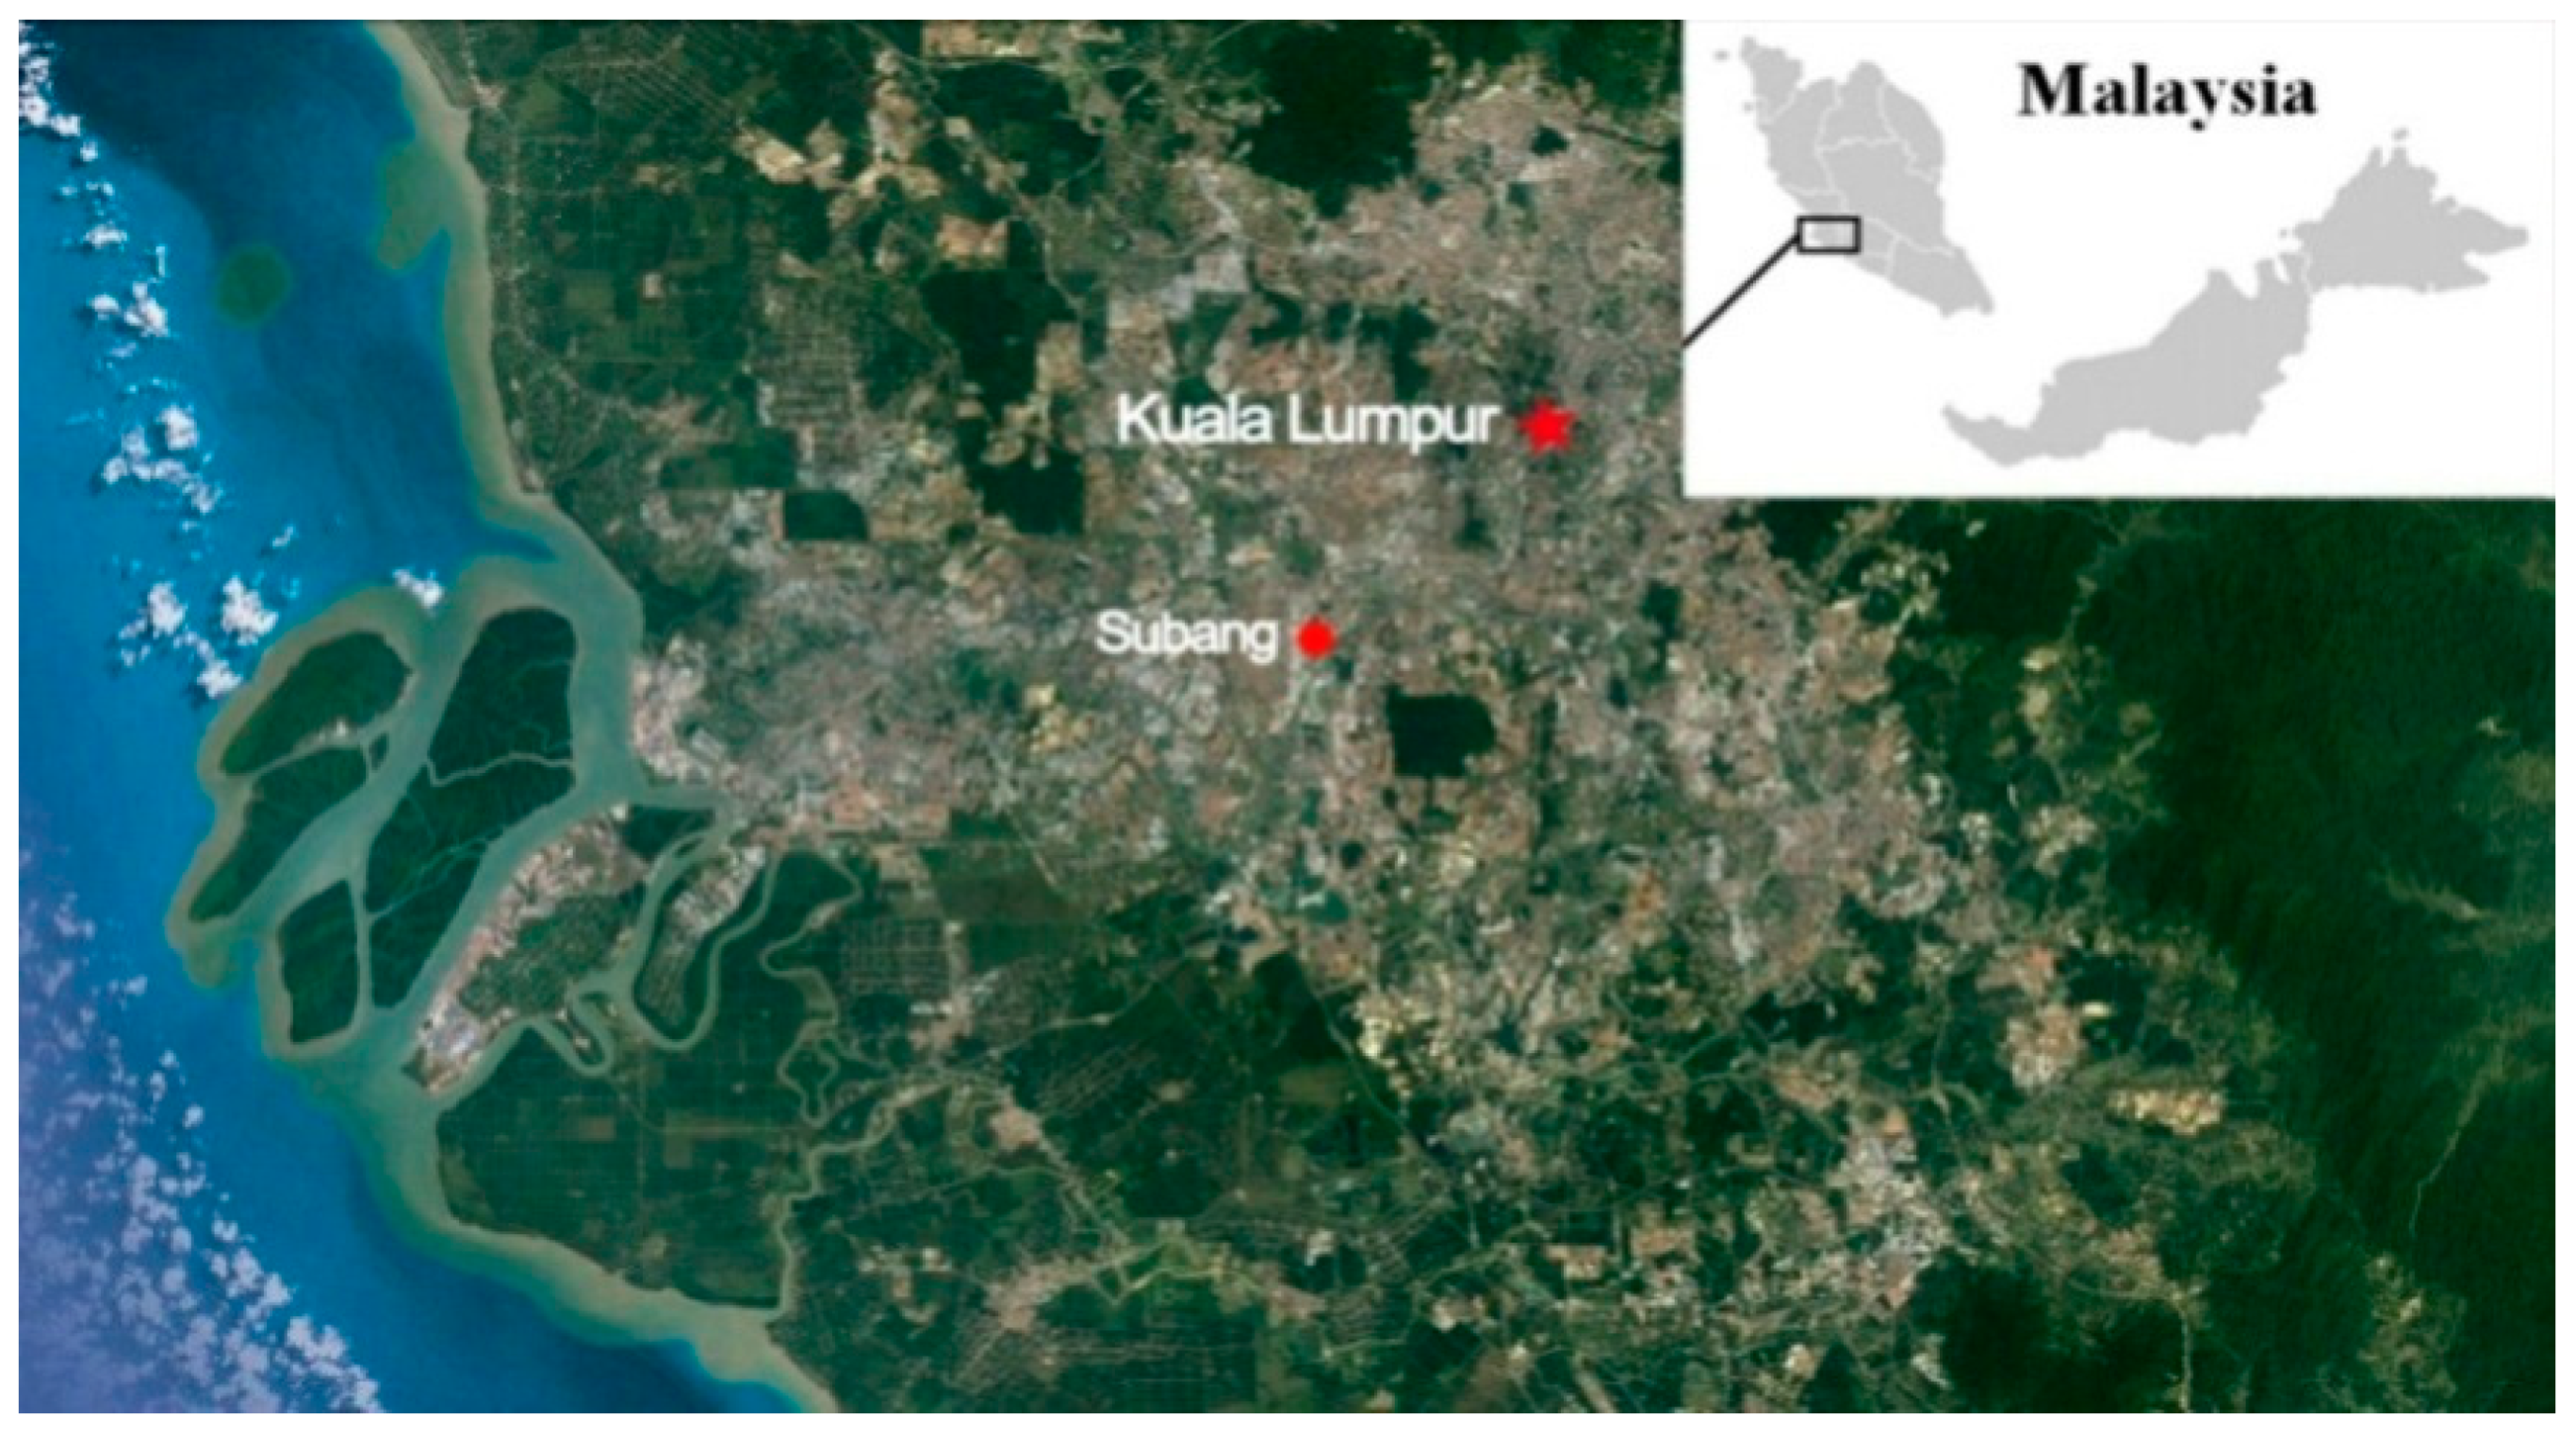
| Location of the system | 300°–320° (North-northwest) |
| Items | Dimensions |
|---|---|
| Rated power | 300 W |
| Output voltage | 24 V |
| Operation wind velocity | 1.8–25.0 ms−1 |
| Starting-up wind velocity | 1.8 ms−1 |
| Rated wind velocity | 12 ms−1 |
| Shutdown wind velocity | 35 ms−1 |
| Coverage area of a wind turbine (length × diameter), A | 1.4 m × 1.2 m |
| Blades | 5 |
| Product life | 20 years |
| Parameters | Values |
|---|---|
| Rated power [54] | 300 W |
| Maximum voltage [54] | 36 V |
| Maximum current [54] | 8.33 A |
| Module size | |
| Size of module [54] | 1956 × 992 × 50 mm |
| Area of a solar PV panel | 1.94 m2 |
| Percentage of active area of a solar PV panel [55] | 75% |
| Active area of a solar PV panel, Acells | 1.455 m2 |
| Total number of the solar PV panels | 112 (84 on double-sloped roof and 28 on V-shape roof) |
| Total effective areas of the solar PV panels, As | 157.14 m2 |
| Life cycle | 20 years |
| Parameters | Values |
|---|---|
| Shadow influence factor, K [58] | 69.4% |
| Influence factor of dip angle and direction of solar PV panel, [55] | 0.95 |
| Module conversion efficiency, ηps [55] | 15% |
| System performance ratio, PR [55,59] | 71.8% |
| Elements | Dimensions |
|---|---|
| Air density, | 1.225 kg/m3 |
| Rotor efficiency, | 0.4 |
| Wind turbine efficiency, | 0.8 |
| Loss factor in wind direction, | 0.9 |
| Coverage area of the blades, | 1.4 m × 1.2 m |
| Item | Unit | Value |
|---|---|---|
| Local carbon dioxide emission factor for power generation (Malaysia), | kg/kW h | 0.726 [60] |
| Electric energy consumed by producing unit power solar photovoltaic panel, | kW h/kW | 2525 [61] |
| Total capacity of the solar energy system, | kW | 33.6 |
| Total weight of the solar energy system, | kg | 2968 (26.5 kg/PV panel × 112) [62] |
| Carbon dioxide emission intensity of the transportation, | Kg/t·km | 0.12 [63] |
| Distance between the solar PV panel manufacturer location and the project site, | km | 339 * |
| Weight of the ith material, * (*Assuming that only the industrial aluminum profile bracket structure is used for the installation of the solar PV panels, and an inclined roof solar panel structure is adopted for installation) | kg | 876.28 ** [64] |
| Carbon dioxide emission coefficient of the ith material (industrial aluminum profile), | kg/kg | 2.148 *** [65] |
| Ratio of operating and maintenance carbon cost of the solar energy system versus its initial carbon investment, | 5% [66,67] | |
| Life of the solar PV system, n | year | 20 |
| Component | Item | Main Manufacturing Materials |
|---|---|---|
| Rotors | Blade | Aluminum alloy |
| Hub | Aluminum alloy | |
| Nacelle | Generator | Mild steel, copper, lubricant, silica |
| cover | Aluminum alloy, epoxy resin | |
| Supporting Structure | Main shaft | Stainless steel |
| bracket | Mild steel | |
| Others | Transformer | Mild steel, copper, lubricant, silica |
| Gearbox | Carbon steel, iron |
| Material | Aluminum Alloy | Mild Steel | Stainless Steel | Epoxy Resin | Copper | Polyester | Others (Carbon Fiber, etc.) |
|---|---|---|---|---|---|---|---|
| Quality, (t) | 0.04 × 72% | 0.04 × 9% | 0.04 × 7% | 0.04 × 4% | 0.04 × 2% | 0.04 × 1% | 0.04 × 5% |
| Carbon dioxide emission coefficient, (t CO2 eq/t) | 14.4 | 2.3 | 4.7 | 4.4 | 5.1 | 3.94 | 3.07 |
| Item | Unit | Value |
|---|---|---|
| Total weight of the wind energy system, | t | 0.18 (6 wind turbines) |
| Carbon emission intensity during the transportation, | kg/t·km | 0.12 [63] |
| Distance between the wind turbine manufacturer location and wind power plant, | km | 8.2 * |
| Item | Unit | Value |
|---|---|---|
| Weight of the crane, | t | 3.9 * |
| Carbon dioxide emission intensity of the transportation, | Kg/t·km | 0.12 [63] |
| Distance between the location of the crane and the project site, | km | 8.2 ** |
| Mass of carbon dioxide emission per hour by the working crane, | Kg CO2 e/hr | 5 [77] |
| Working hour of the crane, | hr | 1 |
| Item | Value (USD) |
|---|---|
| Solar PV panels [58] | $27,000.00 |
| Wind turbines [58] | $3600.00 |
| VRGV [58] | $5000.00 |
| Grid-Connected inverter * [79] | $4400.00 |
| Grid-tie controller (including dump load) * [80] | $2300.00 |
| Installation cost [58] | $2000.00 |
| Estimated initial capital cost ** | $44,300.00 |
| Operating and maintenance cost per kW h of solar energy system [81] | $0.011 |
| Operating and maintenance cost per kW h of wind energy system [82,83] | $0.029 |
| Item | Unit | Value |
|---|---|---|
| FiT rates of renewable energy generation, | USD/kW h | 0.20 [84] |
| Carbon trading price, | USD/kg | 0.012 [85,86] |
| Category | Item | Value |
|---|---|---|
| Cost | Inflation rate of inverter price | 2.13% |
| Inflation rate of controller price | 2.13% | |
| Inflation rate for operating and maintenance cost | 2.13% | |
| Inflation rate of extra property tax | 2.13% | |
| Additional property tax | 2% | |
| Profit | Inflation rate of feed-in tariff [24] | 10% |
| Market discount factor [88] | 8% |
| Year | Capital Cost ($) | Operating and Maintenance Cost ($) | Inverter and Controller Replacement ($) | Income ($) | Annual Cash Flow ($) | Discounted Cash Flow ($) | Cumulative NPV ($) |
|---|---|---|---|---|---|---|---|
| 0 | −45,933.840 | −45,933.840 | −45,933.840 | −45,933.840 | |||
| 1 | −252.172 | 4832.672 | 4580.500 | 4241.203 | −41,692.637 | ||
| 2 | −257.501 | 5297.531 | 5040.030 | 4321.013 | −37,371.623 | ||
| 3 | −262.944 | 5808.877 | 5545.933 | 4402.540 | −32,969.083 | ||
| 4 | −268.503 | 6371.357 | 6102.854 | 4485.780 | −28,483.303 | ||
| 5 | −274.180 | 6990.085 | 6715.905 | 4570.732 | −23,912.571 | ||
| 6 | −279.978 | 7670.686 | 7390.708 | 4657.400 | −19,255.171 | ||
| 7 | −285.900 | 8419.347 | 8133.447 | 4745.788 | −14,509.383 | ||
| 8 | −291.947 | 9242.874 | 8950.927 | 4835.907 | −9673.476 | ||
| 9 | −298.124 | 10,148.754 | 9850.630 | 4927.767 | −4745.709 | ||
| 10 | −304.432 | −8271.954 | 11,145.221 | 2568.835 | 1189.868 | −3555.841 | |
| 11 | −310.874 | 12,241.336 | 11,930.462 | 5116.770 | 1560.930 | ||
| 12 | −317.454 | 13,447.062 | 13,129.608 | 5213.948 | 6774.877 | ||
| 13 | −324.174 | 14,773.360 | 14,449.187 | 5312.936 | 12,087.813 | ||
| 14 | −331.037 | 16,232.289 | 15,901.252 | 5413.757 | 17,501.570 | ||
| 15 | −338.046 | 17,837.110 | 17,499.064 | 5516.435 | 23,018.005 | ||
| 16 | −345.204 | 19,602.413 | 19,257.209 | 5620.996 | 28,639.001 | ||
| 17 | −352.515 | 21,544.247 | 21,191.732 | 5727.467 | 34,366.468 | ||
| 18 | −359.982 | 23,680.264 | 23,320.283 | 5835.878 | 40,202.346 | ||
| 19 | −367.607 | 26,029.883 | 25,662.276 | 5946.259 | 46,148.605 | ||
| 20 | −375.396 | 28,614.464 | 28,239.068 | 6058.641 | 52,207.247 | ||
| Net Present Value | 52,207.247 |
| Input Parameters (Solar Radiation) (kW h m−2) | Annual Power Output (MWh) | Annual Carbon Dioxide Emission Reduction (t) | Annual Low Carbon Benefit (t) | Accumulated NPV (20 Years) (USD) |
|---|---|---|---|---|
| 133.119 | 18.522 | 13.447 | 10.000 | 39,598.765 |
| 174.656 | 24.083 | 17.484 | 14.037 | 66,482.230 |
| Input Parameters (Wind Speed) (m/s) | Annual Power Output (MWh) | Annual Carbon Dioxide Emission Reduction (t) | Annual Low Carbon Benefit (t) | Accumulated NPV (20 Years) (USD) |
|---|---|---|---|---|
| 2.700 | 20.739 | 15.057 | 11.610 | 50,401.809 |
| 4.075 | 21.487 | 15.600 | 12.153 | 53,795.838 |
| Input Parameters (Cost Price Inflation Rate) | Annual Power Output (MWh) | Annual Carbon Dioxide Emission Reduction (t) | Annual Low Carbon Benefit (t) | Accumulated NPV (20 Years) (USD) |
|---|---|---|---|---|
| 0.98% | 21.130 | 15.340 | 11.894 | 52,880.810 |
| 3.79% | 21.130 | 15.340 | 11.894 | 51,092.459 |
© 2019 by the authors. Licensee MDPI, Basel, Switzerland. This article is an open access article distributed under the terms and conditions of the Creative Commons Attribution (CC BY) license (http://creativecommons.org/licenses/by/4.0/).
Share and Cite
Wang, X.; Chong, W.; Wong, K.; Lai, S.; Saw, L.; Xiang, X.; Wang, C.-T. Preliminary Techno–Environment–Economic Evaluation of an Innovative Hybrid Renewable Energy Harvester System for Residential Application. Energies 2019, 12, 1496. https://doi.org/10.3390/en12081496
Wang X, Chong W, Wong K, Lai S, Saw L, Xiang X, Wang C-T. Preliminary Techno–Environment–Economic Evaluation of an Innovative Hybrid Renewable Energy Harvester System for Residential Application. Energies. 2019; 12(8):1496. https://doi.org/10.3390/en12081496
Chicago/Turabian StyleWang, Xiaohang, Wentong Chong, Kokhoe Wong, Saihin Lai, Liphuat Saw, Xianbo Xiang, and Chin-Tsan Wang. 2019. "Preliminary Techno–Environment–Economic Evaluation of an Innovative Hybrid Renewable Energy Harvester System for Residential Application" Energies 12, no. 8: 1496. https://doi.org/10.3390/en12081496
APA StyleWang, X., Chong, W., Wong, K., Lai, S., Saw, L., Xiang, X., & Wang, C.-T. (2019). Preliminary Techno–Environment–Economic Evaluation of an Innovative Hybrid Renewable Energy Harvester System for Residential Application. Energies, 12(8), 1496. https://doi.org/10.3390/en12081496