Article

A Dynamic Rotor Vertical-Axis Wind Turbine with a Blade Transitioning Capability

School of Engineering, Lebanese American University, P.O. Box 36, Byblos 1102, Lebanon
*
Author to whom correspondence should be addressed.
Energies 2019, 12(8), 1446; https://doi.org/10.3390/en12081446
Submission received: 14 March 2019 / Revised: 3 April 2019 / Accepted: 9 April 2019 / Published: 16 April 2019
(This article belongs to the Section A3: Wind, Wave and Tidal Energy)

Abstract

:
This work presents an optimized design of a dynamic rotor vertical-axis wind turbine (DR VAWT) which maximizes the operational tip-speed ratio (TSR) range and the average power coefficient (Cp) value while maintaining a low cut-in wind velocity. The DR VAWT is capable of mimicking a Savonius rotor during the start-up phase and transitioning into a Darrieus one with increasing rotor radius at higher TSRs. The design exploits the fact that with increasing rotor radius, the TSR value increases, where the peak power coefficient is attained. A 2.5D improved delayed detached eddy simulation (IDDES) approach was adopted in order to optimize the dynamic rotor design, where results showed that the generated blades’ trajectories can be readily replicated by simple mechanisms in reality. A thorough sensitivity analysis was conducted on the generated optimized blades’ trajectories, where results showed that they were insensitive to values of the Reynolds number. The performance of the DR VAWT turbine with its blades following different trajectories was contrasted with the optimized turbine, where the influence of the blade pitch angle was highlighted. Moreover, a cross comparison between the performance of the proposed design and that of the hybrid Savonius–Darrieus one found in the literature was carefully made. Finally, the effect of airfoil thickness on the performance of the optimized DR VAWT was thoroughly analyzed.

1. Introduction

The current energy crisis and environmental damage caused by conventional thermal power plants are the main drivers for the development of efficient systems to harvest different renewable energy resources. Being greatly abundant, cheap, and most importantly clean, wind energy is one of the most attractive research areas in the renewable energy field [1,2]. The performances of wind turbines have drastically improved over the past few decades; until recently, these devices became an integral part of several countries’ power generation systems [3]. Recent studies have shown that the wind energy capacity on a global level has exceeded 500 GW in the past couple of years, with countries like Denmark, Germany, Ireland, Portugal, Spain, Sweden, and Uruguay producing more than 10% of their energy from wind [4]. Generally, wind turbines are categorized as horizontal-axis wind turbines (HAWTs), or vertical-axis wind turbines (VAWTs) depending on their axis of rotation [5]. Horizontal-axis wind turbines are usually more efficient, and are used for power production on a national level [6]. However, these turbines require complex yaw mechanisms and intricate blade manufacturing techniques, which make them much more expensive [7]. On the other hand, VAWTs are attributed with much better performances in urban areas due to their distinctive abilities to operate in multidirectional wind flows [8]. They also have simple blade designs, which render their maintenance easier and overall cost lower [9].
Savonius is one of the simplest types of VAWTs, with its rotor consisting of several semi-circular blades. It is a drag type turbine, and compared with other VAWTs, its performance peaks at relatively lower TSRs [10]. This turbine is distinctively attributed with decent self-starting characteristics as a consequence of the large static torque it generates, and this is one of its main traits which attracts researchers [11]. There have been numerous attempts to capitalize on the aforementioned characteristics, and further improve the efficiencies of Savonius VAWTs using experimental and numerical techniques. Ferrari et al. [12] carried numerical investigations and assessed the influence of rotor height on the performance of a Savonius VAWT. It was shown that the efficiency of the turbine improved with increased rotor height up to an asymptotic limit [12]. Light was also shed on the importance of 3D computational fluid dynamics (CFDs), which yielded results in close agreement with experimental data. Despite its reduced computational cost, 2D CFDs resulted in overestimated power coefficient values, and a shift in the Cp curve relative to experimental data [12]. Kamoji et al. [13] tested a helical Savonius turbine with a 90° twist angle using wind tunnel measurements. Contrary to the performance of a conventional Savonius rotor, the presented design generated positive static torque irrespective of the rotor position, thereby, massively boosting the turbine’s start-up characteristics. With the aim of designing a Savonius turbine with a directed discharge flow capability, Tahani et al. [14] studied the performance of a twisted Savonius turbine with a conical shaft. Compared to a conventional Savonius turbine, increases of 18% and 31% were reported in the power coefficient and discharge flow rate values, respectively. Roy and Ducoin [15] presented a novel first-stage Savonius rotor design, where a notable performance improvement was attributed to an increased moment arm and lift contributions over the entire TSR range. The use of shielding plates or curtains installed on the periphery of a Savonius rotor has also been shown to yield massive performance improvements according to several published studies [16,17,18]. For instance, Antar and Elkhoury [19] carried out a parametric optimization process to size a suitable rotor casing design (three guide plates) for a two-bladed Savonius turbine. The optimization process was carried out at four different TSRs, where 3D delayed detached eddy simulation (DDES) based on the Spalart Allmaras (SA) turbulence model [20] resulted in a maximum efficiency increase of 42.5% at TSR = 0.59. Overall, it was shown that the turbine’s efficiency dramatically improved especially at an off-peak TSR range.
The straight-bladed Darrieus type turbine is another common type of VAWTs, which consists of different numbers of straight blades with particular airfoil sections. Compared to the Savonius VAWT, this lift-based turbine attains its peak performance efficiency at relatively higher TSRs [21]. Attempts to boost this turbine’s performance are numerous, for instance, Wang and Zhuang [22] adopted sinusoidal leading-edge serrations on a straight-bladed vertical-axis wind turbine (SB-VAWT) with different geometrical features, to avert the detrimental consequences of dynamic stall. After successfully conducting thorough 3D numerical simulations, it was shown that the power coefficient values increased especially at low- and mid-TSR values for serrations of wave amplitude and wavelength at 2.5% and 33% the chord length (c), respectively. Flow separation was controlled especially at lower TSRs and Reynolds numbers (Re), where a maximum of 50% performance enhancement was reported at a freestream wind velocity ( V ) equal to 3 m/s. Kumar et al. [23] utilized truncated NACA 0018TC-39 airfoils to enhance the start-up characteristics and performance of a SB-VAWT with three blades. Wind tunnel measurements showed a substantial performance improvement for the turbine with truncated airfoils at lower Re, mainly due to manifested lift characteristics. It was also reported that the turbine’s cut-in speed was reduced from V = 4 m/s to V = 2 m/s. With a similar goal of optimizing the start-up phase of a SB-VAWT. Asr et al. [24] conducted 6-DOF transient numerical simulations to assess the turbine’s performance with different airfoil sections and pitch angles. Validating the obtained results versus published experimental data, it was shown that the cambered NACA 2418 airfoil shape with a positive pitch angle of 1.5° reduced the start-up time by 27%. Elkhoury et al. [25] were able to successfully replicate the generated experimental data by conducting large eddy simulations (LES) to analyze the performance of a variable-pitch SB-VAWT. It was shown that the high-solidity turbine with a variable-pitch mechanism and a NACA 0018 airfoil section performed substantially better than the fixed-pitch turbine.
The goal of the present study is to exploit the aforementioned distinctive start-up characteristics of the Savonius rotor, and the decent efficiency of the Darrieus rotor in order to maximize the operational TSR range and the average power coefficient value while maintaining a low cut-in speed. This was accomplished by generating a dynamic rotor vertical-axis wind turbine (DR VAWT) design that is capable of mimicking a Savonius rotor during the start-up phase and lower TSRs, and transitioning via optimized blades trajectories to a Darrieus rotor with increasing radii at higher TSRs. In this framework, the influences of the rotor radius, blade pitch angle, Reynolds number, blades’ trajectories, and airfoil thickness were assessed by conducting a thorough sensitivity analysis on the optimized design. Improved delayed detached eddy simulation (IDDES), which relies on LES away from the wall and reverts to SST k ω for near wall turbulence modeling, was employed to generate all the required data. A 2.5D geometry was utilized, with a domain’s height equal to 0.15 c, and periodic upper and lower boundary conditions, where blade-tip effects were not accounted for in order to considerably lower the computational cost without sacrificing much accuracy. To the best of the authors’ knowledge, a dynamic VAWT that operates at the maximum efficiency or power output has not been proposed or analyzed in the literature before.

2. Geometry and Coordinate Systems

Before discussing the dynamic rotor concept, it is important to define two independent coordinate systems for the Savonius and Darrieus rotor types due to their distinctive geometries. Setting this common ground will aid in presenting the generated results in a clear manner. Figure 1 presents the coordinate systems used for the Savonius configurations and the Darrieus configurations. These are further described in the following sections.

2.1. Savonius Rotor

From an engineering point of view, it is always desirable to come up with a mechanically feasible design, where solid-body deformations are avoided. Hence, as can be seen from Figure 1, two blades with symmetrical airfoil sections were utilized to mimic the shape of a single conventional semi-circular Savonius blade. In total, four blades, each composed of a NACA 0021 airfoil section with c = 0.265 m were utilized to yield a two-bladed Savonius rotor with no blade overlap, as seen in Figure 2. One end of the Savonius blade was constrained to coincide with the origin, while the other one was forced to coincide with the vertical axis. Hence, only one extra parameter was needed to fully define the Savonius geometry. This parameter was taken to be the Savonius angle ( θ s ), defined as the angle between the blade’s chord and the horizontal axis (Figure 1). A demonstration of the geometrical effects resulting from selecting different values for θ s is shown in Figure 2.

2.2. Darrieus Rotor

The blades of the Darrieus configurations were spatially unconstrained, and as a result, three independent geometrical parameters were required to define the exact location of a single blade. The coordinate system shown in Figure 1 (green) was utilized for every blade of the Darrieus rotor, where coordinates x and y were used to determine the location of a blade’s center, and the blade pitch angle (β) was used to fix the blade’s angular orientation at a given radius. Throughout this study, appropriate values for xi, yi, and β i ( i = blade number = ( 1 , 2 , 3 , 4 ) ) such that all four blades of the Darrieus rotor have the same radii (R) and pitch angles.

3. Dynamic Rotor Concept

For a Savonius VAWT, the maximum Cp is attained at relatively low TSRs compared to a Darrieus turbine. From here emerged the concept of a dynamic rotor which is based on the transition from a Savonius rotor at low TSRs, to a Darrieus one with increasing rotor radius at high TSRs. Therefore, this dynamic rotor design has the capability to operate at the peak locations of all Cp curves associated with different rotor radii during the transitioning process. Hence, in this way, the operational TSR range and average power coefficient are maximized for a given maximum rotor radius (Rfinal) set in this study to 1 m. It was important to generate practical blade trajectories that could be physically replicated, rather than randomly directed ones that would render this idea infeasible. Hence, during this study, when moving from the initial Savonius shape to the final Darrieus one at Rfinal = 1 m, the center of each blade was constrained to move along a straight path (Figure 3). Thus, a simple mechanism could be used in this case, composed for example of a rack and a pinion to translate the blade along the path. Owing to the symmetry of the Savonius rotor, the centers of blades 1 and 3 had paths with equivalent slopes, and the same applied for blades 2 and 4 as depicted in Figure 3. In order to determine the exact equations for the paths of the blades’ centers, the following scheme was followed: Starting with the Savonius position (Figure 3, blue), the Savonius angle ( θ s ) was first optimized by generating several Cp curves with different values of θ s . In this way, the optimal value for the Savonius radius (Rs) was determined. Then, with no variation in their angular orientations, the blades were translated from the optimized Savonius configuration to the final Darrieus one, in such a way that would yield the desired value of β at Rfinal. Depending on the chosen final β value, the blades would have to follow different paths since their angular orientation is kept fixed. Hence, after generating several Cp curves pertaining to different values of β at Rfinal, the optimal value for the pitch angle at the Rfinalopt,f), and the paths of the blades’ centers were determined. At this stage, the constraint on fixing the blades’ angular orientations was eliminated, and the transitioning process was discretized into three optimization stages of different radii (R1, R2, and R3) shown in green in Figure 3. At a certain radius or optimization stage, the pitch angle was equal for all the blades, and was optimized by generating different Cp curves with different values of β until further alterations resulted in a clear decaying trend in performance. It is worth noting that, unless the optimum value of θ s was determined to be 45°, the final Darrieus shape will not have a perfectly symmetrical rotor with equidistant blades. However, the distances between adjacent blades are anticipated to have a minimal effect, especially at higher radii as discussed later. The manner in which optimization stages (R1, R2, and R3) were chosen is presented in the results and discussion section, along with the optimal values for θ s and βopt,f that were used to generate the blades trajectories.

4. Flow Solver

The ANSYS Fluent, a commercial CFDs software was utilized to solve all the governing transient flow equations and generate the required data. The SIMPLE algorithm was used to solve the pressure–velocity coupling equation, and a second order upwind-based discretization scheme was used for all flow variables except momentum, where the Bounded Central Differencing scheme was selected. This was necessary to minimize numerical dissipation in order to resolve flow structure in the regions dominated with flow separation. Flow gradients were handled using the Green–Gauss node-based method. The standard interpolation scheme was used in calculating the cell–face pressures. A second order time-accurate formulation was used in transient computations. Furthermore, convective terms of the considered turbulence model were handled using a second-order upwind-based discretization scheme with minimum under-relaxation factors of 0.8.
The convergence criterion for all the scaled residuals was set equal to 1 × 10⁻³, and a maximum of 20 iterations was allowed per time-step. However, on average, the solution converged after the 5th iteration only. Finally, solution convergence was assumed to be reached when the difference between three successive torque coefficient (CT) values averaged over a rotor revolution was less than 1%. All computations were performed on the IBM HPC nextScale M5 with 112 cores of Intel(R)-Xeon(R)[email protected] GHz running with double precision at 4 Teraflops.

5. Numerical Setup

Improved delayed detached eddy simulation was adopted in this study owing to its accuracy and lower computational cost compared to large eddy simulations [26]. Combining the SST k ω model and delayed detached eddy simulation (DDES), IDDES is a convenient scale-resolving simulation model originally presented by Shur et al. [27], where most of the turbulence is resolved except near the wall. The IDDES turbulent-kinetic energy (TKE) transport equation is given by [28]:
( ρ k ) t + ( ρ u i k ) x j = x j [ ( μ + 1 σ μ t ) k x j ] + τ i j S i j ρ k 3 2 L I D D E S
with t: time, k: turbulent kinetic energy, ρ : density, uj: velocity, μ : viscosity, μ t : turbulent viscosity, τ i j : tensor stress, and Sij: mean strain rate. The IDDES length scale (LIDDES) is given by:
L I D D E S = f ˜ d ( 1 + f e ) L R A N S + ( 1 f ˜ d ) L L E S
with LRANS and LLES being the RANS and LES length scales, respectively, defined as:
L L E S = C D E S Δ ,       L R A N S = k 1 / 2 β * ω
with β * : S S T   k ω constant equal to 0.09, C w : empirical constant, Δ : grid scale = m i n { m a x { C w Δ m a x , C w d , Δ m i n } , Δ m a x } , d: distance to the nearest wall, Δ m i n = m i n { Δ x , Δ y , Δ z } , Δ m a x = m a x { Δ x , Δ y , Δ z } , and f ˜ d = m a x { ( 1 f d t ) ,   f B } [27].

5.1. 2.5D Computational Domain

A Quasi-3D domain was adopted where only a portion of the blades’ height was modelled, and blade-tip effects were not accounted for, unlike in full 3D simulations. This approach is usually referred to as 2.5D CFDs [29], where translational periodic boundary conditions are imposed on the two faces at the extremities of the domain. As a result, the computational costs were considerably lowered, without sacrificing much accuracy, since the generated 3D vortices are not neglected. Li et al. [29] compared three CFD techniques with experimental data pertaining to a Darrieus type VAWT. These were 2D unsteady Reynolds Averaged Navier–Stokes (URANS), 2.5D URANS, and 2.5D LES. It was shown that the 2.5D LES results were in close agreement with the experimental data despite not accounting for the tip vortices. Therefore, discrepancies between data generated from 2D simulations and experiments were attributed to the inaccurate modeling of vortices by URANS models, and not the omission of blade-tip effects. As a result, the IDDES model was utilized in the current study on a 2.5D domain with an extrusion height equal to 0.15 c.
The 2.5D computational domain was partitioned into two fluid zones with a sliding interface. The rotor domain, shown in red color in Figure 4, contained the walls of the turbine’s blades, and was rotated at a specified angular velocity ( ω ) relative to the wind tunnel domain. The dimensions of the utilized domain shown in Figure 4, as a function of the variable rotor diameter (D), exceed by far the minimum guidelines presented by Rezaeiha et al. [30] and Balduzzi et al. [31]. These guidelines on the minimum sizing of a VAWT computational domain were derived based on thorough numerical investigations. For instance, it was shown that the ratio of the rotor diameter to the domain’s width, also known as blockage ratio, should be greater than 5%, otherwise the generated power coefficient value would be influenced [29,31]. In addition, it was stated that the distance between the turbine’s center and the domain’s outlet should be at least 10D, in order to allow for the full development of the wake region behind the rotor, which would otherwise result in an underestimated Cp value, as shown by Rezaeiha et al. [30].
Figure 4 highlights the features of the adopted 2.5D mesh, which was generated using the sweep method with eight cell divisions. A total of 16 inflation layers with a first layer thickness of 2 × 10⁻⁵ m, and a growth rate of 1.3 were created in order to ensure that y + 1 . Proper edge- and face-sizing controls were utilized to ensure that complex flow structures were properly captured, and the resulting mesh metrics were within acceptable limits. The nodes on the interface were closely mapped in order to ensure flow continuity and aid in the convergence of the solution. Since this study involved a turbine with a variable radius, the domain size and consequently the number of elements varied from one configuration to another, specifically from 339,872 elements to 407,568 elements. Prior to generating all the required data, the mesh was refined by increasing its density by 1.6 times, and a minimal difference in the value of Cp was observed. Therefore, the selected mesh density was deemed appropriate.

5.2. Boundary Conditions

The inlet air velocity ( V ) was set to 8 m/s, with turbulence intensity (I) equal to 5%. This yielded a chord-based Reynolds number ( Re = ρ V c μ ) equal to 145,132, with ρ = 1.225 kg/m3 and μ = 1.7894 × 10⁻⁵ kg/(m·s). The outlet gauge pressure was set to 0 Pa, and a no-slip boundary condition was imposed on all the blades’ walls. A translational periodic boundary condition was set for the top and bottom extremities of the domain, where the fluid properties were expected to have a repeating pattern. This approach is usually followed in 2.5D analysis where tip effects are not taken into consideration and only a certain height of the blade is modelled. Moreover, a symmetry boundary condition was chosen for the two lateral bounding faces of the domain. Since the IDDES technique was adopted in the current study, the selected time-step size should yield a cell courant number (Co) close to unity, with the exception of the cells in the proximity of the blades’ walls. The cell courant number is given by:
Co = V Δ t Δ x
where V is the velocity of the fluid particle to be transported through a cell of dimension Δ x , and Δ t is the time-step size. After conducting initial studies, a time-step size that would result in a 0.5° rotor rotation was selected, since this yielded Co 1 for most of the domain’s cells.

6. Results and Discussion

6.1. Savonius Configurations

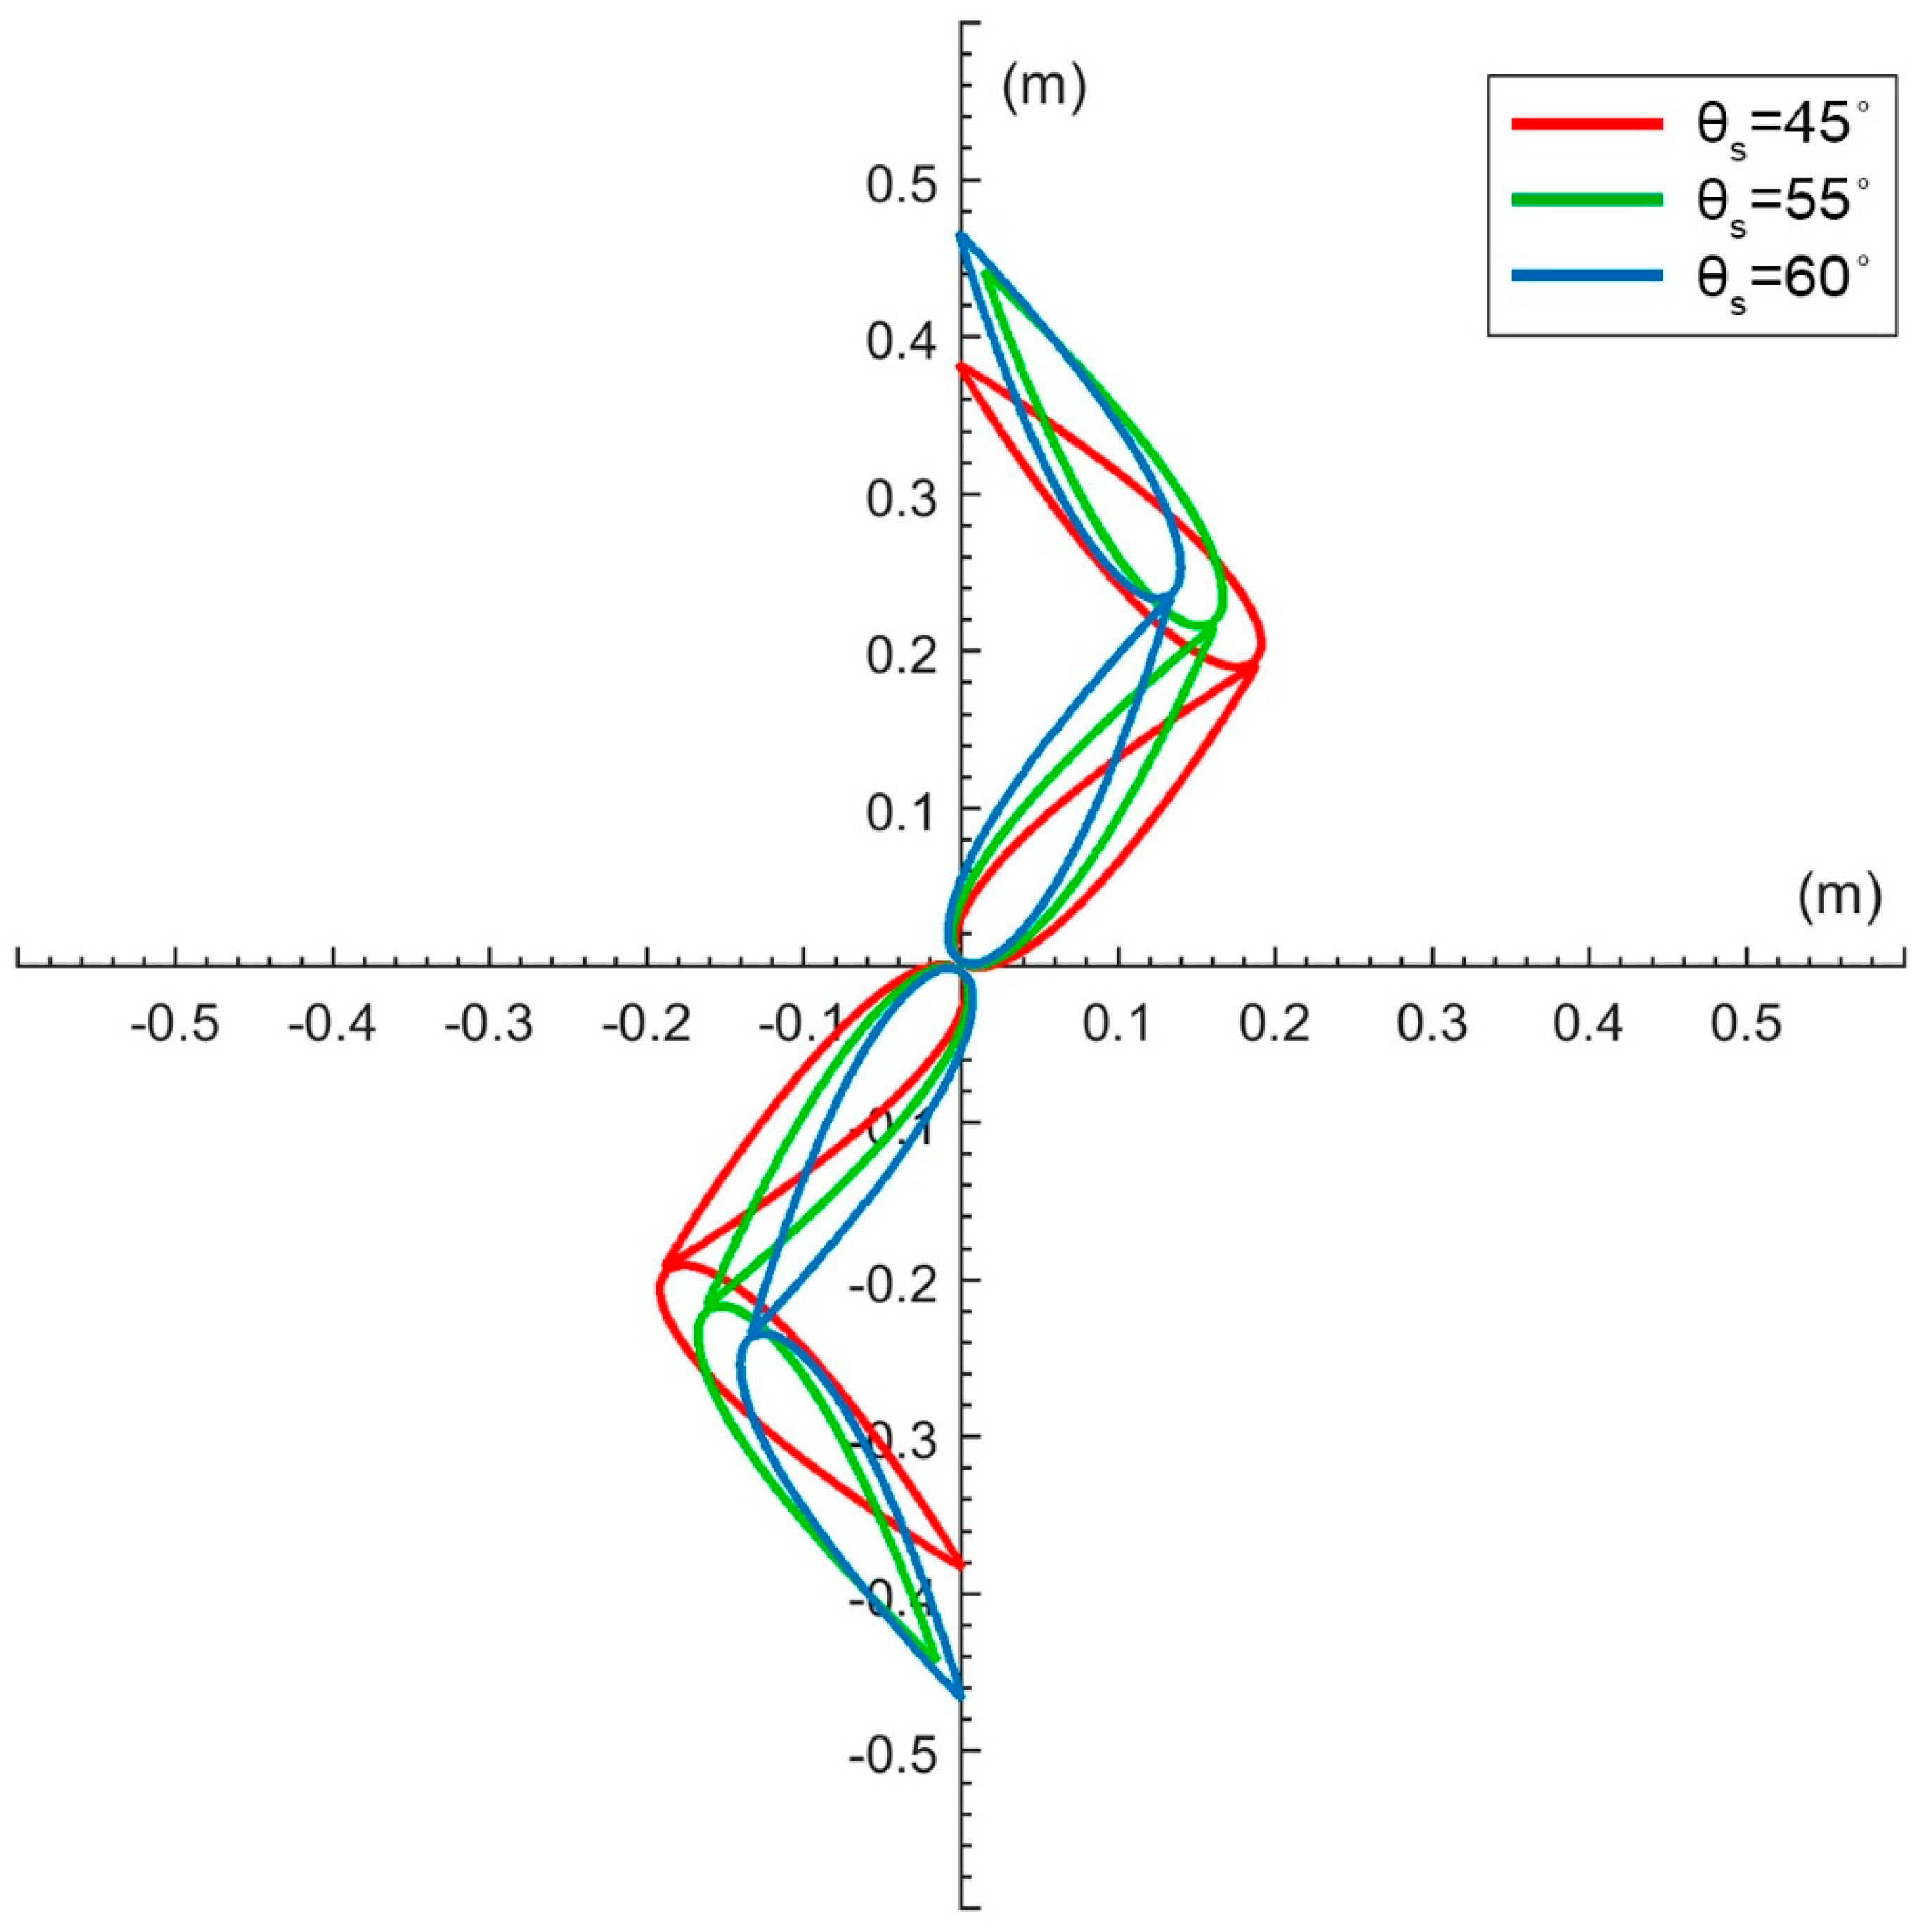
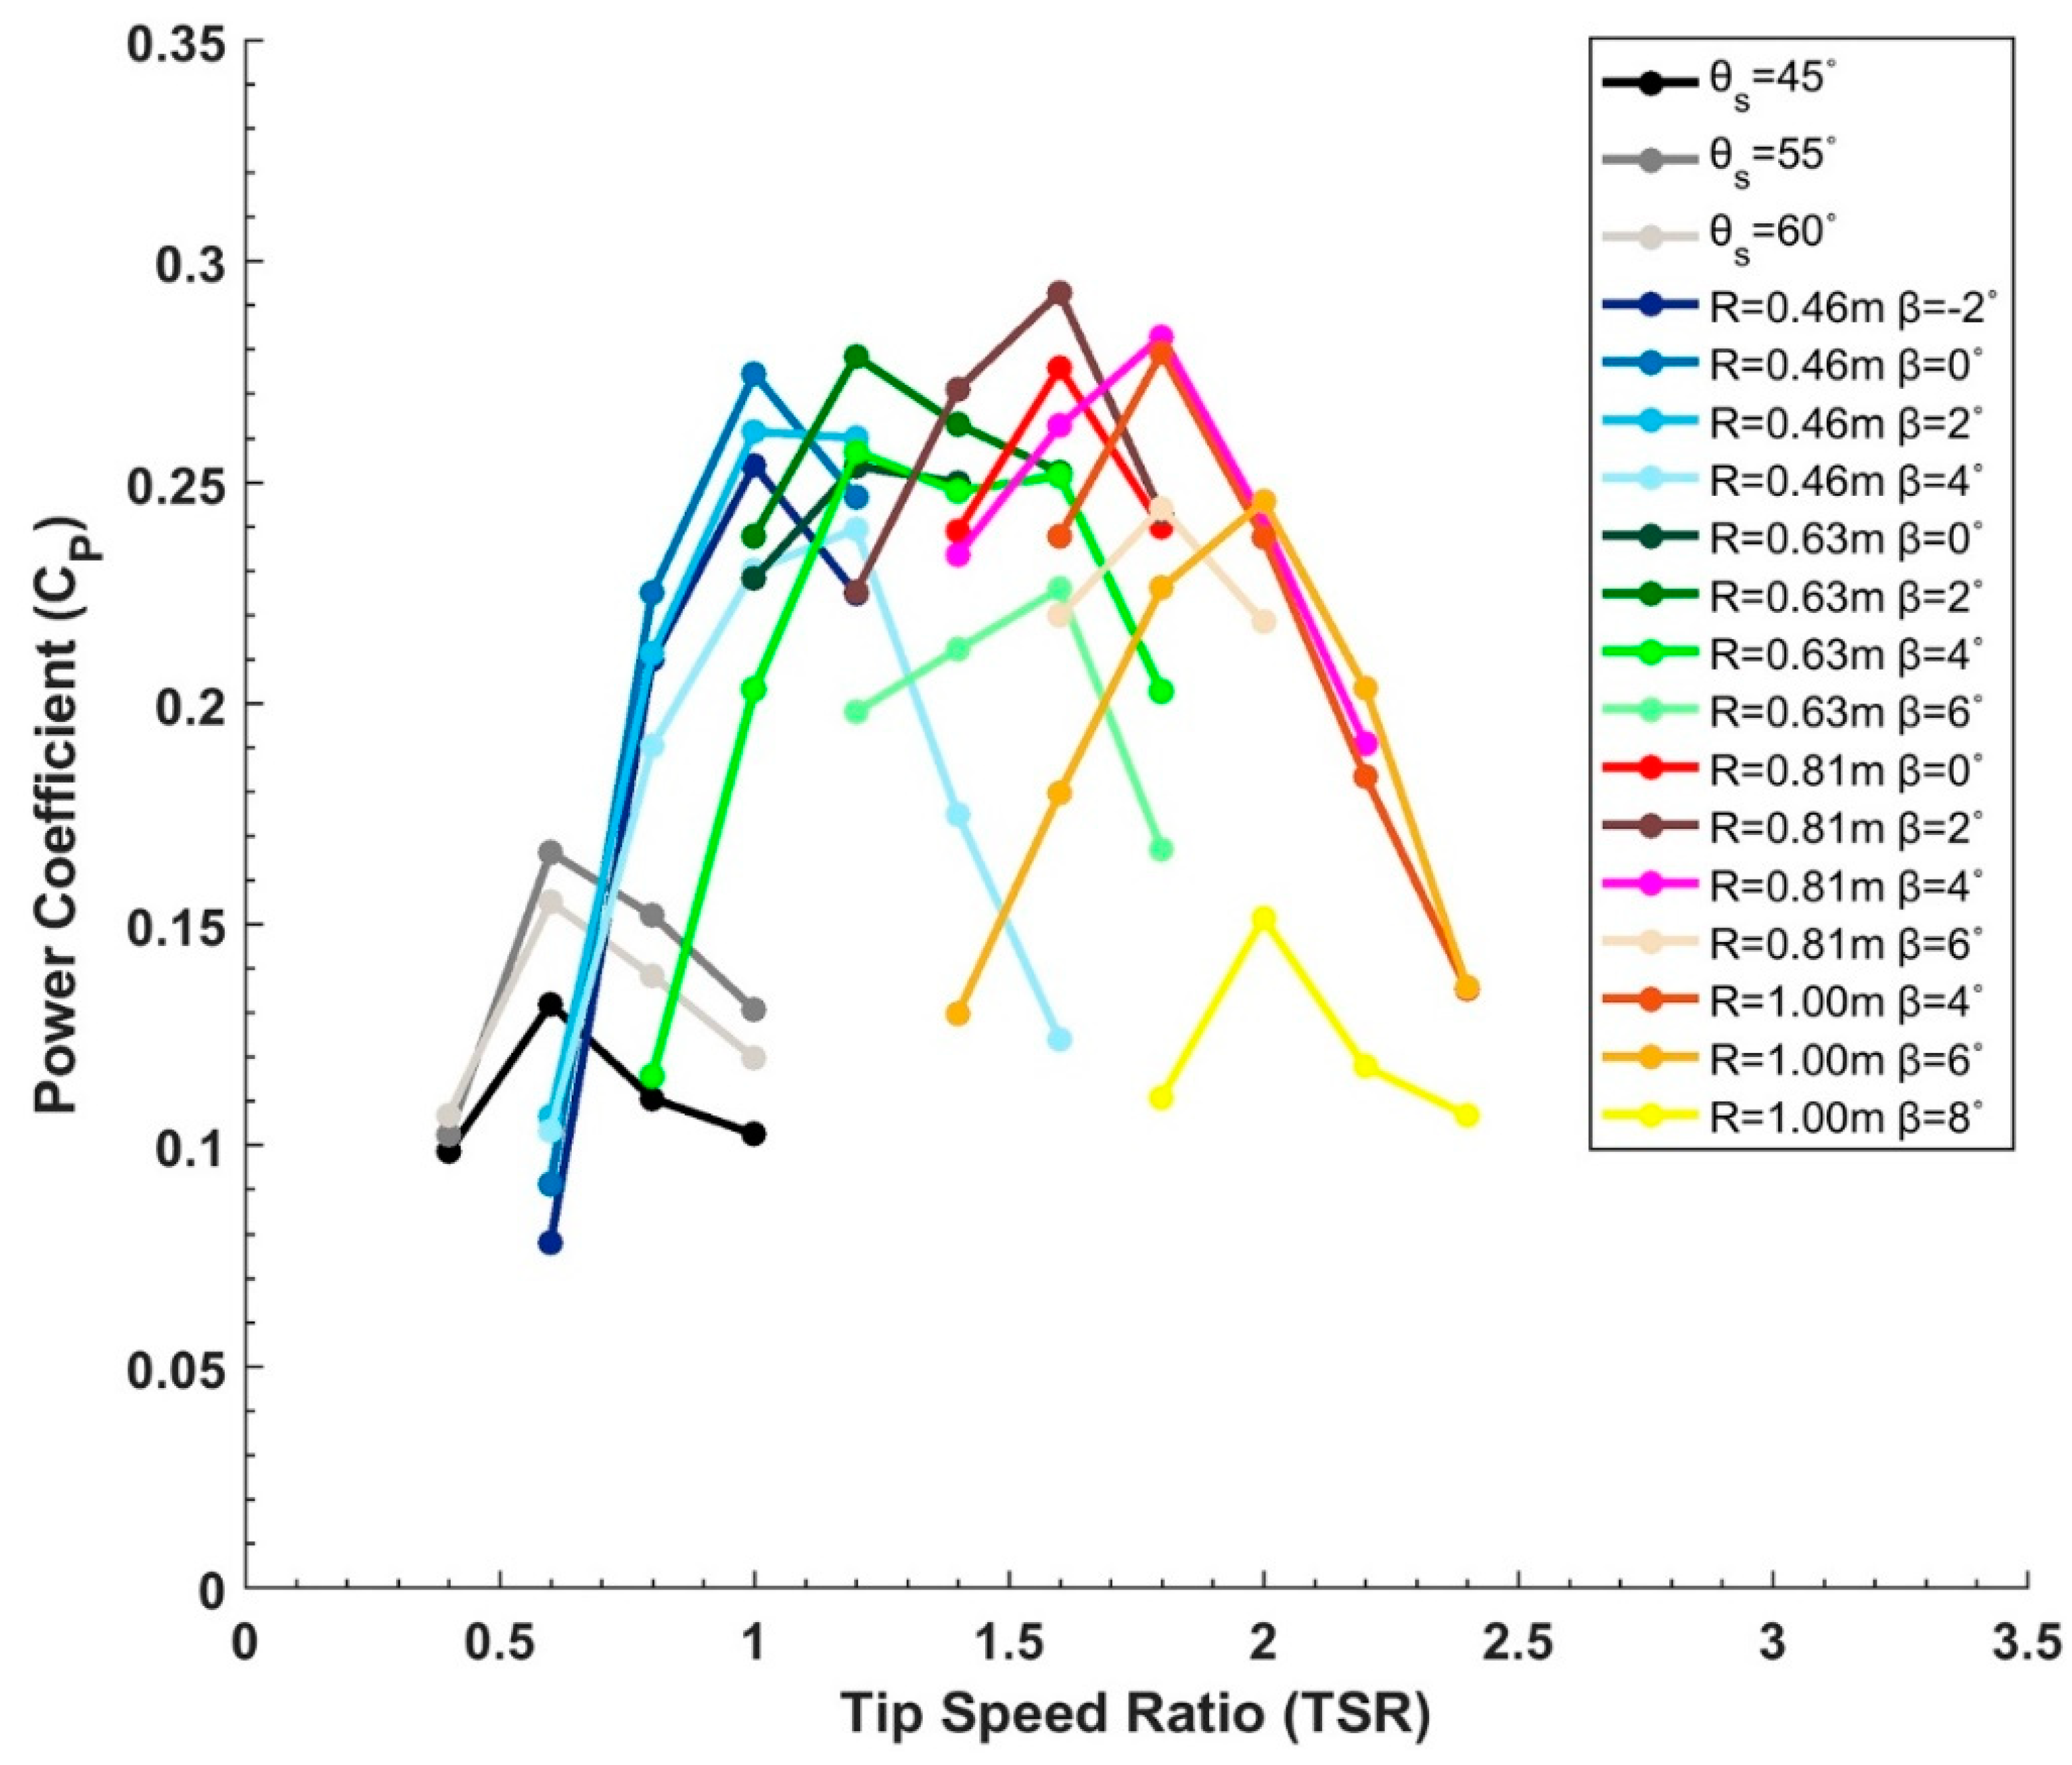
The first step in generating the optimal paths of the blades during the transition process was to find the optimal Savonius configuration. This was accomplished by generating different Cp curves with different values of θ s , as seen in Figure 5. It was evident that as the value of θ s increased from 45° to 55°, the Cp curve shifted upwards attaining a maximum Cp value of 0.166 at TSR = 0.6. However, with a further increase from θ s = 55° to θ s = 60°, the Cp curve exhibited a shift downwards. As a result, the optimal value for θ s was determined to be 55° yielding an optimum Rs of 0.441 m. 
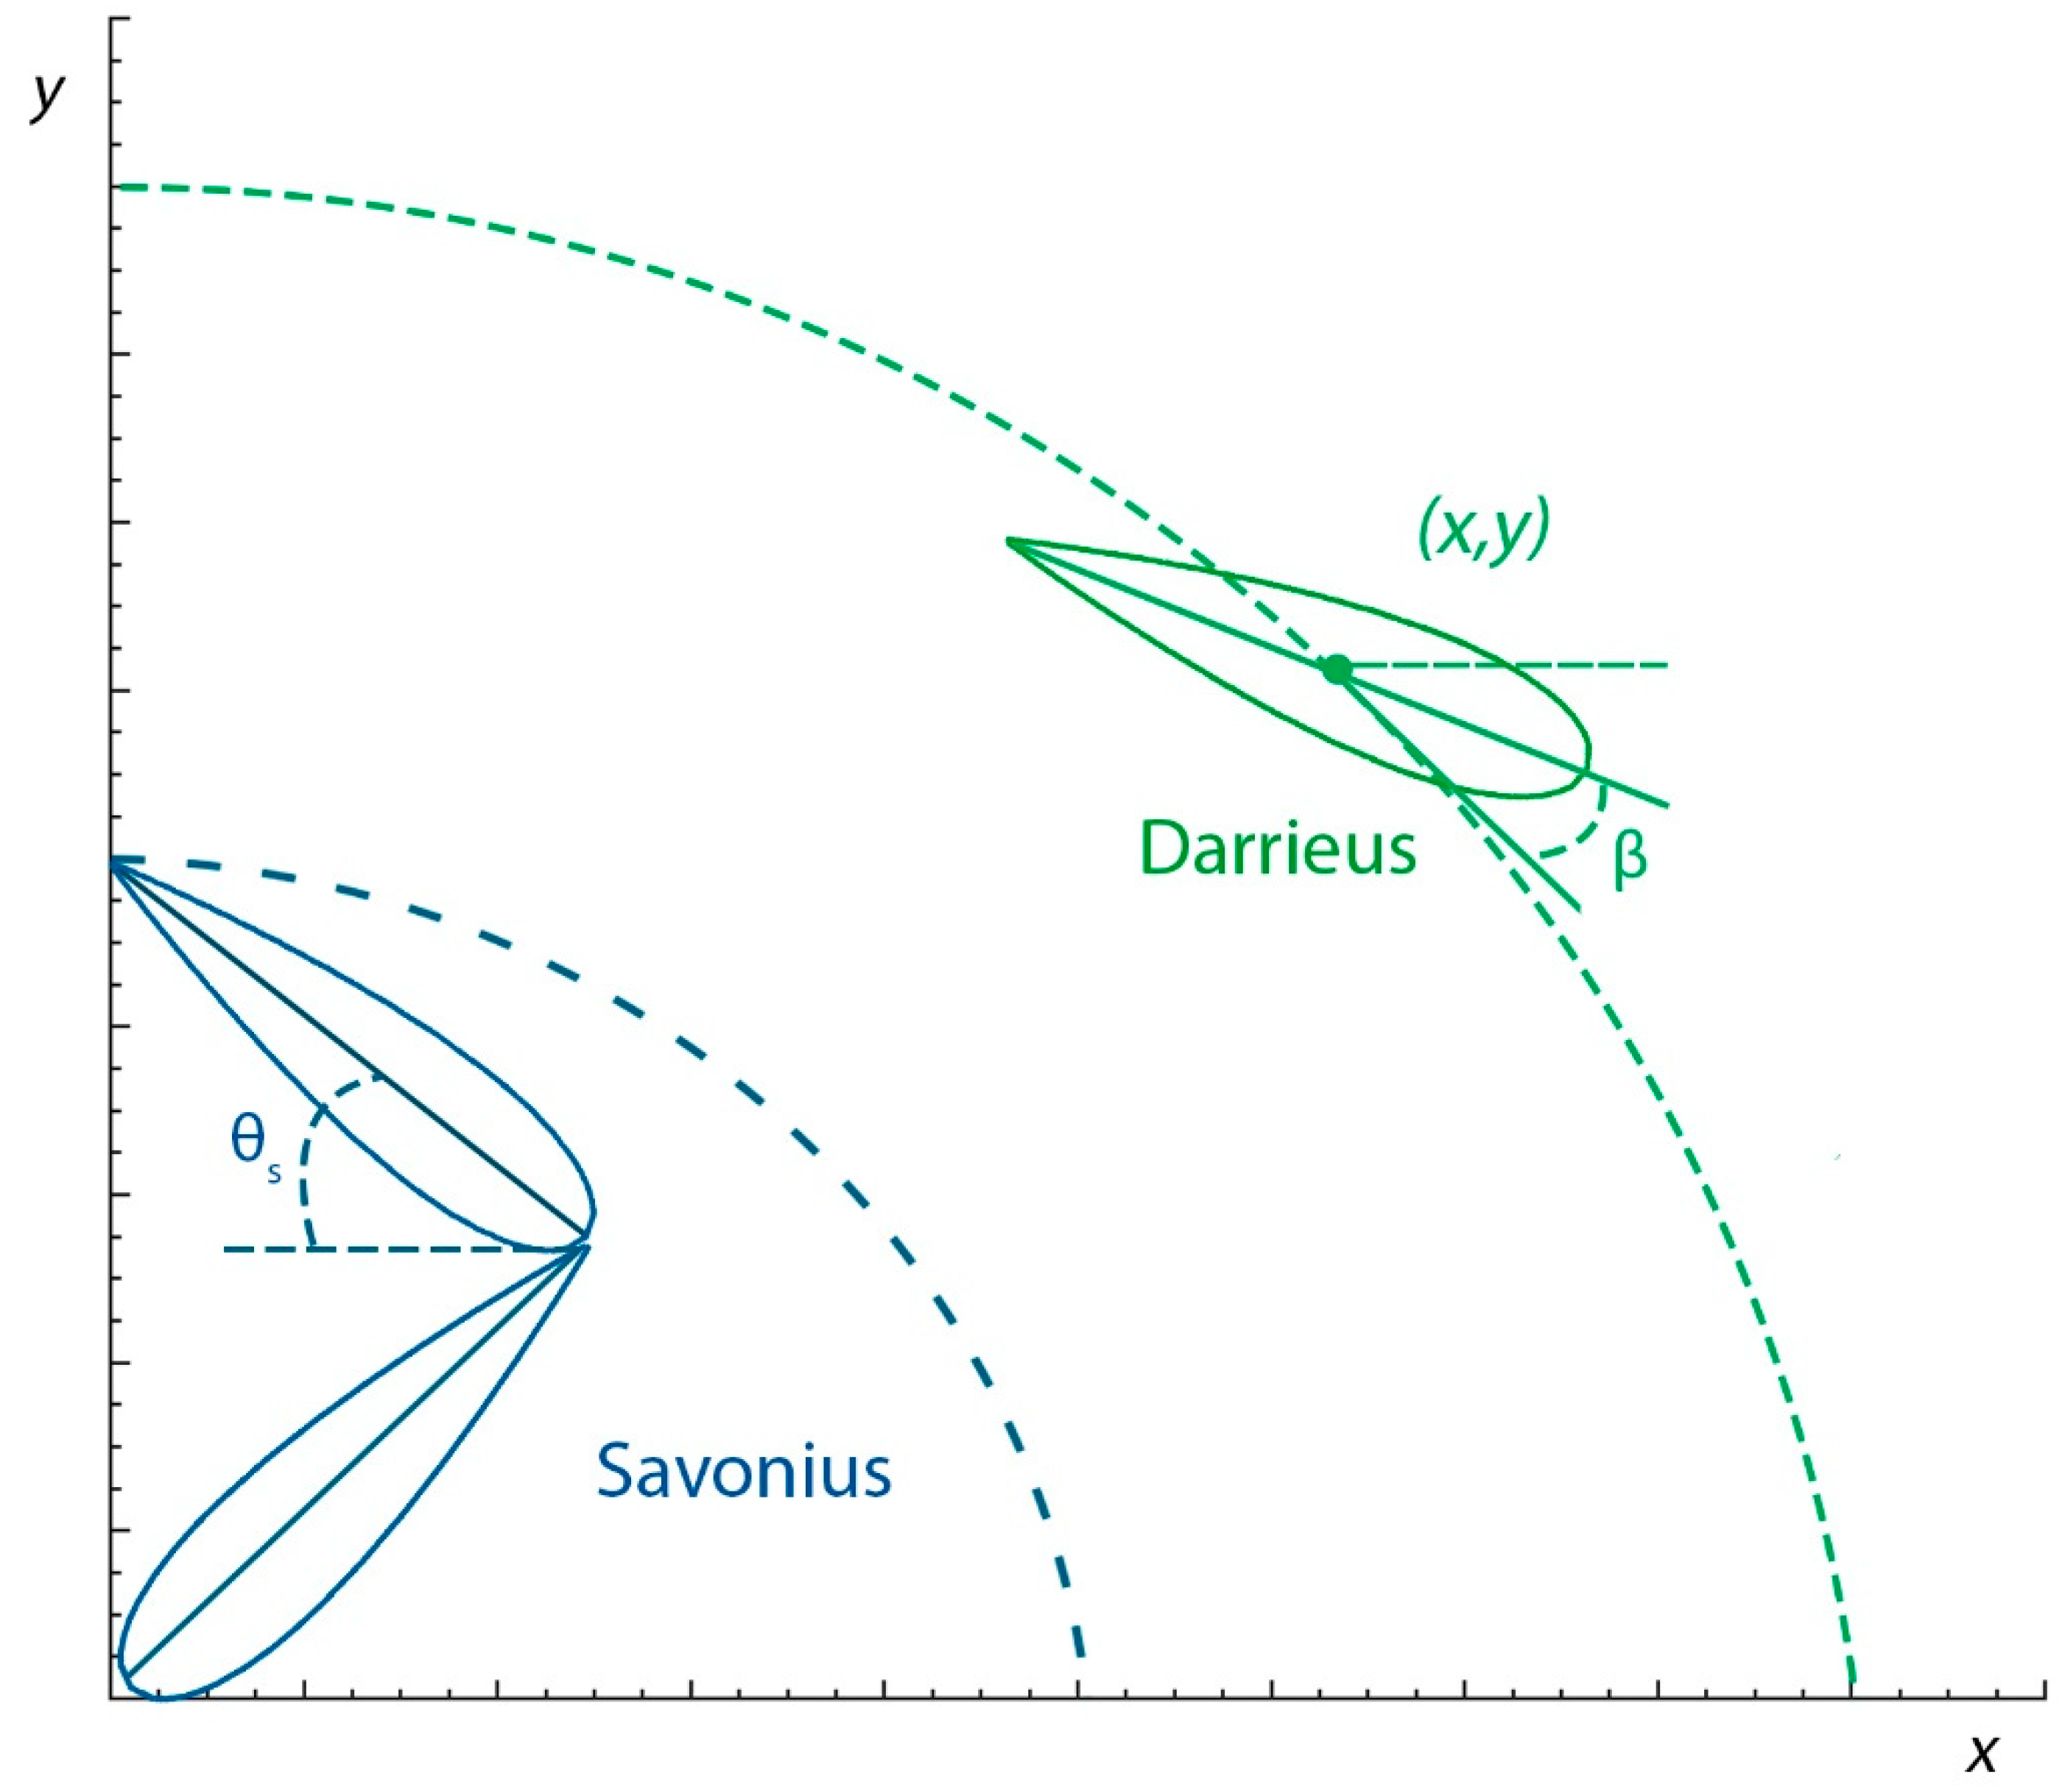
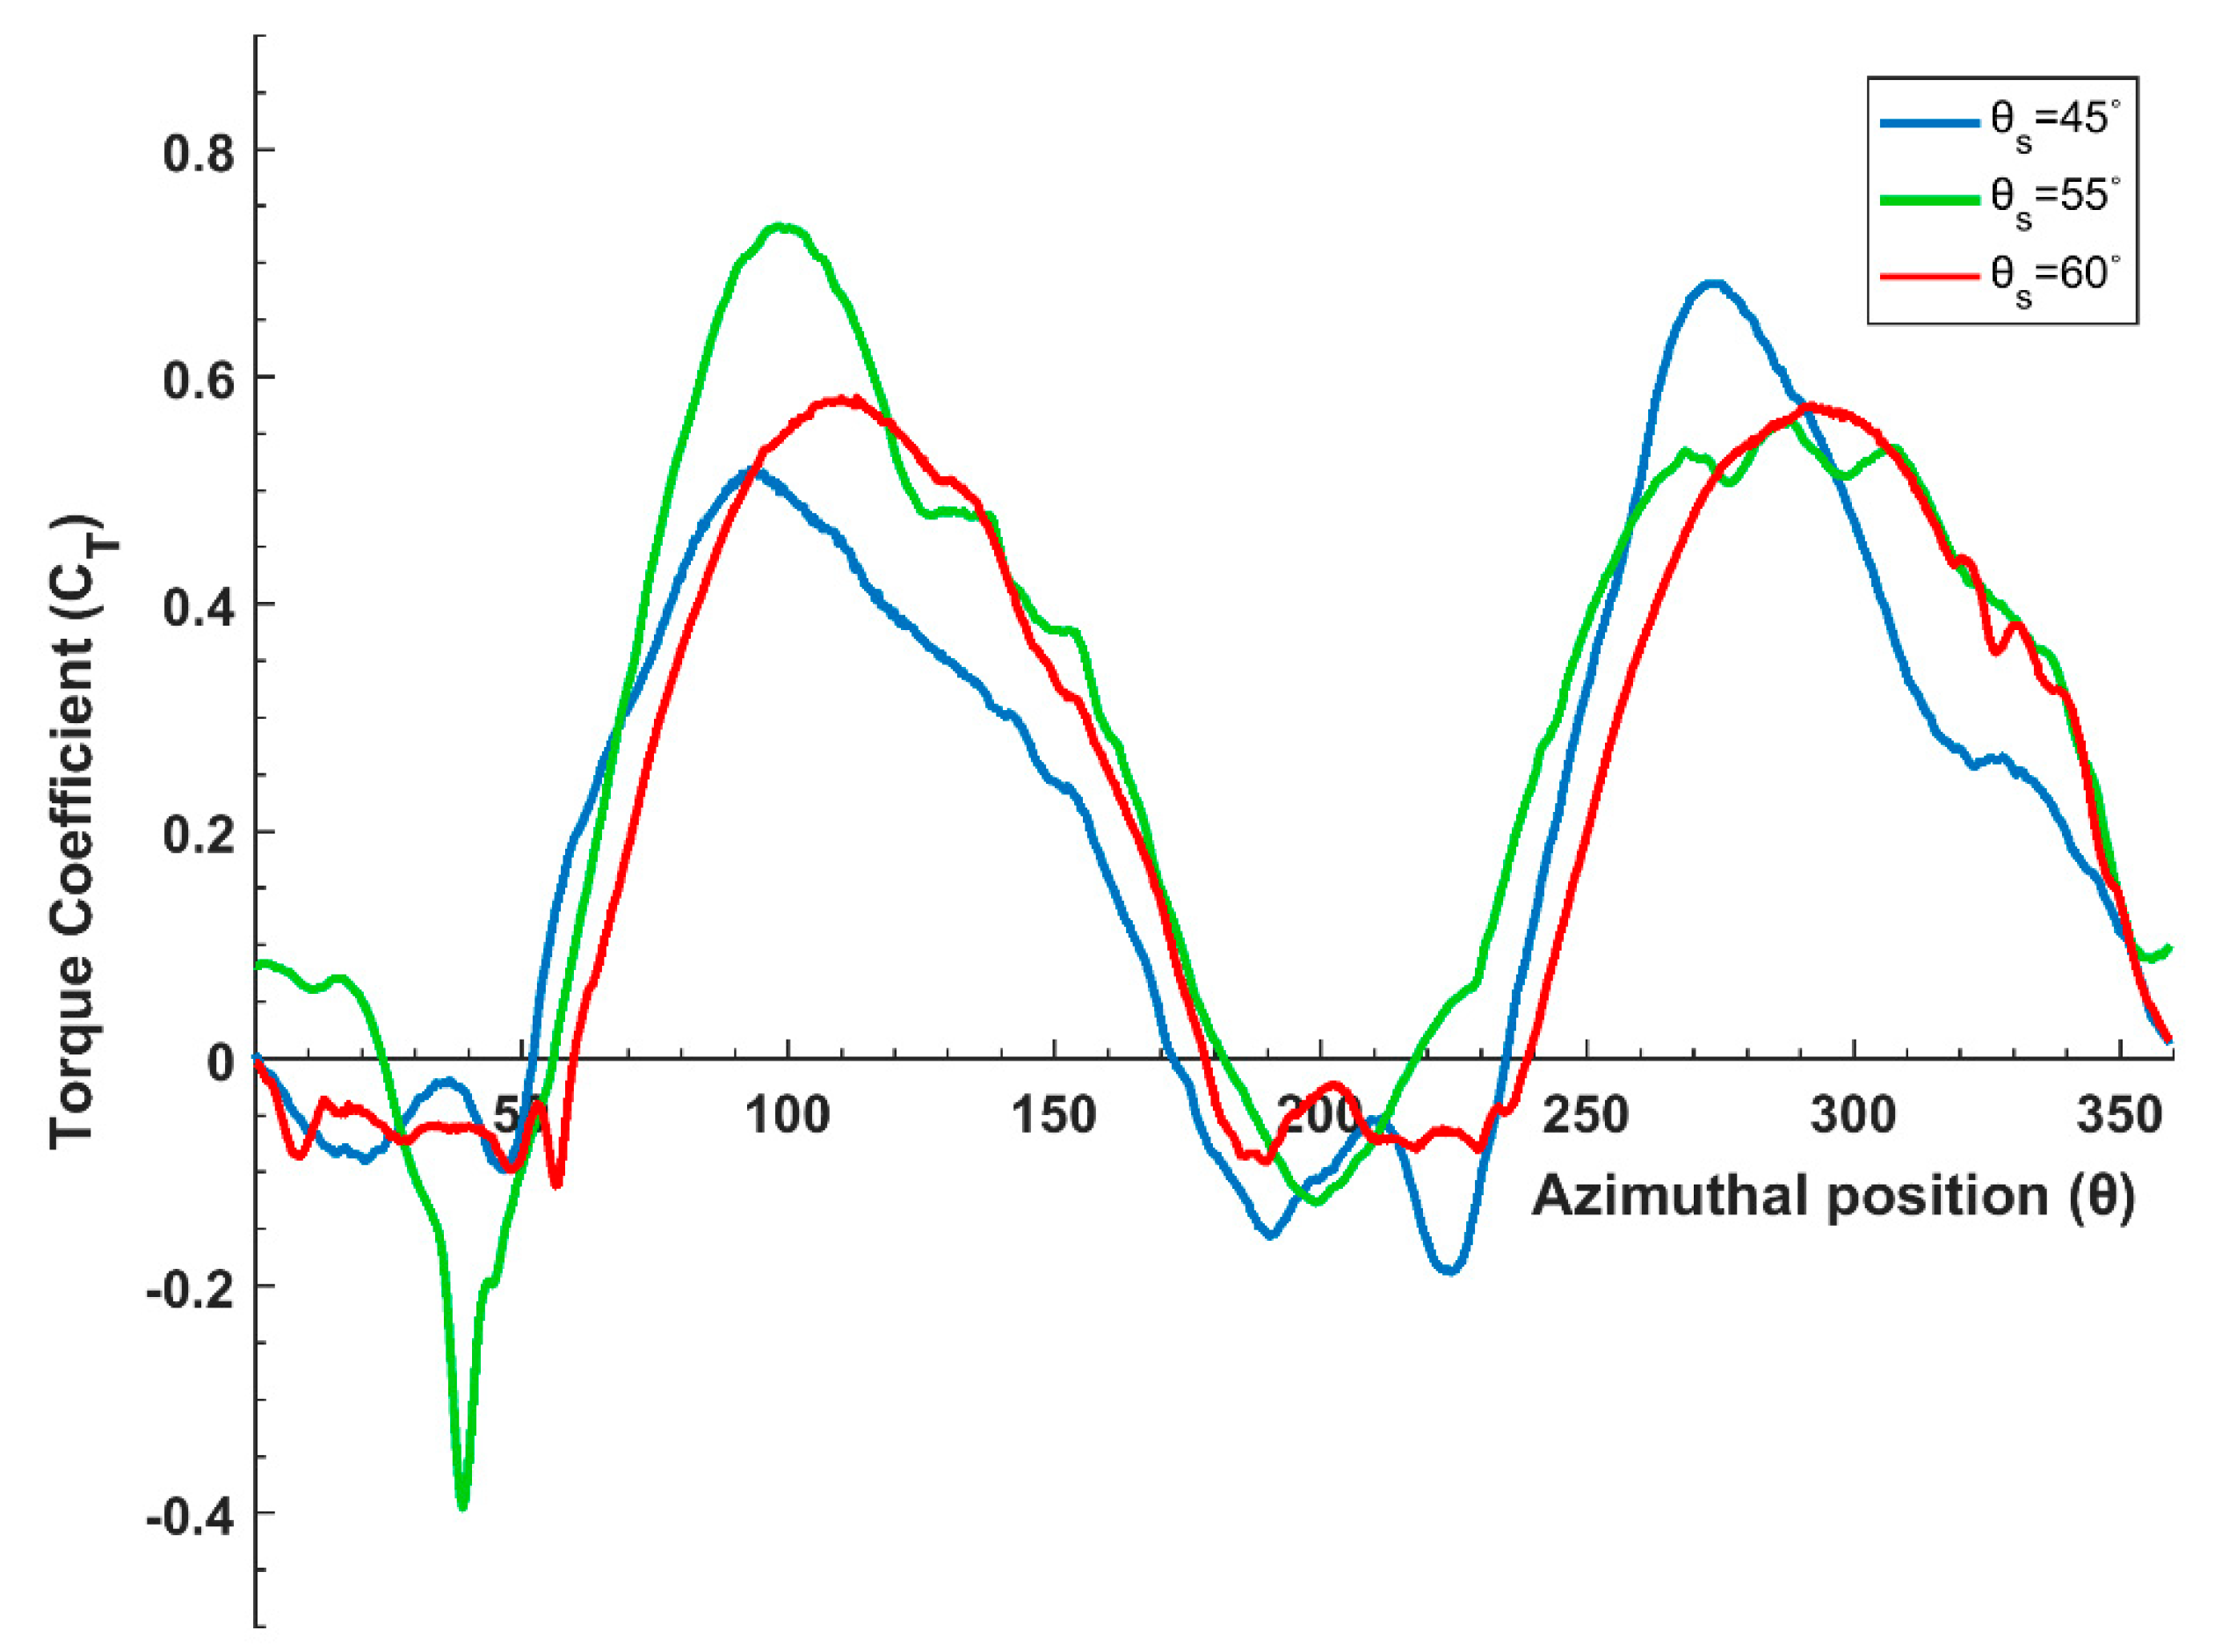
Figure 6 presents the torque coefficient (CT) variation with azimuthal positions at TSR = 0.6 for the three considered Savonius configurations. Azimuthal position θ = 0° was the position where the ends of the Savonius rotor blades coincided with the y-axis, as shown in Figure 3, and θ increased as the blades rotated clockwise. The averaged CT values over one rotation were 0.220, 0.278, and 0.259 for θ s = 45°, θ s = 55°, and θ s = 60°, respectively, and it was clear that θ s = 55° delivered superior performance for most rotors’ azimuthal positions. However, slight exceptions existed at 26° < θ < 67° and 260° < θ < 288° where the performance of θ s = 45° was marginally better, as depicted in Figure 6.
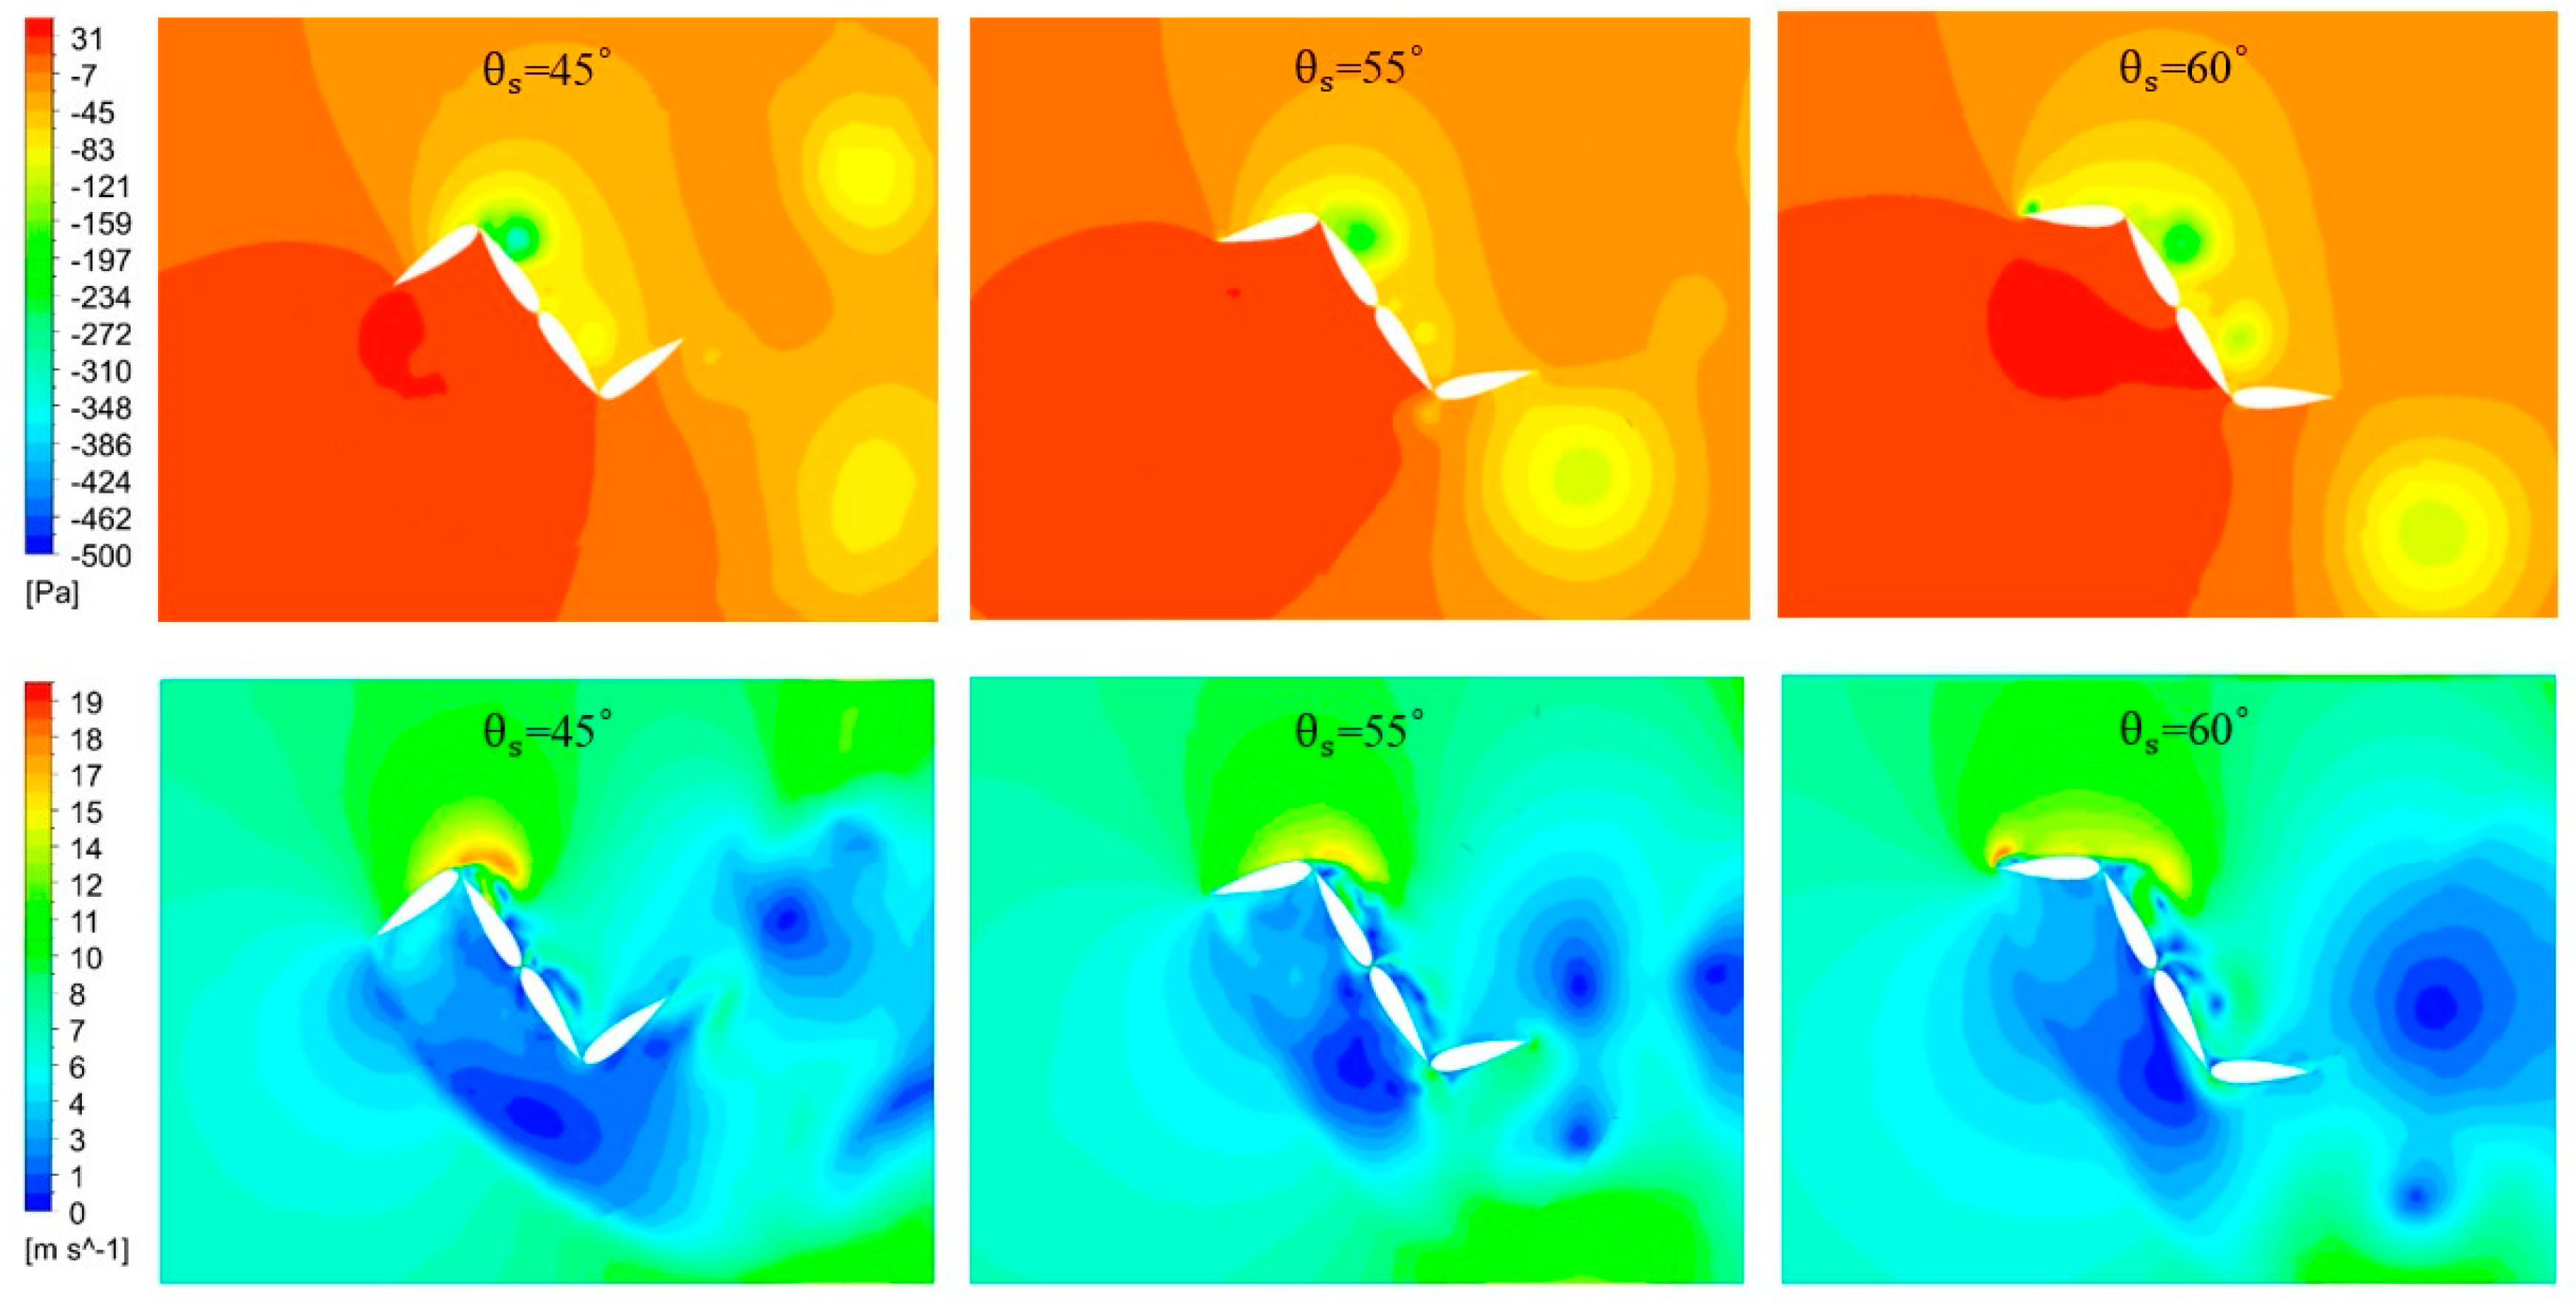
The suggested Savonius configurations adhered to the unique behavior of Savonius turbines by having spells of very high CT values (Figure 6). A maximum CT value of 0.731 was attained by the Savonius turbine with θ s = 55° at an azimuthal angle θ = 100°. The Savonius turbine relied on the difference in pressure between the concave and convex sides of the blades to generate torque. Hence, it was important to visualize the pressure contours at this location in order to obtain further insight. As seen in Figure 7, the positive pressure area on the returning blade of the Savonius turbine with θ s = 55° was the smallest compared with the other configurations. Since this positive pressure inhibits the clockwise rotation of the rotor, the configuration with θ s = 55° developed the least resistance, and consequently generated the largest torque. This can be further explained by analysing the velocity contours (Figure 7), where it was evident that the stagnation area on the convex side of the returning blade was the lowest for θ s = 55°, which in turn led to the aforementioned decrease in positive pressure area.

6.2. Darrieus Configurations

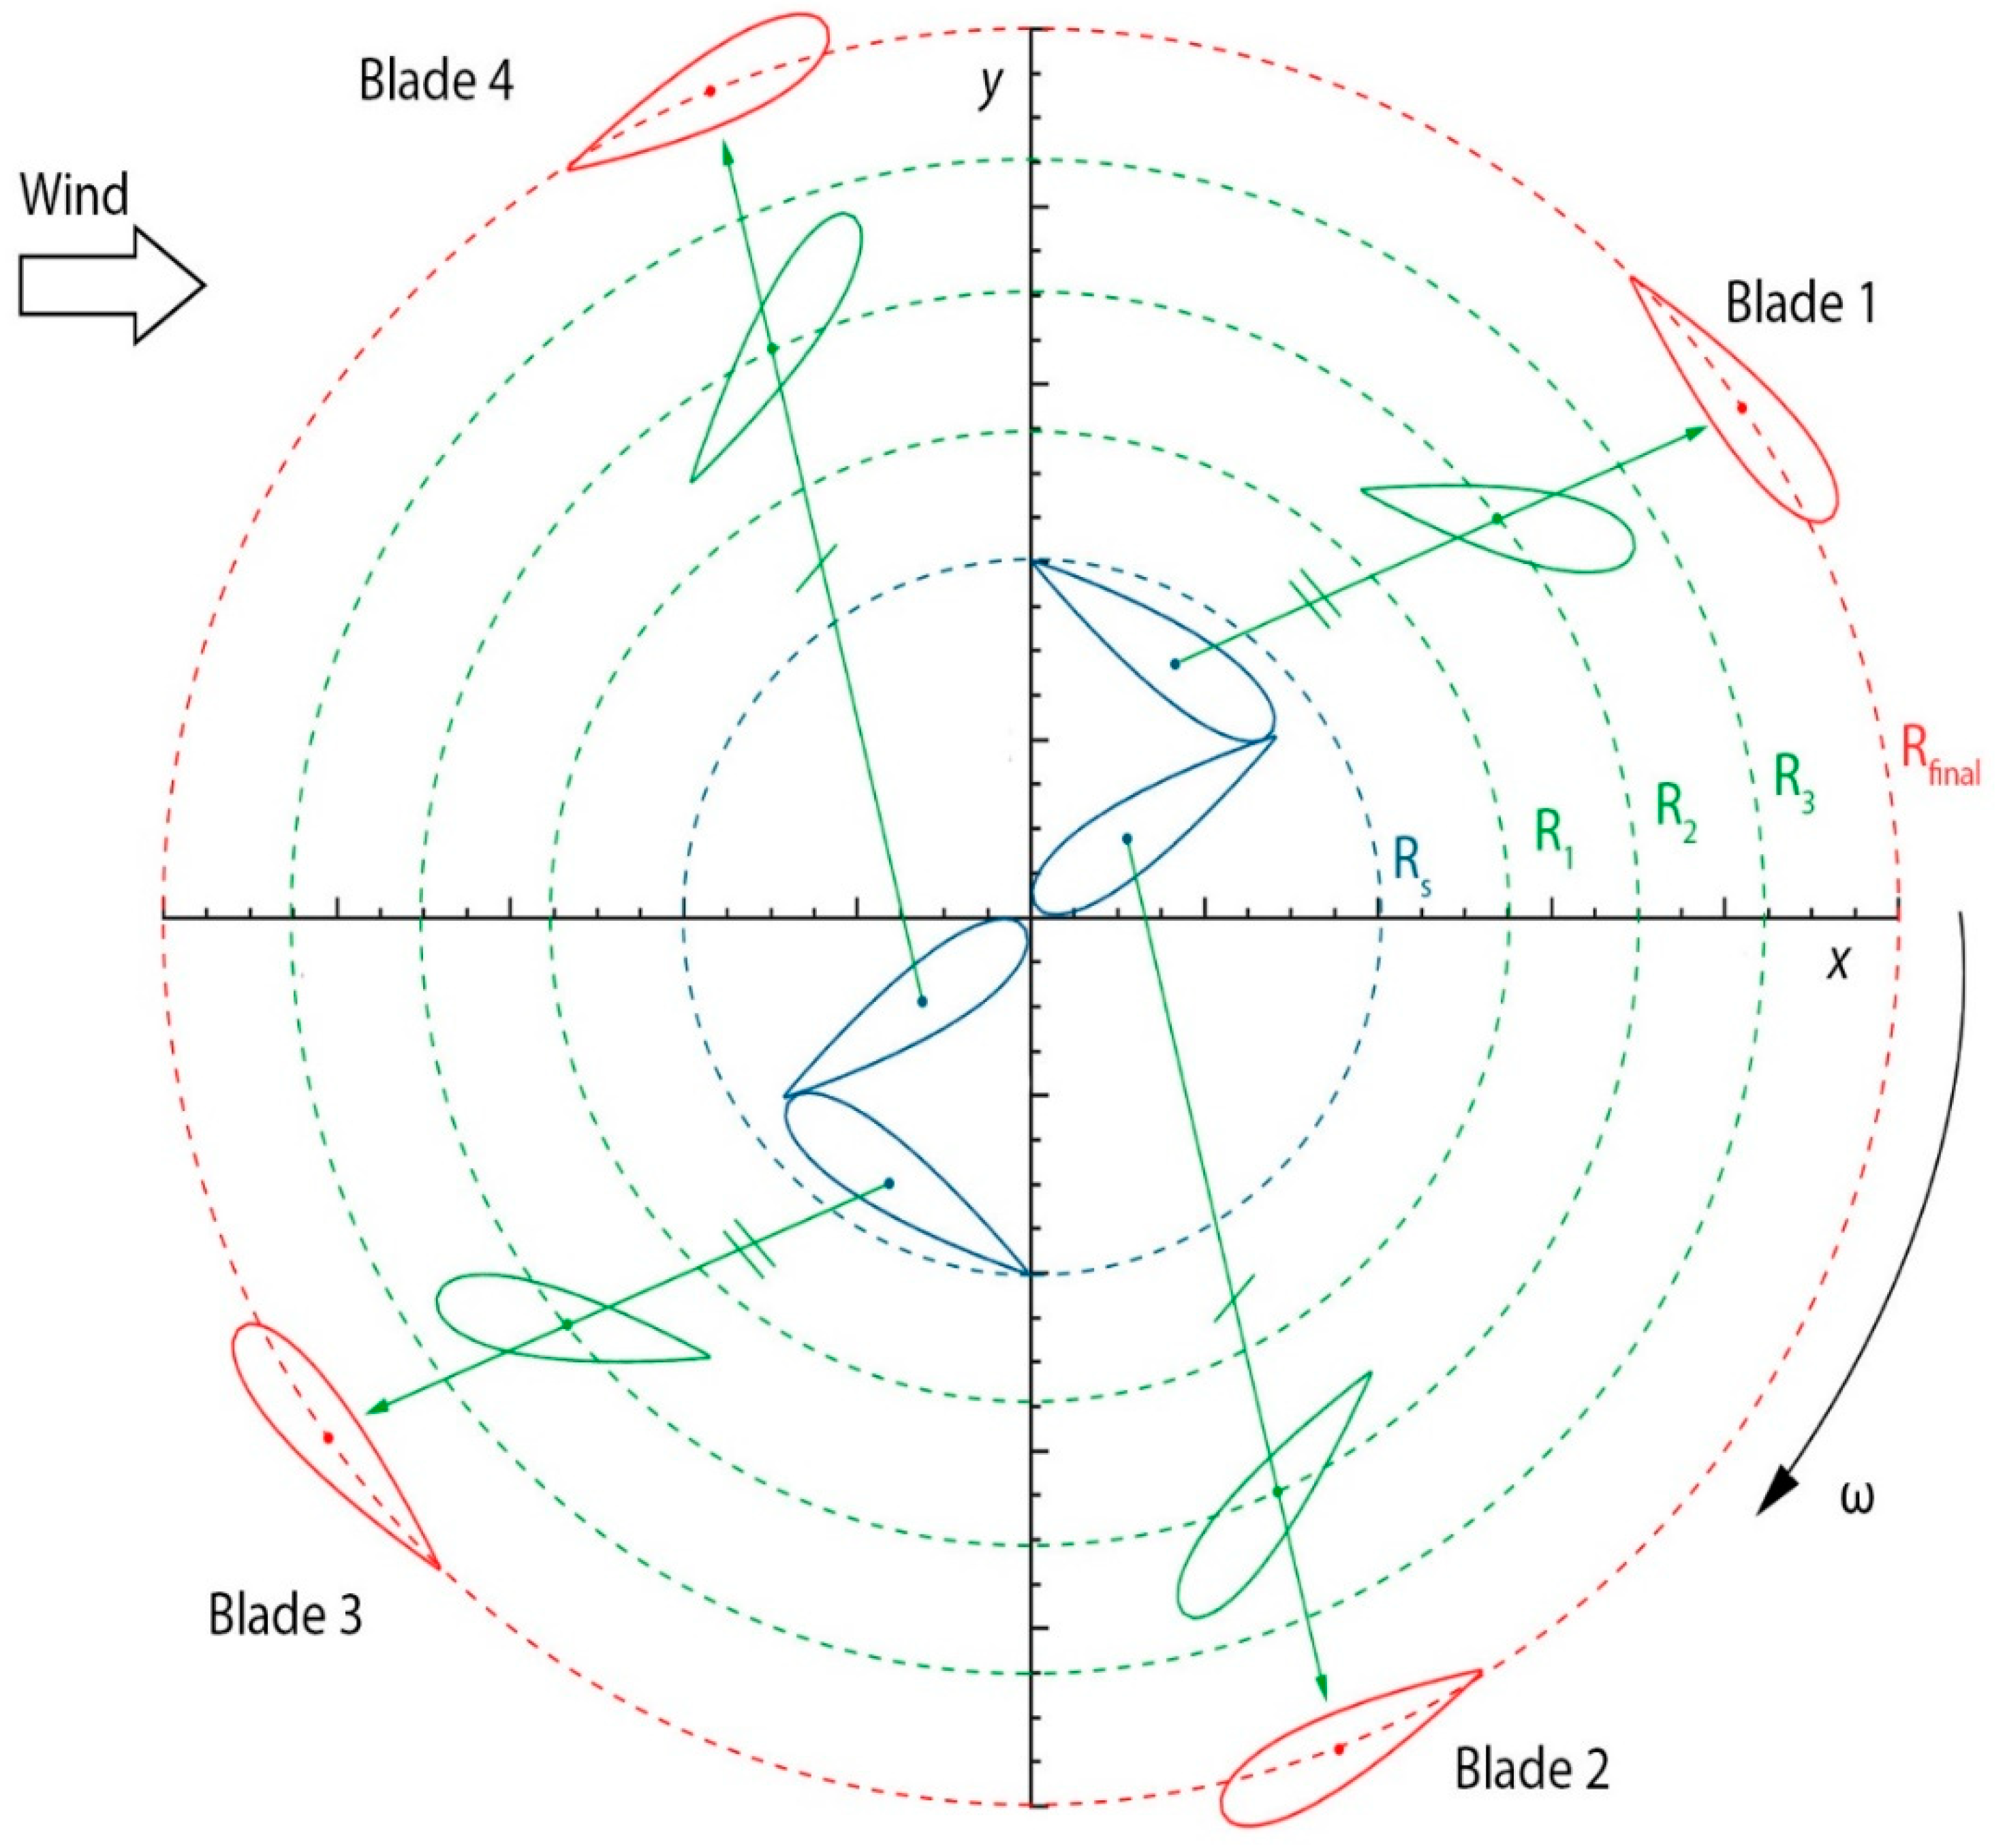
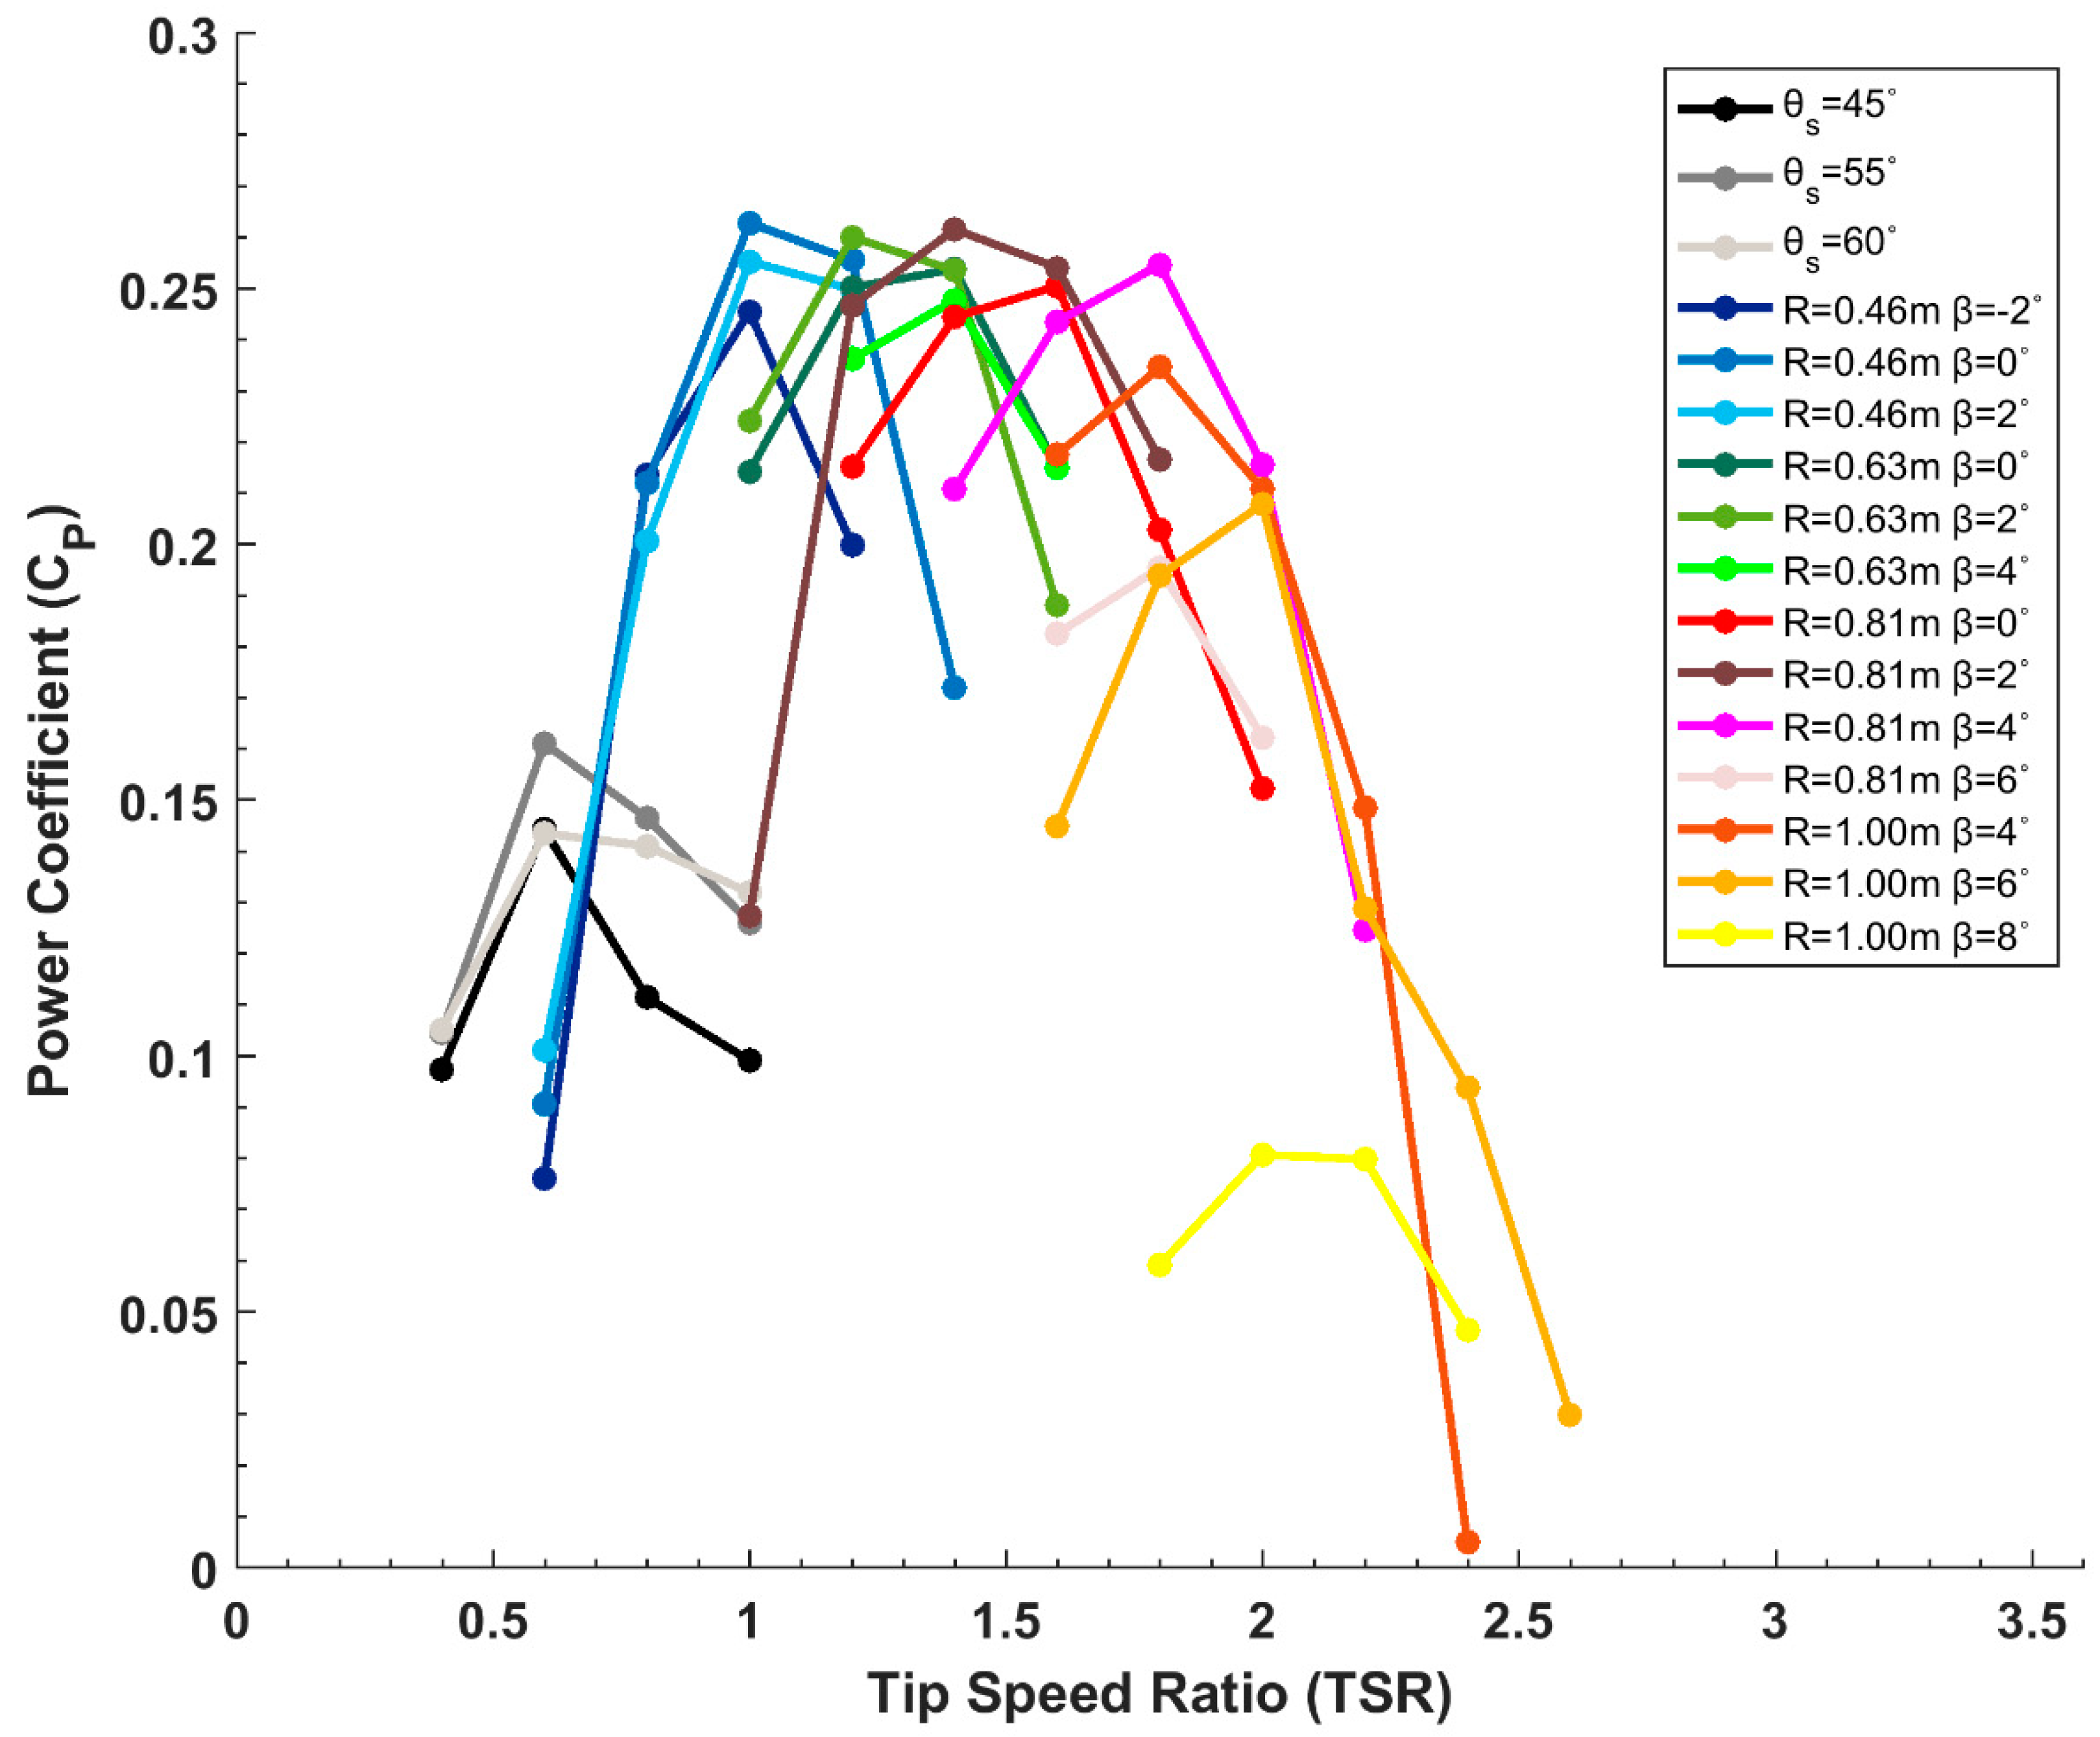
With no variation in its angular orientation, each blade was translated via a unique path from the optimized Savonius configuration of θ s = 55° in order to attain a desired value of β at Rfinal. Consequently, βopt,f was determined by generating different Cp curves with different values of β as seen in Figure 5. It was evident that the optimum value of the pitch angle (βopt,f) was 6°, since the turbine’s efficiency was always greater compared to that of β = 4° and β = 8°. It should be noted that the maximum efficiency of this Darrieus turbine was 0.246, which was almost 50% greater than the maximum efficiency of the optimized Savonius configuration. In addition, peak Cp value was attained at TSR = 2.0 for the Darrieus turbine with R = 1 m, where on the other hand, peak Cp was attained at considerably lower TSR = 0.6 for the optimized Savonius turbine. These two unique characteristics are what mainly distinguishes the performances of these two turbines and form the basis for the current study.
With an optimized θ s = 55° and βopt,f = 6° at Rfinal = 1 m, the straight paths of the blades’ centers were generated, as listed in Table 1. As mentioned earlier, the blades’ transition from Rs = 0.441 m to Rfinal = 1 m with βopt,f = 6° was discretized into three optimization stages (R1, R2, and R3) (Figure 3). The radial increment from one stage to another was selected in a way that would yield similar increments in the x- and y-directions for blades 1 and 3. As a result, this yielded R1 = 0.46 m, R2 = 0.63 m, and R3 = 0.81 m.
At the first optimization stage, in order to have R = R1 = 0.46 m, the blades’ centers had the following coordinates: x1 = 0.276 m, y1 = 0.371 m, x2 = 0.386 m, y2 = −0.254 m, x3 = −0.276 m, y3 = −0.371, x4 = −0.386 m, and y4 = 0.254 m. As depicted in Figure 5, different Cp curves were generated for different values of β. Here again, a vertical shift was evident when the value of β was changed, where it was clear that β = 0° provided the best performance. Compared to the Savonius configuration, the maximum efficiency and the TSR value at which it occurred increased as anticipated. It is evident by now that the Savonius configuration with θ s = 55° had to be adopted during the start-up phase and up until TSR = 0.6, after which a transitioning process into a Darrieus rotor with R = 0.46 and β = 0° had to take place. Having a small radius, this configuration is characterized by its high solidity ( σ = N c 2 R = 1.152 ) , where N is the number of blades. During spells of high angle attack (α), complex flow structures evolve around the blades, and shed to impinge on the other blades of this highly packed rotor. The development of these structures and their interactions are responsible for power generation at lower TSRs, where α values are usually very large. 
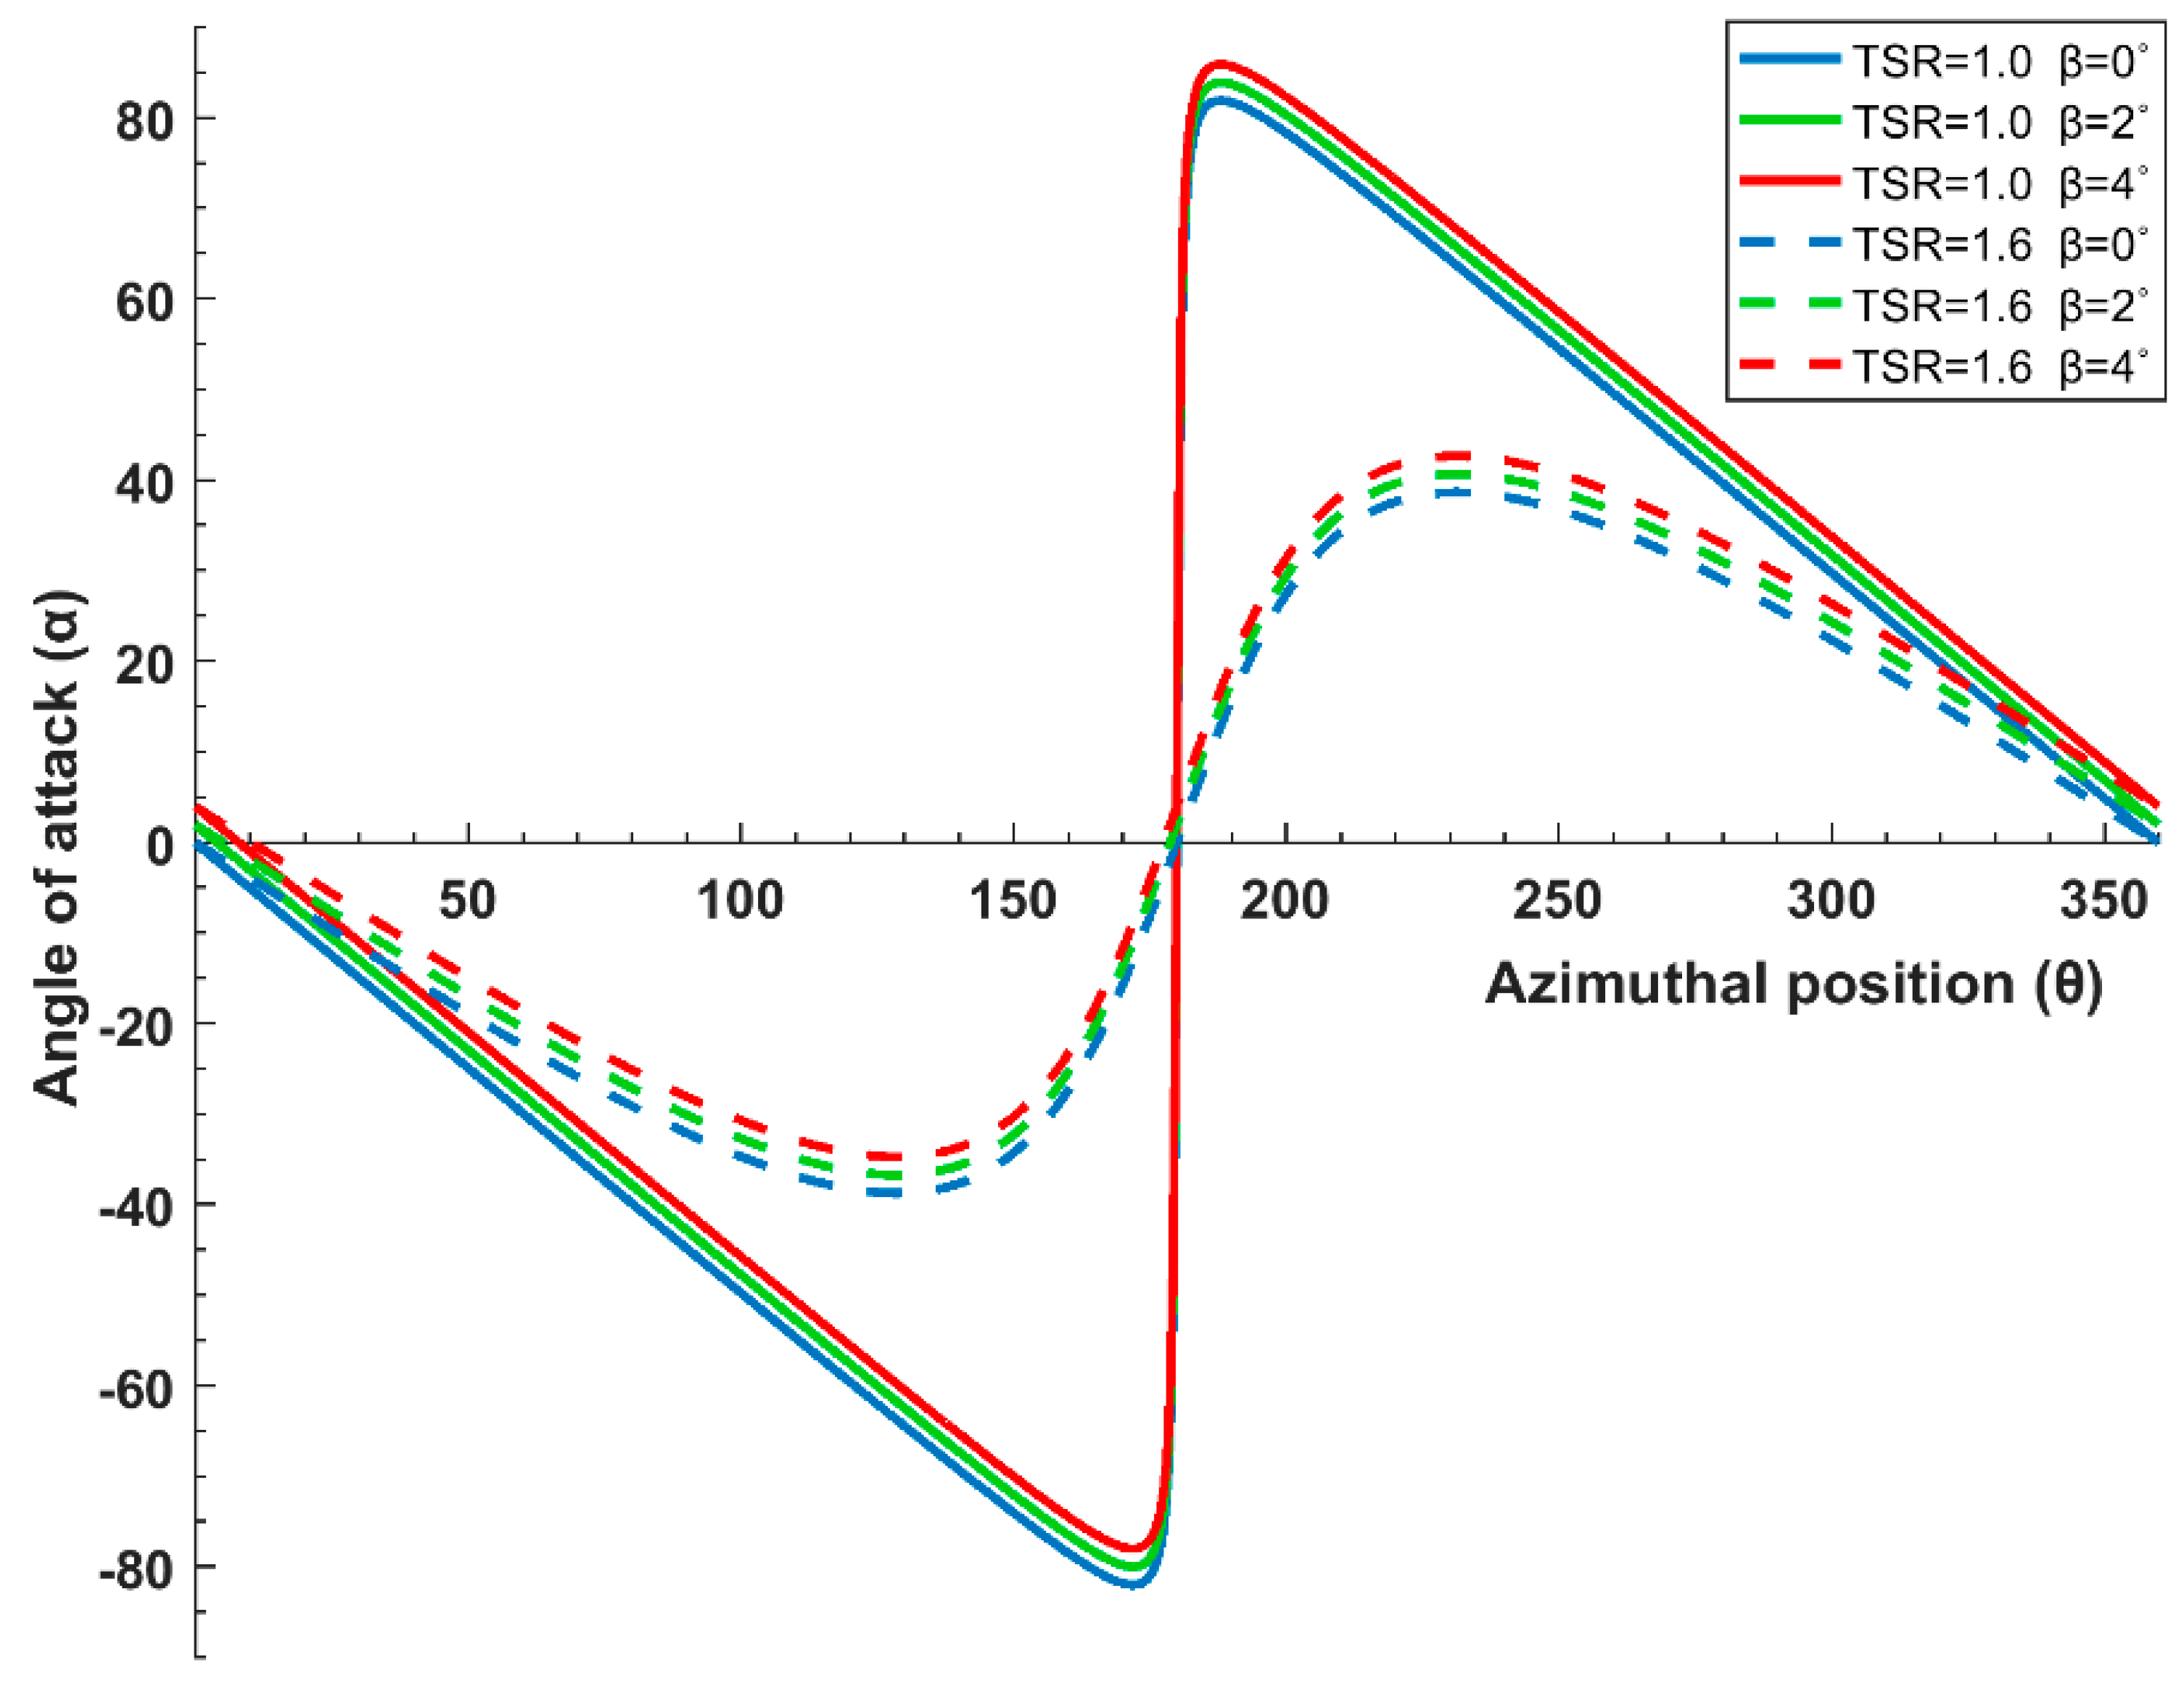
Figure 8 presents the angle of attack variation with θ at TSR = 1.0 and TSR = 1.6, with θ = 0° being the position where the center of blade 1 coincides with the y-axis, and increases with the clockwise rotation of the rotor. It is evident that, for all blade pitch angles, the blades experience massively higher angles of attack at TSR = 1.0, compared to the drastically lower α ranges experienced at TSR = 1.6. This is the main reason why Cp peaks at TSR = 1.0, and undergoes a sharp drop at higher TSRs for the turbine with R = 0.46 m (Figure 5).
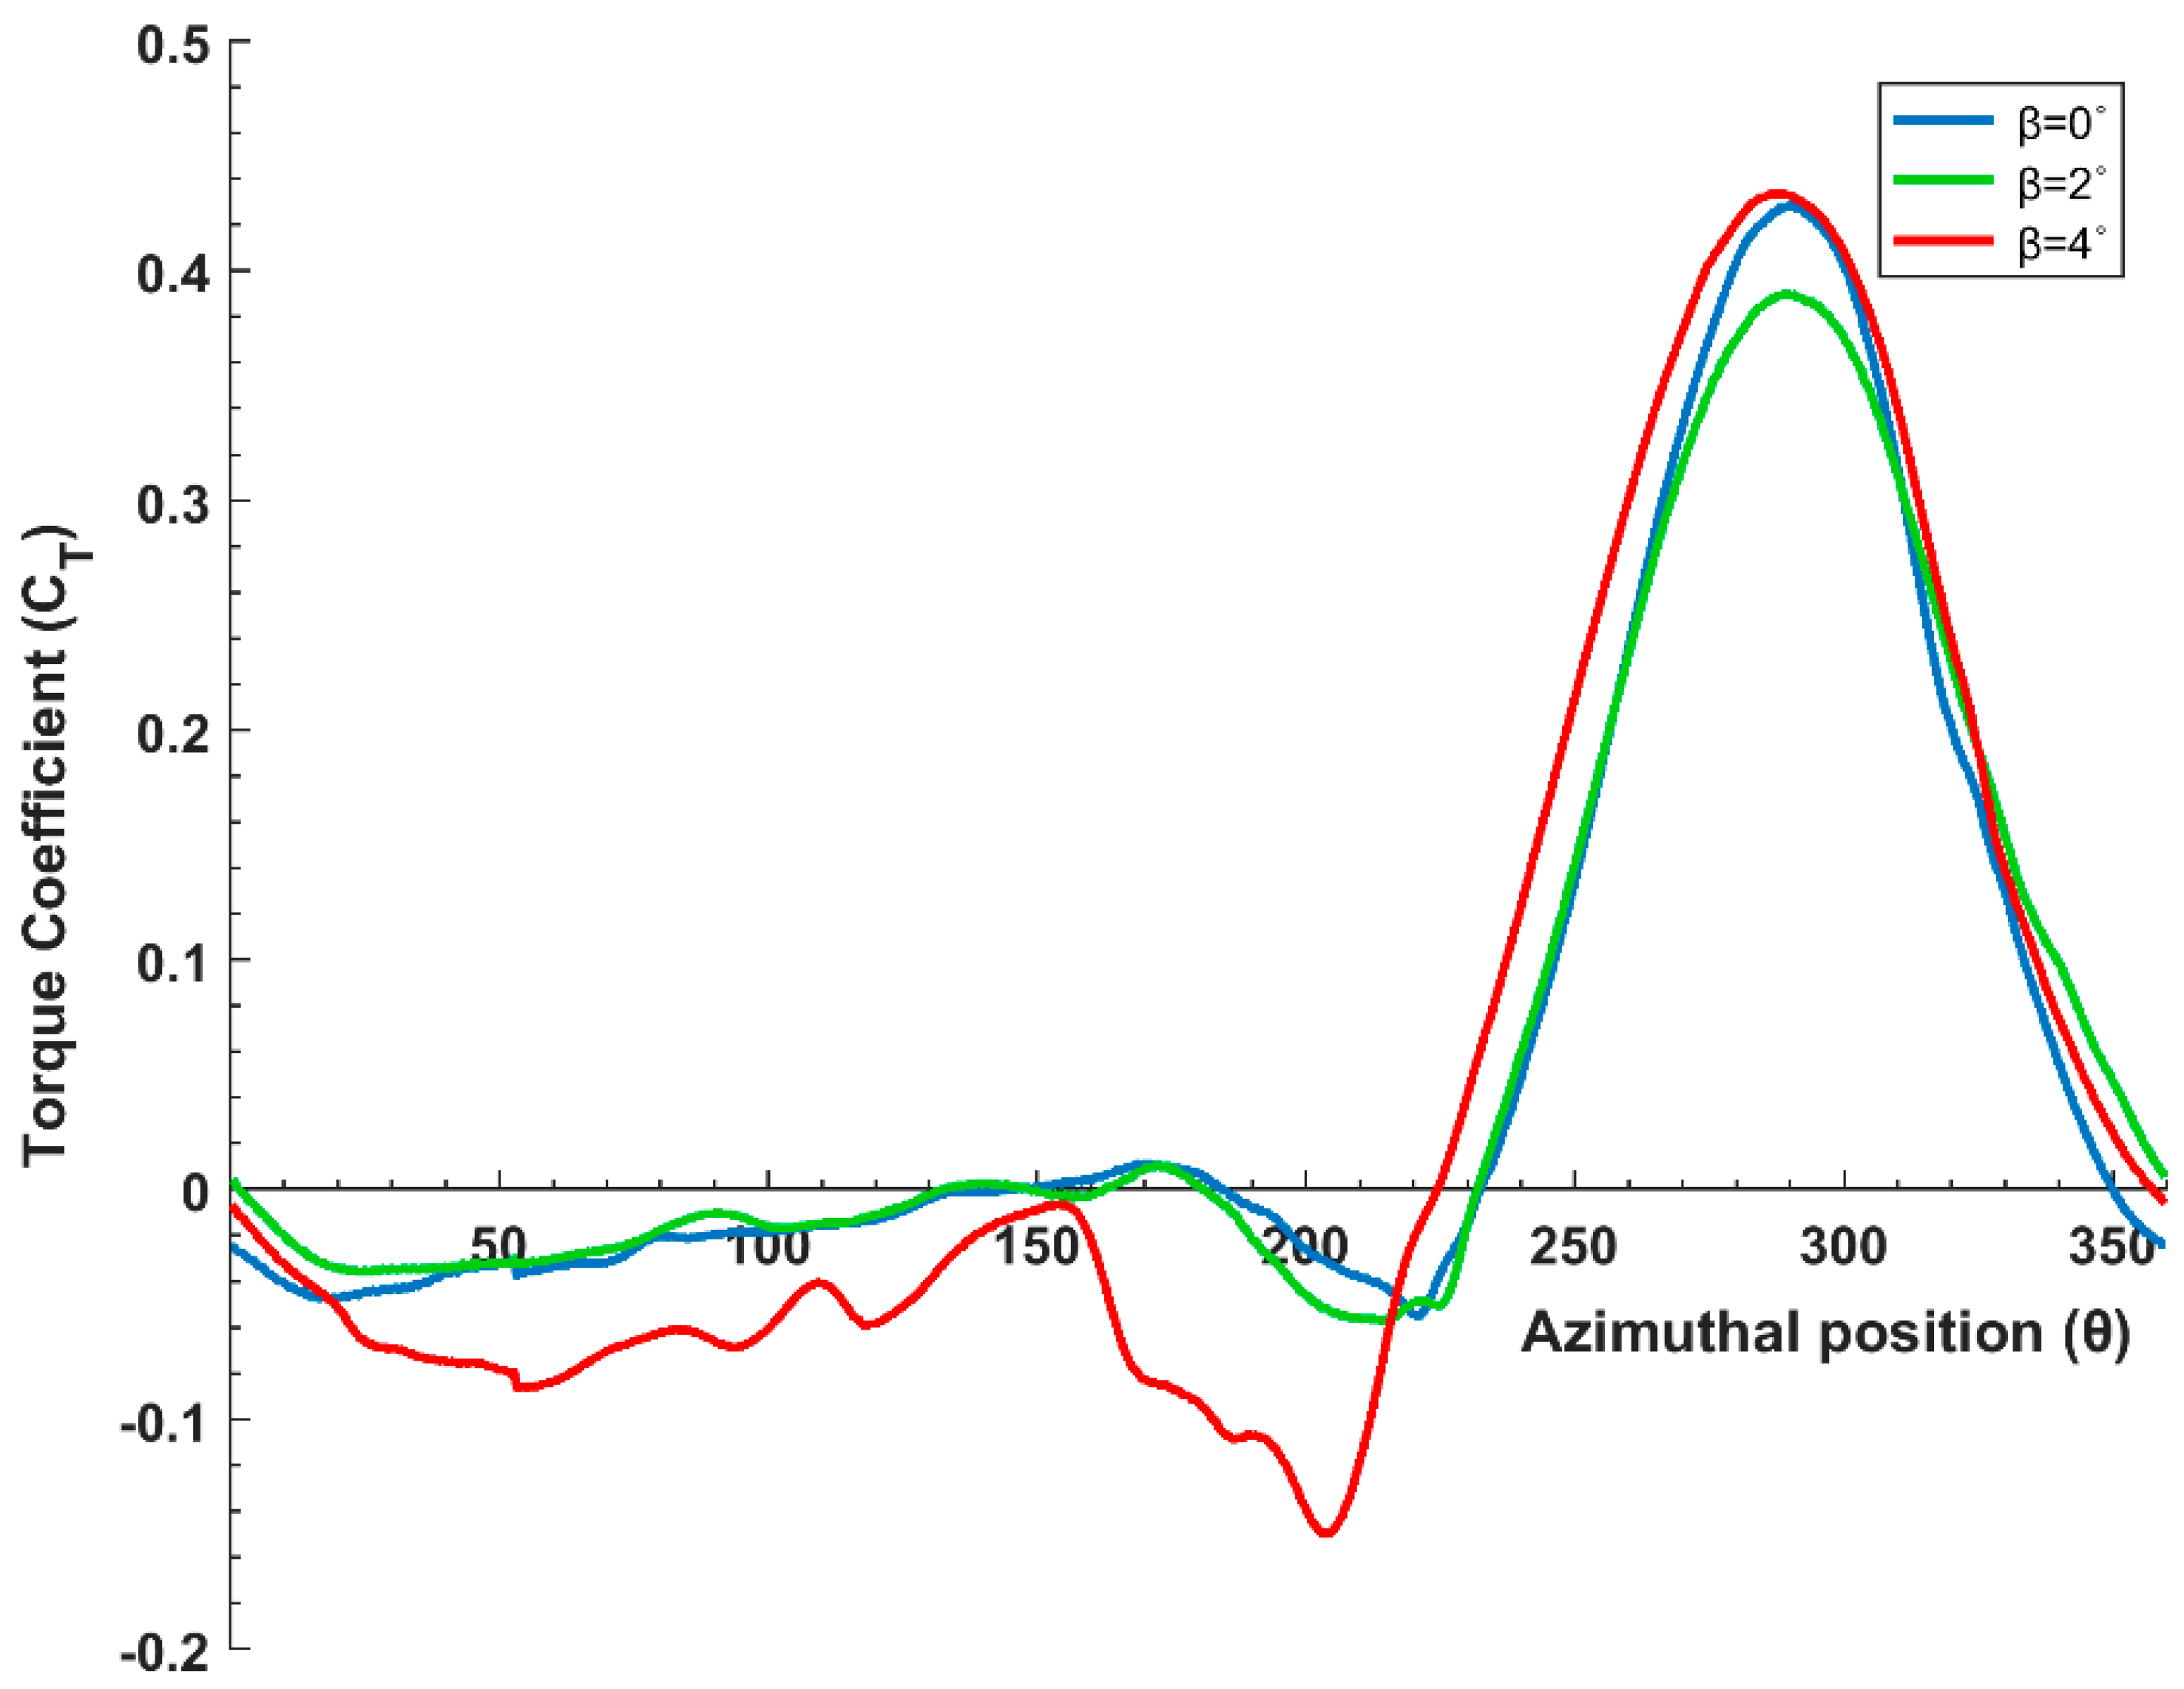
Figure 9 presents the instantaneous torque coefficient variation of a single blade for different β at R = 0.46 m and TSR = 1.0. It is evident that during the downwind cycle ( θ   
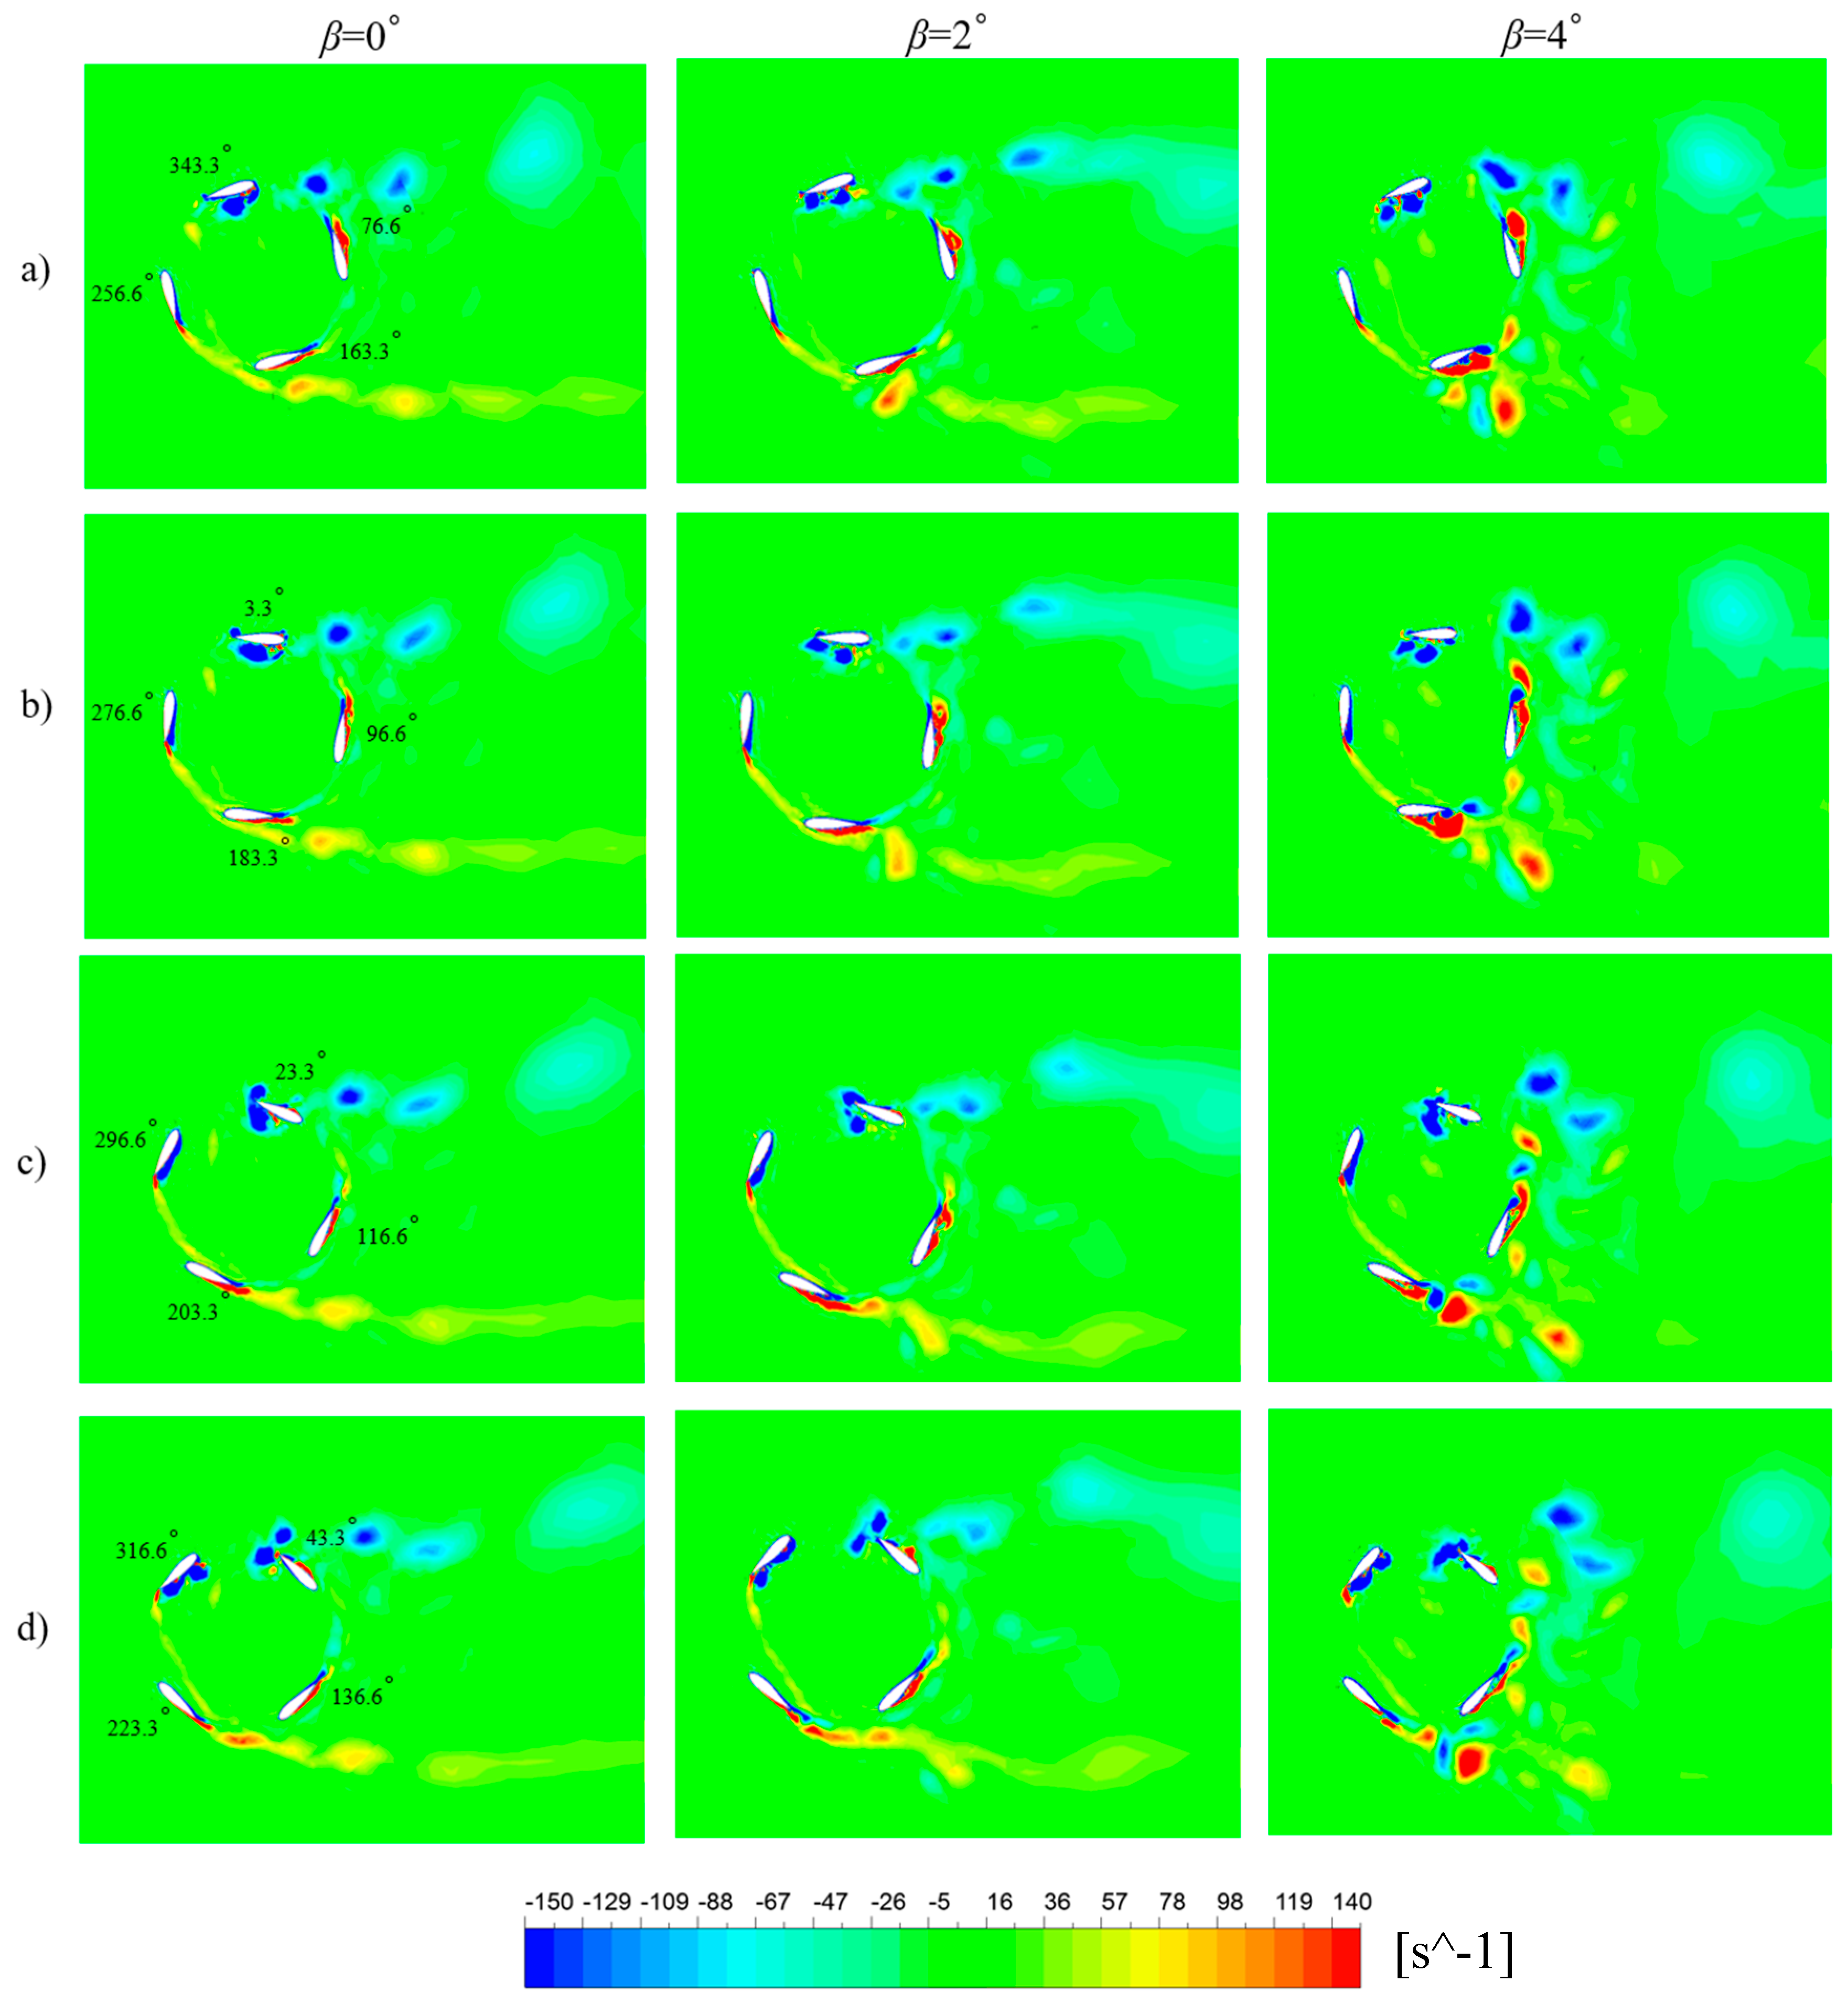
180°), the blade with β = 4° delivers the least amount of torque, while β = 0° and β = 2° have almost the same behavior. In order to further explain this trend, the vorticity field of the configurations with R = 0.46 m and different values of β is shown in Figure 10. The development and interactions of complex flow structures are evident for this high solidity rotor. At θ = 183° (Figure 10b), a trailing edge vortex at the suction side of blade begins to roll up, and eventually reaches the other side of the blade, where it interacts with the vortex developed during the downwind cycle. With β = 4°, the angle of attack is the greatest at this position and during the rest of the upwind cycle. This is why the aforementioned vortex behavior is most prominent for this value of β. As seen in Figure 10c, this results in the periodic shedding of strong counter rotating vortices towards the top-right corner, which then impinges into the suction side of the following blade during its downwind journey. As a result of these interactions, the strength of the vortex core developed on the following blade increases, and this is the main reason why the turbine with β = 4° generates the least amount of torque for θ < 180°. Moving to the upwind cycle ( θ ≥ 180°), it is clear that the blade with the highest pitch angle delivers the greatest amount of torque (Figure 9). This can also be attributed to the fact that the angle of attack is the greatest for β = 4° during this cycle, which leads to the development of stronger vortices on the suction side of the blade Figure 10c ( θ = 296.6°). Consequently, this lowers the pressure on the suction side of the blade to a greater extent, and therefore leads to the generation of more torque during the upwind cycle.
Moving on to the second optimization stage at R = R2 = 0.63 m, the coordinates of the blades’ centers were set as follows: x1 = 0.475 m, y1 = 0.409 m, x2 = 0.494 m, y2 = −0.385 m, x3 = −0.475 m, y3 = −0.409, x4 = −0.494 m, and y4 = 0.385 m. The blade pitch angles were varied and different Cp curves were generated. As expected, the location where the Cp curve peaks shifts to the right with increasing rotor radius. The maximum Cp developed was equal to 0.279 at TSR = 1.2 for the configuration with β = 2°, which provides superior performance compared with other pitch angles. Hence, at this stage, it is clear that the turbine has to transition to R = 0.63 and β = 2° at TSR ≥ 1.2.
At the final optimization stage, with R = R3 = 0.81 m, the coordinates of the blades’ centers were: x1 = 0.675 m, y1 = 0.447 m, x2 = 0.613 m, y2 = −0.529 m, x3 = −0.675 m, y3 = −0.447 m, x4 = −0.613 m, and y4 = 0.529 m. As evident from Figure 5, the peak location of the Cp curve again shifts to the right with an increase in the rotor’s radius. Regarding the sampled values of β, it was clear that a vertical shift in the Cp curve takes place when β increases from 0° to 2°, where a maximum Cp value of 0.293 is attained at TSR = 1.6. However, when β is further increased to 4°, a horizontal shift in the Cp curve takes place, where peak Cp = 0.283 is attained at TSR = 1.8. Finally, with an increase in β to 6°, the Cp curve moves vertically downwards, where the turbine’s performance is deteriorated. Therefore, due to this noticeable horizontal shift in the Cp curve with changing β, it can be concluded that for maximum efficiency, the turbine has to shift to R = 0.81 m with β = 2° for TSR 1.4, and to β = 4° for TSR > 1.6.

6.3. Optimized DR VAWT

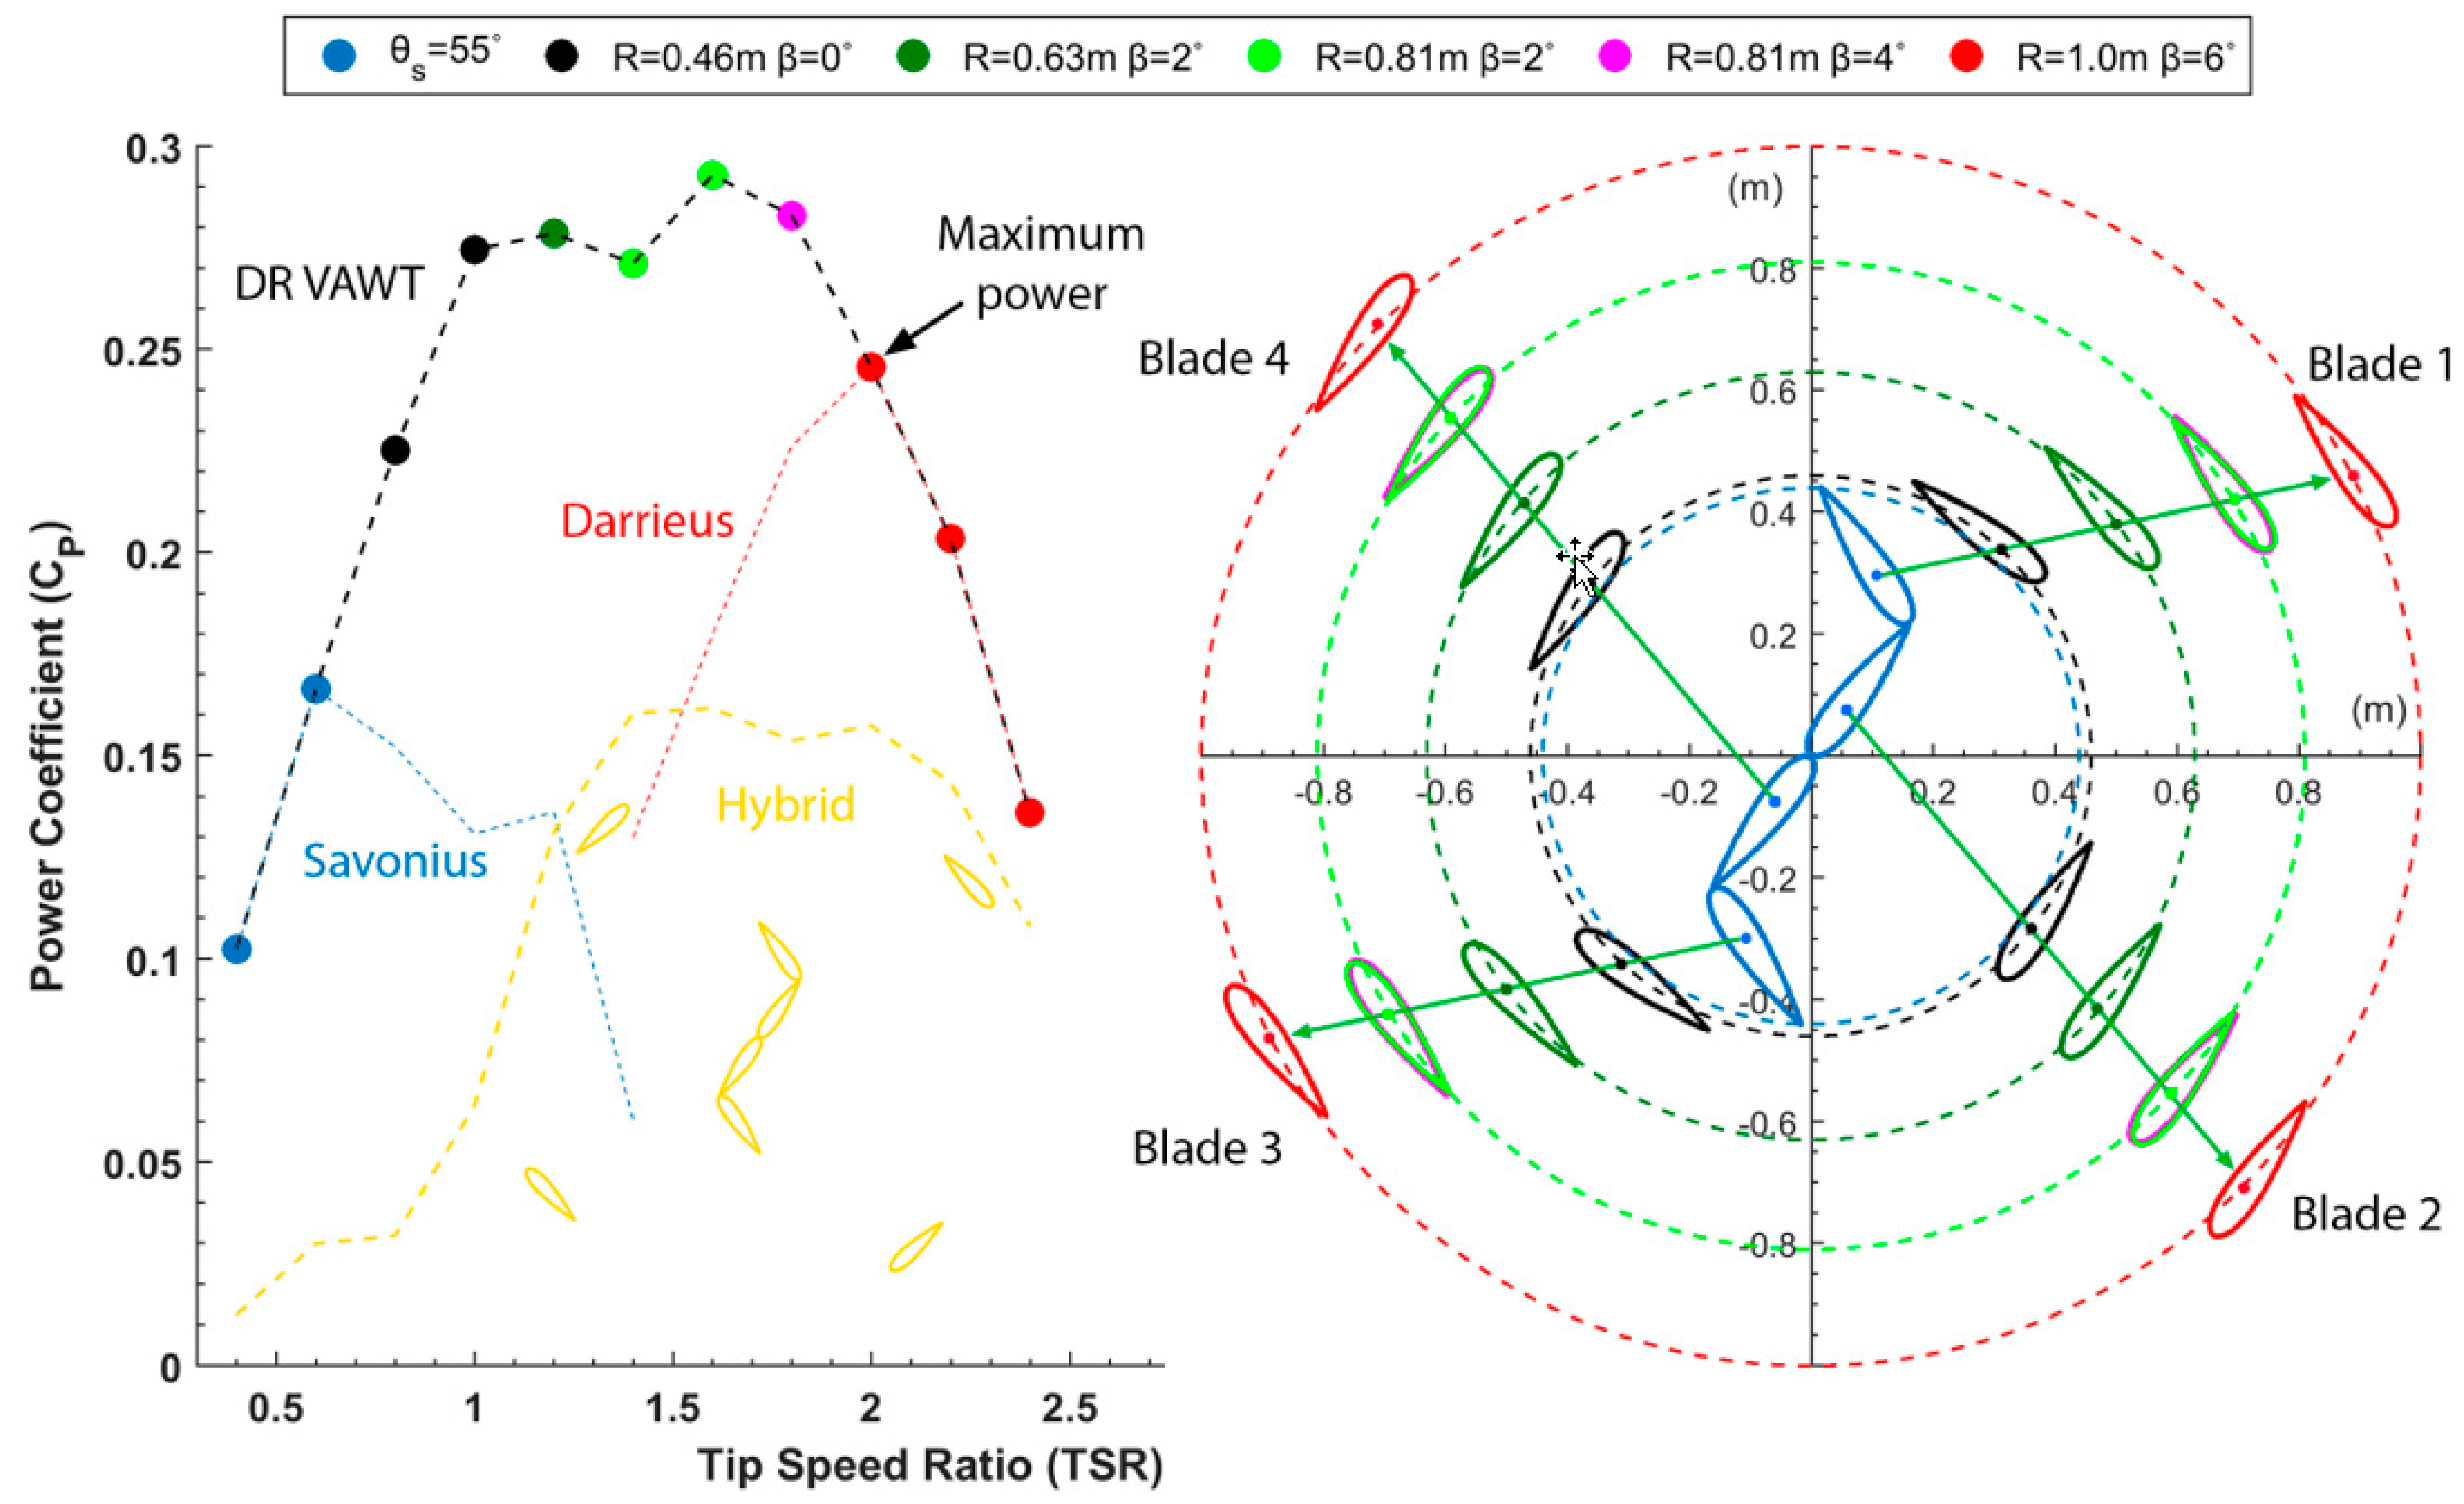
After generating all the necessary Cp curves, it is evident that the optimized dynamic turbine has to transition into its final position of R = Rfinal = 1 m with β = 6° at TSR 2.0. Figure 11 provides a clear illustration of the overall performance of the optimized DR VAWT and its blades trajectories. It is evident that the range of operational TSR where the turbine attains decent performance has drastically increased. The average power coefficient (Cp,avg) is defined as:
C p , avg = 1 n i n C p , i
where n = 11 is the total number of sampled Cp,i values at different TSRs {0.4, 0.6, 0.8, … 2.4}. Cp,avg for the optimized DR VAWT was equal to 0.225, which was 192% higher when compared to the Savonius configuration with Cp,avg = 0.077, and 87.5% higher when compared to the Darrieus configuration at Rfinal with Cp,avg = 0.120. Thus, it can be confidently said that the goal of maximizing the operational TSR range and the average power coefficient while maintaining a low cut-in speed was successfully accomplished.
Figure 11 also presents the power coefficient curve for a turbine with a hybrid Savonius–Darrieus rotor with θ s = 55°, R = 1 m, and β = 6°. The resulting Cp,avg of the hybrid turbine was equal to 0.102, and was considerably (55%) lower than the average Cp produced by the optimized DR VAWT.
The power (P) generated by the turbine is given by:
P = ρ HV 3 ( RC P )
where H is the extrusion height of the turbines’ blades. Since only R and C P terms vary across the different configurations during the transitioning process, the point with maximum RC P will generate maximum amount power for the DR VAWT configuration at a given wind speed. At TSR = 2.0, R = 1 m, and β = 6° (Figure 11), the maximum value of RC P = 0.246 m was attained. Therefore, if the load on the turbine, hence, the rotational velocity can be controlled, one can seek to operate at the point of maximum power (R = 1), while extensively benefiting from the excellent start-up characteristics of the Savonius configuration, and the efficient transitioning process into the final Darrieus position.

6.4. Effect of Reynolds Number

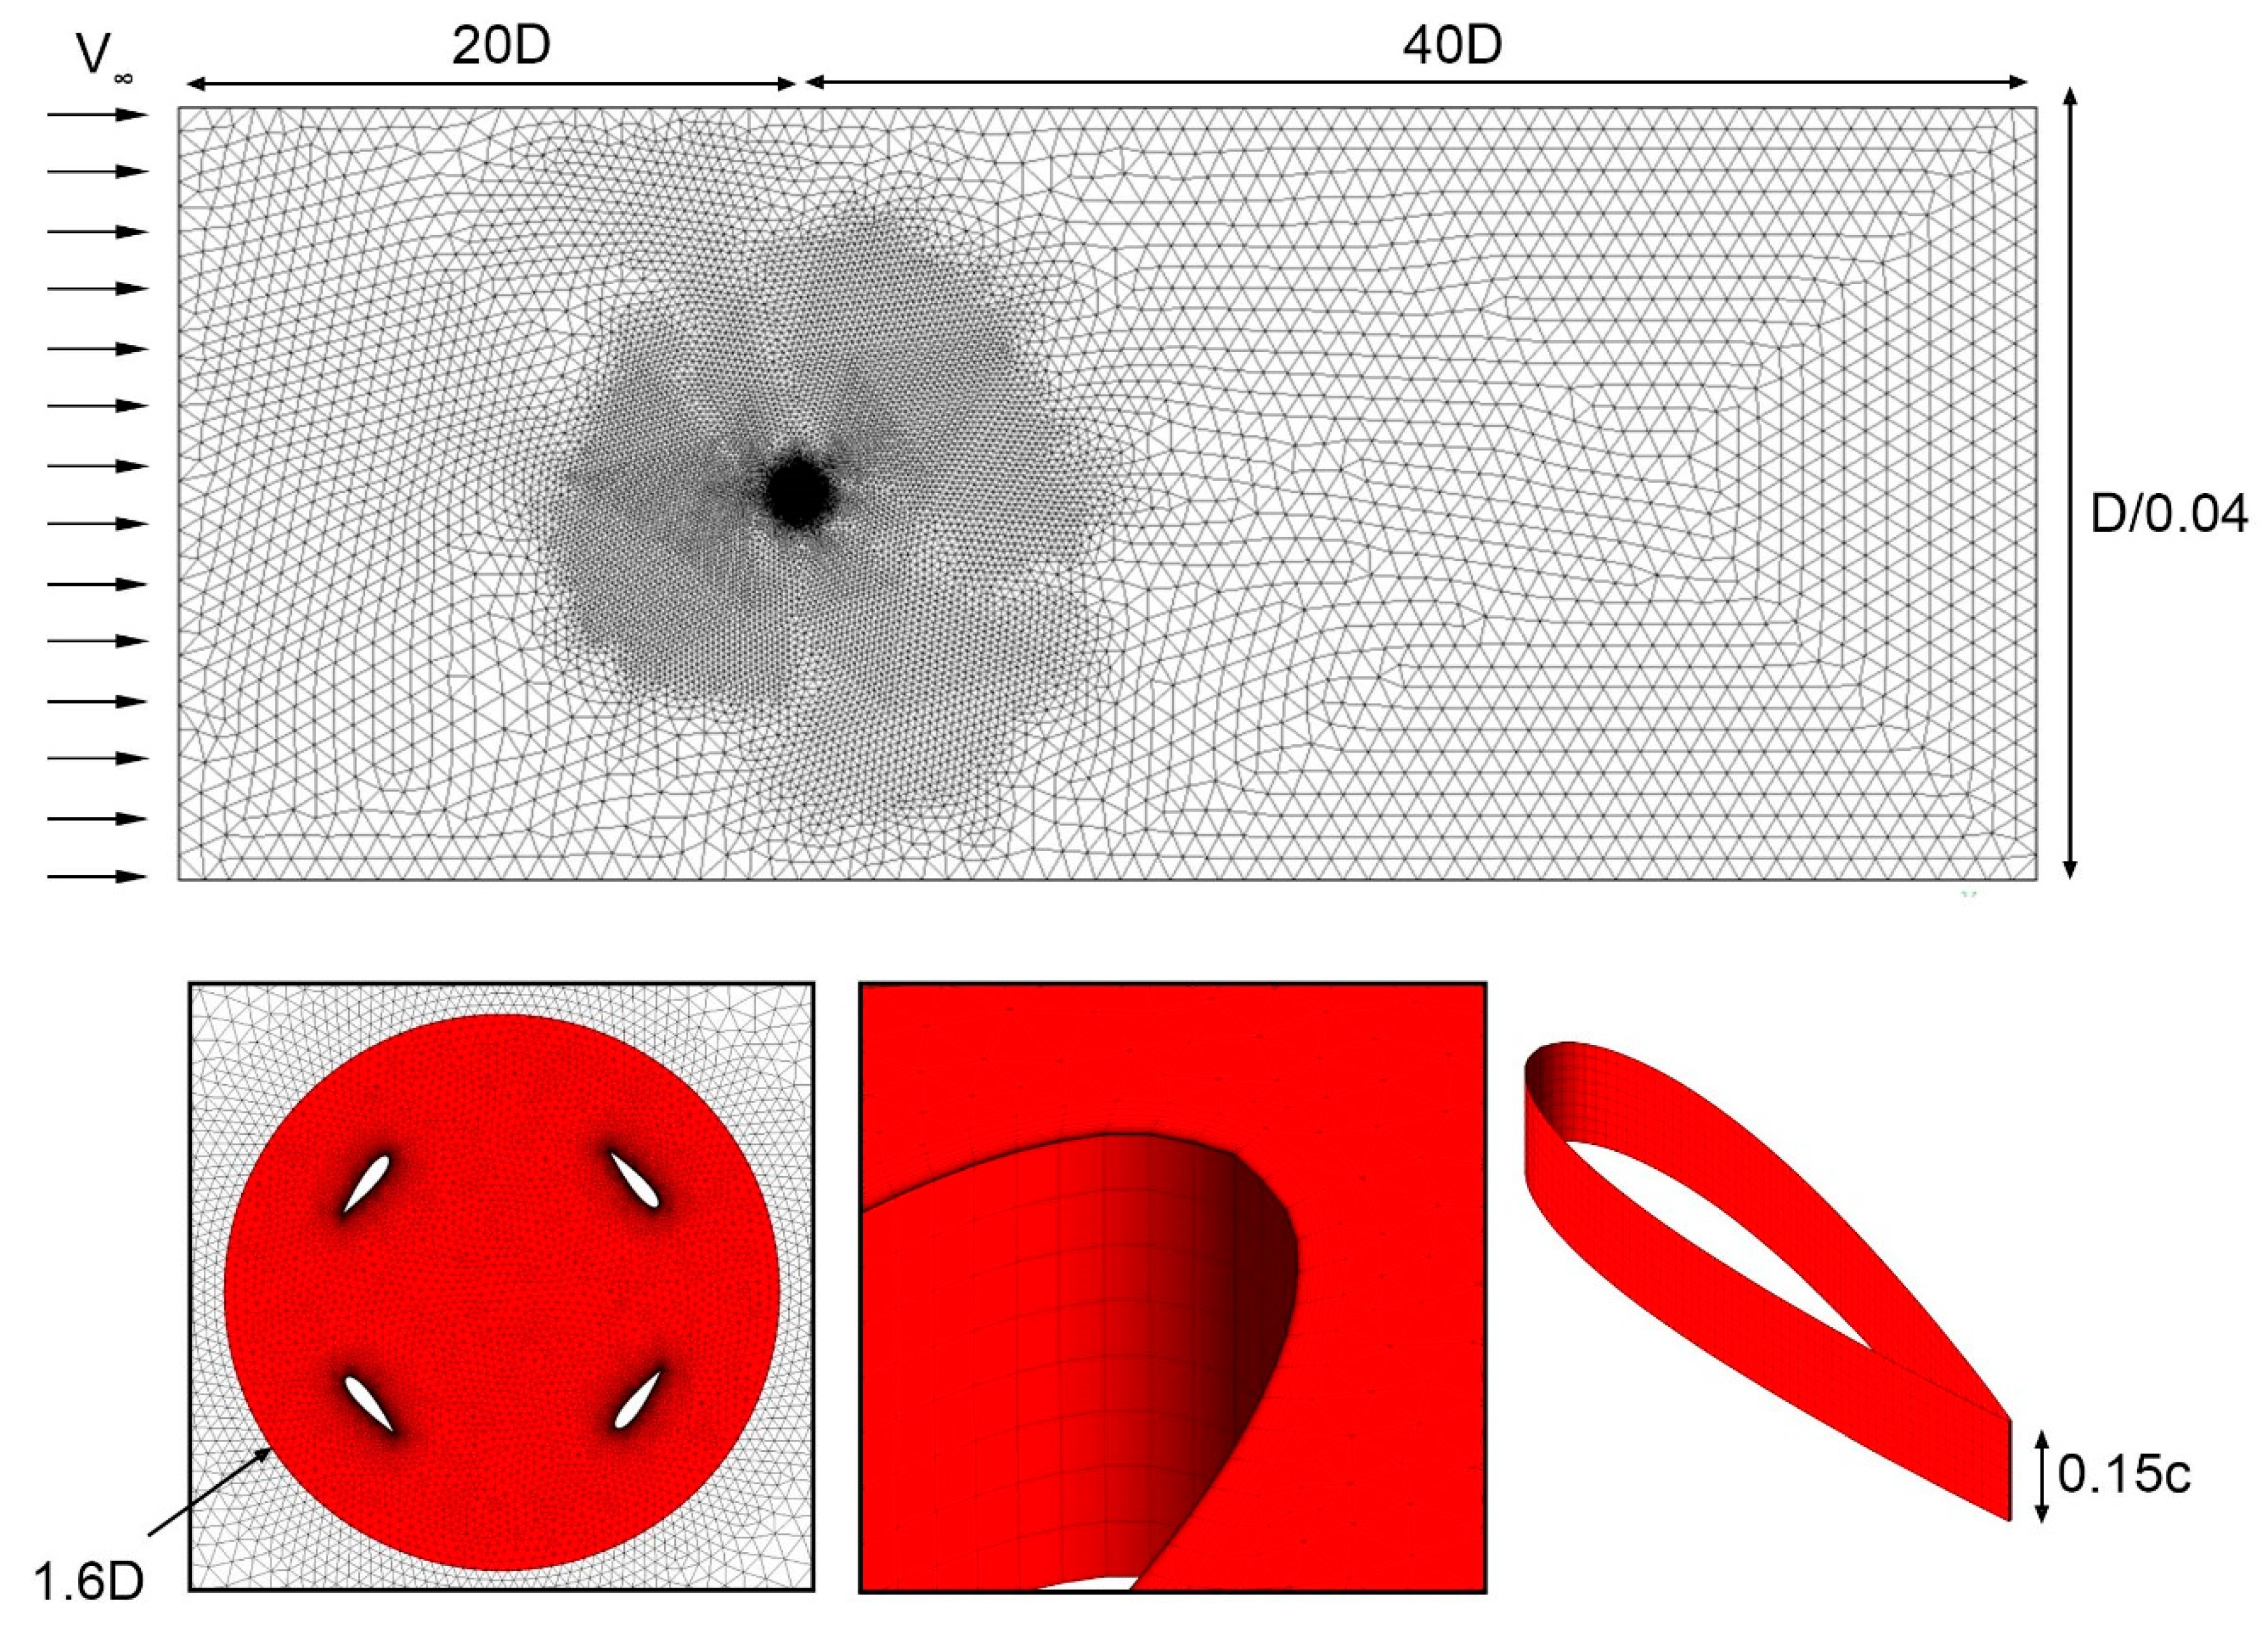
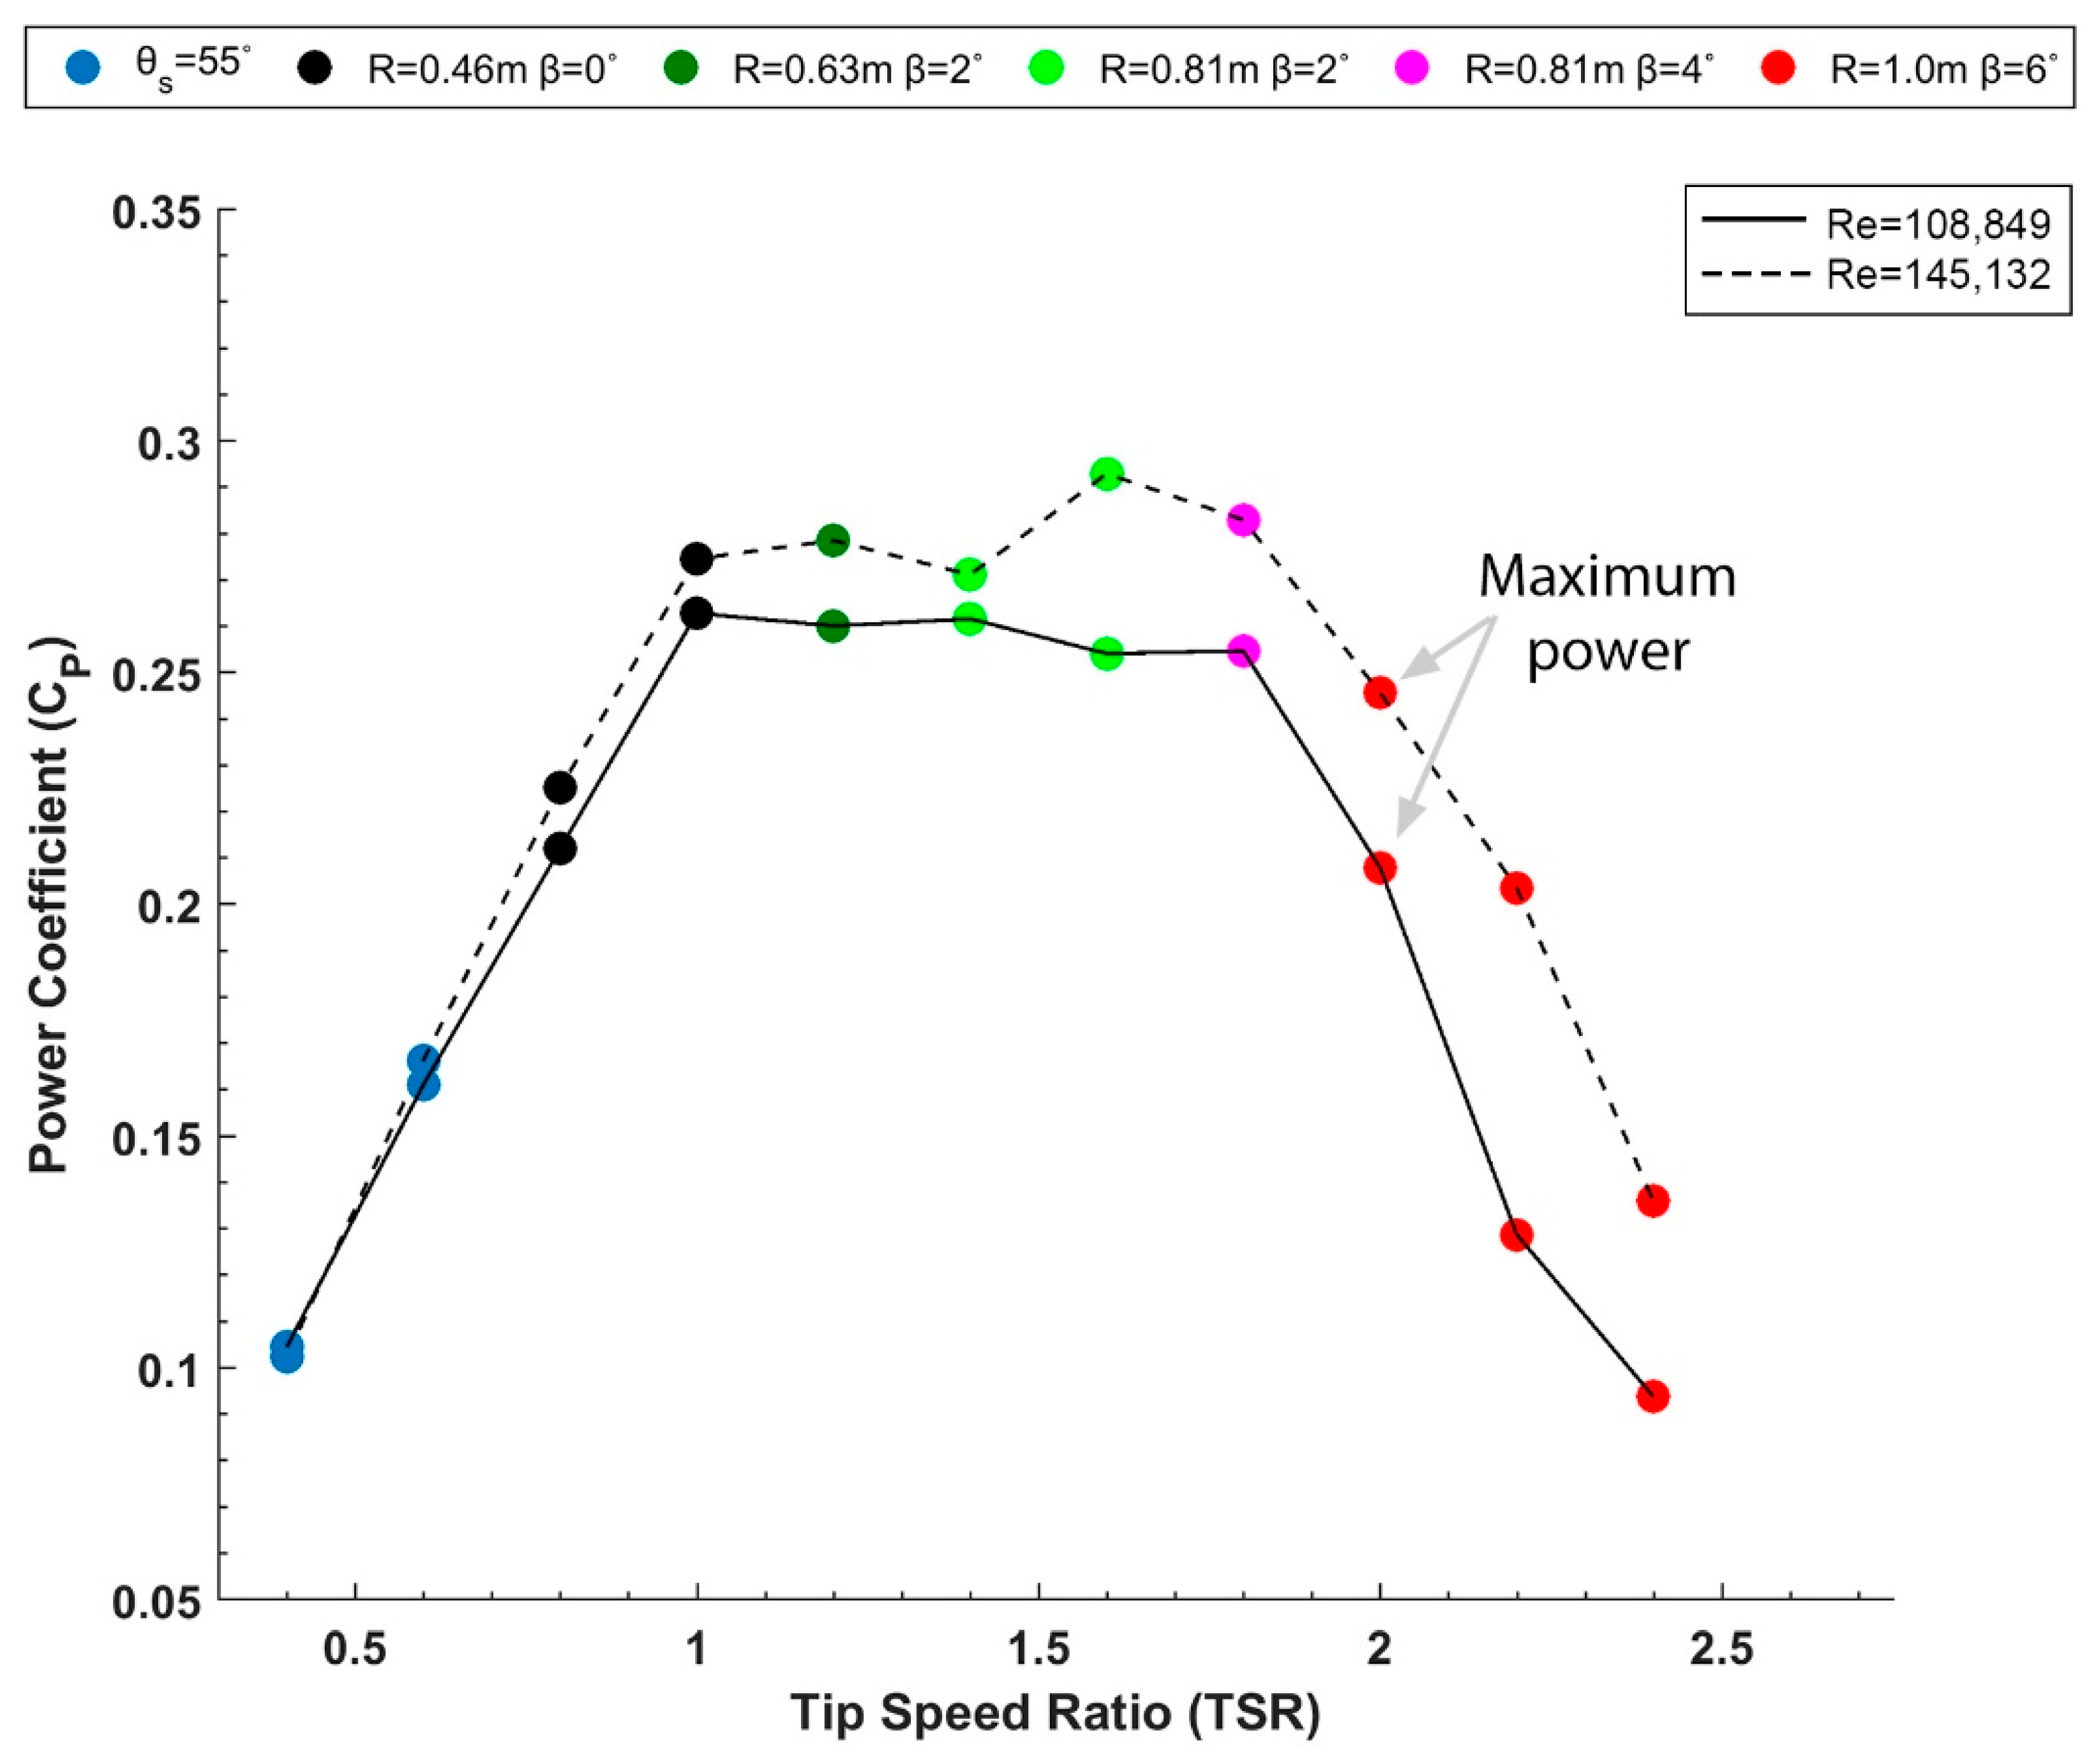
In order to validate the generated optimal blade trajectories, and analyze their sensitivity to wind velocity, a similar optimization process was repeated for a free-stream wind velocity of 6 m/s. This yielded a chord-based Reynolds number of 108,849. Figure 12 shows the power coefficient values at different TSRs for all the sampled configurations at Re = 108,849, where it was evident that the optimal Savonius configuration θ s = 55° remained the same. Moving on to the final radius (Rfinal = 1 m), β = 6° provided superior performance compared with other β values. Hence, the straight paths of the blades’ centers were generated and were identical to the ones generated for Re = 145,132. This was because both yielded similar optimized initial and final positions. Consequently, the optimization stages (Ri) were also identical to the ones chosen in Section 5.2, with radii R1 = 0.46 m, R2 = 0.63 m, and R3 = 0.81 m.
As evident from Figure 12, different values of β were analyzed at the three optimization stages, and a shift in the peak location was observed when increasing the rotor radius. At R = R1 = 0.46 m, the turbine with β = 0° provided the greatest efficiency, where it was clear that a transitioning process should occur from θs = 55° to this configuration at 0.6 < TSR < 1.2. At R = R2 = 0.63 m, β = 2° performed best, and therefore, this configuration should be adopted at 1.2 ≤ TSR ≤ 1.4. Moving on to the final optimization stage with R = R3 = 0.81 m, a similar phenomenon was replicated from the analysis with Re = 145,132, where two optimum values for β co-existed at different TSR ranges. For optimal performance, the turbine should have R = 0.81 m and β = 2° at 1.4 ≤ TSR ≤ 1.6, and R = 0.81 m and β = 4° at 1.6 < TSR < 2. A final transitioning process into R = Rfinal = 1 m and β = 6° should occur at TSR ≥ 2.0. If compared with the generated results from the previous analysis with Re = 145,132, the aforementioned optimal blades’ positions were exactly identical at their respective TSRs. Moreover, the point of maximum power generation (TSR = 2.0, R = 1 m, and β = 6°) was similar in both cases as well. This establishes a solid basis for rendering the optimized blades’ trajectories independent of Re values.
The efficiency of the optimized DR VAWT decreased with decreasing Reynolds number as evident in Figure 13. At the lower Reynolds number, a maximum Cp of 0.263 and an average Cp of 0.200 were obtained, and both were lower than the maximum Cp = 0.293 and Cp,avg = 0.225 of the higher Reynolds number case. The difference in Cp values was minimal at lower TSRs; however, it started to increase at higher TSRs, where the biggest difference was observed at TSR = 1.6 (Figure 13). Hence, it can be deduced that the effect of varying the Reynolds number simply resulted in a vertical shift in the overall power coefficient curve. This is typical behavior of VAWTs, which is commonly referred to in the literature [32,33].

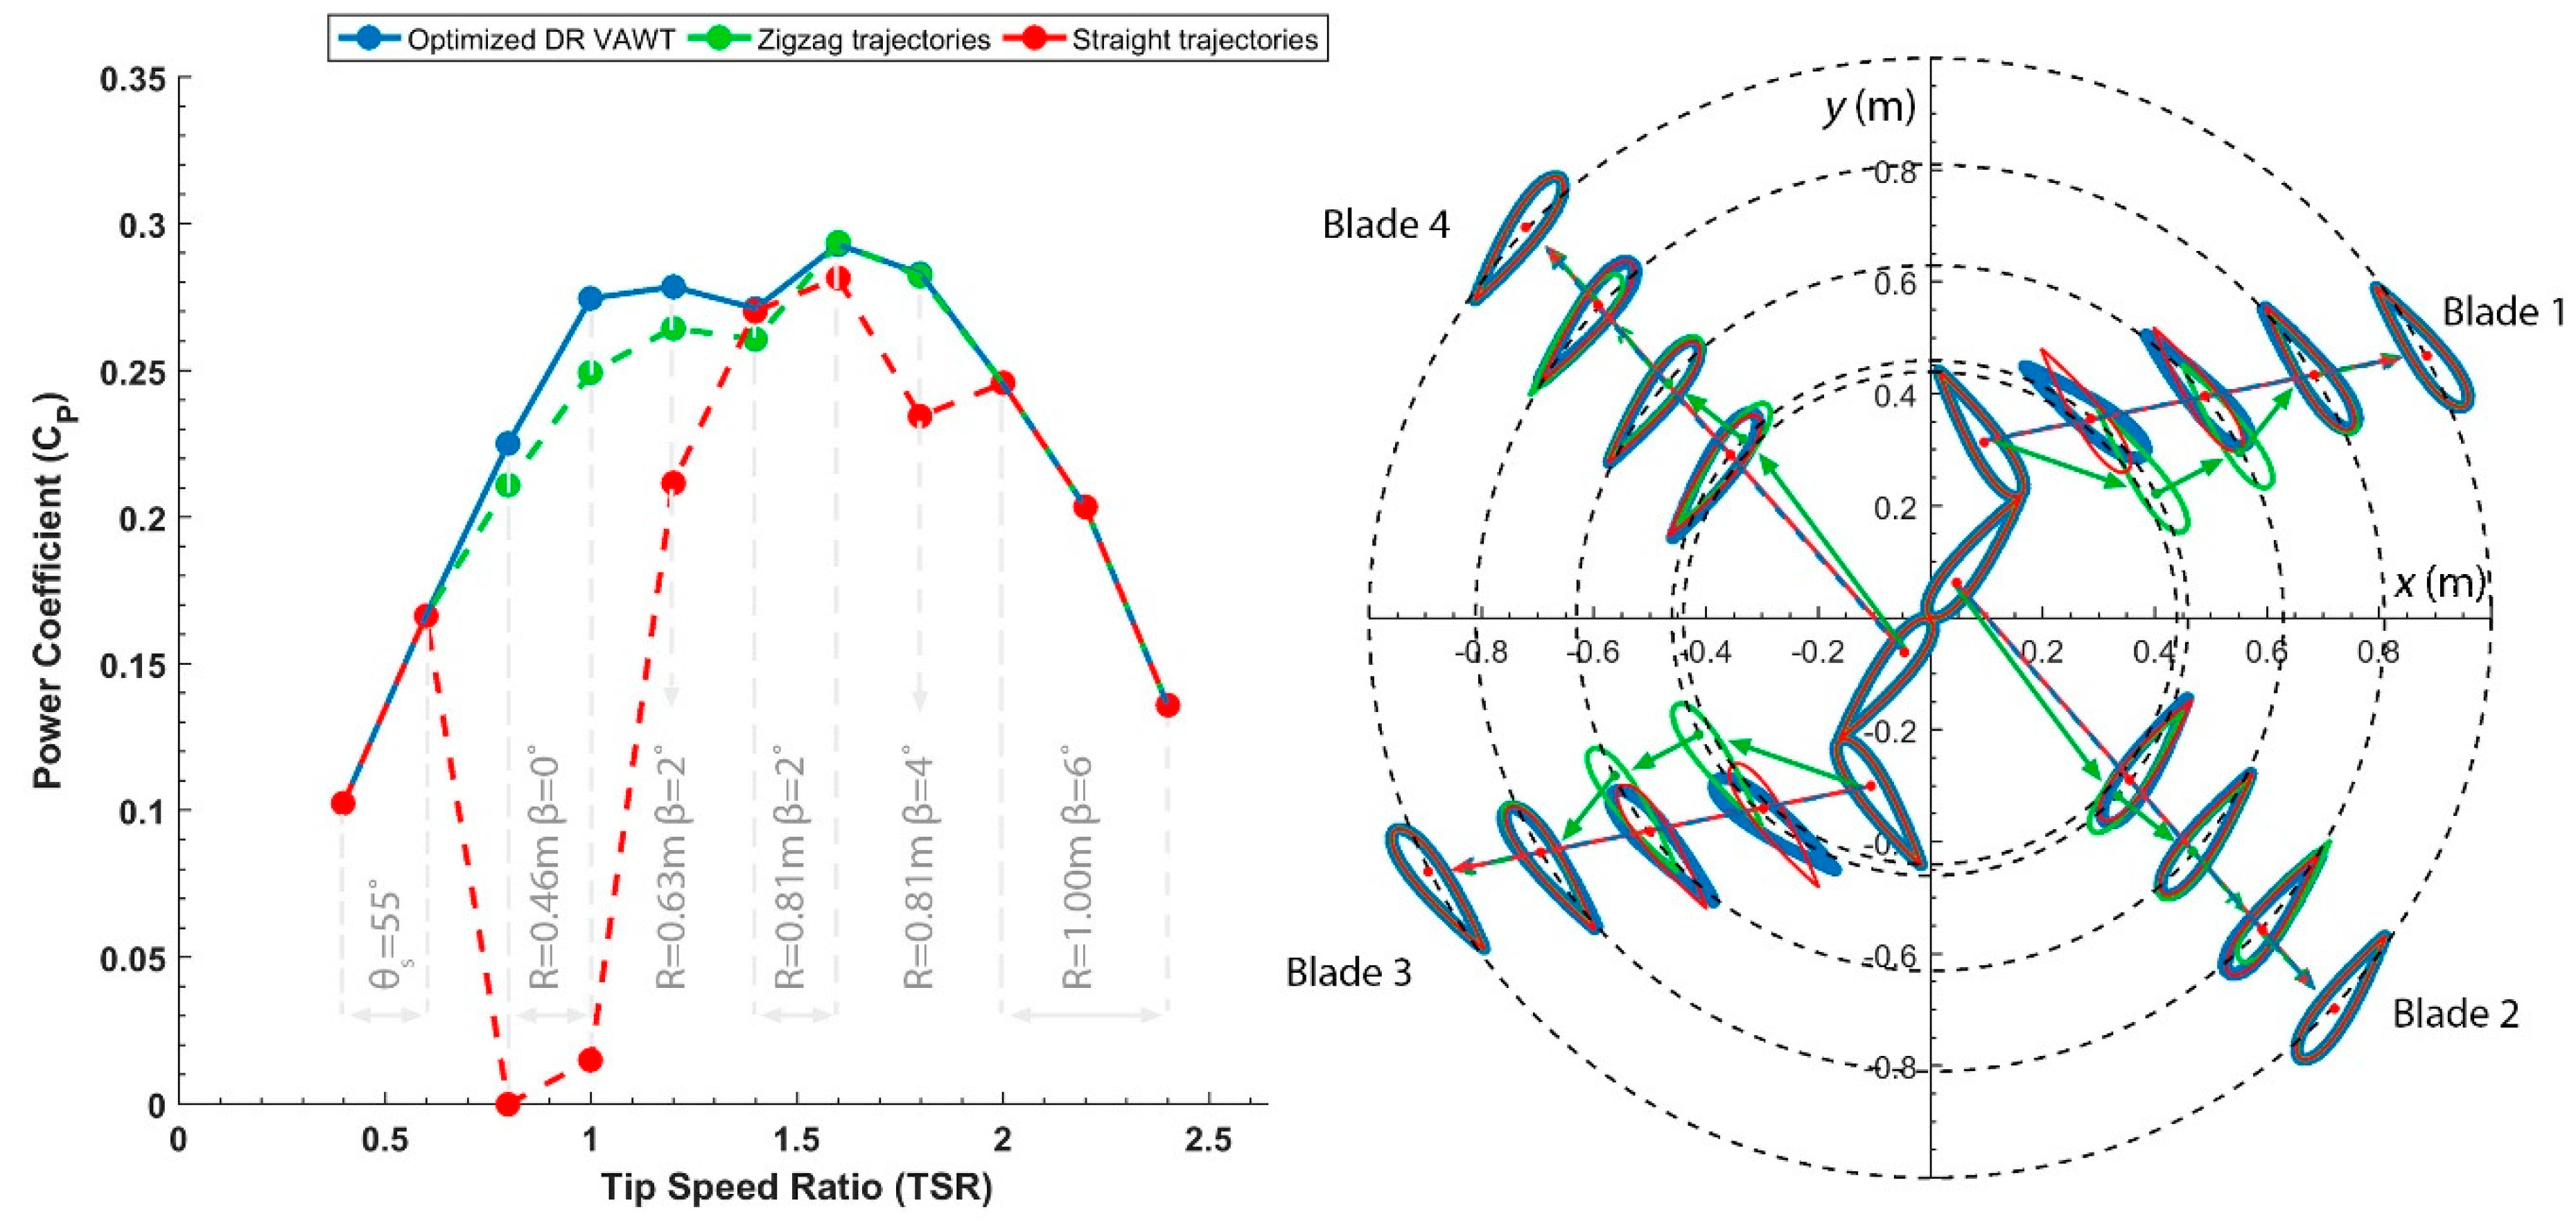
6.5. Effect of Blades’ Trajectories

Another sensitivity analysis was conducted on the blades’ optimized trajectories. The performance of the DR VAWT, with the following trajectories was compared to the optimized ones:
  • Zigzag trajectories: Each blade center followed a zigzag path, composed of four straight lines so that the optimal value of β was achieved at the corresponding radius and TSR. Each blade was allowed to translate while having fixed, angular orientations (Figure 14, green).
  • Straight trajectories: Each blade center followed the optimal straight path at the respective TSR (Table 1), with its angular orientation kept fixed. This means that there was no control over the pitch angle (β) when varying the radius, as seen in Figure 14 (red).
The fixed, angular orientations of the blades were based on the optimized Savonius configuration ( θ s = 55°) as discussed earlier. Figure 14 shows the power coefficient distribution for the DR VAWT following the zigzag and straight blades’ trajectories, with the optimized ones shown in blue. Since in all the simulated cases, the blades started from the same Savonius position, the performance of the optimized DR VAWT was replicated by both cases at TSR ≤ 0.6. Moving on to radius R1 = 0.46 m, it was evident that the zigzag trajectories yielded Cp values that were closer to the optimized configuration than the straight trajectory, with a maximum performance drop equal to 9% at TSR = 1.0. It can be seen from Figure 14 that the blades’ positions for the zigzag trajectories differred compared to the optimized ones at R = R1 = 0.46 m. Since blade vortex interactions are prominent for this high-solidity rotor, as previously discussed, changing the relative distances between the rotor’s blades was anticipated to have a slight influence on performance, even though both the zigzag and optimized cases have the same values of β at the respective R and TSR. When it comes to the straight trajectories at R1, the performance was heavily deteriorated, and the power generated by the turbine was minimal. The main reason behind this performance drop was the inability to control the blade’s angular orientation while transitioning along a straight path. Consequently, random values of the pitch angle β were obtained along the straight path causing a negative influence on the turbine’s performance. Table 2 provides a comparison between the resulting values of β for all the blades when transitioned along a straight path without changing the angular orientations (straight trajectories). Note that blades 1 and 3 will have the same β values due to their identical blade center paths as discussed previously (same applies to blades 2 and 4). It was evident that at R = R1 = 0.46 m, β = −18.36° for blade 1, which massively differed from the optimal value of 0°. This was the main reason why the DR VAWT following the straight trajectories generated minimal amounts torque-generating lift forces at R1.
At R = R2 = 0.63 m, the blades’ positions following the zigzag trajectories still differ compared to the optimized configuration, and thus, Cp slightly dropped by 5%. Regarding the case with straight trajectories, the resulting pitch angle at R2 is still negative (−5.69°) and differs from the optimal value of 2°, however to a lower extent this time. As a result, the DR VAWT with straight blades trajectories yields a value of Cp = 0.21 at TSR = 1.2. Moving on to R = R3 = 0.81 m, the performance of the optimized turbine was replicated by the zigzag trajectories since the blades’ positions were identical to a large extent, as seen in Figure 14. The case with the straight trajectories also yielded a decent performance, however, with slightly lower Cp values compared to the optimized DR VAWT. At R3, the optimal value for β was equal to 2° at 1.4 ≤ TSR ≤ 1.6, and equal to 4° at 1.6 < TSR ≤ 1.8. Since β = 1.5° for blade 1, which slightly differed from the optimal value, this constituted the main cause of the aforementioned performance drop. Overall, it can be said that adopting a mechanism that allows each blade center to follow a zigzag path without changing its angular orientation will provide an overall turbine performance close to the optimized one, since Cp,avg = 0.219, which is only 2.7% lower compared to Cp,avg = 0.225 of the optimized configuration. However, utilizing a simple mechanism that simply translates each blade center along a straight path without altering its angular orientation will yield poor efficiency at 0.6 < TSR ≤ 1.0 with an overall Cp,avg = 0.169, corresponding to a drop by 24.8%.

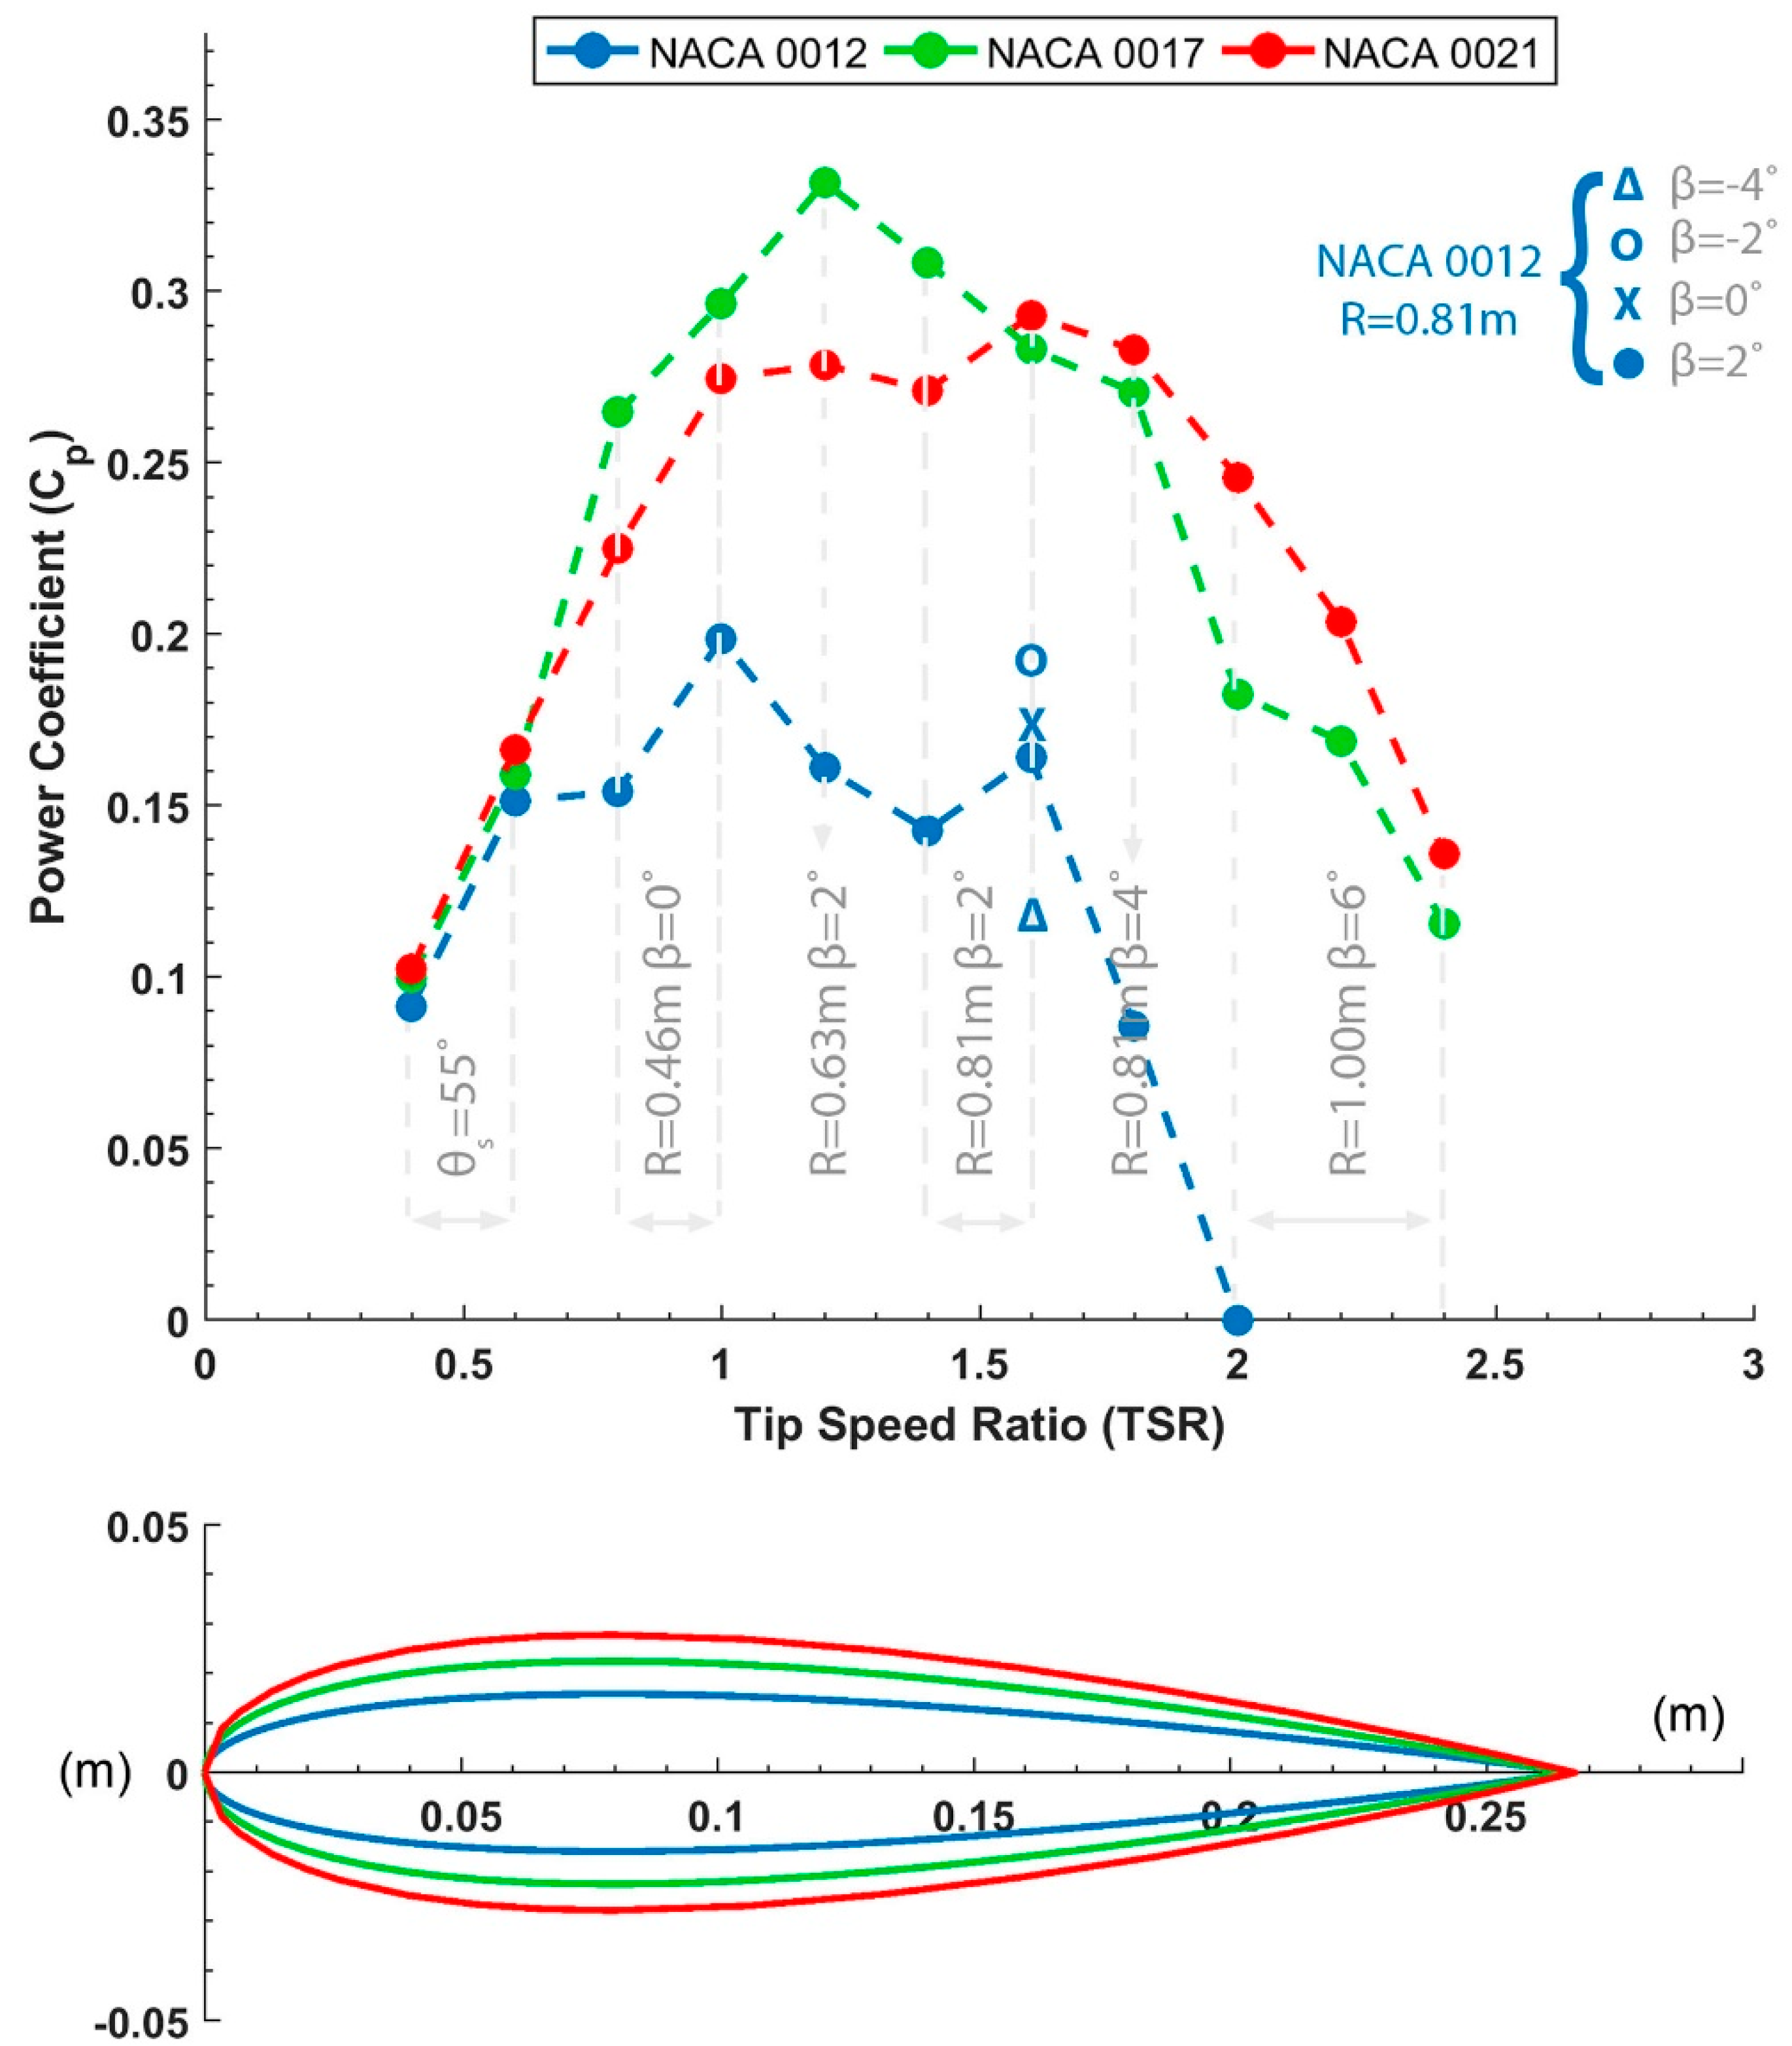
6.6. Effect of Airfoil Thickness

For a conventional four-digit NACA airfoil, the third and fourth digits represent the maximum airfoil thickness as a fraction of the chord length. The maximum thickness is located at 0.3 c from the leading edge of the airfoil. In the current work, optimal blades’ trajectories were generated while adopting NACA 0021 airfoil sections, as mentioned earlier. To study the influence of the airfoil thickness, the performance of the DR VAWT with the optimized blades’ trajectories was assessed utilizing two other airfoil sections: (1) NACA 0012 and (2) NACA 0017. The resulting power coefficient values are presented in Figure 15. It was evident that all cases generated the same amount of power at the Savonius configuration (TSR ≤ 0.6). This was anticipated since the Savonius turbine is a drag-based turbine, relying primarily on the drag forces resulting from the separated flow pressure differences between both sides of the turbine’s blades. Since altering the airfoil thickness does not have a considerable influence on the flow mechanisms, and ultimately on the generated pressure difference for a Savonius configuration, the performances of all three airfoil thicknesses were identical. However, the airfoil’s thickness had a considerable influence on the stalling characteristics, and pressure distributions of a Darrieus type VAWT according to several studies [34,35,36]. As seen in Figure 15, the power coefficient of the NACA 0017 and NACA 0021 configurations increased to an optimal value, and then decreased with increasing TSR for the Darrieus configurations. Additionally, the location where maximum Cp value occurred was different for both cases. Maximum Cp = 0.332 for the NACA 0017 configuration occurred at TSR = 1.2, while maximum Cp = 0.293 for the NACA 0021 configuration occurred at TSR = 1.6. The average power coefficient equalled 0.255 for both cases; however, the former performed better at lower TSRs (TSR < 1.6) and higher turbine solidity, while the latter delivered superior performance at higher TSRs (TSR ≥ 1.6) and lower solidities. Increasing the airfoil’s thickness by 4% (from NACA 0017 to NACA 0021) increased the radius of curvature at the airfoil’s leading edge. This, in turn, leads to smoother pressure differentials, and is the primary reason why thicker airfoils provide better stalling characteristics for the DR VAWT especially at higher TSRs. This also explains the heavily deteriorated performance resulting when adopting thinner NACA 0012 airfoil sections, where Cp,avg = 0.128 and the operational TSR range is narrowed (Figure 15). It is worth noting that the utilized pitch angles for all airfoil sections were extracted while utilizing NACA 0021 airfoils. Consequently, one may attribute the drop in performance to the fact that the DR VAWT with NACA 0012 airfoils was not operating at its optimal conditions. However, as seen from Figure 15, even when the performance of the former was optimized by having β = −2° at R = 0.81 m and TSR = 1.6, for instance, the optimized Cp value was still drastically lower compared to that of the optimized thicker airfoil sections. Hence, thin airfoil sections are clearly not suitable for the proposed DR VAWT.

7. Conclusions

The design of an optimized dynamic rotor vertical-axis wind turbine that is capable of transitioning from a Savonius rotor at the start-up phase to a Darrieus one of increasing radius with increasing TSR was presented. The dynamic rotor idea was based on the fact that the maximum Cp value is usually attained at higher TSRs when the rotor radius increases. With the DR VAWT designed to operate on the peak Cp locations, the operational TSR range and the average Cp value were successfully maximized while maintatining a low cut-in speed. The optimization of the turbine’s design was conducted using IDDES on a 2.5D grid, owing to its accuracy and decent computational demands. In order to provide benchmark data for a mechanism that could be feasibly replicated in reality, the blades centers were forced to move from an optimized initial position to an optimized final one along straight paths. Each of these paths were discretized into three optimization stages, where at each stage the blade pitch angle was optimized. The main findings of this study can be summarized as follows:
(1) The blades of the DR VAWT with NACA 0012 airfoils sections should follow the following trajectories for optimal performance: θs = 55° for TSR ≤ 0.6, R = 0.46 m and β = 0° for 0.6 < TSR < 1.2, R = 0.63 m and β = 2° for 1.2 ≤ TSR < 1.4, R = 0.81 m and β = 2° for 1.4 ≤ TSR ≤ 1.6, R = 0.81 m and β = 4° for 1.6 < TSR < 2, and finally, R = 1.00 m and β = 6° for TSR ≥ 2.0.
(2) At Re = 145,132, the optimized DR VAWT yielded a maximum Cp = 0.293 at TSR = 1.6, along with Cp,avg = 0.225, which is 192% larger compared to Cp,avg = 0.077 of the optimal Savonius configuration, 87.5% larger compared to Cp,avg = 0.120 of the optimal Darrieus configuration at Rfinal, and 120% larger compared to Cp,avg = 0.102 of the hybrid Savonius–Darrieus turbine with θ s = 55°, R = 1 m, β = 6°.
(3) The effect of the Reynolds number was analyzed where the same optimization process was repeated at Re = 108,849. It was concluded that the optimal blades trajectories were identical to the ones generated at Re = 145,132, hence, they were deemed Reynolds-number independent. However, the average power coefficient value of the DR VAWT at the lower Re decreased by 11%.
(4) At TSR = 2.0, R = 1.0 m and β = 6°, and the maximum amount of power was generated by the DR VAWT irrespective of the value of Re. With the ability to control the load on the turbine, hence, the rotational velocity, one could aim to operate at this point, and profit from the excellent start-up characteristics of the Savonius configuration and the efficient transitioning process.
(5) The effect of the blades’ trajectories was studied by generating power coefficient curves for a DR VAWT with all its blades’ centers following two paths with fixed-blade angular orientations. One path was zigzag, and was generated in such a way as to attain the optimal values for β at the respective R and TSR. While the other path was simply straight, hence, no control on the values of β. The zigzag trajectories yielded close performance to the optimized configuration with a drop in Cp,avg of only 2.6%. However, the straight one deteriorated the turbine’s performance, with a 25% drop in Cp,avg.
(6) The effect of airfoil thickness was also analyzed by simulating the performance of the optimized DR VAWT with the following airfoil sections: (1) NACA 0012; (2) NACA 0017; and (3) NACA 0021. It was shown that the average power coefficient was identical for both the NACA 0017 and NACA 0021 sections, where the former performed better at lower TSRs and higher solidities, and vice versa for the latter. The NACA 0012 section provided poor performance, which manifested in a drastic drop of 43% in Cp,avg.

Author Contributions

E.A. performed all the numerical simulations, and prepared this manuscript. All of the authors contributed to the analyses of the data. A.E.C. and M.E. supervised the work.

Funding

This research received funding from LAU-CNRS.

Acknowledgments

We would like to thank Salim Jamal-Eddine and all lab supervisors for their constant support and availability.

Conflicts of Interest

The authors declare no conflict of interest.

References

  1. Wenehenubun, F.; Saputra, A.; Sutanto, H. An Experimental Study on the Performance of Savonius Wind Turbines Related with The Number of Blades. Energy Procedia 2015, 68, 297–304. [Google Scholar] [CrossRef]
  2. Golecha, K.; Kamoji, M.A.; Kedare, S.B.; Prabhu, S.V. Review on Savonius Rotor for Harnessing Wind Energy. Wind Eng. 2012, 36, 605–645. [Google Scholar] [CrossRef]
  3. Jin, X.; Zhao, G.; Gao, K.; Ju, W. Darrieus vertical axis wind turbine: Basic research methods. Renew. Sustain. Energy Rev. 2014, 42, 212–225. [Google Scholar] [CrossRef]
  4. World Wind Energy Association—Wind Power Capacity Reaches 539 GW, 52,6 GW Added in 2017, (n.d.). Available online: https://wwindea.org/blog/2018/02/12/2017-statistics/ (accessed on 11 November 2018).
  5. Wong, K.H.; Chong, W.T.; Sukiman, N.L.; Poh, S.C.; Shiah, Y.-C.; Wang, C.-T. Performance enhancements on vertical axis wind turbines using flow augmentation systems: A review. Renew. Sustain. Rev. 2017, 73, 904–921. [Google Scholar] [CrossRef]
  6. Macphee, D.W.; Beyene, A. Fluid–structure interaction analysis of a morphing vertical axis wind turbine. J. Fluids Struct. 2016, 60, 143–159. [Google Scholar] [CrossRef]
  7. Howell, R.; Qin, N.; Edwards, J.; Durrani, N. Wind tunnel and numerical study of a small vertical axis wind turbine. Renew. Energy 2010, 35, 412–422. [Google Scholar] [CrossRef] [Green Version]
  8. Ouro, P.; Stoesser, T. An immersed boundary-based large-eddy simulation approach to predict the performance of vertical axis tidal turbines. Comput. Fluids 2017, 152, 74–87. [Google Scholar] [CrossRef] [Green Version]
  9. Wekesa, D.W.; Wang, C.; Wei, Y.; Zhu, W. Experimental and numerical study of turbulence effect on aerodynamic performance of a small-scale vertical axis wind turbine. J. Wind Eng. Ind. Aerodyn. 2016, 157, 1–14. [Google Scholar] [CrossRef]
  10. Goh, S.C.; Boopathy, S.R.; Krishnaswami, C.; Schluter, J.U. Tow testing of Savonius wind turbine above a bluff body complemented by CFD simulation. Renew. Energy 2016, 87, 332–345. [Google Scholar] [CrossRef]
  11. Tian, W.; Mao, Z.; Zhang, B.; Li, Y. Shape optimization of a Savonius wind rotor with different convex and concave sides. Renew. Energy 2018, 117, 287–299. [Google Scholar] [CrossRef]
  12. Ferrari, G.; Federici, D.; Schito, P.; Inzoli, F.; Mereu, R. CFD study of Savonius wind turbine: 3D model validation and parametric analysis. Renew. Energy 2017, 105, 722–734. [Google Scholar] [CrossRef] [Green Version]
  13. Kamoji, M.; Kedare, S.; Prabhu, S. Performance tests on helical Savonius rotors. Renew. Energy 2009, 34, 521–529. [Google Scholar] [CrossRef]
  14. Tahani, M.; Rabbani, A.; Kasaeian, A.; Mehrpooya, M.; Mirhosseini, M. Design and numerical investigation of Savonius wind turbine with discharge flow directing capability. Energy 2017, 130, 327–338. [Google Scholar] [CrossRef]
  15. Roy, S.; Ducoin, A. Unsteady analysis on the instantaneous forces and moment arms acting on a novel Savonius-style wind turbine. Convers. Manag. 2016, 121, 281–296. [Google Scholar] [CrossRef]
  16. El-Askary, W.; Nasef, M.; Abdel-Hamid, A.; Gad, H. Harvesting wind energy for improving performance of Savonius rotor. J. Wind Eng. Ind. Aerodyn. 2015, 139, 8–15. [Google Scholar] [CrossRef]
  17. Mohamed, M.; Janiga, G.; Pap, E.; Thévenin, D.; Mohamed, M. Optimal blade shape of a modified Savonius turbine using an obstacle shielding the returning blade. Convers. Manag. 2011, 52, 236–242. [Google Scholar] [CrossRef]
  18. Altan, B.D.; Atılgan, M. The use of a curtain design to increase the performance level of a Savonius wind rotors. Renew. Energy 2010, 35, 821–829. [Google Scholar] [CrossRef]
  19. Antar, E.; Elkhoury, M. Parametric Sizing Optimization Process of a Casing for a Savonius Vertical Axis Wind Turbine. Renew. Energy 2019, 136, 127–138. [Google Scholar] [CrossRef]
  20. Spalart, P.R.; Deck, S.; Shur, M.L.; Squires, K.D.; Strelets, M.K.; Travin, A.; Shur, M. A New Version of Detached-eddy Simulation, Resistant to Ambiguous Grid Densities. Theor. Comput. Dyn. 2006, 20, 181–195. [Google Scholar] [CrossRef]
  21. Subramanian, A.; Yogesh, S.A.; Sivanandan, H.; Giri, A.; Vasudevan, M.; Mugundhan, V.; Velamati, R.K. Effect of airfoil and solidity on performance of small scale vertical axis wind turbine using three dimensional CFD model. Energy 2017, 133, 179–190. [Google Scholar] [CrossRef]
  22. Wang, Z.; Zhuang, M. Leading-edge serrations for performance improvement on a vertical-axis wind turbine at low tip-speed-ratios. Appl. Energy 2017, 208, 1184–1197. [Google Scholar] [CrossRef]
  23. Kumar, P.M.; Kulkarni, R.; Srikanth, N.; Lim, T.-C. Performance Assessment of Darrieus Turbine with Modified Trailing Edge Airfoil for Low Wind Speeds. Smart Grid Renew. 2017, 8, 425–439. [Google Scholar] [CrossRef]
  24. Asr, M.T.; Nezhad, E.Z.; Mustapha, F.; Wiriadidjaja, S. Study on start-up characteristics of H-Darrieus vertical axis wind turbines comprising NACA 4-digit series blade airfoils. Energy 2016, 112, 528–537. [Google Scholar] [CrossRef]
  25. ElKhoury, M.; Kiwata, T.; Aoun, E. Experimental and numerical investigation of a three-dimensional vertical-axis wind turbine with variable-pitch. J. Wind Eng. Ind. Aerodyn. 2015, 139, 111–123. [Google Scholar] [CrossRef]
  26. Hu, R.; Wang, L.; Fu, S. Improved Delayed Detached Eddy Simulation of Flow Structures behind A Backward-Facing Step. In 54th AIAA Aerospace Sciences Meeting; American Institute of Aeronautics and Astronautics: Reston, VA, USA, 2016. [Google Scholar] [CrossRef]
  27. Shur, M.L.; Spalart, P.R.; Strelets, M.K.; Travin, A.K. A hybrid RANS-LES approach with delayed-DES and wall-modelled LES capabilities. Int. J. Heat Flow 2008, 29, 1638–1649. [Google Scholar] [CrossRef]
  28. Lei, H.; Zhou, D.; Bao, Y.; Li, Y.; Han, Z. Three-dimensional Improved Delayed Detached Eddy Simulation of a two-bladed vertical axis wind turbine. Convers. Manag. 2017, 133, 235–248. [Google Scholar] [CrossRef]
  29. Li, C.; Zhu, S.; Xu, Y.-L.; Xiao, Y. 2.5D large eddy simulation of vertical axis wind turbine in consideration of high angle of attack flow. Renew. Energy 2013, 51, 317–330. [Google Scholar] [CrossRef] [Green Version]
  30. Rezaeiha, A.; Kalkman, I.; Blocken, B. CFD simulation of a vertical axis wind turbine operating at a moderate tip speed ratio: Guidelines for minimum domain size and azimuthal increment. Renew. Energy 2017, 107, 373–385. [Google Scholar] [CrossRef] [Green Version]
  31. Balduzzi, F.; Bianchini, A.; Maleci, R.; Ferrara, G.; Ferrari, L. Critical issues in the CFD simulation of Darrieus wind turbines. Renew. Energy 2016, 85, 419–435. [Google Scholar] [CrossRef]
  32. Bravo, R.; Tullis, S.; Ziada, S. Performance Testing of a Small Vertical-Axis Wind Turbine, 21st Can. Congress Applied Mechanics CANCAM. (2007) 2–3. Available online: http://www.eng.mcmaster.ca/~stullis/index_files/Bravo CANCAM 2007.pdf (accessed on 5 July 2018).
  33. ElKhoury, M.; Kiwata, T.; Nagao, K.; Kono, T.; Elhajj, F. Wind tunnel experiments and Delayed Detached Eddy Simulation of a three-bladed micro vertical axis wind turbine. Renew. Energy 2018, 129, 63–74. [Google Scholar] [CrossRef]
  34. Chen, J.; Chen, L.; Xu, H.; Yang, H.; Ye, C.; Liu, D. Performance improvement of a vertical axis wind turbine by comprehensive assessment of an airfoil family. Energy 2016, 114, 318–331. [Google Scholar] [CrossRef]
  35. Wang, Y.; Shen, S.; Li, G.; Huang, D.; Zheng, Z. Investigation on aerodynamic performance of vertical axis wind turbine with different series airfoil shapes. Renew. Energy 2018, 126, 801–818. [Google Scholar] [CrossRef]
  36. Jafari, M.; Razavi, A.; Mirhosseini, M. Effect of airfoil profile on aerodynamic performance and economic assessment of H-rotor vertical axis wind turbines. Energy 2018, 165, 792–810. [Google Scholar] [CrossRef]
Figure 1. Schematic showing the two independent coordinate systems used to define a single-blade position for the Savonius (blue) and Darrieus (green) configurations.
Energies 12 01446 g001
Figure 2. Effect of varying the angle (θs) on the geometric orientation of the Savonius rotor shape.
Energies 12 01446 g002
Figure 3. Schematic showing an arbitrarily chosen initial (blue) and final (red) blades’ positions, along with the resulting blades’ centers paths (green).
Energies 12 01446 g003
Figure 4. The 2.5D computational domain with the rotor zone shown in red.
Energies 12 01446 g004
Figure 5. Power coefficient curves for the Savonius configurations with different θs, and the Darrieus configurations with different R and β (Re = 145,132).
Energies 12 01446 g005
Figure 6. Instantaneous torque coefficient for three Savonius configurations at a tip speed ratio (TSR) of 0.6.
Energies 12 01446 g006
Figure 7. Instantaneous pressure (top) and velocity (bottom) contours at TSR = 0.6 for the three Savonius configurations at θ = 100°.
Energies 12 01446 g007
Figure 8. Angle of attack variation with the rotor’s azimuthal position at different TSRs and blade pitch angles.
Energies 12 01446 g008
Figure 9. Instantaneous torque coefficient distribution for the Darrieus turbine with R = 0.46 m and TSR = 1.0, for various blade pitch angles (β).
Energies 12 01446 g009
Figure 10. Instantaneous Z-vorticity (s−1) field at R = 0.46 m for β = 0° (left), β = 2° (center), β = 4° (right) at TSR = 1.0.
Energies 12 01446 g010
Figure 11. Overall power coefficient (Cp) curve of the optimized Dynamic Rotor Vertical Axis Wind Turbine (DR VAWT) (left), and a schematic showing the optimal blades trajectories at V = 8 m/s (Re = 145,132).
Energies 12 01446 g011
Figure 12. Power coefficient curves for the Savonius configurations with different θs, and the Darrieus configurations with different R and β at V = 6 m/s (Re = 108,849).
Energies 12 01446 g012
Figure 13. Overall power coefficient distribution of the optimized DR VAWT at Re = 108,849 and Re = 145,132.
Energies 12 01446 g013
Figure 14. Power coefficient distribution curves for the optimized, zigzag, and straight blades’ trajectories (Re = 145,132).
Energies 12 01446 g014
Figure 15. Power coefficient values of the DR VAWT with different airfoil sections (Re = 145,132).
Energies 12 01446 g015
Table 1. Path equations of the blades’ centers.
X LIMITS (M)PATH EQUATION
BLADE 1 0.0760 x 1 0.8746 y 1 = 0.191 x 1 + 0.318
BLADE 2 0.0775 x 2 0.7354 y 2 = 1.212 x 2 + 0.214
BLADE 3 0.8746 x 3 0.0760 y 3 = 0.191 x 3 0.318
BLADE 4 0.7354 x 4 0.0775 y 4 = 1.212 x 4 0.214
Table 2. Generated pitch angle values resulting from the blades following the straight trajectories with no change in their angular orientations.
Radius (m)Blades 1 and 3Blade 2 and 4Optimal Values
(R1) 0.46−18.36°
(R2) 0.63−5.69°
(R3) 0.811.5°2°or 4°
(Rfinal) 1

