1. Introduction
The household sector accounts for about 25% of final energy consumption or 17.4% of gross inland energy consumption in the European Union EU, making it one of the largest contributors of Green House Gas (GHG) emissions in the atmosphere. From that, 79.2% is used for water and space heating (64.7% space heating and 14.5% water heating), mainly by burning combustible fuels like natural gas and oil, as well as transforming electricity to heat in electrical boilers or heat pumps [
1]. As world trends head towards a decarbonized and sustainable society, solar collectors for domestic water and space heating gain space as a reliable and environmentally friendly technology.
Simple thermosyphon-type systems employing naturally driven fluid circulation are used for water heating, while larger systems employing forced (pumped) circulation are used for both water and space heating. The latter represent a huge potential in the residential, industrial, and district heating sectors, especially in the form of large-scale solar collector arrays. The European Technology Platform on Renewable Heating and Cooling, a group consisting of stakeholders from the biomass, geothermal, solar thermal, and heat pump sectors, including the related industries, had published the Strategic Research and Innovation Agenda (SRA) [
2], where the strategic research priorities to enable an increasing share of heating and cooling to be supplied by Renewable Energy Sources (RES) are defined. Within the solar thermal sector, a key priority is the optimization of large-scale solar collectors and solar collector arrays for uniform flow distribution and low pumping power.
An important category of these systems refers to large flat plate solar collector units, employing the Z-type configuration. This involves an inlet and an outlet manifold, as well as a number of riser tubes (10–20, depending on the total collector area). The uniformity of the flow distribution within the parallel riser tubes plays an important role in the overall collector efficiency. Chiou et al. [
3] investigated such a system and concluded that the collector efficiency can be decreased more than 20% if the uniformity of the fluid flow diminishes, however without verifying it experimentally. Wang and Wu [
4] studied the flow and temperature distribution in flat plate solar collector arrays via a discrete numerical model and found that flow non-uniformity has a detrimental effect on the thermal performance of the collector. Weitbrecht et al. [
5] experimentally studied the flow distribution in flat plate solar collectors using laser Doppler velocimetry for their measurements. Wang [
6] and Maharudrayya [
7] utilized an analytical approach to study the problem of fluid flow distribution in the channels of a Z-type configuration, demonstrating that as the Reynolds number increases, the flow becomes non-uniform. Kim et al. [
8] investigated the effect of the shape of the riser tube cross section. They studied three types of risers: rectangular, triangular, and trapezoidal. A more uniform flow distribution was observed in triangular riser tubes, but the corresponding pressure drop was prohibitive for commercial applications. Facao [
9] studied numerically the flow distribution in a Z-type configuration and proposed the modification of the inlet and outlet tube diameters, aiming to improve its uniformity. Garcia-Guendulain et al. [
10] analyzed numerically, by means of CFD, four flat plate solar collector configurations and proposed the use of distribution plates inside the inlet and outlet manifolds to improve flow uniformity.
In light of the above, the present paper presents a study of the flow characteristics in the manifold of a Z-type solar collector. Both experimental measurements and numerical simulations are carried out and their results are compared to each other. Parametric studies are performed with respect to the hydrodynamic performance of the collector for various inlet mass flow rate values. Furthermore, a method aiming to the enhancement of flow uniformity among risers is presented and implemented, resulting in a collector with modified riser diameters. The flow uniformity in the redesigned collector is assessed by means of numerical simulations.
2. Selection of Test Cases
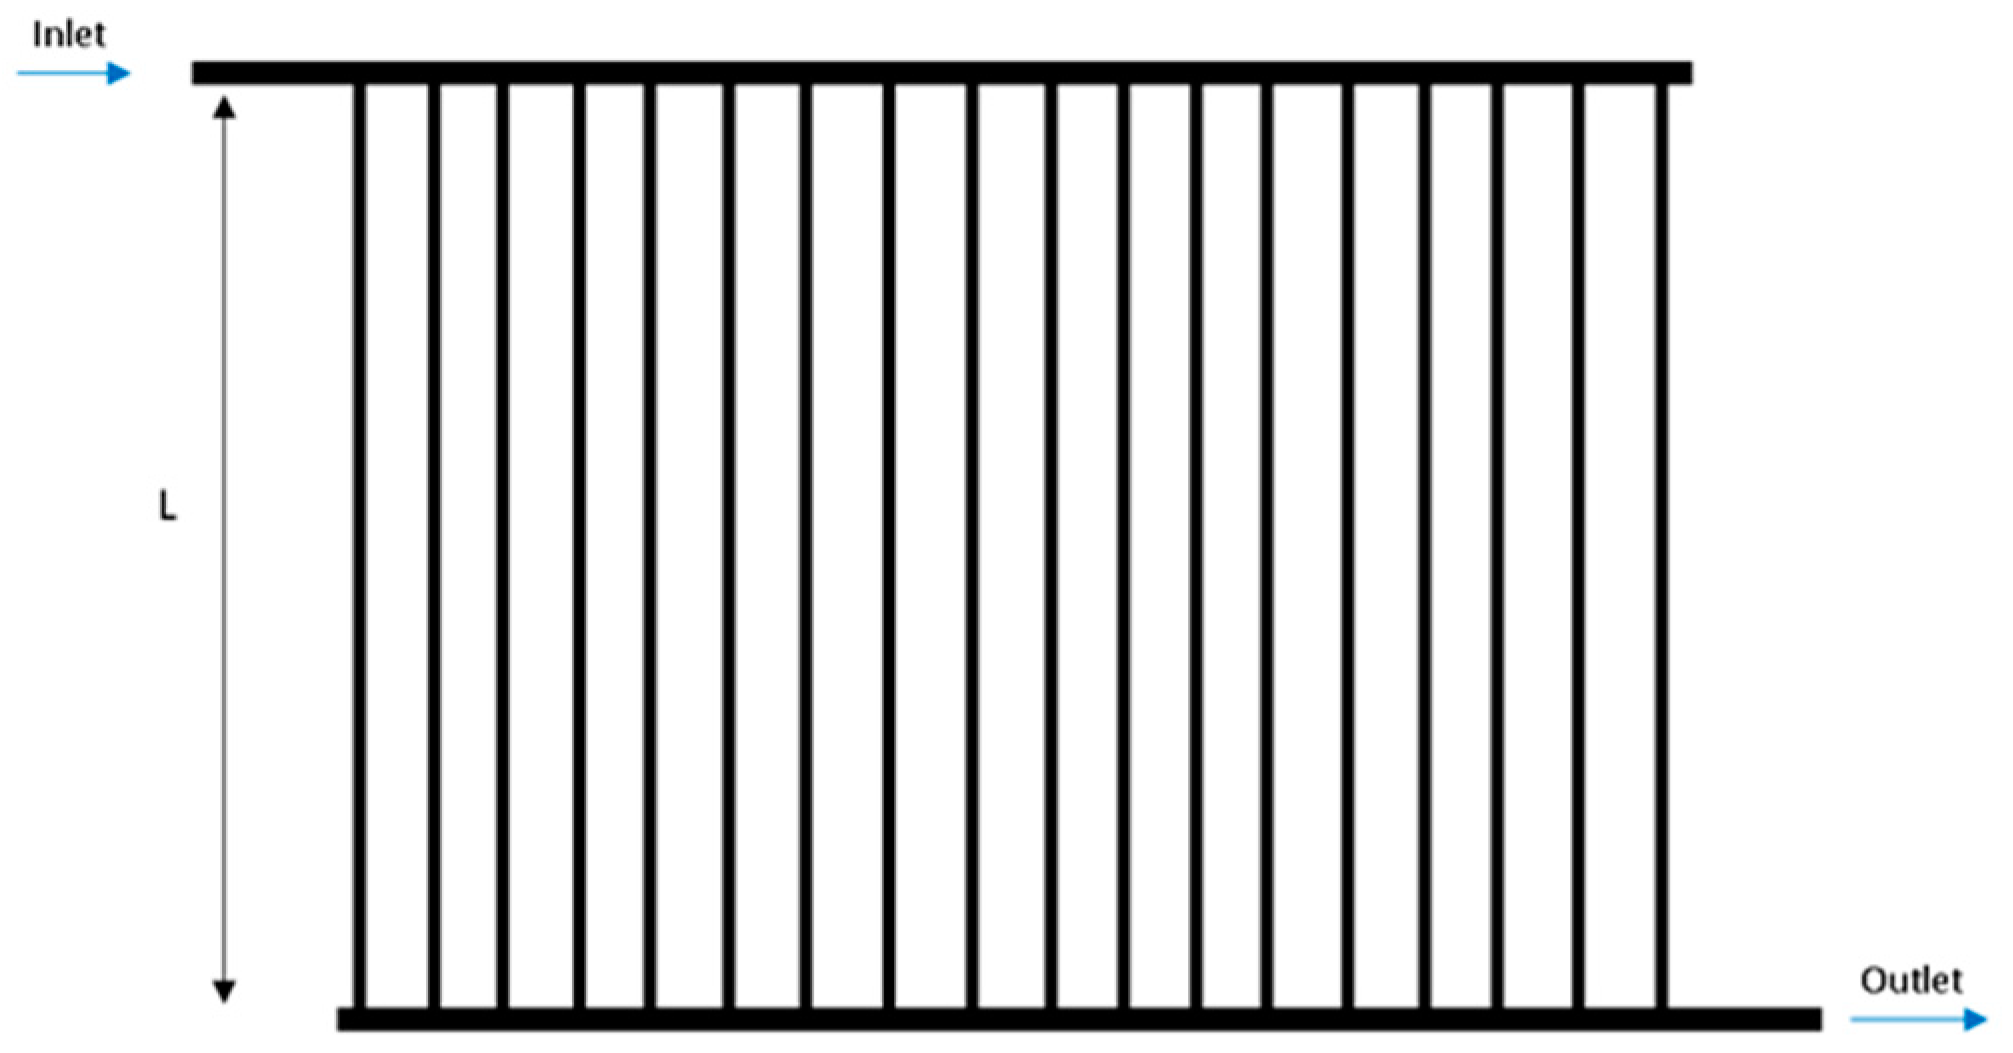
The device under investigation concerns a solar collector pipe system, used in a typical large solar collector. The specific design is presented in
Figure 1. It has an effective area of 2.4 m
2 and consists of an inlet manifold pipe, an outlet manifold pipe, and 18 riser tubes in a Z-type configuration. The diameter of the inlet and outlet manifolds is 22 mm, that of the riser tubes is 8 mm, while their wall thicknesses are 0.7 mm and 0.45 mm, respectively. The riser tubes have a length of L = 1170 mm, while the center-to-center distance between two adjacent risers is 120 mm.
The basis for the selection of the cases examined in the present study is the ISO 9806:2017 standard [
11], which is currently the standard followed by certification laboratories for the testing of solar thermal collectors. According to the latter, the recommendation for pressure drop measurements is to perform them over a range of flow rates from 0.005 kg/s to 0.03 kg/s per square meter of collector gross area. Within the above range, the recommended value by most solar collector manufacturers for thermal performance testing is around 0.02 kg/s per square meter value. In the present case of the collector under investigation, the equivalent flow range is 0.012–0.072 kg/s and the central value is 0.048 kg/s. Based on the above, six cases were selected for the present investigation, which cover the above range, as well as extending the range towards higher flow rates, which the authors believe could be implemented in the near future in practical systems.
Table 1 summarizes the various cases studied herein. All of them were numerically simulated, while three of them—cases 4, 5, and 6—were also investigated experimentally due to limitations in the measurement technique.
Table 1 also includes the corresponding Reynolds numbers at the inlet manifold and the riser tubes, under the assumption of uniform flow distribution among the risers. Based on the estimated riser local Reynolds numbers (defined below), the flow within the tubing system is expected to be mostly within the laminar or at least the transitional flow regime, which is highly relevant for the numerical modeling to be analyzed in the following sections. It is worth noting that in case 6, corresponding to the highest inlet Reynolds number, the expected local riser Reynolds is 1240, while the critical value for transition from laminar to turbulent flow is known to be 2200.
3. Experimental Investigation
3.1. Experimental Setup
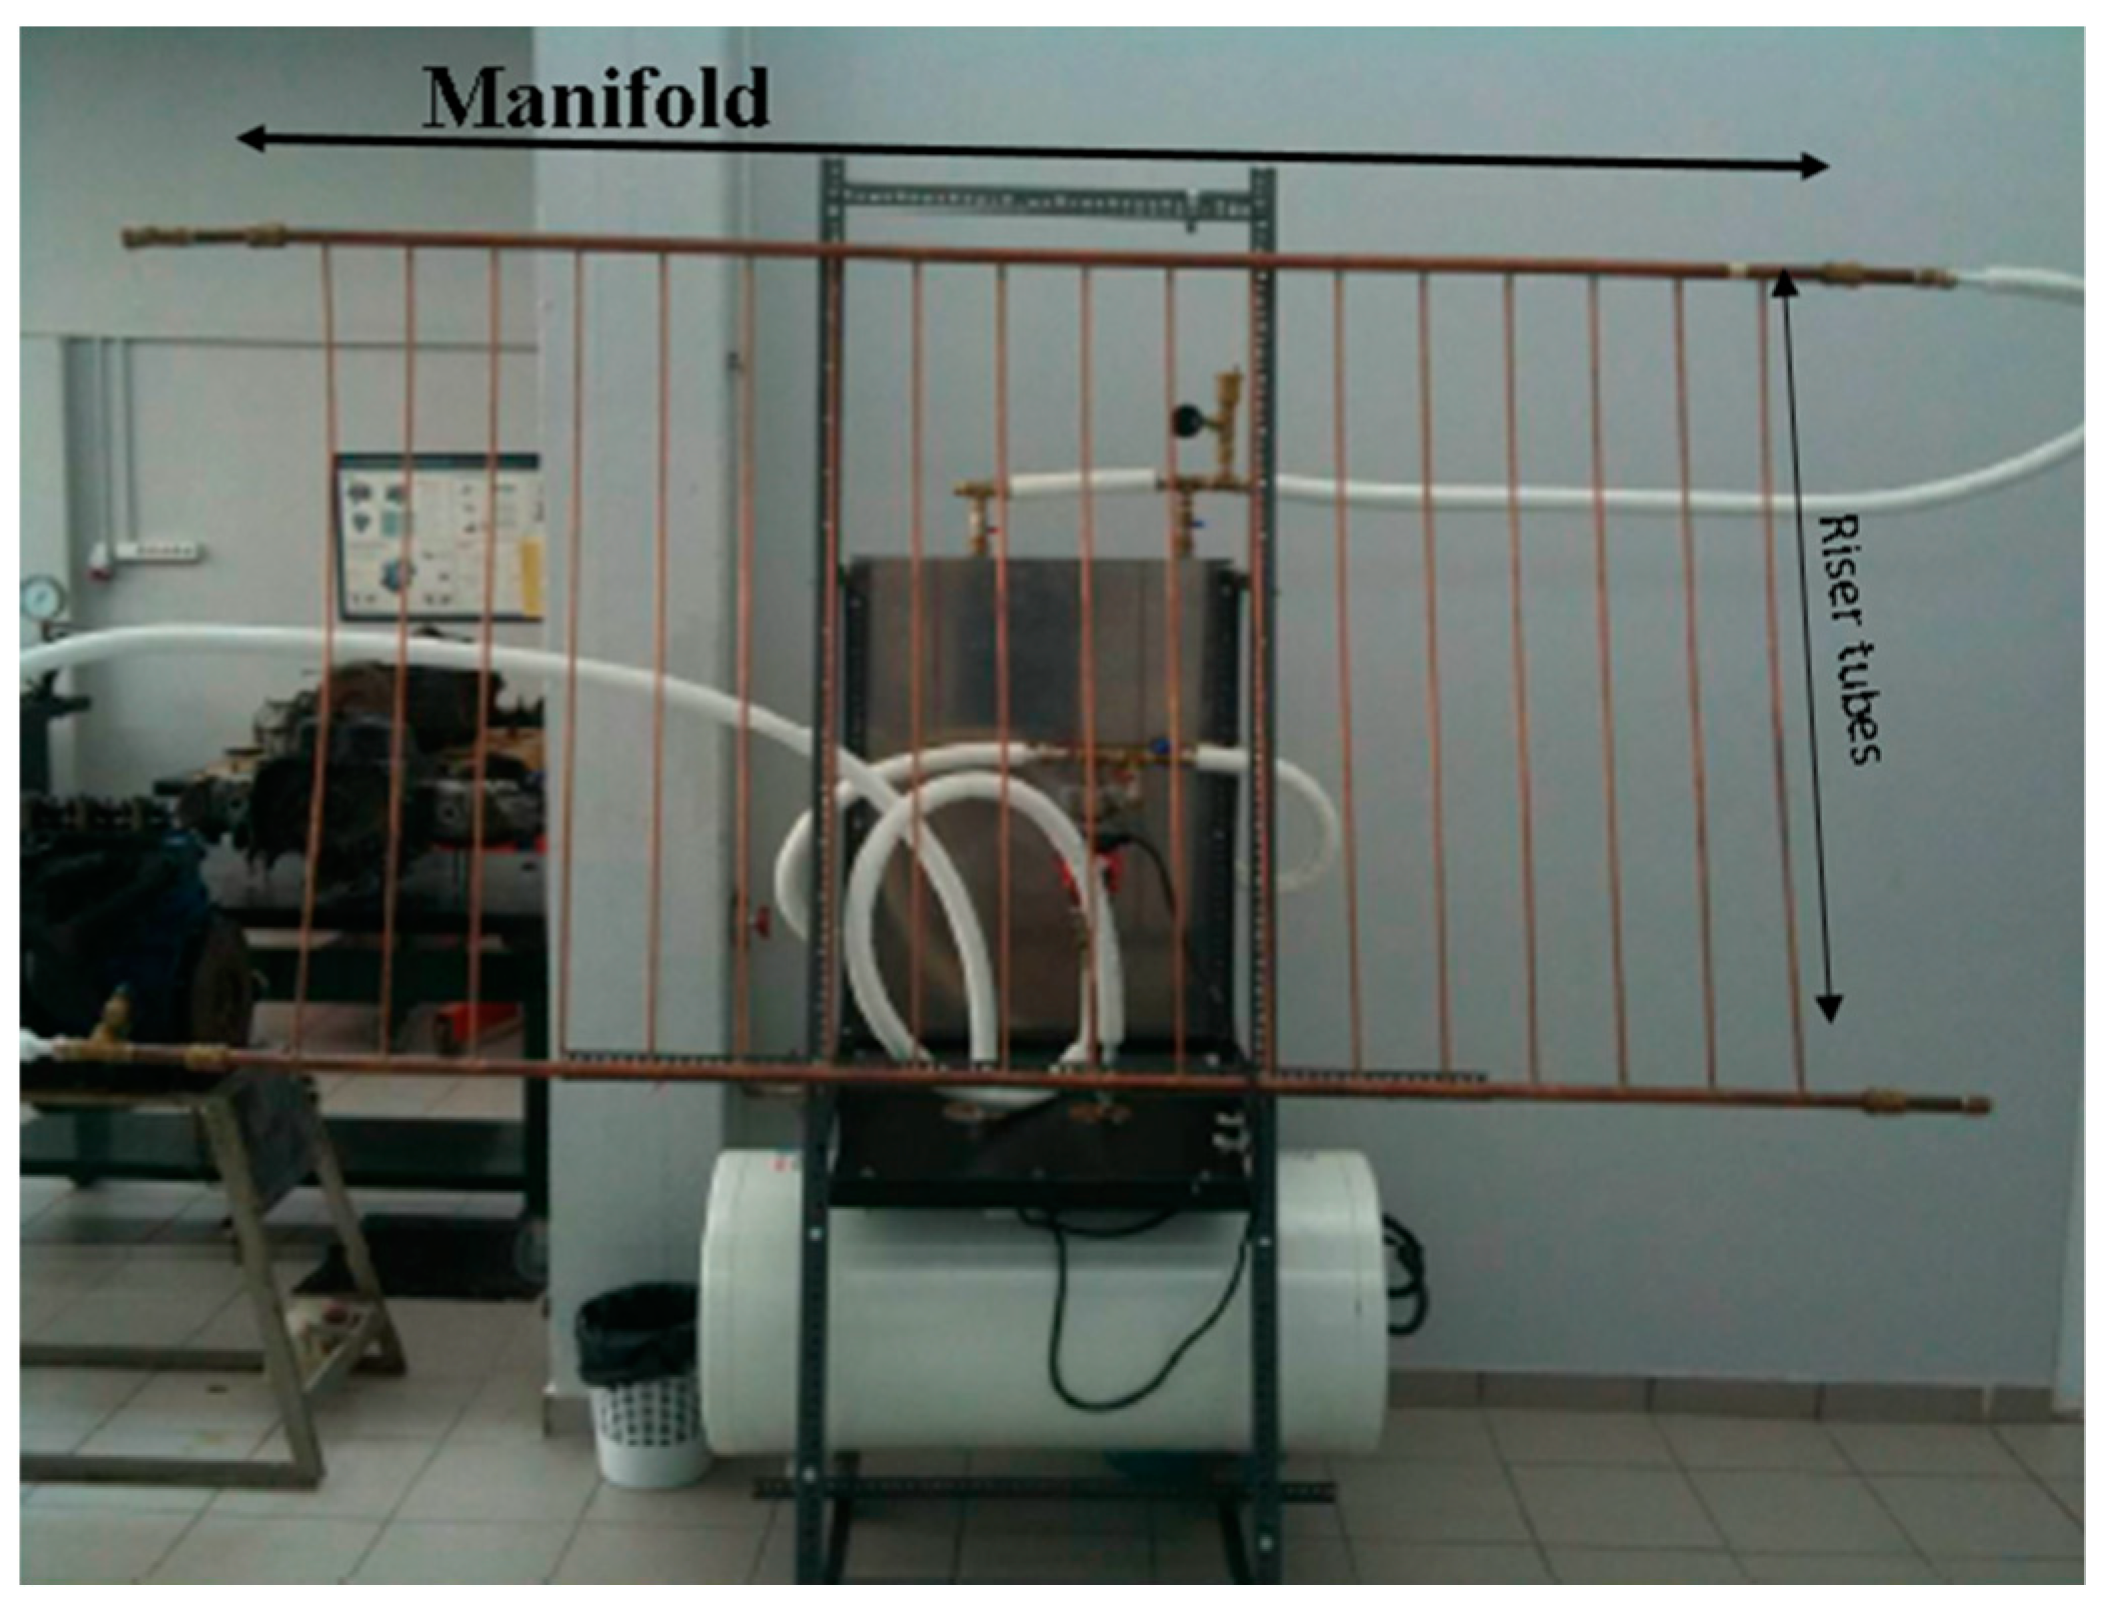
The laboratory experiments were conducted using a solar collector pipe system made of copper under real working conditions. The experimental facility setup is depicted in
Figure 2.
In order to determine the fluid flow distribution within the riser tubes, the main requirement was to measure the flow rates through all the riser tubes, without any flow disturbances induced by the measuring instrument. To this end, the ultra-sound measurement technique was selected. In particular, a commercially available hand-held, battery operated, ultrasonic flow meter was employed, capable of measuring the flow rate of liquids in fully enclosed pipes by means of clamp-on sensors attached to the outside of the pipes. This specific instrument employs the transit-time method, where ultrasonic signals are emitted by a transducer installed on the pipe and received by a second transducer. These signals are emitted alternately in the direction of flow and against it. As the medium is flowing, the transit-time of the sound signals propagating in the flow direction is shorter than the one propagating against the direction of flow. The transit-time difference T is measured and allows the determination of the average flow velocity along the path of acoustic propagation. A profile correction is then performed to obtain the average flow velocity over the cross-sectional area of the pipe, which is proportional to the volumetric flow rate. In the present case, special metallic adaptors were manufactured in order to ensure better attachment of the clamp-on sensors to the small diameter riser tubes; the design of the adaptors was experimentally optimized with the aim to ensure the reliability of the ultra-sound measurement with respect to conventional flow rate measurement techniques.
A variable-area flow meter (i.e., rotameter) with an operational range of 0.2–2.0 lt/min was employed in order to check the accuracy and repeatability of the ultrasonic flow meter for the measurement of the volume flow rate within an isolated copper pipe of 7.1 mm internal diameter, identical to the riser tube used in the tube system of the solar collector. The flow rate in this pipe was adjusted within the range to be encountered during the main measurements. It was found that the difference between the ultrasound and the rotameter measurements was less than 5%, which is within the same order of magnitude as the rotameter error. It is also worth mentioning that the ultrasonic flow meter did not have the capability to measure below a value of 0.2 lt/min in the copper tube and this was attributed to the low velocity at this flow rate, which could not give rise to a measurable ultrasonic signal by the specific instrument.
3.2. Experimental Results
For the experimental determination of the flow distribution among the risers, the six cases presented in
Table 1 were examined, corresponding to different inlet Reynolds numbers (and different corresponding inlet flow rate values).
The flow rate was adjusted by means of a conventional water circulation pump with three flow settings and a suitable needle valve. The total water mass flow rate was measured by a second rotameter with a range of 2.0–10.0 lt/min, placed upstream from the inlet manifold. The flow rate through each riser was measured by the ultrasound instrument and, for each case, the sum of the 18 values corresponding to the 18 risers was compared with the total flow rate measured by the second rotameter; in all cases these two quantities were found in agreement within 5%. The latter proves that the ultrasound technique is reliable and can be employed as a non-intrusive measurement technique in critical points of a solar collector or a solar collector array.
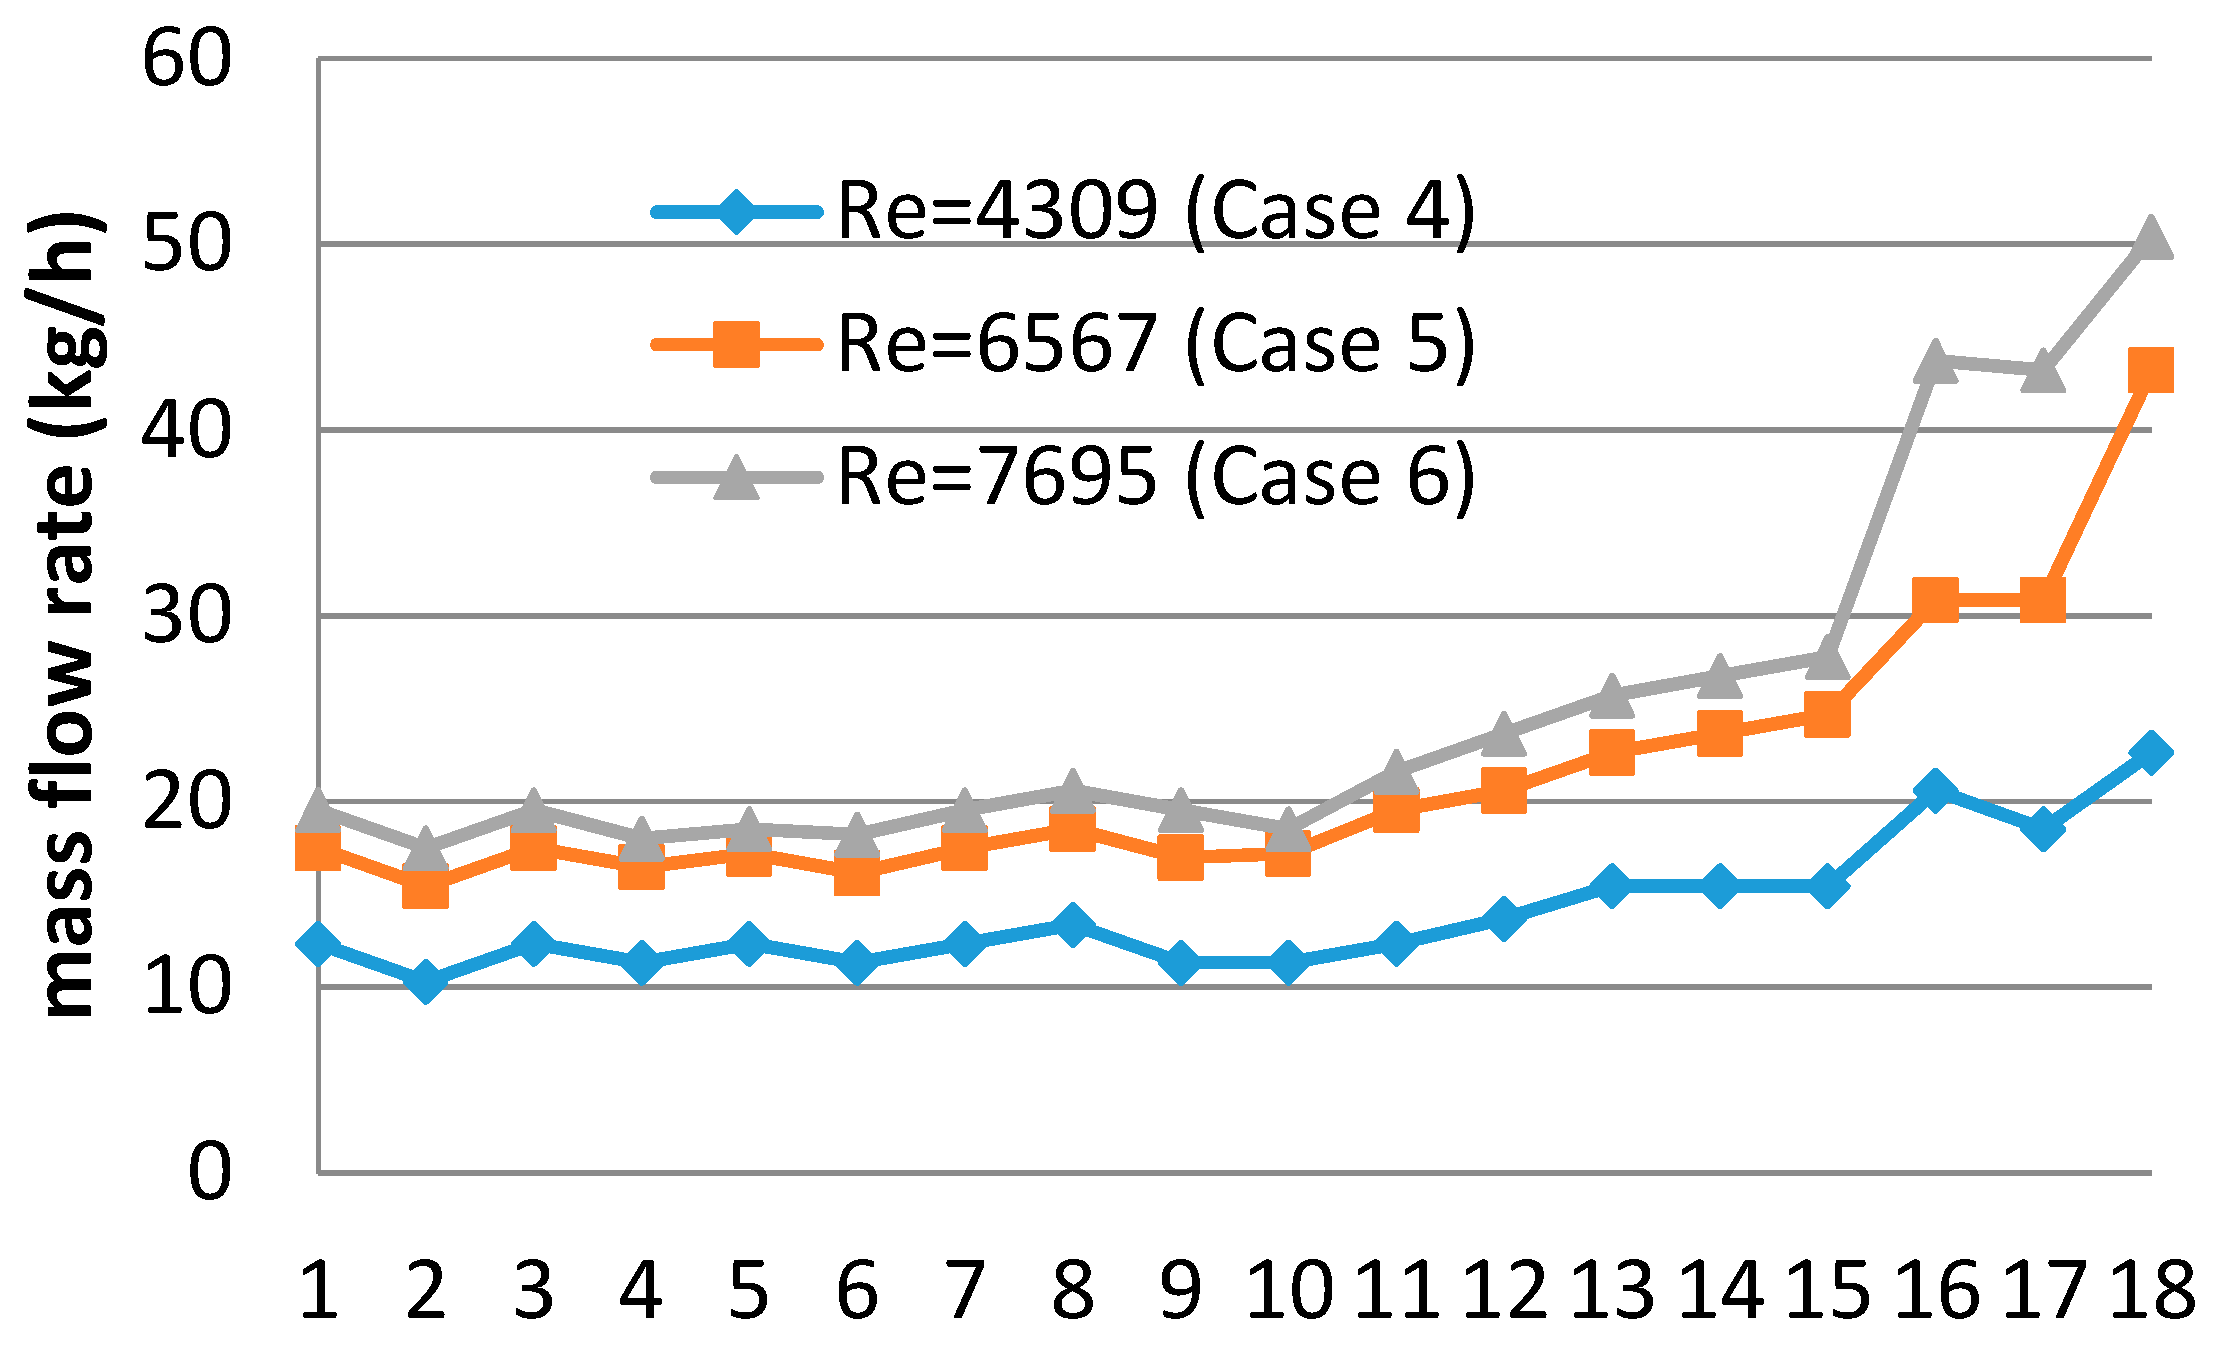
The results, in terms of mass flow rate per riser, as measured in the above experiments, are presented in
Figure 3. It seems that the greater the distance of the riser from the inlet, the higher the flow rate; this becomes more pronounced as the Reynolds number increases. Such a flow behavior is expected to have a negative effect on the overall efficiency of the solar collector with respect to heat transfer. Similar results concerning the flow distribution among the risers for configurations of the same type have also been reported in the literature, e.g., by Weitbrecht et al. [
5], Datta et al. [
12], and Jones et al. [
13].
4. Numerical Investigation
In this section, the flow distribution among the risers is numerically studied by means of CFD simulations. In what follows, the setup of the CFD model is described and justified, the simulation procedure is validated against the experimental results and parametric results for various inlet Reynolds numbers are presented.
4.1. Numerical Setup
The numerical simulations of the flow through the solar collector were carried out using the commercial code ANSYS Fluent 14. Three-dimensional steady-state incompressible flow simulations were performed. To this end, the continuity and momentum (Navier–Stokes) equations for an incompressible Newtonian fluid (water, herein) were numerically solved. The Semi-Implicit Method for Pressure-Linked Equations (SIMPLE) algorithm [
14] was utilized for coupling pressure with velocity.
The laminar flow model was implemented in the simulations for all inlet Reynolds numbers, even for inlet manifold values higher than the critical value of 2200 (for ducts). The reason is that after the inlet tube, the flow is distributed in the riser tubes where the (expected) local Reynolds numbers become significantly lower than the critical one, as it can be seen in
Table 1. However, for model validation purposes, turbulent simulations were also implemented in the cases of higher inlet Reynolds numbers, namely 4, 5, and 6. In order to account for possible turbulence effects, two turbulence models were utilized in the present study, namely the Shear Stress Transport (SST) variant of the
k-
ω model and the standard k-ε model with enhanced wall treatment. The latter implements a standard wall function model that automatically switches to a two-layer low-Reynolds approach to resolve the boundary layer up to the wall wherever a small value of y+ is met (of the order of 20 or less). Both models employ two equations and rely on the Boussinesq hypothesis. In such a case, the Reynolds-Averaged Navier–Stokes (RANS) equations are solved (mean flow equations), in which the laminar viscosity coefficient is augmented by the turbulent one, the latter being calculated by means of the two turbulent quantities
k and
ω or
ε, respectively. To this end, two more equations are solved in conjunction with the continuity and momentum equations mentioned above.
A second order discretization scheme in space was implemented for the mean flow equations, while first order was used for the turbulence model. Concerning the boundary conditions for the mean flow equations, a no-slip condition was imposed at the wall boundaries of the manifolds and the risers, and the mass flow rate was prescribed at the inlet, while the outlet was considered to be an outflow-type boundary. As boundary conditions for the turbulence model, the hydraulic diameter (
) and turbulent intensity (
) at the inlet were prescribed for both models. The inlet manifold diameter was used for the first (
), while the latter was estimated according to the empirical formula [
10]:
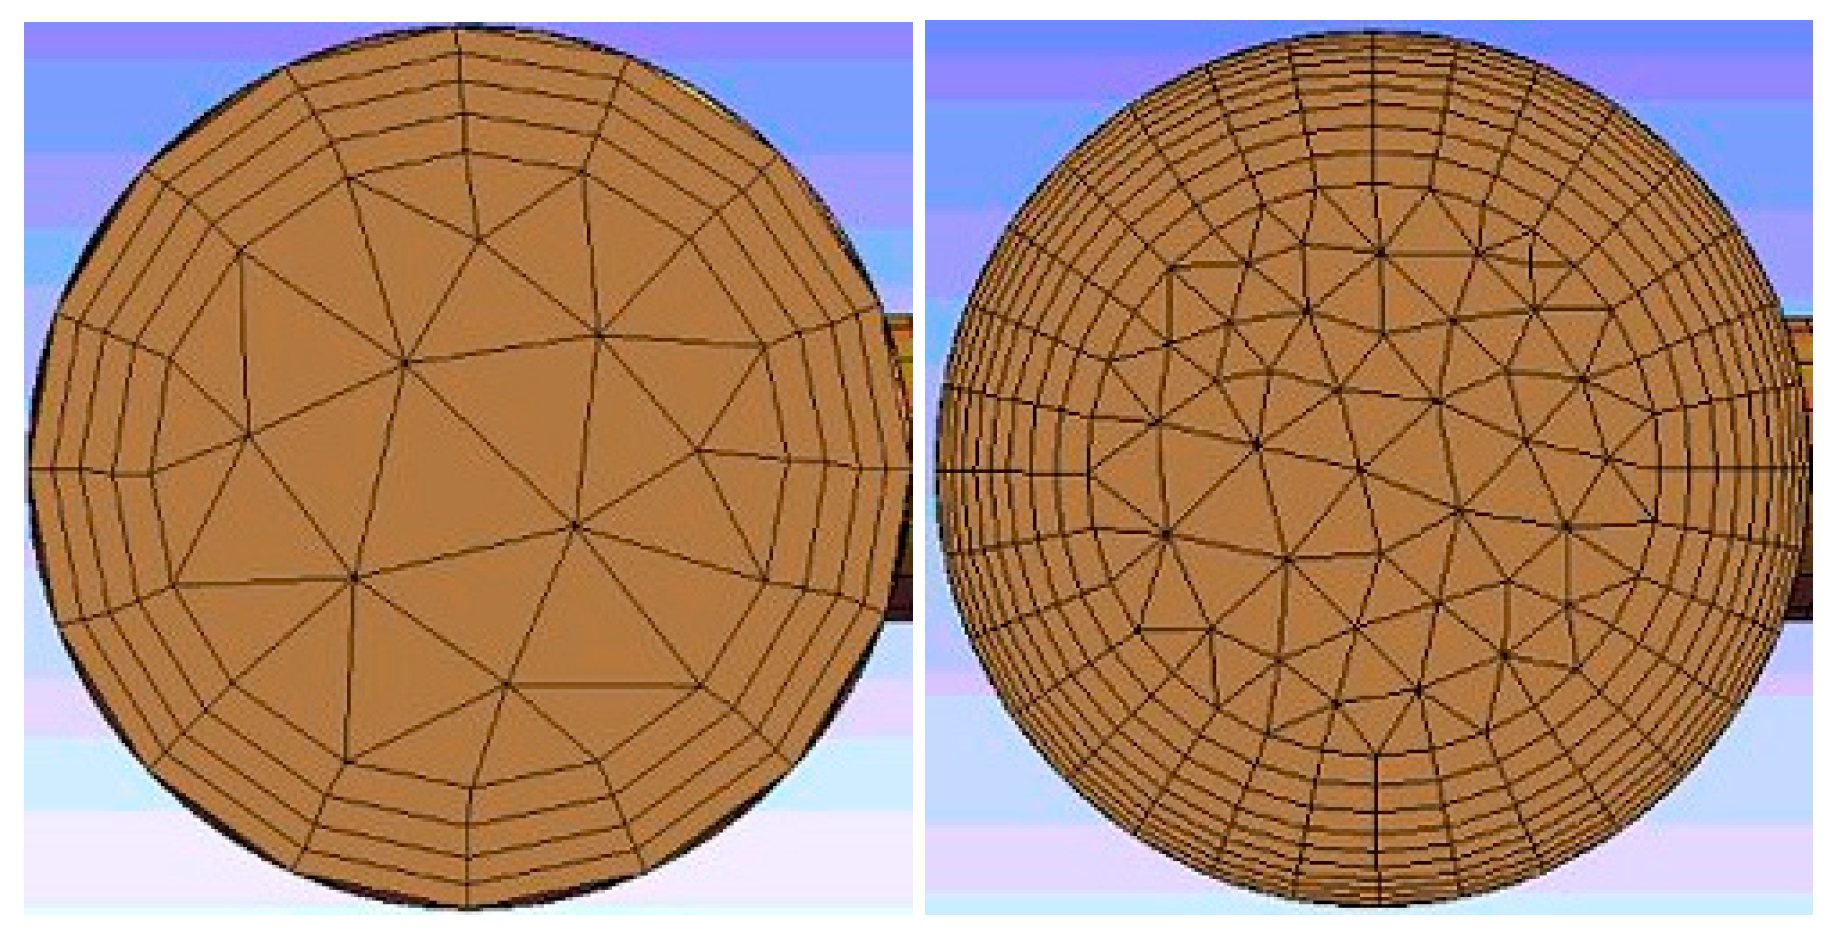
In order to create a computationally efficient grid to be used in the simulations, a compromise between a coarse mesh that would produce less accurate results with lower computational cost and a dense mesh that would be computationally intensive had to be made. To this end, two different grids, A and B, were created. Both of them have the common feature that two regions of the flow domain can be identified: the region near the walls where a number of inflation layers were used and prismatic elements were generated, and the inner region consisting of tetrahedral ones. A different number of inflation layers were used in each grid that also had a different total number of elements; these parameters are summarized in
Table 2.
Figure 4 presents the cross section of the inlet manifold tube for each grid. The grid generation inside the risers was based on similar characteristics to those used in the manifolds. Both grid A and grid B were used in the simulations, while turbulent simulations were performed only in grid B.
4.2. Comparison between Simulations and Experiments—Grid Sensitivity
The three cases 4, 5, and 6, for which experimental measurements were performed, were initially simulated by means of the laminar flow CFD model in grids A and B.
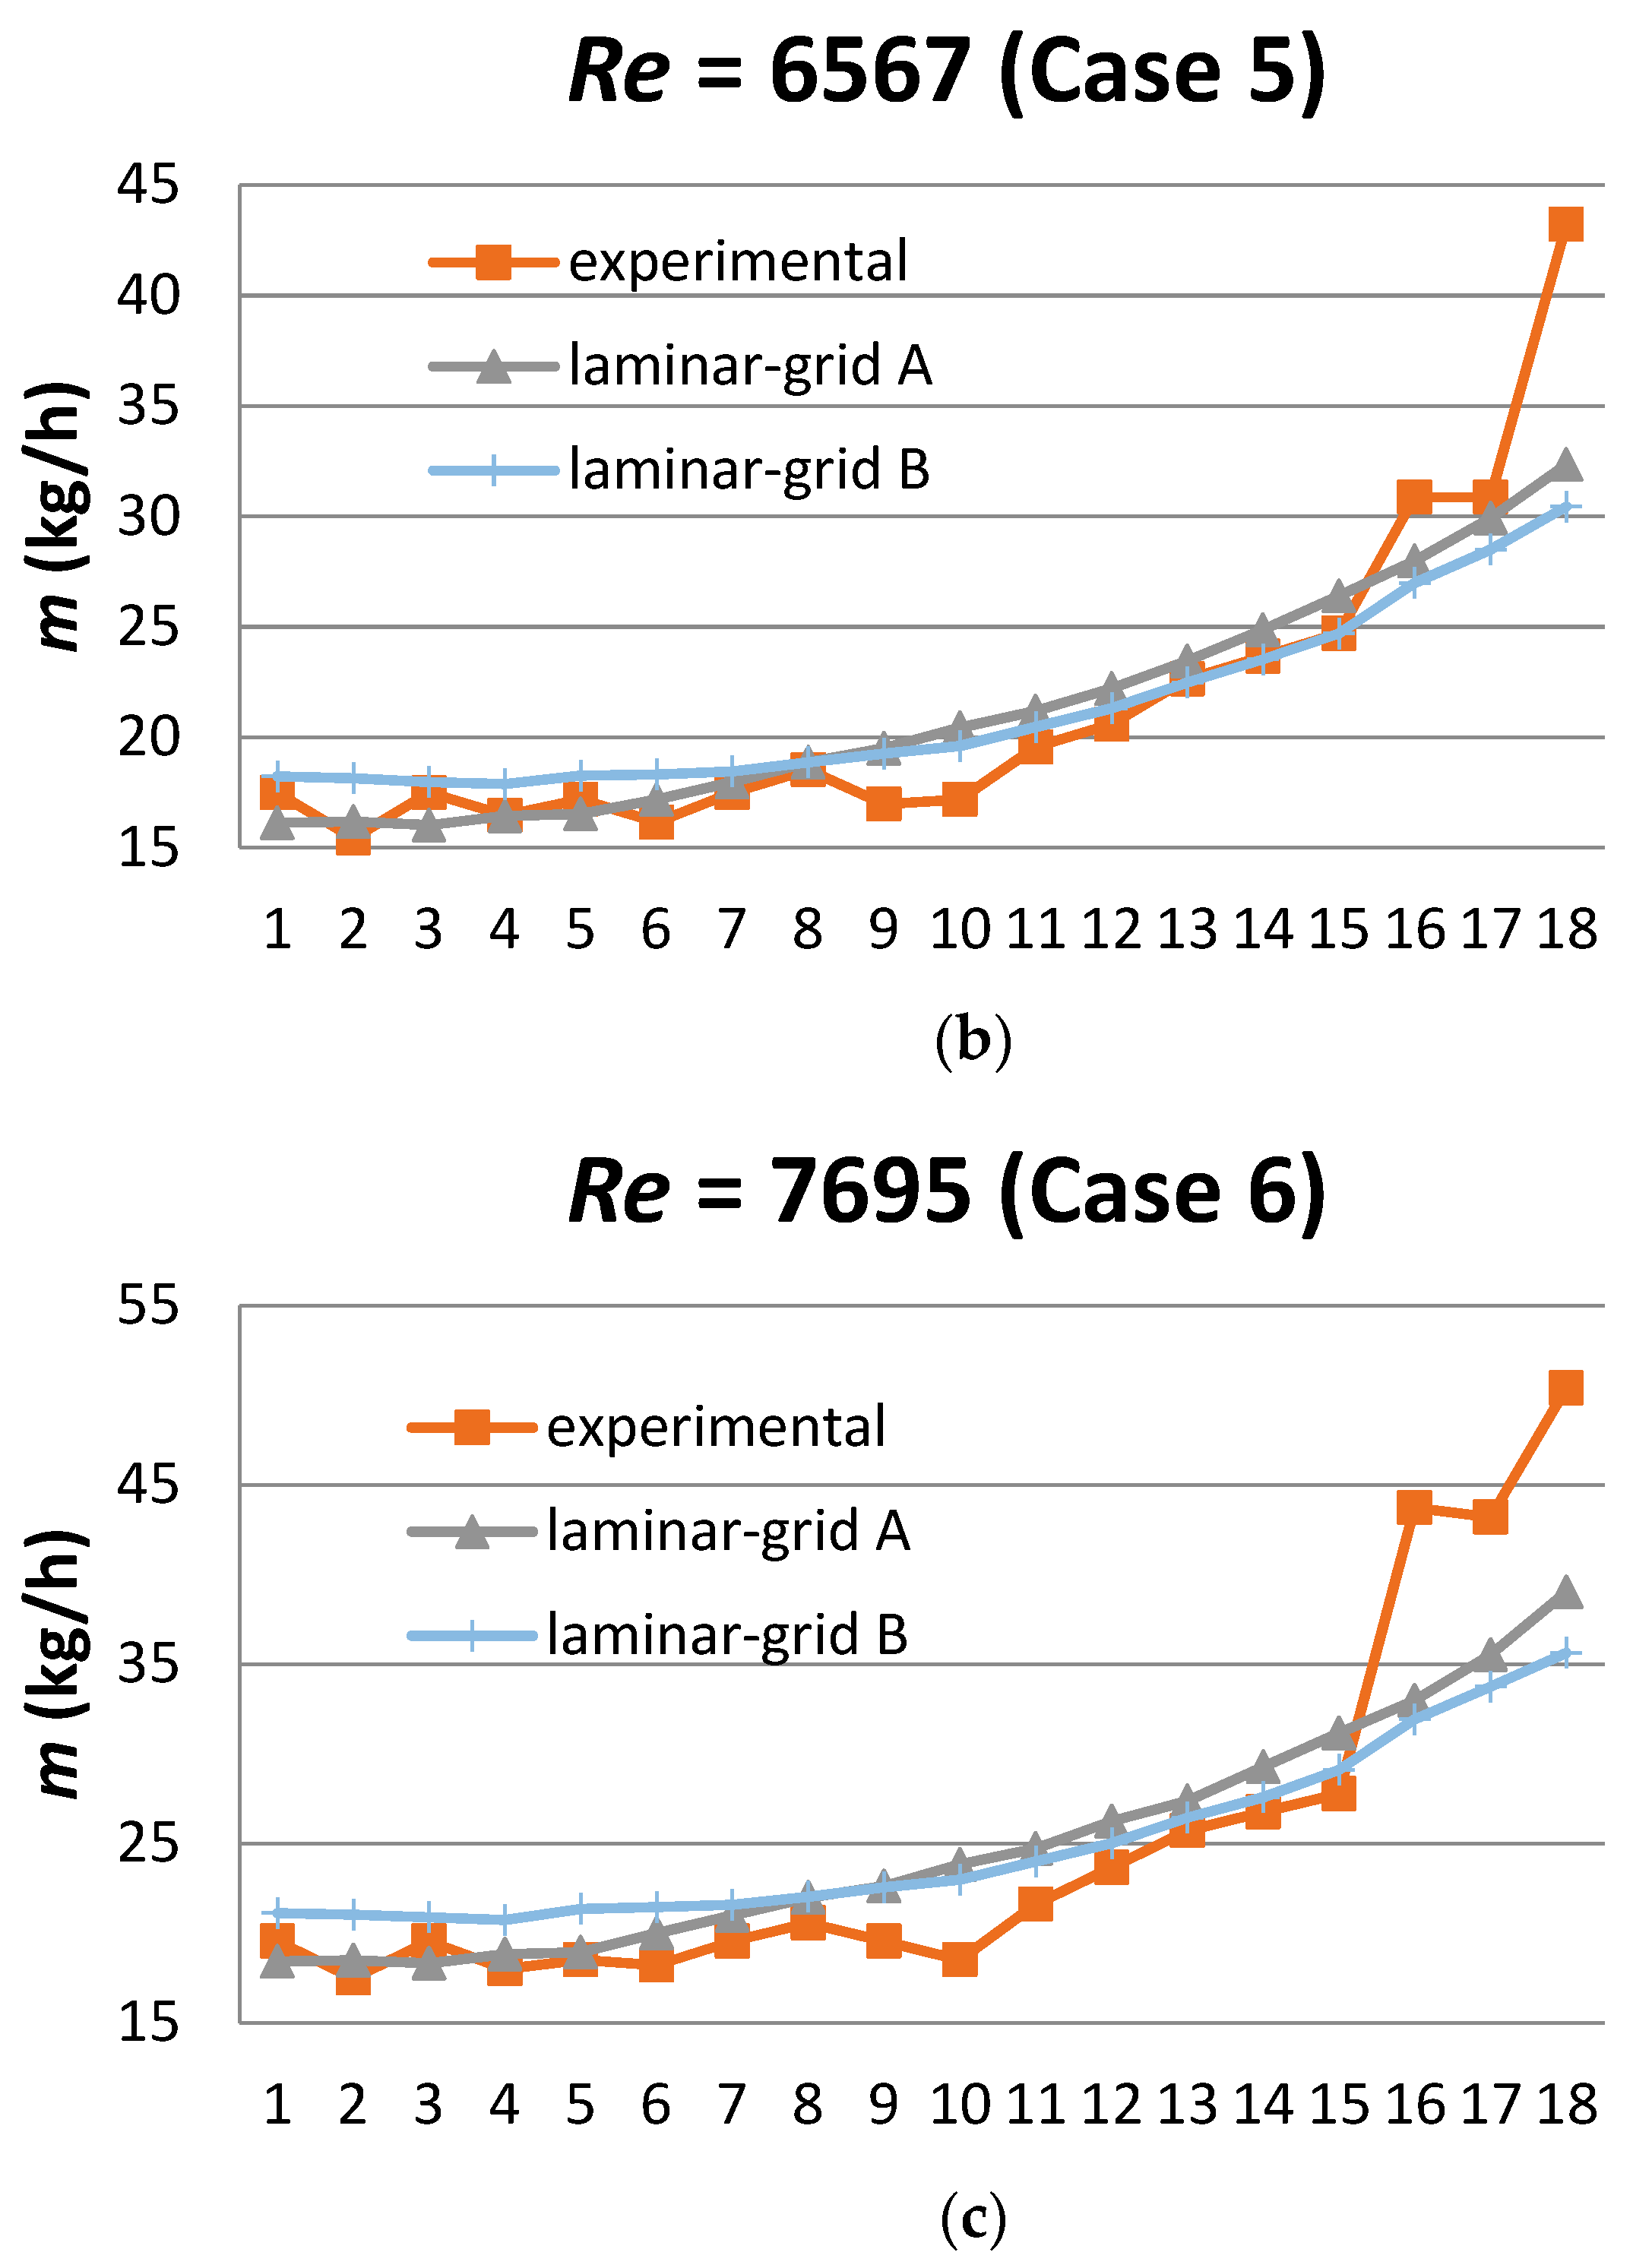
Figure 5 compares the numerical and experimental results in these cases in terms of the mass flow rate distribution among the risers. The overall comparison between numerical results of the two grids and the experimental results is very satisfactory in all cases. The numerically predicted flow rate distributions are smoother compared to the measured ones in the real collector configuration. The distributions predicted by both grids are very close to each other. Predictions of grid B are slightly better at the first risers, while grid A is closer to the experimental results at the last risers, as can be seen in cases 4 and 5. However, both distributions are well within the region spanned by the experimental results. Qualitatively, it could be claimed that the distribution predicted by grid A is more “inclined” compared to that of grid B, and tends to be slightly better at reproducing the trends of the experimental one.
Figure 6 presents the numerical results for cases 1, 2, and 3, for which no experimental results were performed. As can be seen, the two grids A and B provide almost identical distributions. It has to be mentioned that the plots presented in
Figure 5 and
Figure 6 focus on the range between the minimum and maximum flow rate values involved in each case.
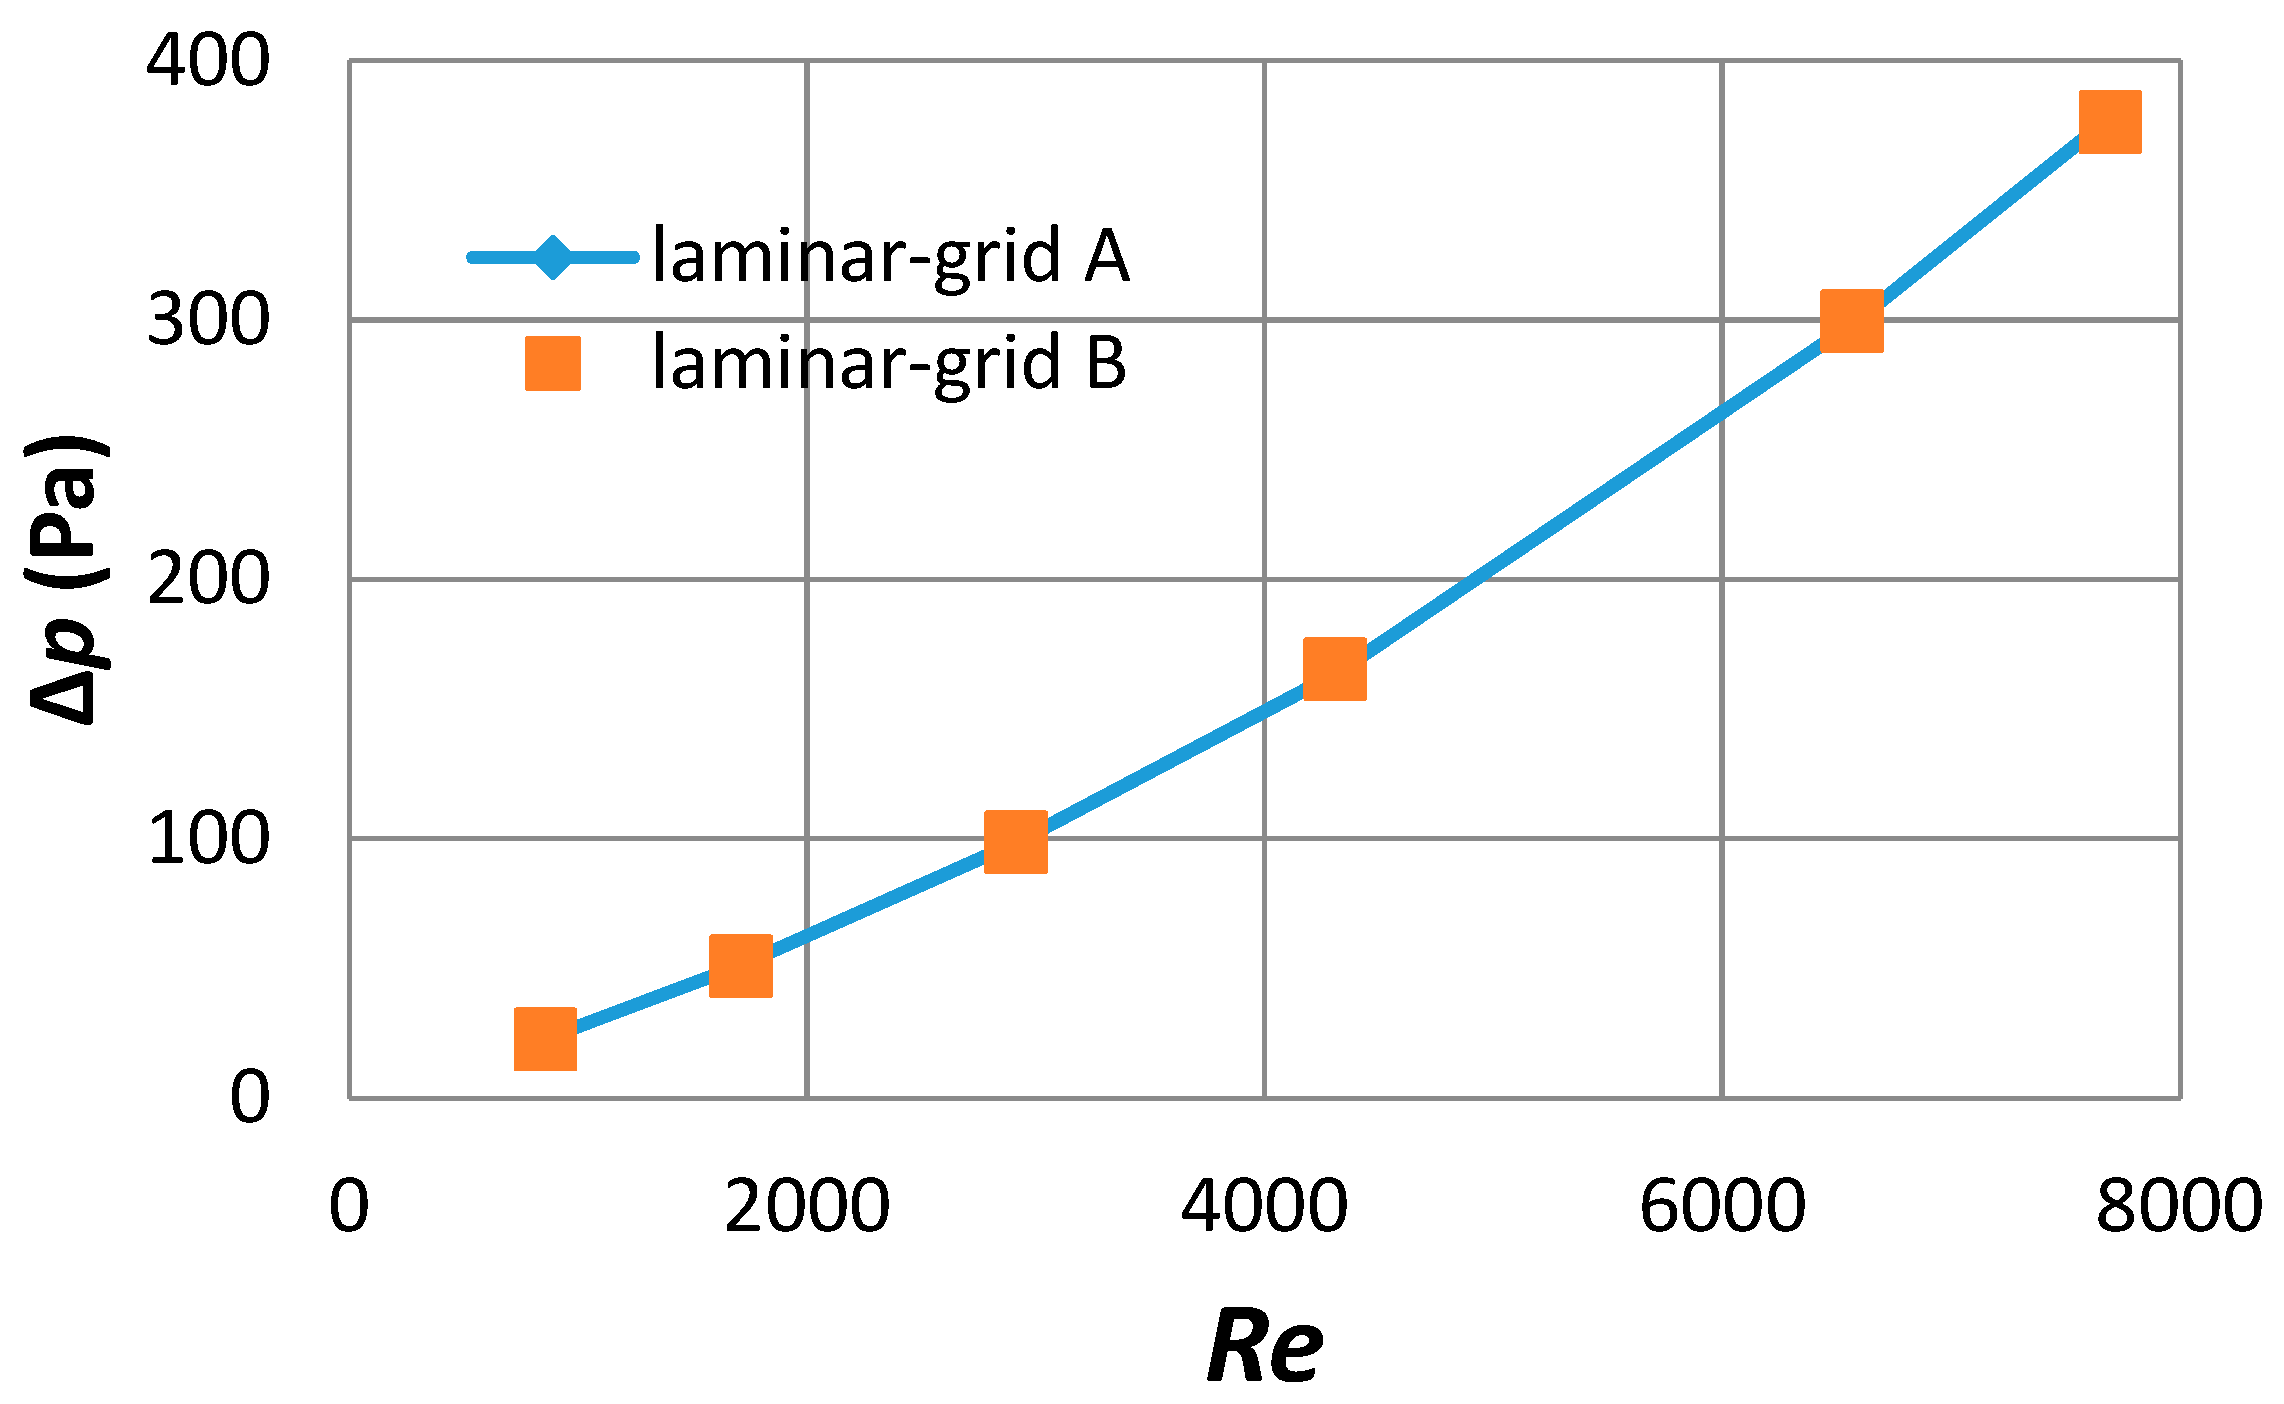
Figure 7 depicts the calculated pressure drop (Δ
p) between the inlet and the outlet of the solar collector against the Reynolds number (
Re), as predicted by the laminar flow simulations in grids A and B for cases 1 to 6. The two plots are identical.
Summarizing, in the cases for which experimental results were available, the comparison of the numerical predictions to the experimental ones is satisfactory and, in all of the cases, they can be considered grid insensitive, i.e., the use of the laminar model in grid A is sufficient for the simulations in the range of the inlet Reynolds numbers under consideration.
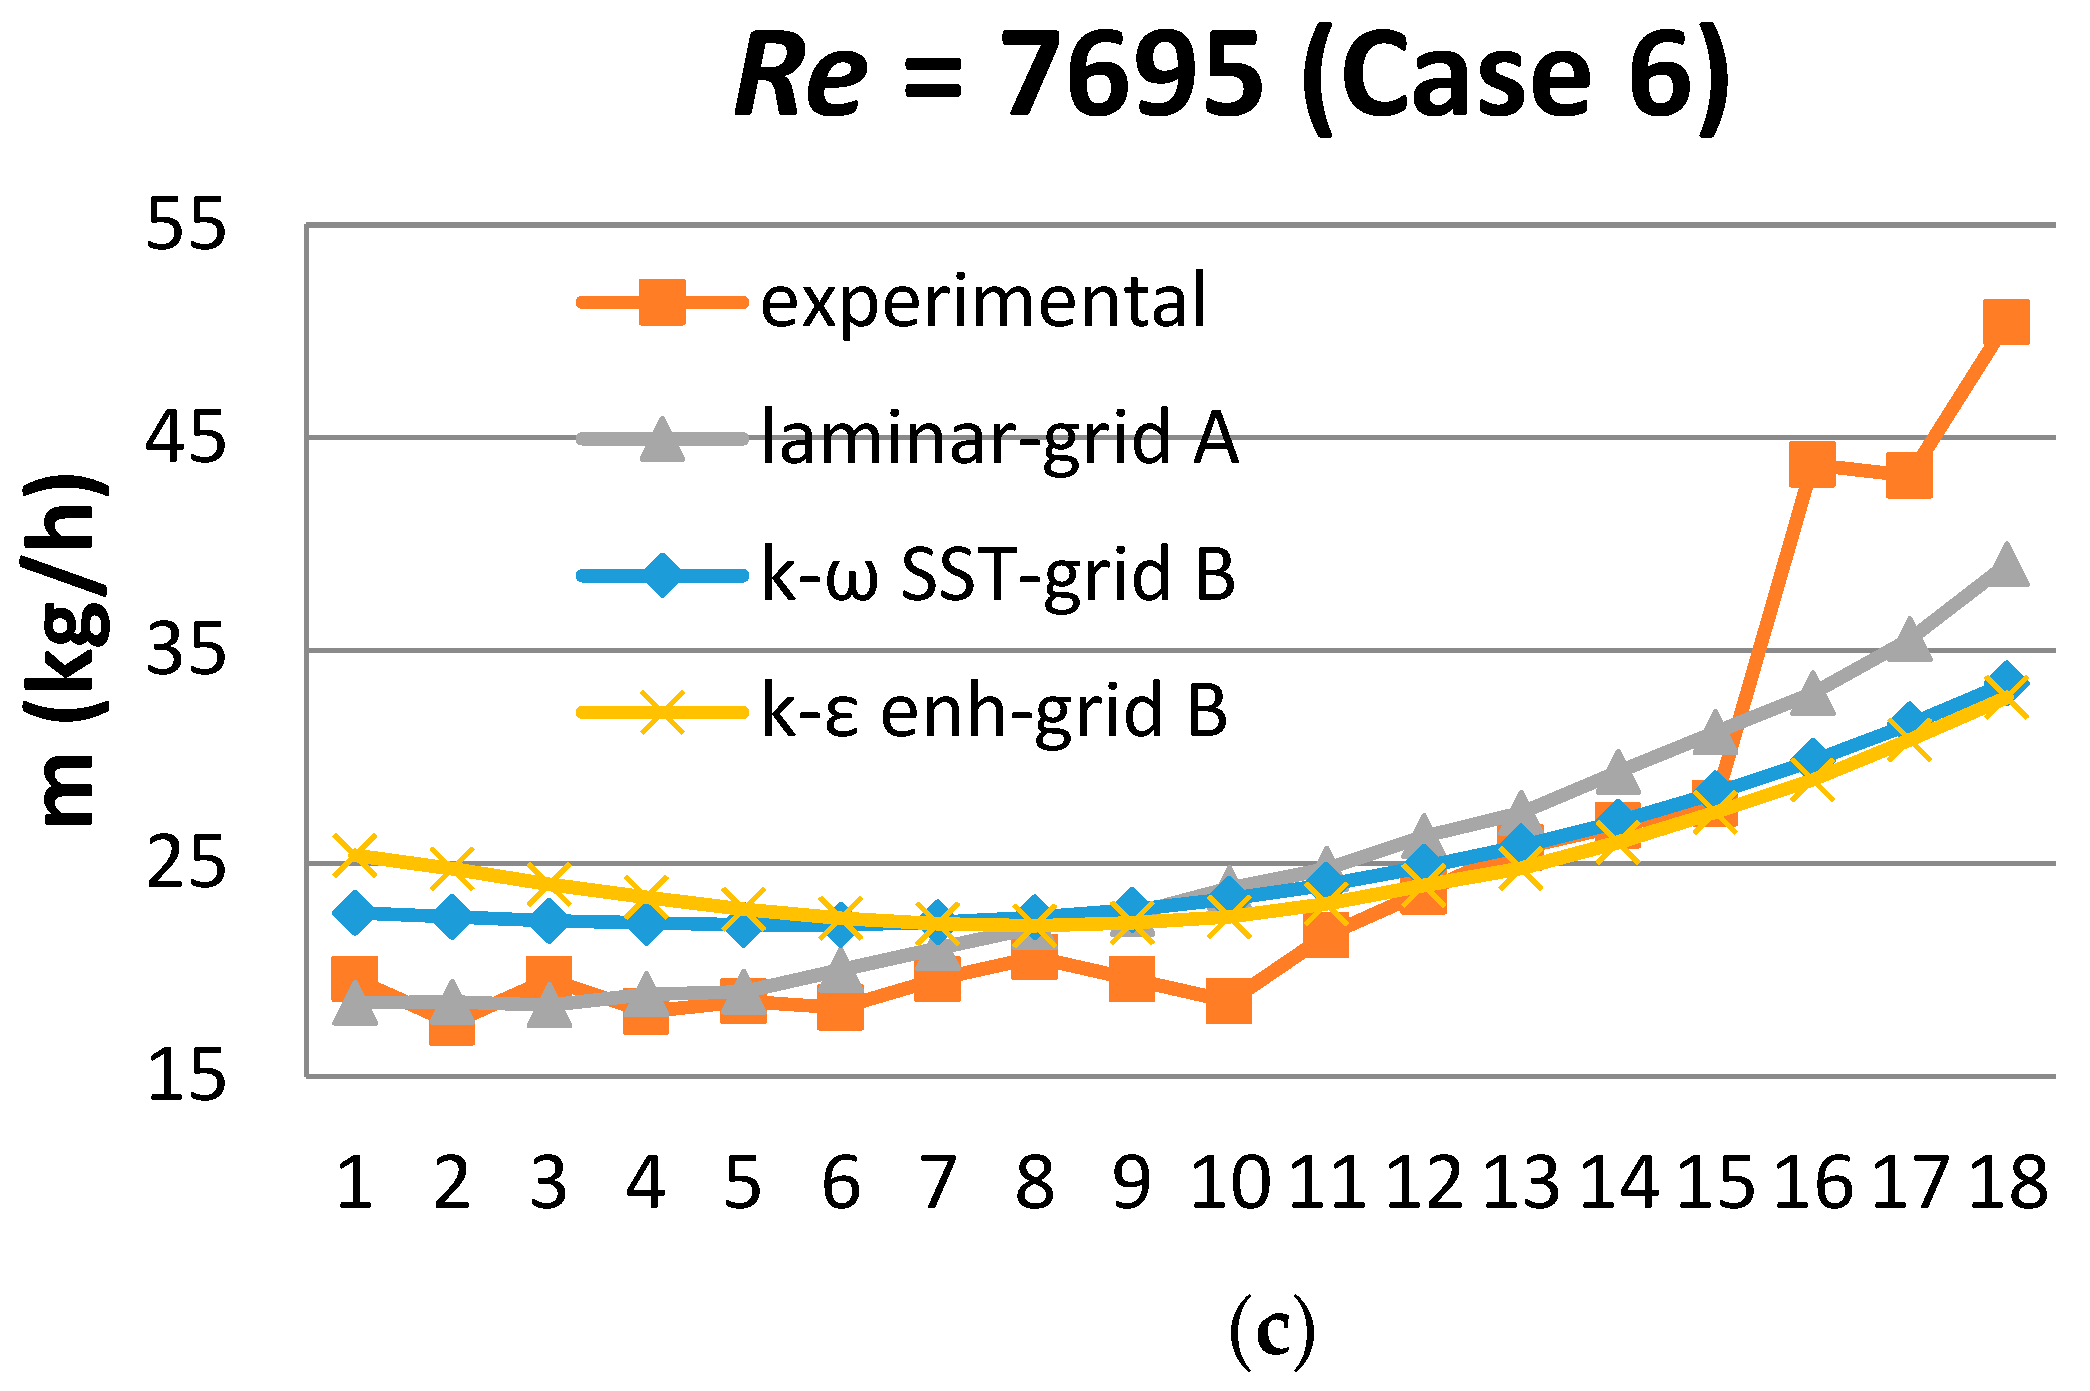
In order to further justify and validate the use of the laminar flow approach, turbulent flow simulations in the dense grid B were also performed for cases 4, 5, and 6, utilizing the two turbulence models mentioned above (
k-
ω SST and
k-
ε with enhanced wall treatment). The corresponding results are presented in
Figure 8, along with the corresponding laminar flow results from grid A and the experimental ones. The turbulent flow results were not in any of the cases better than the laminar flow ones. In particular, the
k-
ω SST model seems to perform better than
k-
ε with enhanced wall treatment (
k-
ε enh) in the simulated “questionable” turbulent flow cases. However, the distribution predicted by the laminar flow simulation in grid A outperforms that of the
k-
ω SST model.
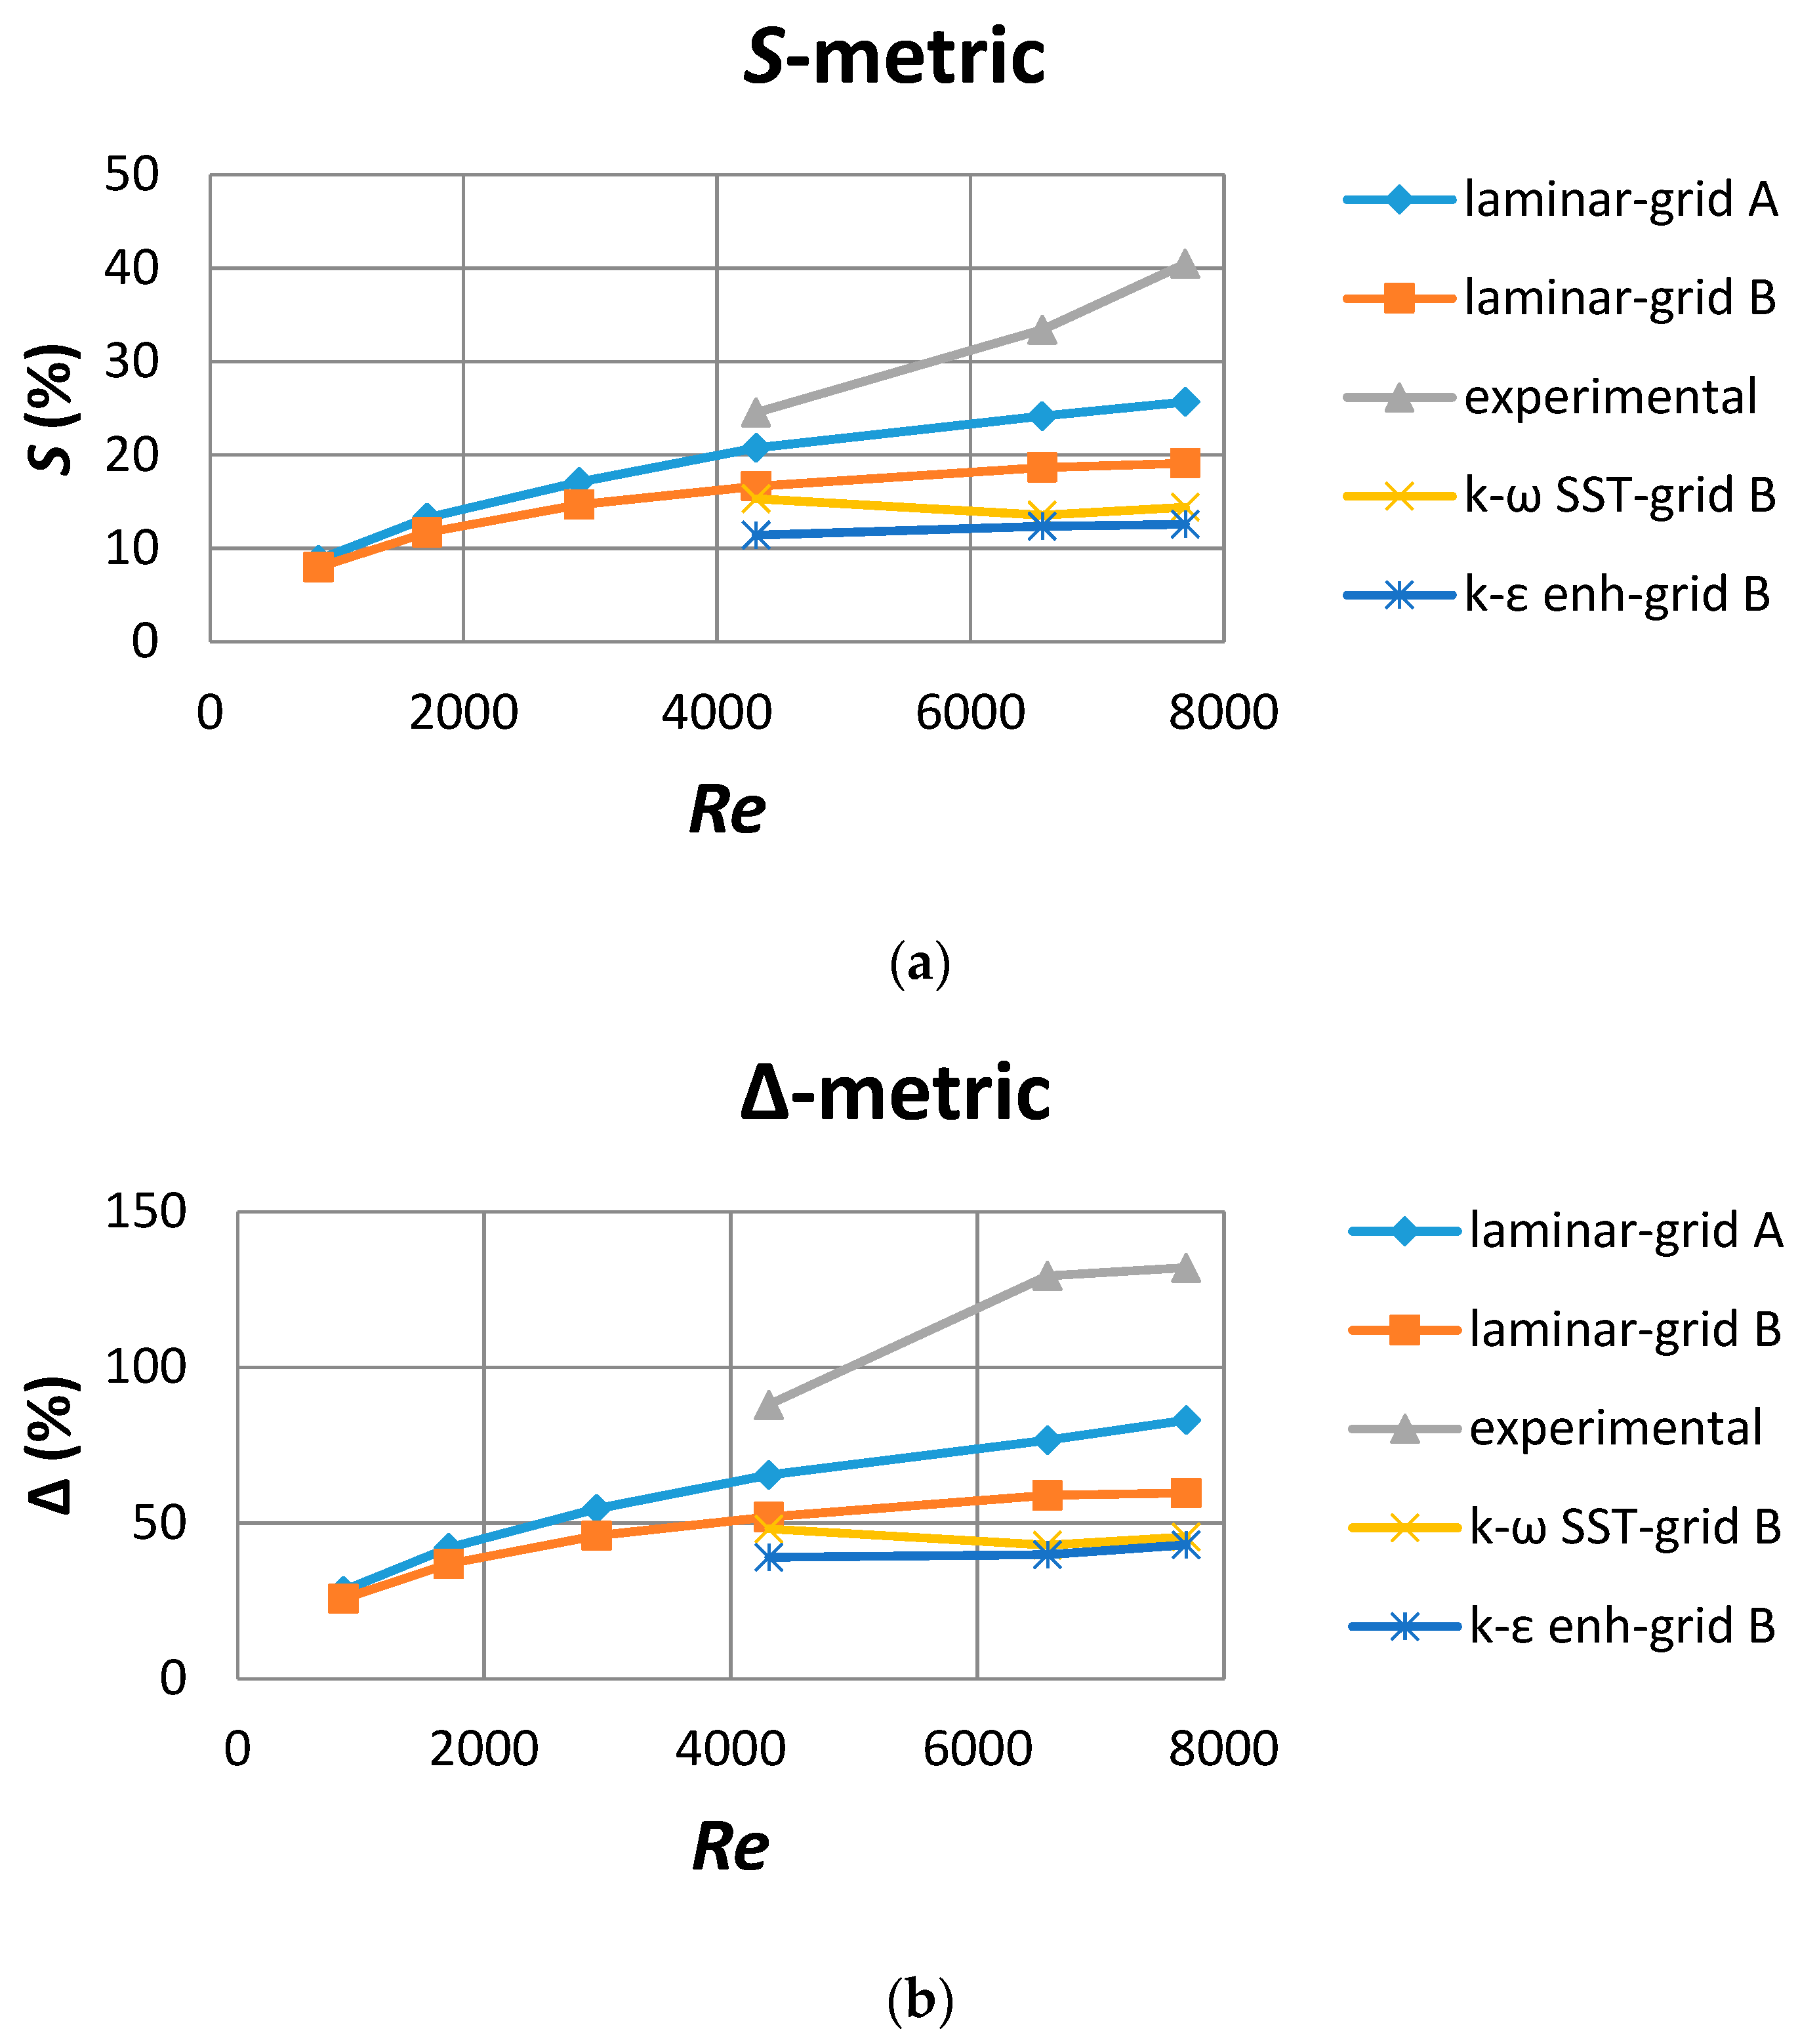
For the sake of completeness, a comparison between the various flow model simulations mentioned above and the experimental results (wherever available), in terms of non-uniformity metrics
Sβ and Δ
β versus inlet Reynolds number, is presented in
Figure 9. According to this, in terms of both metrics, the laminar flow model in grid A performes slightly better than the corresponding one in grid B with respect to the metrics characterizing the experimental results, and both outperform the corresponding results of the two turbulent flow models. These remarks further support the above mentioned statement that the laminar flow model in grid A is sufficient for the flow simulations in the flow regime under consideration.
4.3. Parametric Study of Flow Rate Distribution with Inlet Reynolds Number
Selected numerical results from those presented above (in
Figure 5 and
Figure 6) are summarized herein, in order to comment on the flow rate distribution among the solar collector riser tubes for the various values of the inlet Reynolds number (i.e., total mass flow rate across the collector). According to the previous section, the laminar flow model in grid A satisfactorily represents the flow distribution among risers. Thus,
Figure 10 summarizes, in two aggregate graphs, the corresponding results of this model for all cases. The plots refer to the mass flow rate per riser (
), as well as to the non-dimensional ratio of the local flow rate at each riser to the average one (
).
As becomes apparent from
Figure 10a, the higher the Reynolds number, the higher the flow non-uniformity among the risers. According to
Figure 10b, the flow rate is lower than the average at the first risers (located at the first half of the collector) and becomes higher than the average at the last ones (in order for the continuity to be fulfilled). The same flow behavior is observed in all cases. However, as the Reynolds number increases, the above behavior progressively becomes more intense and, as a consequence, the flow non-uniformity is more pronounced.
The corresponding values of the metrics
Sβ and Δ
β, along with the experimental ones for cases 4, 5, and 6 are presented in
Table 3. They support the above remark, since the higher the Reynolds number, the higher the values of
Sβ and Δ
β. It has to be mentioned that the values of
Sβ and Δ
β predicted by the numerical simulations underestimate the experimental ones in all cases. The underestimation of flow non-uniformity is mainly due to the measurements concerning the last three riser tubes, 16, 17, and 18; this may be attributed to geometry imperfections during manufacturing.
Table 3 also provides the total pressure drop across the collector that has been graphically presented in
Figure 7. According to this figure, pressure drop increases more than linearly with the increase of the Reynolds number; this behavior is expected, as the pressure drop curve is a quadratic function of the fluid mass flow rate.
5. Enhancement of Flow Uniformity
A procedure is proposed herein aiming to improve the flow uniformity in the risers. This is based on appropriately modifying the diameters of the riser tubes in order to achieve a more uniform flow rate distribution among them. According to this procedure, for each riser, with an initial internal diameter
d = 7.1 mm, a modified diameter is determined. Thus, for the
ith-riser (
i = 1, …,
N), its new diameter d
i is estimated by requiring its flow rate to be equal to the average one (assuming the same average velocity in the original and the modified riser) and is calculated according to the following formula:
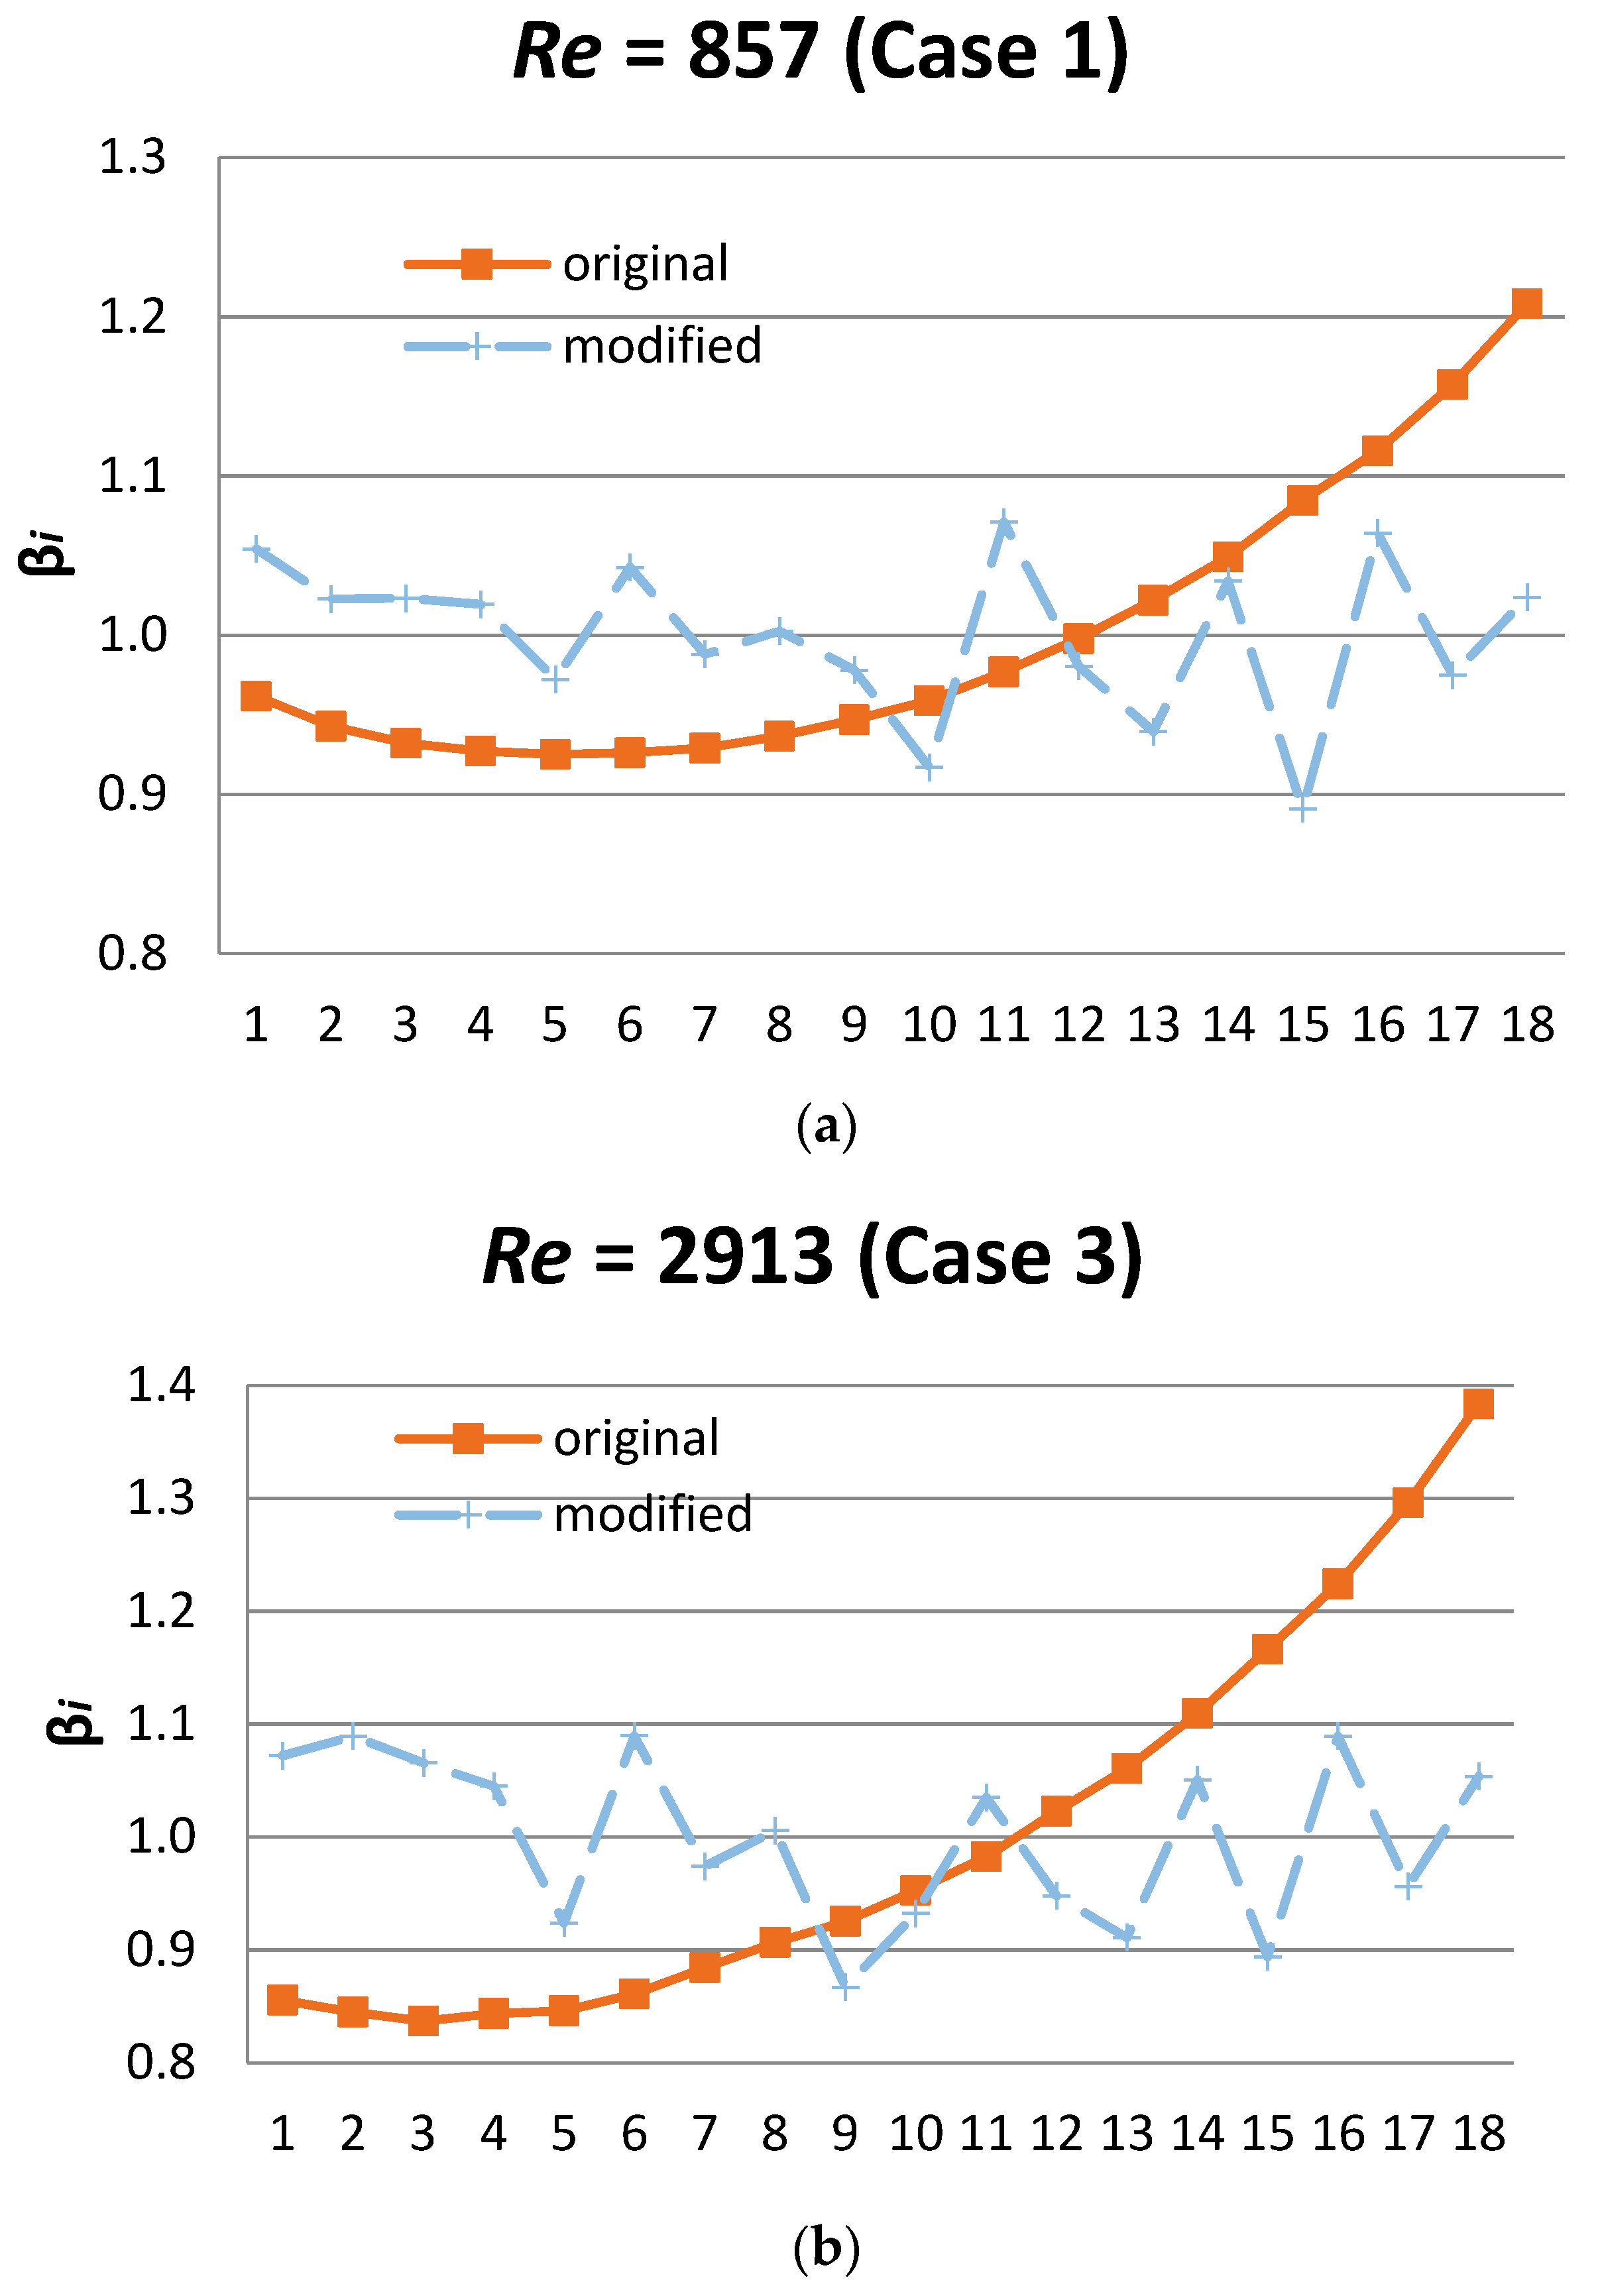
For demonstration purposes, the above procedure was applied in three cases, 1, 3, and 6. In each case,
N = 18 different diameters for the riser tubes were calculated. However, for practical reasons concerning the manufacturing of the risers, the resulting diameter values were rounded to one decimal and grouped into three different groups, as presented in
Table 4.
As the procedure is flow rate dependent, a new grid was generated for each case in order to simulate the flow in the collector with the modified risers and assess its hydrodynamic performance.
Figure 11 demonstrates the comparison of the flow distributions predicted in the initial and the modified collector geometries for the three cases mentioned above, in terms of the non-dimensional coefficients
. It is evident that, in all cases, the flow presents a more uniform distribution compared to the initial one.
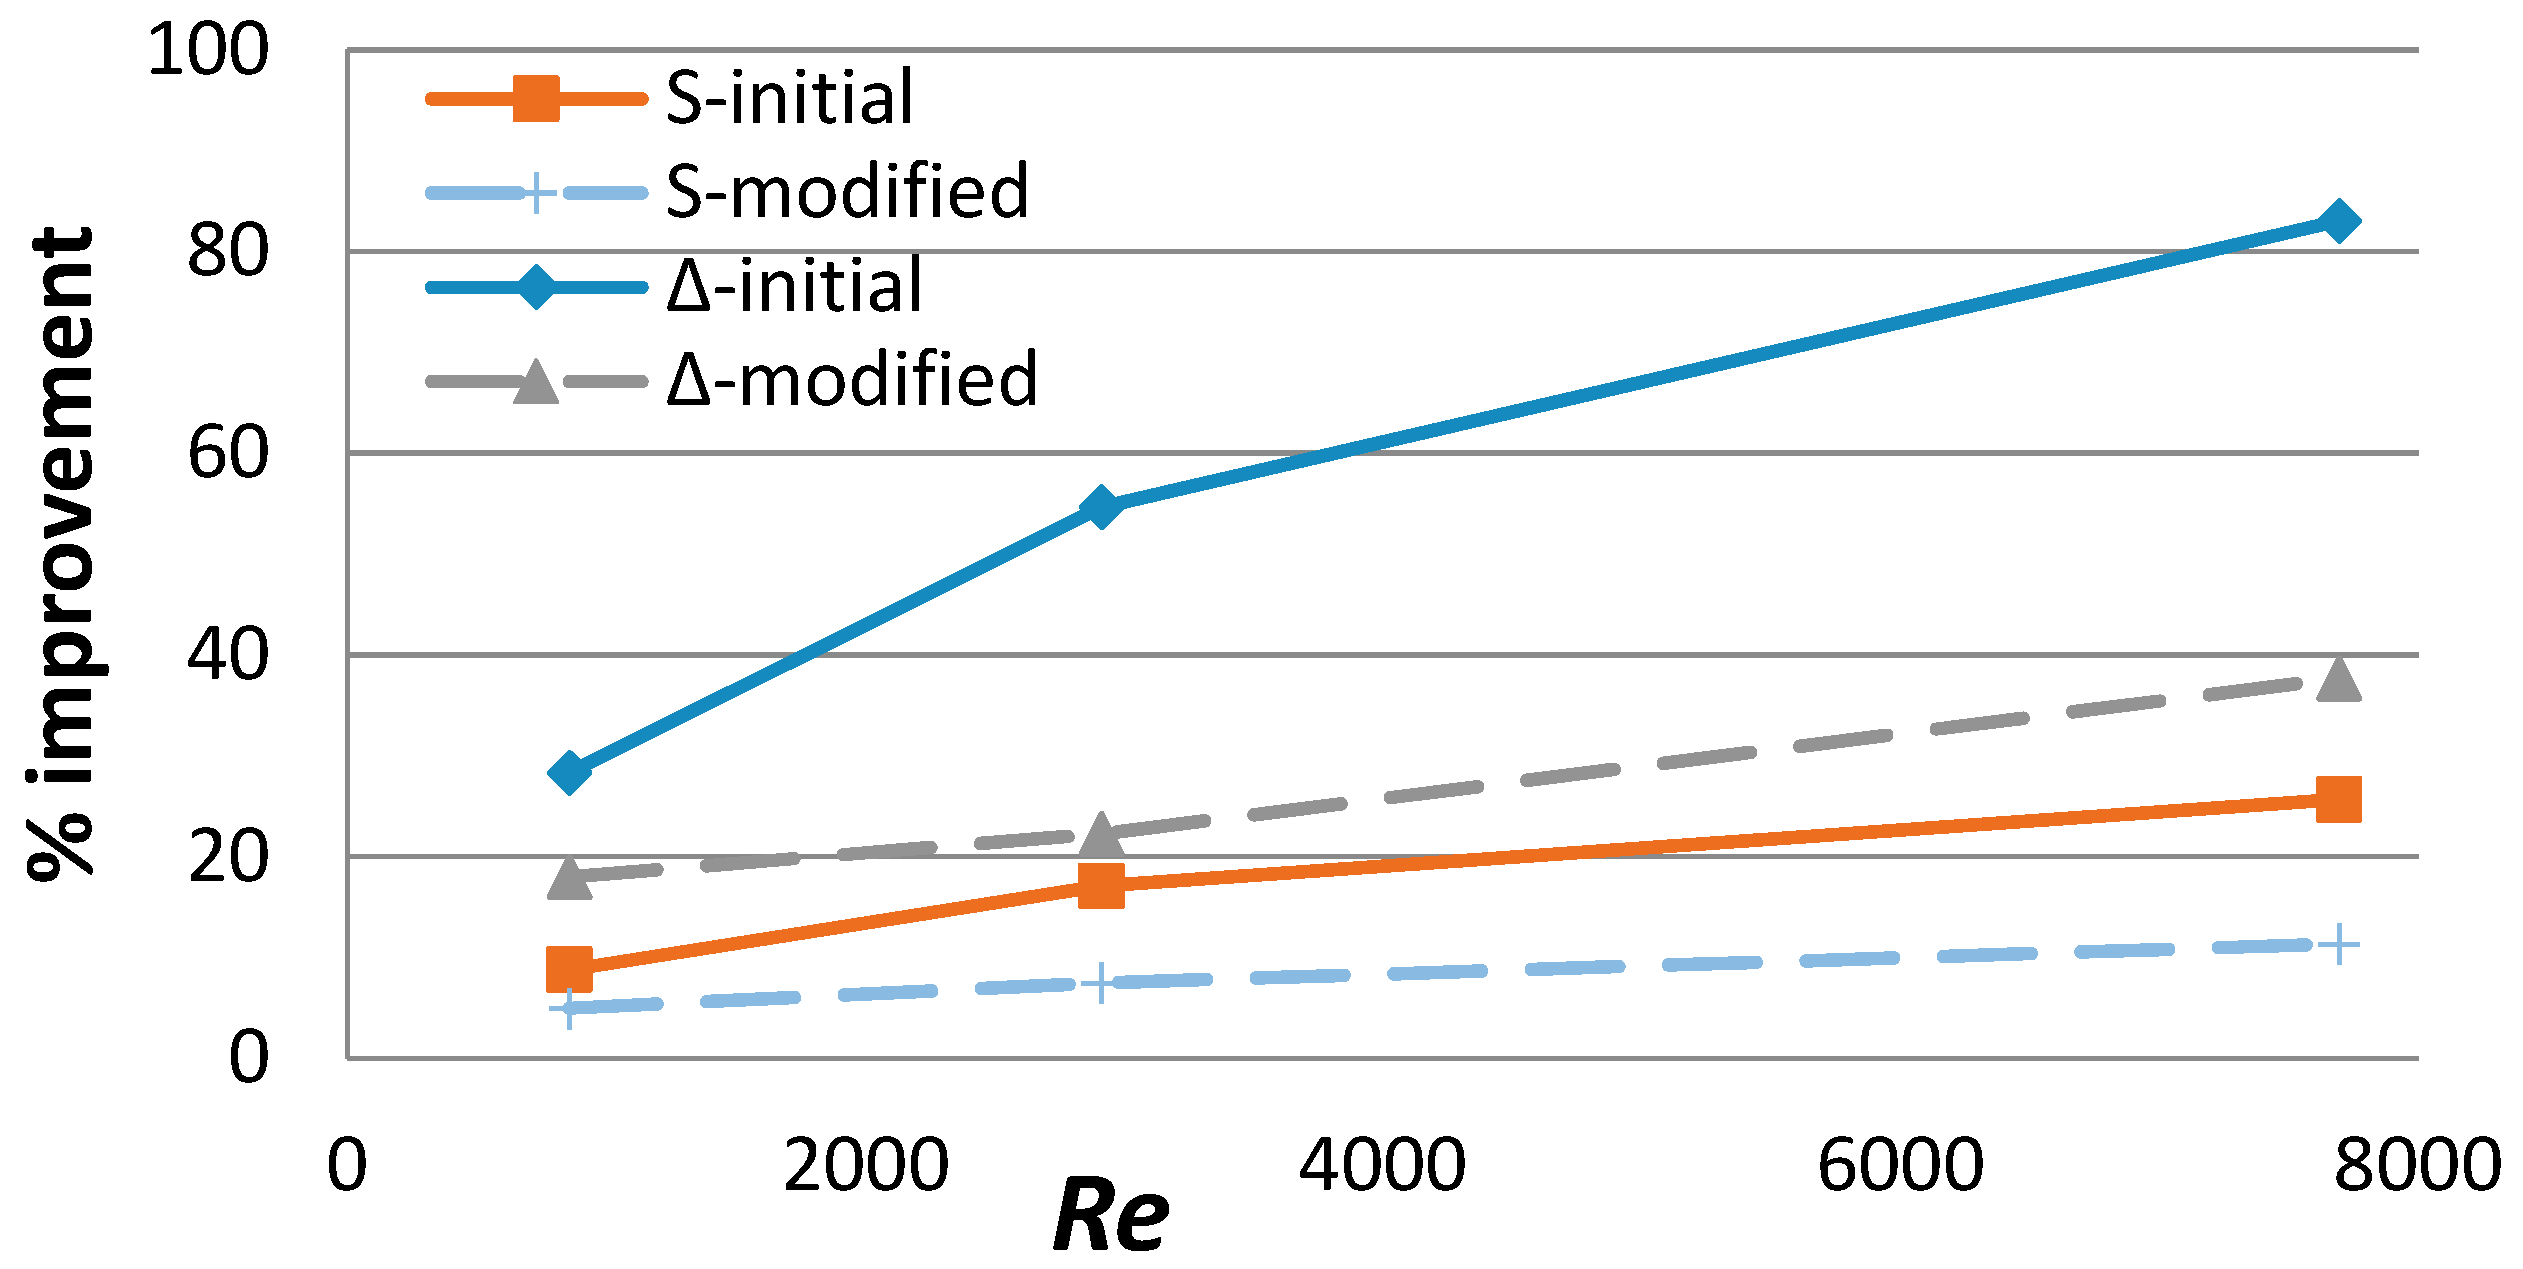
Figure 12 depicts the corresponding results in terms of uniformity metrics for the three cases under consideration. It becomes evident that, in all cases, the new values of the metrics are improved in the modified collector geometry.
Table 5 presents the corresponding results that quantify the above remarks. In particular, the values of the metrics
Sβ and Δ
β, as well as pressure drop across the collector, are presented for the initial and modified collector geometries. In all cases, the final values are lower than the initial ones. The higher the Reynolds number, the higher the percentage improvement; for
Re = 857, this corresponds to about 77% reduction in terms of the S
β metric, for
Re = 2913 the reduction becomes 129%, while for
Re = 7695 it remains about the same (126%). Similarly, important reduction percentages are obtained in terms of the Δ
β, namely 57%, 145%, and 121%, respectively. In addition, according to
Table 5, the pressure drop in the collector in all cases is lower than the initial one. Thus, the achieved flow rate uniformity enhancement is combined with a lower pumping requirement, i.e., the modified collector exhibits an overall improved hydrodynamic performance, both in terms of expected heat transfer efficiency and pressure drop.
6. Conclusions
Fluid flow distribution in flat plate solar collectors was and continues to be a matter of research for various applications, since the observed non-uniformity of the flow rate distribution among the riser tubes has a detrimental effect in the thermal efficiency of the collector.
In the present work, both experimental and numerical studies of the flow uniformity were performed in a forced circulation Z-type flat plate solar collector. Mass flow rate measurements in the riser tubes were performed, utilizing a specially adapted ultrasound instrument for various values of total flow rates in the collector. Appropriate metrics were introduced to quantify flow rate distribution non-uniformity among the risers. By means of a commercial CFD code, laminar and turbulent flow models in different computational grids were tested. Grid-insensitive solutions were obtained and successfully validated against the experiments. It was found that the use of the laminar flow model was sufficient to simulate and reproduce the flow non-uniformity in the flow regime under consideration.
Parametric studies for flow conditions outside the experimental window were performed, utilizing the CFD method in order to assess the effect of the Reynolds number in the flow distribution among the riser tubes. It was concluded that the flow non-uniformity among the risers increases with the inlet Reynolds number. In particular, the flow rate is lower than average at the risers located at the first half of the collector and becomes higher than average at the last ones. Furthermore, a CFD-based procedure for enhancing flow rate uniformity among the risers was proposed and successfully demonstrated; this relied on modifying the diameter of each riser tube and grouping them in three sizes. It was found that the flow rate uniformity enhancement was combined with a lower pumping requirement, i.e., the modified collector exhibited an overall improved hydrodynamic performance both in terms of expected heat transfer efficiency and pressure drop.
The continuation of the present research concerns further studies involving heat transfer measurements and calculations and the quantification of the improvement of the solar collector operational efficiency as a consequence of enhancing flow rate uniformity.
Author Contributions
A.H. and D.K. conceived and designed the investigation, E.H. manufactured all the purpose-built pipe systems. A.H. and E.H. performed the experiments, P.K. and D.K. conducted the simulations, D.K., A.H. and P.K. analyzed the data.
Acknowledgments
The authors gratefully acknowledge Costas Travasaros, president of Solar Heat Europe/ESTIF (European Solar Thermal Industry Federation) for valuable discussions concerning ISO 9806:2017, as well as the anonymous reviewers for their constructive and essential remarks. This research has been co-financed by the European Regional Development Fund of the European Union and Greek national funds through the Operational Program Competitiveness, Entrepreneurship and Innovation, under the call RESEARCH–CREATE–INNOVATE (project code: T1EDK-04359).
Conflicts of Interest
The authors declare no conflicts of interest.
Nomenclature
| D | Internal diameter of inlet and outlet tubes. |
| d | Internal diameter of riser tube. |
| di | Modified diameter of the ith-riser tube. |
| Average mass flow rate in riser tubes. |
| Mass flow rate the ith-riser tube. |
| N | Number of risers. |
| P | Pressure. |
| Re | Reynolds number. |
| u | Average velocity at the inlet tube. |
| ui | Average flow velocity in ith-riser tube. |
| S | Standard deviation of flow rate distribution among risers. |
| βi | Ratio of the local flow rate in the ith-riser to the average one. |
| Δ | Maximum flow rate difference non-dimensionalized by the average one. |
| ν | Coefficient of fluid kinematic viscosity. |
| ρ | Fluid density. |
References
- Energy Consumption in Households. Eurostat, Statistics Explained. Available online: https://ec.europa.eu/eurostat/statistics-explained/index.php/Energy_consumption_in_households (accessed on 15 November 2018).
- Strategic Research and Innovation Agenda for Renewable Heating and Cooling. Available online: http://www.rhcplatform.org/fileadmin/user_upload/members/Downloads/RHC_SRA_epo_Final_lowres.pdf (accessed on 10 November 2018).
- Chiou, J.P. The effect of nonuniform fluid flow distribution on the thermal performance of solar collector. Sol. Energy 1982, 29, 487–502. [Google Scholar] [CrossRef]
- Wang, X.A.; Wu, L.G. Analysis and performance of flat plate solar collector arrays. Sol. Energy 1990, 45, 71–78. [Google Scholar] [CrossRef]
- Weitbrecht, V.; Lehmann, D.; Richter, A. Flow distribution in solar collectors with laminar flow conditions. Sol. Energy 2002, 73, 433–441. [Google Scholar] [CrossRef]
- Wang, J. Pressure drop and flow distribution in parallel-channel configurations of fuel cells: Z-type arrangement. Int. J. Hydrog. Energy 2010, 35, 5498–5509. [Google Scholar] [CrossRef]
- Maharudayya, S.; Jayanti, S.; Deshpande, A.P. Flow distribution and pressure drop in parallel-channel configurations of planar fuel cells. J. Power Sources 2005, 144, 94–106. [Google Scholar] [CrossRef]
- Kim, S.; Choi, E.; Cho, Y.I. The effect of header shapes on the flow distribution in manifold for electronic packaging applications. Int. J. Heat Mass Transf. 1995, 22, 329–341. [Google Scholar] [CrossRef]
- Facao, J. Optimization of flow distribution in flat plate solar thermal collectors with riser and header arrangements. Sol. Energy 2015, 120, 104–112. [Google Scholar] [CrossRef]
- Garcia-Guendulain, J.M.; Riesco-Avila, J.M.; Elizalde-Blancas, F.; Belman-Flores, J.M.; Serrano-Arellano, J. Numerical study on the effect of distribution plates in the manifolds on the flow distributionand thermal performance of a flat plate solar collector. Energies 2018, 11, 1077. [Google Scholar] [CrossRef]
- Kramer, K.S.; Mehnert, S.; Geimer, K.; Reinhardt, M.; Fahr, S.; Thoma, C.; Kovacs, P.; Ollas, P. GUIDE TO STANDARD ISO 9806:2017 A Resource for Manufacturers, Testing Laboratories, Certification Bodies and Regulatory Agencies; Technical Report; Fraunhofer Institute for Solar Energy Systems: Freiburg, Germany, 2017. [Google Scholar]
- Datta, A.B.; Majumdar, A.K. Flow distribution in parallel and reverse flow manifolds. Int. J. Heat Fluid Flow 1980, 2, 253–262. [Google Scholar] [CrossRef]
- Jones, G.F.; Lior, N. Flow distribution in manifold solar collectors with negligible buoyancy effects. Sol. Energy 1994, 52, 289–300. [Google Scholar] [CrossRef]
- Patankar, S.V.; Spalding, D.B. A calculation procedure for heat, mass and momentum transfer in three-dimensional parabolic flows. Int. J. Heat Mass Transf. 1972, 15, 1787–1806. [Google Scholar] [CrossRef]
Figure 1.
Z-type configuration solar collector, consisting of inlet/outlet manifolds and 18 parallel riser tubes.
Figure 1.
Z-type configuration solar collector, consisting of inlet/outlet manifolds and 18 parallel riser tubes.
Figure 2.
Experimental facility setup.
Figure 2.
Experimental facility setup.
Figure 3.
Experimental mass flow rate measurements in the riser tubes.
Figure 3.
Experimental mass flow rate measurements in the riser tubes.
Figure 4.
Cross section of a manifold tube for grids A (left) and B (right).
Figure 4.
Cross section of a manifold tube for grids A (left) and B (right).
Figure 5.
Comparison of numerical results (laminar flow simulations in grids A and B) with experimental ones. (a) Re = 4309 (Case 4); (b) Re = 6567 (Case 5); (c) Re = 7695 (Case 6).
Figure 5.
Comparison of numerical results (laminar flow simulations in grids A and B) with experimental ones. (a) Re = 4309 (Case 4); (b) Re = 6567 (Case 5); (c) Re = 7695 (Case 6).
Figure 6.
Comparison of numerical results (laminar flow simulations in grids A and B). (a) Re = 857 (Case 1); (b) Re = 1713 (Case 2); (c) Re = 2913 (Case 3).
Figure 6.
Comparison of numerical results (laminar flow simulations in grids A and B). (a) Re = 857 (Case 1); (b) Re = 1713 (Case 2); (c) Re = 2913 (Case 3).
Figure 7.
Comparison of the pressure drop against inlet Reynolds number, as predicted by the laminar flow simulations in grids A and B.
Figure 7.
Comparison of the pressure drop against inlet Reynolds number, as predicted by the laminar flow simulations in grids A and B.
Figure 8.
Comparison of numerical with experimental results. The former were produced by laminar flow simulations in grid A and turbulent flow simulations (two models) in grid B. (a) Re = 4309 (Case 4); (b) Re = 6567 (Case 5); (c) Re = 7695 (Case 6).
Figure 8.
Comparison of numerical with experimental results. The former were produced by laminar flow simulations in grid A and turbulent flow simulations (two models) in grid B. (a) Re = 4309 (Case 4); (b) Re = 6567 (Case 5); (c) Re = 7695 (Case 6).
Figure 9.
Comparison of uniformity metrics Sβ and Δβ (defined by equations (7) and (8), respectively) versus inlet Reynolds number corresponding to the various numerical and experimental results. (a) S-metric; (b) Δ-metric.
Figure 9.
Comparison of uniformity metrics Sβ and Δβ (defined by equations (7) and (8), respectively) versus inlet Reynolds number corresponding to the various numerical and experimental results. (a) S-metric; (b) Δ-metric.
Figure 10.
Numerical prediction of flow distribution in riser tubes for various inlet Reynolds numbers. (a) Mass flow rate; (b) Non-dimensional local to average flow rate ratio.
Figure 10.
Numerical prediction of flow distribution in riser tubes for various inlet Reynolds numbers. (a) Mass flow rate; (b) Non-dimensional local to average flow rate ratio.
Figure 11.
Comparison of predicted flow distribution in the initial and modified collector geometries. (a) Re = 857 (Case 1); (b) Re = 2913 (Case 3); (c) Re = 7695 (Case 6).
Figure 11.
Comparison of predicted flow distribution in the initial and modified collector geometries. (a) Re = 857 (Case 1); (b) Re = 2913 (Case 3); (c) Re = 7695 (Case 6).
Figure 12.
Comparison of flow uniformity metrics in the initial and modified collector geometries.
Figure 12.
Comparison of flow uniformity metrics in the initial and modified collector geometries.
Table 1.
Test cases selected.
Table 1.
Test cases selected.
| Case | 1 | 2 | 3 | 4 | 5 | 6 |
|---|
| (kg/h) | 50 | 100 | 170 | 251.5 | 383.2 | 449.1 |
| (kg/s) | 0.0139 | 0.0278 | 0.0472 | 0.0699 | 0.1065 | 0.1248 |
| Re at inlet | 857 | 1713 | 2913 | 4309 | 6567 | 7695 |
| Re at riser | 138 | 276 | 470 | 695 | 1058 | 1240 |
Table 2.
Characteristics of the two grids created for the simulations.
Table 2.
Characteristics of the two grids created for the simulations.
| GRID | Elements | Inflation Layers | Growth Rate |
|---|
| A | 1,275,104 | 4 | 1.2 |
| B | 3,537,547 | 9 | 1.2 |
Table 3.
Numerical and experimental values of metrics Sβ and Δβ for the six cases. Predicted pressure drop is also tabulated. (Numerical results refer to laminar flow simulations in grid A).
Table 3.
Numerical and experimental values of metrics Sβ and Δβ for the six cases. Predicted pressure drop is also tabulated. (Numerical results refer to laminar flow simulations in grid A).
| Case | Reynolds | Sβ,num (%) | Sβ,exp (%) | Δβ,num (%) | Δβ,exp (%) | Δp,num (Pa) |
|---|
| 1 | 857 | 8.8 | - | 28.3 | - | 22.9 |
| 2 | 1713 | 13.3 | - | 42.1 | - | 51.3 |
| 3 | 2913 | 17.1 | - | 54.7 | | 98.6 |
| 4 | 4309 | 20.7 | 24.5 | 65.5 | 88.1 | 163.6 |
| 5 | 6567 | 24.2 | 33.4 | 76.6 | 129.4 | 298.3 |
| 6 | 7695 | 25.7 | 40.4 | 83.1 | 132.1 | 378 |
Table 4.
Groups of modified riser diameters aiming to uniformity improvement.
Table 4.
Groups of modified riser diameters aiming to uniformity improvement.
| Risers | Initial d (mm) | New d (mm)
(Re = 857) | New d (mm)
(Re = 2913) | New d (mm)
(Re = 7965) |
|---|
| 1 to 5 | 7.1 | 7.3 | 7.7 | 8.2 |
| 6 to 13 | 7.1 | 7.2 | 7.3 | 7.3 |
| 14 to 18 | 7.1 | 6.7 | 6.4 | 6.1 |
Table 5.
Initial and final values of pressure drop, Sβ and Δβ in riser tubes before and after modification of riser diameters for flow uniformity enhancement.
Table 5.
Initial and final values of pressure drop, Sβ and Δβ in riser tubes before and after modification of riser diameters for flow uniformity enhancement.
| Reynolds Number | Initial ΔΡ (Pa) | Final ΔΡ (Pa) | Initial Sβ (%) | Final Sβ (%) | Initial Δβ (%) | Final Δβ (%) |
|---|
| 857 | 23.0 | 22.7 | 8.8 | 5.0 | 28.3 | 18.0 |
| 2913 | 98.6 | 96.0 | 17.1 | 7.5 | 54.7 | 22.3 |
| 7695 | 377.9 | 352.0 | 25.7 | 11.3 | 83.0 | 37.7 |
© 2019 by the authors. Licensee MDPI, Basel, Switzerland. This article is an open access article distributed under the terms and conditions of the Creative Commons Attribution (CC BY) license (http://creativecommons.org/licenses/by/4.0/).
