1. Introduction
The low-speed high-torque generator is one of the most important components of a direct-drive wind turbine [
1,
2]. It is the core component that converts the mechanical energy of the blades captured from the wind into electrical energy. The direct-drive turbine improves the transmission efficiency [
3,
4,
5], but high loss and the ventilation system have become the key and difficult issues to be solved in the design process of low-speed and high-torque generators [
6]. As market demand increases, the continuous increase of single-unit capacity makes the high-loss characteristics of low-speed and high-torque generators more prominent, and gradually becomes one of the main obstacles to the development trend of single-unit large-capacity [
7,
8,
9]. Therefore, the cooling system design plays a prominent role in the construction cost and operational reliability [
10,
11,
12].
An axial-radial ventilation cooling system has been successfully applied to large-scale low-speed high-torque direct-drive wind turbines because of its high reliability, easy maintenance, and pollution-free advantages. The ventilation cooling system determines the operation temperature rise of the generator, as well as the operating life of the winding insulation and the thermal stress of the generator body [
13,
14,
15]. The high temperature of the winding causes the insulation material to age, even the generator winding will be damaged or broken down [
14,
16,
17]. For large-capacity wind turbines, the operating environment is harsh. Once the generator fails, it will lead to high maintenance and lifting costs—especially for large-scale offshore wind turbines, where maintenance and hoisting are not only expensive, but it is also difficult to change generator components. Therefore, it is extremely important to adopt effective cooling methods to control the temperature rise of the generator to achieve high reliability for large capacity direct-drive wind generators.
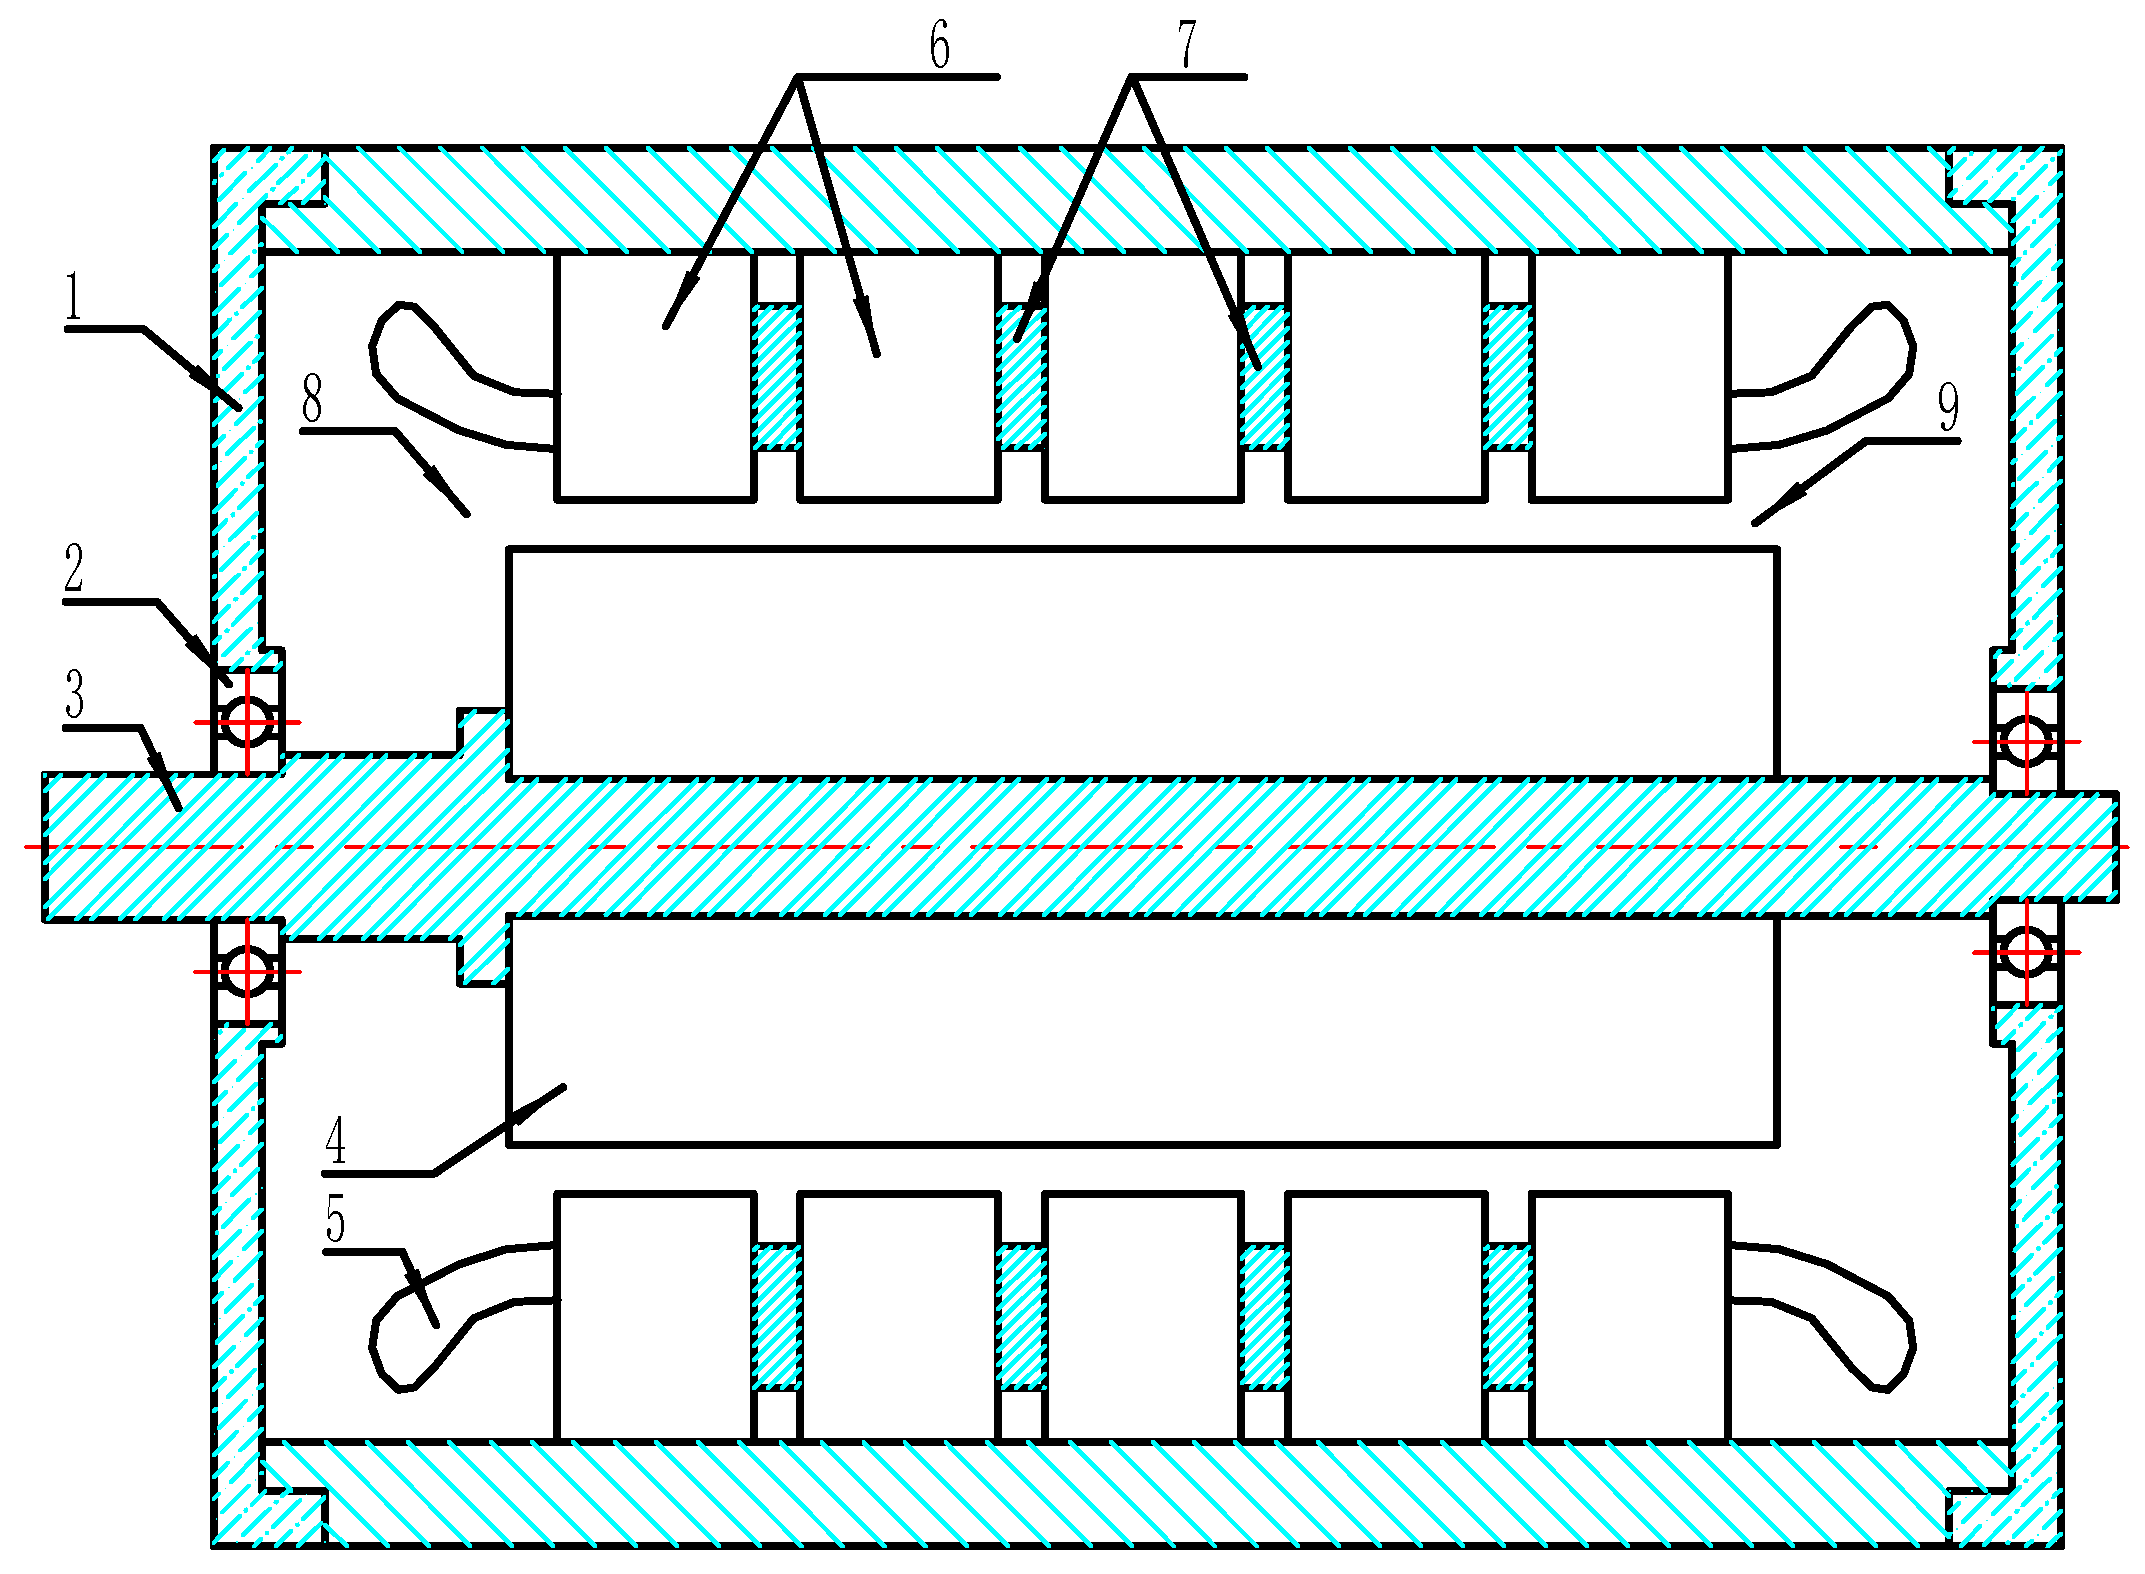
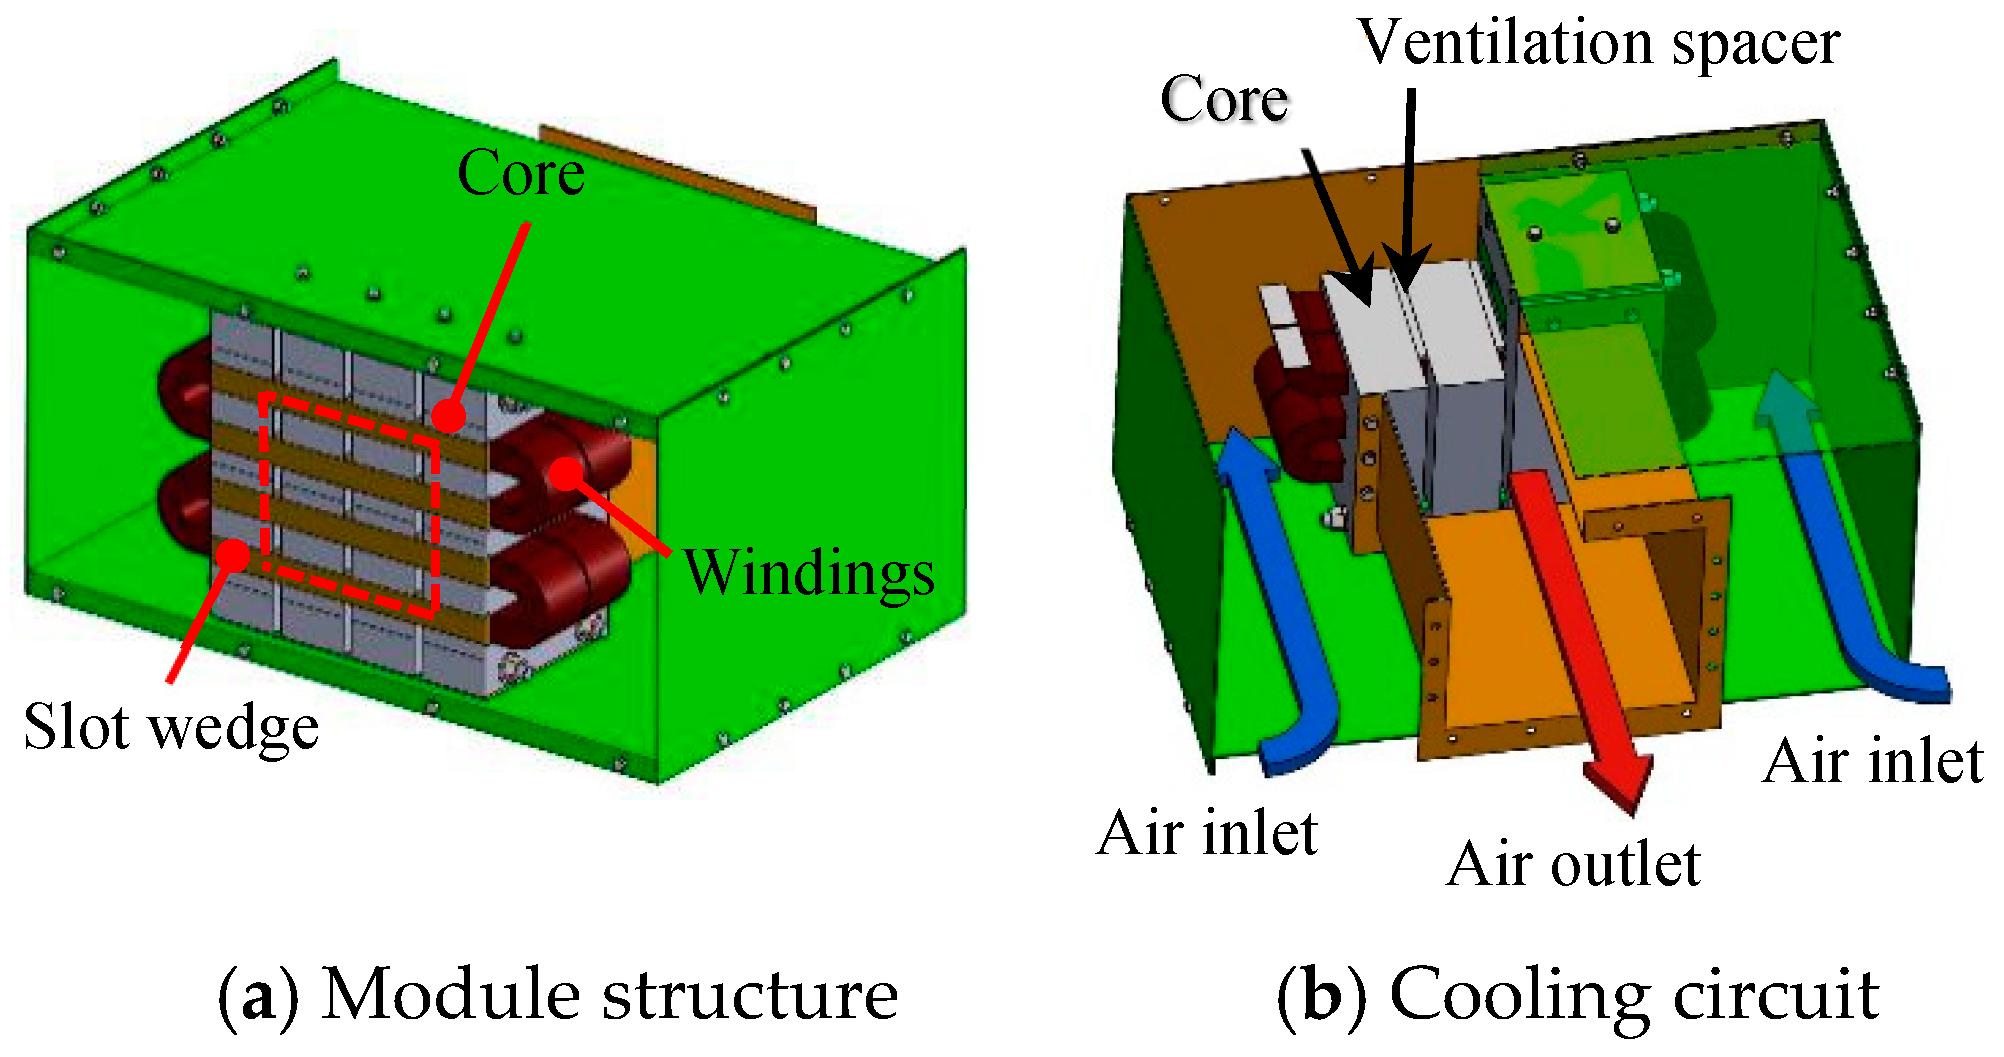
For the axial-radial ventilation system, the stator core is usually departed from a certain distance in the axial direction as shown in
Figure 1. The two adjacent stator core segments are connected and supported using the ventilation spacer (number 7 in
Figure 1). The narrow ducts between the two adjacent core segments are formed into the radial ventilation ducts, and the cooling air goes into the generator through the air gap from the number 2 (in
Figure 1) end of the generator (number 8 and 9 in
Figure 1). The existence of the radial ventilation ducts increases the heat dissipation area. Therefore, the power density of the generator can be improved due to the increase of the heat dissipation capacity. So, the radial ventilation of the stator has been widely applied in the large-scale generators [
18,
19,
20]. The ventilation spacers located in the ventilation ducts is an important component to form the ventilation ducts. When the cooling air flows through the radial ventilation ducts, the ventilation spacer structures have great influences on the temperature field because the ventilation spacer can change the flow distribution, flow loss, flow pressure drop, etc. Due to the complexity of the generator structure and cooling circuit structure of the radial ventilation system, the traditional equivalent cooling circuit calculation method cannot meet the demand for the current generator [
21,
22]. For the large capacity wind turbine, the test method has the disadvantages of high cost, long cycle, and some other limitations, therefore it is usually adopted to verify the design. With the continuous development of computer hardware and computational science in recent years, numerical simulation methods based on computational fluid dynamics (CFD) and computational heat transfer (CHT) are used for comparison of the ventilation cooling calculations for the large wind turbine due to the low cost, short cycle, and few limitations [
23,
24,
25]. As mentioned above, although the ventilation spacer plays an important role in the radial ventilation cooling system, there are few literatures on the optimization of the ventilation spacer.
In order to explore the influences of ventilation spacer structures on the radial cooling performance, the combination of numerical calculations and experiments was utilized to optimize the ventilation spacer structure for an MW-class direct-drive permanent magnet wind generator, the general specifications are given as shown in
Table 1. Aiming at a large number of ventilation spacer structure schemes, the numerical simulation analyses were carried out using the finite volume method. Based on the comprehensive considerations such as cooling effect, processing technology, structural strength, and huge construction cost, the optimal solution scheme was obtained and then the generator cooling system test bench was built. The heat dissipation of the ventilation spacer with the final optimization scheme, compared with the original scheme, was verified by experiments.
2. Establishment of the Numerical Calculation Model
To determine the influence of the ventilation spacers on thermal distributions and fluid velocity distributions, generator components except the ventilation spacer were kept consistent with the original design. Therefore, it is assured that the analysis and evaluation of different ventilation spacer structures was carried out under the premise of the same electromagnetic scheme. Based on an MW-class direct-drive permanent-magnet wind generator, the numerical calculation models of the generator—with a total of 63 ventilation spacers in 13 series including the original one—is solved.
2.1. Control Equations and their Discretization
The ventilation cooling process of a generator is a physical process in which fluid flowing and heat transfer are coupled. The heat transfer process is divided into a pure heat conduction process occurring in the solid part; and a convective heat transfer process occurring between the cooling air and the solid part. The governing equation for the pure heat conduction process in solid parts is shown in (1) [
26,
27]:
where
Ts is solid part temperature,
ST is the heat source,
ρs is the mass density of solid part,
c is the specific heat capacity,
λs is the thermal conductivity of solid parts, and
t is the calculation time.
The governing equation for fluid flowing and convective heat transfer processes is as shown in (2) [
26,
28]:
where
φ is the universal variable, which can represent
u,
v,
w (cooling air velocity component in different direction), and
T is the cooling air temperature;
U is the cooling air velocity vector;
ρf is the mass density of the cooling air;
Γφ is general diffusion coefficient; and
Sφ is the generalized source.
When the universal variable φ in (2) is set to 1, the governing equation becomes a continuity equation; when the general variable φ is u, v, w, the governing equation becomes a momentum conservation equation; when the general variable φ is T, the governing equation becomes an energy conservation equation.
Since the entire calculation process is a steady-state process, (1) and (2) can be simplified into (3) and (4) [
27,
29].
Based on the internal node method, Equations (3) and (4) are discretized using the Finite Volume Method (FVM). For convenience of explanation, the discretization forms in the one-dimensional Cartesian coordinate system corresponding to (3) and (4) are given, as shown in (5) and (6):
where Δ
x is the distance between adjacent nodes and superscript
i corresponds to the
i-th node in the solid component node.
where superscript
j corresponds to the
j-th node in the cooling air basin node.
In the discretizing forms (5) and (6), the convection term uses a second-order upwind difference format, and the diffusion term uses a central difference format.
2.2. Physical Model for the Numerical Calculation
Due to the large number of simulation calculations, it is necessary to simplify the simulation model reasonably for the economic considerations. The specific simplified principles are as follows:
(1) The calculation model is established according to the actual dimensions of the generator.
(2) The rotor loss density is very low compared to the stator loss density; the rotor inner surface is smooth due to the special design; a fan is equipped to evacuate the air to form a negative pressure area in the yoke of the stator—so the cooling air will go into the air-gap from the generator end area; the incoming velocity of cooling air going into the air-gap is about 27.8 m/s (measured), however the peripheral speed of the rotor is about 3.40 m/s according to the generator parameters, this is very small compared to the incoming velocity of the cooling air; based on the analyses, the rotor rotation effect on the stator thermal field can be ignored.
(3) According to the periodicity of the generator in the axial and tangential directions, the calculation model simplified to contain one radial air passage and one ventilation spacer located therein is established.
(4) Since the insulation of the winding is extremely thin and complicated, the actual modeling will make the subsequent mesh division extremely difficult and hard to calculate. Therefore, the insulation, including the turn to turn insulation, coils’ insulation, layer to layer insulation, slot insulation, slot wedge, wedge spacer, windings, etc., should be combined as one component for meshing and calculating. Then the different thermal conductivity of different components can be replaced by using the equivalent thermal conductivity. During the convert process, the heat exchange to external components is kept unchanged. Thus, the equivalent thermal conductivity can be determined by (7) [
30].
where
lco is the winding dimension,
lin is the insulation thickness,
λco is the winding thermal conductivity,
λin is the insulation thermal conductivity, and
λe is the equivalent thermal conductivity. The copper coils’ thermal conductivity is 386.4 W/(m/K), and the thermal conductivity of the insulation materials is 0.29 W/(m/K).
To calculate the equivalent thermal conductivity of the windings, the windings’ basic parameters are given as shown in
Table 2.
The simplified calculation model is as shown in
Figure 2. The cooling air inlet, outlet, and boundary conditions are as shown in
Figure 2, the tangential sides of the model are set as periodic boundaries and the remaining boundaries are all set as wall boundaries.
2.3. Determination of the Heat Sources and Input Settings
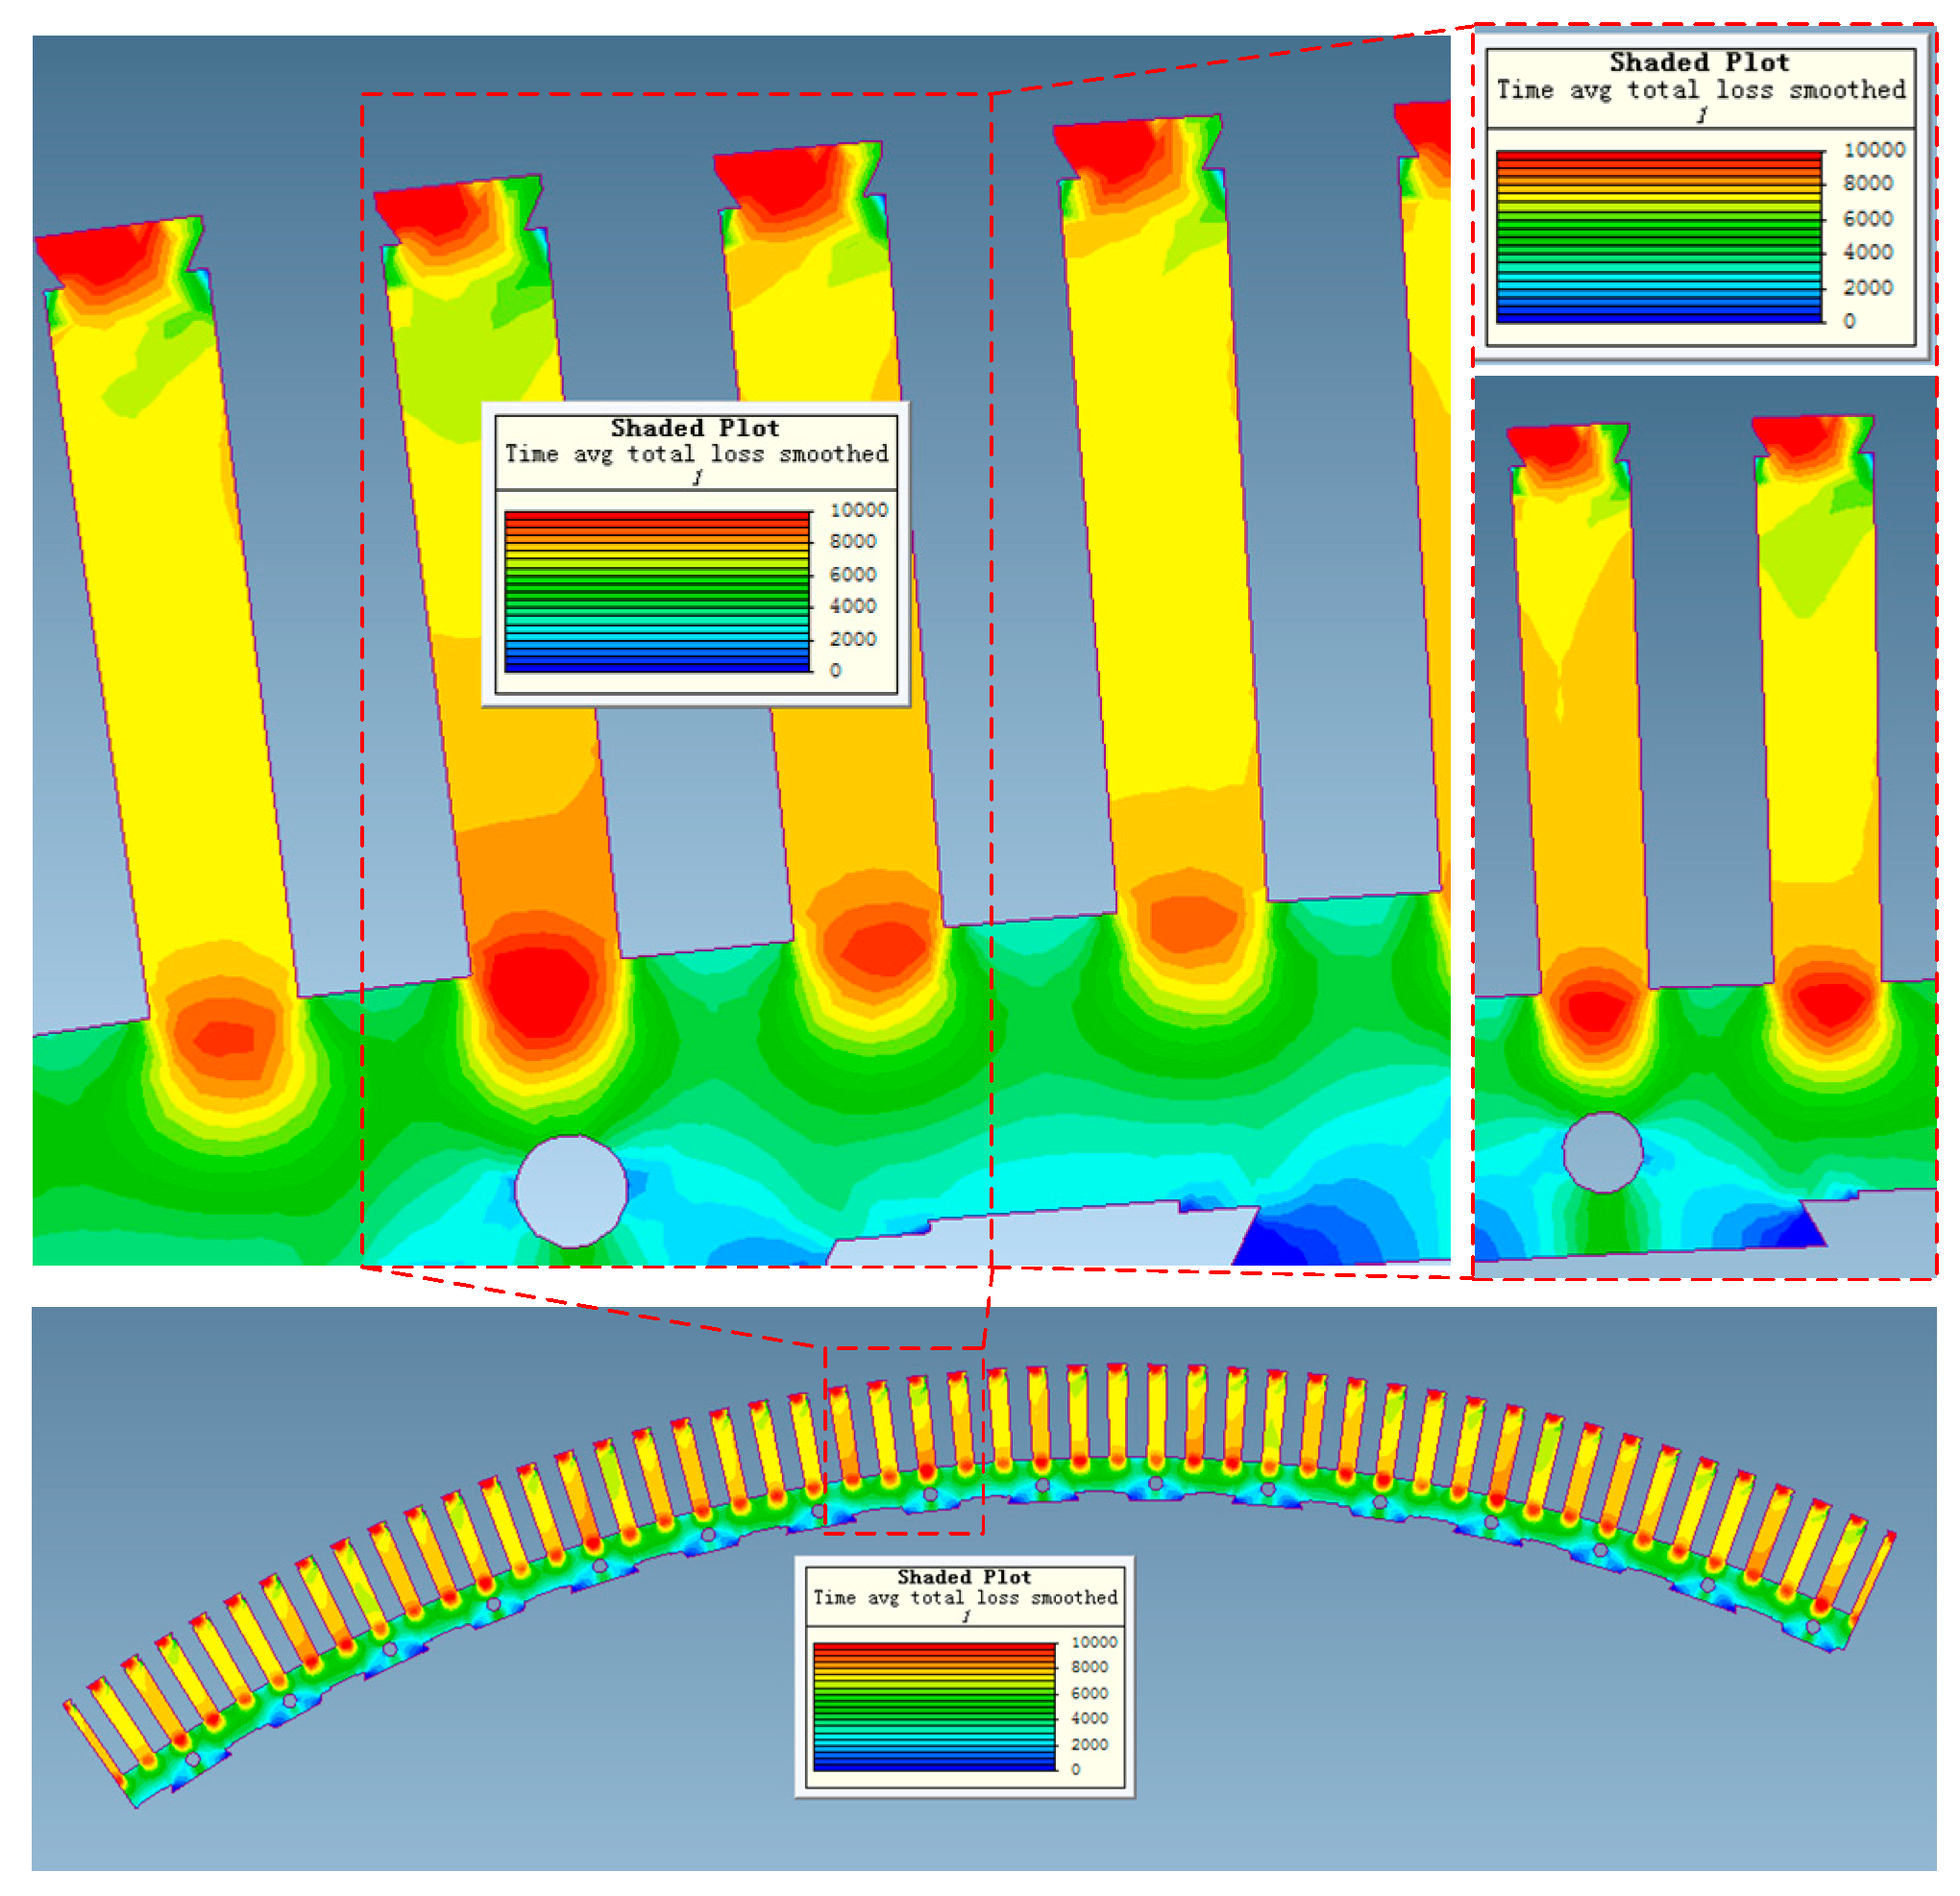
To proceed the thermal and fluid flowing coupled calculations, the stator loss including the core loss and windings’ loss should first be determined. So, the 2-D electromagnetic field calculation model of Direct-Drive Permanent Magnet Wind Generators (DDPMWG) was established and solved by using the finite element method. The stator core loss distributions are obtained as shown in
Figure 3. Due to the special design, the flux density at the teeth is 1.69 T (averaged), which is much larger than the yoke (1.26 T, averaged), so the core loss density of the teeth is much larger than that of yoke accordingly, as shown in
Figure 3. For this generator, the total core loss of teeth is 14.42 kW, however the total core loss of yoke is only 8.36 kW. Since 63 different ventilation spacers schemes needed to be calculated to get the optimized ventilation spacer structure quickly and the calculation results differ with the actual generator, we took into account the core loss distributions, so we neglected the differences of the loss distributions in different parts of the stator core, and regarded the loss distributed in the core evenly to proceed the thermal and fluid flowing coupled calculations, then validated the optimized ventilation spacer by using the experiments. By this way, we could skip large simulation calculations and obtain the optimized ventilation spacer scheme faster.
Table 3 shows the loss of each component of the generator.
The calculation input of 63 ventilation spacers including the original one was completely the same. The boundary conditions of thermal calculations are shown in
Table 4.
Considering the electromagnetic wire outer insulation material, its size is very small, and it is difficult to get the reasonable mesh grids, so the insulation and windings are combined as one component as stated above. The iron core adopts laminations, the thermal conductivity in the axial direction is much smaller than the radial direction and tangential direction. Therefore, the thermal conductivity of the winding and the core material are anisotropic, the thermal conductivity of the other components’ materials are isotropic. The thermal conductivity of the windings can be determined by using Equation (7) and the windings’ basic parameters given in
Table 2.
Table 5 shows the thermal conductivity of generator components.
Due to the large radial dimensions of the generator, the cooling air in the air-gap of the generator is flowing in a turbulent state. The turbulent area along normal direction of wall can be divided into two areas—wall area and large turbulent area. The wall functions are adopted to reduce the mesh elements. The distance of the wall area to the wall is determined by using a semi-empirical formula as shown in (8) [
31].
where Δ
y is the distance from calculation particle to the wall,
ρ is the mass density of the fluid,
uτ is the friction velocity of the fluid aligned to the wall tangential direction, and
u is the time-average velocity of the fluid.
Based on the analyses above, the
k-ε realizable turbulence model, the scalable wall function, and the boundary conditions (shown in
Figure 2) were adopted to carry out the numerical calculations. The governing equations were then solved by the semi-implicit method (SIMPLE) for solving the fluid flowing and heat transfer coupling equations.
2.4. Meshing of the Physical Numerical Calculation Model
The quality of the grid is the key to affect the calculation results. The grids commonly used in computational models are hexahedral and tetrahedral elements. Since the windings, the iron core is made up of heat-generating components and the shape is relatively regular. The hexahedral mesh element was adopted, but the cooling air flow region was difficult to be meshed using hexahedral elements due to the complicated geometric structure, so the tetrahedral mesh was used for meshing division.
In order to improve the accuracy of the calculation results, the simulation calculation of each ventilation spacer structure was verified by grid independence. Taking the maximum temperature of the winding and the pressure drop of the cooling air as the reference, under the premise of ensuring the mesh quality, the calculation of different mesh densities is carried out, and the mesh with the smallest number of calculations results independent of the mesh density was selected as the final computing grids.
During the simulation calculation, the Y+ values should be verified by the mesh elements, and the final mesh solution also needed to be adjusted according to the Y+ value of the cooling expansion layer. After adjustment, the Y+ values of the cooling air flow in the 63 ventilation spacers were distributed in the range of 5~300, in accordance with the application range of the scalable wall function. While the mesh works are done, the mesh elements of the simulation model with 63 ventilation spacers range from 1 million to 3 million, which is dependent on the complexity of the ventilation spacers. The maximum distortion factor was 0.89, which can satisfy the calculation requirement (generally less than 0.95).
2.5. Criteria to Judge the Optimized Ventilation Spacer
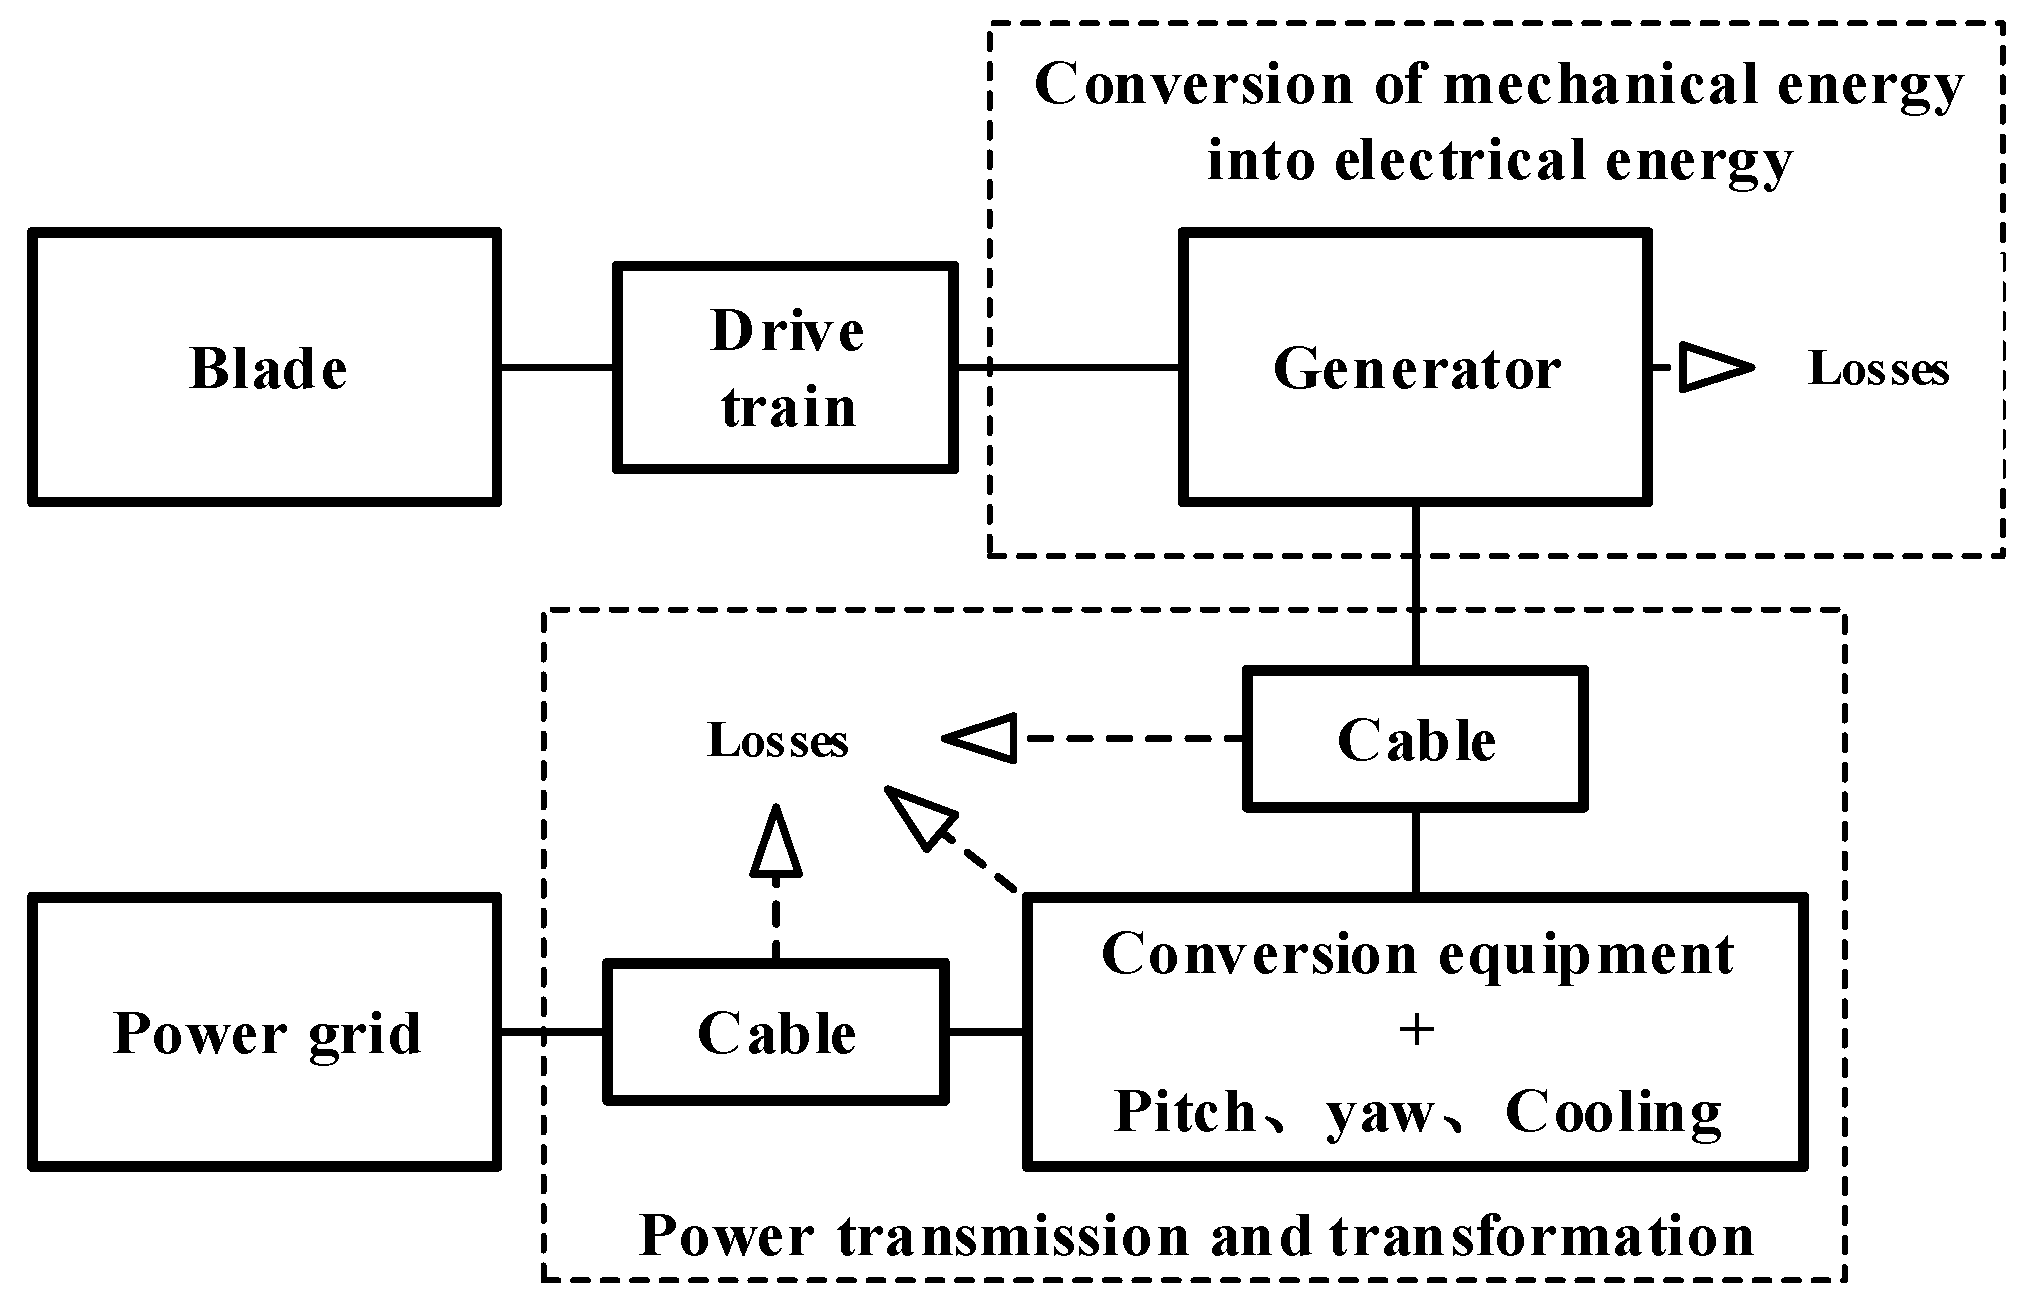
The simulation calculations for the 63 ventilation spacer schemes were carried out at the same loss, and the same air volume and inlet temperature. It is not appropriate to determine the preferred ventilation spacer structure only by the maximum temperature rise. Due to the fact the radial air passages with different ventilation spacer structures have different impedances, when the cooling air flows into the radial air passages corresponding to different ventilation spacer structures is kept constant, the resistance overcoming the cooling air flow is different—that is, when the temperature of the generator winding under a certain ventilation spacer structure is low, the air power required by the air-cooling fan may also be larger. Therefore, in order to evaluate the final preferred solution from the 63 ventilation spacer structures, it is necessary to comprehensively compare the generator winding temperature rise and the cooling air pressure drop. When the power of the generator is the same (the current is equal), the winding temperature directly affects the resistance of the winding and ultimately reflects in the copper loss. When the cooling air flow is the same, different pressure drops mean that the aerodynamic power of the fan is different. The pneumatic power provided by the cooling fan is the loss during the power conversion and transmission of the wind turbine (as shown in
Figure 4), because the iron loss of the generator relative to the copper loss is small, and it is not very sensitive to temperature changes. Therefore, it can be considered that the iron loss is constant at different winding temperatures, and when the copper loss and the consumed pneumatic power are added together, the corresponding overall efficiency is lower, and vice versa. Therefore, under the premise of ensuring the same power, from the perspective of the efficiency of the whole machine, a certain relationship is established between the generator winding temperature and the cooling air pressure drop, to determine the preferred scheme of the ventilation spacer structure.
The copper loss can be calculated according to (9):
where
Pcoil is the winding copper loss,
R0 is the winding standard resistance,
T0 is the standard temperature,
Tcoil is the winding temperature,
n is the winding phase number, and
K is the AC resistance increase factor.
When the generator power is the same, the copper loss corresponding to the original design scheme of the ventilation spacer structure can be converted into the loss at the winding temperature corresponding to the optimization scheme of the other ventilation spacer structure by (9), and the difference between the two schemes can be obtained by (10):
where
Pcoil-or is the copper loss of the original design scheme which is 29.31 W (as shown in
Table 3),
Tcoil-or is the winding temperature of the original design scheme, and
Tcoil-op is the winding temperature of optimization scheme.
The starting power of the cooling air flow can be calculated by (11):
where Δ
p is the cooling air pressure drop and
Q is the cooling air flow volume.
When the cooling air flow rate is the same, the aerodynamic power corresponding to the cooling air flow can be calculated by (11), and the difference between the original design of the ventilation spacer structure can be obtained by (12):
where Δ
por is the cooling air pressure drop of the original design scheme, Δ
pop is the cooling air pressure drop of the optimization scheme, and
Q is the cooling air flow volume set to 1.736 m
3/s (as shown in
Table 3).
Summed (10) and (12), the difference between the copper loss and the aerodynamic power within different ventilation spacer structures including the original design is obtained, as shown in (13).
when Δ
Ptot corresponding to a ventilation spacer structure optimization scheme is small, it indicates that the overall efficiency of the optimization scheme is higher. Therefore, the final preferred embodiment of the ventilation spacer structure can be determined by (13).
2.6. Thermal Field and Flowing Field Distribution of the Optimized Ventilation Spacer
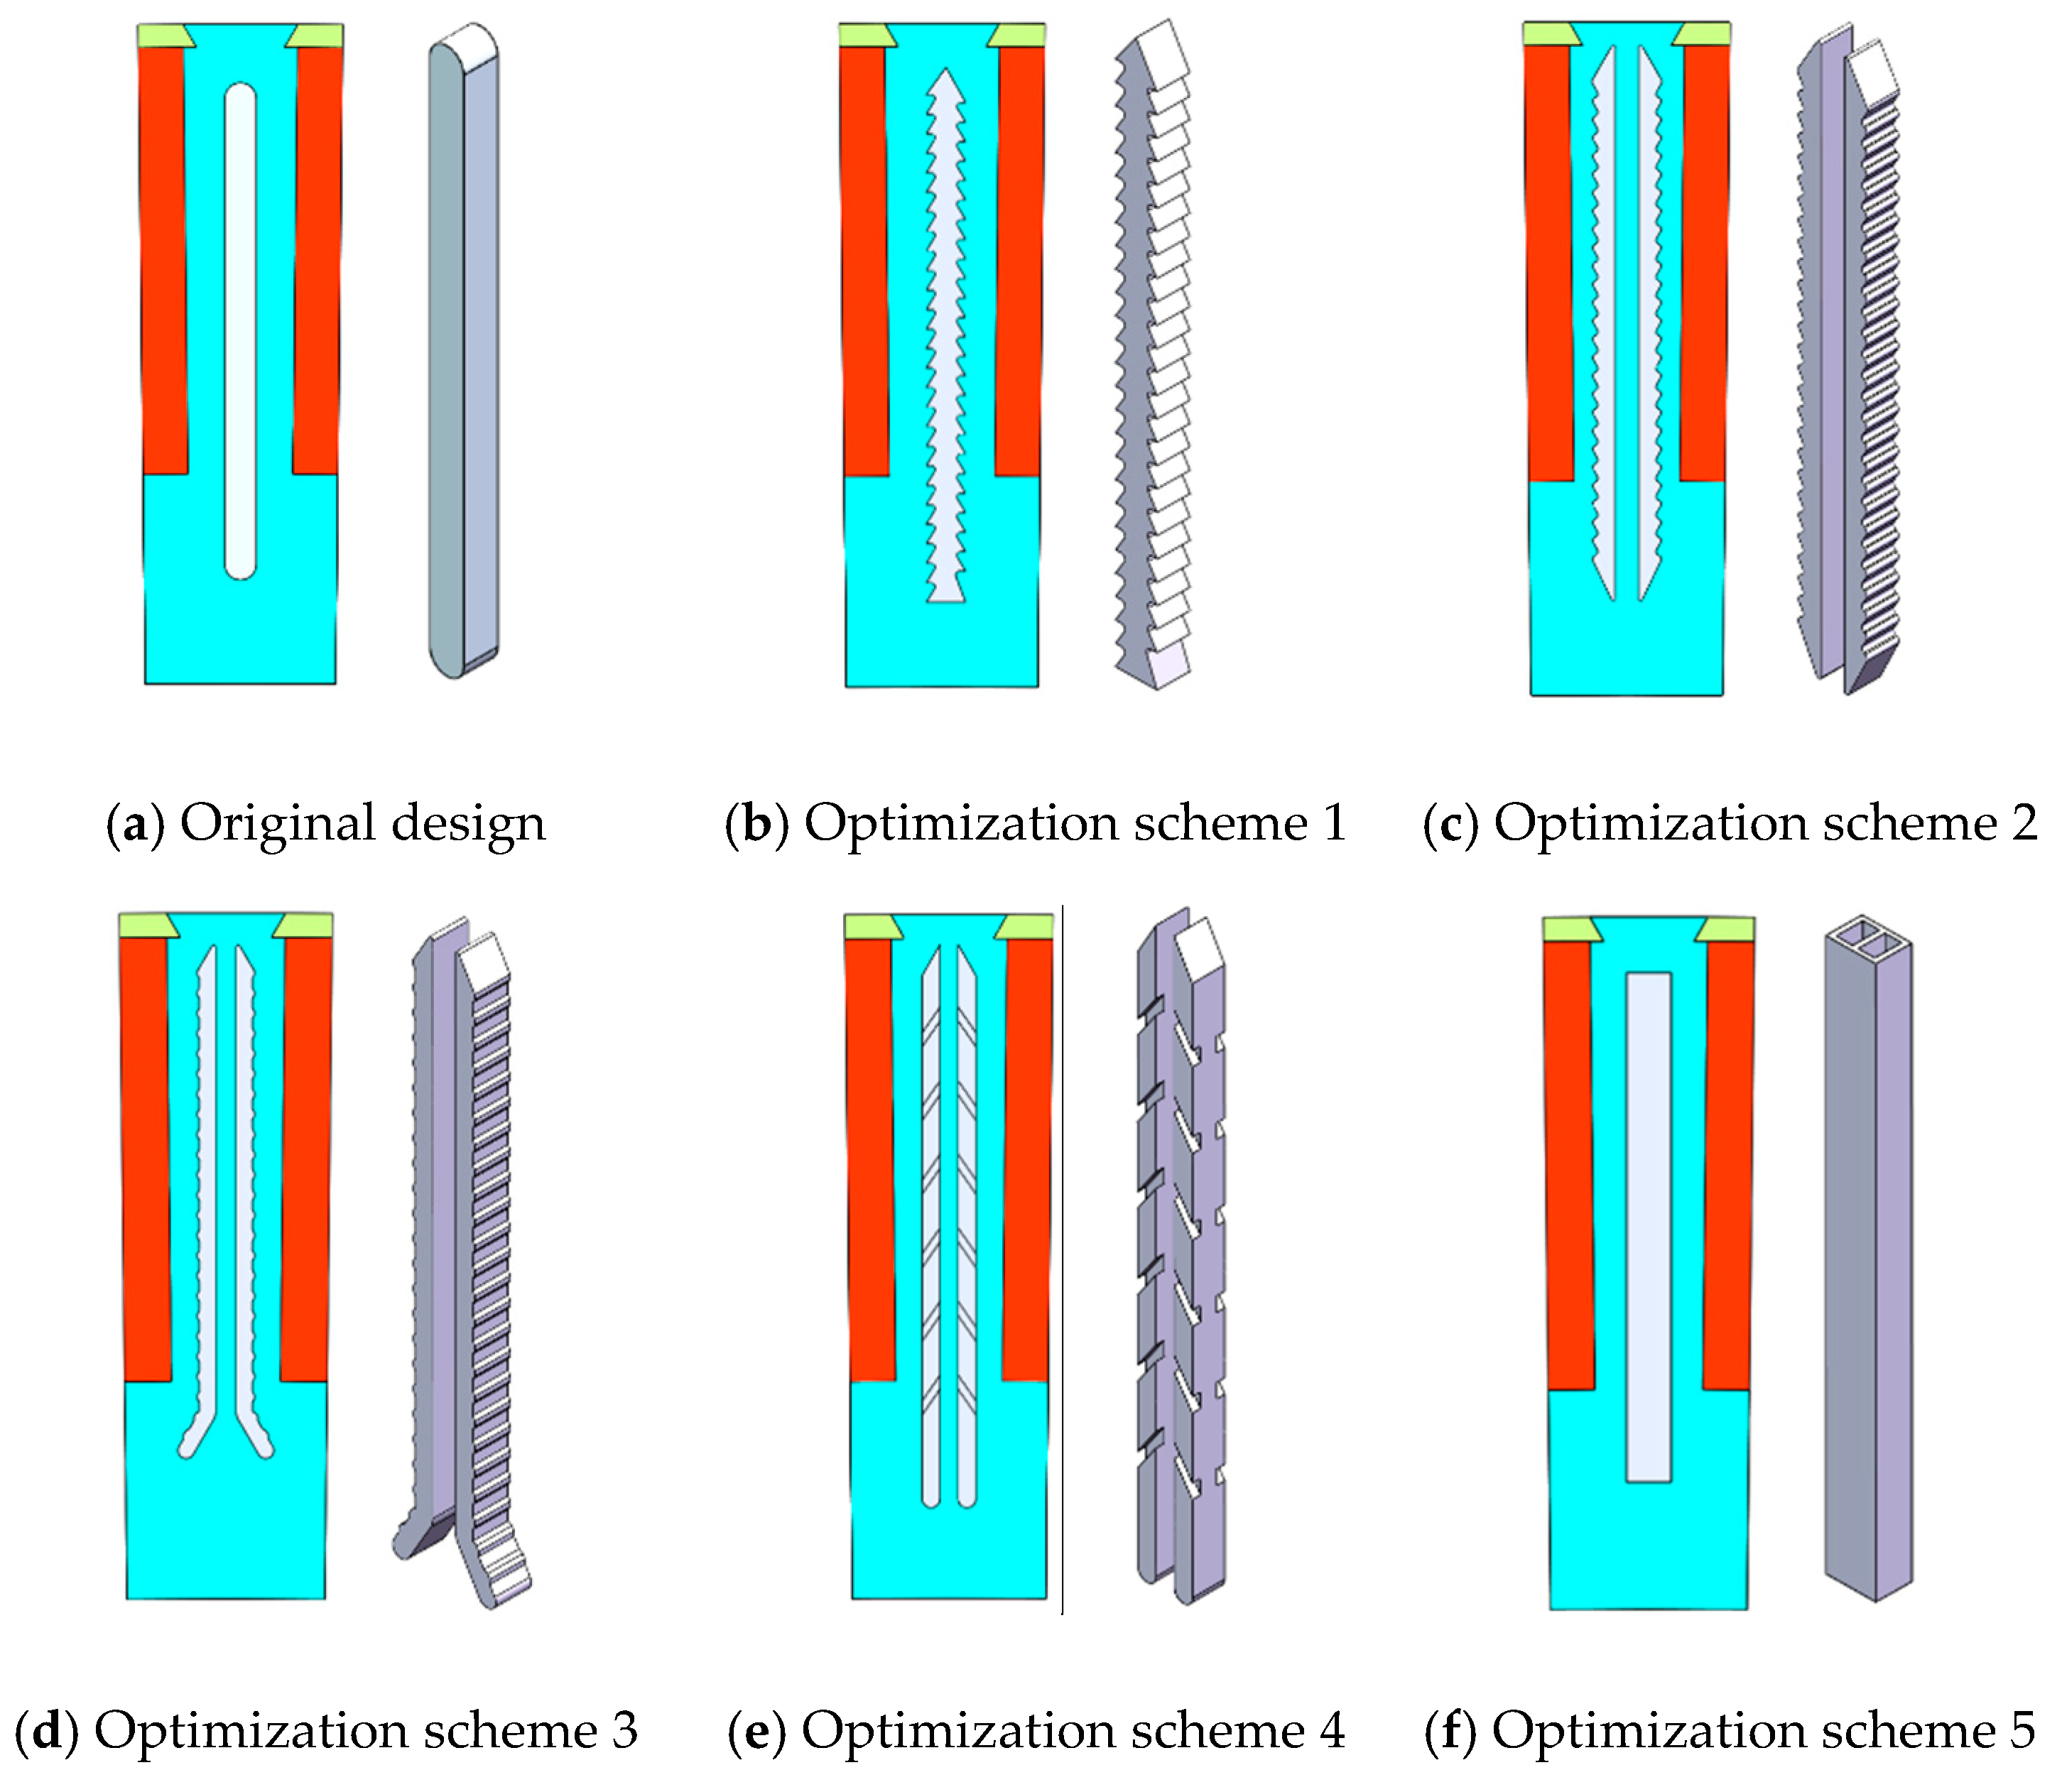
In the 63 ventilation spacer optimization schemes, five optimized structures were selected for detailed analysis according to the criteria described in 1.5. The comparison of the five structures with the existing structure is shown in
Figure 5.
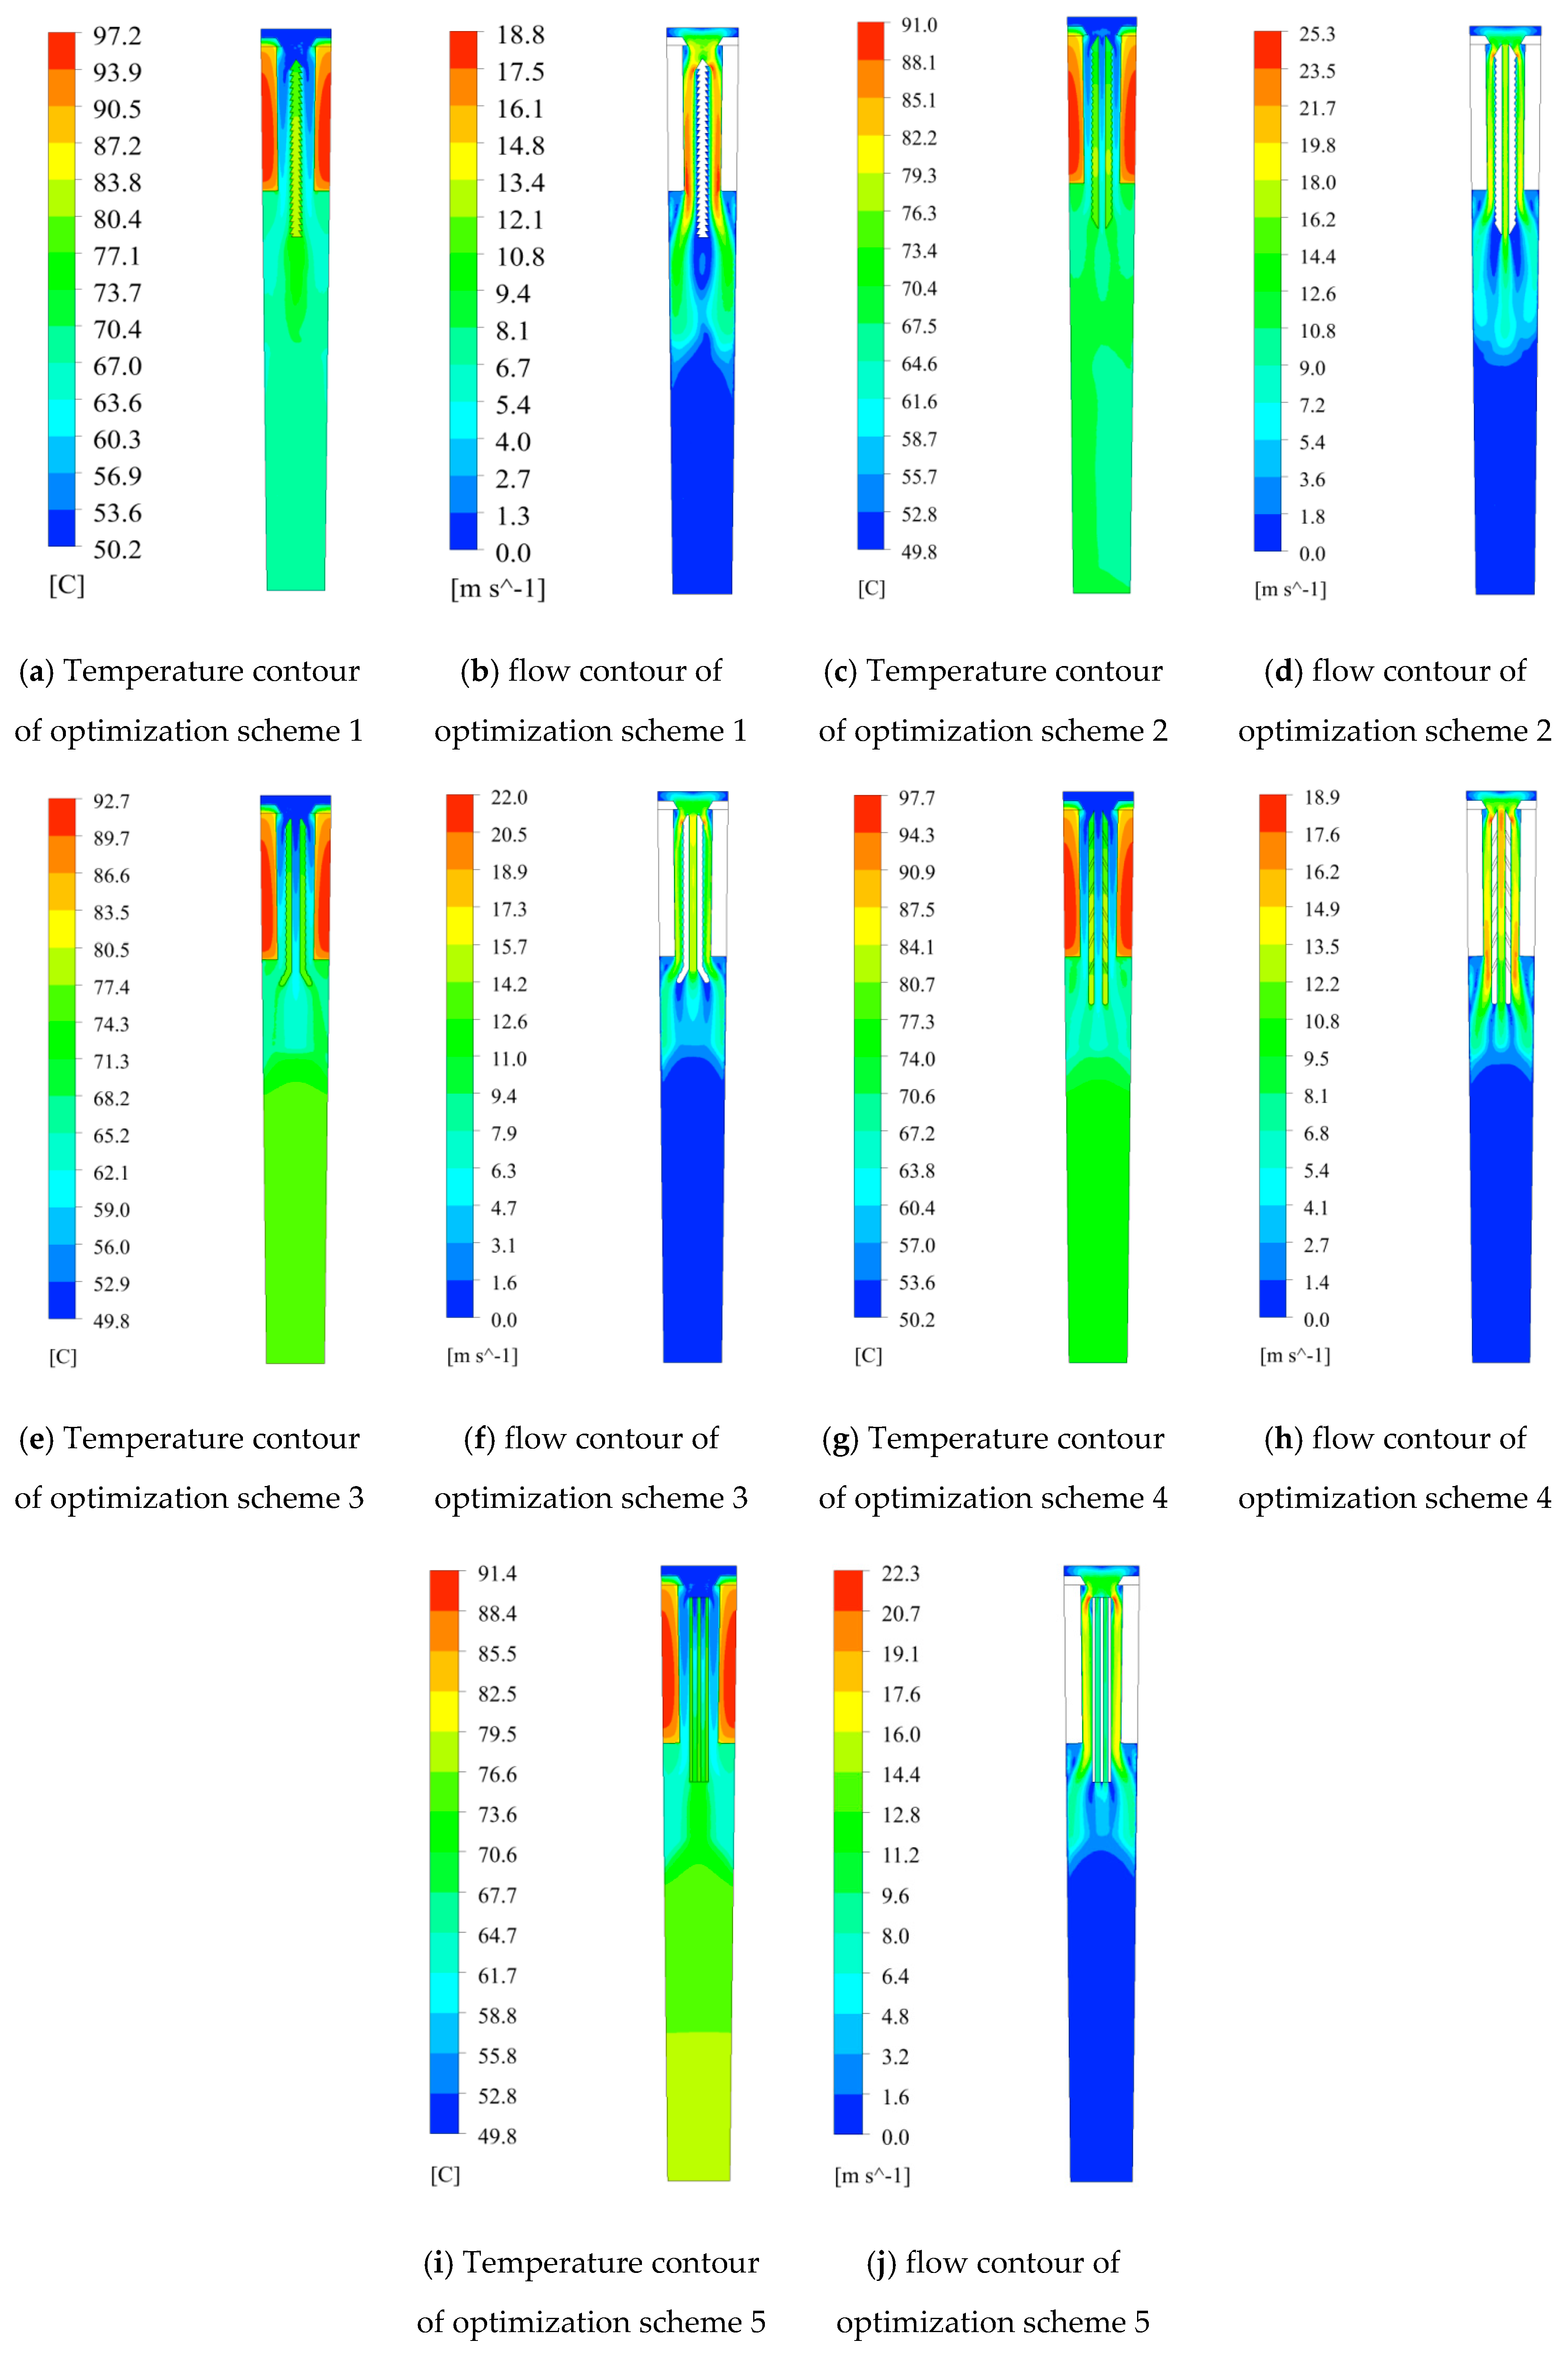
The temperature field and flow field distributions obtained from numerical simulation calculation of the five ventilation spacer structure schemes are as shown in
Figure 6.
It can be seen from
Figure 6 that the temperature field and the flow field contour maps corresponding to different optimization schemes have significant differences. As mentioned above, different ventilation spacer structures cause changes in the cooling air flow characteristics, which in turn affects the convective heat transfer between the cooling air and the stator conductor. Specifically, when the stator conductor loss and the cooling air volume are the same, the different ventilation spacer structures make the flow rate of the cooling air in the radial air passage different, and the turbulence of the cooling air when circulating the different structure ventilation spacers is also incomplete. The same occurs while the flow rate and turbulence directly affect the convective heat transfer coefficient between the cooling air and the winding. In addition, different ventilation spacer structures make the heat exchange area of the stator conductors different.
Table 6 shows the convective heat transfer coefficient between the cooling air and the winding and the heat exchange area of the ventilation spacer in the different ventilation spacer structure scheme.
It can be seen from
Table 6 that, compared with the original design scheme, the convective heat transfer coefficient between the cooling air and the winding and the heat exchange area of the ventilation spacer are increased, and the cooling air and the winding in optimization scheme 2 are improved. The increase in convective heat transfer coefficient is most significant. Compared with the original design, optimization schemes 4 and 5 have a convective heat transfer coefficient between the cooling air and the windings, but the heat exchange area of the ventilation spacer increases significantly.
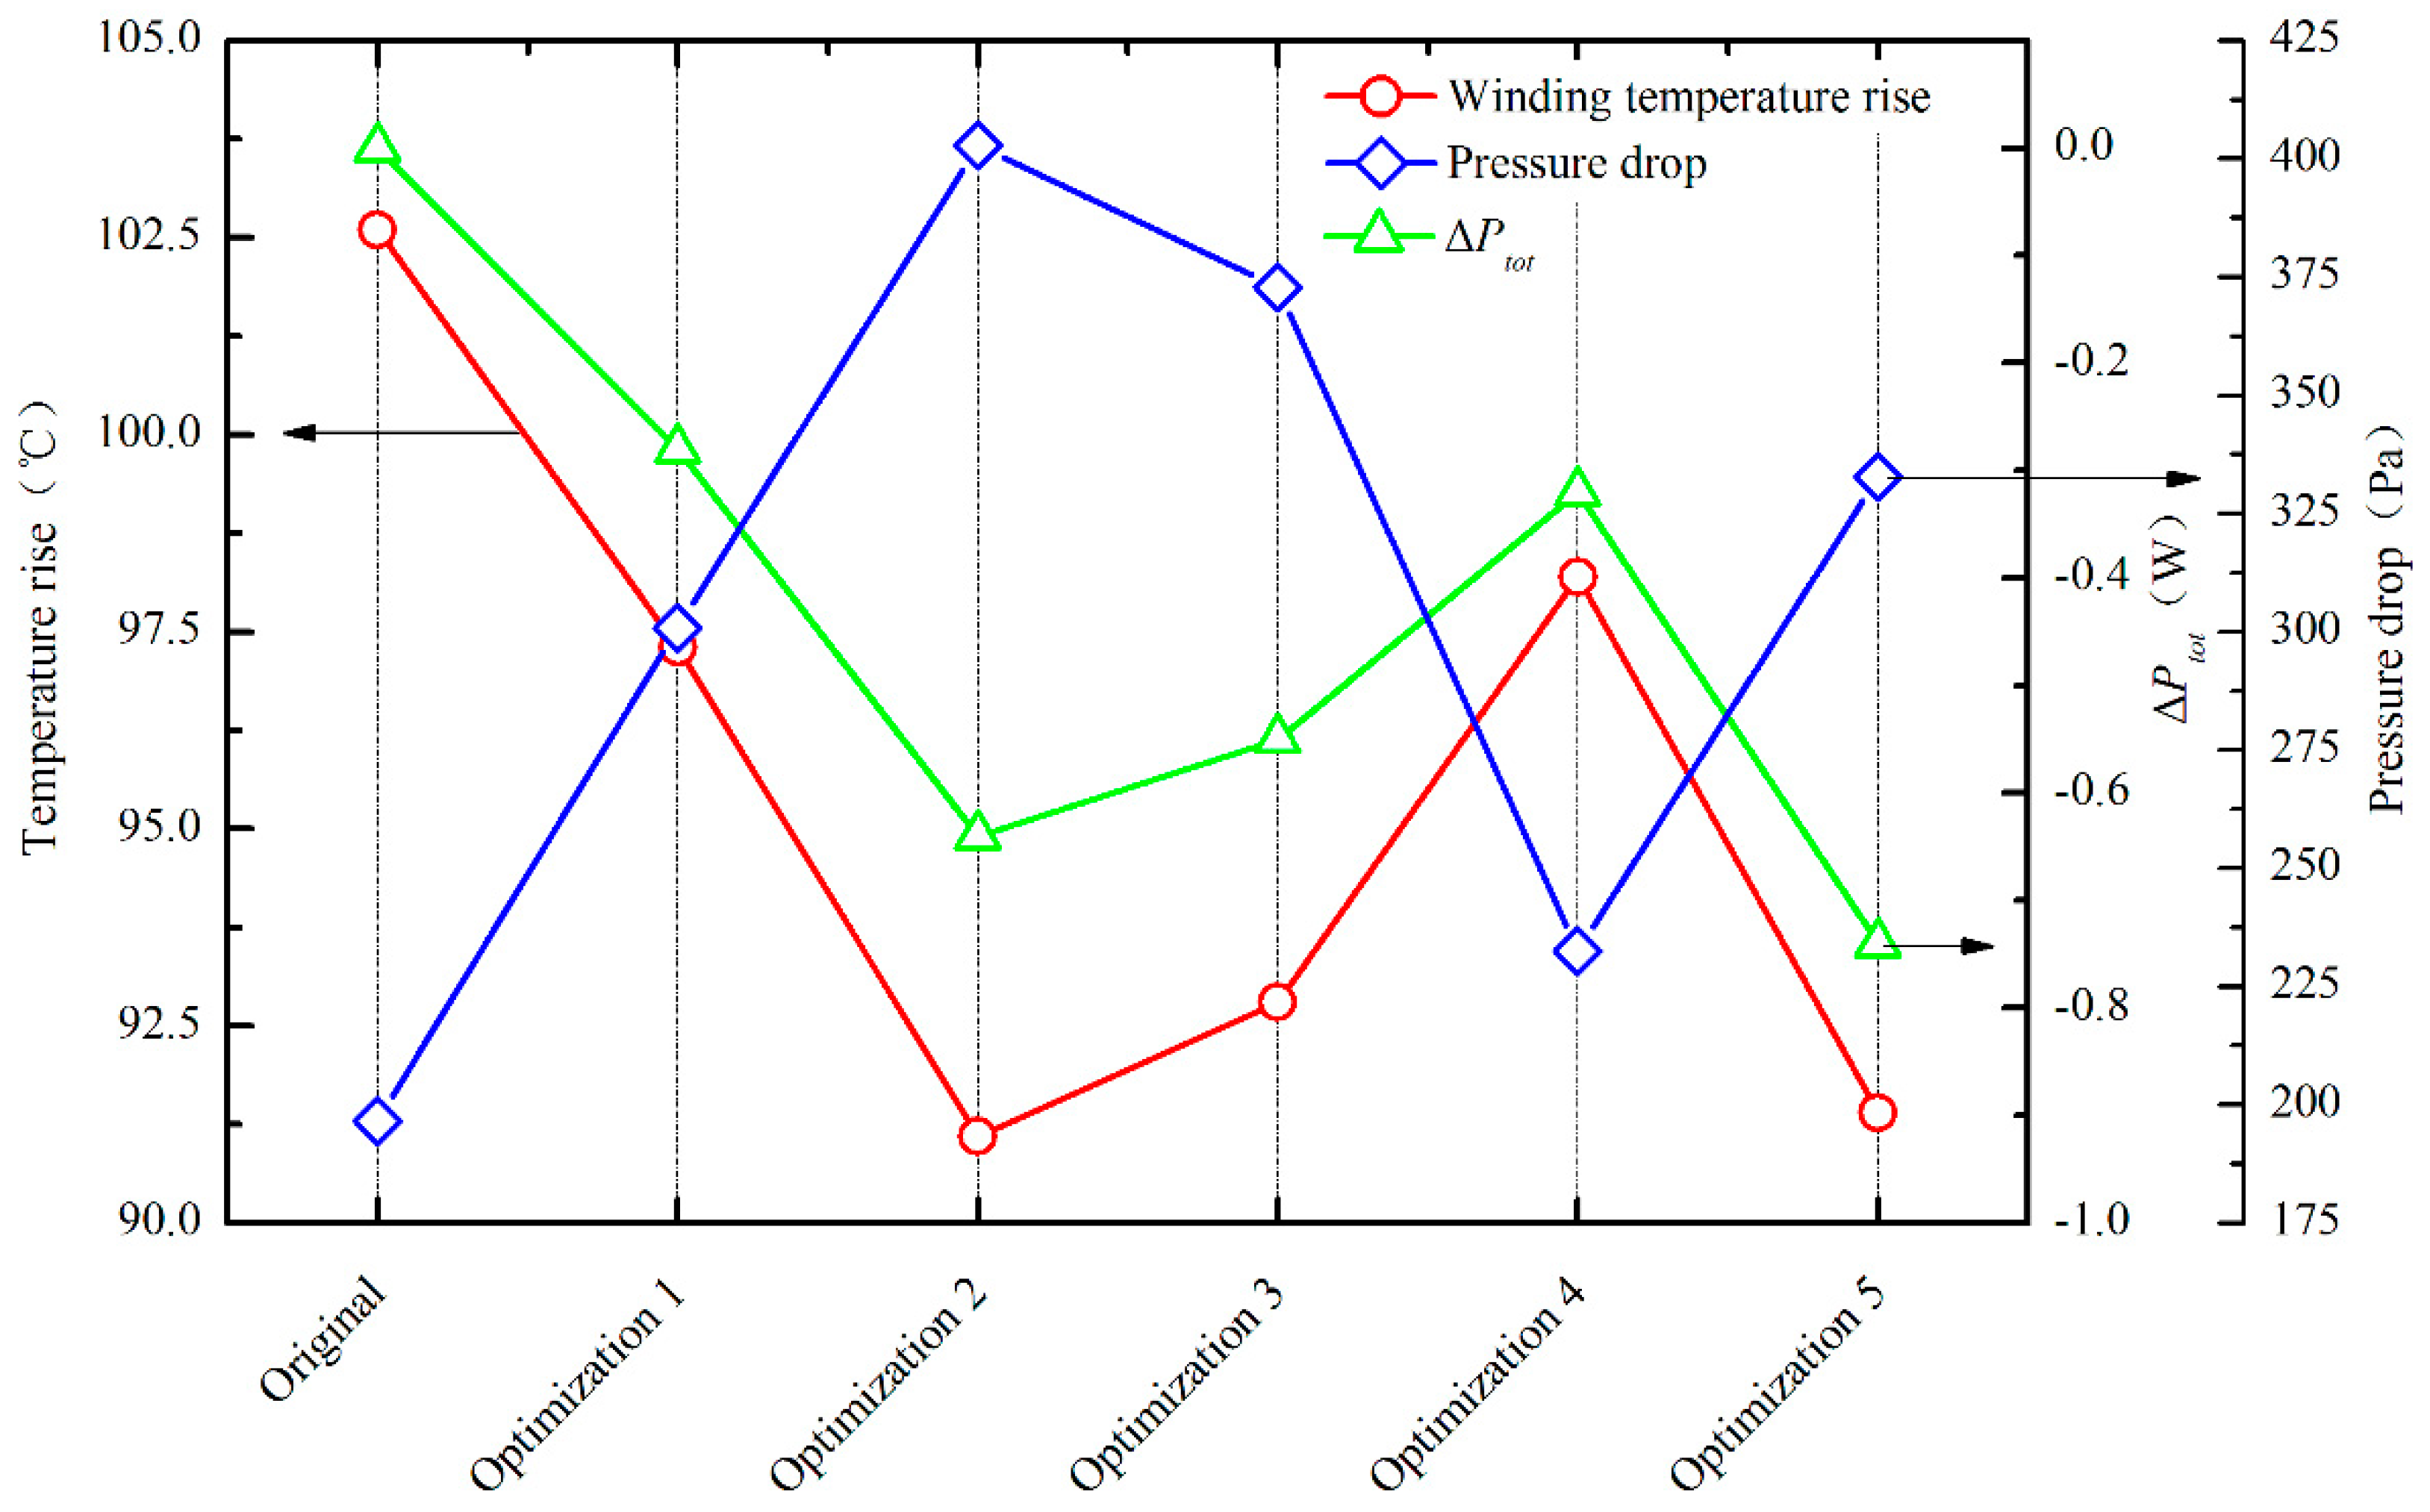
Table 7 and
Figure 7 show the simulation results of the maximum winding temperature, cooling air pressure drop, and Δ
Ptot for different ventilation spacer schemes.
It can be seen from
Table 7 and
Figure 7 that the maximum temperature of the windings of the five ventilation spacer structures is lower than the original design, and the cooling air pressure drop is higher than the original design. Judging from Δ
Ptot, the overall performance ranking of the five ventilation spacer structures is as follows: preferred scheme 5 → preferred scheme 2 → preferred scheme 3 → preferred scheme 4 → preferred scheme 1. However, considering that the ventilation spacer also bears the axial pressure of the stator core, it needs to have good strength, and the design of the scheme 5 cannot meet the requirements in terms of strength. In addition, the ventilation spacer is mostly spot-welded to the iron core stack of the air passage, and the width of the ventilation spacer of the preferred schemes 2 and 3 is too narrow—which is difficult to weld—and the parallel installation process of the two ventilation spacer steels is not well controlled. The ventilation spacer structure of the preferred scheme 4 is too complicated, is not easy to be processed by batch processing, and is likely to cause blockage of the internal passage of the ventilation spacer when the stator is immersed. Therefore, the ventilation spacer structure of the preferred embodiment 1 can be used as the final preferred solution for further optimization and experimental verification.
3. Test Bench to Verify the Optimized Ventilation Spacer
In order to verify the final optimization scheme of the ventilation spacer structure, a simulation bench for the generator cooling design was designed and built, as shown in
Figure 8. The test bench mainly composed of a small flow wind tunnel, a tested die card composed of core segments, ventilation spacer, windings, and windings’ insulation as shown in
Figure 8. Since only fractions of the generator are selected to be tested, the resistance of the windings is very small, which leads to a low voltage on the winding terminals. There was no suitable AC power supply to provide the large current (400 A) and low voltage (mW-class), thus, during test process, the DC power supply was selected to feed the windings. The current was set to make the windings—fed on DC power supply—generate the same loss as was fed on AC power supply. Besides, the AC power supply can get rid of the influences of the windings’ inductance, so we could also simulate the influences of the windings’ resistance increase, caused by the increase of the windings’ temperature, on the thermal distribution. Twelve temperature probes were set in the 4 slots, each slot had 3 temperature probes, one in slot bottom, one in middle part of the slot, between the two winding layers, and one in the slot opening. The windings were simplified from distributed windings to concentrated windings. The simplifying process has little influence on the thermal distributions. The four sets of cores formed three rows of radial ventilation ducts, wherein the nine radial ventilation ducts in the dotted line frame in
Figure 8a, were used for placing the ventilation spacer, while the remaining radial ventilation ducts were only used to place the metal parts to connect the adjacent cores, these ventilation ducts are dependent from the test ventilation ducts. The innovative design has advantages such as simple structure, repeatable replacement of the ventilation spacer, and low construction cost. After the peripheral casing was installed, it constituted the cooling circuit with cooling air going into the module from the two side passages and coming out from the central passage, which simulated the actual cooling circuit of the real wind generator, as shown in
Figure 8b.
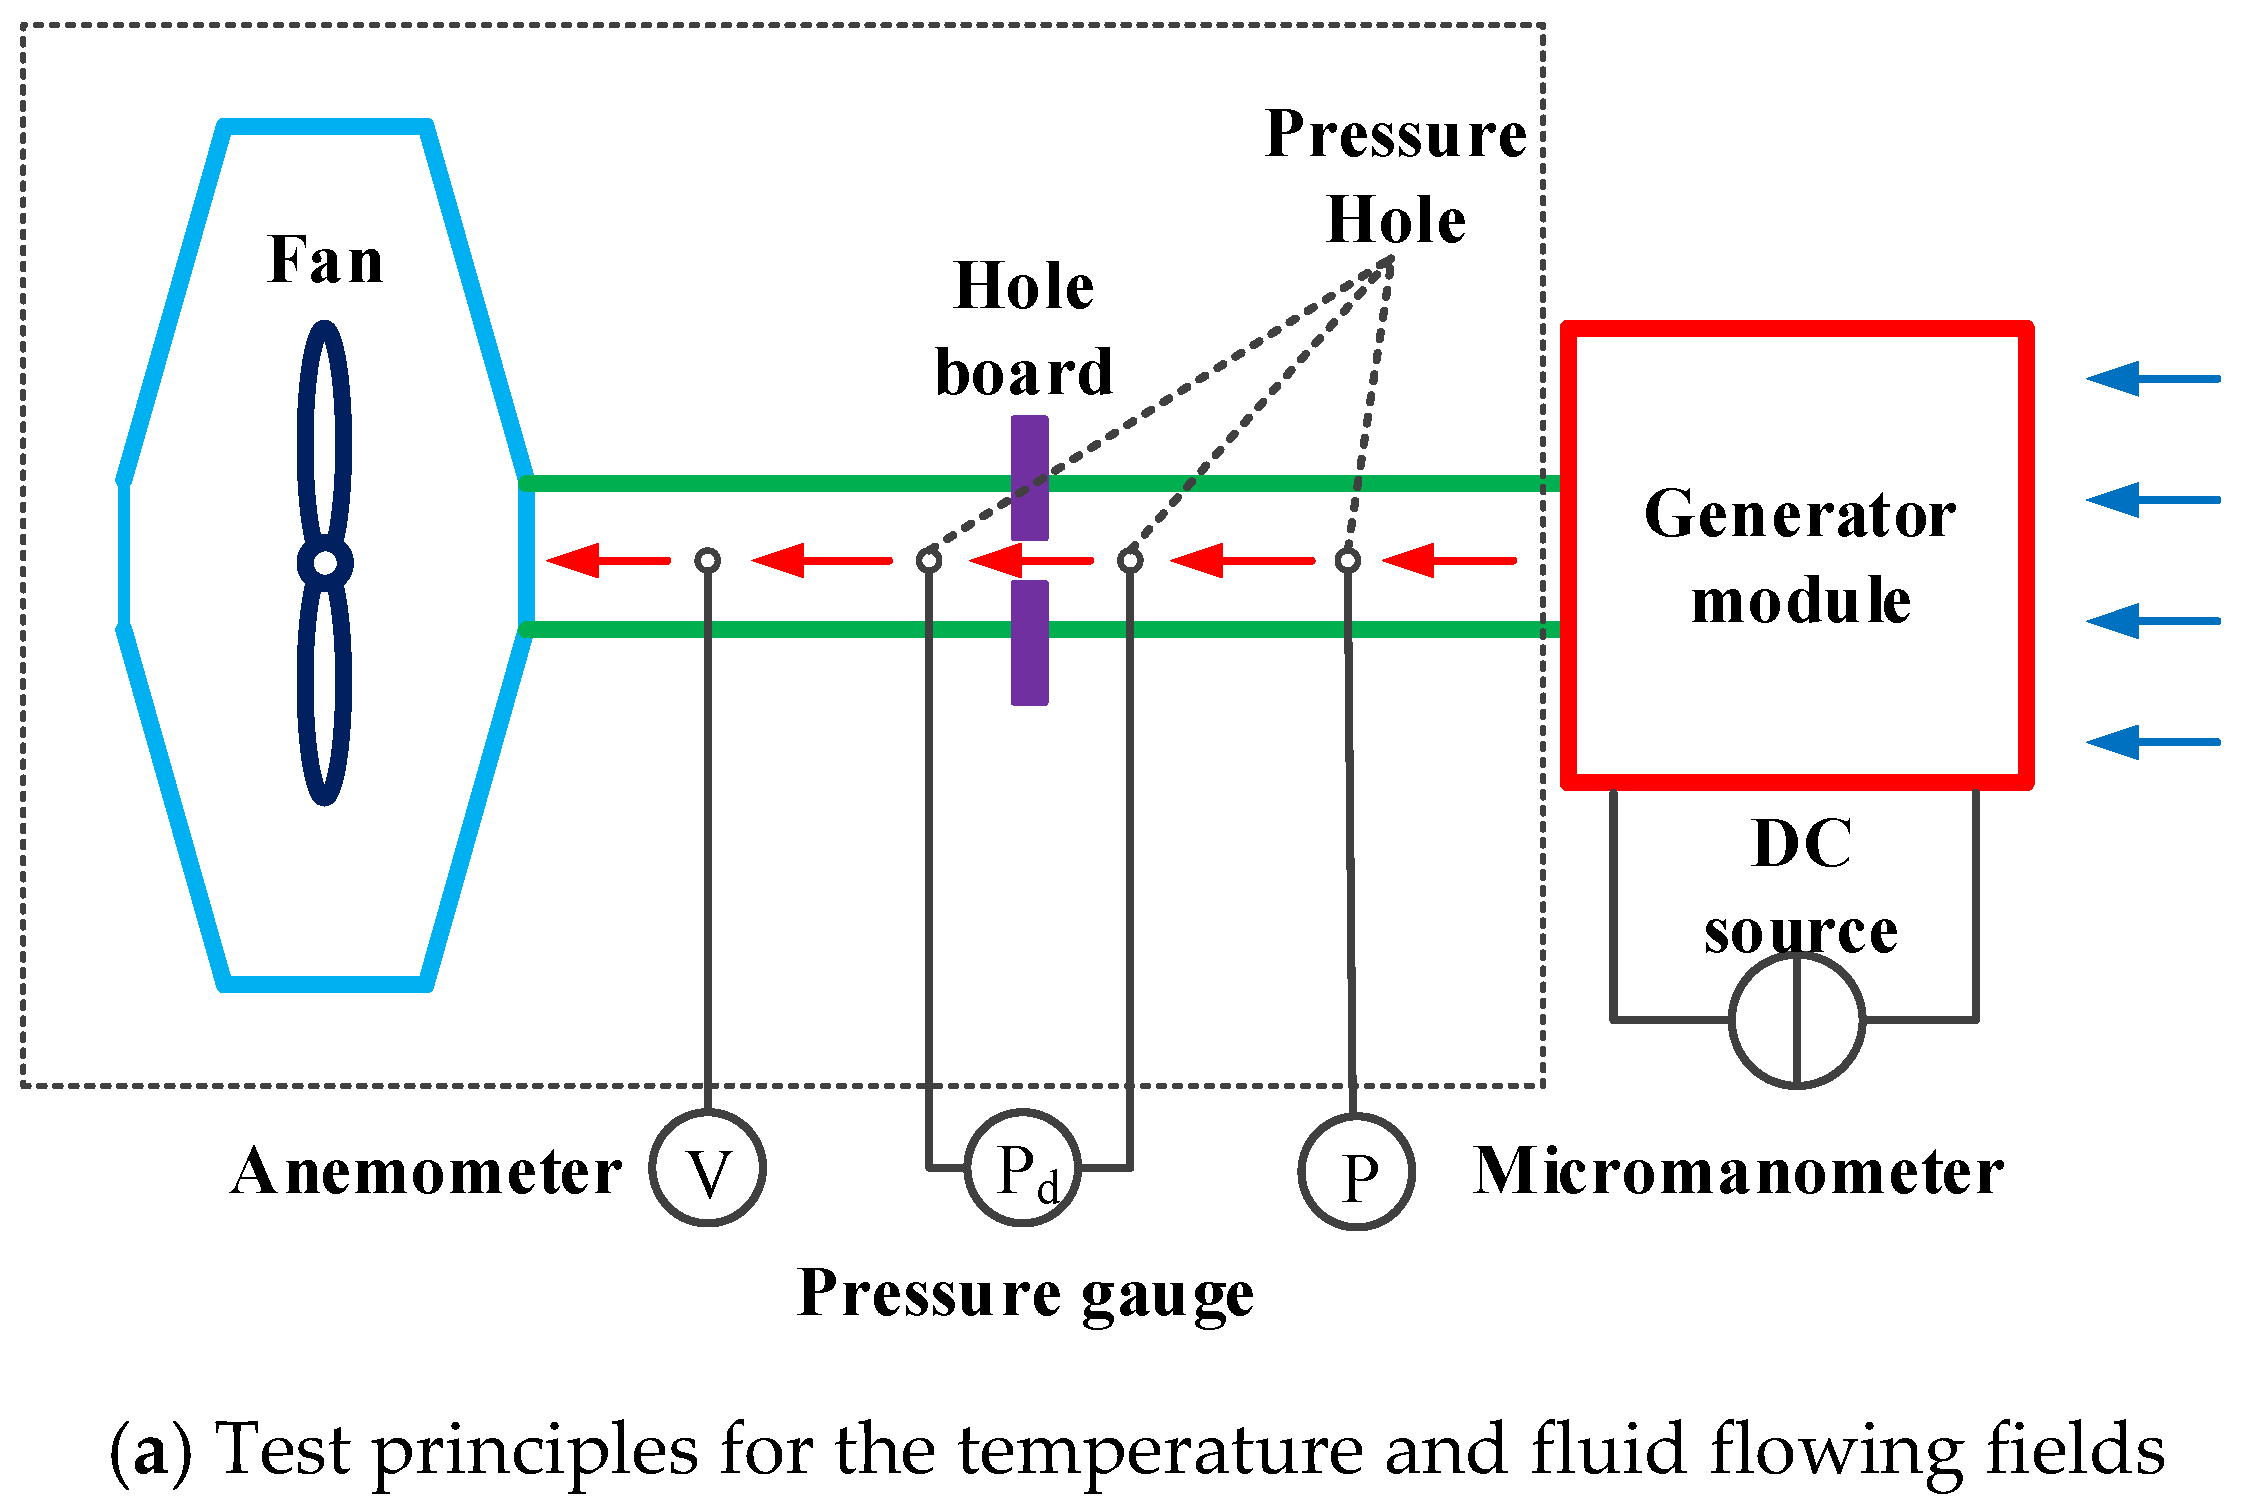
The test principles and built test bench is as shown in
Figure 9. The actual heat transfer processing of the generator is described as follows: Firstly, a fan is used to evacuate the air in the stator yoke back area, so this area will be a negative pressure area as the fan operates, the cooling air will come into the generator module by through the wind tube, as shown in
Figure 9a. A hole board is set in the wind tube to get the pressure drop, the pressure difference Δ
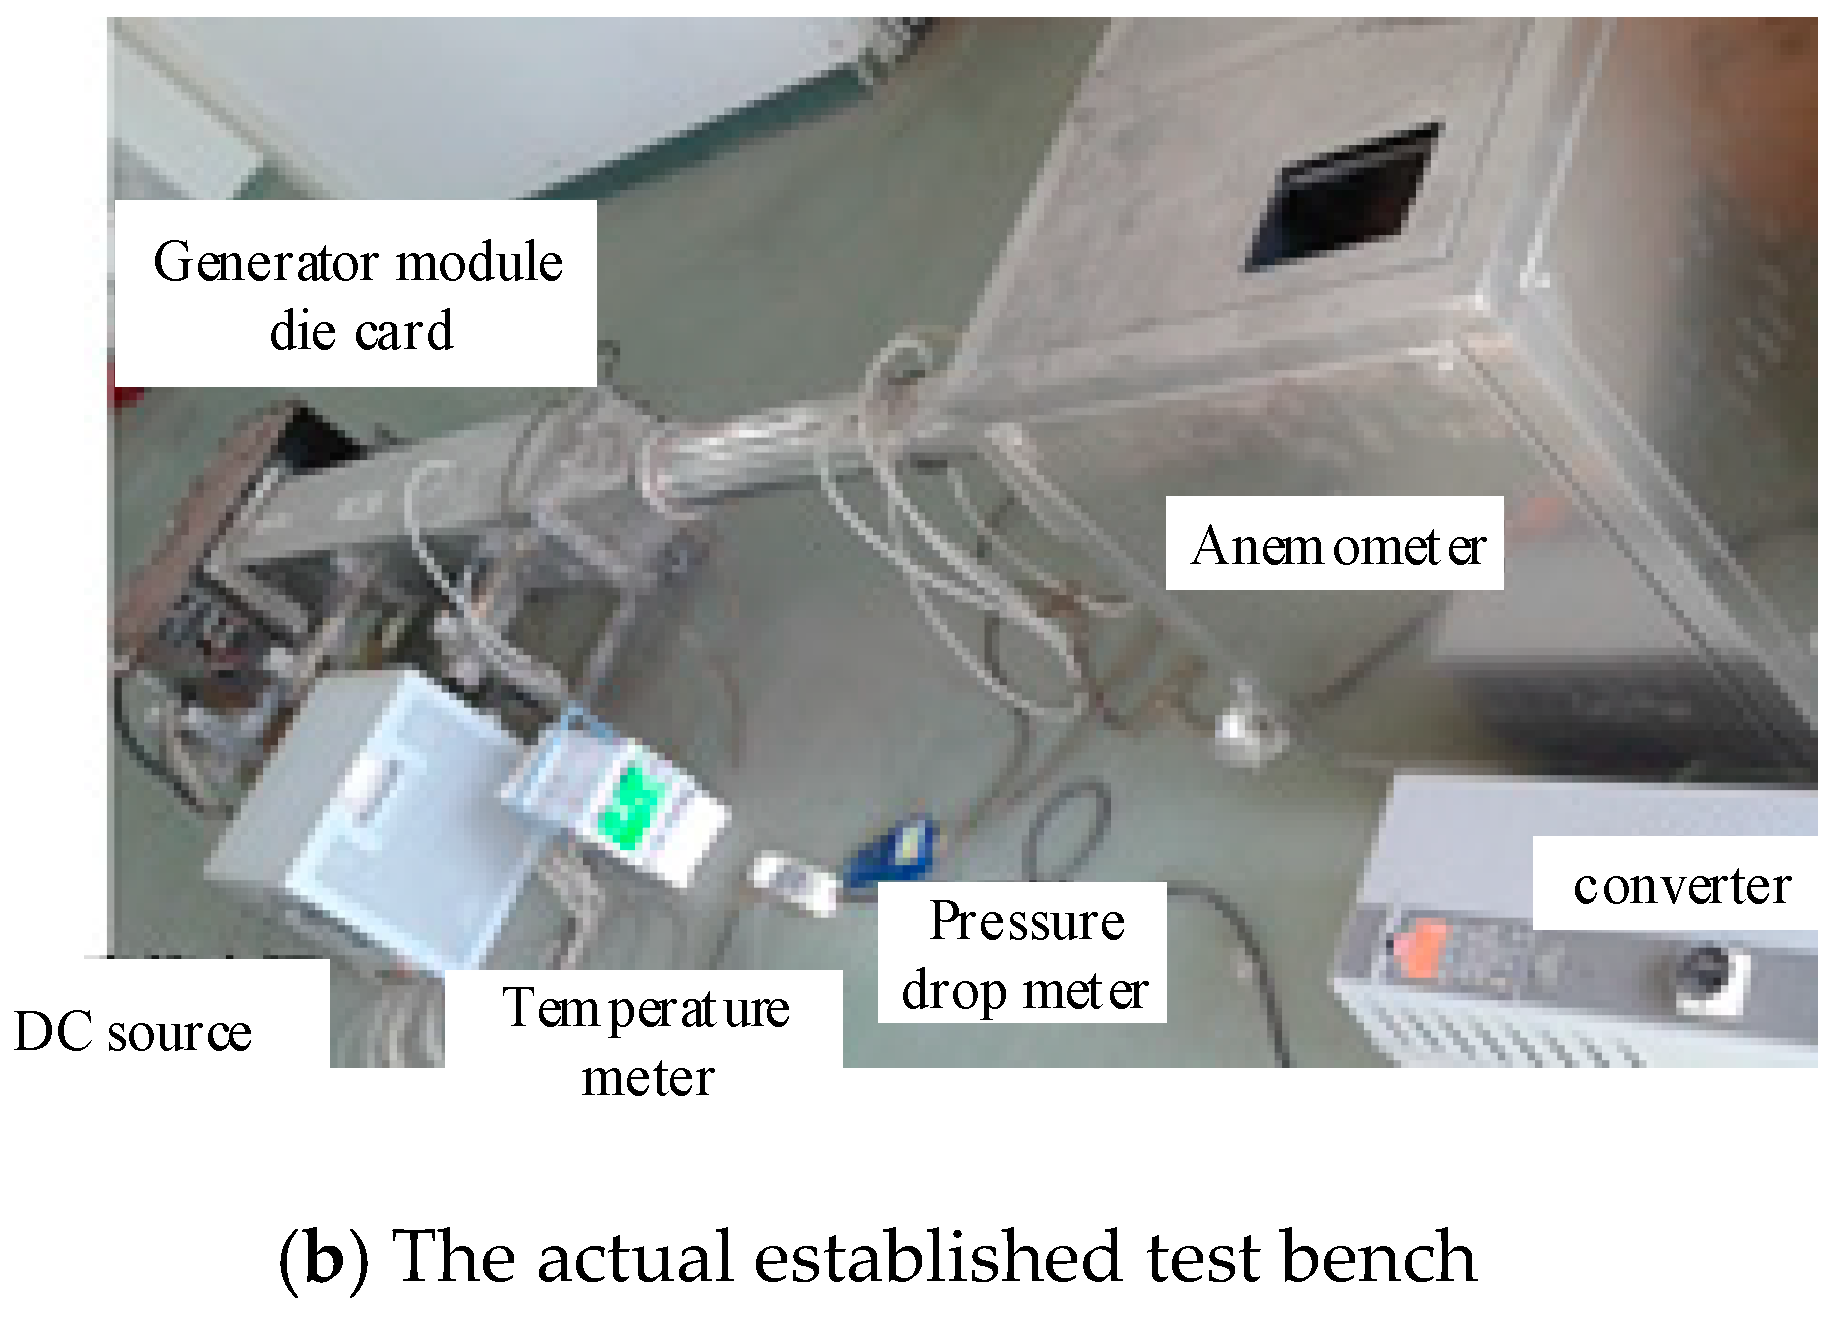
P is determined by the orifice flowmeter located on both sides of the hole board, and the flow coefficient of the orifice plate and the wind speed is measured by using the anemometer. So, the air volume going into the generator can be calculated using the pressure drop, wind speed, and orifice flow coefficient. The micro-pressure gauge close to the test model is used to measure the outlet static pressure value. The pressure difference between the static pressure value and the atmosphere is the ventilation pressure drop of the model. The temperature of the windings is measured by a temperature measuring element embedded in the interior of the model. The actual cooling system test bench is built as shown in
Figure 9b.
4. Comparisons of the Numerical Calculation Results and Experimental Results
In order to verify the actual cooling effect of the optimal ventilation duct steel structure, the original design scheme and optimal scheme of the ventilation spacer structure were tested, as shown in
Table 8. The test principles are set as follows: 1. Keep the input current 400 A and the fan operating frequency as constants; 2. replace the different ventilation spacers to measure the winding temperature in the generator module. Based on the test principles above, while the input current and fan operating frequency are constants, the influences of the ventilation spacer on the windings’ temperature can be determined by measuring the temperature of the windings and the pressure drop of the ventilation air. While the input current is kept as constant, the resistance of the windings increases as the winding temperature increases. As a consequence, the DC voltage also increases, therefore the loss increases simultaneously. By this way, we can simulate the increase of windings’ temperature resulting loss of windings’ loss, during the actual generator operation process. In addition, if the operation frequency of the fan is kept constant, the different ventilation spacer can result in different fluid resistance—a large fluid resistance can lead to a small air volume. By this way, we can simulate the influences of ventilation spacers on the air volume, which can also result in the changes of the windings’ temperature. Based on the analyses above, the criterion to judge the ventilation spacer is simplified, and we can use the temperature rise of the generator windings to judge the ventilation effect of the ventilation spacer.
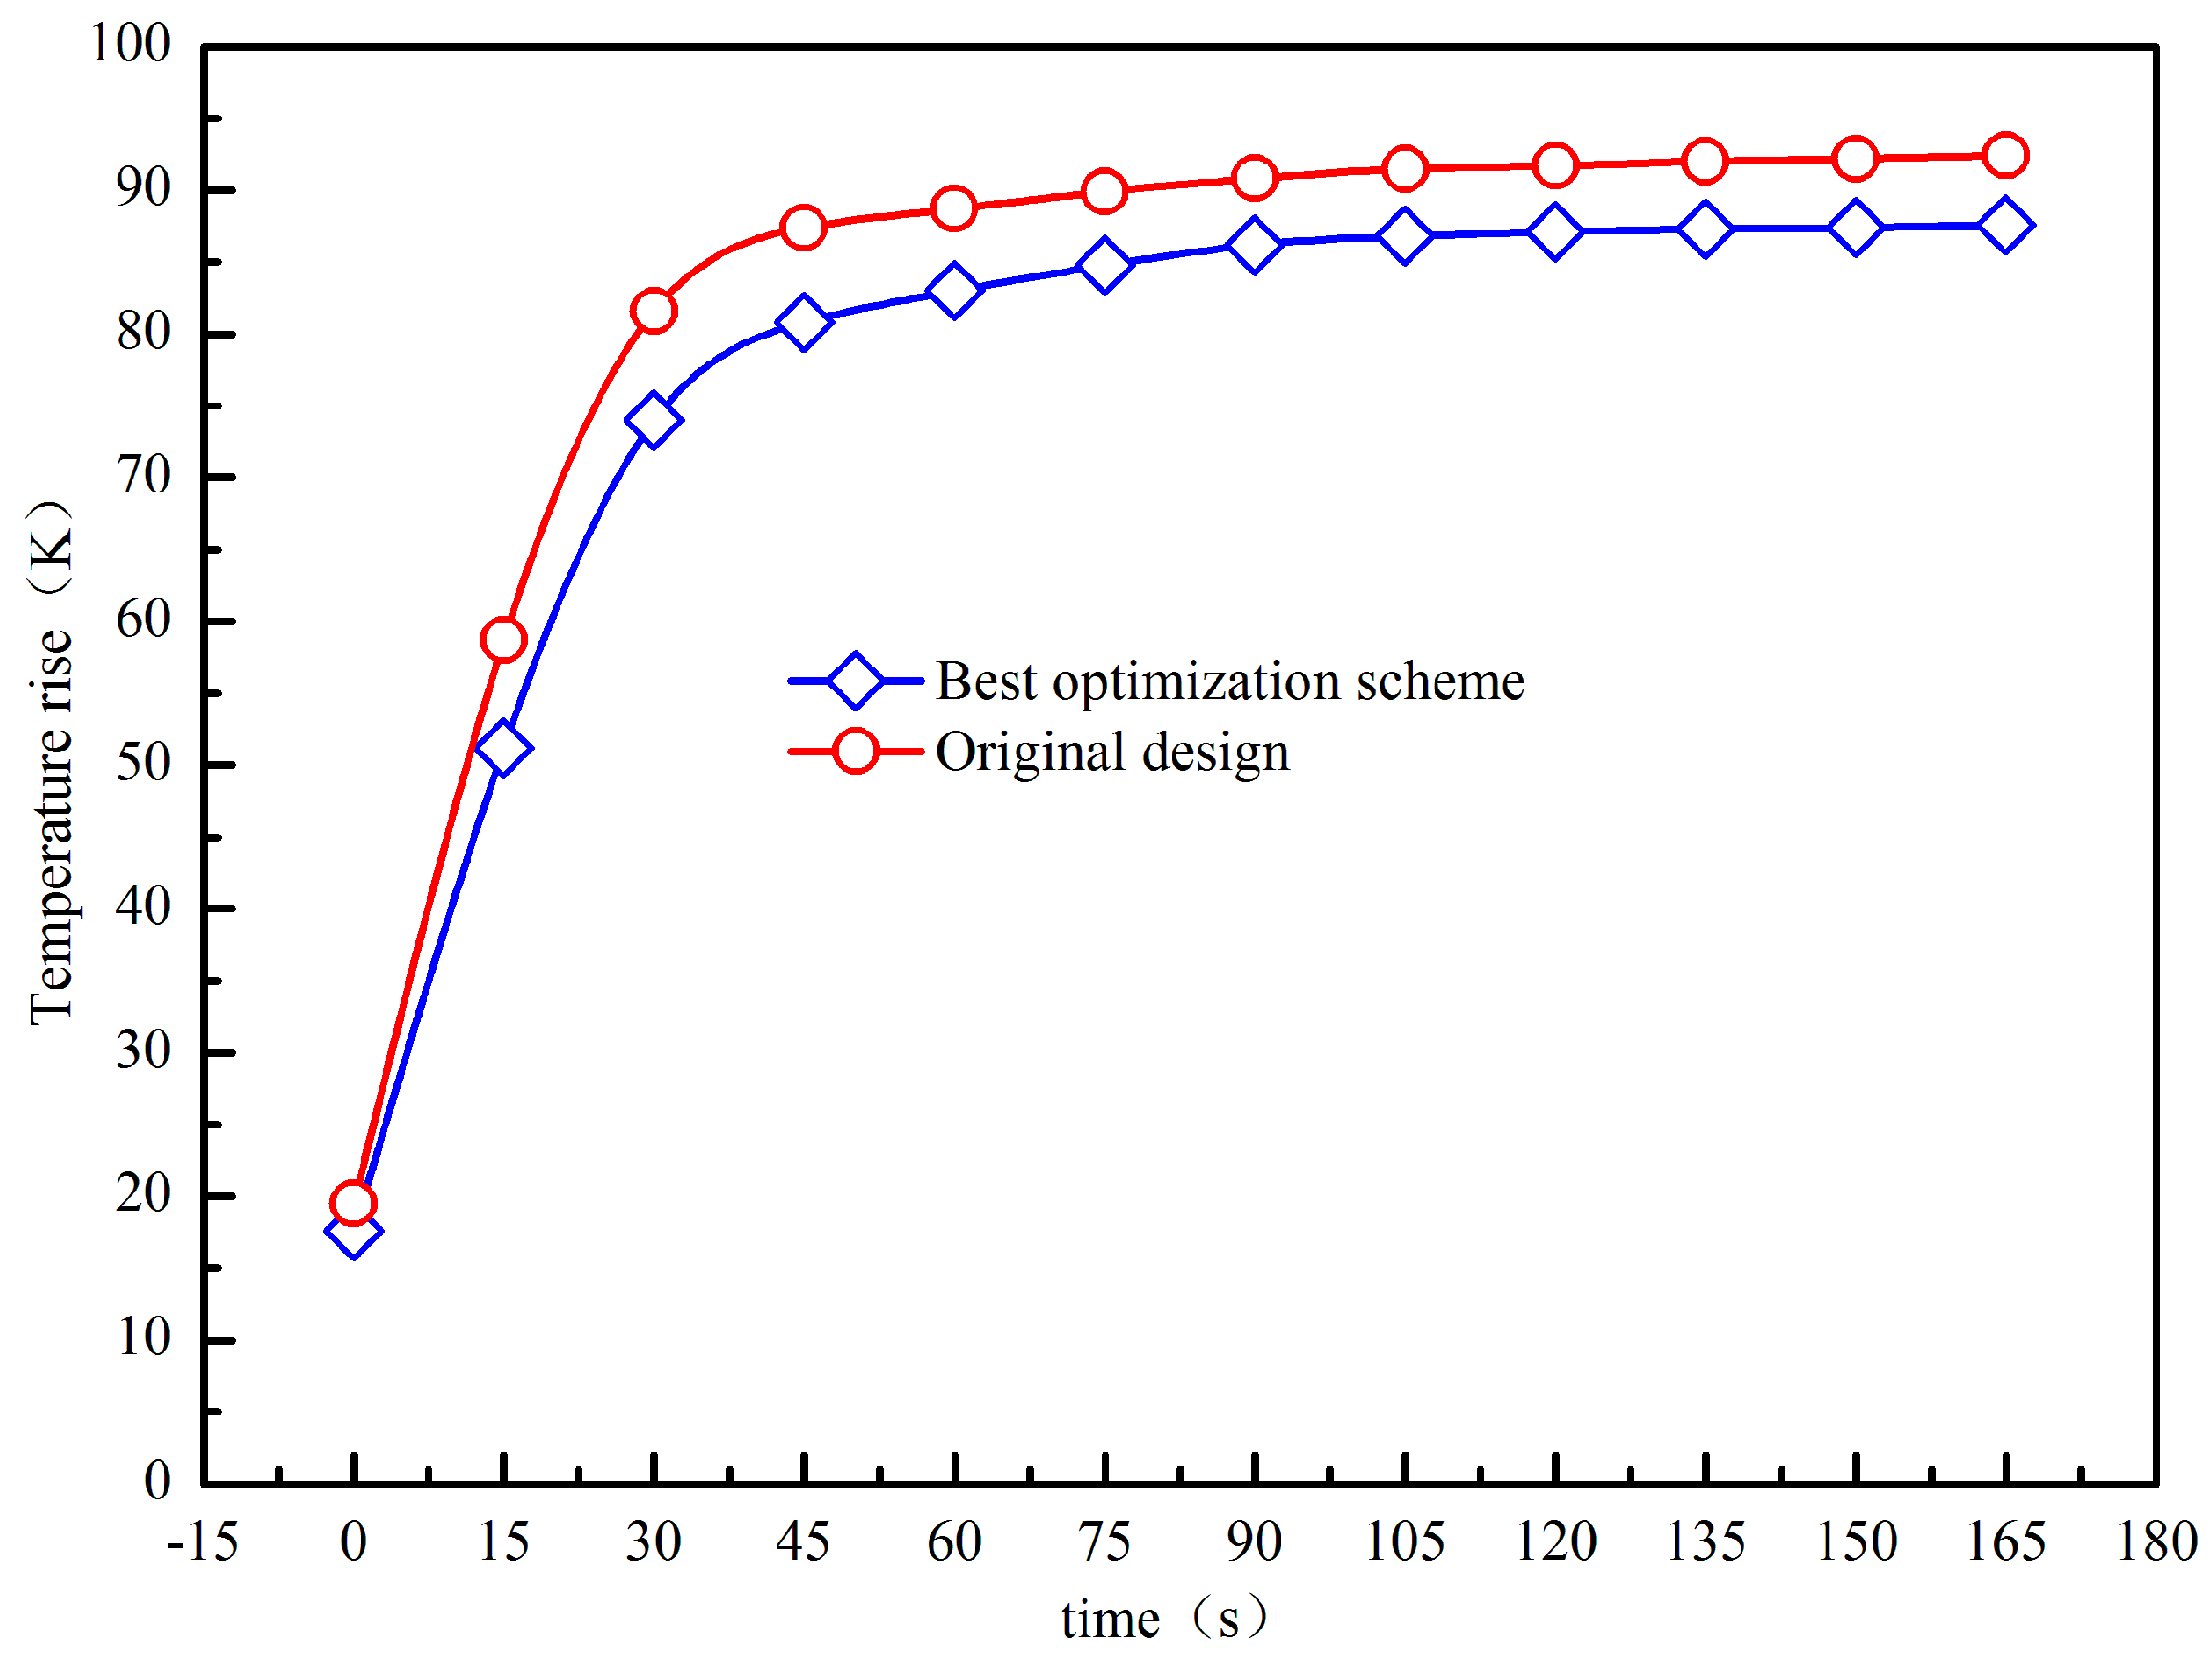
During the test process, the winding temperature rises of the generator using original ventilation spacer and best scheme ventilation spacer are recorded, and when the temperature difference between adjacent two test points are within 0.1 K, the test is finished. The temperature rises of the generator using the original scheme and best scheme ventilation spacer are drawn as shown in
Figure 10, and the test data after the winding temperature rise is stable is shown in
Table 9.
It can be observed from
Figure 10 and
Table 9 that the maximum temperature of the tested die card winding of the optimal ventilation duct structure is 4.7 K lower than the original design. However, considering that the ambient temperature of the two ventilation spacer schemes is slightly different, the maximum temperature of the tested mode card winding of the optimal ventilation duct is converted here, and the conversion is based on Equation (14):
where ∆
T is the winding temperature rise,
Tar is ambient temperature,
I is the winding current, the subscript
r represents the converted value, and the subscript
t represents the test value.
Through Equation (14), the maximum temperature of the winding in the test card test process of the optimal ventilation duct steel is converted to the maximum temperature of the winding corresponding to the original design scheme test environment temperature, which is 110.4 °C. The maximum temperature of the tested die card winding of the optimal ventilation duct steel structure is 3.9 K lower than the original design.
5. Conclusions
Radial ventilation cooling is one of the important cooling methods for air-cooled generators, and ventilation duct steel is an important component of radial ventilation type generators. Different ventilation spacer structures have a great influence on the flow of cooling gas in the air passage of the generator, which in turn determines the cooling performance of the generator. Based on an MW permanent magnet wind generator, this paper combines numerical simulation and experimental methods to optimize the ventilation spacer structure. A total of 63 ventilation spacer structures including the original design scheme were simulated. By comparing the winding temperature rise and cooling air pressure drop corresponding to different ventilation spacers, five ventilation spacer optimization schemes were selected as alternatives. Based on the consideration of the processability and mechanical strength of the ventilation spacer manufacturing and assembly, the preferred scheme 1 pagoda-type ventilation spacer is finally selected as the final preferred solution. In order to verify the actual effect of optimizing the spacer steel, the generator cooling experiment platform was built, and the original design scheme and the final cooling scheme of the generator ventilation test under the ventilation system design were realized on the experimental platform. The test results show that in the final optimization scheme, the ventilation spacer can effectively reduce the temperature rise of the generator die by 3.9 K. The motor die design and ventilation spacer design in the test bench are highly innovative and have great engineering practical significance for optimization of generator cooling systems.


