Study of Sensitive Parameters on the Sensor Performance of a Compression-Type Piezoelectric Accelerometer Based on the Meta-Model


Abstract
1. Introduction
2. Materials and Methods
3. Results
4. Conclusions
Author Contributions
Funding
Conflicts of Interest
References
- Serridge, M.; Licht, T.R. Piezoelectric Accelerometer and Vibration Preamplifiers. In Theory and Application Handbook; Brüel & Kjær: Nærum, Denmark, 1987. [Google Scholar]
- Gautschi, G. Piezoelectric Sensorics: Force, Strain, Pressure, Acceleration and Acoustic Emission Sensors, Materials and Amplifiers; Springer: Berlin, Germany, 2002. [Google Scholar]
- Yuan, Y.; Chow, K.S.; Du, H.; Wang, P.; Zhang, M.; Yu, S.; Liu, B. A ZnO thin-film driven microcantilever for nanoscale actuation and sensing. Int. J. Smart Nano Mater. 2013, 4, 128–141. [Google Scholar] [CrossRef]
- Koka, A.; Sodano, H.A. High-sensitivity accelerometer composed of ultra-long vertically aligned barium titanate nanowire arrays. Nat. Commun. 2013, 4, 2682. [Google Scholar] [CrossRef] [PubMed]
- Rong, Q.; Qiao, X.; Guo, T.; Bao, W.; Su, D.; Yang, H. Orientation-dependent fiber-optic accelerometer based on grating inscription over fiber cladding. Opt. Lett. 2014, 39, 6616–6619. [Google Scholar] [CrossRef] [PubMed]
- Wang, J.; Peng, G.; Hu, Z.; Yang, H.; Hu, Y. Design and analysis of a high sensitivity FBG accelerometer based on local strain amplification. IEEE Sens. J. 2015, 15, 5442–5449. [Google Scholar] [CrossRef]
- Lu, Q.; Bai, J.; Wang, K.; He, S. Design, optimization, and realization of a high-performance MOEMS accelerometer from a double-device-layer SOI wafer. J. Microelectromech. Syst. 2017, 26, 859–869. [Google Scholar] [CrossRef]
- Rong, Q.; Guo, T.; Bao, W.; Shao, Z.; Peng, G.D.; Qiao, X. Highly sensitive fiber-optic accelerometer by grating inscription in specific core dip fiber. Sci. Rep. 2017, 7, 11856. [Google Scholar] [CrossRef]
- Allik, H.; Hughes, T.J.R. Finite element method for piezoelectric vibration. Int. J. Numer. Methods Eng. 1970, 2, 151–157. [Google Scholar] [CrossRef]
- Lerch, R. Finite element analysis of piezoelectric transducers. In IEEE 1988 Ultrasonics Symposium Proceedings; IEEE: Chicago, IL, USA, 1988; pp. 643–654. [Google Scholar]
- Kim, J.; Varadan, V.V.; Varadan, V.K. Finite element modelling of structures including piezoelectric active devices. Int. J. Numer. Methods Eng. 1997, 40, 817–832. [Google Scholar] [CrossRef]
- Dong, Z.; Yang, M. Optimal design of a double-vibrator ultrasonic motor using combination method of finite element method, sensitivity analysis and adaptive genetic algorithm. Sens. Actuators A 2017, 266, 1–8. [Google Scholar] [CrossRef]
- Kim, J.; Varadan, V.V.; Varadan, V.K.; Bao, X.Q. Finite-element modeling of a smart cantilever plate and comparison with experiments. Smart Mater. Struct. 1996, 5, 165–170. [Google Scholar] [CrossRef]
- Kumar, V. Optimization and modelling of process parameters involved in ultrasonic machining of glass using design of experiments and regression approach. Am. J. Mater. Eng. Technol. 2013, 1, 13–18. [Google Scholar]
- Kumar, J.P.N.; Kumar, S.J.; Jeyathilak, R.K.S.; Venkatesh, M.; Christopher, A.S.; Ganesh, K.C. Effect of design parameters on the static mechanical behavior of metal bellows using design of experiment and finite element analysis. Int. J. Interact. Des. Manuf. 2017, 11, 535–545. [Google Scholar] [CrossRef]
- Huang, D.; Allen, T.T.; Notz, W.I.; Zeng, N. Global optimization of stochastic black-box systems via sequential Kriging meta-models. J. Global Optim. 2006, 34, 441–466. [Google Scholar] [CrossRef]
- Ross, P. Taguchi Techniques for Quality Engineering; McGraw-Hill: New York, NY, USA, 1996. [Google Scholar]
- Montgomery, D.C. Design Analyses of Experiments, 3rd ed.; John Wiley & Sons: New York, NY, USA, 1997. [Google Scholar]


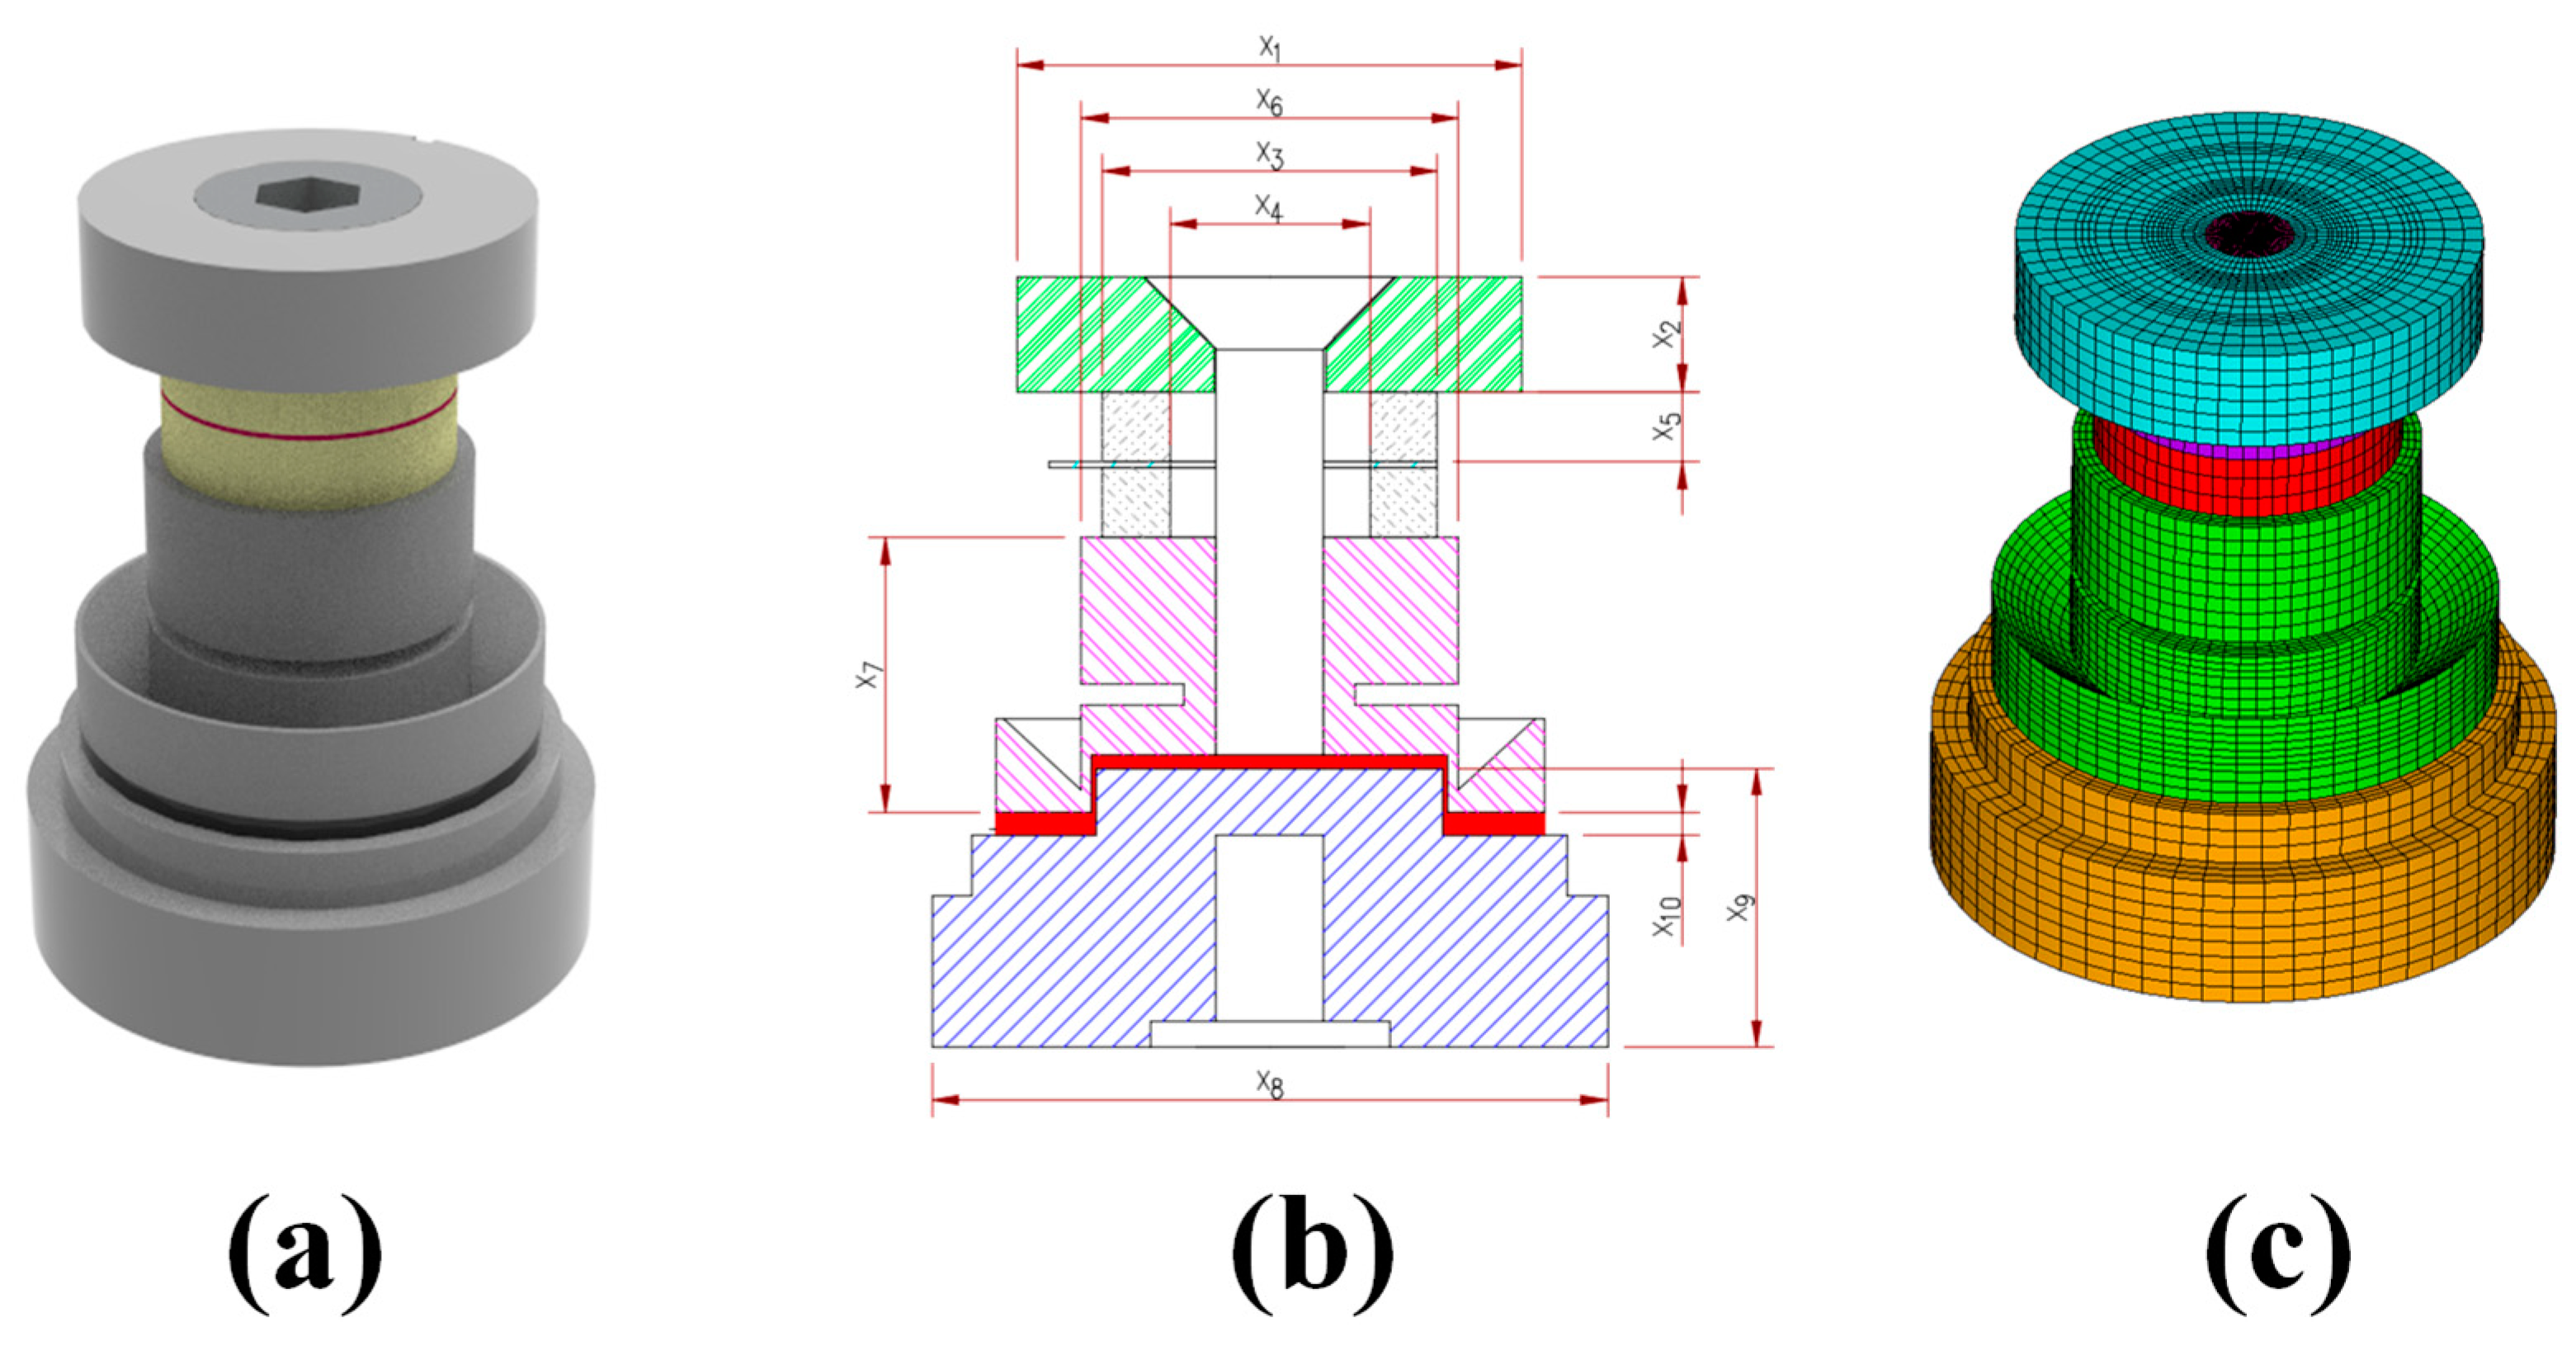
| Design Variables | Component | Dimension (mm) | Material Type | Density (kg m−3) | Young’s Modulus (GPa) | Poisson’s Ratio (-) |
|---|---|---|---|---|---|---|
| x1 | Head outer diameter (O.D.) | 19 | Tungsten | 17,900 | 385 | 0.2 |
| x2 | Head height | 4.3 | ||||
| x3 | Piezoelement outer diameter (O.D.) | 12.6 | Pb(Zr,Ti)O3 (PZT) | 7600 | - | 0.3 |
| x4 | Piezoelement inner diameter (I.D.) | 7.5 | ||||
| x5 | Piezoelement thickness | 2.65 | ||||
| x6 | Tail outer diameter (O.D.) | 14.2 | SS316L stainless steel | 7767 | 193 | 0.29 |
| x7 | Tail height | 10.3 | ||||
| x8 | Base outer diameter (O.D.) | 25.4 | SS316L stainless steel | 7767 | 193 | 0.29 |
| x9 | Base height | 10.5 | ||||
| x10 | Epoxy thickness | 0.8 | Epoxy | 950–2000 | 2.5–20 | 0.3–0.4 |
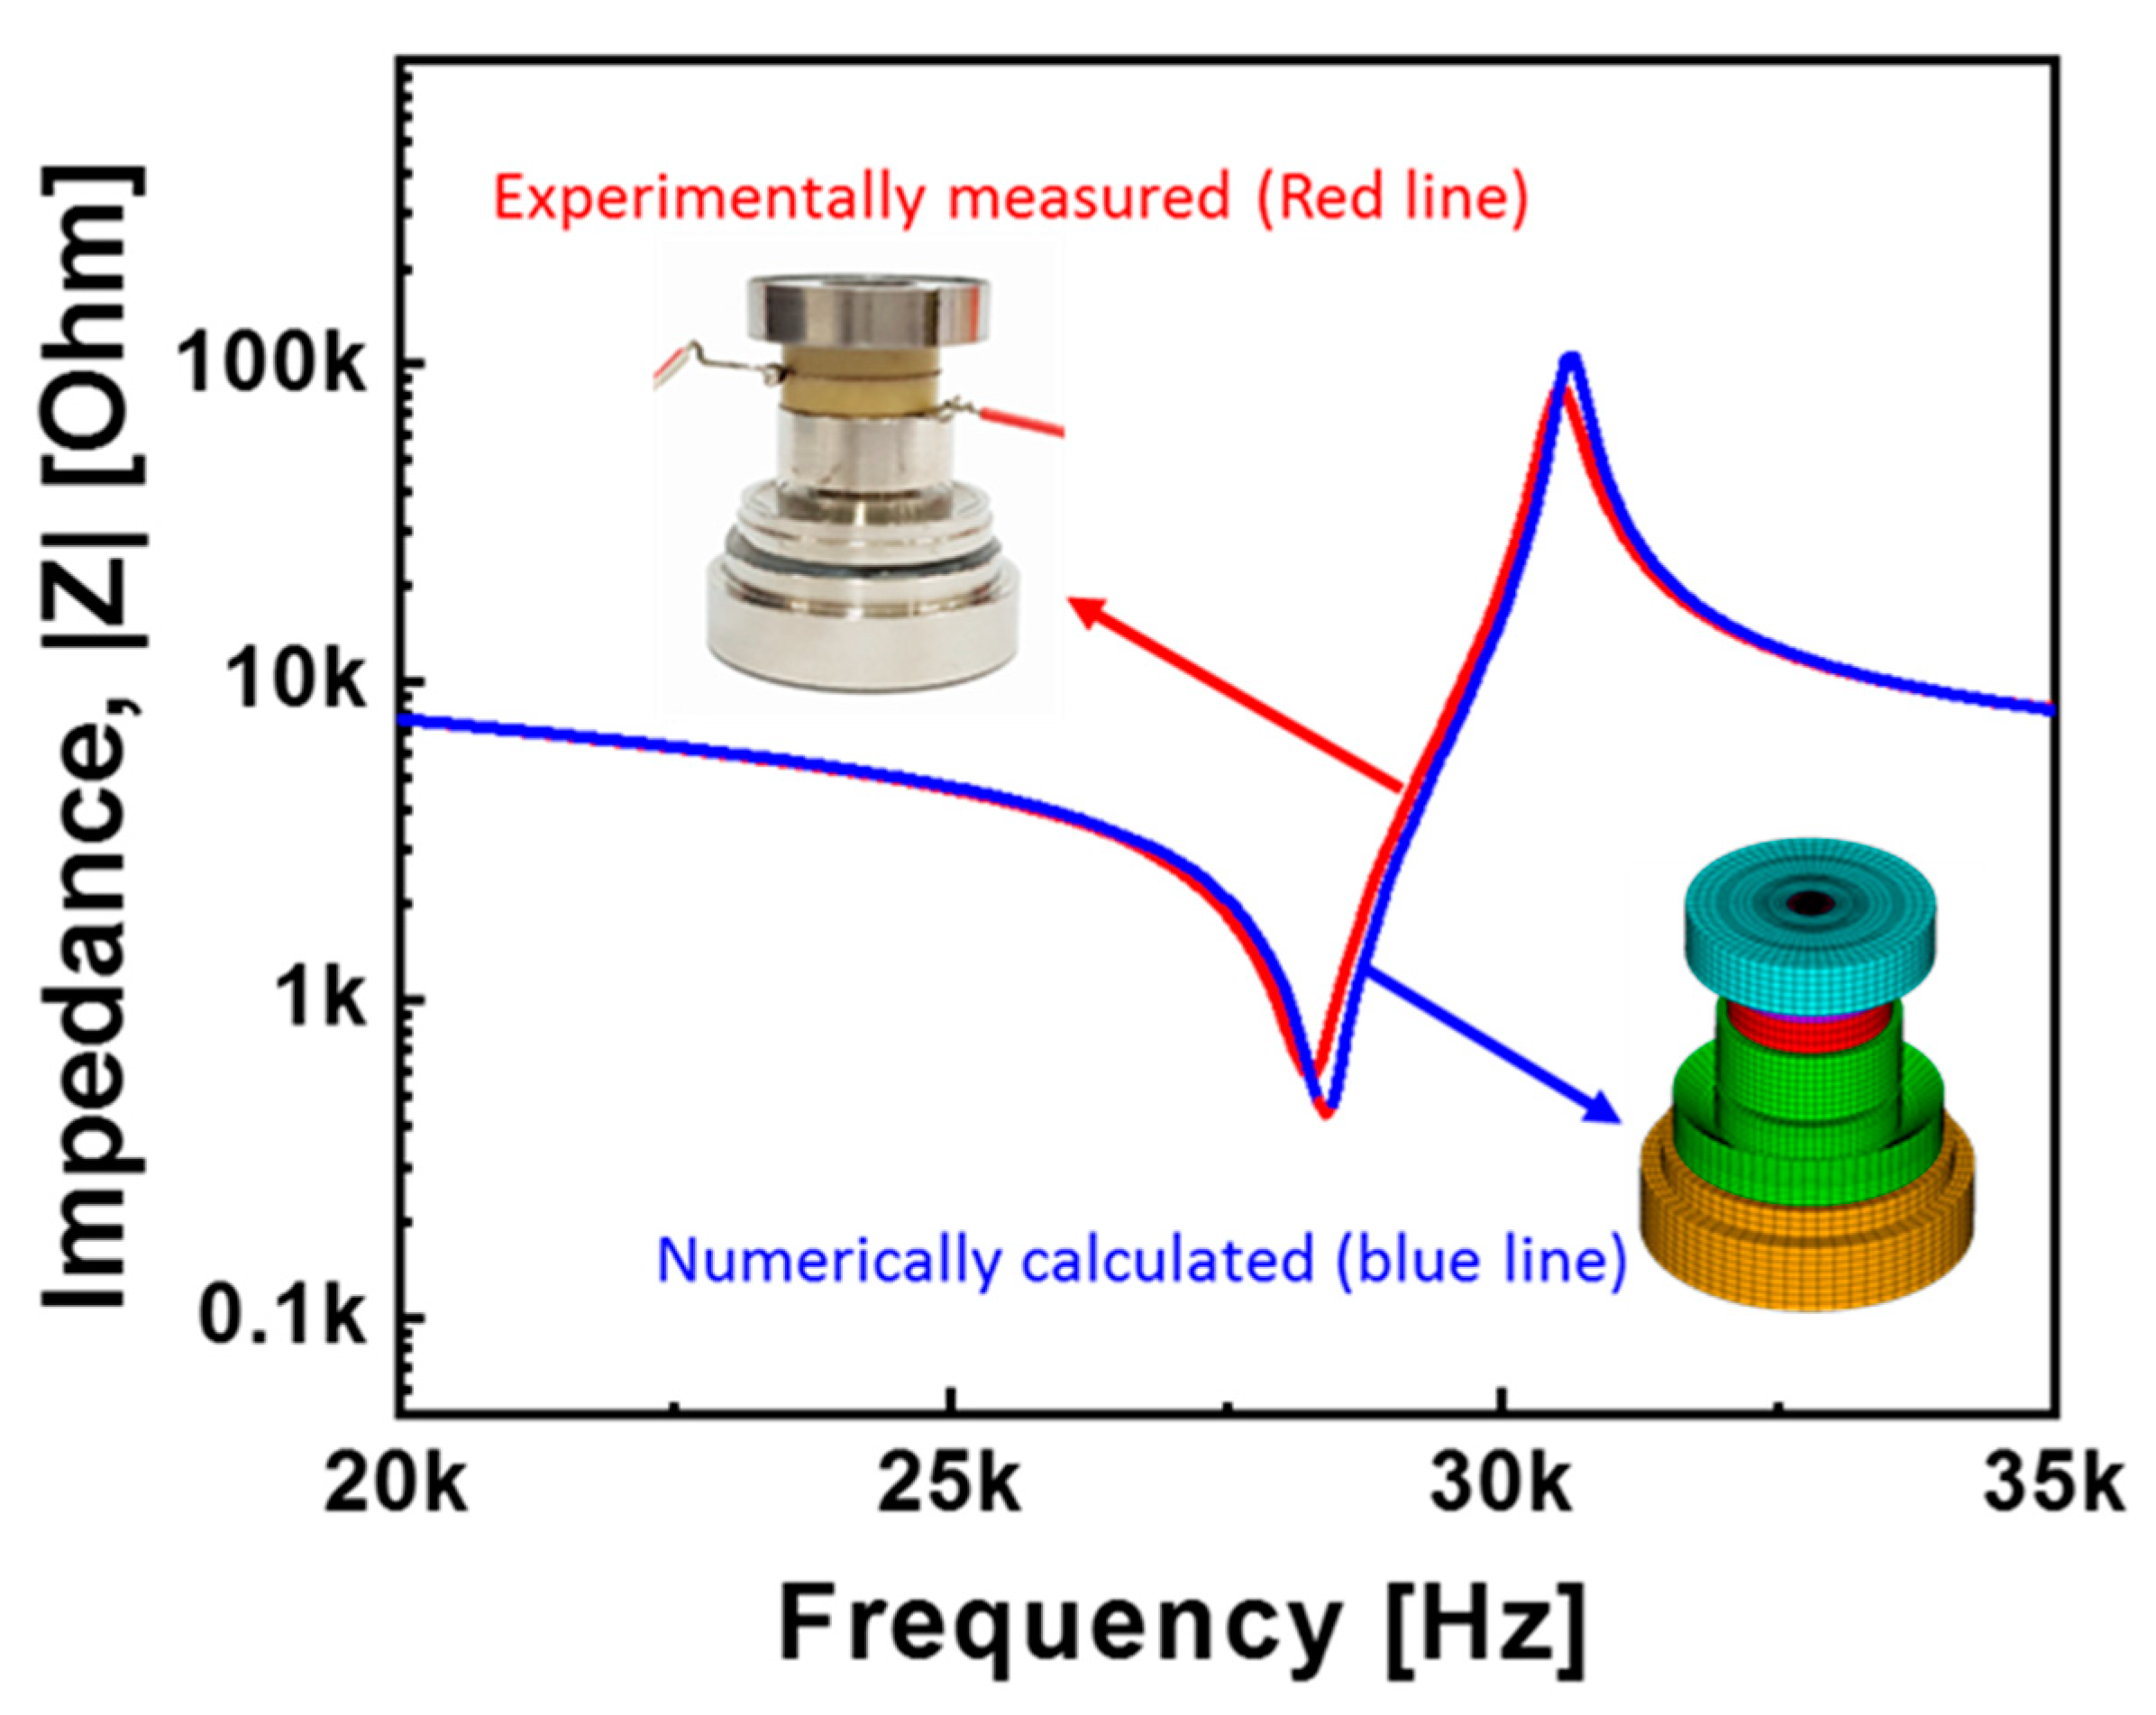
| Resonance Frequency fr (kHz) | Resonance Impedance |Zr| (Ω) | Anti-Resonance Frequency fa (kHz) | Anti-Resonance Impedance |Za| (Ω) | |
|---|---|---|---|---|
| Piezoelectric analysis | 28.7 | 440.8 | 30.6 | 105,950 |
| Experimental | 28.3 | 577.2 | 30.5 | 82,719 |
| Test Run | x1 (mm) | x2 (mm) | x3 (mm) | x4 (mm) | x5 (mm) | x6 (mm) | x7 (mm) | x8 (mm) | x9 (mm) | x10 (mm) | Resonance Frequency (kHz) | Electric Potential (V) |
|---|---|---|---|---|---|---|---|---|---|---|---|---|
| 1 | 23 | 2.3 | 13.2 | 6.5 | 3.65 | 13.2 | 11.3 | 24.4 | 11.5 | 0.6 | 24.7 | 0.161 |
| 2 | 15 | 6.3 | 13.2 | 8.5 | 1.65 | 13.2 | 11.3 | 24.4 | 11.5 | 1 | 28.7 | 0.082 |
| 3 | 23 | 6.3 | 12 | 8.5 | 3.65 | 15.2 | 9.3 | 24.4 | 11.5 | 0.6 | 20.7 | 0.584 |
| 4 | 15 | 2.3 | 13.2 | 8.5 | 3.65 | 15.2 | 11.3 | 26.4 | 9.5 | 0.6 | 35.7 | 0.092 |
| 5 | 15 | 6.3 | 12 | 6.5 | 1.65 | 15.2 | 11.3 | 26.4 | 11.5 | 0.6 | 34.3 | 0.077 |
| 6 | 15 | 2.3 | 12 | 8.5 | 3.65 | 13.2 | 9.3 | 26.4 | 11.5 | 1 | 32.1 | 0.115 |
| 7 | 23 | 2.3 | 12 | 8.5 | 1.65 | 15.2 | 11.3 | 24.4 | 9.5 | 1 | 23.9 | 0.11 |
| 8 | 23 | 2.3 | 13.2 | 6.5 | 1.65 | 15.2 | 9.3 | 26.4 | 11.5 | 1 | 27.3 | 0.075 |
| 9 | 23 | 6.3 | 13.2 | 8.5 | 1.65 | 13.2 | 9.3 | 26.4 | 9.5 | 0.6 | 25.8 | 0.173 |
| 10 | 15 | 6.3 | 13.2 | 6.5 | 3.65 | 15.2 | 9.3 | 24.4 | 9.5 | 1 | 24.2 | 0.168 |
| 11 | 23 | 6.3 | 12 | 6.5 | 3.65 | 13.2 | 11.3 | 26.4 | 9.5 | 1 | 18.4 | 0.424 |
| 12 | 15 | 2.3 | 12 | 6.5 | 1.65 | 13.2 | 9.3 | 24.4 | 9.5 | 0.6 | 35.5 | 0.033 |
| 13 | 19 | 4.3 | 12.6 | 7.5 | 2.65 | 14.2 | 10.3 | 25.4 | 10.5 | 0.8 | 28.7 | 0.147 |
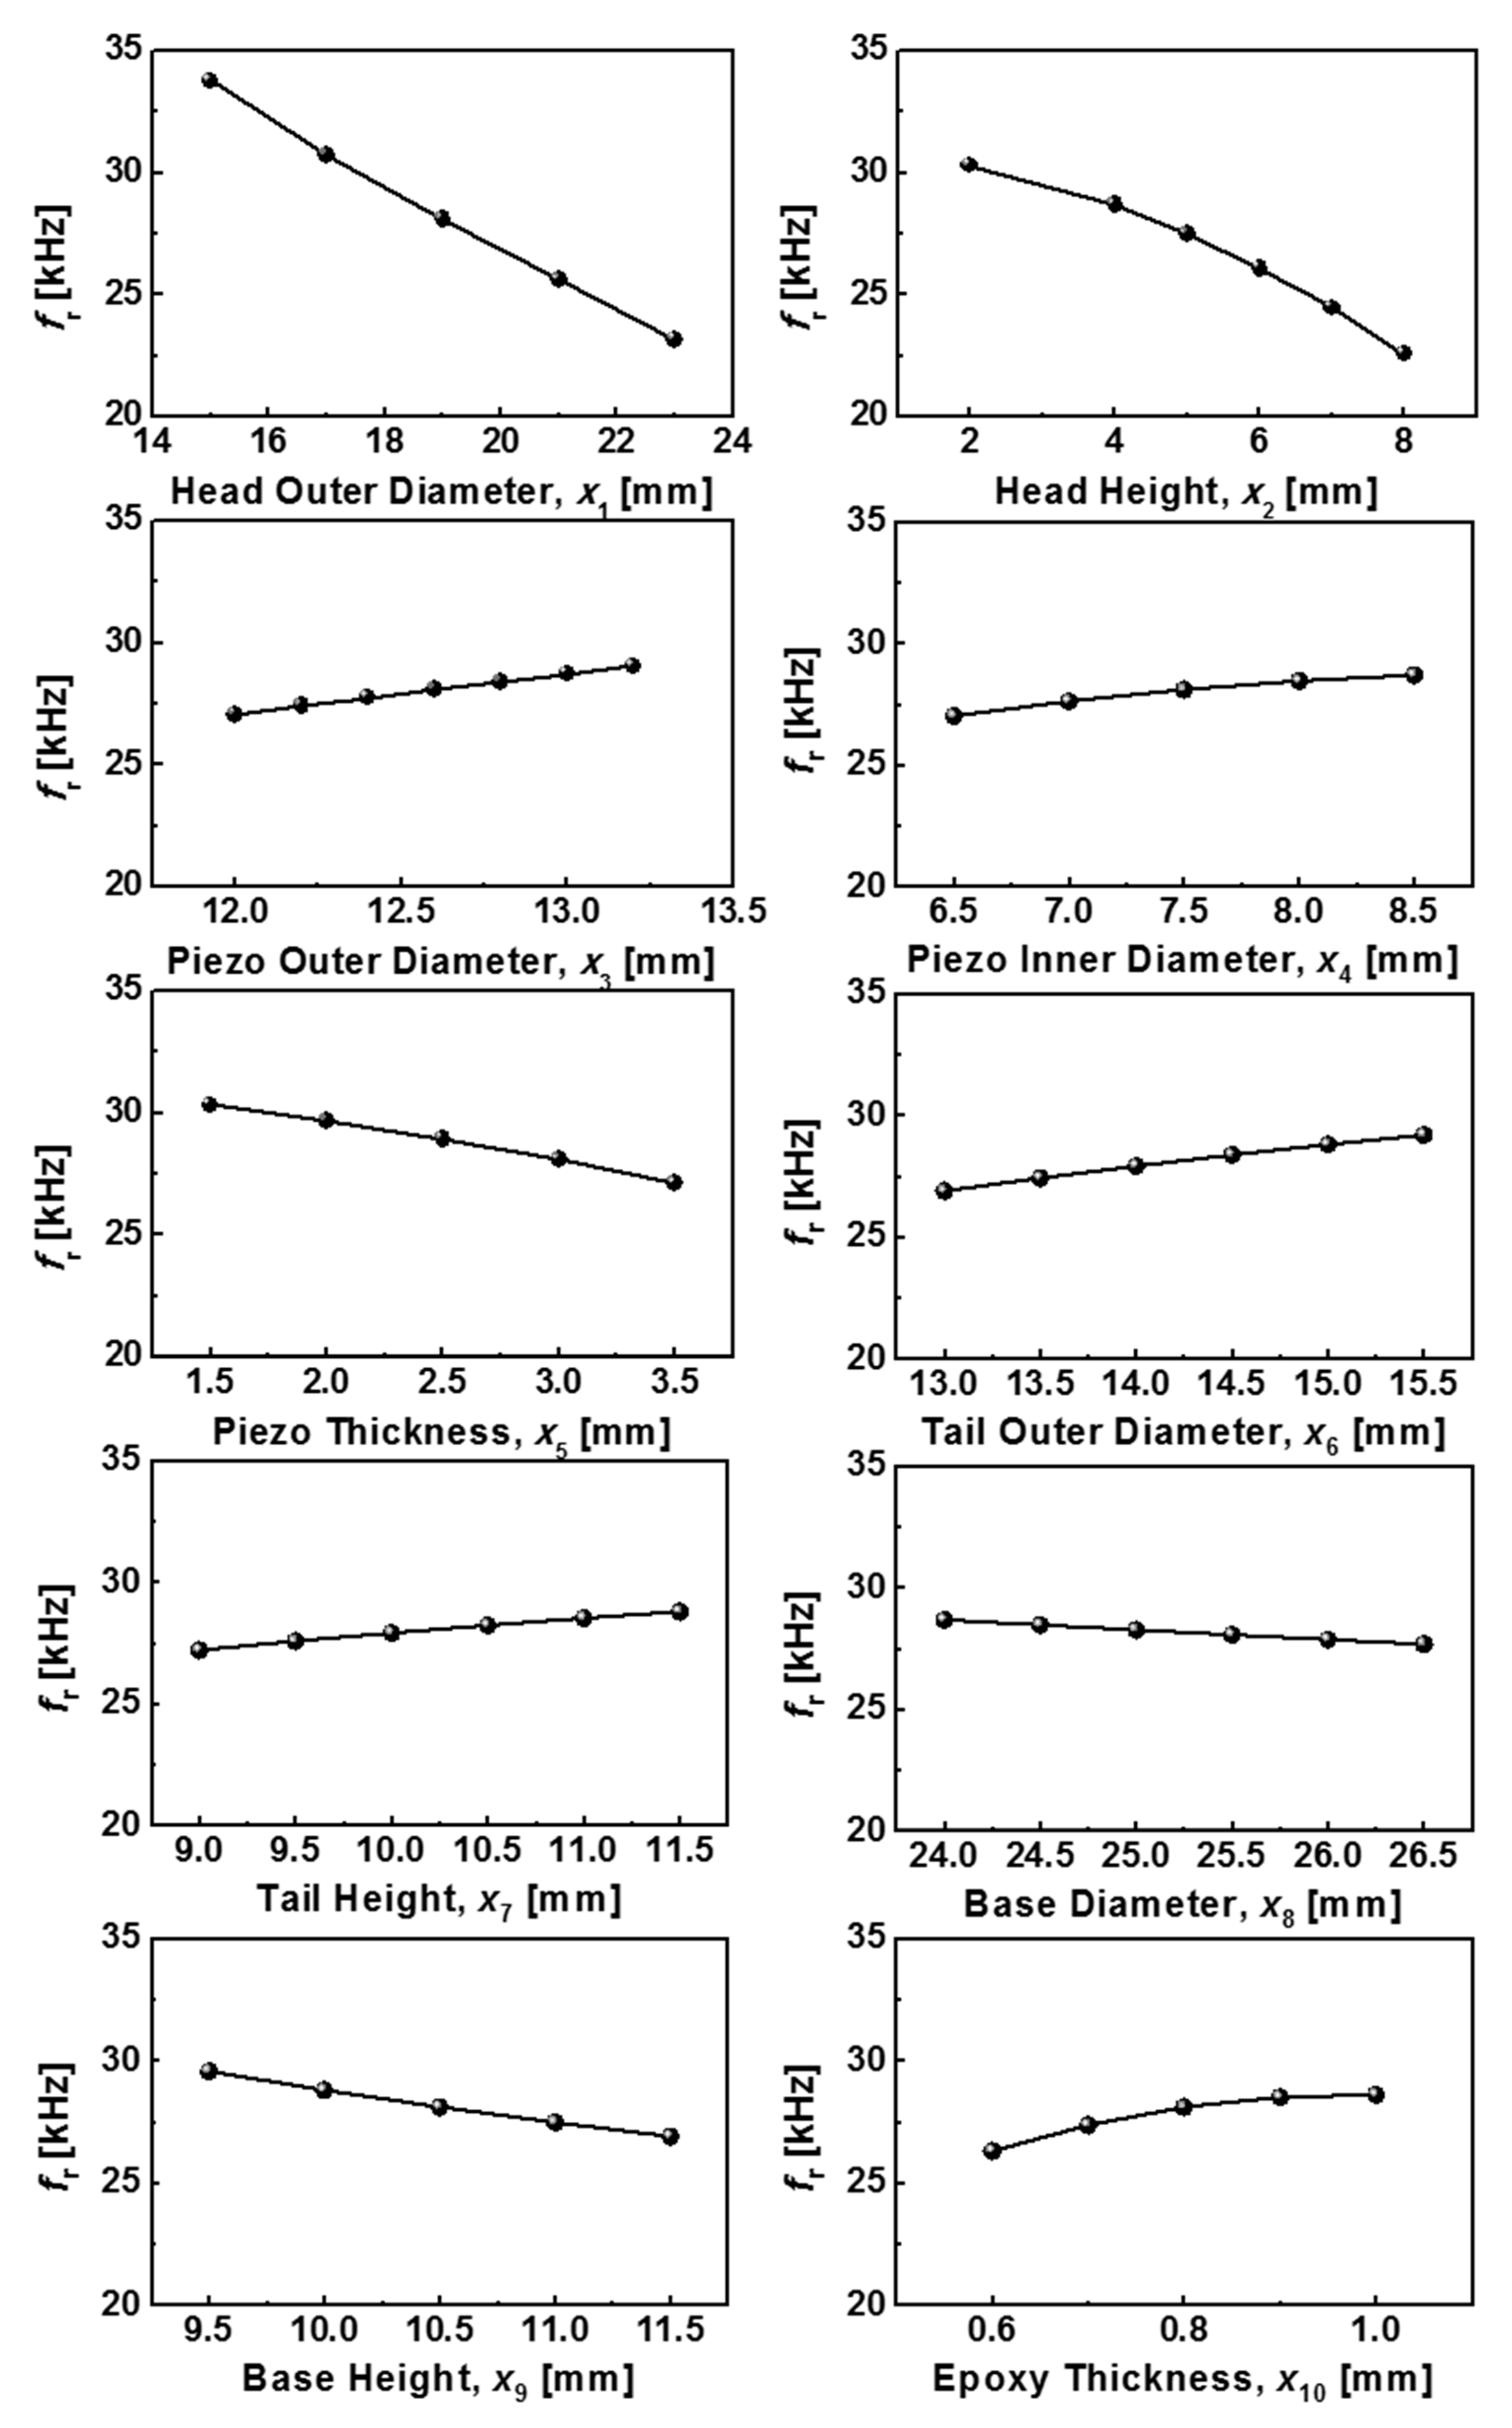
| Design Variables | Dimension (mm) | Resonance Frequency (kHz) | Electric Potential (V) | Design Variables | Dimension (mm) | Resonance Frequency (kHz) | Electric Potential (V) |
|---|---|---|---|---|---|---|---|
| x1 Head outer diameter | 15 | 33.8 | 0.17 | x2 Head height | 2 | 30.3 | 0.11 |
| 17 | 30.7 | 0.23 | 4 | 28.7 | 0.28 | ||
| 19 | 28.1 | 0.28 | 5 | 27.5 | 0.35 | ||
| 21 | 25.6 | 0.33 | 6 | 26.1 | 0.42 | ||
| 23 | 23.2 | 0.38 | 7 | 24.2 | 0.48 | ||
| 8 | 22.5 | 0.54 | |||||
| x3 Piezo-element outer diameter | 12.0 | 27.1 | 0.289 | x4 Piezo-element inner diameter | 6.5 | 27.0 | 0.292 |
| 12.2 | 27.4 | 0.286 | 7.0 | 27.6 | 0.285 | ||
| 12.4 | 27.8 | 0.283 | 7.5 | 28.1 | 0.280 | ||
| 12.6 | 28.1 | 0.280 | 8.0 | 28.5 | 0.278 | ||
| 12.8 | 28.4 | 0.277 | 8.5 | 28.7 | 0.278 | ||
| 13.0 | 28.7 | 0.275 | |||||
| 13.2 | 29.0 | 0.273 | |||||
| x5 Piezo-element thickness | 1.5 | 30.5 | 0.220 | x6 Tail outer diameter | 13.0 | 26.9 | 0.282 |
| 2.0 | 28.9 | 0.246 | 13.5 | 27.4 | 0.281 | ||
| 2.5 | 28.2 | 0.272 | 14.0 | 27.9 | 0.280 | ||
| 3.0 | 27.9 | 0.299 | 14.5 | 28.4 | 0.280 | ||
| 3.5 | 27.6 | 0.326 | 15.0 | 28.8 | 0.280 | ||
| 15.5 | 29.2 | 0.281 | |||||
| x7 Tail height | 9.0 | 27.2 | 0.253 | x8 Base diameter | 24.0 | 28.7 | 0.303 |
| 9.5 | 27.6 | 0.264 | 24.5 | 28.5 | 0.295 | ||
| 10.0 | 27.9 | 0.274 | 25.0 | 28.3 | 0.286 | ||
| 10.5 | 28.2 | 0.284 | 25.5 | 28.1 | 0.279 | ||
| 11.0 | 28.5 | 0.294 | 26.0 | 27.9 | 0.271 | ||
| 11.5 | 28.8 | 0.304 | 26.5 | 27.7 | 0.264 | ||
| x9 Base height | 9.5 | 29.6 | 0.237 | x10 Epoxy thickness | 0.6 | 26.3 | 0.238 |
| 10.0 | 28.8 | 0.259 | 0.7 | 27.4 | 0.258 | ||
| 10.5 | 28.1 | 0.280 | 0.8 | 28.1 | 0.280 | ||
| 11.0 | 27.5 | 0.300 | 0.9 | 28.5 | 0.305 | ||
| 11.5 | 26.9 | 0.318 | 1.0 | 28.6 | 0.331 |
© 2019 by the authors. Licensee MDPI, Basel, Switzerland. This article is an open access article distributed under the terms and conditions of the Creative Commons Attribution (CC BY) license (http://creativecommons.org/licenses/by/4.0/).
Share and Cite
Lee, G.-J.; Hwang, W.-J.; Park, J.-J.; Lee, M.-K. Study of Sensitive Parameters on the Sensor Performance of a Compression-Type Piezoelectric Accelerometer Based on the Meta-Model. Energies 2019, 12, 1381. https://doi.org/10.3390/en12071381
Lee G-J, Hwang W-J, Park J-J, Lee M-K. Study of Sensitive Parameters on the Sensor Performance of a Compression-Type Piezoelectric Accelerometer Based on the Meta-Model. Energies. 2019; 12(7):1381. https://doi.org/10.3390/en12071381
Chicago/Turabian StyleLee, Gyoung-Ja, Won-Ju Hwang, Jin-Ju Park, and Min-Ku Lee. 2019. "Study of Sensitive Parameters on the Sensor Performance of a Compression-Type Piezoelectric Accelerometer Based on the Meta-Model" Energies 12, no. 7: 1381. https://doi.org/10.3390/en12071381
APA StyleLee, G.-J., Hwang, W.-J., Park, J.-J., & Lee, M.-K. (2019). Study of Sensitive Parameters on the Sensor Performance of a Compression-Type Piezoelectric Accelerometer Based on the Meta-Model. Energies, 12(7), 1381. https://doi.org/10.3390/en12071381