Article

Numerical Investigation of the Wind and Thermal Conditions in Sky Gardens in High-Rise Buildings

by
Murtaza Mohammadi
and
John Kaiser Calautit
*
Department of Architecture and Built Environment, University of Nottingham, Nottingham NG7 2RD, UK
*
Author to whom correspondence should be addressed.
Energies 2019, 12(7), 1380; https://doi.org/10.3390/en12071380
Submission received: 17 March 2019 / Revised: 4 April 2019 / Accepted: 8 April 2019 / Published: 10 April 2019
(This article belongs to the Section G: Energy and Buildings)

Abstract

:
High-rise buildings are known to be highly energy intensive, adding stress on already stressed resources. Alternatively, designers are looking at passive strategies and investing in architectural elements, such as sky gardens, which could improve the performance of buildings. Sky gardens are green areas located in a building which are exposed to the outdoors. They could provide multifaceted improvements in buildings by introducing environmental benefits to occupants and altering microclimate. This study aims to determine the wind comfort and thermal condition in sky gardens in high-rise buildings using numerical modelling. Different geometrical configurations of sky gardens were simulated and analysed. Based on the initial results, the study reveals that sky gardens can generate high wind velocities of the order ~10 m/s when located on a high-rise building. The addition of features such as trees and other architectural elements, which can act as a buffer, can help attenuate the high wind speeds and creating habitable spaces. The reduction varies 50%–80%, depending on the location and spatial domain of the sky garden. Furthermore, the study also investigated the reduction in air temperature due to the addition of trees, which can further reduce temperature in hot weather.

Graphical Abstract

1. Introduction

The increasing population and number of high-rise buildings accompanied by decreasing space for parks/vegetation and social areas has generated many environmental issues. The building industry is faced with multiple challenges to reduce its energy usage along with providing conducive living condition for the inhabitants [1]. Globally, we use a third of energy in buildings [2], and environmental issues such as the urban heat island (UHI) effect can further impact the energy demand of buildings [3]. Consequently, it has become crucial to check the rising air temperatures over a city and ameliorate the situation.
In most major cities, the skyline is dotted with high-rise buildings—a response and consequence of economic and industrial activity as well as demographic growth [4]. High-rise buildings consume more energy per square meter in contrast to low-rise buildings [5]. Various factors are responsible for buildings’ high energy intensity, including fabric, air conditioning, occupancy, climate, and exposure to increased environmental stress such as the UHI effect. Nooriati et al. [1] suggests that high-rise building is more exposed to climatic elements compared to low-rise buildings, requiring buffering effect for protection.
Vegetative measures are being increasingly implemented to mitigate UHI and address the rising energy demand in the building sector. Taha [6] has recognised the importance of evapotranspiration (evaporation and transpiration) from soil-vegetation system in mitigating UHI. Gao [7] observed that vegetated areas can lead to a reduction of the average air temperatures up to 2 °C. Yang et al. [8] conducted experimental and numerical studies to evaluate the cooling efficacy from vegetation planted in a public park in Taipei. Their study concluded that shading provided by tree canopies can directly mitigate UHI effect while evaporative cooling from the leaves can provide an indirect means to tackle UHI. Furthermore, Bruse and Fleer [9] pointed out that significant improvement of the microclimate can be accomplished by slight modifications to urban geometries, such as introducing small parks within the built environment. Dimoudi and Nikolopoulou [10] performed computational fluid dynamics (CFD) simulations of a row of trees along a street, showing a reduction of 1 °C in the air temperature at pedestrian level.
Apart from parks and avenues, other types of greenery that can incorporated into a building or city includes green roofs, vertical greenery, and courtyards, which are usually exposed to external environments, as opposed to atriums and enclosed greenery. Architects and designers are continuously looking for new ways to incorporate greenery into their designs, a good example of these are sky gardens. A sky garden refers to planted landscapes created above the ground such as in intermediate floors or at the rooftop, maximizing the greenery and environmental [11,12]. The concept is initiated from re-adapting the vernacular or traditional features in low-rise buildings, such as courtyards, and can similarly provide a community space for recreational purposes.
Increased wind speeds, in addition to the shading provided by the sky garden, will help in improving the thermal comfort conditions during summer by forced convection and evaporation; while in winter, a decrease in energy consumption of the building can be expected due to a reduced heat loss through the green cover of the sky garden. The biophilic design also draws higher real estate value and architectural returns [13,14,15]. A higher life span of the roof and building materials is also anticipated [16]. Niu and Burnett [17] carried out a CFD simulation around sky gardens and their results indicated that the wind speeds are much amplified in the sky garden spaces.
Occupants’ health has also been a subject of concern in recent years due to highly artificial environment in high-rise buildings [18]. Use of atria and courtyards in the form of sky gardens could provide natural environment for occupants, modifying microclimate and generating conducive environments [19,20]. Natural ventilation in buildings can provide comfortable environment while generating a good indoor air quality [21]. Moreover, studies have shown a wider thermal comfort range of people in a free-running building, consequently decreasing energy demand.
A study conducted by Nooriati et al. [1] found that sky gardens had a more conducive and thermally comfortable space as compared to balcony gardens and rooftop gardens. Although the study did not identify the contribution of each specific characteristic and measure the actual performance of each factor, it nevertheless collected people’s responses to comfort via questionnaire and their responses to environmental conditions existing at the sky garden. Oberndorfer et al. [22] highlighted that sky gardens reduce congestion and provide open spaces mandated by local regulatory bodies in a cost-effective way. Other benefits include improving the health and wellbeing of the residents by creating leisure and open spaces, architecturally sound environment, and attenuating the air and sound pollution. Furthermore, they provide peaceful places and a natural ambience for the residents of the urban area [11,23].
Many cities, like Hong Kong, have drafted a policy to construct green features on high-rise buildings [15,24]. Such compact cities, where there is not enough space to plan green spaces on the ground, sky gardens may serve to maximize the green plot ratio. Likewise, Singapore is investing in integrated designs of their buildings, such that the built environment can benefit from urban vegetation.
Assessment studies of the impact of green measures usually takes into account the cooling effect of vegetation on streets, facades, or roof, while other studies look at effect of building forms on pedestrian level wind patterns. To the best of the author’s knowledge, no study yet exists that investigates the aerodynamic performance of the sky garden in detail while performing parametric study of the effect of its configuration on the wind flow. The few studies which do exist are qualitative and statistical in nature, where users’ responses were used to generate a conclusion. The identified gaps are summarized below:
  • Lack of CFD studies to numerically model the airflow distribution patterns in a sky garden and parametrically assess the impact of its configuration.
  • Lack of CFD studies to investigate the effect of such airflow distribution on the thermal distribution in these sky gardens.
  • Absence of studies investigating the impact of tree configuration on the aero-thermal performance of the sky garden.
Particularly, the concept of sky gardens needs more research since high-rise buildings are a norm, and proper integration and planning directive of sky gardens could potentially lead to better environmental and social benefits. Except for some key projects around the globe, the idea of vertical greenery has not been fully implemented. In fact, it is the logical expansion of Ebenezer Howard’s idea—garden city movement—for high-rises.
The present study aims to investigate the effect of sky garden configuration, with and without vegetation, on the wind conditions, along with examination of the thermal condition of such vegetated zones, considering only the evapo-transpirational cooling effect of the plants.

2. Materials and Methods

2.1. CFD Governing Equations

The evaluation of aerodynamic response of the sky garden and the thermal characteristics of the semi-open space requires simulation of physical phenomena occurring in the proposed environment, characterised by turbulent behaviour [25]. CFD allows for numerical modelling of the fluid flow and heat transfer and understanding its characteristics. Modelling turbulence in the wake of a porous object is one of the main challenges when it comes to simulating turbulent air flow. The present study utilizes the standard k-ϵ turbulence model, as proposed by Kichah et al. [26], to determine the flow characteristics. The governing equations are given by Launder and Spaulding [27].
Continuity equation:
u ¯ l x i = 0
Mean strain-rate tensor:
u ¯ l t + u ¯ J u l ¯ t = 1 ρ p ¯ x i + x j ( 2 v s l J ¯ u J u l ¯ )
s l J ¯ = 1 2 ( u l ¯ x j + u J ¯ x i )
Turbulence kinetic energy:
t ( ρ k ) + x i ( ρ k u i ) = x j [ ( μ + μ t σ k ) k x j ] + G k + G b ρ ε Y M + S k
Rate of dissipation:
t ( ρ ε ) + x i ( ρ ε u i ) =   x j [ ( μ + μ t σ ε ) ε x j ] + C 1 ε ε k ( G k + C 3 ε G b ) C 2 ε ρ ε 3 k + S ε .  
Turbulent viscosity:
μ t = ρ C μ k 2 ε
where u ¯ l and p ¯ are the mean components of velocity and pressure, respectively, and u J u l ¯ are the Reynolds stresses. For the present study, constants in the equations have been set the following values— C 1 ε = 1.44, C 2 ε = 1.92, C μ = 0.09, σ k = 1.0 and σ ε = 1.3. The near-wall modelling significantly impacts the fidelity of numerical solutions, in as much as walls are the main source of mean vorticity and turbulence [28]. Standard wall functions, as defined in FLUENT, have been utilized in the present study and the governing momentum equations are:
Law-of-the-wall for mean velocity:
U * = 1 k ln ( E y * )
Dimensionless velocity:
U * U p C μ 1 / 4 k p 1 / 2 τ w / ρ
Dimensionless distance:
y * ρ C μ 1 4 k p 1 2 y p μ .
The characteristics of the vegetation that are most important from the standpoint of impacts on the heat transfer are the height, leaf area index (LAI), fractional coverage, albedo, and stomatal resistance [14]. Furthermore, transpiration extracts heat from the airflow due to phase change from liquid water to water vapour [29].
Rahman et al. [30], while studying the cooling effect of vegetation, were able to specify the volumetric cooling power of a specific plant type under study as a monthly averaged transpiration energy loss. Their study showed a value of 284 and 335 W/m3. This was a very specific case, given the type of plant and environmental conditions existing at the site. To the best of the author’s knowledge, no standard measured values exist for volumetric cooling capacity of plants in literature. To simplify, a value of 300 W/m³ for a unit leaf area density (LAD) is used, as estimated by Gromke et al. [31].
A simplified model of a tree, represented by a spherical porous region of 2 m radius, was implemented [10,30,32,33,34]. Following Sonnenwald et al. [35], the Ergun equation was utilized to determine viscous resistance factor (1/α) and the inertial resistance factor (C2). FLUENT [28] provides these formulae as:
Permeability:
α = d 2 150 3 ( 1 ) 2
Inertial loss coefficient:
C 2 = 3.5 d ( 1 ) 3
where the particle diameter d and the void fraction Ø are set to 0.02 m and 0.9 respectively for the current study.

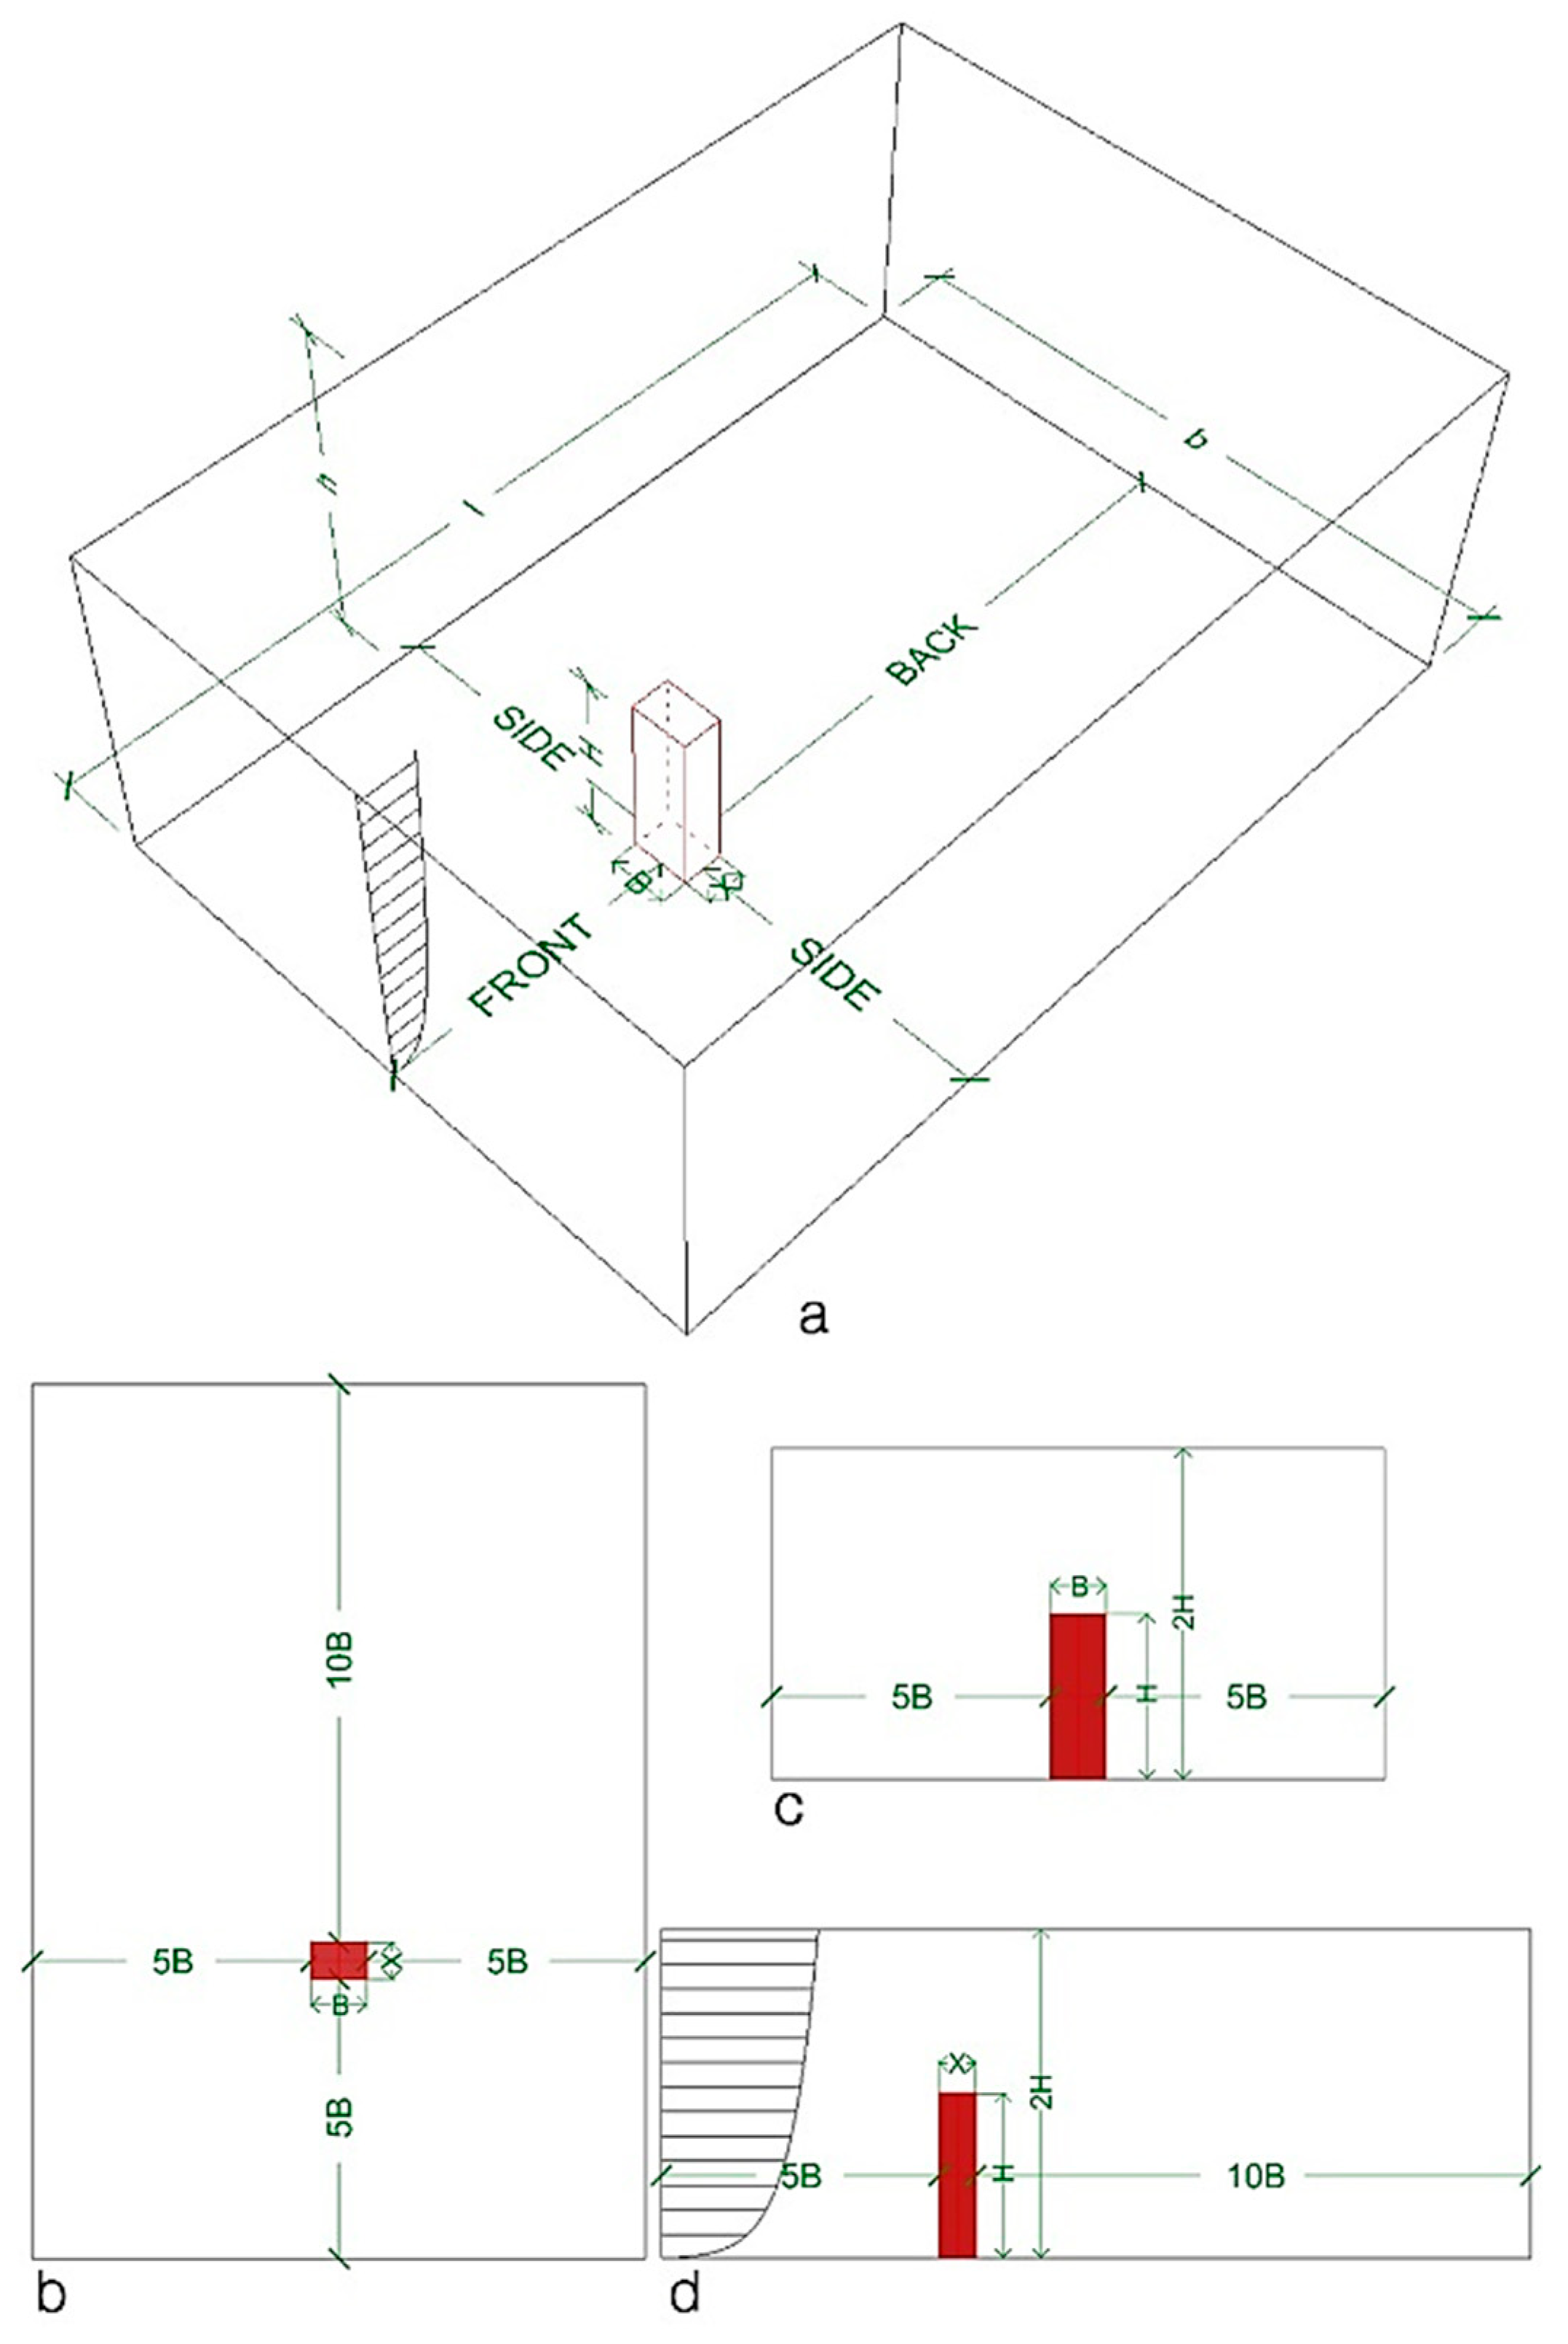
2.2. Computational Domain

Table 1 summarizes the various domain sizes utilised by different studies for tall building CFD simulations, where H is the building height, B is the width, and X the depth (length along the wind direction), while l, b, and h refer to domain length, width, and height, respectively.
The current study adopts a combination of domain sizes as proposed by Tominaga [39] and Agerneh et al. [40], with the building floor plan in the ratio of 3:2 and facing the inlet. The height, width, and depth of the building were set as 80 m, 18 m, and 27 m, respectively. The validation model consists of a rectangular building without a sky garden. The surrounding fluid domain measures 20,100,960 m³ as shown in Figure 1.

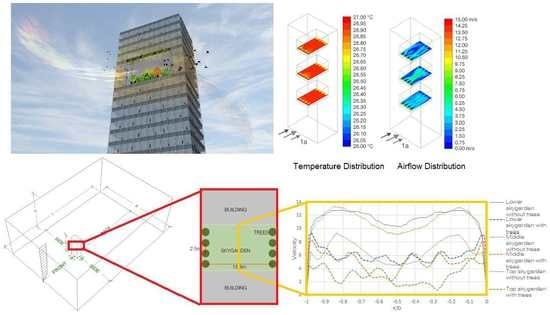
2.3. Sky Garden Configuration

Pomeroy [42] described six types of sky garden based on their spatial morphology. Amongst them, the stepped terrace and fragmented zone behave more like a huge balcony; nevertheless they all modify the airflow pattern and provide comfort for the occupants in terms of social and economic benefit and increase the life of building material [43,44]. In addition, gardens located on the roof, although they could provide ecological benefit for the building, they are usually not included in the same typology. The present study adopts the hollowed-out (centre type), eroded corner (corner type), and interstitial type (periphery) of morphology for the sky garden as detailed in [42].
In total, seven configurations were studied. They were grouped under three heads; 1) central, 2) corner and, 3) periphery (Figure 2). These are representative of sky garden shapes most commonly integrated in high-rise buildings [42]. The simulated building was 20 storeys high and each storey’s height was 4 m. In total, the height of the building was 80 m and each sky garden covered two storeys, i.e., 8 m. Each model had three sky gardens at three different heights to simulate and analyse the flow patterns at various positions of the sky garden. They were located at 0.3H, 0.5H, and 0.8H, so that the floor of the sky gardens corresponded to 24 m, 44 m, and 64 m above the ground, as shown in Figure 2. The modelled 3D diagrams of the building and sky gardens is shown in Table 2.

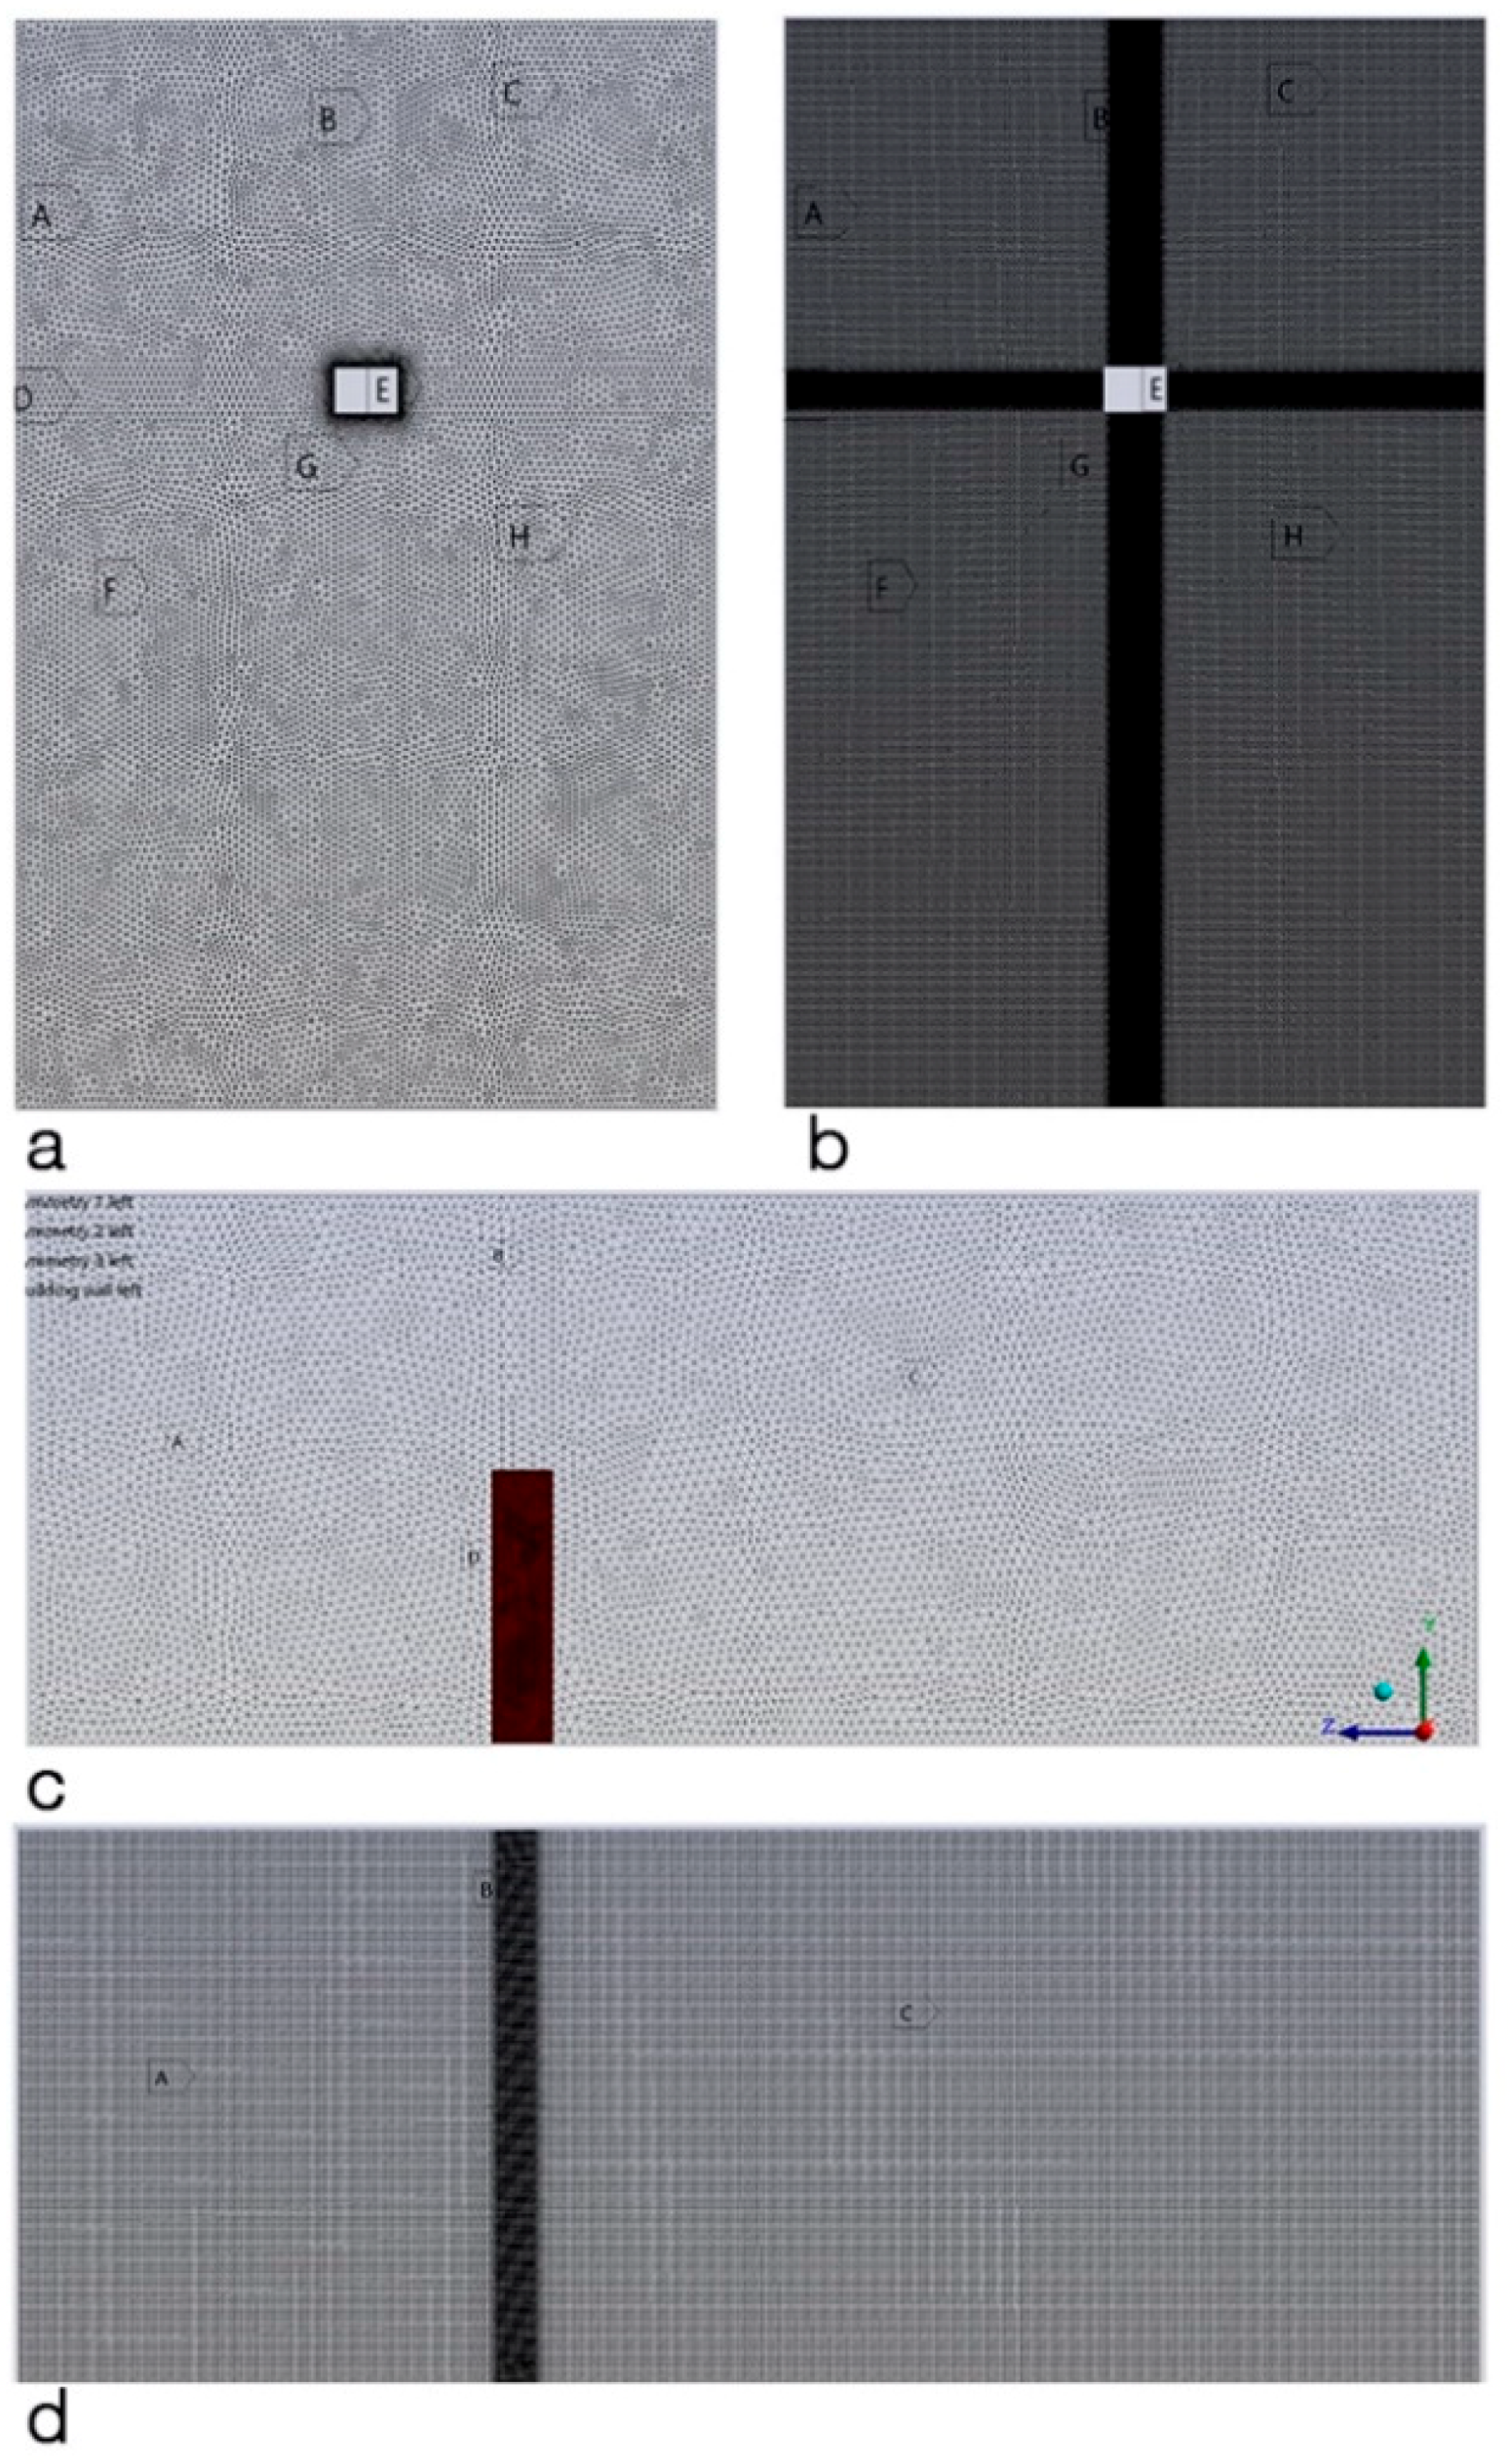
2.4. Computational Grid

The computational grid consisted of unstructured mesh with finer elements near the building, selected based on grid analysis and validation, detailed in Section 3.1.1. The advanced size function in ANSYS Meshing was used to precisely capture the geometry while maintain a smooth growth rate between regions of curvature. In order to accurately capture the flow fields near the critical areas of interest in the simulation, size functions were applied in those surfaces. Table 3 summarizes the mesh details used in the simulation.

2.5. Boundary Conditions

Richards and Hoxey [45] recommended the use of a log-law profile for the velocity inlet profile as:
U ( z ) = u * k l n ( z + z o z o ) .
However, for validation purposes, the inlet velocity profile is modelled after Agerneh et al. [40] and the outlet is set to 0 pa pressure. A comparison of their profile to the lag-law expression developed by Richards and Hoxley [45], where u * is 0.8, k is 0.4, and zO is 0.6 for the case in hand, is shown in Figure 3. The air temperature for the inlet is kept constant at 300 K (27 °C). Boundary condition for the outlet is set to pressure outlet with 0 pa. Gravity of −9.8 m/s2 is set for the simulation domain to account for buoyancy. Symmetry for top and side walls and no slip condition for ground implemented as a standard roughness model.

2.6. Tree Configuration

The unique nature of each sky garden design, its location, and building type, accompanied by the existence of no standard design practice, makes it difficult to simulate any one particular kind of sky garden. A study by Tian et al. [15] revealed that amongst the existing building stock of Hong Kong consisting of sky gardens, the vegetated spaces typically occupy 20% of the sky garden area. Considering other factors like load-bearing capacity of the structure, angle of slab, planting techniques, walking paths, mechanical equipment, and other factors, no more than 80% of the space can be greened. Thus, the potential for green areas varies between 20% to 80% of the sky garden area. The trees are placed in the zones of high wind speeds, as identified in Section 4.1, to act as attenuators. Figure 4 shows the tree arrangements in the different sky gardens. A sphere of 2 m diameter is used to represent a generic shrub and is placed 100 mm above the floor. Also, to account for structural and architectural reasons, the trees are placed 100 mm away from the edge and equally spaced out. When the width of the sky garden is increased, a proportional number of trees are added to keep a constant tree projection area of 15%. Boundary conditions, vegetation, and the building model are setup as defined in Section 2.5.

3. Results

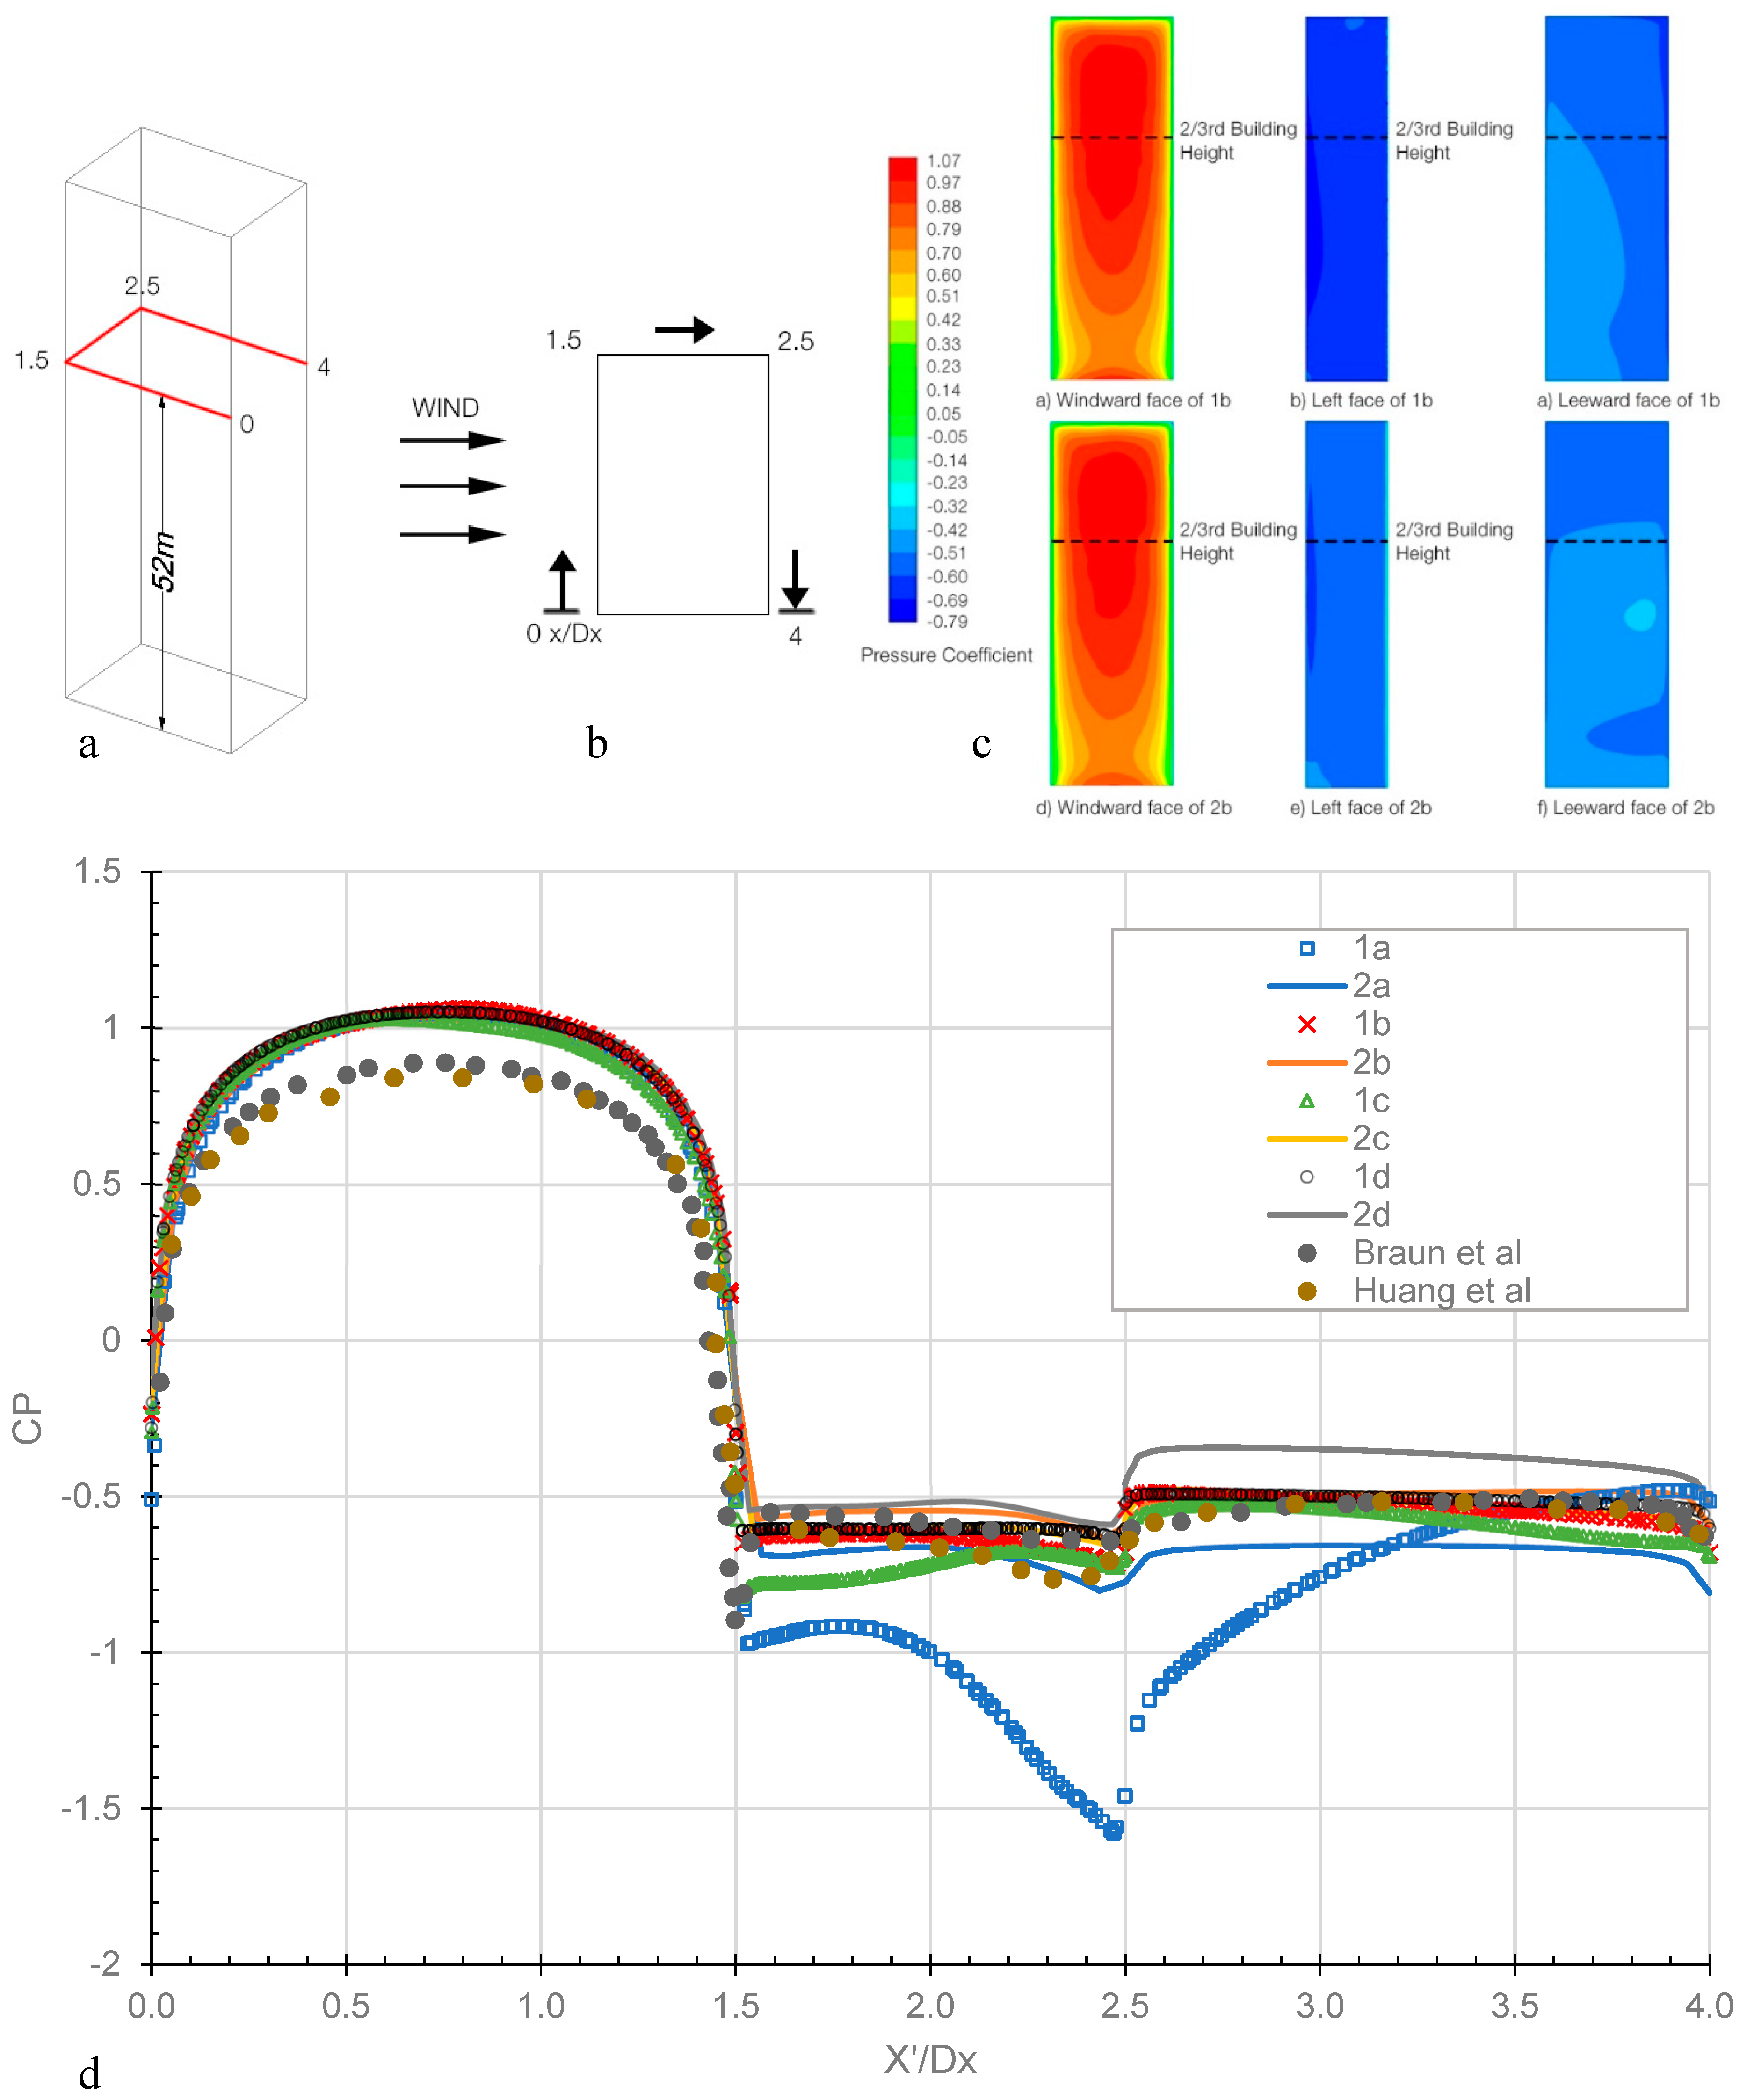
3.1. Method Verification and Validation

3.1.1 Building Model

Both mesh types (structured and unstructured) of varying mesh sizes (sensitivity analysis) were generated for the study, see Figure 5. The details of the mesh are shown in Table 4. Similar to the study conducted by Agerneh et al. [40], the coefficient of pressure at two-thirds of building height was plotted, which corresponds to 52 m. The reference values of pressure and velocity were taken at the inlet, with Uref of 10.29 m/s. CP was obtained from along the building periphery, starting from the lower windward corner (point 0 to 4 in Figure 6a) and normalized by the building depth of 18 m.
The pressure coefficients obtained for each model are shown in Figure 6d. All 18 models had similar values along the windward face, although it is slightly greater than the values predicted in the literature by Braun et al. [46] and Huang et al. [38]. On the leeward faces, most models had comparable pressure coefficients, except for some variations by lower-resolution meshes. There was good agreement between the present study and models obtained from the literature, especially the models 1b, 1c, 2b, and 2c. Major deviations were seen for the case 1a along the leeward faces, underpredicting the pressure. Models 2a, 2d, and 1c also showed underpredicted values as compared to the literature, but only showed slight deviation.
It is interesting to observe that the models 1b, 1c, 2b, and 2c, corresponding to 2–8 million mesh elements, showed good agreement with the literature, especially the unstructured grid. Overall, the numerical simulations were able to model the patterns of pressure coefficient around the high-rise building model as indicated in literature. Higher mesh resolution increases computational time, and hence in the light of this observation, unstructured mesh of ~2.5 million elements was utilised for further analysis.

3.1.2. Vegetation Modelling Validation

The porous vegetation model was validated against the numerical study by Manickathan et al. [29]. The simulation domain was modelled accordingly, consisting of a porous tree medium represented by 1 m × 1 m area placed 0.5 m above ground (see Appendix A). The medium is placed in a 35 m × 11.5 m field representing the surrounding air fluid. The original inlet wind profile as proposed by Manickathan et al. [29] employs the Richards and Hoxey [45] model (Equation (9)) with von Karman number equal to 0.41 and zo = 0.0217 m, and the inlet air temperature was set at 32 °C (305 K). The corresponding permeability and inertial resistance coefficient were calculated using Equations (10) and (11). Figure 7a is a comparative plot of wind speeds for different porosity of vegetation when the analysis is done parallel to inlet wind direction, at a height of 1m. The axis is centred at the vegetation. Figure 7b is a plot of wind speeds when the analysis is done in the vertical direction, at a distance of 1.5 m leeward of the vegetation.
In Figure 7a,b, it is observed that the trend follows the reference curve before and after encountering the porous medium. The drop in the wind speeds near the anterior of the tree was slightly higher for the present model. The differences observed could be due to the fact that the reference case was carried out in 2D. In addition, the present study adopted a more simplified approach and utilizes the standard k-ϵ model in contrast to the realizable k-ϵ model used by Manickathan et al. [29]. However, since the deviation was small, the consequent results were considered sufficiently accurate to estimate the aero-thermal characteristics of wind around vegetation in sky gardens.

4. Discussion

The developed building model is first analysed without the presence of trees to observe the impact of sky gardens as a geometrical intervention in high-rise buildings. This is described in Section 4.1. In the latter section, the sky garden included trees to investigate the change in microclimate. Static pressure, velocity, and turbulence intensity were analysed at a height of 1.4 m above the sky garden, which is the average chest height for a person sitting (1.3 m) and standing (1.5 m) [47]. To understand the dynamics of the flow in the entire sky garden, a cross-sectional velocity map through the centre of the building is generated. In order to simulate the effect of varying wind direction, which is frequently encountered, the building was oriented at three different angles to the wind, 0°, 45°, and 90°. The symmetric approach to modelling removes redundant cases of wind from the opposite side.

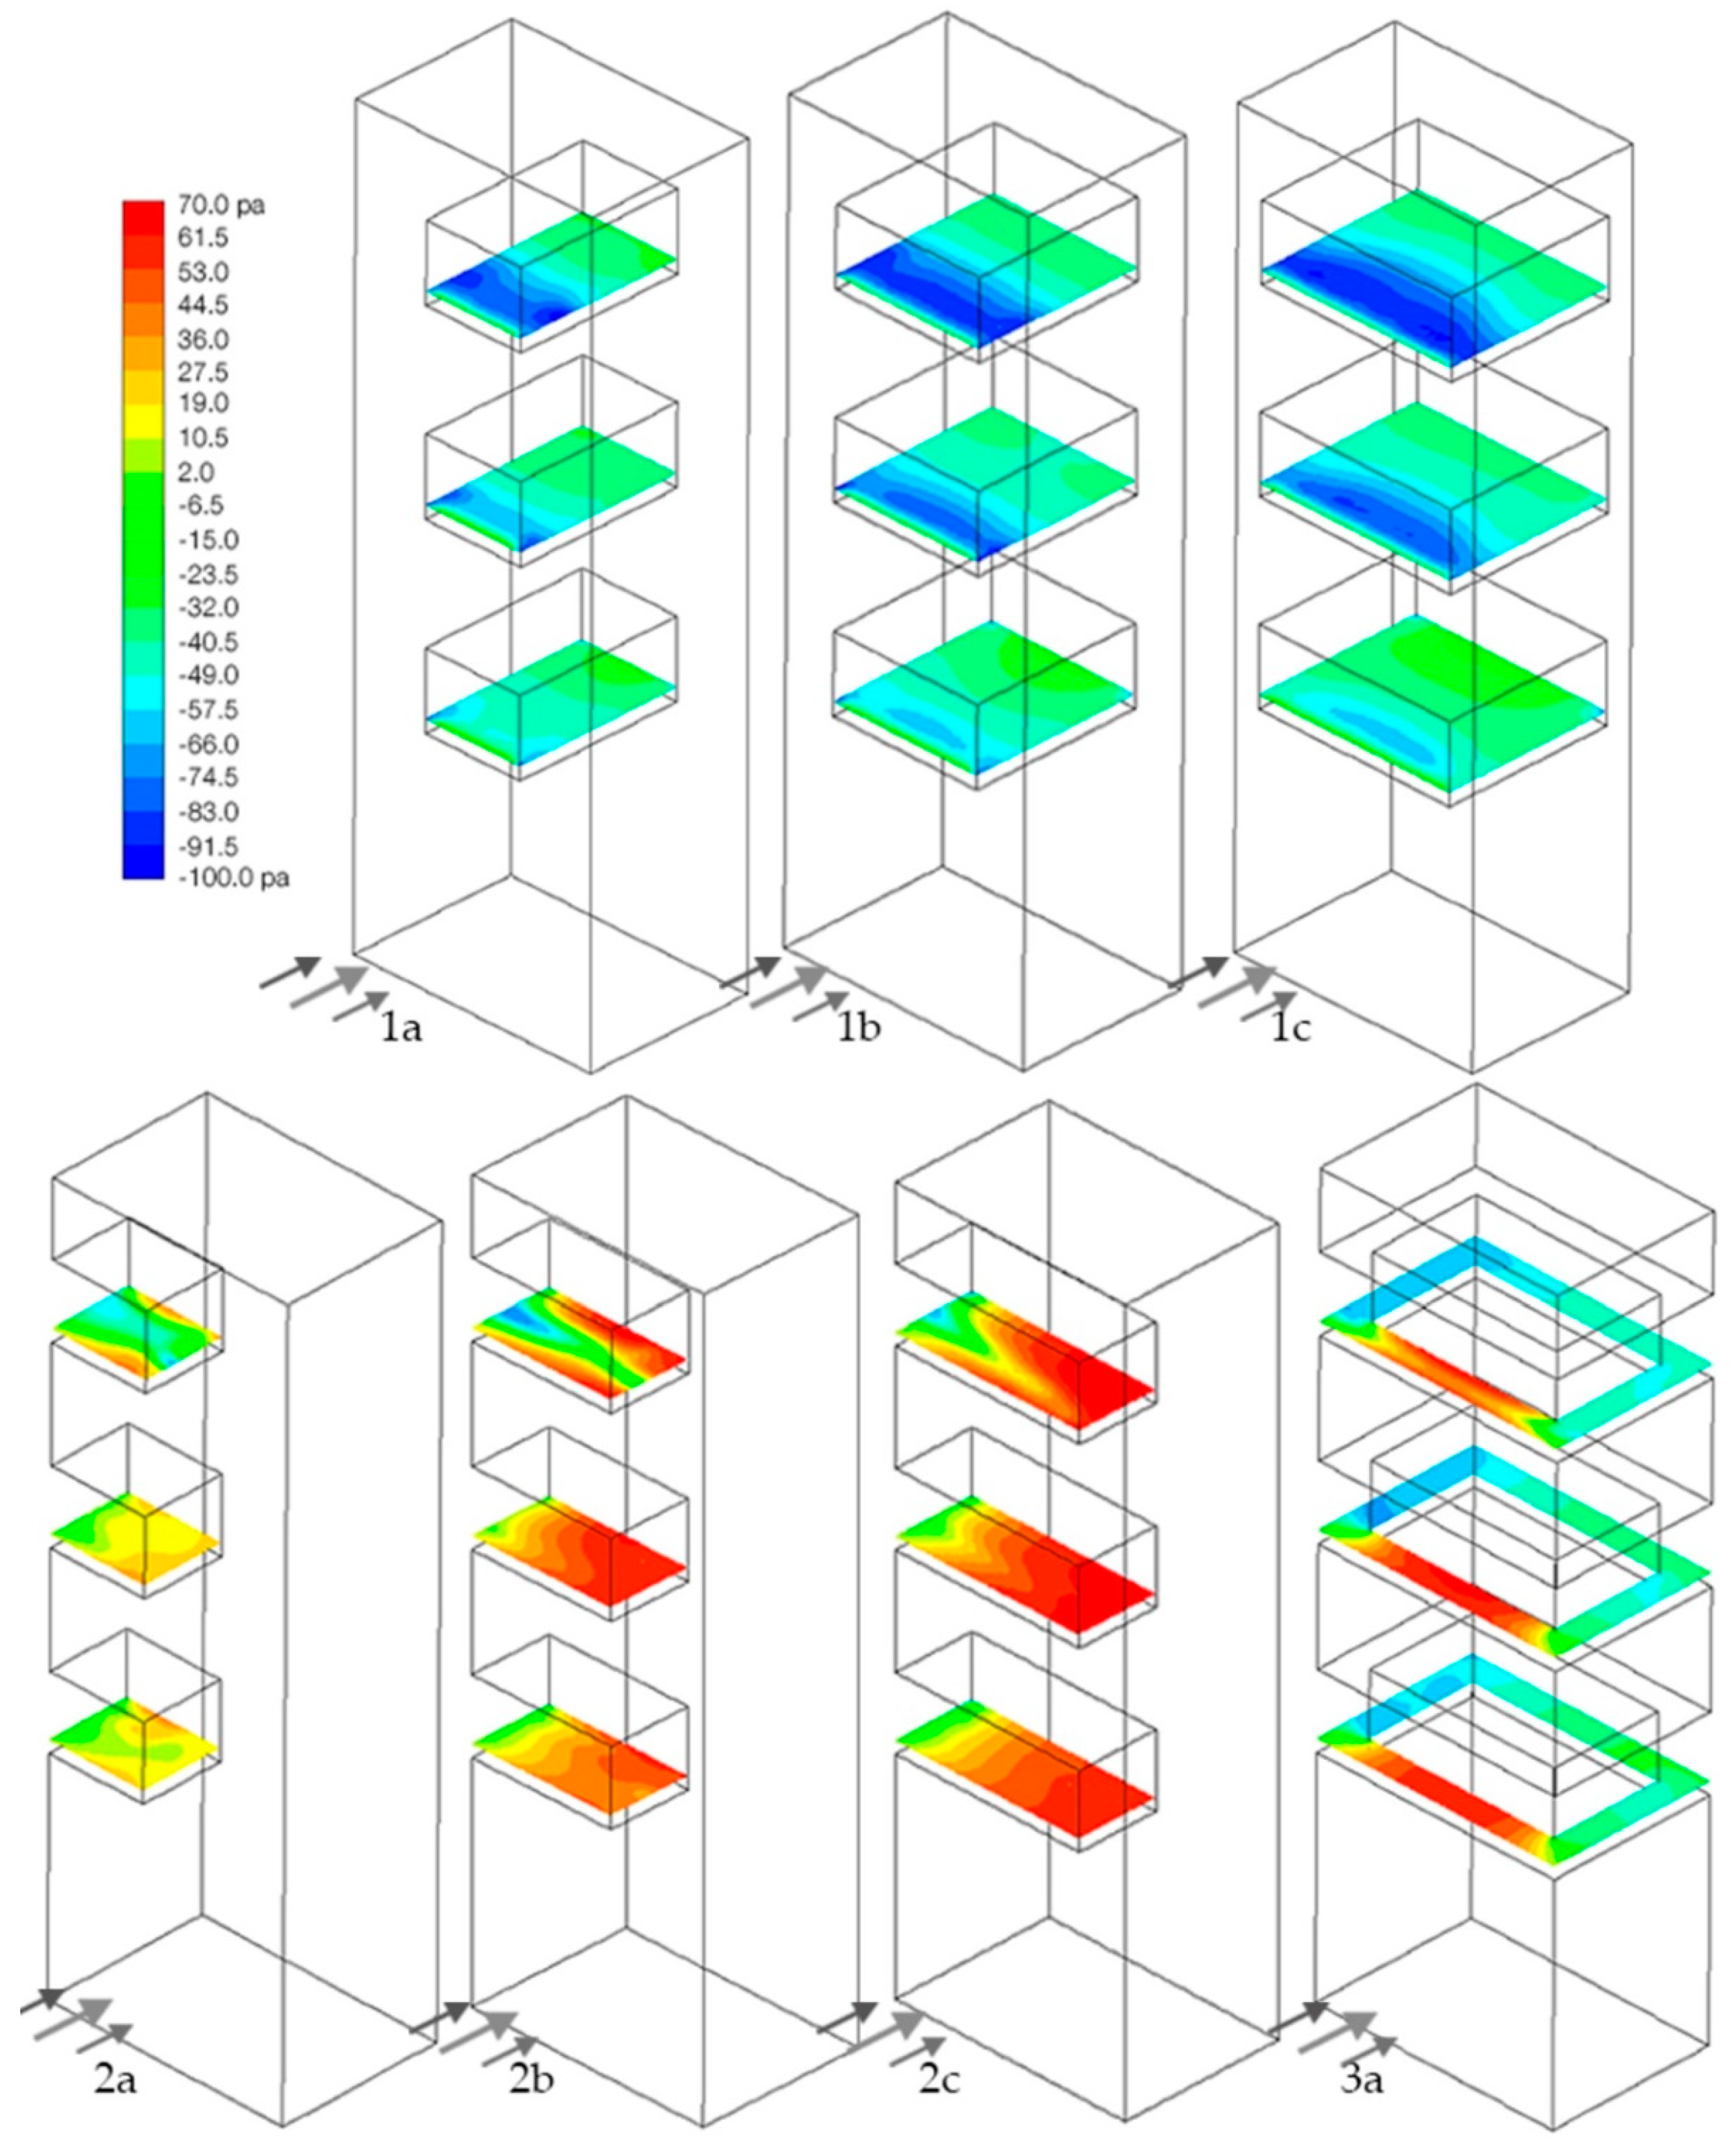
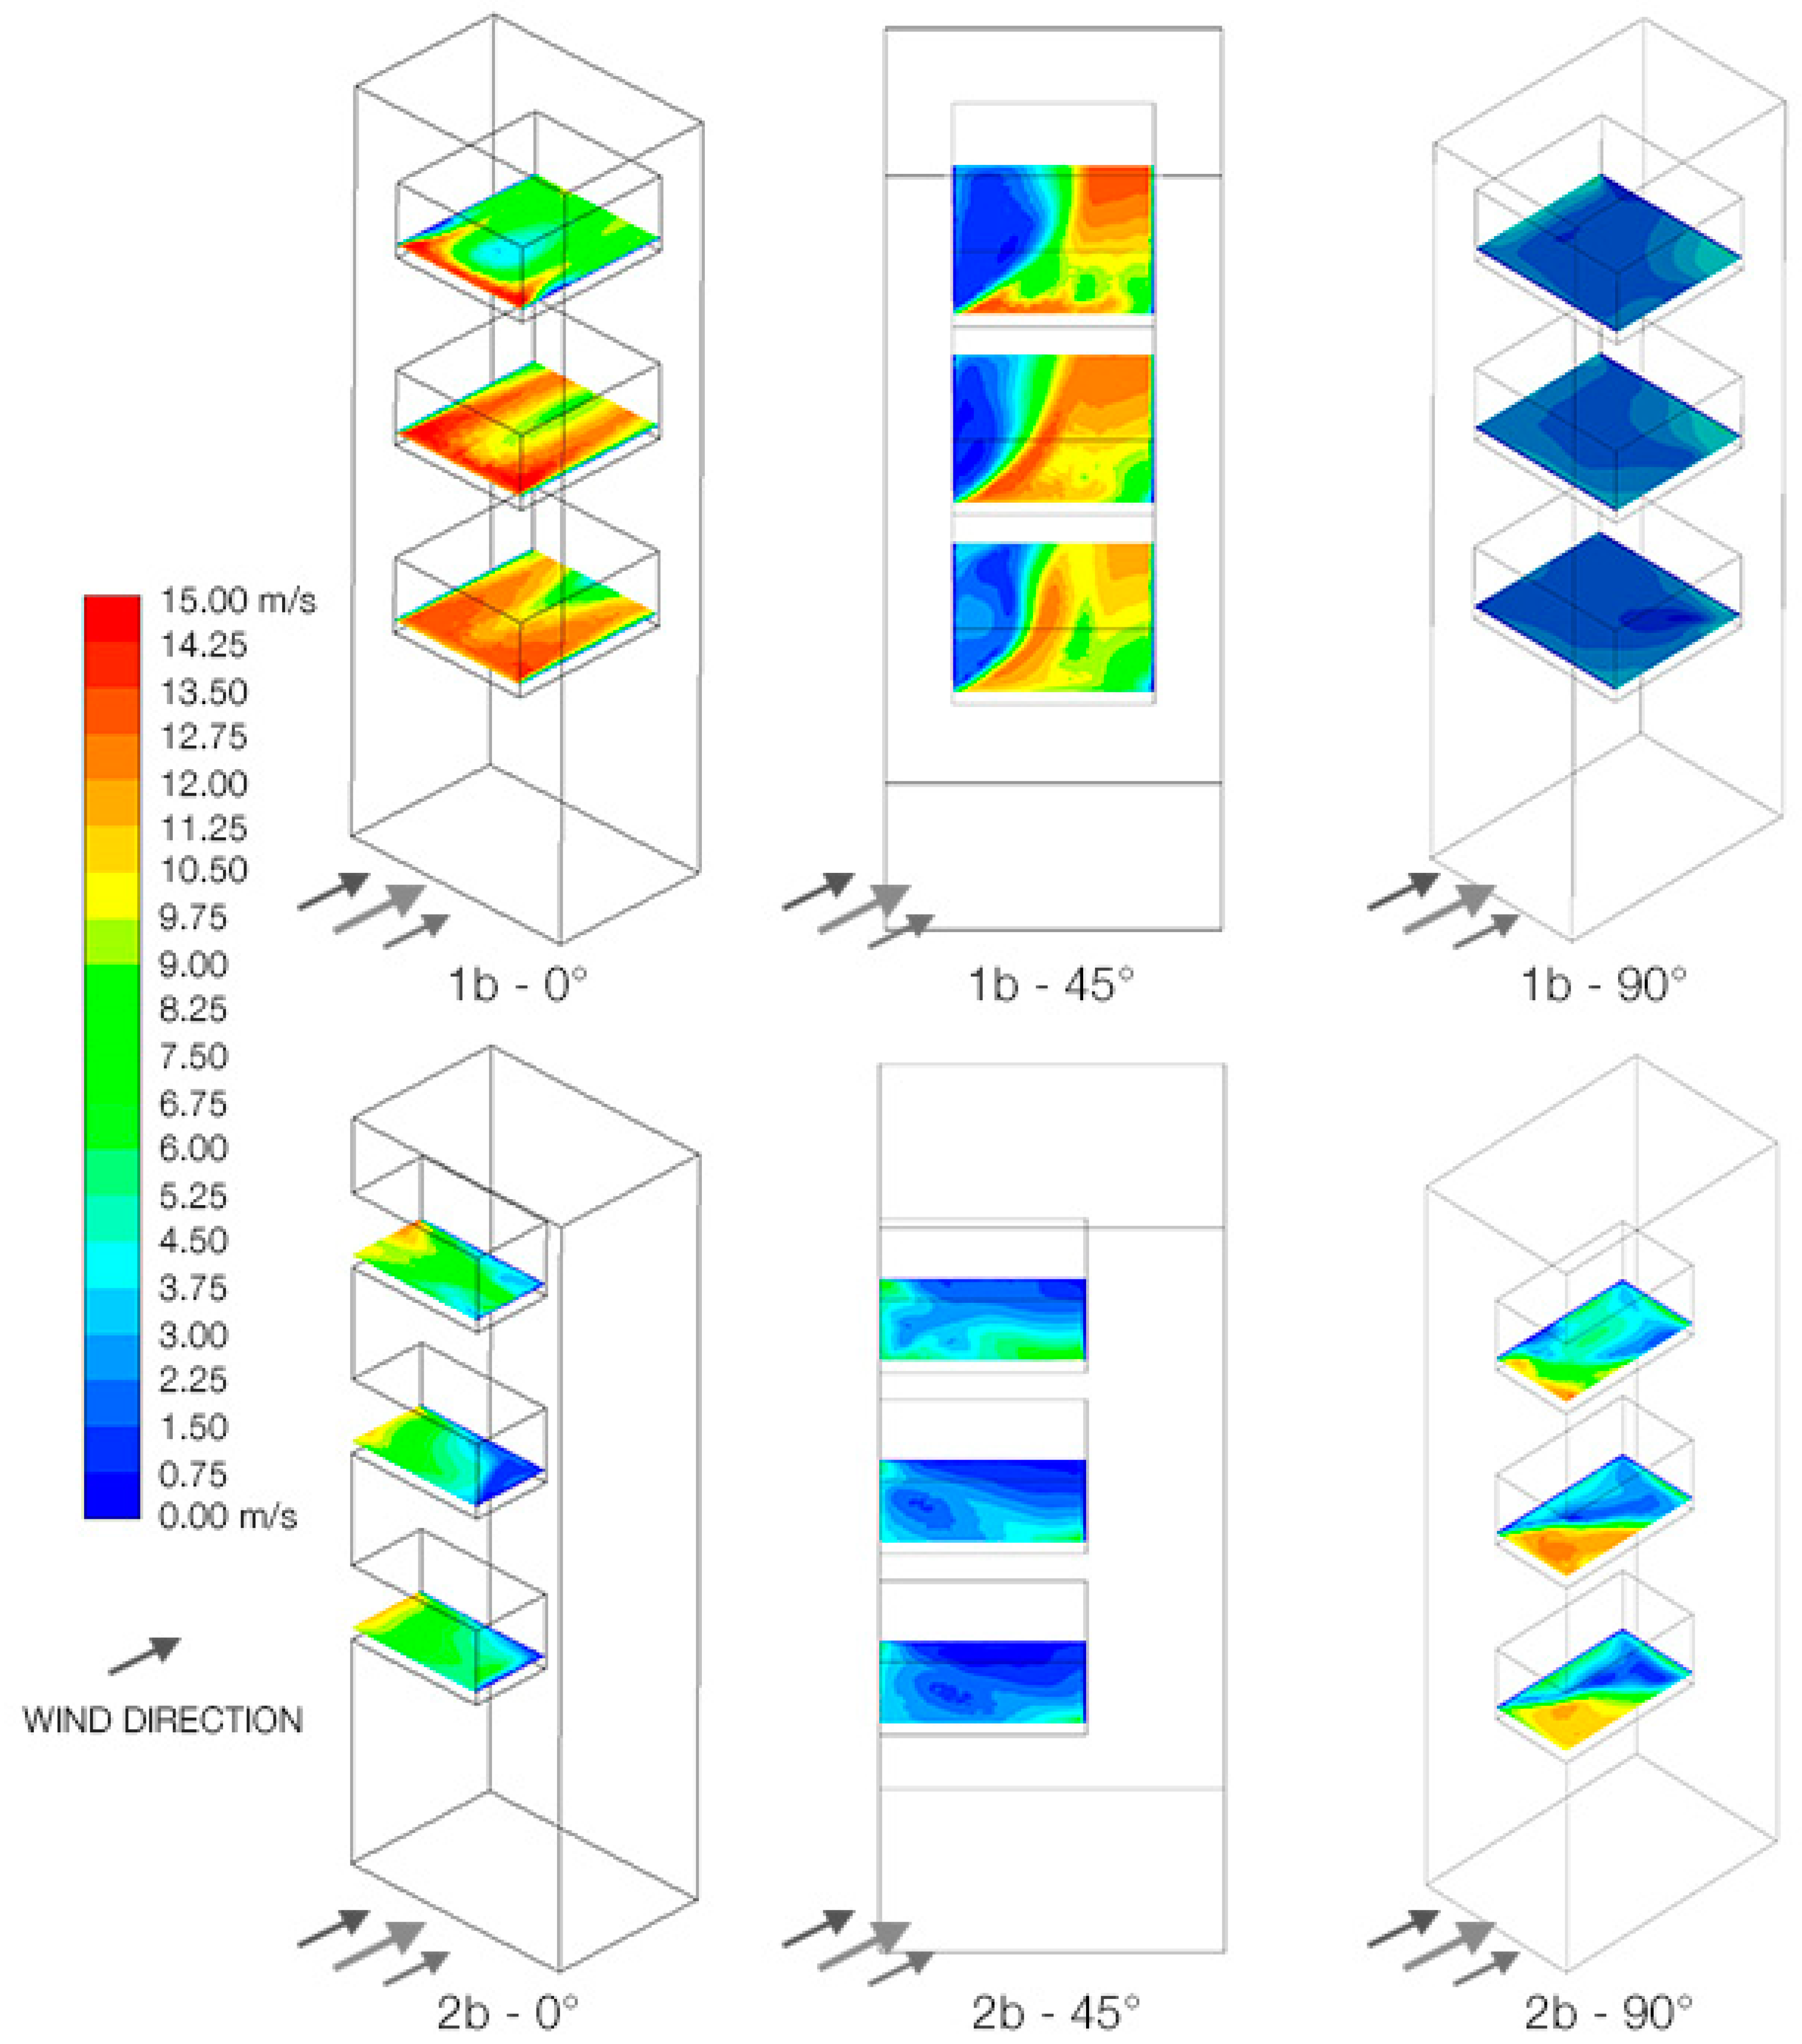
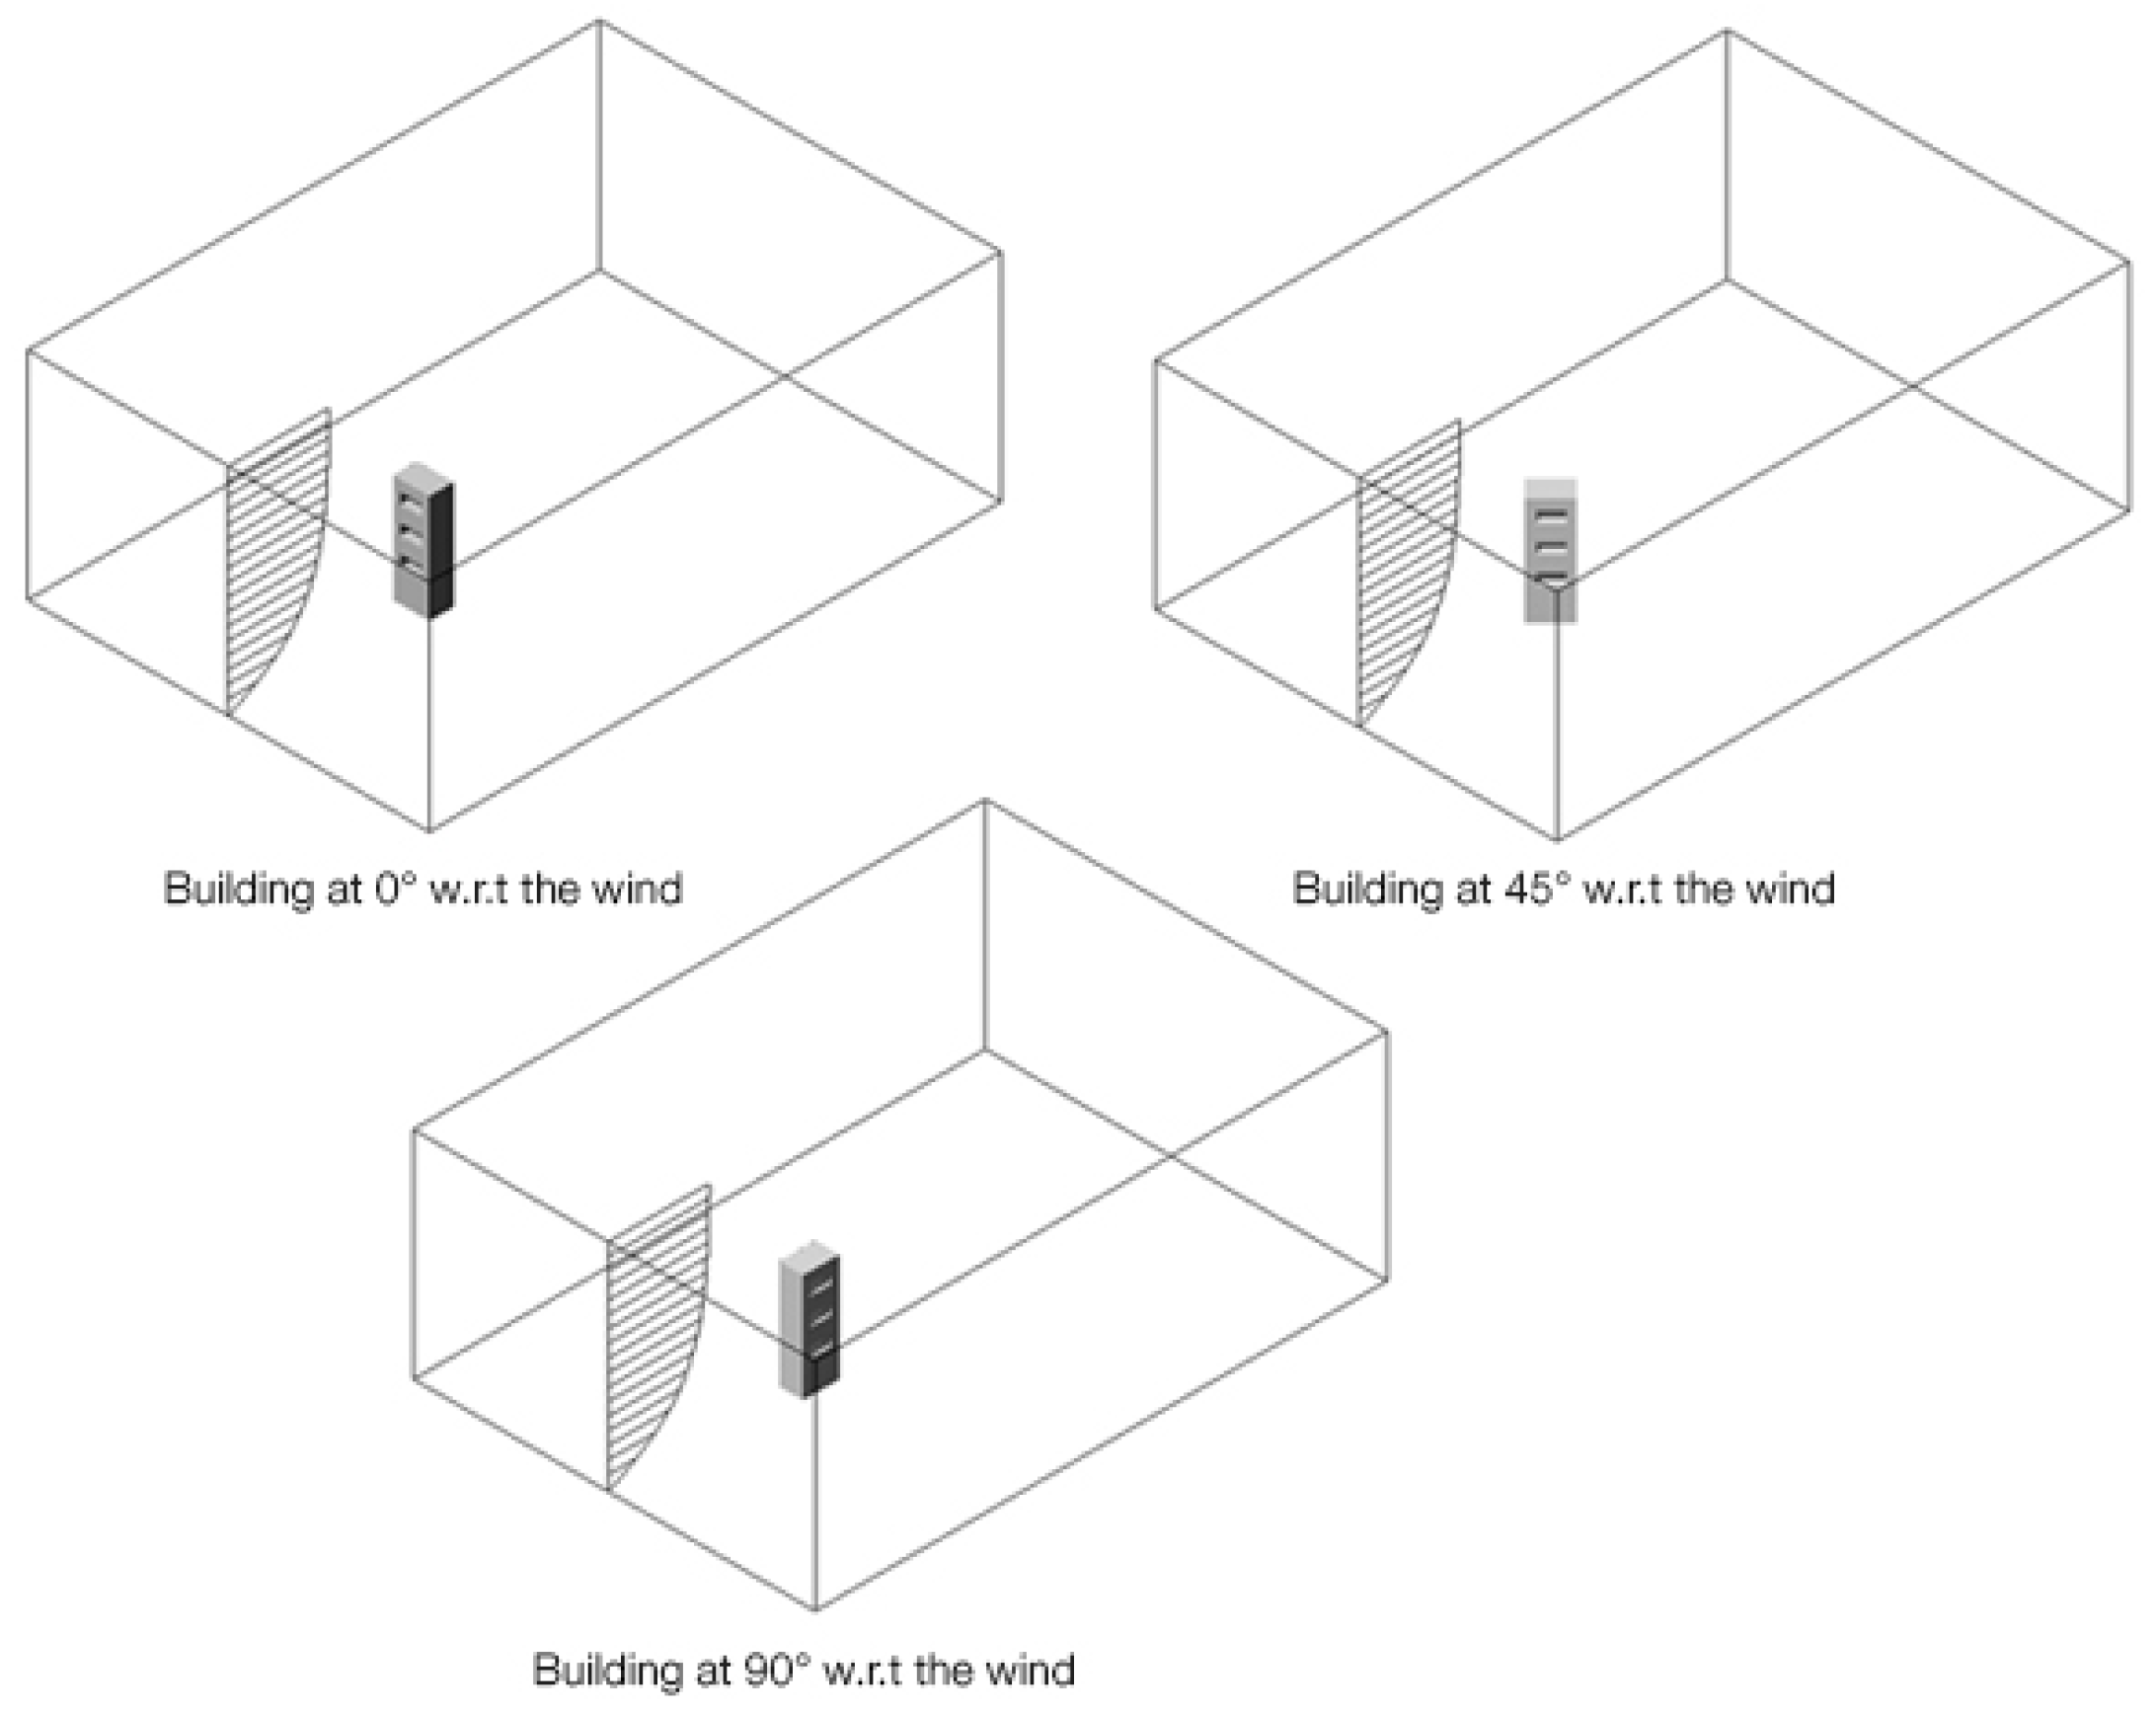
4.1. Wind Flow through Buildings with Sky Gardens without Vegetation

Figure 8 shows the velocity contour at the three sky gardens in each model when the building is directly facing the wind (0°). In general, the speed increased as the height of the sky garden decrease for the central type of sky garden, while the other two types (corner and periphery) show the opposite trend, i.e., increase in wind speeds with increasing height of the sky garden.
For the central sky garden, Figure 8 (1a, 1b and 1c) it is observed that the wind speeds are higher near the wall and a region of lower wind speeds develops in the centre. The effect becomes prominent with increasing width of the sky garden. Speeds upto 15 m/s are seen near the front and sides of the sky garden. In the corner configuration, Figure 8 (2a, 2b, and 2c), the speeds range from 0 to 8 m/s, increasing from the wall to the leeward edge, with even higher speeds in some configurations. In the periphery configuration, Figure 8 (3a), wind speeds are high around corners and lower along the edges. Windspeeds can reach upto 15 m/s around the wind-facing corners and 4 m/s at the leeward corners. Along the edges, the speeds are almost zero near the centre and gradually increase towards the corner. With the increasing height of the sky garden, higher wind speeds are observed along the windward edge, while the other sides show little change.
Figure 9 is a plot of static pressure in the sky gardens when the building is at an angle of 0°. In the central type sky garden, Figure 9 (1a, 1b, 1c), the pressure is seen to increase from along the windward edge to the leeward edge. Except for the sharp fall near the windward edge, pressure increases gradually along the length of the sky garden. The sharp fall in pressure near the front edge creates a suction effect drawing air into the sky garden. Higher sky gardens record lower pressure on the windward side on average, and are almost constant along its width. On the highest sky garden, the pressure increases from −100 pa to about −20 pa, while on the lowest, it increases from about −60 pa to 0 pa, from the front to rear side of the building.
In the case of corner sky gardens, Figure 9, (2a, 2b, 2c), the pressure is comparatively higher and is seen to decrease from the wall to the leeward edge. Increasing the width of the sky garden leads to generation of higher pressures near the wall. For instance, at the mid-rise sky garden, the pressure increases from ~20 pa to ~70 pa near the wall. Higher sky gardens produce a tailing effect, as substantially extended contours lead to a steeper pressure gradient. The effect is significant for the model in Figure 9 (2b), producing a sharp pressure drop in the centre, accompanied by higher wind speeds. The periphery sky garden, Figure 9 (3a) generates high pressures of about ~50 pa along the windward edges which gradually decreases around the corners and is least along the sides. This leads to suction effect around the corners, causing higher wind speeds. A slight increase of pressure is seen on the rear leeward edge. The pressure remains nearly the same with increasing height of the sky garden, although a slight decrease is observed on the windward edge.
Turbulence intensity (for buildings at 0°) is shown in Figure 10. Central sky garden records, on average, higher turbulence intensity as compared to other configurations. The contours in Figure 10 (1a, 1b, and 1c) are similar in pattern to the velocity map, increasing with height and width of the sky garden. For instance, in Figure 10 (2c), turbulence increases from 10% to 30% in the centre of the sky garden as one moves from lower to higher location of the sky garden. In all sky gardens of this configuration, however, the turbulence is maximum in the centre and least along the wall edges.
In the corner configuration, Figure 10 (2a, 2b and 2c), the sky gardens have relatively low turbulence intensity. The only exception being the topmost sky garden in, Figure 10 (2b), where turbulence is as high as 40%. In general, turbulence increases with increasing height and decreasing width of the sky garden. As for the periphery configuration, Figure 10 (3a), it varies from 0% to around 10%, being higher towards the rear side of the building. On the windward edge, an increase in turbulence is observed with higher location of the sky garden, while along the leeward edges it remains constant with respect to height.
A velocity vector map through the centre of the sky garden, along the direction of wind, is shown in Figure 11. In the central type sky garden, Figure 11 (1a, 1b, 1c), a low-pressure region towards the rear zone of the building causes high wind speeds exiting the sky gardens. Wind from both the bottom and top of the sky garden bends towards the middle, creating a zone of recirculation. Within the sky garden, maximum speeds of over 10 m/s occur away from the floor and ceiling, while near the surfaces it is less than 3 m/s. In all the top sky gardens of central type, wind moves in the form of an arc, with lower speeds near the floor. The shape is inverted for the bottom sky gardens, bulging downwards near the floor and lower speeds near the ceiling. For the mid-rise sky gardens, however, the wind is seen to concentrate towards the centre as it moves from the windward side to the leeward side of the building.
In the case of the corner sky gardens, Figure 11 (2a, 2b, and 2c), speeds are greater when the width is low consequently broader sky gardens generate calmer condition. A recirculation zone is formed near the floor of sky gardens on the top level, while a similar recirculation zone is seen near the ceiling of the bottom sky garden. The speeds here vary between 5 to 8 m/s. No such pattern is seen in the mid-height sky gardens, and the airflow is slowed down near the rear to about 2 to 3 m/s. Periphery sky gardens, Figure 11 (3a) generate multiple recirculation zones at various locations. In the top sky garden at both the rear and front side of the sky garden, a recirculation zone is observed near the floor with speeds of around 4 m/s in the front. The bottom sky garden generates a recirculation zone near the ceiling, while the centrally located sky garden produces such zones near both the floor and ceiling.
According to Dutch guideline NEN 8100 [48], speeds from around 5 m/s start becoming uncomfortable if blown in a region for more than 5% of the time in a year. The guideline points out that speeds of about 15 m/s are dangerous for even a short while (0.05% of the year) and should be controlled to prevent accidents. Lawson [49] presented a classification of wind speeds (Table 5) based on the threshold limit for a particular activity, like sitting or walking. In brief, quality classes A, B, and C are acceptable for sedentary activities like sitting and languid walking pace, which is usually expected in an office recreational zone. Class D will usually introduce discomfort while E has to be avoided for fear of accidents.
In the case of sky gardens of configuration types 1 and 2, the speeds are generally higher than 7 m/s, creating uncomfortable regions (class D). In some areas, the speeds are even higher than 10 m/s, significantly impacting people’s comfort, even becoming dangerous spots. Especially in the central type, speeds of around 13–14 m/s (class E) near the front of the building can knock people down and create an unpleasant atmosphere; while in the case of corner type sky garden, wind speed near the leeward edge reaches about 10 m/s producing disturbing environments. In the case of the periphery sky garden, however, the speeds are calm and around 2–3 m/s in most places (class A). The corners, nevertheless, see speeds over 13 m/s (class D) which has a potentially disastrous effect on people.
Figure 12 is a plot of velocity contours for type b of central and corner configuration when the wind is blowing at an oblique angle. In the case of central sky garden, a wind shelter region is formed near the windward wall edge (towards the left), deflecting the air around it. High speeds are observed near the front and rear side of the sky garden directly in the path of wind (towards the right). Again, high speeds of over 10 m/s (class D) are observed in this arrangement rendering it unsafe for use, although on the left side is a region of calm conditions with speeds of about 1–2 m/s (class A). When the building is facing away from the wind (at an angle of 90°), the speeds are drastically brought down to about 1 m/s.
If the sky garden is in corner configuration, the wind produces an almost similar effect when blown from either the front or side of the building, although the speeds recorded near the windward side are higher when oriented at a 90° angle. Interestingly, the air slows down to about 2–3 m/s (class A) when the wind blows obliquely at 45° to the sky garden. This is due to the fact that there is no passage for the wind to flow, creating a high-pressure zone and stalled air flow. It can be concluded that the central sky garden sees least wind speeds when the wind blows perpendicular to its width while the corner sky garden sees least wind speeds when the wind blows from the corner at 45°. This part of the study revealed that conditions in a high-rise non-vegetated sky garden are not comfortable and, in many cases, not safe for human occupation. Vegetation is later introduced to reassess the sky garden conditions, which is detailed out in the proceeding section.

4.2. Wind Flow through Buildings with Vegetation in Sky Garden

Velocity and temperature contours, on a horizontal plane, are extracted at a height of 1.4 m above the sky garden floor for each configuration and is shown in Figure 13 and Figure 14, respectively. A vertical plane through the centre of the sky garden is also evaluated for velocity and temperature distribution profile and is shown in Figure 15 and Figure 16, respectively.
In Figure 13, a stark reduction in velocity at each of the sky garden plane can be observed, when compared with no vegetation sky gardens. Speeds varying between 0 to 8 m/s can be observed, with speeds as high as 13–14 m/s in some regions. In the centre type geometry, Figure 13 (1a, 1b, 1c), the trees provide resistance to the oncoming air flow, creating an alternative precinct of high and low wind speeds behind them. Wind speeds of over 12 m/s are seen in front of the trees, where it is deflected on either side. The air flow slows down to 5–7 m/s as it passes the front row of trees and the region immediately behind sees speeds less than 1 m/s, being as they are in the wind shadow region.
Air speeds of about 0 to 3 m/s are seen on top of sky garden in, Figure 13 (1a), which increases to about 0 to 5 m/s at the middle height. However, the highest is observed in the lowest sky garden, where the speeds range from about 2 to 5 m/s. Similarly, in Figure 13 (1b and 1c), the speeds are observed to increase with decreasing height. Comparing the lower sky gardens in Figure 13 (1a, 1b, and 1c), it is observed that the wind speed increases with increasing width, from about 3–4 m/s in Figure 13 (1a), to about 5–6 m/s in Figure 13 (1c). The relation between wind speeds and sky garden configuration remains the same as in earlier case, i.e., speeds increasing with width and decreasing with height.
In the case of corner type, Figure 13 (2a, 2b, 2c), the decrease in wind speed is not as pronounced as in the centre type; nevertheless, winds slow down when blown through the vegetated medium. The side edge where high speeds were generated earlier, now record significantly lower speeds. The inter tree spaces record 3–4 m/s in most cases, although occasionally a higher or lower speed is also observed. The extreme corner of the leeward edge, however, shows higher speeds of about 10 m/s, suggesting a sparse arrangement of the trees.
High wind speeds around the corners in case of the periphery configuration are significantly reduced with the presence of vegetation (Figure 13 (3a)). Speed of 7 m/s is observed around the corners, which were originally around 10 m/s. The leeward edges generate calm conditions with speeds less than 2 m/s. The speed on the windward edge increases from the centre towards the corner, as well as with increasing height of the sky garden. Near the centre of the windward edge of the sky garden, the speeds vary from ~1 m/s near the bottom to 4 m/s on the top. The configuration has no effect on the leeward edges.
Along with wind speeds, a reduction in air temperature is also seen in the vicinity of the vegetation which acts as heat sinks. For centre type configuration (Figure 14, 1a, 1b, and 1c), the temperature in the core area of the sky garden is observed to be slightly lowered. The core of the tree shows the lowest temperatures of about 26.4–26 °C, a drop of 0.6–1 °C, which gradually increases in its wake.
What differs in each configuration is the relative spread of temperature drop and its pattern. The contours become more regular and evenly spread with decreasing height of sky garden and increasing width, following the air distribution pattern. Similarly, the temperature distribution in the corner configuration (Figure 14, 2a, 2b, and 2c) closely follows the air circulation pattern. The presence of recirculation and lull zones in this configuration leads to lower temperatures only being generated near the trees. It is observed that tree cores have temperatures in the range of 26.5 to 26 °C, occasionally even lower in some places. The reduction then continues backward, turning toward the leeward edge. Reductions of about 0.5–0.3 °C are observed in the wake of the vegetation, while near the walls, there is no observable temperature change, except in the lower sky gardens. In general, reduction in air temperatures is seen to increase with the width of the sky garden and decrease with height. It is localised on higher sky gardens while the contours are well spread in the lower ones, suggesting that lower wind speeds lead to higher temperature drops and an even spread of cooler air.
In the case of periphery configuration, most cooling is confined within the sides. The windward edge and the back leeward edge hardly see any temperature reductions except near the corners where vegetation is located. Air is deflected towards the sides when it hits the windward edge, causing the air to cool down there. Sides generate a low temperature drop with higher reductions near the vegetated corners. In fact, the illustrated contours in Figure 14 (3a), indicate that leeward corners are cooler than windward ones, with fairly well-spread temperature reductions. The tree cores on the leeward edges are 0.2–0.3 °C cooler than the ones on the windward edges.
Trees in the central sky garden configuration deflect the wind upward, the porous medium slowing down the air flow in its wake. According to the illustrated results (Figure 15 (1a, 1b, and 1c)) it can be ascertained that the vegetation has acted as buffer zones, attenuating the wind speed and creating calmer region near the floor. Velocities in the range 0 to 7 m/s are observed along the entire depth of the sky garden, except near the windward trees where higher velocities around 10 m/s are also encountered. The general air distribution pattern (centre configuration) is similar to the one observed earlier in sky gardens without trees. Winds from the lower sky garden deflects upward in the wake of the building while the wind from top sky garden deflect downwards.
Corner configuration shows a marginal reduction in wind speeds accompanied by change in the recirculation pattern. Speeds are primarily reduced near the vicinity of the vegetation and slightly in its wake. At the analysis plane, however, the speed of air is generally between 0 to 5 m/s, although a little higher at 7 m/s in Figure 15 (2a). Periphery configuration has no discernible change in its air distribution and wind speed, however, the speed in the sky garden is fairly low, around 1–2 m/s. Recirculation zones are found along the floor on the top sky garden and near the ceiling on the bottom sky garden. Multiple recirculation zones are observed in the middle sky garden
As with regards to air temperature along the vertical plane, a gradient is established along the length of the central and corner sky gardens, and along the height of the periphery sky garden. A small reduction in temperature is seen along the length of the central sky garden, Figure 16 (1a, 1b, and 1c), with higher reductions near the vegetation. Highest temperature drop occurs at the terminal edge, where the withdrawing air stream is slower near the floor and produces more cooling in the surrounding region. The recirculating air behind the building also aids in the process, localising the cooling effect with air temperature in the immediate wake of the leeward trees. In the top sky garden, the cooled air is drawn out straight ahead, while it settles down slightly in the case of middle sky garden. However, at the bottom sky garden, the air stream draws the cooled air upward.
In the corner configuration, it is observed that although the air temperature is reduced, it does not cover the entire depth of the sky garden; rather, it deflects towards the terminal edge. Also, the cooling is only observed near the proximity of the vegetation. Conversely, the temperature gradient is established vertically along the side edge of the periphery sky garden. Here, the cross-sectional plane for analysis is generated at the centre of the side edge of the sky garden instead of the windward edge, as is the case with other geometries. Again, the lower temperature air is concentrated near the leeward edge although some reduction in air temperature does occur near the windward vegetated corner.
The marginal decrease in air temperature, as observed from Figure 14 and Figure 16, indicates that the vegetation density, arrangement, and/or its volumetric power is not enough to cool the entire sky garden. It, nevertheless, is able to create a conducive environment in terms of wind comfort of the occupants. Figure 17 is a plot of velocity profile along the central longitudinal line of the sky gardens with and without trees to illustrate the effect of vegetation on trees.
In the central configuration (Figure 17d), the lower and middle sky gardens have high wind speeds in the range 9–12 m/s, which is of class D according to Lawson. This region is moderately acceptable in zones where people are expected to walk fast. Introduction of a row of trees in this configuration lowers the speeds to about ~4 m/s (class B) near the centre and ~7 m/s (class C) near the walls. The reduced winds in the centre favour activities ranging from strolling to sitting down for a while. Area near the walls, however, are favourable for walking and running activities. Speeds at the top sky garden in the range 5–9 m/s are reduced to 1–4 m/s with the introduction of trees. This, according to Lawson, is suitable for leisurely activity like sitting and strolling. Class B zones are seen near the edges and class A near the centre.
Figure 17e is a velocity profile plot for the corner type sky garden. It is observed here that the reduction in wind velocity is smaller compared to the central configuration. The top and bottom sky gardens demonstrate moderate velocity reduction while the middle sky garden has no discernible reductions. In fact, near the walls, the trees have created higher wind speeds at the middle sky garden. The top sky garden generates wind speeds of about ~7 m/s (class C, D) indicating suitable conditions for strolling and fast walking. The lower sky garden provides conditions for sedentary activities in the centre (class B) and ambulatory activity near the walls (class D).
The high speeds around the corners of the periphery configuration also generate highly reduced wind speeds, as can be visualized from Figure 17f. Regions up to one-fifth of the length of the sky garden from either side show a decrease in wind speeds with the introduction of trees on each of the three levels. The corners, which earlier belonged to class D, now demonstrate class A type wind conditions, favouring sedentary activities. A spike in the wind velocity at a short distance from the corner suggests that the spacing between the trees is not sufficient to keep it in check. Nevertheless, the speeds are under ~9 m/s, belonging to class B and C. At the centre, marginal changes are observed due to the absence of trees, however, the zone sees low wind speeds in the range 1–4 m/s, favouring sedentary activities like sitting and walking (class A and B).
As explained before, due to the fluctuating nature of wind direction, air flow was simulated to flow obliquely with respect to the building, covering all sides. Figure 18 and Figure 19 show velocity and temperature gradient, respectively, at the sky gardens 1b and 2b when wind flows obliquely to the building. The central sky garden illustrates a sharp velocity drop with the introduction of a row of tree at its windward and leeward edge. From the illustrated Figure 18 (1b at 0°, 1b at 45°) it is observed that speeds of about 10–15 m/s, which were classified as unsafe, show decreased speeds in the range 6–10 m/s with the addition of trees. The leeward edge in 1b at 45° illustrate speeds of about 9 m/s (class D), which gradually decreases to about 2 m/s (class A) towards the wall. When the wind is blown at 90° to the building (1b at 90°), the speeds are less than 1 m/s.
In the case of corner configuration, the row of trees is effective in decreasing wind speeds when it is blown orthogonal to any of the sides (2b at 0°, 2b at 90°). Quality class D, observed near the edges in sky garden 2b, generate calmer conditions of class C with the introduction of trees. The generated calmer conditions facilitate strolling and leisurely activities. There is, however, no observable difference with the introduction of trees to the corner configuration if the wind is blown at 45° angle to the building.
From the illustrated contours of temperature (Figure 19), it is evident that air temperatures are significantly reduced in areas with low wind velocity. The sky garden 1b shows maximum temperature drop when it faces away from the wind, limiting the air velocity flowing through it. A lower temperature drop is observed near the centre while a higher temperature drop is seen near the openings in the case of 1b at 90°. Similarly, the corner configuration also displays a higher reduction in air temperatures at locations where wind speeds are low, at the windward edges in cases 2b at 0° and 2b at 90°, and the central zone in 2b at 45°.
Figure 20 shows the temperature contours through the building with centre type sky garden, when the inlet speed is reduced. Clearly, it can be observed that the temperatures along the entire sky garden, on each level, has significantly reduced. The reduction is about double the original case near the centre.

5. Conclusions

This study evaluates the aero-thermal performance of high-rise sky gardens planted with trees using numerical modelling. High-rise buildings witness high wind speeds and can be unpleasant if allowed to blow unchecked over occupied semi-enclosed zones. The main findings indicate that wind speeds must be decreased to create conducive environments for the sky garden users. Lower speeds create safe wind conditions as well as enhance cooling from trees. The conclusions and recommendations drawn from the simulated results are presented below:
  • Vegetation, which resists air flow through them, can attenuate the high wind speeds in the sky garden to create a safe environment at occupants’ level. In the central configuration, the mid-height sky garden saw a reduction of nearly 77% in wind speeds at the centre, falling from ~9 m/s to 2 m/s. Similarly, in the periphery configuration, the speeds at the mid sky garden fell from 12 m/s to 2 m/s at the corner, with a reduction of over 80%.
  • Trees, apart from acting as buffers, also have the potential to cool the surrounding air within and outside the sky garden. Although a marginal decrease in air temperature is observed in the study based on the set conditions, it illustrates the potential of trees to cool the air in its wake.
  • Lower wind speeds further assist the vegetative cooling process of the surrounding air. Sky garden design should aim to reduce the high wind speeds for user wind comfort as well as higher temperature reductions through evapo-transpiration from vegetation. The convective heat losses from occupants is not accounted for in this study.
  • Tree density, including its porosity, plays a significant role in buffering the winds. Low porosity and high density will improve its performance. Closely spaced trees will further provide a better wind-breaking mechanism.
Future work can potentially look into the following aspects:
  • In an actual semi-enclosed space on a high-rise, there will be other elements apart from trees which could modify the air flow. The effect of such features, like parapets, furniture, mechanical devices, etc., could be the focus of future studies.
  • Modelling a detailed thermodynamic balance to accurately represent the interaction of leaves with the wind will give better estimates of the induced cooling around the trees. For the sake of simplicity, a constant volumetric cooling power was assumed in this study which was obtained by averaging the cooling capacity of a specific plant over the course of one year.
  • Comfort of occupants depends on a lot of parameters apart from wind and temperature. This includes humidity, solar radiation, acclimatization of people, etc. [50]. Future studies could investigate the thermal comfort of occupants on sky gardens, taking into account other factors as well that were not considered in this study.
  • Sky gardens come in a variety of shape and geometrical configuration, of which the most common types were studied here. A detailed study of the various existing forms and their assessment on air flow pattern remains to be investigated.
  • Given the large number of factors which has an impact on the performance of the sky garden, a sensitivity analysis could be undertaken to understand the relative contribution of each factor.
  • Air flow distribution and speeds at higher level above the user plane can be investigated with the idea to integrate renewables like wind turbine to take advantage of high wind speeds.

Supplementary Materials

The following are available online at https://www.mdpi.com/1996-1073/12/7/1380/s1.

Author Contributions

Conceptualization, J.K.C.; methodology, J.K.C.; software, M.M.; validation, M.M. and J.K.C.; formal analysis, M.M.; investigation, M.M.; resources, J.K.C.; data curation, M.M.; writing—original draft preparation, M.M.; writing—review and editing, J.K.C.; visualization, M.M.; supervision, J.K.C.; project administration, J.K.C.; funding acquisition, J.K.C.

Funding

This research received no external funding.

Acknowledgments

The authors would like to thank the support of the Department of Architecture and Built Environment for providing the facility for carrying out the modelling and simulations and the University of Nottingham for the Developing Solutions Scholarship.

Conflicts of Interest

The authors declare no conflict of interest.

Appendix A

Figure A1. Three different orientations of the building with respect to the inlet wind direction.
Energies 12 01380 g0a1
Figure A2. 2D Simulation domain to validate vegetation model; the green patch represents the implemented tree.
Energies 12 01380 g0a2
Figure A3. Region of analysis as performed by Manickathan et al. [29] and used for reference. Reproduced with permission from [29], Lento Manickathan, Thijs Defraeye, Jonas Allegrini, Dominique Derome, Jan Carmeliet, Agricultural and Forest Meteorology, Elsevier, 2018 (show in Supplementary Materials).
Energies 12 01380 g0a3

References

  1. Nooriati, T.; Aldrin, A.; Fadzil, S.S.; Foong, S.Y. An Assessment of Thermal Comfort and Users’ Perceptions of Landscape Gardens in a High-Rise Office Building. J. Sustain. Dev. 2010, 3, 153. [Google Scholar]
  2. Key World Energy Statistics 2017; International Energy Agency: Paris, France, 2017; p. 97.
  3. Wilby, R.L. A review of climate change impacts on the built environment. Built Environ. 2007, 33, 31–45. [Google Scholar] [CrossRef]
  4. Gonçalves, J.C.S. The Environmental Performance of Tall Buildings/Joana Carla Soares Gonçalves with Érica Mitie Umakoshi; Earthscan: London, UK, 2010; ISBN 978-1-84407-812-7. [Google Scholar]
  5. Firley, E.; Gimbal, J. The Urban Towers Handbook; Wiley: Hoboken, NJ, USA, 2011. [Google Scholar]
  6. Taha, H. Urban climates and heat islands: Albedo, evapotranspiration, and anthropogenic heat. Energy Build. 1997, 25, 99–103. [Google Scholar] [CrossRef]
  7. Gao, W. Thermal Effects of Open Space with a Green Area on Urban Environment: Part I: A theoretical analysis and its application. J. Archit. Plan. Environ. Eng. 1993, 448, 15–27. [Google Scholar]
  8. Yang, A.-S.; Juan, Y.-H.; Wen, C.-Y.; Chang, C.-J. Numerical simulation of cooling effect of vegetation enhancement in a subtropical urban park. Appl. Energy 2017, 192, 178–200. [Google Scholar] [CrossRef]
  9. Bruse, M.; Fleer, H. Simulating surface–plant–air interactions inside urban environments with a three dimensional numerical model. Environ. Model. Softw. 1998, 13, 373–384. [Google Scholar] [CrossRef]
  10. Dimoudi, A.; Nikolopoulou, M. Vegetation in the urban environment: Microclimatic analysis and benefits. Energy Build. 2003, 35, 69–76. [Google Scholar] [CrossRef]
  11. Tian, Y.; Jim, C.Y. Factors influencing the spatial pattern of sky gardens in the compact city of Hong Kong. Landsc. Urban Plan. 2011, 101, 299–309. [Google Scholar] [CrossRef]
  12. Ong, B.L. Green plot ratio: An ecological measure for architecture and urban planning. Landsc. Urban Plan. 2003, 63, 197–211. [Google Scholar] [CrossRef]
  13. Niu, J. Some significant environmental issues in high-rise residential building design in urban areas. Energy Build. 2004, 36, 1259–1263. [Google Scholar] [CrossRef]
  14. Sailor, D.J. A green roof model for building energy simulation programs. Energy Build. 2008, 40, 1466–1478. [Google Scholar]
  15. Tian, Y.; Jim, C.Y.; Tao, Y. Challenges and Strategies for Greening the Compact City of Hong Kong. J. Urban Plan. Dev. 2012, 138, 101–109. [Google Scholar] [CrossRef]
  16. Kosareo, L.; Ries, R. Comparative environmental life cycle assessment of green roofs. Build. Environ. 2007, 42, 2606–2613. [Google Scholar]
  17. Niu, J.L.; Burnett, J. Setting up the criteria and credit-awarding scheme for building interior material selection to achieve better indoor air quality. Environ. Int. 2001, 26, 573–580. [Google Scholar] [CrossRef]
  18. Turner, S.; Binnie, P.W.H. An indoor air quality survey of twenty-six (26) Swiss office buildings. Environ. Technol. 1990, 11, 303–314. [Google Scholar] [CrossRef]
  19. Hughes, B.R.; Calautit, J.K.; Ghani, S.A. The development of commercial wind towers for natural ventilation: A revie. Appl. Energy 2012, 92, 606–627. [Google Scholar] [CrossRef]
  20. Jomehzadeh, F.; Nejat, P.; Calautit, J.; Yusof, M.; Zaki, S.; Hughes, B.; Yazid, M. A review on windcatcher for passive cooling and natural ventilation in buildings. Part 1: Indoor air quality and thermal comfort assessment. Renew. Sustain. Energy Rev. 2017, 70, 736–756. [Google Scholar] [CrossRef]
  21. Calautit, J.K.; O’Connor, D.; Sofotasiou, P.; Hughes, B.R. CFD Simulation and Optimisation of a Low Energy Ventilation and Cooling System. Computation 2015, 3, 128–149. [Google Scholar] [CrossRef] [Green Version]
  22. Oberndorfer, E.; Lundholm, J.; Bass, B.; Coffman, R.R.; Doshi, H.; Dunnett, N.; Gaffin, S.; Köhler, M.; Liu, K.K.Y.; Rowe, B. Green Roofs as Urban Ecosystems: Ecological Structures, Functions, and Services. BioScience 2007, 57, 823–833. [Google Scholar] [CrossRef] [Green Version]
  23. Osmundson, T. Roof Gardens: History, Design, and Construction; W. W. Norton & Company: New York, NY, USA, 2000; ISBN 978-0-393-73012-8. [Google Scholar]
  24. Buildings Department Environmental Report; Hong Kong Building Department, Publications and Press Releases, 2010. Available online: https://www.bd.gov.hk/doc/en/resources/codes-and-references/notices-and-reports/env_reports/COER2010_eng.pdf (accessed on 25 July 2018).
  25. Launder, B.E. Turbulence Modelling for CFD. By D. C. WILCOX. DCW Industries Inc., 1993. J. Fluid Mech. 1995, 289, 406–407. [Google Scholar] [CrossRef]
  26. Kichah, A.; Bournet, P.-E.; Migeon, C.; Boulard, T. Measurement and CFD simulation of microclimate characteristics and transpiration of an Impatiens pot plant crop in a greenhouse. Biosyst. Eng. 2012, 112, 22–34. [Google Scholar] [CrossRef]
  27. Launder, B.; Spalding, D.B. The Numerical Computation of Turbulent Flow Computer Methods. Comput. Methods Appl. Mech. Eng. 1974, 3, 269–289. [Google Scholar] [CrossRef]
  28. Ansys 18.2 Documentation; Ansys: Canonsburg, PA, USA, 2017.
  29. Manickathan, L.; Defraeye, T.; Allegrini, J.; Derome, D.; Carmeliet, J. Parametric study of the influence of environmental factors and tree properties on the transpirative cooling effect of trees. Agric. For. Meteorol. 2018, 248, 259–274. [Google Scholar]
  30. Rahman, M.A.; Smith, J.G.; Stringer, P.; Ennos, A.R. Effect of rooting conditions on the growth and cooling ability of Pyrus calleryana. Urban For. Urban Green. 2011, 10, 185–192. [Google Scholar] [CrossRef]
  31. Gromke, C.; Blocken, B.; Janssen, W.; Merema, B.; van Hooff, T.; Timmermans, H. CFD analysis of transpirational cooling by vegetation: Case study for specific meteorological conditions during a heat wave in Arnhem, Netherlands. Build. Environ. 2015, 83, 11–26. [Google Scholar] [CrossRef]
  32. Amiro, B.D. Comparison of turbulence statistics within three boreal forest canopies. Bound-Layer Meteorol 1990, 51, 99–121. [Google Scholar] [CrossRef]
  33. Dauzat, J.; Rapidel, B.; Berger, A. Simulation of leaf transpiration and sap flow in virtual plants: Model description and application to a coffee plantation in Costa Rica. Agric. For. Meteorol. 2001, 109, 143–160. [Google Scholar]
  34. Sanz, C. A Note on k–ε Modelling of Vegetation Canopy Air-Flows. Bound. -Layer Meteorol. 2003, 108, 191–197. [Google Scholar] [CrossRef]
  35. Sonnenwald, F.; Stovin, V.; Guymer, I. Feasibility of the Porous Zone Approach to Modelling Vegetation in CFD. In Hydrodynamic and Mass Transport at Freshwater Aquatic Interfaces; Rowiński, P., Marion, A., Eds.; Springer International Publishing: Cham, Switzerland, 2016; pp. 63–75. ISBN 978-3-319-27749-3. [Google Scholar] [Green Version]
  36. Mochida, A.; Murakami, S.; Shoji, M.; Ishida, Y. Numerical Simulation of flowfield around Texas Tech Building by Large Eddy Simulation. J. Wind Eng. Ind. Aerodyn. 1993, 46–47, 455–460. [Google Scholar]
  37. Franke, J.; Hirsch, C.; Jensen, A.G.; Krüs, H.W.; Schatzmann, M.; Westbury, P.S.; Miles, S.D.; Wisse, J.A.; Wright, N.G. Recommendations on the Use of CFD in Wind Engineering. 2004. Available online: https://www.kuleuven.be/bwf/projects/annex41/protected/data/Recommendations%20for%20CFD%20in%20wind%20engineering.pdf (accessed on 25 July 2018).
  38. Huang, S.; Li, Q.S.; Xu, S. Numerical evaluation of wind effects on a tall steel building by CFD. J. Constr. Steel Res. 2007, 63, 612–627. [Google Scholar] [CrossRef]
  39. Tominaga, Y.; Mochida, A.; Murakami, S.; Sawaki, S. Comparison of various revised k–ε models and LES applied to flow around a high-rise building model with 1:1:2 shape placed within the surface boundary layer. J. Wind Eng. Ind. Aerodyn. 2008, 96, 389–411. [Google Scholar] [CrossRef]
  40. Agerneh, K.D.; Bitsuamalk, G.T.; Merrick, R. Computational Evaluation of Wind Pressures on Tall Buildings. In Proceedings of the 11th Americas Conference on Wind Engineering, San Juan, Puerto Rico, 22–26 June 2009. [Google Scholar]
  41. Revuz, J. Numerical Simulation of the Wind Flow around a Tall Building and Its Dynamic Response to Wind Excitation. Ph.D. Thesis, University of Nottingham, Nottingham, UK, 2011. [Google Scholar]
  42. Pomeroy, J. The Skycourt and Skygarden: Greening the Urban Habitat/Jason Pomeroy; Routledge: Abingdon, UK, 2014; ISBN 978-0-415-63698-8. [Google Scholar]
  43. Carter, T.; Keeler, A. Life-cycle cost–benefit analysis of extensive vegetated roof systems. J. Environ. Manag. 2008, 87, 350–363. [Google Scholar] [CrossRef] [PubMed]
  44. Yang, J.; Yu, Q.; Gong, P. Quantifying air pollution removal by green roofs in Chicago. Atmos. Environ. 2008, 42, 7266–7273. [Google Scholar]
  45. Richards, P.J.; Norris, S.E. Appropriate boundary conditions for computational wind engineering models revisited. J. Wind Eng. Ind. Aerodyn. 2011, 99, 257–266. [Google Scholar] [CrossRef]
  46. Braun, A.L.; Awruch, A.M. Aerodynamic and aeroelastic analyses on the CAARC standard tall building model using numerical simulation. Comput. Struct. 2009, 87, 564–581. [Google Scholar] [CrossRef]
  47. Neufert, E.; Neufert, P. Architects’ Data, 3rd ed.; Baiche, B., Walliman, N., Eds.; Blackwell Science: Oxford, UK; Malden, MA, USA, 2000; ISBN 978-0-632-03776-6. [Google Scholar]
  48. Wind Comfort and Wind Danger in the Built Environment. Available online: https://infostore.saiglobal.com/en-gb/standards/nen-8100-2006-356708/ (accessed on 27 August 2018).
  49. Lawson, T.V. The wind content of the built environment. J. Wind Eng. Ind. Aerodyn. 1978, 3, 93–105. [Google Scholar] [CrossRef]
  50. Givoni, B.; Noguchi, M.; Saaroni, H.; Pochter, O.; Yaacov, Y.; Feller, N.; Becker, S. Outdoor comfort research issues. Energy Build. 2003, 35, 77–86. [Google Scholar] [CrossRef]
Figure 1. (a) Computational domain and location of the building; (b) top view; (c) front view; (d) side view.
Energies 12 01380 g001
Figure 2. Spatial dimensions of the modelled high-rise building with sky gardens (dimension in metres).
Energies 12 01380 g002
Figure 3. Inlet velocity profile used in the present study.
Energies 12 01380 g003
Figure 4. Sky gardens model and plan showing tree arrangement; (a) typical plan of central type, (b) simulation model of central type, (c) typical plan of corner type, (d) simulation model of corner type, (e) typical plan of periphery type, (f) simulation model of periphery type.
Energies 12 01380 g004
Figure 5. Mesh design; (a) unstructured plan view, (b) structured plan view, (c) unstructured side view, (d) structured side view.
Energies 12 01380 g005
Figure 6. (a) Location of the line at which CP was analysed; (b) direction of CP evaluation, normalized by building depth; (c) contours of CP on building face of models 1b and 2b; (d) comparison of CP between present work and previous studies.
Energies 12 01380 g006
Figure 7. (a) Wind speed along the direction of the inlet; (b) wind speed across the inlet direction; location of vegetation is shown in green in both cases.
Energies 12 01380 g007
Figure 8. Velocity contours at different heights for different sky garden configurations; (1a) Central sky garden b/B = 0.4, (1b) Central sky garden b/B = 0.6, (1c) Central sky garden b/B = 0.8, (2a) Corner sky garden b/B = 0.4, (2b) Corner sky garden b/B = 0.6, (2c) Corner sky garden b/B = 0.8, (3a) Periphery sky garden a/A = 0.5.
Energies 12 01380 g008
Figure 9. Pressure contours at different heights for different sky garden configurations; (1a) Central sky garden b/B = 0.4, (1b) Central sky garden b/B = 0.6, (1c) Central sky garden b/B = 0.8, (2a) Corner sky garden b/B = 0.4, (2b) Corner sky garden b/B = 0.6, (2c) Corner sky garden b/B = 0.8, (3a) Periphery sky garden a/A = 0.5.
Energies 12 01380 g009
Figure 10. Turbulence intensity at different sky garden heights; (1a) Central sky garden b/B = 0.4, (1b) Central sky garden b/B = 0.6, (1c) Central sky garden b/B = 0.8, (2a) Corner sky garden b/B = 0.4, (2b) Corner sky garden b/B = 0.6, (2c) Corner sky garden b/B = 0.8, (3a) Periphery sky garden a/A = 0.5.
Energies 12 01380 g010
Figure 11. Velocity vectors along the cross-sectional plane; (1a) Central sky garden b/B = 0.4, (1b) Central sky garden b/B = 0.6, (1c) Central sky garden b/B = 0.8, (2a) Corner sky garden b/B = 0.4, (2b) Corner sky garden b/B = 0.6, (2c) Corner sky garden b/B = 0.8, (3a) Periphery sky garden a/A = 0.5.
Energies 12 01380 g011
Figure 12. Velocity map in sky gardens when the wind is at an oblique angle to the building; (1b) Central sky garden b/B = 0.6 at 0°, 45° and 90° wind angle, (2b) Corner sky garden b/B = 0.6 at 0°, 45° and 90° wind angle.
Energies 12 01380 g012
Figure 13. Velocity contour, at a height of 1.4 m, of the sky gardens with trees; (1a) Central sky garden b/B = 0.4, (1b) Central sky garden b/B = 0.6, (1c) Central sky garden b/B = 0.8, (2a) Corner sky garden b/B = 0.4, (2b) Corner sky garden b/B = 0.6, (2c) Corner sky garden b/B = 0.8, (3a) Periphery sky garden a/A = 0.5.
Energies 12 01380 g013
Figure 14. Temperature contour in the sky garden with trees, at a height of 1.4 m; (1a) Central sky garden b/B = 0.4, (1b) Central sky garden b/B = 0.6, (1c) Central sky garden b/B = 0.8, (2a) Corner sky garden b/B = 0.4, (2b) Corner sky garden b/B = 0.6, (2c) Corner sky garden b/B = 0.8, (3a) Periphery sky garden a/A = 0.5.
Energies 12 01380 g014
Figure 15. Cross sectional velocity vector through the sky garden centre; (1a) Central sky garden b/B = 0.4, (1b) Central sky garden b/B = 0.6, (1c) Central sky garden b/B = 0.8, (2a) Corner sky garden b/B = 0.4, (2b) Corner sky garden b/B = 0.6, (2c) Corner sky garden b/B = 0.8, (3a) Periphery sky garden a/A = 0.5.
Energies 12 01380 g015
Figure 16. Temperature contour along a vertical plane through the centre of sky garden; (1a) Central sky garden b/B = 0.4, (1b) Central sky garden b/B = 0.6, (1c) Central sky garden b/B = 0.8, (2a) Corner sky garden b/B = 0.4, (2b) Corner sky garden b/B = 0.6, (2c) Corner sky garden b/B = 0.8, (3a) Periphery sky garden a/A = 0.5.
Energies 12 01380 g016
Figure 17. Location of centreline for analysis at: (a) Central sky garden; (b) corner sky garden, and (c) periphery sky garden; velocity profile along the centreline of (d) central sky garden; (e) corner sky garden; and (f) periphery sky garden.
Energies 12 01380 g017
Figure 18. Velocity gradient at sky gardens with trees with oblique wind direction; (1a) Central sky garden b/B = 0.4, (1b) Central sky garden b/B = 0.6, (1c) Central sky garden b/B = 0.8, (2a) Corner sky garden b/B = 0.4, (2b) Corner sky garden b/B = 0.6, (2c) Corner sky garden b/B = 0.8, (3a) Periphery sky garden a/A = 0.5.
Energies 12 01380 g018
Figure 19. Temperature gradient at sky garden with trees when wind flows obliquely to the building; (1a) Central sky garden b/B = 0.4, (1b) Central sky garden b/B = 0.6, (1c) Central sky garden b/B = 0.8, (2a) Corner sky garden b/B = 0.4, (2b) Corner sky garden b/B = 0.6, (2c) Corner sky garden b/B = 0.8, (3a) Periphery sky garden a/A = 0.5
Energies 12 01380 g019
Figure 20. Air temperature around the sky garden with reduced inlet velocity.
Energies 12 01380 g020
Table 1. Domain sizes from relevant tall building computational fluid dynamics (CFD) simulation.
StudyDomain SizeBuilding
l (front + X + back)b (side + B + side)hH (mts)
Mochida et al. [36]10.8H6.9H5.6H0.16
Franke et al. [37]5H + X + 15H5H + B + 5HH + 5H
Huang et al. [38]1.5H + X + 5.5H2H + B + 2H2H183
Tominaga et al. [39]5H + X + 10H5H + B + 5HH + 5H
Agarneh et al. [40]8B + X + 25B 2H182
Revuz [41]5B + X + 30B13B + B + 13B2.5H
Present study5B + X + 10B5B + B + 5B2H80
Table 2. Seven spatial configurations of sky garden designed and modelled in the study.
RatioCentral Sky Garden
b/B0.40.60.8
Energies 12 01380 i001 Energies 12 01380 i002 Energies 12 01380 i003
1a1b1c
Corner sky Garden
b/B0.40.60.8
Energies 12 01380 i004 Energies 12 01380 i005 Energies 12 01380 i006
2a2b2c
Periphery Sky Garden
a/A 0.5
Energies 12 01380 i007
3a
Table 3. Computational mesh size implemented for the sky garden model.
ParameterCentral Sky GardenCorner Sky GardenPeriphery Sky Garden
1a1b1c2a2b2c3a
Nodes444,103453,350461,077428,637433,783439,328434,676
Elements2,372,6112,422,8942,465,4612,292,6382,318,8952,348,7222,324,585
Table 4. Mesh sizing used for building model validation.
ParameterUnstructured GridStructured Grid
1a1b1c1d2a2b2c2d
Nodes269,743536,188747,0871,318,186318,324475,661756,1141,462,334
Elements1,455,4792,876,8924,033,9417,244,4421,712,8222,518,2233,970,2207,648,310
Table 5. Wind speed classification based on pedestrian comfort, after Lawson.
Threshold of Wind SpeedQuality ClassOriginal DescriptionReference Activity
U > 1.8 m/sACovered areaSitting long
U > 3.6 m/sBPedestrian stand aroundSitting short
U > 5.3 m/sCPedestrian walk throughStrolling
U > 7.6 m/sDRoads and car parksWalking fast
U > 15 m/sEDangerousUnacceptable

