Abstract
Additional energy demand is needed to accomplish the mega-projects of the Belt & Road Initiative (BRI). As energy consumption is one of the prime determinants of environmental degradation, the present study investigates the impact of energy inequalities on environmental degradation along with financial development. The entropy approach is applied to quantify the three energy consumption inequalities; average, between, and total energy consumption inequality respectively. The energy consumption inequality of BRI economies follows an uprising temporal trend. The estimates reveal that East Asia and South Asia have the highest and lowest energy consumption inequality among the BRI regions. Within regions, it is found that Central Asia has the lowest, and East Asia has the highest energy inequality among the BRI regions, respectively. Based on bootstrapping, the generalized least square (GLS) is applied to quantify the impact of energy consumption inequalities on environmental degradation along financial development. The energy inequalities have a statistically positive impact on environmental degradation in BRI regions, East Asia, Central Asia, the Middle East and North African region (MENA), and Southeast Asia respectively. In contrast, South Asian economies are sustaining environmental quality despite the energy consumption inequalities. Financial development also has a significantly major impact on environmental degradation in BRI, and its regions except for Central Asia, and MENA.
1. Introduction
China officially used the term the “One Belt and One Road initiative (BRI)” in 2015, containing 65 economies around the globe [1,2]. The National Development and Reform Commission, as well as the Ministries of Commerce, and Foreign Affairs of China publicly announced BRI visions to integrate industrial cooperation containing 65 countries from all over the world [2]. 57 out of 65 of these countries had already signed the articles of agreement of the Asian Infrastructure Investment Bank for official banking service among the BRI region [2]. BRI economies have a 30%, 38.5%, and 62.3% share of global gross domestic product (GDP), land area, and population respectively [1,2,3]. An adequate level of energy is required to achieve the maximum level of output because energy is an essential feature for nurturing all development processes [3,4]. Rapid economic growth leads to an increase in energy use, which has a negative impact on the environment [5]. In the modern world, industrial expansion creates additional demand for energy to fulfil capital intensive growth requirements and modern business operations [3]. According to the World Bank, the world energy consumption increased by nearly 1.43% in 2015, while China was consuming energy at an increased rate of 1.04% [6]. The patterns of energy consumption in BRI are compiled by using the World Development Indicators database [6]. Figure 1 depicts a temporal increasing trend in average energy consumption of the BRI region. The regional energy consumption of BRI economies is presented in Figure 2. It indicates that Europe, South Asia and Southeast Asian economies of BRI have less volatility in their regional energy consumption pattern. MENA economies follow a decreasing energy consumption pattern within the region. East Asia depicts a rapidly increasing energy consumption pattern due to the Chinese economy, as China is the second largest global economy.
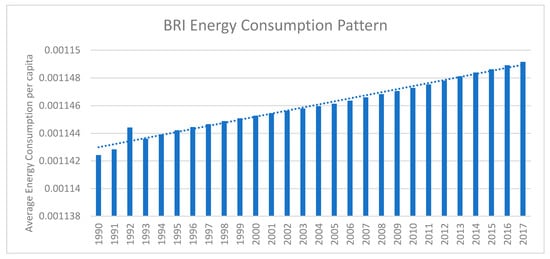
Figure 1.
Pattern of Energy Consumption in BRI.
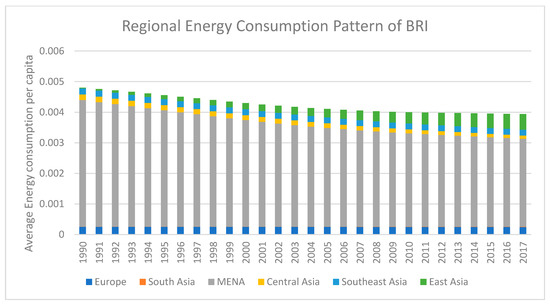
Figure 2.
Regional Patterns of Energy Consumption in BRI.
On the other hand, BRI economies require energy to start mega-projects, which increases air pollutants and environmental degradation [3,7]. The average energy consumption is increasing environmental degradation in Europe. By contrast, energy consumption inequalities are decreasing environmental degradation in South Asian economies. Hence, environmental degradation is also an important matter of concern and is directly linked to energy consumption [8]. Energy demands mostly depend on energy use, including renewable and non-renewable energy sources, and affect the environmental quality in major ways by increasing the risk of catastrophes and terrible damages (disasters) [9,10]. As for economic growth, a higher level of energy is required for present and upcoming material needs. An increase in energy demand is a direct cause of carbon dioxide (CO2) emissions, which lead to environmental degradation and other environmental problems [5,9,10]. CO2 emissions, which account for 75% of greenhouse gases, are a major contributor to global warming and climate change worldwide [11].
Effective financial policy is necessary concerning energy consumption to achieve sustainable development [1,12]. The financial sector of the world experienced a 5.61% growth rate in 2017 [1,6]. The role of financial markets is significant as many researchers argued that financial development encourages us to reduce energy consumption and investment in energy efficiency, mobilization and use of saving, source monitoring and to improve environmental quality [13,14]. Financial development includes providing foreign direct investment by increasing banking activities, stock markets domestic credits, cost loans and by promoting newly innovated technology and via the adoption of new financial development technologies which can increase energy efficiency [15,16]. Financial development allows consumers to get cheaper loans to buy consumer goods and creates energy demand due to the expansion of household consumption [1,17,18]. Several researchers have given significant focus to investigating the relationship between energy consumption, environmental degradation and economic growth but financial development is still inadequately investigated in the case of BRI. Some of the studies have analyzed the relationship between energy and income growth [15,19,20,21,22,23], while the remaining studies have tested the EKC hypothesis by examining the relationship between environmental degradation and GDP [1,24,25,26]. Some studies also investigated energy consumption, carbon emissions, and economic growth linkages but did not incorporate the financial development indicators [27,28,29].
Although BRI is getting attention around the globe, many of its participating countries are still considering its impacts on areas such as environmental degradation, income, and finance while seeking to catch up on the path of sustainable development. The BRI region contains 24% of global household consumption [1,2]. Transport infrastructure integration among BRI countries is the core objective of BRI to enable the free flow of economic benefits and to optimize resource allocation along the markets that are integrated [2]. The China International Trade Institute also mentioned that industrial cooperation will be created among BRI economies [2]. BRI also promotes financing and banking services through the Asian Infrastructure Investment Bank. Due to these circumstances, it will create an increase in energy consumption, and potential energy markets because of its dynamic role in the economy, thereby increasing economic growth and sustainable development [4]. BRI economies make up 42.8% of world energy consumption [2,6]. Energy consumption enhances environmental degradation with respect to eight air pollution indicators [7]. Sustaining rapidly growing energy consumption, and energy market is one of the prime hurdles to achieving BRI goals. Consequently, energy inequality can be an important instrument for predicting energy consumption patterns. Therefore, there is a dire need to investigate the energy inequality and environmental degradation-financial development nexus within BRI and its regions. The contribution of the study is three-fold. Firstly, the aspiration of the study is to reveal the regional disparities of energy consumption. It also spotlights the impact of energy inequalities on environmental degradation along with financial development. Energy inequalities with respect to the population of BRI and its region, are computed through entropy (Theil’s index). Secondly, it is tested whether regional, intra-regional or total energy inequality affect environmental degradation. Lastly, the study also explores the impact of financial development on environmental degradation.
The empirical findings will be helpful for understanding energy consumption and developing a green economy. The temporal quantification of the energy inequalities with respect to population differ in BRI regions. Understanding these differences will contribute to energy and environmental policy formulations. Therefore, regional energy inequality is an essential instrument to understand energy consumption within and across the BRI region. Furthermore, energy consumption is directly linked to economic development and the environment. Regional energy inequality and financial development also enlighten the regional response of environmental degradation to devise better eco-friendly and energy policies.
2. Materials and Methods
2.1. Data and Empirical Strategy
The BRI contains 2, 5, 8, 11, 15, and 24 countries from East Asia, Central Asia, South Asia, Southeast Asia, Middle East and North Africa (MENA), and Europe respectively [1,2]. The present paper also takes into account the classification of countries by the China International Trade Institute in the BRI region [1,2]. The panel of selected economies from BRI, are reported in Table 1. Due to data availability, the sample-set of study incorporates 46 economies; 2, 3, 5, 8, 12, and 16 from East Asia, Central Asia, South Asia, Southeast Asia, MENA, and Europe respectively. The time span of sample-set is from 1990 to 2017. The dataset is retrieved from the World Development Indicators (WDI) on energy consumption, population, CO2 emission, and financial development indicators respectively [6]. A detailed description of variables is provided in Table 2.

Table 1.
BRI regions and Economies.

Table 2.
Variable Description.
2.2. BRI’s Panel Correlation Analysis
The BRI correlation matrix is reported in Table 3. The environmental degradation, financial development indicators (FD2, FD3) are positively associated with average and total energy inequality respectively. Meanwhile, the first financial indicator (FD1) is negatively correlated with average energy inequality and indicates that the financial sector considers pollution regulation and green investment while giving domestic credit. The financial indicators are highly correlated with each other. Thus, PCA (principal components analysis) is applied to construct a financial development index to avoid the issue of multi-collinearity and estimate robustness [30]. The results of the PCA are reported in Table 4. Eigenvalues point out that the first component is explaining the 93.14% standard variation in dependent variable as compared to other components. Thus, the first component is most relevant to construct the financial development index. The factor loading provides the 55.5%, 58.8%, and 58.7% standard variation of the first component from FD1, FD2, and FD3 respectively. These factors loading are used as the weight to measure the composite financial development index (FinDev).

Table 3.
Panel correlation analysis of the BRI region.

Table 4.
PCA analysis.
2.3. Energy Inequalities Quantification
In information theory, information can be extracted from random variables through “Entropy” [31]. To measure uncertain information the entropy (E) can be quantified by where is the probability of an event happened for i= 1, 2, 3,…, N and often considered a yardstick for measuring uncertainty information from random variables [31,32]. Theil proposed the inequality measure to compute the difference of variables having unique distributions [31,32]. The Theil index provides the information inequality (disparity) of random variables of two different distributions [30,31]. The probability of an outcome indicates the information inequality among two distributions sooner and later taking the information into account. The Theil index also spotlights that the previous distribution does contain enough information to predict the post-distribution [32,33].
By following references [32,34,35,36,37,38,39,40,41,42], the present study states the cross-entropy (Et) at time “t” for information inequality as follows:
where and are the “ith” economy’s sooner and later probabilities in time “t” respectively; i = 1,2,3…..N, and t = 1,2,3…….t. The probability sum of and is 1 and non-negative [33]. The probabilities of and can be replaced by Shares of and as these shares also follow and validate probability properties. In energy economics, entropy can be quantified through the economic variables share to compute their distribution inequalities [34,35,36,37,38,39,40,41,42].
is used to investigate energy consumption inequality in regional distributions of BRI of energy consumption (EC) with respect to population. Suppose that the energy consumption shares of “i” economy in a specific region at time “t” can be calculated as follows:
In Equation (2), indicates the energy consumption of economy “i” in time “t” while is the sum of energy consumption of economies of BRI at time “t”. Likewise, the population share of “i” economy in a specific region at time “t” can be calculated as follows:
In Equation (3), indicates the population of the economy “i” in time “t” while is the sum of population of economies of BRI at time “t”. The cross-entropy of energy consumption index can be denoted as follows:
Equation (4) denotes energy consumption inequality. The approaches zero if differences in per capita energy consumption between BRI economies decrease, while if the difference in per capita energy consumption between BRI economies arises then will approach infinity. In simple words, if population share encompasses enough information to predict energy consumption share then energy consumption inequality will converge to zero, otherwise it will increase and approaches infinity, which depicts less information for forecasting energy consumption share.
The total energy consumption inequality (At) of BRI can be measured through inequalities of within- BRI regions (“Wt”) and between BRI regions (“Bt”). Let a region (“r”) of BRI contain many economies that have comparable energy consumption patterns. If an economy located in “r” region for = 1990, 1991……2017 (R ≤ N), then inequalities of (“Wt”) and (“Bt”) can be quantified as follows:
In Equations (5) and (6), energy consumption share, and population share of region “r” is stated as , and . respectively. The “At” is the sum of (“Wt”) and (“Bt”) inequalities and stated in Equation (7) as follows:
In Equation (7), the average (“Wt”) entropy is the weighted aggregation of (“Wt”) and quantifies energy consumption inequality within economies of BRI in region “r” while (“Bt”) computes the inequality between regions of BRI. In light of consumption inequalities, we check whether the BRI regional disparities in energy consumption are linked with the environmental degradation-financial development nexus. By adopting the approach of references [35,38], the econometric model is presented in Equation (8) as follows:
In Equation (8), = environmental degradation, = set of energy consumption inequalities [, = financial development, , “i” = BRI economies = 1,2,…46, and “t”=time= 1990,1991,……2017. The Equation (8) is computed by utilizing bootstrapping generalized least square (GLS) modeling to tackle the normality and heteroskedasticity among the BRI regions. The empirical estimates will elaborate on the effect of regional energy consumption inequalities on the environmental degradation-financial development nexus for the BRI region.
3. Empirical Results
3.1. Energy Inequality Analysis
BRI contains 6 regions; East Asia, Central Asia, South Asia, Southeast Asia, MENA, and Europe (See, Table 1). The energy inequality of BRI economies is calculated by utilizing Equation (4). The computed range of energy inequality in BRI region, is 0.002497 (0.2497 percent) to 0.002581 (0.2581 percent). It has the highest average energy per capita inequality in 2016–2017. The energy inequality index of the BRI region has sustained its values at around 0.0025 (0.25 percent) until 2008, then it followed an increasing trend. The energy inequality dynamics show that the BRI region has a deviation of energy consumption in production, consumption, income level, and climate condition across its economies. By using Equation (4), in Figure 3, the energy inequalities within BRI regions are illustrated. The lower index value of energy inequality demonstrates the subsistence of less energy consumption difference among economies within a BRI region and vice versa. The BRI energy inequality index demonstrates an increasing trend. South Asia has the lowest energy inequality among the BRI regions. European and Southeast Asian economies of BRI have minor and major energy inequalities within regions, respectively. The central Asian and MENA economies are following a declining trend in energy inequalities among themselves, respectively. On the other side, East Asia has higher energy inequality within the region over time because China has a much larger economy compared to Mongolia.
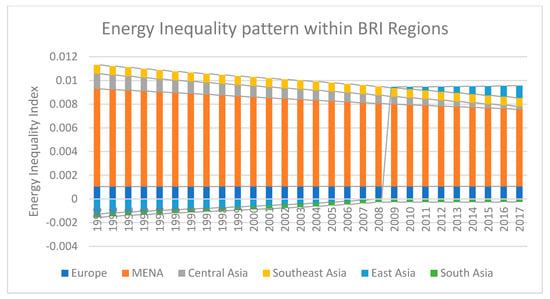
Figure 3.
Energy Inequalities within BRI Regions.
3.2. Pareto analysis
Pareto analysis is also conducted to elaborate the energy inequalities range difference in BRI and its 6 regions. It is illustrated in Figure 4. The MENA region has the highest energy inequality range difference among the BRI regions while BRI itself is the second largest among its regions with respect to energy inequality range. Europe, South Asia, and Central Asia are ranked as 3rd, 4th, and 5th respectively. While, South Asian economies of BRI has the lowest energy inequality index value ranging from “−0.0002864” to “−0.0002587” due to their population growth.
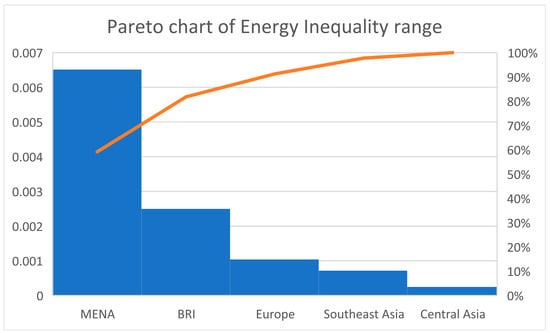
Figure 4.
Pareto analysis.
By applying the Equation (5), insightful estimates are reported in Figure 5. Figure 5 reveals the energy inequality of BRI between the regions. Central Asia has the lowest energy consumption disparity among the BRI regions. European and Southeast Asian economies of BRI have a normal level of disparity between the BRI regions. South Asian economies of BRI follow an increasing energy consumption disparity over time between the BRI regions. In contrast, MENA economies follow a declining trend in energy consumption disparity between the BRI regions. Obviously, East Asia, due to China, has the highest energy consumption disparity between the BRI regions over time.
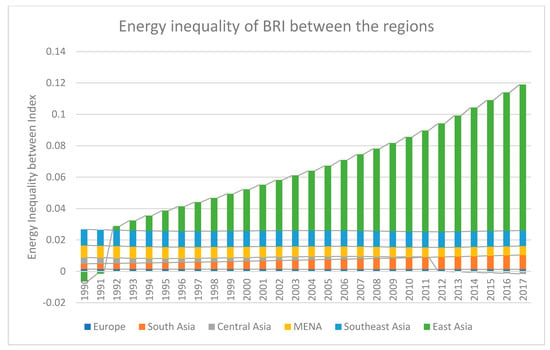
Figure 5.
Energy Inequality of BRI between the regions.
Furthermore, the pattern of average total energy inequality over time, is illustrated in Figure 6. The total energy disparity traces the temporal divergence across the BRI regions due to the higher energy consumption level of China. The minimum average value of total energy inequality is −0.0012 (−0.12 percent), and −0.0076 (−0.76 percent) in Central Asia, and East Asia respectively. There is an uprising temporal tendency in BRI’s total energy inequality. In BRI regions, Central Asia has the lowest total energy inequality while East Asia has the highest total energy inequality due to the higher economy volume and population size of China. Southeast Asia also indicated an increasing trend in total energy inequality over time but this started to decline in 2016, and 2017. Total energy inequality in MENA economies was increasing until 2008 and then followed a declining path. European economies of BRI followed a normal variation in total energy inequality. South Asian economies of BRI experienced an growing trend in total energy inequality due to energy demand and increasing population size, especially in Bangladesh, Pakistan, and India.
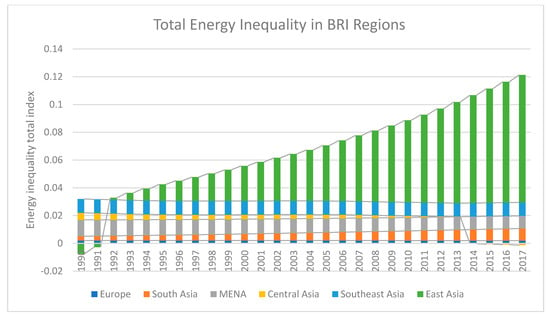
Figure 6.
Total Energy Inequality in BRI regions.
3.3. Impact of Energy Inequalities and Financial Development on Environmental Degradation
To estimate the impact of energy inequalities on environmental degradation-financial development, the generalized least square (GLS) method is applied to compute the empirical estimates for Eq. 8 based on the bootstrapping method. The regional estimates of average, between regions, and total energy consumption inequality for BRI are presented in Table 5 and Table 6 respectively. In BRI economies, it is found that energy inequality has a statistically positive impact on environmental degradation in M1 (average energy consumption inequality model), M2 (between regions energy consumption inequality model), and M3 (total energy consumption inequality model), respectively. Energy consumption inequalities have a positive significant impact on environmental degradation in East Asia, Central Asia, MENA, and Southeast Asia due to additional energy consumption [1,10].

Table 5.
Results of BRI Energy Inequalities.

Table 6.
Results of BRI Energy Inequalities.
Based on the bootstrapping method, GLS estimated results are reported in Table 4. It found that financial development also has a major impact on environmental degradation in all estimated models. Financial development is significantly enhancing the environmental degradation along-side energy consumption inequalities in East Asia, Europe, South Asian, and Southeast Asia while it has an insignificant impact on environmental degradation in the case of Central Asia, and MENA economies.
4. Results and Discussion
From the energy inequality index, it inferred that BRI has a temporal increasing trend in the average consumption of energy inequality. In the regional context, Pareto analysis figures out that MENA, and BRI are ranked 1st and 2nd with respective to energy disparity range among the regions respectively. Energy consumption inequality is rapidly increasing within East Asia over time due to Chinese economic expansion. Meanwhile, East Asia and South Asia demonstrate a temporal increasing pattern in between the regions and total energy consumption inequality respectively, since these regions have a larger population size due to countries like Bangladesh, China, India, and Pakistan. In contrast, MENA, and Central Asia show a declining trend in between the regions and total energy consumption inequality respectively.
The average energy consumption inequality (EI) has a substantial major influence on environmental degradation in case of BRI, and its 6 regions. The EI of East and Central Asian countries have a greater up-surging effect on environmental degradation as compared to other regions. However, energy consumption inequality between the regions (BEI) also has a statistically positive impact on environmental degradation in the case of BRI, and its regions except for MENA and South Asia. In European economies, only EI is increasing environmental degradation. The European Environment Agency (EEA) has indicated that air pollutants emissions have declined dramatically in recent decades due to environmental regulations.
The total energy consumption inequality (TEI) is also significantly increasing the environmental degradation in BRI, East Asia, Central Asia, MENA, Southeast Asia respectively but is not doing so for Europe and South Asia. This infers that energy inequalities accrue environmental degradation as shown in the study of reference [7], which also showed that energy consumption enhances air pollution indicators. Non-renewable and total energy consumption is increasing CO2 emissions [43,44].
In contrast, energy consumption inequalities have a deteriorating effect on environmental degradation in South Asian economies since these economies have successfully implemented the “Environmental Acts”, and strategies for sustainable development [45]. Due to the Environmental Acts, South Asia is implanting modern and eco-friendly technologies for production, which ultimately improve the state of the environment [15,16,45,46,47]. South Asian countries mostly rely on primary industries and agricultural export, which are smaller global warming determinants. An increment in value added for agriculture leads to a decline in CO2 emissions [48]. As another possibility, South Asian countries are utilizing hydro and nuclear projects to produce energy that produces less CO2 emissions [47,49].
In the presence of EI, financial development (FinDev) has a statistically positive impact on environmental degradation in case of BRI, Europe, and Asian regions except for Central Asia. In MENA, and Central Asia, financial development does not affect environmental degradation along EI. In the presence of BEI, environmental degradation is enhanced by financial development of BRI, East Asia, Europe, South Asia, and Southeast Asia respectively. In the presence of TEI, financial development is significantly increasing environmental degradation in BRI and in its regions except for Central Asia and South Asia. The first interpretation for financial development having a positive impact on environmental degradation is the easy access of capital, and investment for production from the financial and banking sectors, respectively [1,2]. The second reason is that rapid investment creates demand for additional energy consumption through higher volumes of vehicles, machinery, refrigerators, and air conditioners [1,10].
5. Conclusions and Policy Implications
The BRI region is experiencing rapid growth in population and energy consumption as the BRI region contains 24%, 42.8%, and 62.3% of global household consumption, energy consumption, and population respectively. The production methods related to energy are inflating the energy inequalities in the BRI region. Thus, the present study unveils to what extent the population is affecting the dynamics in energy inequalities in BRI, and within BRI regions respectively to provide insightful information for policy development. It also highlights the inter, and intra energy inequality among BRI and its regions respectively.
The energy consumption inequalities are computed by using the state of the art “Theil’s entropy” method. Central Asian and MENA economies are following a declining trend in energy inequalities among themselves respectively. However, East Asia has experienced higher energy inequality within the region over time. South Asia has the lowest energy inequality among the BRI regions. Within regions, the model found that Central Asia has the lowest energy inequality, and East Asia has the highest among the BRI regions respectively. South Asian and MENA show temporal increases, and a declining trend in energy consumption disparity between the BRI regions respectively. Furthermore, the total energy disparity traces the temporal divergence across the BRI regions due to the higher energy consumption level of China.
The GLS based on bootstrapping is applied to quantify the impact of energy consumption inequalities on environmental degradation along financial development. The energy inequalities have a statistically positive impact on environmental degradation in BRI, East Asia, Central Asia, MENA, and Southeast Asia respectively. In MENA, total energy consumption inequality enhances the environmental degradation at a higher rate due to oil exporting countries within the region. In contrast, energy consumption inequalities are reducing environmental degradation in the case of the South Asian economies. Moreover, energy consumption inequalities have an insignificant impact on European environmental degradation. Financial development also has a significantly positive impact on environmental degradation in BRI, and its regions except for Central Asia, and MENA in average, between the regions, and total energy consumption inequality models respectively.
Based on empirical findings, the study proposes three managerial policy implications. Firstly, the BRI, and its regions like South Asia, can actively participate in adopting eco-friendly and modern technologies, which can be helpful to enhance energy efficiency and bring a downturn in environmental degradation. Secondly, the BRI, and its region having a significantly positive impact on energy consumption inequalities regarding environmental degradation, could be active in replacing non-renewable energy consumption with renewable energy consumption, which emits less CO2 emissions in the environment. Lastly, the quantification of energy inequalities is applicable to maintain balance in regional energy consumption inequality within BRI and its regions. These policies can target the higher energy consumption inequalities in BRI regions to balance additional energy demand. Thus, the current paper suggests strategically-guiding principles concerning energy consumption, environmental combat, and sustainable development.
Author Contributions
Conceptualization, M.H.; methodology, M.H. and I.K.; formal analysis, M.H. and L.J.; investigation, A.S.N.O.; writing—original draft preparation, M.H.; writing—review and editing, M.W.A., and I.K.; supervision, C.Y.
Funding
This research received no external funding.
Conflicts of Interest
The authors declare no conflict of interest.
References
- Hafeez, M.; Chunhui, Y.; Strohmaier, D.; Ahmed, M.; Jie, L. Does finance affect environmental degradation: Evidence from One Belt and One Road Initiative region? Environ. Sci. Pollut. Res. 2018, 25, 9579–9592. [Google Scholar] [CrossRef] [PubMed]
- Fung Business Intelligence Centre. The Belt and Road Initiative: 65 Countries and Beyond. 2016. Available online: https://www.fbicgroup.com/?q=reports&page=4 (accessed on 15 March 2019).
- Rauf, A.; Liu, X.; Amin, W.; Ozturk, I.; Rehman, O.U.; Hafeez, M. Testing EKC hypothesis with energy and sustainable development challenges: A fresh evidence from Belt and Road Initiative economies. Environ. Sci. Pollut. Res. 2018, 25, 1–15. [Google Scholar] [CrossRef]
- Belke, A.; Dobnik, F.; Dreger, C. Energy consumption and economic growth: New insights into the cointegration relationship. Energy Econ. 2011, 33, 782–789. [Google Scholar] [CrossRef]
- Hossain, S. An econometric analysis for CO2 emissions, energy consumption, economic growth, foreign trade and urbanization of Japan. Low Carbon Econ. 2012, 3, 92–105. [Google Scholar] [CrossRef]
- World Bank. World Development Indicator. 2017. Available online: http://data.worldbank.org/ (accessed on 20 March 2017).
- Yasmeen, R.; Li, Y.; Hafeez, M. Tracing the trade–pollution nexus in global value chains: Evidence from air pollution indicators. Environ. Sci. Pollut. Res. 2019, 26, 5221–5233. [Google Scholar] [CrossRef]
- Nassani, A.A.; Aldakhil, A.M.; Abro, M.M.Q.; Zaman, K. Environmental Kuznets curve among BRICS countries: Spot lightening finance, transport, energy and growth factors. J. Clean. Prod. 2017, 154, 474–487. [Google Scholar] [CrossRef]
- Yan, X.; Crookes, R.J.D. Energy demand and emissions from road transportation vehicles in China. Prog. Energy Combust. Sci. 2010, 36, 651–676. [Google Scholar] [CrossRef]
- Zhang, M.; Li, H.; Zhou, M.; Mu, H. Decomposition analysis of energy consumption in Chinese transportation sector. Appl. Energy 2011, 88, 2279–2285. [Google Scholar] [CrossRef]
- IPCC. IPCC Fifth Assessment Synthesis Report-Climate Change 2014 Synthesis Report; Synthesis Report; IPCC: Geneva, Switzerland, 2014; p. 167.
- Kahouli, B. The short and long run causality relationship among economic growth, energy consumption and financial development: Evidence from South Mediterranean Countries (SMCs). Energy Econ. 2017, 68, 19–30. [Google Scholar] [CrossRef]
- Khan, M.T.I.; Yaseen, M.R.; Ali, Q. Dynamic relationship between financial development, energy consumption, trade and greenhouse gas: Comparison of upper middle income countries form Asia, Europe, Africa and America. J. Clean. Prod. 2017, 161, 567–580. [Google Scholar] [CrossRef]
- Tamazian, A.; Chousa, J.P.; Vadlamannati, K.C. Does higher economic and financial development lead to enviromental degradation: Evidence from BRIC countries. Energy Policy 2009, 37, 246–253. [Google Scholar] [CrossRef]
- Nasreen, S.; Anwar, S.; Ozturk, I. Financial stability, energy consumption and environmental quality: Evidence from South Asian economies. Renew. Sustain. Energy Rev. 2017, 67, 1105–1122. [Google Scholar] [CrossRef]
- Komal, R.; Abbas, F. Linking financial development, economic growth and energy consumption in Pakistan. Renew. Sustain. Energy Rev. 2015, 44, 211–220. [Google Scholar] [CrossRef]
- Salahuddin, M.; Gow, J.; Ozturk, I. Is the long-run between economic growth, electricity consumption, carbon dioxide emissions and financial development in Gulf Cooperation Council Countries robust? Renew. Sustain. Energy Rev. 2015, 51, 317–326. [Google Scholar] [CrossRef]
- Claessens, S.; Feijen, E. Financial Sector Development and the Millennium Development Goals; Work Bank Working Paper: Washington, DC, USA, 2006; Volume 89, pp. 1–106. [Google Scholar]
- Csereklyei, Z.; Rubio Varas, M.d.M.; Stern, D.I. Energy and economic growth: The stylized facts. Energy J. 2016, 37, 223–255. [Google Scholar] [CrossRef]
- Jobert, T.; Karanfil, F. Sectoral energy consumption by source and economic growth in Turkey. Energy Policy 2007, 35, 5447–5456. [Google Scholar] [CrossRef]
- Lise, W.; Montfort, K.V. Energy consumption and GDP in Turkey: Is there a cointegration relationship? Energy Econ. 2007, 27, 1166–1178. [Google Scholar] [CrossRef]
- Odhiambo, N.M. Energy consumption and economic growth nexus in Tanzania: An ARDL bounds testing approach. Energy Policy 2009, 37, 617–622. [Google Scholar] [CrossRef]
- Rezitis, A.N.; Ahammad, S.M. The relationship between energy consumption and economic growth in south and Southeast Asian countries: A panel vector auto regression approach and causality analysis. Int. J. Energy Econ. Policy 2015, 5, 704–715. [Google Scholar]
- Coondoo, D.; Dinda, S. Causality between income and emission: A country group specific econometric analysis. Ecol. Econ. 2002, 40, 351–367. [Google Scholar] [CrossRef]
- Luzzati, T.; Orsini, M. Natural environment and economic growth: Looking for the energy-EKC. Energy 2009, 34, 291–300. [Google Scholar] [CrossRef]
- Say, N.P.; Yucel, M. Energy consumption and CO2 emissions in Turkey: Empirical analysis and future projection based on an economic growth. Energy Policy 2006, 34, 3870–3876. [Google Scholar] [CrossRef]
- Richmond, A.K.; Kaufmann, R.K. Is there a turning point in the relationship between income and energy use and/or carbon emissions? Ecol. Econ. 2006, 56, 176–189. [Google Scholar] [CrossRef]
- Lean, H.H.; Smyth, R. CO2 emissions, electricity consumption and output in ASEAN. Appl. Energy 2010, 87, 1858–1864. [Google Scholar] [CrossRef]
- Heidari, H.; Katircioğlu, S.T.; Saeidpour, L. Economic growth, CO2 emissions, and energy consumption in the five ASEAN countries. Int. J. Electr. Power Energy Syst. 2015, 64, 785–791. [Google Scholar] [CrossRef]
- Creane, S.; Goyal, R.; Mobarak, A.M.; Sab, R. Financial Development and Economic Growth in the Middle East and North Africa Finance and Development; A Quarterly Magazine of the IMF: 4 No. 1; International Monetary Fund: Washington, DC, USA, 2003. [Google Scholar]
- Shannon, C.E. A Mathematical Theory of Communication. Bell Syst. Tech. J. 1948, 27, 379–423. [Google Scholar] [CrossRef]
- Theil, H. Economics and Information Theory; North Holland: Amsterdam, The Netherlands, 1967. [Google Scholar]
- Theil, H. The Development of International Inequality 1960–1985. J. Econ. 1989, 42, 145–155. [Google Scholar] [CrossRef]
- Salois, M.J. Regional Changes in the Distribution of Foreign Aid: An Entropy Approach. Phys. A 2013, 392, 2893–2902. [Google Scholar] [CrossRef]
- Mishra, A.K.; Livanis, G.T.; Moss, C.B. Did the Federal Agriculture Improvement and Reform Act of 1996 Affect Farmland Values? Entropy 2011, 13, 668–682. [Google Scholar] [CrossRef]
- Salois, M.J.; Moss, C.B. An Information Approach to the Dynamics in Farm Income: Implications for 286 Farmland Markets. Entropy 2010, 13, 38–52. [Google Scholar] [CrossRef]
- Xu, H.Y.; Kuo, S.H.; Li, G.; Legara, E.F.T.; Zhao, D.; Monterola, C.P. Generalized Cross Entropy Method for Estimating Joint Distribution from Incomplete Information. Phys. A 2016, 453, 162–172. [Google Scholar] [CrossRef]
- Bourguignon, F. Decomposable Income Inequality Measures. Econometrica 1979, 47, 901–920. [Google Scholar] [CrossRef]
- Bourguignon, F.; Morrisson, C. Inequality among World Citizens. Am. Econ. Rev. 2002, 92, 727–744. [Google Scholar] [CrossRef]
- Maasoumi, E.; Racine, J. Entropy and Predictability of Stock Market Returns. J. Econ. 2002, 107, 291–312. [Google Scholar] [CrossRef]
- Salois, M.J.; Moss, C.B.; Erickson, K. FarmIncome, Population and Farmland Prices: A Relative Information Approach. Eur. J. Agric. Econ. 2012, 39, 289–307. [Google Scholar] [CrossRef]
- Theil, H. World Income Inequality and Its Components. Econ. Lett. 1979, 2, 99–102. [Google Scholar] [CrossRef]
- Shafiei, S.; Salim, R.A. Non-renewable and renewable energy consumption and CO2 emissions in OECD countries: A comparative analysis. Energy Policy 2014, 66, 547–556. [Google Scholar] [CrossRef]
- Tang, C.F.; Tan, B.W. The impact of energy consumption, income and foreign direct investment on carbon dioxide emissions in Vietnam. Energy 2015, 79, 447–454. [Google Scholar] [CrossRef]
- Khwaja, M.A.; Umer, F.; Shaheen, N.; Sherazi, A.; Shaheen, F.H. Air Pollution Reduction and Control in South Asia; Sustainable Development Policy Institute: Islamabad, Pakistan, 2012. [Google Scholar]
- Iwata, H.; Okada, K.; Samreth, S. Empirical study on the environmental Kuznets curve for CO2 in France: The role of nuclear energy. Energy Policy 2010, 38, 4057–4063. [Google Scholar] [CrossRef]
- Iwata, H.; Okada, K.; Samreth, S. A note on the environmental Kuznets curve for CO2, a pooled mean group approach. Appl. Energy 2011, 88, 1986–1996. [Google Scholar] [CrossRef]
- Ben Jebli, M.; Ben Youssef, S. The role of renewable energy and agriculture in reducing CO2 emissions: Evidence for North Africa countries. Ecol. Indic. 2017, 74, 295–301. [Google Scholar] [CrossRef]
- Dong, K.; Sun, R.; Jiang, H.; Zeng, X. CO2 emissions, economic growth, and the environmental Kuznets curve in China: What roles can nuclear energy and renewable energy play? J. Clean. Prod. 2018, 196, 51–63. [Google Scholar] [CrossRef]
© 2019 by the authors. Licensee MDPI, Basel, Switzerland. This article is an open access article distributed under the terms and conditions of the Creative Commons Attribution (CC BY) license (http://creativecommons.org/licenses/by/4.0/).