Article

A Techno-Economic Analysis of a PV-Battery System in Greece

by
Ioannis E. Kosmadakis
,
Costas Elmasides
*,
Dimitrios Eleftheriou
and
Konstantinos P. Tsagarakis
Department of Environmental Engineering, Democritus University of Thrace, 67100 Xanthi, Greece
*
Author to whom correspondence should be addressed.
Energies 2019, 12(7), 1357; https://doi.org/10.3390/en12071357
Submission received: 26 February 2019 / Revised: 23 March 2019 / Accepted: 27 March 2019 / Published: 9 April 2019
(This article belongs to the Section A2: Solar Energy and Photovoltaic Systems)

Abstract

:
A techno-economic assessment has been carried out to evaluate the economic feasibility of energy self-consumption from a combination of photovoltaics and lead-acid batteries (PV-BAT). The Total annual economic cost (TAEC) and the cost per unit of energy were first calculated, from PV-BAT data collected over a 12 month period and then from energy system model data for the same period. A comparison of the actual renewable energy yield to optimal model output revealed that energy was restrained partially due to limited storage resources. The cost per kilowatt-hour for the two examined scenarios ranged from 0.55 to 0.62 €/kWh and from 0.42 to 0.46 €/kWh, respectively, showing room for further cost reductions. Despite currently lower energy purchasing costs from electricity providers, these findings constitute a significant price indication of the kilowatt-hour produced by PV-BAT, showing the need for further investigation into how battery sizing can be optimized and battery cost can be reduced.

1. Introduction

The world wealth is driven by the energy sector, considering that economic growth is positively related to higher energy use [1]. At the same time, the effective integration of a blend of renewables into the existing energy mix is necessary in order to alleviate global warming [2]. Harvesting supplementary renewable energy from hybrid power systems (HPS) or photovoltaics and lead-acid battery (PV-BAT) systems is highly associated with the system supply costs and power availability. Design, control, and operation of these systems are related to its efficiency and thus to economic sustainability. Control and optimization strategies are essential to resolve issues such as the relatively small lifespan of the necessary lead acid batteries [3,4] or the diversion of renewable energy surplus due to limited storage resources [5,6,7]. Such strategies, if effective, will not only increase performance but will also reduce the cost of each kilowatt-hour produced, creating sustainable conditions for integration into the electicity market in the future. Shaw-Williams et al. [8] showed that currently, conventional photovoltaics (PV) systems are still more profitable than battery combinations. However, with increasing penetration levels of PV-BAT systems, considerable network benefits arise and collaborative actions such as demand management are needed to fully exploit the reserve capacity of residential PV-BAT systems. Shaikh et al. [9] investigated a comparative analysis between a lead-acid battery supported wind-PV system and a gasoline generator system and showed a marginal economic superiority of the former due to the environmental friendliness of that system. Alharthi et al. [10] showed that hybrid system capacity factor increase is possible when wind-power is added to a hybrid power system with the proviso of adequate wind potential at the location of the installation. Aderemi et al. [11] assessed the financial feasibility of energy autonomy for a mobile cellular base station and confirmed, through simulations, environmental and economical advantages of the PV-BAT systems over the PV-BAT combinations with generator support.
PV electricity system prices have dropped by over 80% in the last 10 years, and in a growing number of markets, electricity cost from PV is already cheaper than residential retail electricity [12]. In Greece, the number of installations increased between 2006 and 2013, mainly due to a favorable market environment involving simple permitting processes and generous feed-in-tariffs, as specified by the legal framework at that time [13]. Due to subsequent regulations, in 2012 and then again in 2014, PV penetration progressed rather slowly from then onwards despite the fact that in 2015, new legislation was enacted that promoted energy offsetting applications (net metering and variations) from PV auto-producers without electrical energy storage (EES). According to the Hellenic Electricity Distribution Network Operator (HEDNO), the installed capacity from these applications in continental Greece and the interconnected islands had reached 42.35 MWp in 2018. By October 2018, the total installed photovoltaic capacity in Greece reached 2472.6 MWp, 351.3 MWp of which were installed on rooftops [14].
Electricity from PV systems can also be stored for later use in systems such as battery banks. Coupling batteries to PV systems favors direct electricity use at the installation site, as that electricity production is offset to match consumption. Like PVs, storage battery costs are expected to fall in the years to come [15,16,17]. With cheaper PVs and batteries on the one hand and an upward trend in electricity prices on the other hand, self-consumption is becoming sustainable and thus, encouraging further auto-producers.
Although there are no data on the installed power of stand-alone hybrid systems in continental Greece, large scale hybrid energy systems based on a variety of renewable energy sources and EES systems have been deployed on five Greek islands, namely Crete, Rodos, Tilos, Lesvos, and Ikaria, and mainly from 2010 onwards. According to HEDNO, the total installed capacity of these non-interconnected islands is 877.86 MW, 807.35 MW of which are installed on the island of Crete.
As technology improves PV costs fall [15]. Cost estimation based on widely used variables is an essential step for assessing the sustainability of energy production systems. Towards this direction, we study an energy production system consisting of a combination of polycrystalline photovoltaics and lead acid batteries that have been tested in real conditions in order to calculate the cost per kWh produced. To calculate the unit cost of energy, the most established approach is to refer to the levelized cost of energy (LCOE) [15,18] or the total annual economic cost (TAEC) [15,19]. By adding environmental externalities [20], the cost of energy may differ and favor renewables compared to energy from fossil fuels. In this study, we evaluate the cost of the PV-BAT system and undertake a risk analysis. The aim of this work is to use an established methodology to calculate the cost of unit energy produced (in €/kwh), so that the system is comparable with other solar renewable energy systems or conventional fossil fuel energy systems. Since solar based systems are heavily based on sunshine, we consider this as an uncertainty factor to calculate energy cost production ranges.

2. Materials and Methods

This section consists of three parts. Initially, the technical details of the PV-BAT system are analyzed, followed by the energy monitoring and control protocol. Then, the cost calculation methodology is presented.

2.1. Description of the PV-BAT System

Figure 1 illustrates the direct current (DC) coupled PV-BAT combination studied in this work, similar to the setup employed in [4]. A rooftop PV installation consisting of 6 PV modules with a total capacity of 1590 Wp provides the electrical power necessary to partially cover the consumption on the alternating current (AC) grid and to store energy to a battery bank consisting of 24 lead-acid 2-volt cells. The cells have a nominal capacity of 150 Ah and are connected in series, resulting in a total nominal voltage of 48 Volt.
Fluctuations in energy production due to intermittent solar energy are addressed by using the lead-acid batteries and an energy management system (EMS), which ensures that the batteries are always protected and efficiently utilized.
Power electronics and the operating principle of this hybrid system have been extensively described by Kosmadakis and Elmasides [4].
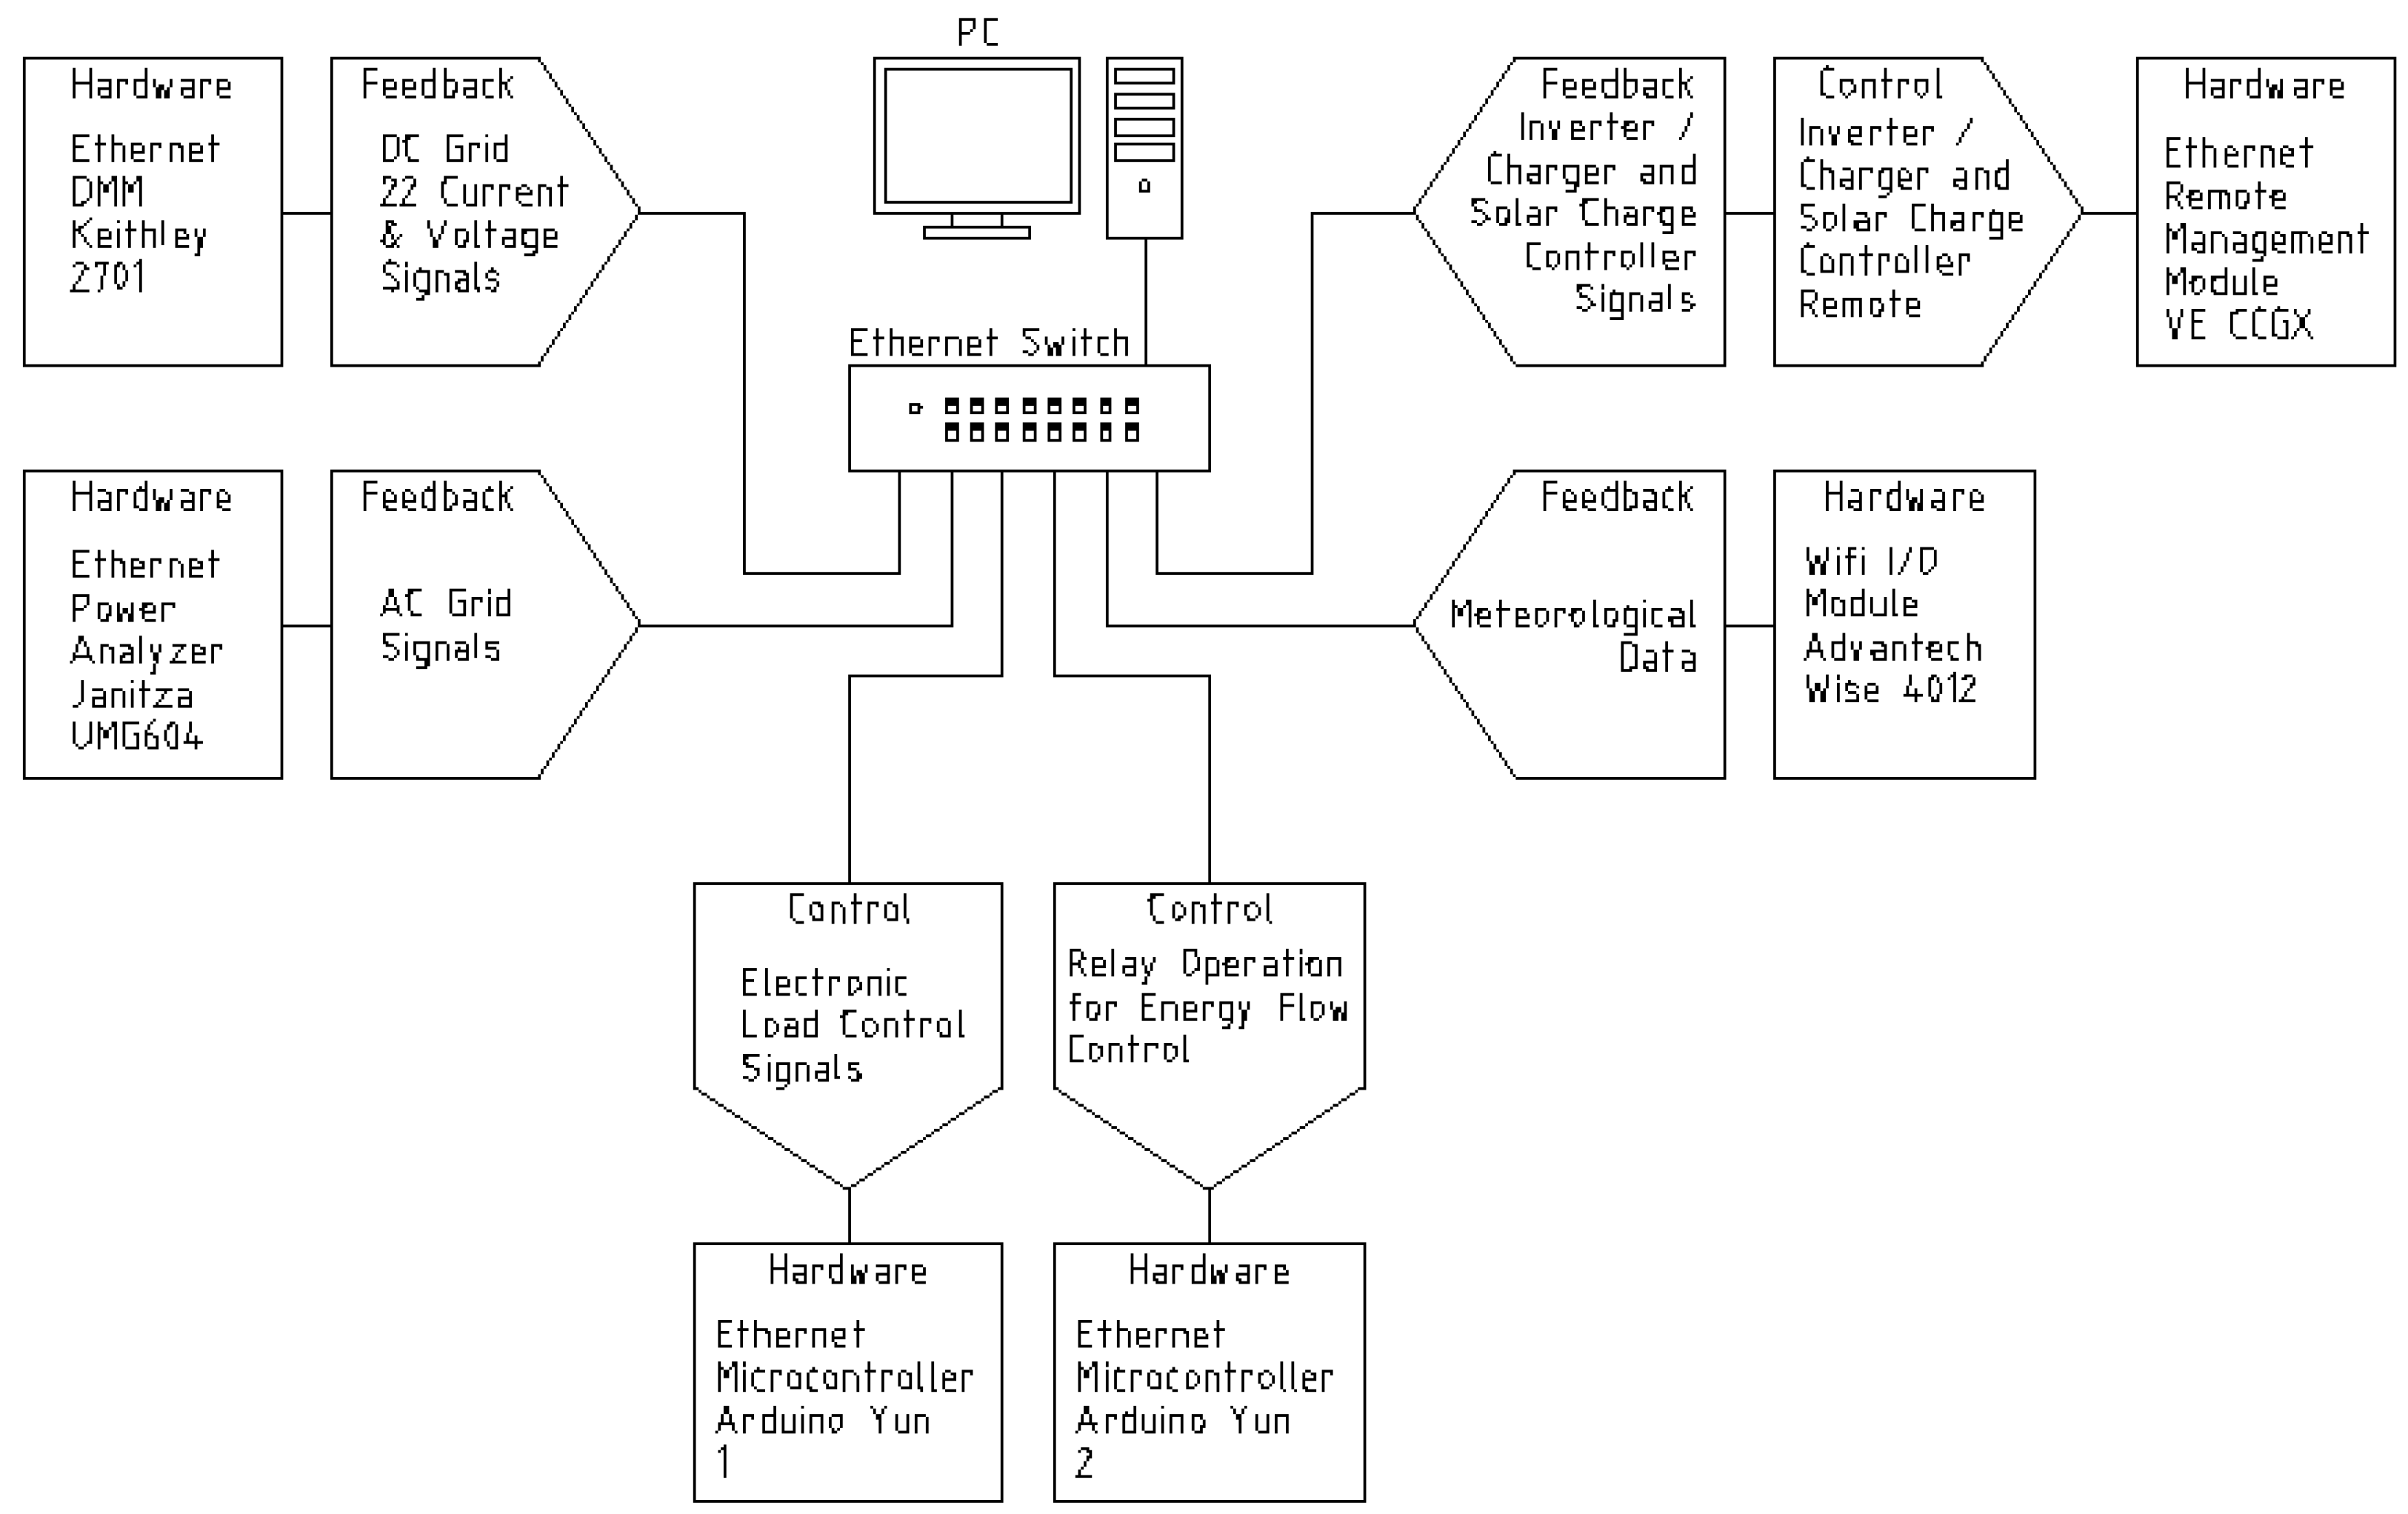
The proper measuring and controlling energy flows in any hybrid power system are essential for achieving high system efficiency and reliability. The system is supervised over ethernet by a computer program written in Python, complying with a centralized control structure.
The EMS monitors all electrical signals from every resource of the PV-BAT system on a 2-minute basis. Given predetermined objectives, appropriate actions are taken in real-time, depending on the sampled data. Measurement and control instrumentation shown in Figure 2 have also been thoroughly described by Kosmadakis and Elmasides [4].

2.2. Energy Output

Measurements of global horizontal irradiance (GHI) were acquired every 2 minutes at the PV installation with a pyranometer (Li-Cor LI200). The direct normal irradiance (DNI) and diffuse horizontal irradiance (DHI) were computed using the direct insolation simulation code (DISC) model from [4,21,22].
With fixed tilt PV-surface and PV-array azimuth angles of approximately 28 and 170 degrees, respectively, the calculation of the angle of solar incidence (AOI) becomes a function of the current solar position with respect to system latitude–longitude–altitude. The ground reflectivity, known as Albedo, was used as a constant of 0.3 in our case.
The calculated total solar irradiance incident (Epoa) was fed to the Sandia cell and module temperature model [23] together with measurements of wind speed and atmospheric temperature taken at the PV installation in order to compute the temperatures of the PV cell (Tc) and the PV module (Tm).
Subsequently, estimations of the photo current (IL), the diode reverse saturation current (I0), the series resistance (Rs), the shunt resistance (Rsh), and the modified diode ideality factor (nNsVth), also described in [4], were obtained after initializing the five-parameter model [20] with the details from the PV manufacturers datasheet and the aforementioned Epoa, Tc, and Tm calculations.
The five parameters were channeled afterwards as inputs to the PV single diode model [24,25,26], from which I-V curves and module output were calculated. PV power output estimations were further optimized considering losses due to PV module reflectivity and charge controller efficiency.
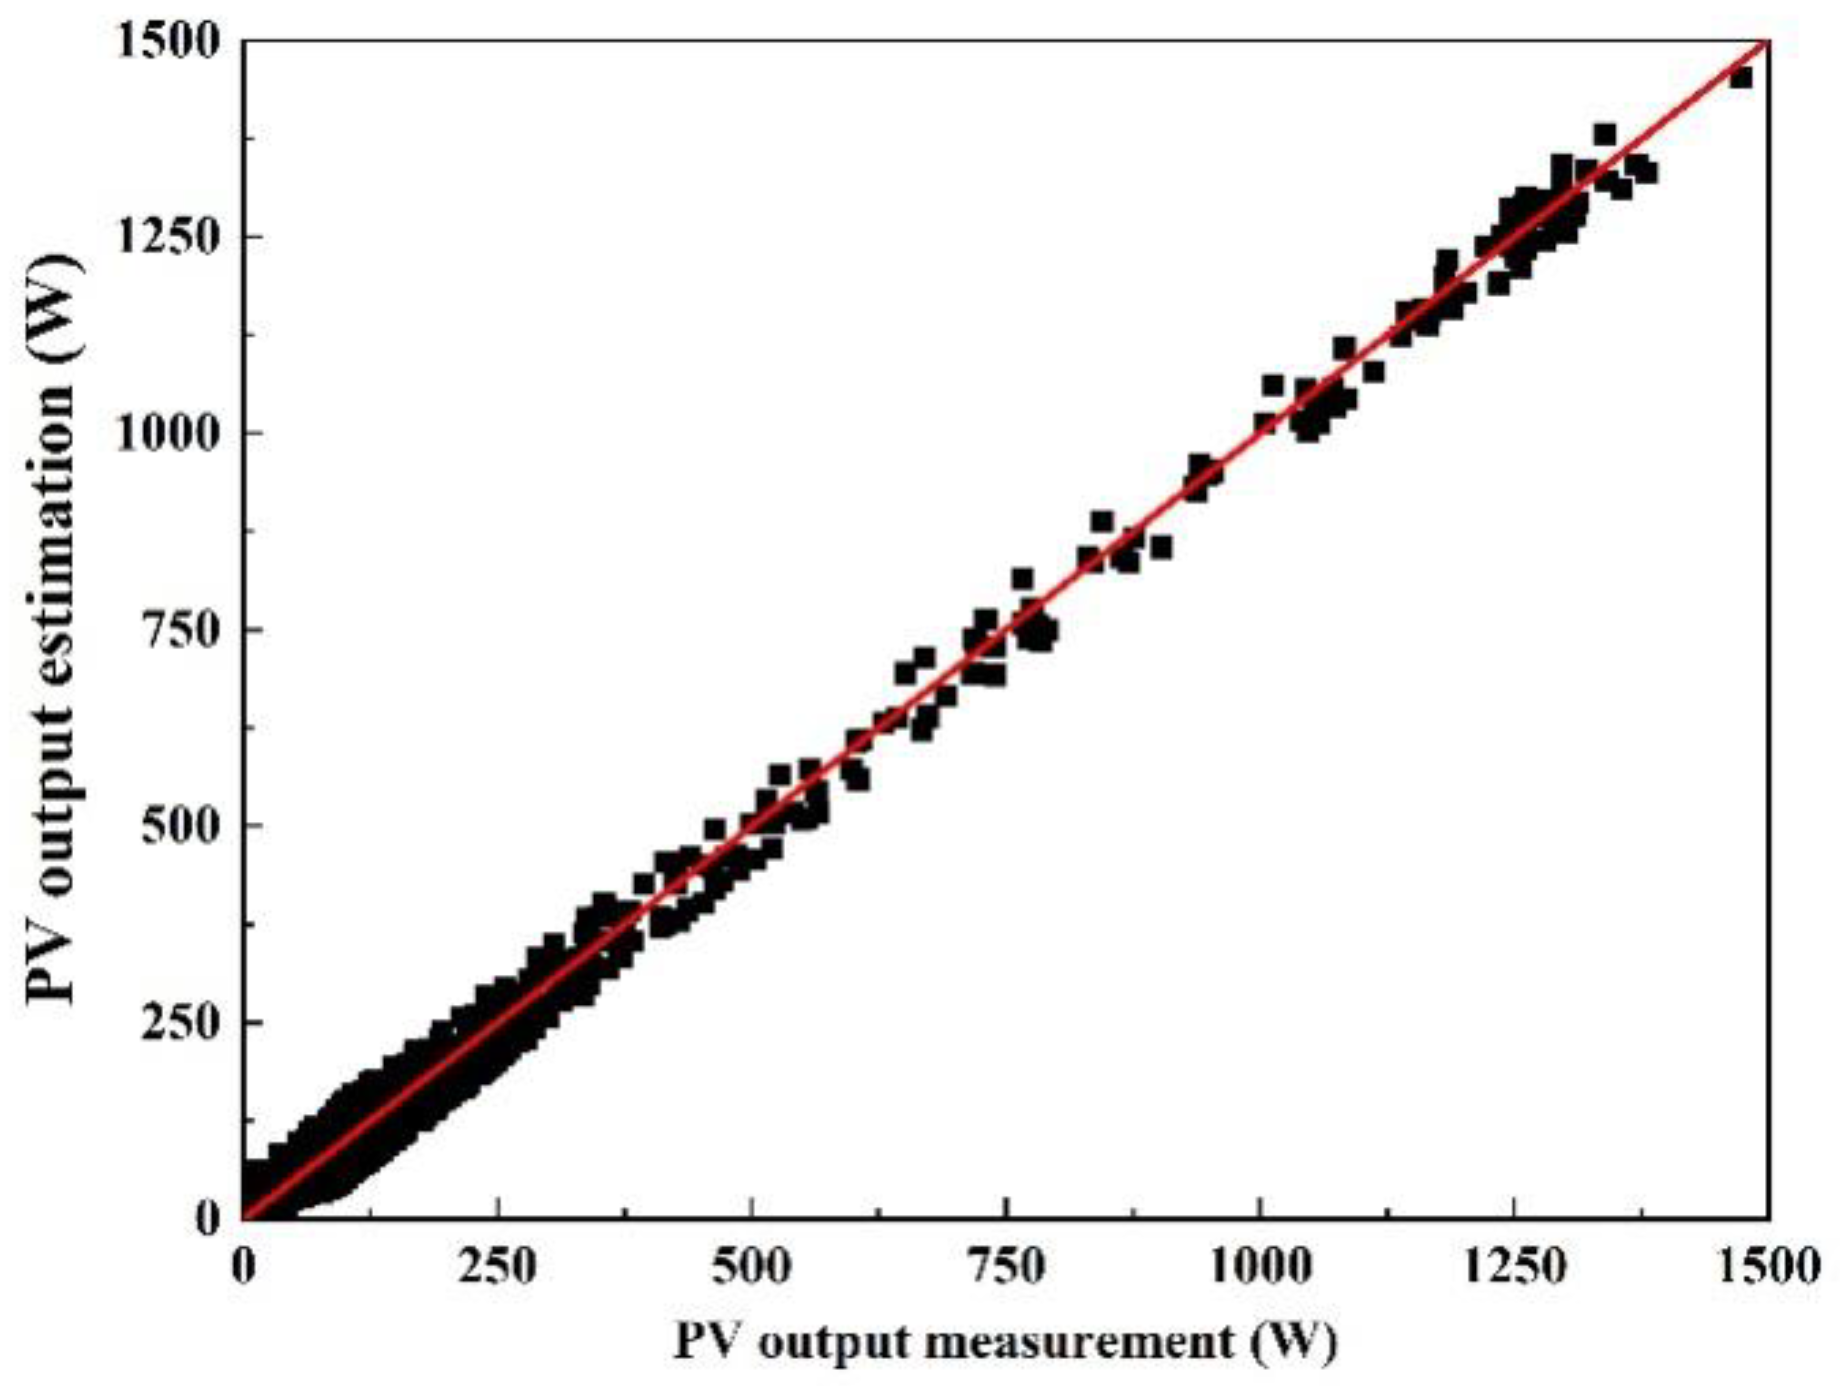
All mathematical models were conveniently implemented utilizing the PVLIB Python package, a well-documented PV simulation tool from Sandia National Laboratories [27,28,29,30]. Figure 3 shows the performance of the applied model.
The ratio of power output (Pout) to power input (Pin) is evidence of how much energy is used or dissipated as heat in a power electronic device. The efficiencies of power converters used in our system (Figure 1) were calculated as follows:
PV charger efficiency (npv-ch):
n p v c h = P c c P P V P c c =   n p v c h .   P P V
AC/DC inverter efficiency (ninv)
n i n v = P A C o u t P i c    P A C o u t = n i n v . P i c
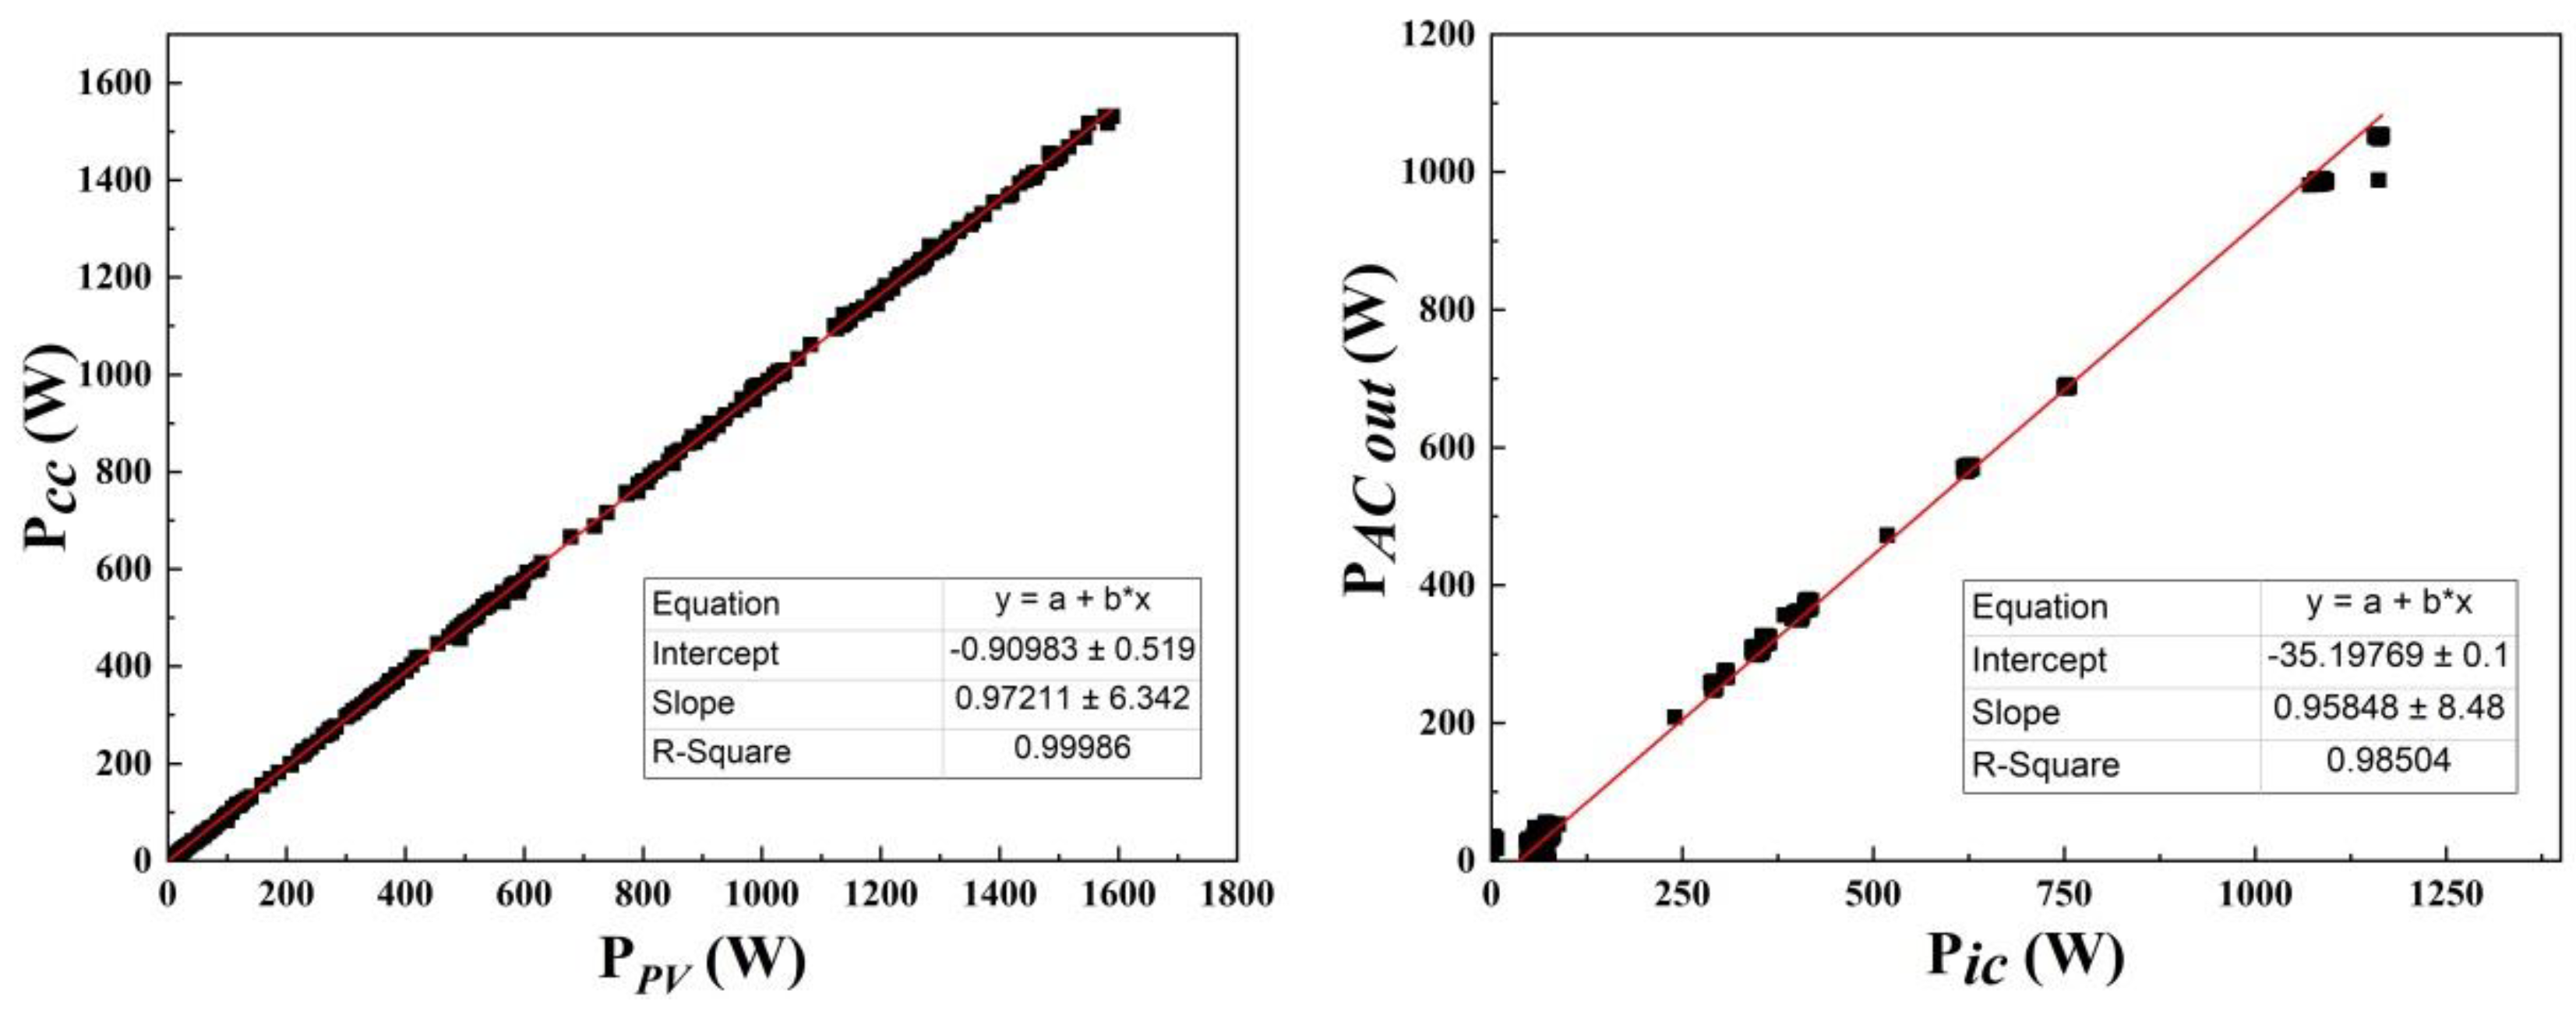
Graphs presented in Figure 4 were derived from the above formulas using experimental measurements.
By performing linear fitting on the set of experimental data points shown in Figure 4, the PV charger and AC/DC inverter efficiencies are determined. The PV charger efficiency is close to 97%, while the AC/DC inverter efficiency is about 96%.

2.3. Energy Cost

For the estimation of the cost of energy produced, construction, operation, and maintenance costs are critical inputs. Good approximations of the installed equipment, the life expectancy, and the appropriate interest rates for the years to come are needed to calculate the real cost of energy production. To evaluate the energy system, the TAEC is be calculated as discussed by Tsagarakis [19]. This consists of the sum of the annuitized capital costs and annual operation and maintenance costs. When this is divided by the energy produced annually, it results in the cost per unit of energy [31]. The cost of land is excluded since the equipement is placed on the roof of the building. This cost estimation has been employed by Tsagarakis and Papadogiannis in order to estimate the cost of each kWh produced by a biogas generation in a wastewater treatment facility [32], while Tsagarakis [33] further studied the optimum number of generators required to increase energy production.
T A E C = ( C R F i C a p i t a l   C o s t i ) + A n n u a l   O & M   C o s t
where Capital recovery Factor: C R F = r ( 1 + r ) t ( 1 + r ) t 1 , t is the lifetime of the project and r is the opportunity cost of capital, i.e., the rate for the best alternative investment. Since different pieces of equipment may have different life expectancies, this results in lower CRFs for long life equipment compared to short life equipment, but this methodology supports such differences. For the opportunity cost of capital, several alternative values have been employed in economic analyses depending on the owner's access to capital. Ιn this paper's analysis, a value of 4% was employed [34,35,36]. The cost of each energy unit produced (i.e., kWh in our case) is calculated by dividing the TAEC with the number of kWh produced per year. We consider this low discount rate as suitable for making strategic economic (instead of financial) decisions. This is the long term rate for investment projects in contrast to higher discount rates, which can be used by private investors. If the investor is a private company, then other evaluation criteria would be more suitable—for example, the payback period. Private investors are interested, among others, to know when they are going to get their money back, which is necessary in order for them to re-invest it. The advantage of a per unit cost is that it can be compared with other technologies and highlights cost redactions as the technology improves.
For capturing the uncertainty of PV energy production, we use the mean and standard deviation values of energy produced in our case study due to sunlight and conclude the respective cost variations. Thus, the annual sunlight mean and standard deviation values of sunlight derived from the daily forecasted and measured values over a twelve month period for Scenarios 1 and 2, respectively, were used to take into account the input uncertainty and define a normal probability distribution for these values. These mean and standard deviation values resulted in a normal probability distribution output regarding the energy produced by the system and the consequent cost estimation. With the use of @Risk software (Palisade Corporation, Ithaca, NY, USA), which applied the Monte Carlo simulation, areas of confidence regarding the outputs were produced. In the context of this work, the cost of monitoring equipment was not considered.

3. Results and Discussion

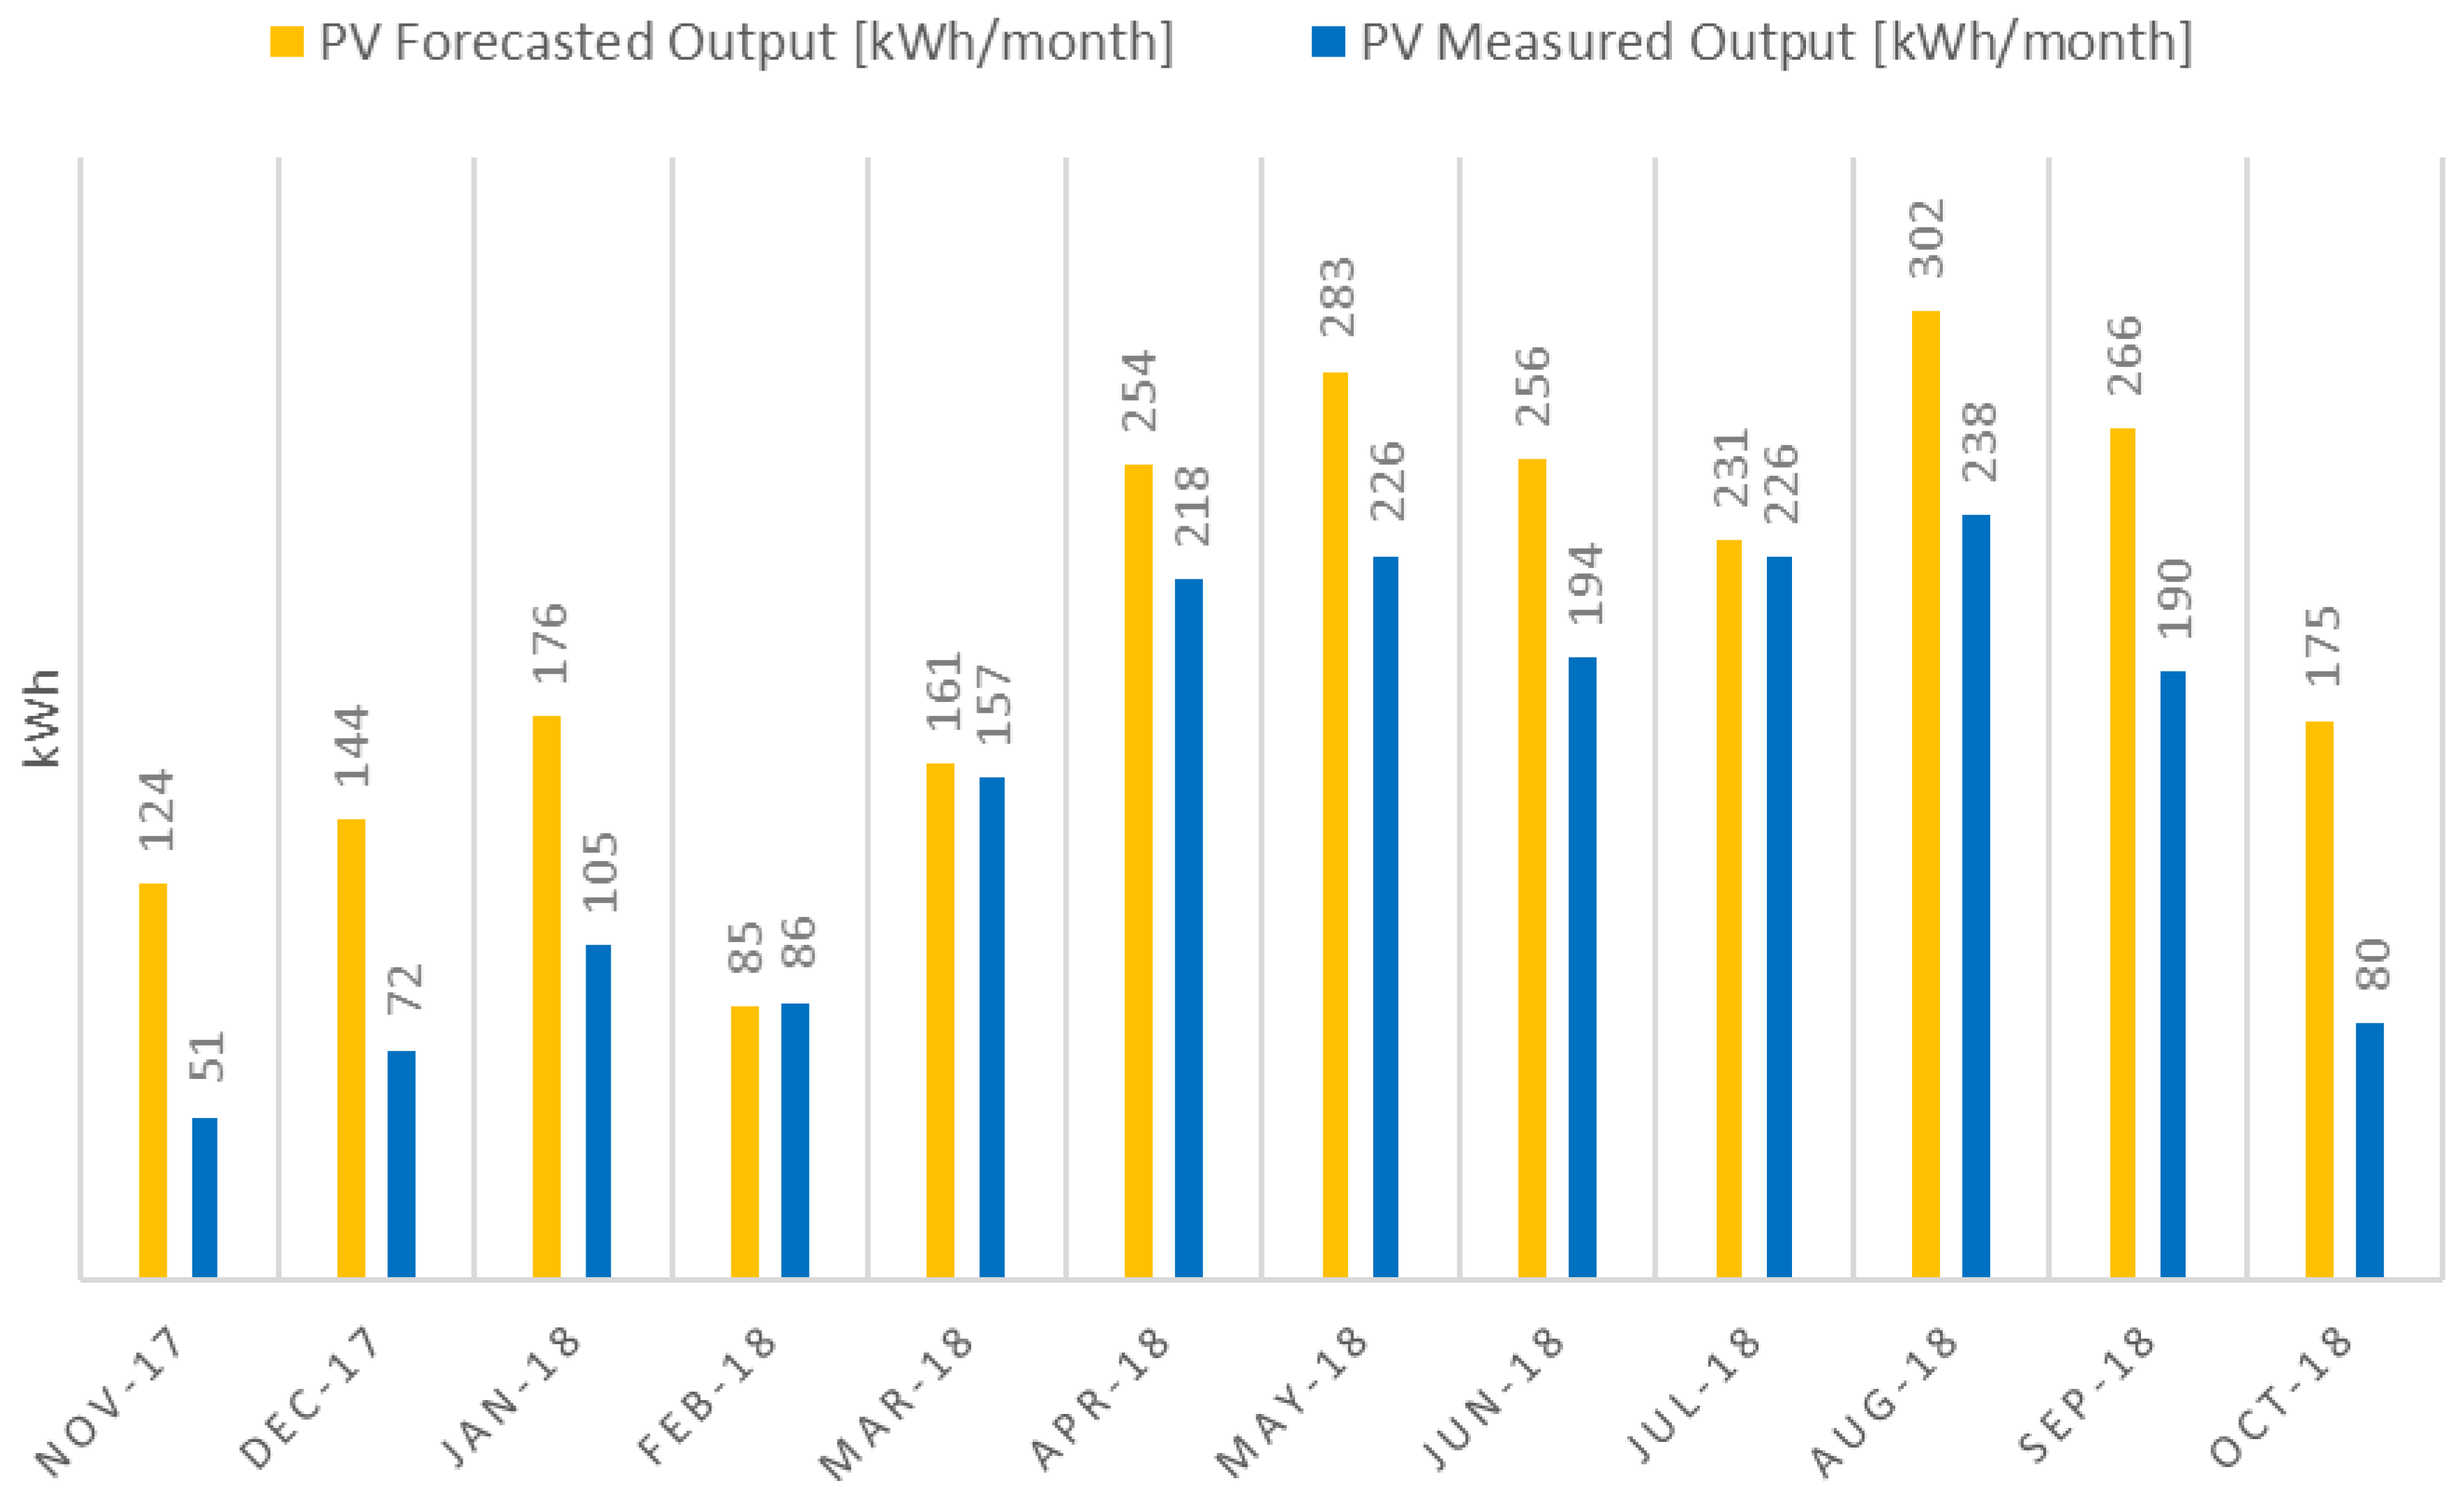
Energy production monitoring from the HPS recorded every two minutes from 1 November 2017 until 30 October 2018 was compared with the irradiance-based model results shown in Figure 5. One way to compare the performance between different energy systems is by calculating the capacity factor, i.e., the annual energy output per unit of installed power.
C f = A n n u a l   E n e r g y   Y i e l d   [ W h / y e a r ] ( I n s t a l l e d   C a p a c i t y   [ W ]   x   8760 [ h / y e a r ] )
The total energy produced from 1590 Wp installed PV capacity for a time period of one year was 1843.26 kWh, resulting in a capacity factor (Cf) of approximately 13%. The calculated energy output based on the same PV capacity and meteorological data was 2456.35 kWh, resulting in a capacity factor of approximately 18%. This energy difference can be attributed to limited storage resources, which were not considered by the model.
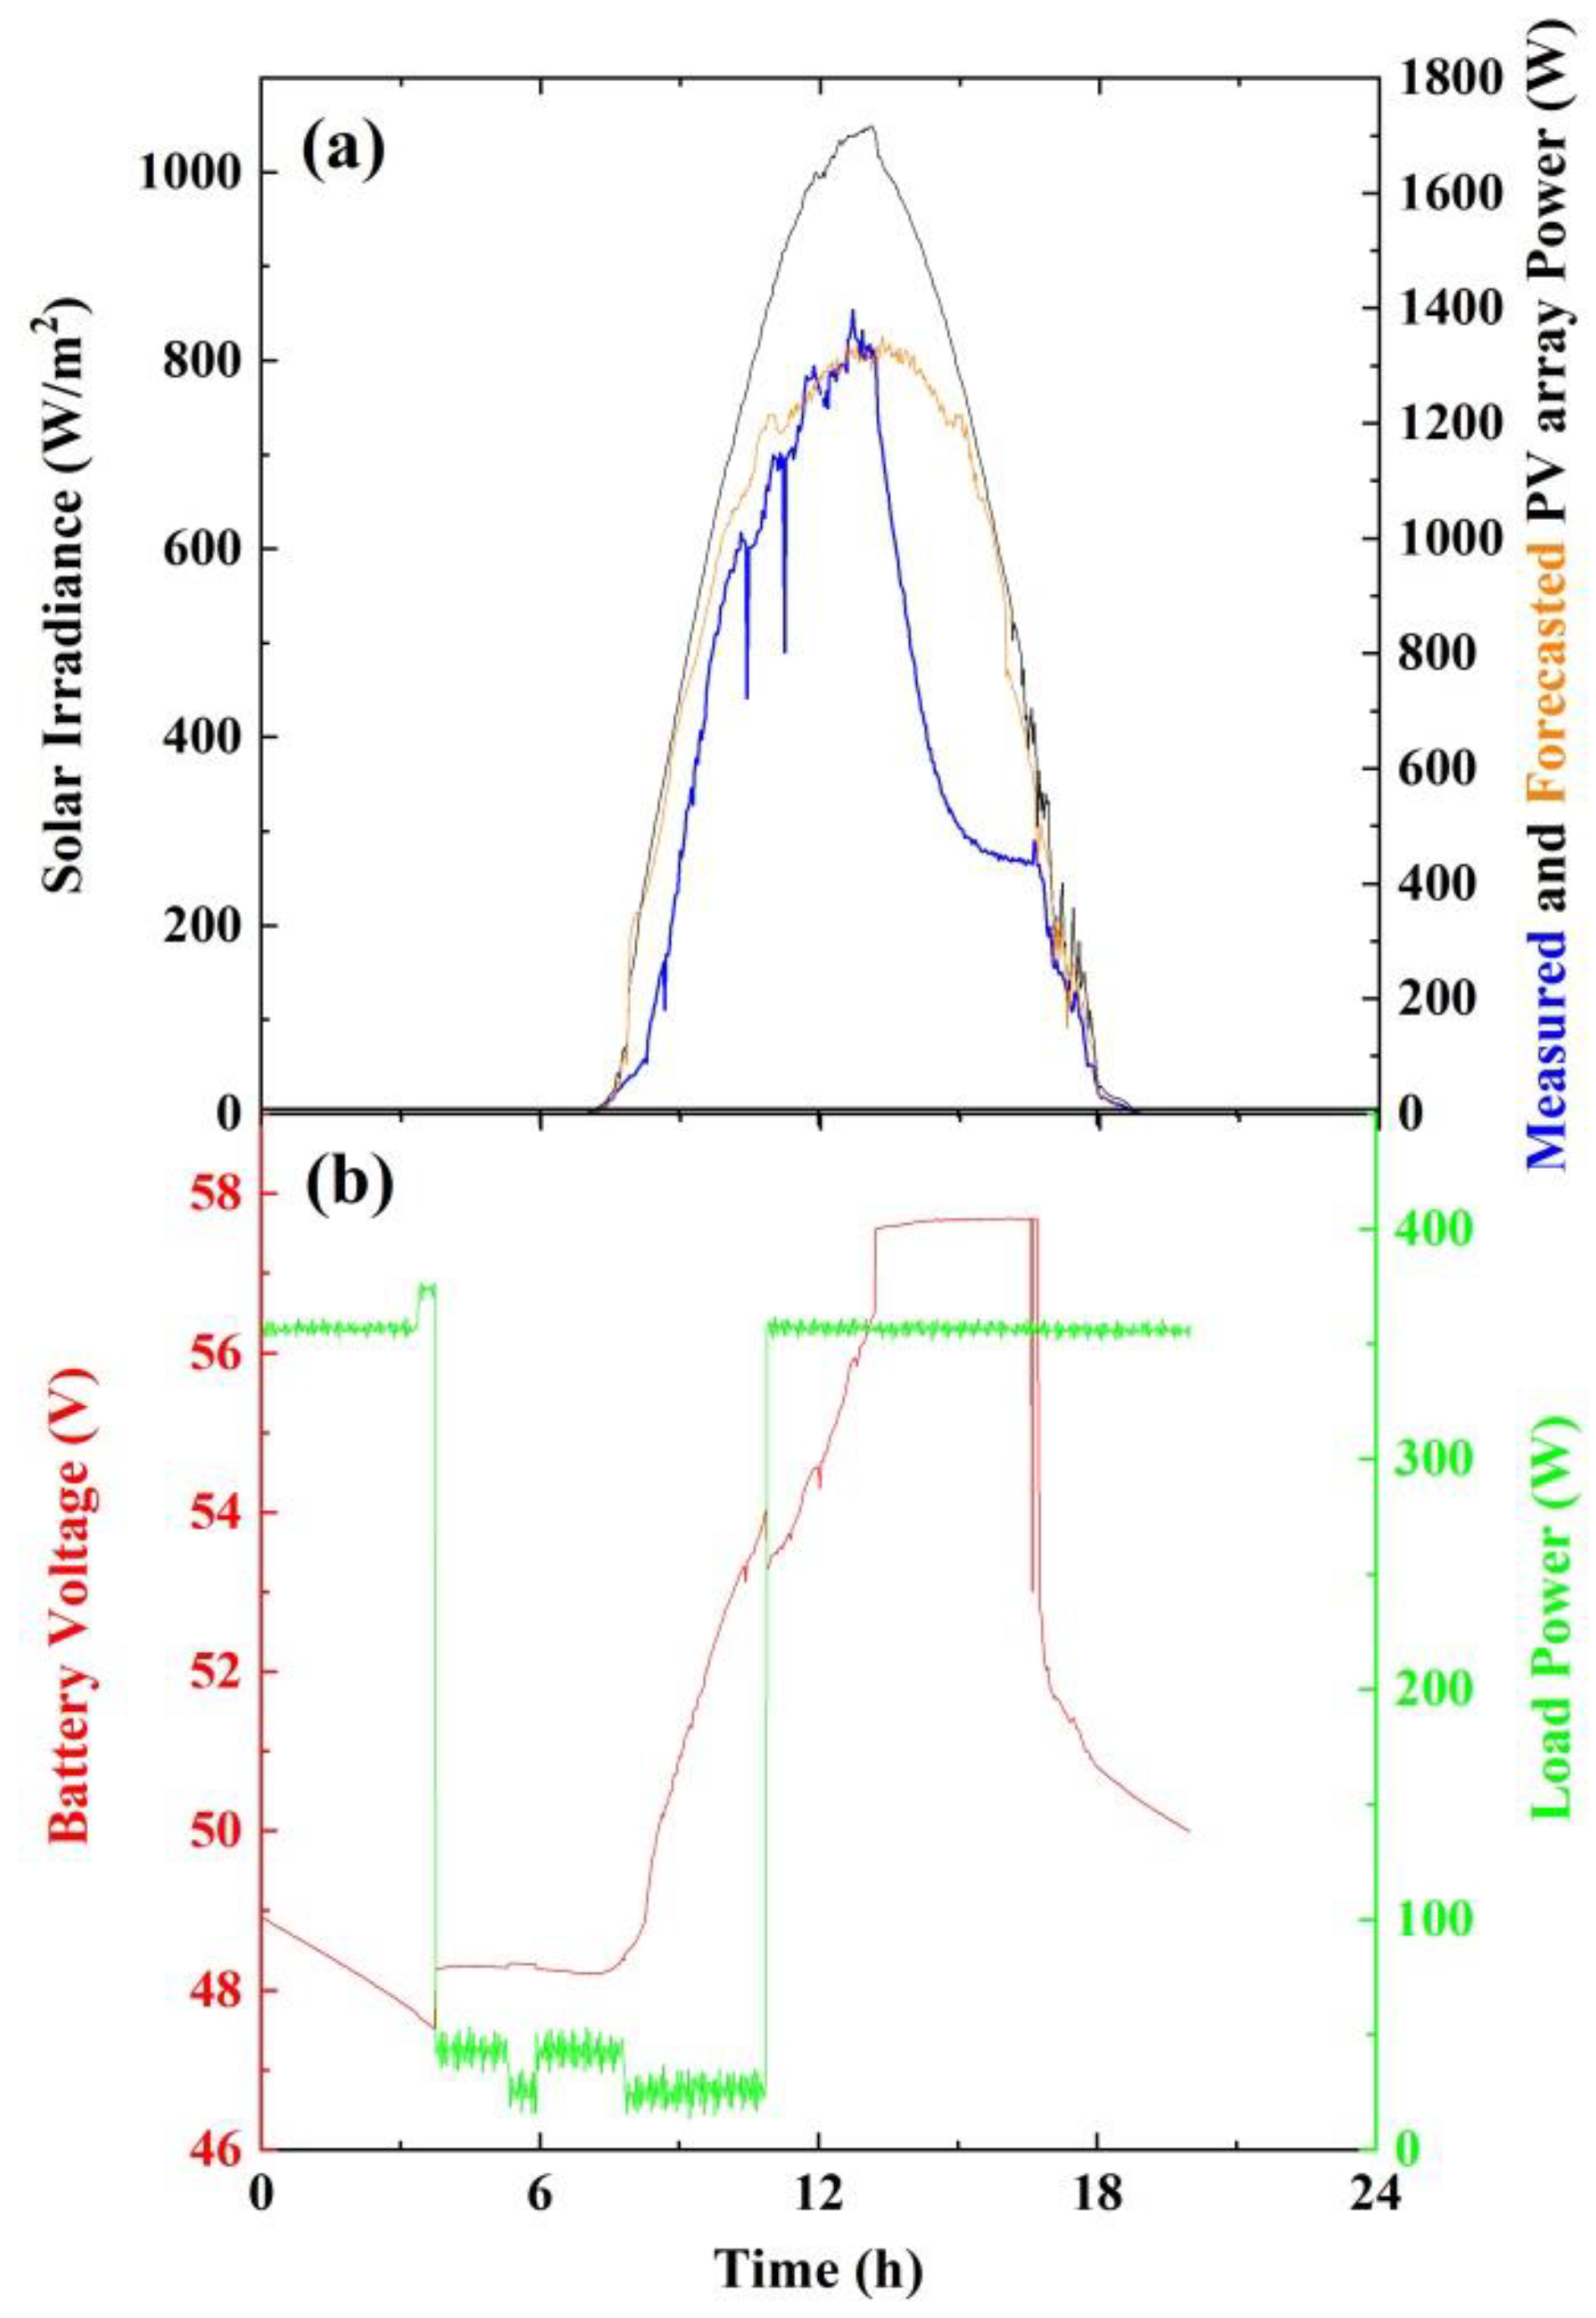
Figure 6a depicts such a case. The yellow curve shows the variation of solar power that reaches PV panels, and the blue curve shows the power output from the PV-array (PPV, Figure 1) as a function of time for one day in March 2018. The orange curve exhibits the modeled PV output for the same period. During this spring day, the PV-system output approached a peak power of approximately 1350 W.
It is worth mentioning that PV power output did not qualitatively follow the solar energy change. This can be interpreted by the battery voltage curve for the same day presented with the red curve in Figure 6b. When the battery voltage reaches its maximum value, the PV charge controller restricts the power output from the PV system to prevent the battery from overcharging, and thus potential renewable energy remains unused. This is a weak point in PV-BAT systems and HPS in general, which also explains the aforementioned difference between the forecasted and measured PV energy output. It becomes obvious that this behavior is repeated whenever the energy produced from PVs is higher than the energy needed to cover the load and the battery is fully charged. During the recording of the system’s operating performance, an arbitrary two stages load consumption was selected (green curve, Figure 6b) similar to a residential load profile with low energy demands.
As described in Section 2.3, capital cost is one of the main components that constitute TAEC. The detailed purchasing equipment cost of the PV-BAT system described in Figure 1 is presented in Table 1. Cost figures refer to the beginning of 2017, and the Value Added Tax is not included in this cost because it is a transfer payment.
The life expectancy of the system is considered at 25 years except for the solar charge controller (10 years), the inverter/charger (10 years), and the battery bank (three years). These are safe values for the subsequent calculations as the equipment normally has longer life spans. We work with the conservative values of Table 1 in order to avoid any case specific deviations from the real cost values. Our aim was not to promote these systems but rather to outline a methodology for their evaluation. Successful application reveals the appropriate periods to be used for the economic analysis without the risk of under or overestimating costs.
The annual Operation and Maintenance (O&M) cost is estimated at 270€, which consists of personnel (100€), consumables (70€), and insurance (100€). With the above-mentioned values, the cost per kWh in the two examined scenarios is calculated as presented in Table 2.
To consider uncertainty, as described in Section 2.3, we used input data for energy forecasted as a normal curve with mean daily value of 6.73 kWh/d and a standard deviation of 3.62 kWh/d (first scenario). Then, for energy produced, we considered a normal curve with a mean daily value of 5.05 kWh/d and a standard deviation of 3.65 kWh/d (second scenario). We ran 5000 simulations with @RISK software to calculate the output energy cost per kWh, as depicted in Figure 7. With 90% probability, the energy output will be from 2340 to 2572 kWh/y, as forecasted by the simulation we employed (first scenario).
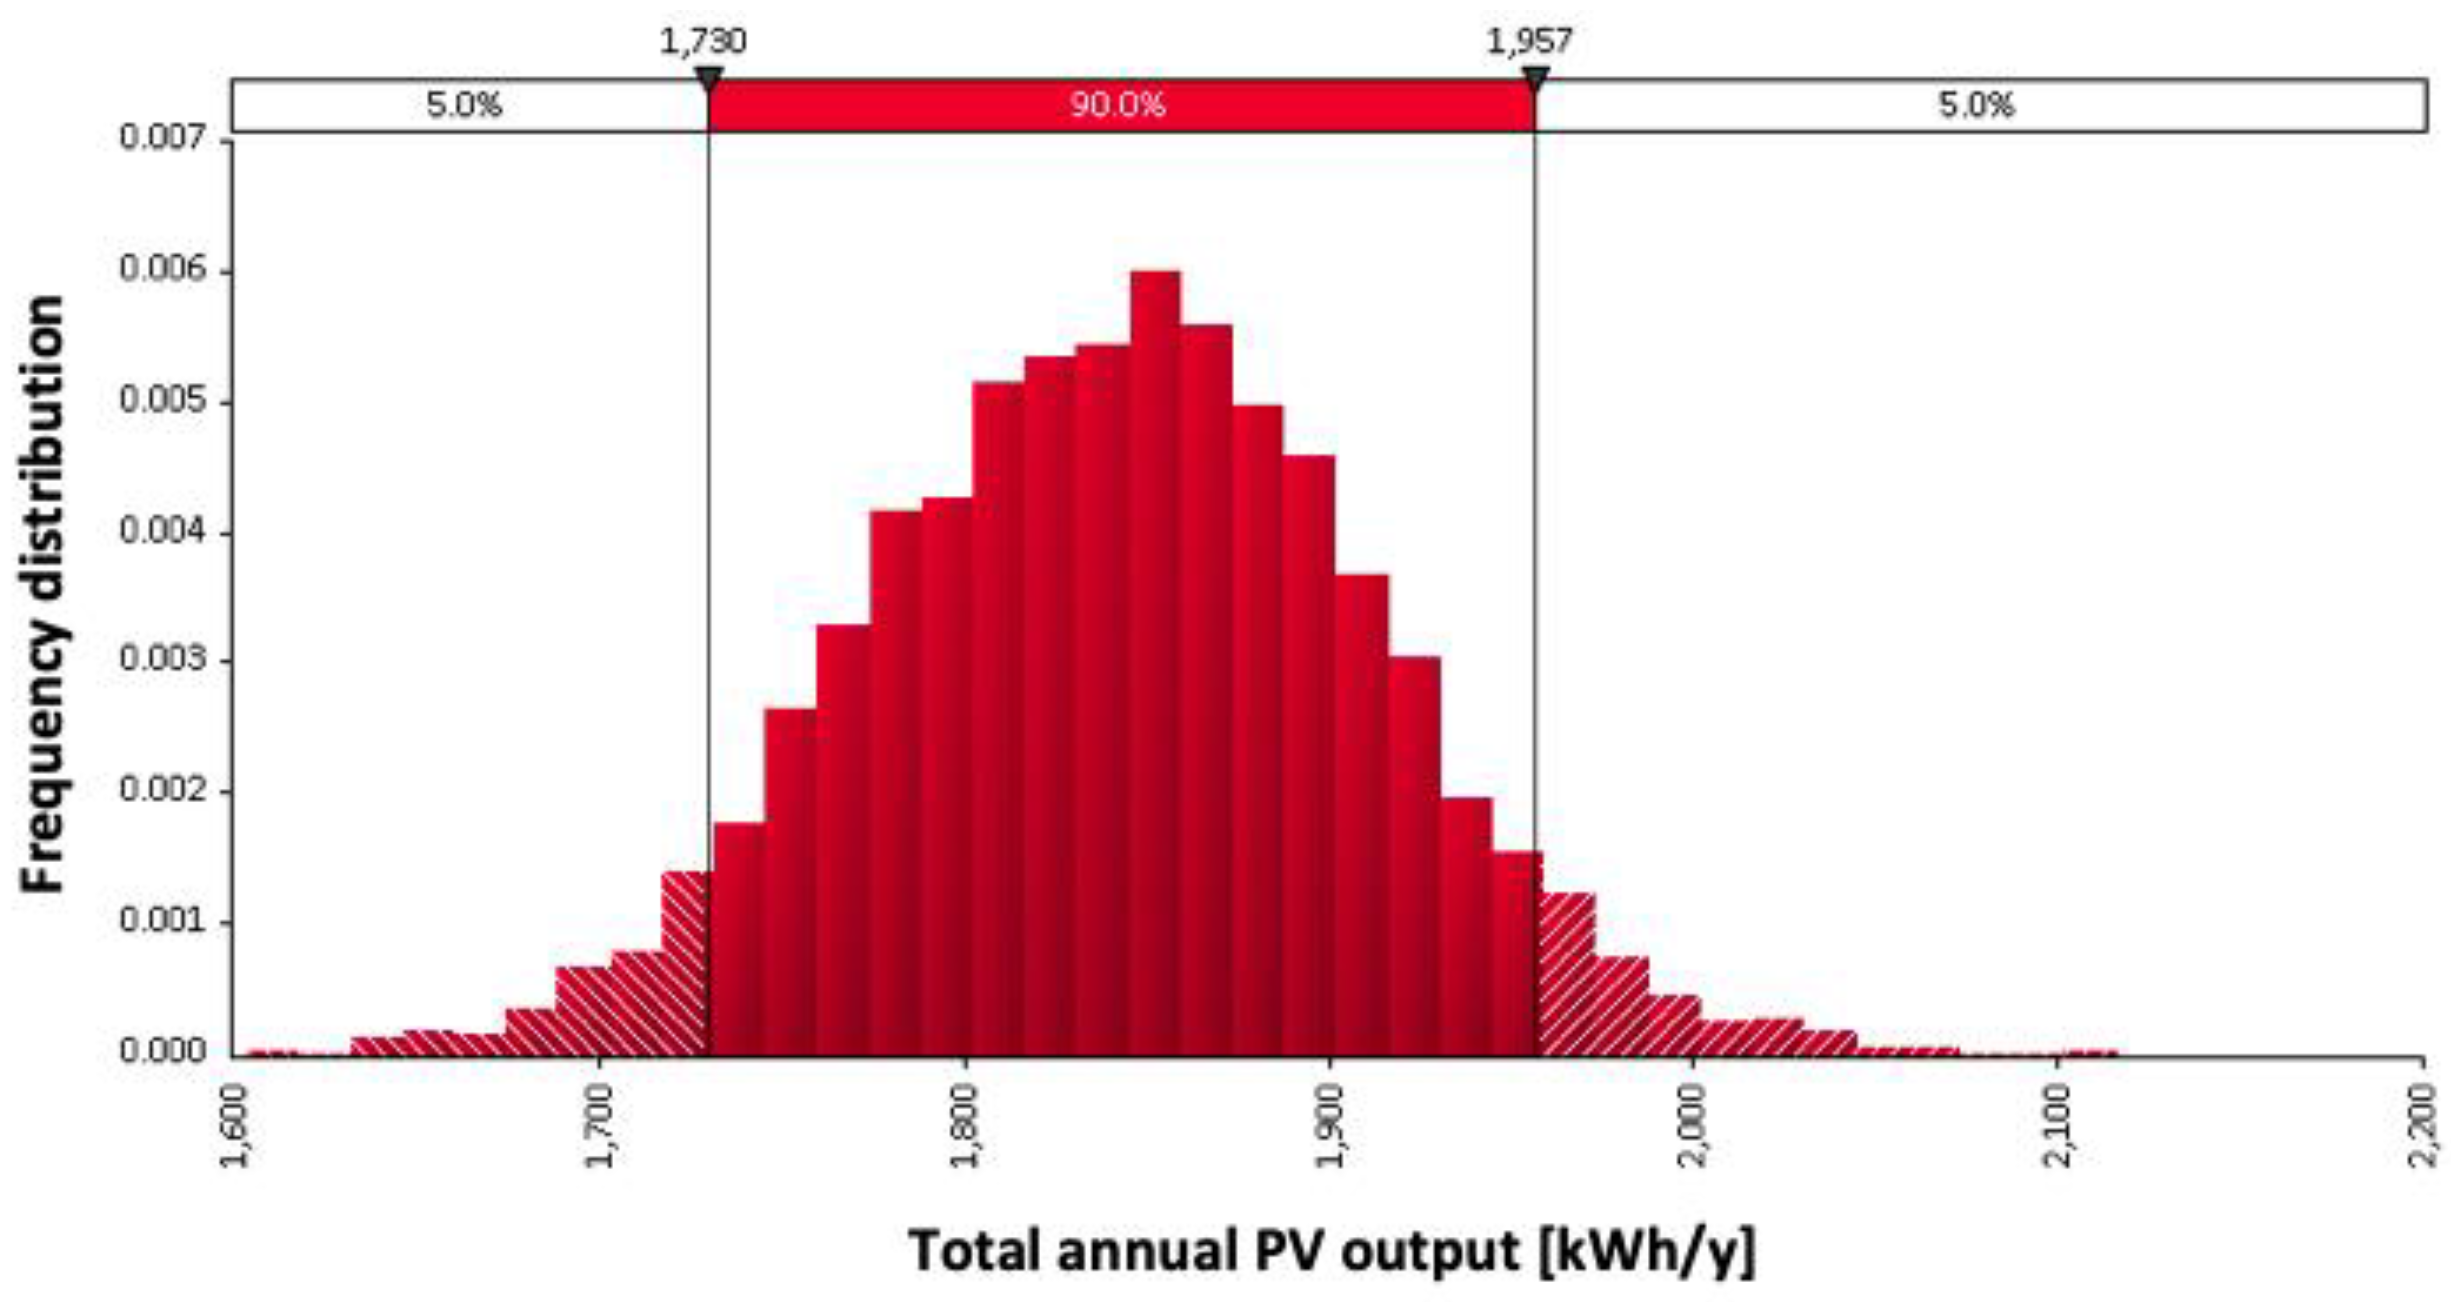
Using the measured energy production in place of Figure 7, Figure 8 was created (second scenario) with 1723 to 1959 kWh/y being produced under the 90% probability range.
The descriptive statistics of the simulated results for both the forecasted and the actual scenarios are provided in Table 3.
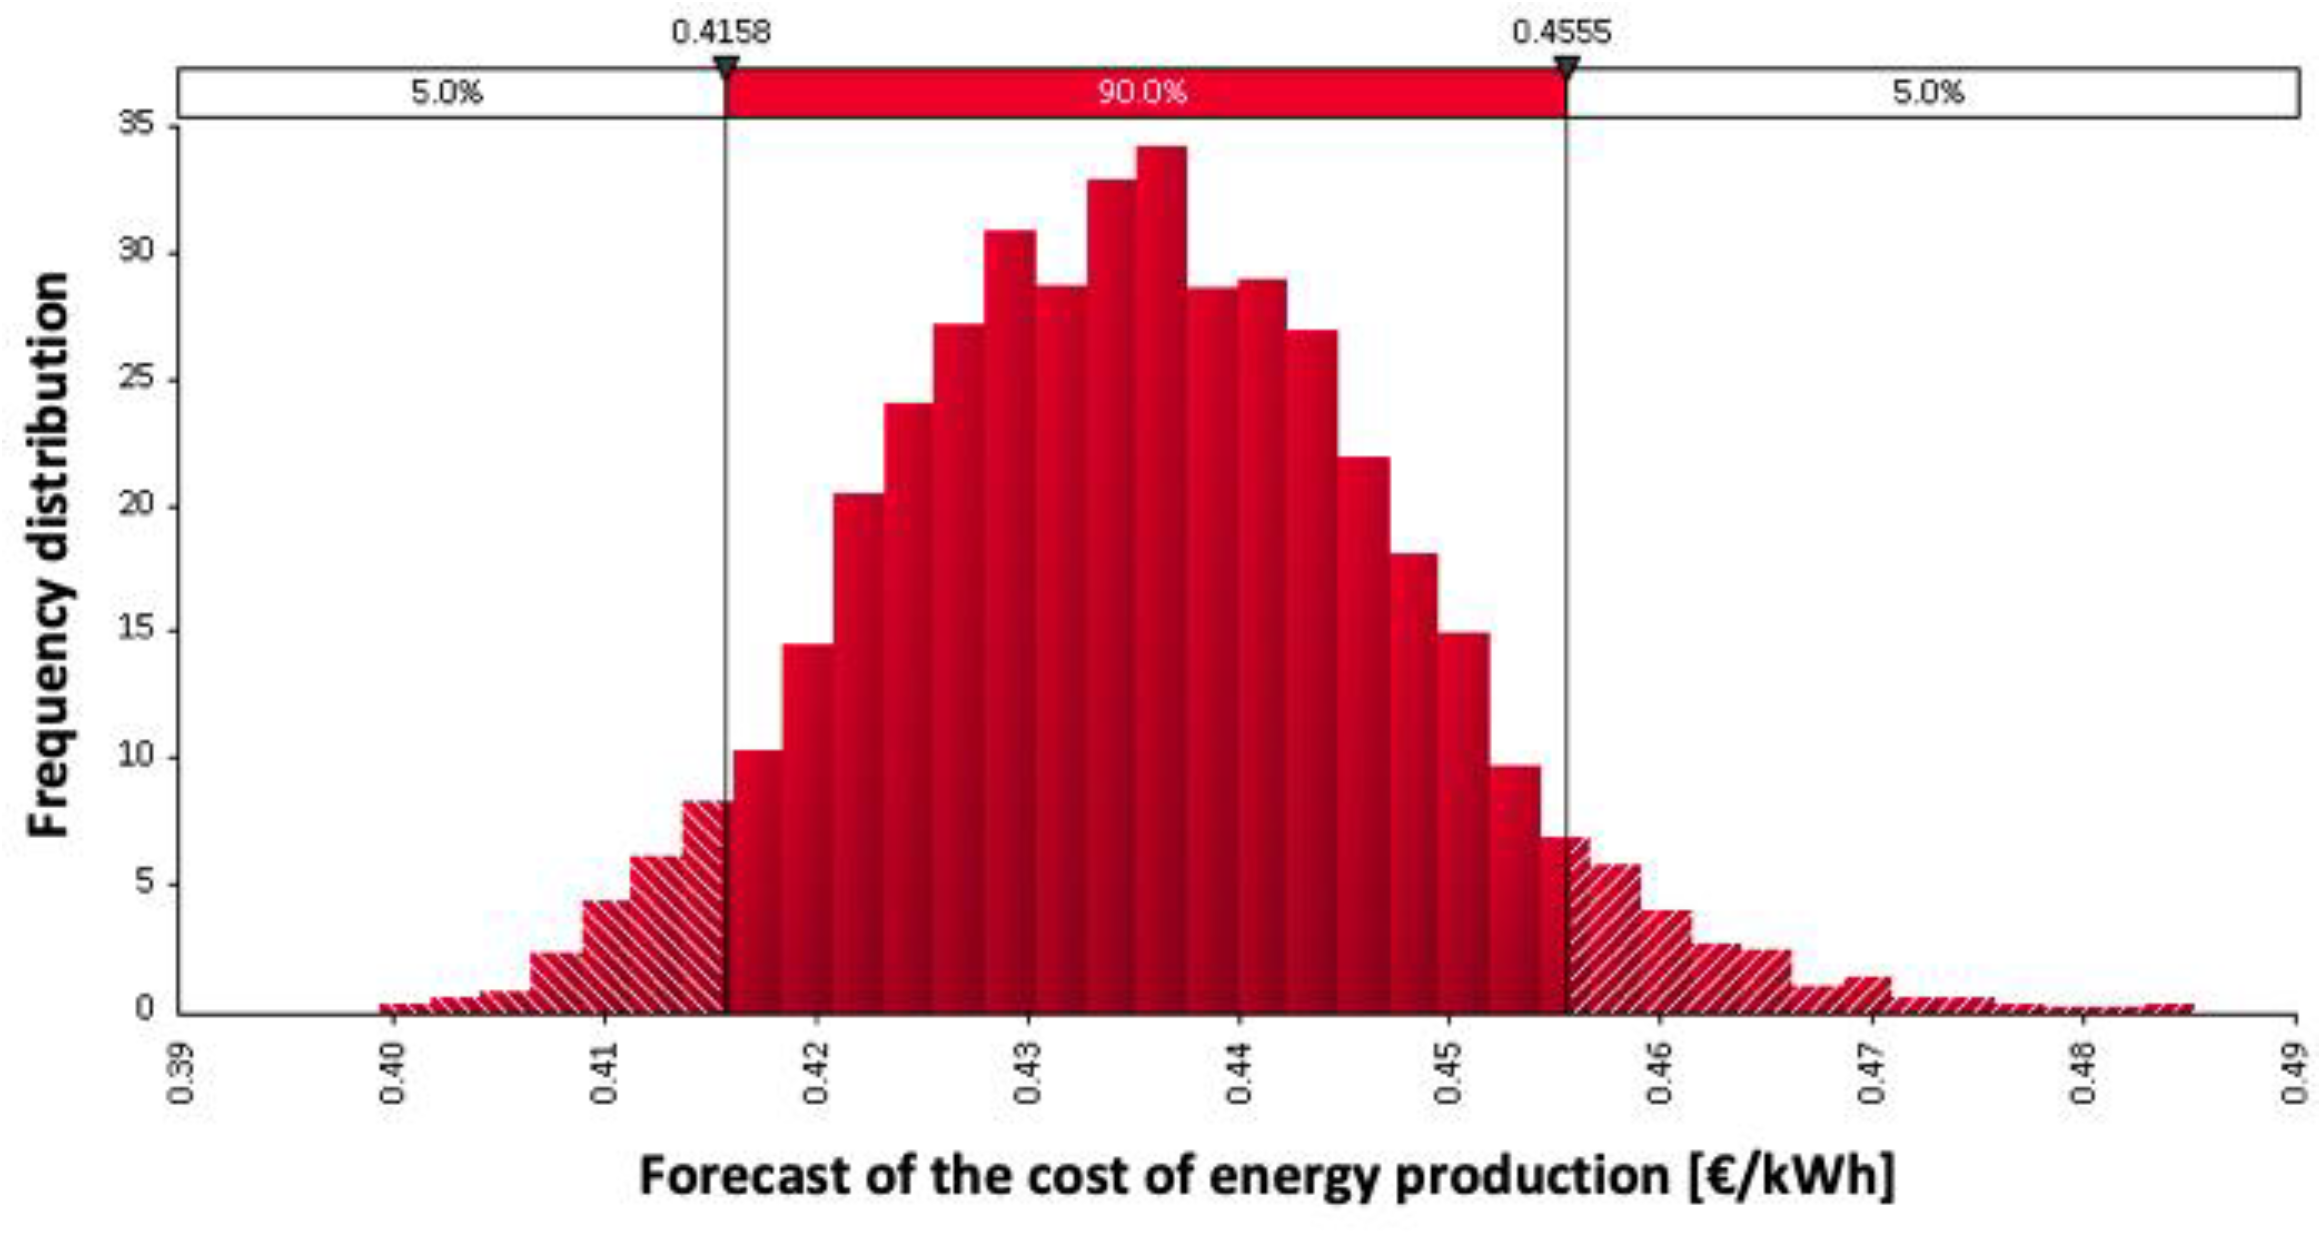
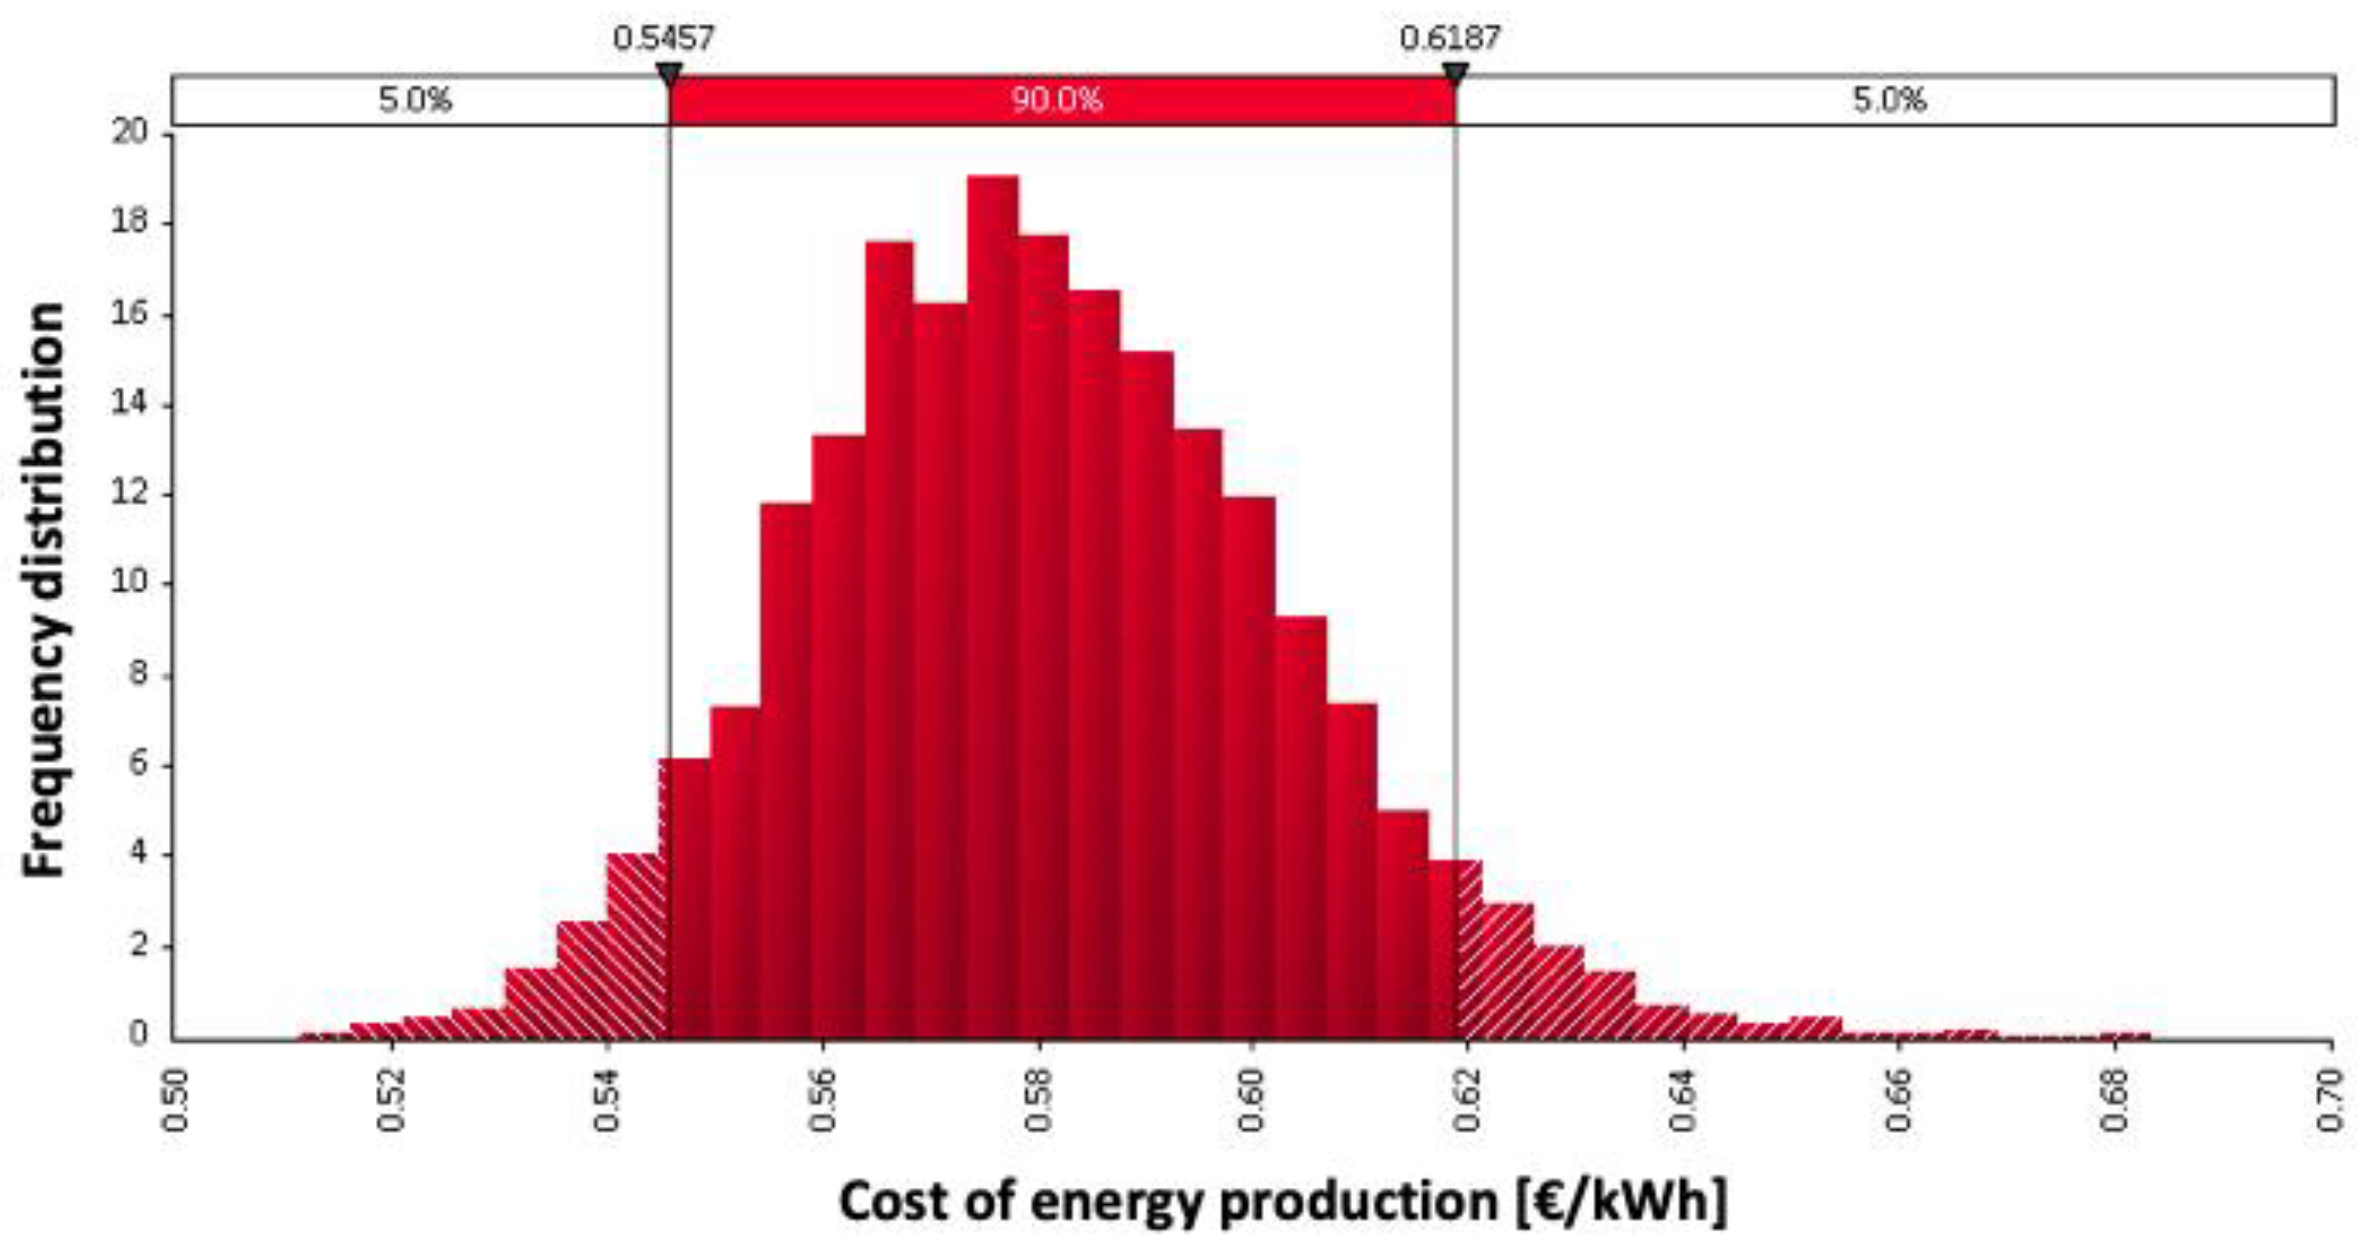
Based on the distribution of energy production per year, as depicted in Figure 7 and Figure 8, the costs per kWh of the forecasted and the real (measured) case are presented in Figure 9 and Figure 10, respectively. The simulated cases resulted in 0.42 to 0.46 €/kWh produced in the forecasted scenario (Figure 9) and 0.55 to 0.62 with the actual data (Figure 10) within the 90% probability range.
The descriptive statistics of the simulated results for both the optimum and the actual scenarios are provided in Table 4. Based on the energy produced, the cost per kWh may vary at the approximate range of 0.50 €. This is in line with values reported from similar analyses [37,38]. However, none of these studies have taken into account the energy price development considering at the same time the loss of excess energy due to limited resources, as was done in this study. Although the PV-BAT system is adequately sized, battery protection from an overabundance of solar energy is sometimes unavoidable and leads to higher energy prices, such as our worst case scenario. On the other hand, the best case scenario of the low-cost energy examined in the present work could only be achieved by performing optimum energy management mainly on the consumption side [4].
To competitively incorporate a PV-BAT system such as the one described in this study into the Greek market, a cost target of approximately 0.20 €/kWh, which is the gross energy purchasing cost for the average Greek household, must be achieved. It is obvious that there is a considerable difference between our best scenario and the target mentioned. Using a different battery technology (e.g., lithium ion), one has the advantage of better energy efficiency as well as the chance of replacing the battery bank only once over the course of 25 years [37]. On the other hand, the cost of this technology is higher at the moment. In our study, the lead acid battery cost per usable capacity is calculated to be 173 €/kWh, while the cost of lithium ion technology ranges between 560-1220 €/kWh [37], which is more than double. However, the cost is expected to fall considerably in the next decade (200-650 €/kWh) [37]. The onsite energy production, which does not bear any energy transfer costs, is also an existing benefit that could not be quantified in this analysis.
Other drivers for such systems are technology learned [39,40] and experience gained by doing [40,41]. Since the described system is fully decentralized, relevant training should be included to achieve better system efficiency [42,43,44].

4. Conclusions

Hybrid power systems, and in particular PV and battery systems, were previously considered as viable alternatives only in isolated areas with limited grid connection. However, the prices of the various renewable energy systems in recent years have been on a steep downward path, consequently encouraging distributed energy production and self-consumption.
This work provides the cost figures from the analysis and discussion of the methodological framework for the calculation of the unit cost of energy with consideration to the selection of appropriate discount rates and economic lifetimes. The analysis was based on the TAEC to investigate the sustainability of an HPS in Greece. Based on real data acquired over a period of 12 months, the cost of energy produced from a PV system in combination with lead-acid batteries was calculated at 0.58 €/kWh. These calculations are on the safe side since they consider reference lifetime values, which may prove to be longer (reducing the cost of each kWh) after successful operation. The rejection of excess solar energy due to limited storage availability highlights the need for further investigation into how battery sizing can be optimized and battery cost reduced.
These findings constitute a significant price indication of the kWh produced by HPS, but research into further cost reduction parameters is ongoing. Future work will focus on the system cost per degree of autonomy as well as the conditions under which battery storage will be profitable.

Author Contributions

I.K. and C.E. conceived and designed the research. I.K. collected the energy data. I.K. and C.E. analyzed the energy data, D.E. and K.P.T. performed the economic analysis. I.K., C.E., D.E. and K.P.T. wrote the paper.

Funding

This research received no external funding.

Conflicts of Interest

The authors declare no conflict of interest.

References

  1. Conti, J.; Holtberg, P.; Diefenderfer, J.; LaRose, A.; Turnure, J.T.; Westfall, L. International Energy Outlook 2016 with Projections to 2040; USDOE Energy Information Administration (EIA): Washington, DC, USA, 2016. [Google Scholar]
  2. Dincer, I. Renewable energy and sustainable development: A crucial review. Renew. Sustain. Energy Rev. 2000, 4, 157–175. [Google Scholar] [CrossRef]
  3. Kempener, R.; Borden, E. Battery Storage for Renewables: Market Status and Technology Outlook; International Renewable Energy Agency: Abu Dhabi, UAE, 2015; p. 32. Available online: https://www.irena.org/publications/2015/Jan/Battery-Storage-for-Renewables-Market-Status-and-Technology-Outlook (accessed on 29 December 2018).
  4. Kosmadakis, I.; Elmasides, C. Towards performance enhancement of hybrid power supply systems based on renewable energy sources. Energy Procedia 2019, 157, 977–991. [Google Scholar] [CrossRef]
  5. Badwawi, R.A.; Abusara, M.; Mallick, T. A review of hybrid solar PV and wind energy system. Smart Sci. 2015, 3, 127–138. [Google Scholar] [CrossRef]
  6. Askarzadeh, A. Optimisation of solar and wind energy systems: A survey. Int. J. Ambient Energy 2017, 38, 653–662. [Google Scholar] [CrossRef]
  7. Singh, S.; Singh, M.; Kaushik, S.C. A review on optimization techniques for sizing of solar-wind hybrid energy systems. Int. J. Green Energy 2016, 13, 1564–1578. [Google Scholar] [CrossRef]
  8. Shaw-Williams, D.; Susilawati, C.; Walker, G. Value of Residential Investment in Photovoltaics and Batteries in Networks: A Techno-Economic Analysis. Energies 2018, 11, 1022. [Google Scholar] [CrossRef]
  9. Shaikh, P.H.; Leghari, Z.H.; Mirjat, N.H.; Shaikh, F.; Solangi, A.R.; Jan, T.; Uqaili, M.A. Wind–PV-Based Hybrid DC Microgrid (DCMG) Development: An Experimental Investigation and Comparative Economic Analysis. Energies 2018, 11, 1295. [Google Scholar] [CrossRef]
  10. Alharthi, Y.Z.; Siddiki, M.K.; Chaudhry, G.M. Resource Assessment and Techno-Economic Analysis of a Grid-Connected Solar PV-Wind Hybrid System for Different Locations in Saudi Arabia. Sustainability 2018, 10, 3690. [Google Scholar] [CrossRef]
  11. Aderemi, B.A.; Chowdhury, S.P.D.; Olwal, T.O.; Abu-Mahfouz, A.M. Techno-Economic Feasibility of Hybrid Solar Photovoltaic and Battery Energy Storage Power System for a Mobile Cellular Base Station in Soshanguve, South Africa. Energies 2018, 11, 1572. [Google Scholar] [CrossRef]
  12. Waldau-Jäger, A. Pv Status Report 2016; EUR 28159 EN; European Commission, Joint Research Centre, Directorate C, Energy Efficiency and Renewables Unit: Ispra, VA, Italy, 2016. [Google Scholar] [CrossRef]
  13. Giannini, E.; Moropoulou, A.; Maroulis, Z.; Siouti, G. Penetration of photovoltaics in greece. Energies 2015, 8, 6497. [Google Scholar] [CrossRef]
  14. Energy Exchange Group DAS Monthly Report October 2018. Available online: http://www.enexgroup.gr/fileadmin/groups/EDRETH/DAS_Monthly_Reports/201810_DAS_Monthly_Report.pdf (accessed on 29 December 2018).
  15. Ilas, A.; Ralon, P.; Rodriguez, A.; Taylor, M. Renewable Power Generation Costs in 2017; International Renewable Energy Agency (IRENA): Abu Dhabi, UAE, 2018; 160p, Available online: www.irena.org/publications/2018/Jan/Renewable-power-generation-costs-in-2017 (accessed on 20 October 2018).
  16. Vieira, F.M.; Moura, P.S.; de Almeida, A.T. Energy storage system for self-consumption of photovoltaic energy in residential zero energy buildings. Renew. Energy 2017, 103, 308–320. [Google Scholar] [CrossRef]
  17. Nykvist, B.; Nilsson, M. Rapidly falling costs of battery packs for electric vehicles. Nat. Clim. Chang. 2015, 5, 329–332. [Google Scholar] [CrossRef] [Green Version]
  18. Comello, S.D.; Glenk, G.; Reichelstein, S. Levelized Cost of Electricity Calculator: A User Guide. Sustainable Energy Initiative, 2017. Available online: Http://stanford.Edu/dept/gsb_circle/cgi-bin/sustainableenergy/lcoe (accessed on 28 October 2018).
  19. Tsagarakis, K.P. Shallow geothermal energy under the microscope: Social, economic, and institutional aspects. Renew. Energy 2019, in press. [Google Scholar] [CrossRef]
  20. Rhodes, J.D.; King, C.; Gulen, G.; Olmstead, S.M.; Dyer, J.S.; Hebner, R.E.; Beach, F.C.; Edgar, T.F.; Webber, M.E. A geographically resolved method to estimate levelized power plant costs with environmental externalities. Energy Policy 2017, 102, 491–499. [Google Scholar] [CrossRef]
  21. Maxwell, E.L. A Quasi-Physical Model for Converting Hourly Global to Direct Normal Insolation. Aug. 1987 (SERI/TR-215-3087). pp. 35–46. Available online: http://rredc.nrel.gov/solar/pubs/PDFs/TR-215-3087.pdf (accessed on 21 August 2018).
  22. Loutzenhiser, P.G.; Manz, H.; Felsmann, C.; Strachan, P.A.; Frank, T.; Maxwell, G.M. Empirical validation of models to compute solar irradiance on inclined surfaces for building energy simulation. Sol. Energy 2007, 81, 254–267. [Google Scholar] [CrossRef] [Green Version]
  23. King, D.L.; Boyson, W.E.; Kratochvil, J.A. Photovoltaic Array Performance Model. Sandia Report 2004 (SAND2004-3535). Available online: http://www.osti.gov/servlets/purl/919131-sca5ep/ (accessed on 17 August 2018).
  24. De Soto, W.; Klein, S.A.; Beckman, W.A. Improvement and Validation of a Model for Photovoltaic Array Performance. Sol. Energy 2006, 80, 78–88. [Google Scholar] [CrossRef]
  25. Hongmei, T.; Mancilla-David, F.; Ellis, K.; Muljadi, E.; Jenkins, P. A Cell-to-Module-to-Array Detailed Model for Photovoltaic Panels. Sol. Energy 2012, 86, 2695–2706. [Google Scholar]
  26. Gray, J.L. The Physics of the Solar Cell; John Wiley & Sons, Ltd.: Hoboken, NJ, USA, 2003; Chapter 3; pp. 62–112. ISBN 0-471-49196-9 2003. Available online: http://dx.doi.org/10.1002/9780470974704.ch3 (accessed on 21 August 2018).
  27. Stein, J.S. The Photovoltaic Performance Modeling Collaborative (PVPMC). In Proceedings of the 2012 38th IEEE Photovoltaic Specialists Conference, Austin, TX, USA, 3–8 June 2012; pp. 3048–3052. [Google Scholar]
  28. Stein, J.S.; Holmgren, W.F.; Forbess, J.; Hansen, C.W.H. PVLIB: Open Source Photovoltaic Performance Modeling Functions for Matlab and Python. In Proceedings of the IEEE 44th Photovoltaic Specialist Conference, Portland, OR, USA, 5–10 June 2017; pp. 3425–3430. [Google Scholar]
  29. Andrews, R.W.; Stein, J.S.; Hansen, C.W.H.; Riley, D. Introduction to the Open Source PV LIB for Python Photovoltaic System Modelling Package. In Proceedings of the IEEE 40th Photovoltaic Specialist Conference, Denver, CO, USA, 8–13 June 2014; pp. 170–174. [Google Scholar]
  30. Holmgren, W.F.; Groenendyk, D.G. An Open Source Solar Power Forecasting Tool Using PVLIB-Python. In Proceedings of the IEEE 43rd Photovoltaic Specialists Conference, Portland, OR, USA, 5–10 June 2016; pp. 972–975. [Google Scholar]
  31. Creedy, J.; Passi, H. Public sector discount rates: A comparison of alternative approaches. Aust. Econ. Rev. 2018, 51, 139–157. [Google Scholar] [CrossRef]
  32. Tsagarakis, K.P.; Papadogiannis, C. Technical and economic evaluation of the biogas utilization for energy production at iraklio municipality, greece. Energy Convers. Manag. 2006, 47, 844–857. [Google Scholar] [CrossRef]
  33. Tsagarakis, K.P. Optimal number of energy generators for biogas utilization in wastewater treatment facility. Energy Convers. Manag. 2007, 48, 2694–2698. [Google Scholar] [CrossRef]
  34. Walraven, D.; Laenen, B.; D’haeseleer, W. Minimizing the levelized cost of electricity production from low-temperature geothermal heat sources with orcs: Water or air cooled? Appl. Energy 2015, 142, 144–153. [Google Scholar] [CrossRef]
  35. Usman, M.; Imran, M.; Yang, Y.; Lee, D.H.; Park, B.-S. Thermo-economic comparison of air-cooled and cooling tower based organic rankine cycle (ORC) with R245FA and R1233ZDE as candidate working fluids for different geographical climate conditions. Energy 2017, 123, 353–366. [Google Scholar] [CrossRef]
  36. Commission Delegated Regulation (EU) No 480/2014 of Supplementing Regulation (EU) No 1303/2013 of the European Parliament and of the Council Laying Down Common Provisions on the European Regional Development Fund, the European Social Fund, the Cohesion Fund, the European Agricultural Fund for Rural Development and the European Maritime and Fisheries Fund and Laying Down General Provisions on the European Regional Development Fund, the European Social Fund, the Cohesion Fund and the European Maritime and Fisheries Fund. OJ L 138, 13.5.2014, p. 5–44.
  37. Kost, C.; Shammugam, S.; Jűlch, V.; Nguyen, H.; Schlegel, T. Levelized Cost of Electricity—Renewable Energy Technologies; Fraunhofer ISE: Freiburg, Germany, 2013. [Google Scholar]
  38. Cucchiella, F.; D’Adamo, I.; Gastaldi, M.; Stornelli, V. Solar Photovoltaic Panels Combined with Energy Storage in a Residential Building: An Economic Analysis. Sustainability 2018, 10, 3117. [Google Scholar] [CrossRef]
  39. IEA-PVPS. Technical Assumptions Used in PV Financial Models. Review of Current Practices and Recommendations. International Energy Agency - Photovoltaic Power Systems Programme, Report IEA-PVPS T13-08:2017. Available online: http://www.iea-pvps.org/index.php?id=426&eID=dam_frontend_push&docID=3822 (accessed on 17 August 2018).
  40. Weiss, M.; Junginger, M.; Patel, M.K.; Blok, K. A review of experience curve analyses for energy demand technologies. Technol. Forecast. Soc. Chang. 2010, 77, 411–428. [Google Scholar] [CrossRef]
  41. Wei, M.; Smith, S.J.; Sohn, M.D. Experience curve development and cost reduction disaggregation for fuel cell markets in Japan and the US. Appl. Energy 2017, 191, 346–357. [Google Scholar] [CrossRef]
  42. Shum, K.L.; Watanabe, C. Towards a local learning (innovation) model of solar photovoltaic deployment. Energy Policy 2008, 36, 508–521. [Google Scholar] [CrossRef]
  43. Winskel, M.; Markusson, N.; Jeffrey, H.; Candelise, C.; Dutton, G.; Howarth, P.; Jablonski, S.; Kalyvas, C.; Ward, D. Learning pathways for energy supply technologies: Bridging between innovation studies and learning rates. Technol. Forecast. Soc. Chang. 2014, 81, 96–114. [Google Scholar] [CrossRef]
  44. Ferioli, F.; Schoots, K.; van der Zwaan, B.C.C. Use and limitations of learning curves for energy technology policy: A component-learning hypothesis. Energy Policy 2009, 37, 2525–2535. [Google Scholar] [CrossRef]
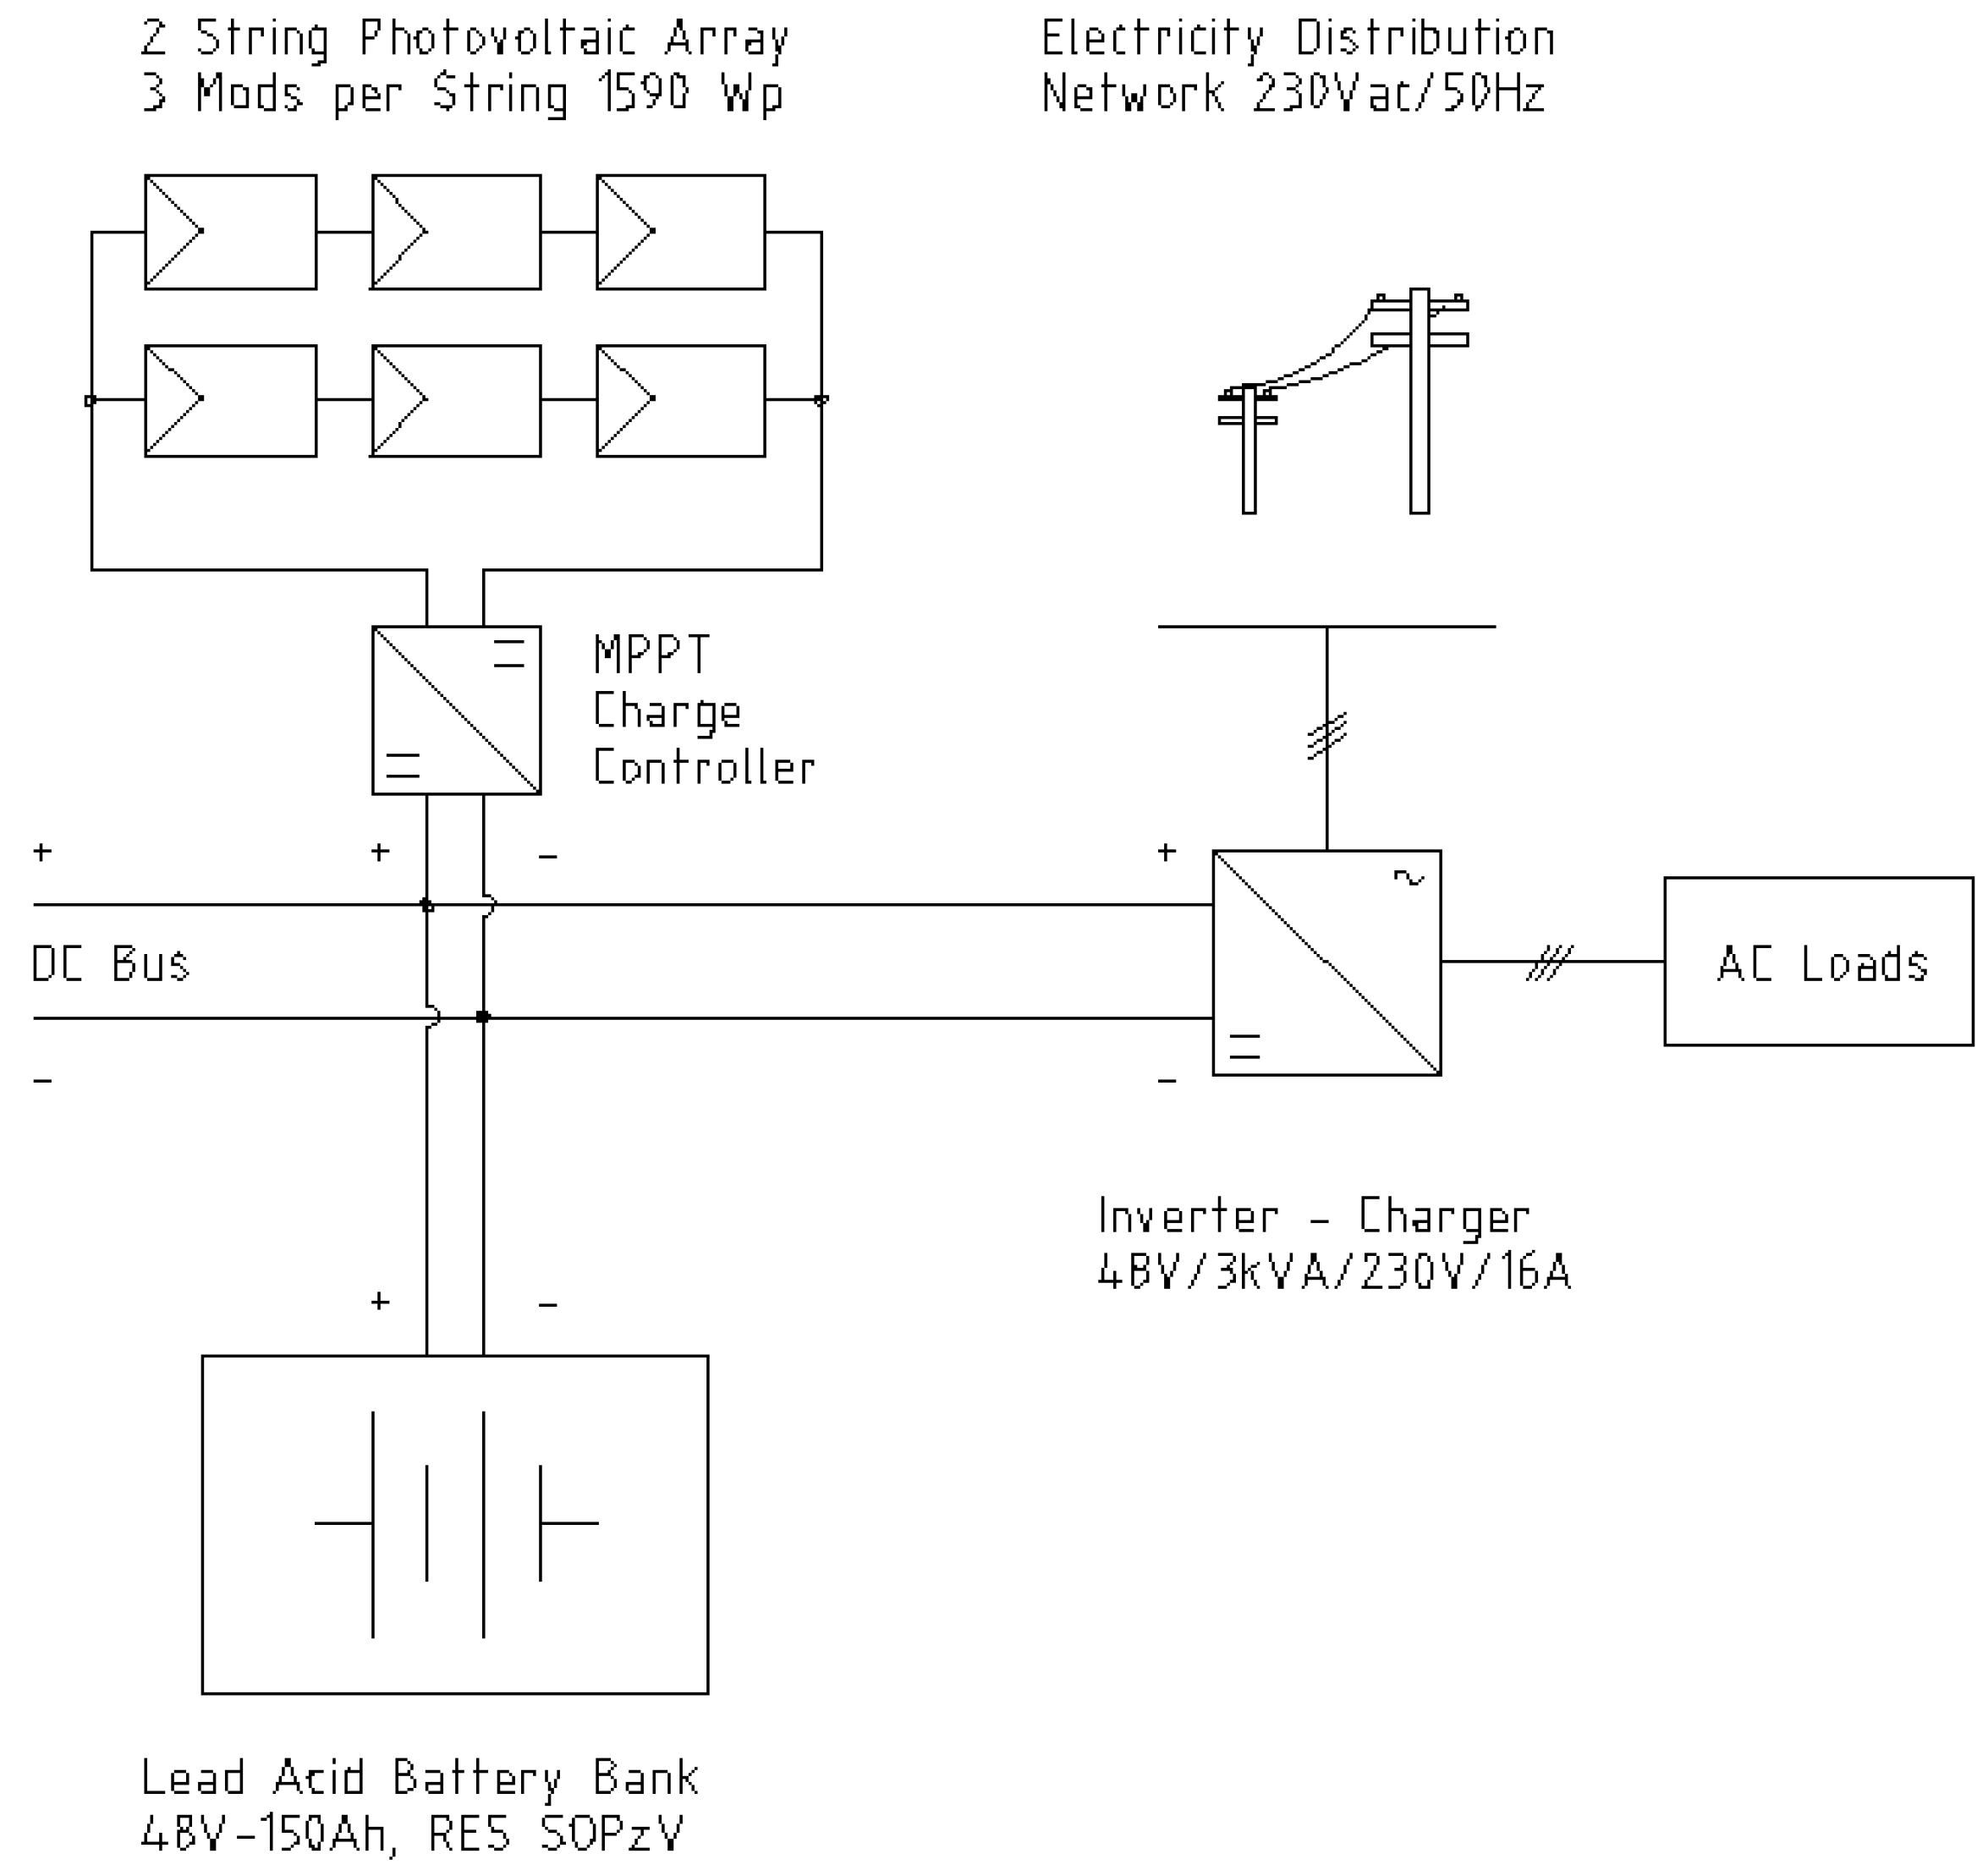
Figure 1. The diagram of the photovoltaics and lead-acid batteries (PV-BAT) system.
Energies 12 01357 g001
Figure 2. Measurement and control implementation of the PV-BAT system as a block diagram showing the instrumentation and the equipment used in this study.
Energies 12 01357 g002
Figure 3. A nearly symmetric comparison between experimental measurements and the PV model output.
Energies 12 01357 g003
Figure 4. PV charge controller (left) and inverter (right) efficiency ratios.
Energies 12 01357 g004
Figure 5. Comparison between measured and modeled PV energy output.
Energies 12 01357 g005
Figure 6. (a) Variations of solar irradiance (yellow curve), measured PV output (blue curve), and calculated PV output (orange curve) as a function of time; (b) variation of battery voltage (red curve) and applied load (green curve) as a function of time.
Energies 12 01357 g006
Figure 7. Forecast of the total annual energy produced by the PV array.
Energies 12 01357 g007
Figure 8. Total annual measured energy produced by the PV array.
Energies 12 01357 g008
Figure 9. Calculation of the unit cost of energy production based on the forecasted energy values.
Energies 12 01357 g009
Figure 10. Calculation of the unit cost of energy production based on the measured energy values.
Energies 12 01357 g010
Table 1. Capital cost components.
AACost ComponentPieces€/PieceTotal Price
1Solar Charge Controller1225.00 € 225.00 €
2PV Module6200.70 € 1204.20 €
3Inverter / Charger11212.00 € 1212.00 €
4Battery Bank (w. 35mm2 cabling 6m)2451.81 € 1243.44 €
5Battery Rack1125.00 € 125.00 €
6Circuit breaker for photovoltaics (DC)187.49 € 87.49 €
7Miniature Circuit Breaker (for AC/DC circuits)124.90 € 24.90 €
8Miniature Circuit Breaker (for AC/DC circuits)39.70 € 29.10 €
11AC indoor installation cabling150.80 € 12.00 €
12Din Rail Enclosure (40W x 60H x 18D cm) 156.93 € 56.93 €
13DC Cable (4 mm2, 10 mm2)202.50 € 50.00 €
9Roof Solar Installation (incl. Wiring) 450.00 €
10Indoor Electrical Installation 200.00 €
14Additional costs for residential installation 400.00 €
15Miscellaneous 69.49 €
Sum 5,389.55 €
* DC = direct current, AC = alternating current
Table 2. Cost per kWh for the two examined scenarios.
ScenarioCapital CostO&M costkWh/yrTAEC€/kWh
15389.55 €270 €2456.351068.660.44
25389.55 €270 €1843.261068.660.58
* TAEC = total annual economic cost, O&M = Operation and Maintenance
Table 3. Descriptive statistics of the total annual energy produced by the PV array (kWh/y).
StatisticsForecastedMeasured
Values50005000
Mean2456.361843.26
Standard Deviation68.2668.87
Median2455.761844.05
Minimum2202.031603.69
25% Percentile2410.291795.62
50% Percentile2455.761844.05
75% Percentile2503.091889.92
Maximum2675.222116.13
Table 4. Descriptive statistics of the total cost of energy production (€/kWh).
StatisticsForecastedMeasured
Values50005000
Mean0.440.58
Standard Deviation0.010.02
Median0.440.58
Minimum0.400.51
25% Percentile0.430.57
50% Percentile0.440.58
75% Percentile0.440.60
Maximum0.490.68