1. Background
The growing desire to improve the efficiency and reduce the environmental impact of industrial processes is strongly influenced by the optimal management of heat, mass, and power flows. This calls upon development of holistic approaches, addressing all factors collectively. Such approaches must consider energy and material (in particular water) recovery within a comprehensive process integration framework which incorporates other options such as organic Rankine cycle (ORC), which can generate electricity from low–medium-temperature heat and providing the remainder for low temperature processes or other uses. Water is a universal energy carrier and plays an intermediary role in transferring heat among processes. Steam is also used in Rankine cycles to produce electricity while satisfying heating demands of processes at medium–high temperature levels. Moreover, at medium to low temperature levels, an ORC can be used to produce electricity, reduce cooling duties and, if integrated with process streams, can serve as a heat transfer medium at different temperature levels. These complex interactions necessitate simultaneous consideration of their performance to improve efficiency and environmental impact of industrial processes [
1].
As summarized by Kermani et al. [
2], the research on heat-integrated water allocation network (HIWAN) design has extensively focused on single plant operations [
3], while very few authors have proposed inter-plant methodologies [
4,
5,
6]. Nonetheless, they are limited to water recovery among plants while heat recovery is overlooked as they do not consider non-water process thermal streams. For more details the readers are encouraged to refer to the review papers by Ahmetović et al. [
3] and most recently by Kermani et al. [
2] who have extensively studied HIWAN design methodologies. Independently, inter-plant heat recovery has also been extensively addressed in the literature as part of “total site heat integration” (TSHI) methodologies which was initially proposed by Dhole and Linnhoff [
7]. Shortly after, Hu and Ahmad [
8] proposed a graphical approach by using exergy analysis for steam costing to find the optimal pressure levels of the utility system which act as indirect heat transfer media between processes. This was further elaborated by Klemeš et al. [
9] to address inter-plant heat integration. In all these cases, only thermal utilities were considered as the heat transfer media. Use of fluids loops (such as water) and direct heat exchange have been recently addressed by many authors [
10,
11,
12,
13,
14]. Most recently, Tarighaleslami et al. [
14] proposed a unified conceptual approach addressing direct (hot water loops) and indirect (steam) heat recovery simultaneously. In summary, the literature did not consider the role of process water units in their approaches. Liew et al. [
15] provided a comprehensive overview of these methodologies with emphasis on inter-plant heat and power integration. Following a survey of the literature, it is imperative to lead the direction of research towards:
developing methodologies for total site heat, mass, and power integration by considering potential heat and mass recovery technologies;
incorporating sustainability and environmental criteria within the optimization framework;
designing optimal hot water and hot oil loops;
developing multi-period, multi-objective methodologies to address the eminent trade-offs among social, environmental, and financial drivers; and,
giving priority to hybrid (conceptual–mathematical) methodologies to overcome the main drawback of mathematical approaches by including industrial and practical insights.
The combined heat and power superstructure developed by Kermani et al. [
16] can address the first gap, while the HIWAN hyperstructure developed by Kermani et al. [
17,
18] can address the second gap by integrating a cooling water network with the process water network. The aim of the current work is to address several gaps (1, 3, 4, 5) by proposing a hybrid mixed-integer nonlinear programming (MINLP) superstructure for simultaneous optimization of heat, water, and power. The superstructure is constructed by combining the targeting superstructure of HIWAN [
17] and the combined heat and power superstructure [
16] for both ORC and steam cycle modeling and optimization.
2. Problem Definition and Proposed Approach
The proposed methodology is formulated as a MINLP superstructure.
Figure 1 provides the key components of the proposed generic superstructure. Provided is a set of industrial sites,
P, (or clusters within each plant). Each site
i has a set of water unit operations (demands:
WAN, sources:
WAN) and a set of thermal streams (hot:
HS, cold:
CS). Direct heat or mass exchanges are not allowed between sites (for practical reasons). Mass exchange is managed via the water network by incorporating several tanks which also handle cooling requirements. Heat exchange is managed via addition of several heat transfer vectors, such as steam cycle, ORC, heat pump, and water network. ORC and steam cycles can both be used to transfer heat by evaporating and condensing between sites while producing electricity where a pressure difference exists. The cooling system is modeled as part of the water network. Inter-site and inter-plant operations are essentially the same in terms of modeling (i.e., restricted exchanges of heat and resources except via a (de)centralized utility hub) which can both be addressed by the proposed superstructure.
There exist many objective functions that can be considered in optimizing the proposed MINLP superstructure. Due to the presence of trade-offs among these objectives, no single solution possesses the optimal performance for all objectives and hence a multi-objective optimization framework has been selected to provide many optimal solutions (expressed as a Pareto frontier). In the context of this work, three objective functions are considered and defined as: minimizing the total freshwater consumption, maximizing the net power output (i.e., production minus internal demands), and minimizing the annualized investment cost of the system. The latter includes annualized investment cost of equipment (i.e., pumps, turbines, compressors, furnace, etc.) and heat exchanger network (HEN) cost. Freshwater consumption is used as an objective in this work as the most relevant indication of industrial impact on the water system and an indicator, which can be influenced by industry. More complex methods, such as water footprinting, could be substituted but are not employed here so as not to further complicate the approach. The overall problem is solved subject to heat, mass, power balances, and sizing constraints. To this end, combined heat and power superstructure constraints introduced by Kermani et al. [
16] can be incorporated in the mixed-integer linear programming (MILP) formulation of Kermani et al. [
17] to address the entire set of constraints.
The resulting MINLP model contains binary variables addressing investment cost coefficients, choice of working fluid, and equipment. In addition, the equations governing the thermodynamic properties of various working fluids (in modeling Rankine cycles [
16] and heat pumping [
19]) are non-convex which further increases the difficulty of reaching a global optimum. This has discouraged the authors from using global MINLP optimization frameworks. As discussed by Jeżowski [
20], there exist several ways to deal with these difficulties including the applications of linearization [
21,
22], good initialization, sequential, or meta-heuristic approaches [
23,
24]. Kermani et al. [
2] and Liew et al. [
15] have provided comprehensive reviews of these techniques in the field of HIWAN design and total site heat (and power) integration, respectively. One of the main benefits of genetic algorithms (GAs) is their ability to escape local optima due to random mutation of decision variables at each generation and hence are well-received by the scientific community, in particular for this application, in optimizing Rankine cycle’s decision variables [
2,
15]. To this end, the authors have adapted the GA-based multi-objective optimization framework of Kermani et al. [
16] for solving the proposed MINLP model. Linearization and sequential approaches have also been incorporated at various stages of the proposed solution strategy to address large-scale cases (
Section 4.3).
The methodology is applied on a large-scale kraft pulp mill (up to 1000 air-dried tons (adt) of kraft pulp production per day). The pulp and paper industry is energy-intensive and consists of consuming/transferring large quantities of energy to complex freshwater and contaminated water networks. This also includes cooling duties related to several low–medium-temperature hot thermal streams, which are potential candidates for heat recovery and/or electricity generation via ORC integration. This makes the kraft process a promising industry to validate the performance and robustness of the methodology.
3. Kraft Process
The kraft process is a chemical/mechanical process converting wood chips to pulp (
Figure 2). The process starts with the steaming and screening of wood chips to be prepared for cooking. Steaming is used to preheat the chips, recover heat from the flashed cooking liquor, and remove the entrained air to facilitate impregnation during the cooking stage. Screening is also carried out to remove knots and any non-wood elements. The steamed chips are sent to a high-pressure and high-temperature (∼160–170
C) cooker (i.e., digester), where cellulosic fibers are separated from the chips by use of a chemical blend known as liquor. Liquor consists of white liquor and spent black liquor from the previous cooking batch. White liquor is a mixture of NaOH and Na
S that is used for the delignification of wood chips. Heating is provided either via direct steam injection/blowing or through indirect heating in steam/liquor heat exchangers. The outlet of the digester is washed to separate the spent liquor (i.e., black liquor) from the fibers and goes through a recovery process for reuse. Any incomplete cooked fibers, knots, or debris are separated using screening devices and are recycled to the digester. The pulp is then bleached using a sequence of bleaching agents, such as ClO
, O
, and H
O
. At the wet-end section of the pulp machine, pulp is pressed to drive out water. Thereafter, it is sent to the dry-end where any additional water is removed by evaporation via blowing hot air. The final moisture content is reduced to approximately 10% for market requirements. The black liquor (around 15% dry solid content) from the washing section is sent to multi-effect evaporators and subsequent concentrators to yield highly concentrated dry solid (75% dried solid content). The resulting heavy black liquor is then burnt in a recovery boiler. The recovery boiler has four functions [
25]:
burning of organic materials to produce water and CO which are more environmentally benign;
recovering the energy content of the burnt organic materials in the hot flue gases to run turbo-generators or to satisfy the steam demands of the mill;
restoration of inorganic chemicals in black liquor as chemical pulping agents; and
recovery of by-products, e.g., tall oil and turpentine.
The inorganic residues form a smelt that consists of NaCO and NaS. The smelt is used to produce green liquor, which goes through a causticizing process to produce NaOH that together with NaS form the white liquor.
Each section of a pulp mill might have water, heating, and/or cooling demands. Fresh (i.e., contaminant-free) water is used in all mill departments as part of the process or for dilution purposes. Consequently, the warmed-up cooling water is stored in water tanks at several temperature levels and is distributed to the processes. Water, as a process stream, is used in several sections including the washing, bleaching, recovery boiler, lime burning, and steam production sections. In addition, contaminated outlet water from some sections such as washing and bleaching can be reused and/or recycled. In a pulp mill, water is a contaminant and an energy carrier [
26]. In a typical bleached kraft mill 20–90 t/adt of freshwater and 10–14 GJ/adt of heat is consumed and the electricity generation from the recovery boiler is between 600–800 kWh/adt [
25]. The energy efficiency of the kraft mill is strongly interconnected with the correct management of water and energy in the mill [
27]. Process integration techniques, including heat integration, water network optimization, and steam cycle operation optimization, can significantly reduce the water and energy consumption in the mill.
Typical research in water–energy optimization in the pulp and paper industry is often limited to specific sections of a plant and lack a global vision of the process (e.g., brown stock washing system [
28], white water networks [
29], bleaching stage [
30], and evaporators condensates and vacuum pump sealing reutilizations [
31]). This results in the absence of a systematic approach that can address all interconnections among heat, water, and power in the pulp and paper industry. This paper proposes a methodology to address all these elements in a systematic manner through its application on a bleached kraft pulp mill case study.
4. Data Extraction and Problem Formulation
Collecting process data includes characterizing an industrial site and its main features to acquire deep understanding of the main elements in the process and their operational modes. This step has a significant influence on the subsequent steps of the analysis. Project objectives should be defined and discussed at this step, as it directly influences the amount and level of detail in data extraction. Furthermore, this must be performed in such a way to facilitate future projects [
17]. Three main approaches are considered to facilitate data extraction and building the mathematical model which represents the mill:
Only the temperature and maximum allowed inlet and outlet contaminations must be extracted from water unit operations, such as bleaching or washing. The proposed MILP superstructure [
17] will consider all thermal stream possibilities within the water network.
Successive heat exchangers without any stream splitting are combined into a single stream (e.g., three phases of a cold stream consisting of pre-heating, evaporation, and superheating are modeled as one stream). Phase changes are still considered with the corresponding heat load.
Many process hot thermal streams in the current mill are part of the water network (i.e., being cooled down). Those with unknown (i.e., unmeasured) thermodynamic characteristics are replaced by their associated cooling water stream. This approach adds two water unit operations to the overall problem (i.e., a demand and a supply).
In the current operating conditions of the mill, no heat integration exists between hot and cold thermal streams. Demand of water process operations were satisfied in the water network, while any extra heating required in the network was satisfied by steam, either directly or indirectly.
4.1. Data Classification
Appendix A provides the operating data of the case study. This list was compiled through communication with mill personnel and expert insight to provide an accurate representation of a typical kraft pulp mill:
Cold process streams: Nineteen (19) cold process streams exist in the mill (
Table A2). Among these, the heat loads of the air pre-heater and black liquor heater are proportional to the size of the recovery boiler and hence were modeled as part of the black liquor furnace (
Section 4.2.1).
Hot process streams: Twenty (20) hot process streams are cooled in the mill (
Table A3). After combining heat exchangers in series, fifteen (15) hot streams should be considered. As an example, the primary, secondary and inlet/outlet condensers in the evaporation section are modeled as 9.9 kg/s of saturated steam at 1.9 bar. Among these hot streams, five (5) represent several equipment cooling duties where temperatures of the hot sides are unknown (or uncertain), such as the bearing cooler, pulp machine cooler, and fan cooler. These heat exchangers were each modeled as two water unit operations, source and sink.
Waste thermal streams: There are four (4) waste hot streams that can be recovered for heating purposes (
Table A5).
Hot utility: Highly concentrated black liquor is burnt in a recovery boiler to produce steam at 60 bar. The steam is passed through steam turbines to generate electricity. The process steam demands are satisfied using three pressure levels: high (10–12 bar), medium (5 bar), and low (1 bar) pressures (see
Section 4.2.1).
Water unit operations: Fourteen (14) water unit operations were extracted for this case study (
Table A4, thirteen (13) demands and six (6) sources of water at various temperatures). One major issue in developing a mathematical model of water recycling is the availability of quantitative data on the contamination levels of water streams. To overcome this issue, several restrictions are discussed and imposed. In addition to the method described by Kermani et al. [
17] (step 2), which is used to forbid or restrict specific mass exchanges, a level of quality is defined for each water unit operation (source/sink) using binary parameters. To address this, the following constraint was added to the model:
where
and
are quality parameters assigned to units
i and
j, respectively. This constraint implies that a source unit of quality 0 cannot be recycled in any other sink unit except those of quality 0. Moreover, the demand of a sink unit with a quality of 0 can be satisfied by any source unit. The quality of all water tanks and all water units acting as cooling utility (i.e., indirect heat exchange) was set to 1. The quality of wastewater disposal units was set to 0. Contaminated water unit operations were modeled with a quality of 0, these are: the demands of bleaching, washing, pulp machine, pressure disc filter, and smelt spout, and the sources of pulp machine, condensates in the recausticization section, and smelt spout. This approach facilitates the implementation of specific restrictions. Additional mill-specific restrictions and/or recycling–reusing opportunities were incorporated into the model:
▹ Direct recycling within each tank is forbidden.
▹ The outlet of the pulp machine cannot be directly reused.
▹ Consequently, the white water tank was modeled to recycle white water to the pulp machine.
▹ The outlet of the vacuum pump cannot be recycled in the bleaching section.
▹ The outlet of the cooling water cooler cannot be sent to wastewater disposal.
▹ Freshwater cannot be used to dilute or (directly) cool wastewater.
Water network: Freshwater is available at 20 C. Wastewater disposal is at 30 C. The water pathways through the plant are managed by three tanks, namely, treated warm water (28 C), raw warm water (52 C), and treated hot water (60 C). Their temperatures are due to the current operating conditions of the mill and are defined as variables in the optimization.
4.2. Problem Formulation
To represent the current distribution of different departments in the kraft mill and to impose certain restrictions on heat and mass exchange, the mill was divided into three “industrial clusters” (similar to the schematic representation in
Figure 1):
DG cluster: Digester cluster, which includes the digester, washing, and recausticization units, and represents the process of breaking down wood chips for pulp production.
PM cluster: Pulp machine cluster, which encompasses the pulp machine, bleaching, and ClO units and represents the industrial site for producing market-value pulp.
RB cluster: Recovery boiler cluster, which encompasses evaporation, concentration, and recovery boiler units. It represents the steam production section and the process of regenerating chemicals for green liquor production.
No direct heat or mass exchanges are allowed between clusters: mass exchange can only take place via water tanks, whereas heat exchange can take place either through hot water loops (part of the water network) or via evaporation and condensation of water (i.e., steam cycle) or another working fluid (i.e., ORC).
4.2.1. Recovery Boiler
The steam and electricity demands in kraft mills are satisfied through burning concentrated black liquor. Data from Vakkilainen [
32] was used to model the recovery boiler furnace (
Table 1). The furnace is assumed to be existing and thus does not have an investment cost. In addition, the recovery boiler of this Canadian kraft pulp mill has been recently upgraded and hence the maximum achievable steam pressure is assumed to be 160 bar [
32]. Given the lower heating value of black liquor, air to fuel ratio, and the furnace’s temperature level, the radiative (constant temperature, 1000
C) and convective heat loads of the furnace amount to 4065 and 7154 kJ/kg of black liquor, respectively.
4.2.2. Steam Cycle
Steam is currently produced at 58.7 bar and 473
C. Process steam consumption is at 3 levels: 12, 5.2, and 1 bar. The ORC superstructure [
16] is used to model the steam cycle by changing the working fluid to water and introducing four (4) pressure levels. Several architectures, including regenerative, superheating, and open and closed feedwater heaters, are considered. Moreover, to meet the specificities of combined heat and power production in typical industrial plants, the following adaptations are imposed:
4.2.3. Cooling Water System
The cooling water system has the task of cooling the process streams, equipment, and waste streams. The heated cooling water can be recirculated (recirculating system) in the mill or discharged (once-through system). The latter requires a great amount of water usage and is most suitable for mills located near an appropriate water source. Moreover, the temperature of the discharged water should comply with environmental regulations. Recirculating cooling systems significantly reduce water consumption in the mill by reusing the chilled cooling water as such or as part of the process and are mainly classified as closed or open cycles. In an open cycle, the heated water is cooled by directly blowing air and evaporating part of the cooling water. The lowest temperature to which the water can be cooled down is theoretically limited to the wet bulb temperature. This requires the addition of clean make-up water to compensate for the loss. A closed cycle uses refrigeration and heat exchangers to cool the water; the lowest possible outlet temperature of the cooled cooling water is limited by the heat exchanger minimum approach temperature (
) [
25]. Open recirculating cooling systems were modeled using data presented in
Table 2 [
25]. The outlet temperature of chilled cooling water is assumed to be 26
C.
Figure 3 illustrates the overall layout of the kraft mill together with the considered clustering. All water unit operations are also shown in this figure. The units with filled arrows follow the
branching approach [
17] where a splitter/mixer is placed at their outlets/inlets, respectively.
4.3. Solution Strategy
Within our previous work [
16,
18], two solution strategies were proposed:
Kermani [
18] proposed an iterative three-step sequential solution strategy for targeting and designing HIWANs where problems
P1 and
P2 were formulated as MILP models to target utility consumptions and provide potential thermal matches. Problem
P3 was proposed and formulated as a nonlinear programming (NLP) problem to optimize the operating conditions, i.e., temperatures and flows, in the HIWAN subject to thermal matches of problem
P2 and utility targets of problem
P1. In addition, the heat recovery approach temperature (HRAT) in the water network was optimized by iteratively changing its value and selecting the best solution among all. Temperatures of water tanks could also be optimized as part of problem
P3.
Kermani et al. [
16] proposed a decomposition solution strategy and a novel superstructure for the optimal integration of ORCs into industrial processes addressing fluid selection, operating condition determination, and equipment sizing. The solution strategy uses a decomposition approach with the upper level handled by a GA in which the working fluid and its operating conditions are optimized. The lower level optimization applies a sequential solution strategy to solve the optimal ORC architecture and equipment sizes using a deterministic MILP model (similar formulation to problem
P1 in [
18]) and to provide a set of potential thermal matches by solving problem
P2 ([
33,
34,
35]).
To solve the problem of combined heat, water, and power optimization, a solution strategy should be considered that can address the specificities of the two problems, i.e., HIWAN and combined heat and power, in a systematic manner. Accordingly, problem
P1 can include ORC and steam cycle superstructures with fixed operating conditions to maintain linearity. Problem
P2 is the heat load distribution (HLD) model and remains unchanged. To optimize the operating conditions of the ORC and steam cycle, GA is implemented in a similar way as presented in [
16]. However, in addition to decision variables of ORC and steam cycle superstructures, HIWAN variables can be addressed, including water tank temperatures and HRAT. As the aim of the proposed methodology is not to provide a detailed design of HEN, problems
P3 and
P3 can be eliminated at this stage. Estimating the HEN cost is carried out as described in [
16]. The objectives of the solution strategy are considered to be maximizing electricity production, minimizing freshwater consumption, and minimizing the annualized investment cost.
5. Preliminary Analysis
5.1. Current Operating Conditions
In the current operating conditions of the mill, hot and cold process thermal streams are not integrated with each other; hence, to estimate utility consumptions, i.e., hot utility (steam consumption, black liquor flowrate), grand composite curves of thermal streams were considered separately, as presented in
Figure 4. Overall, 131.4 MW (10.36 GJ/adt, assuming operating time of 8000 hr/yr) of steam are required. Taking into account the operating conditions of the steam cycle and the characteristics of the black liquor furnace, this corresponds to 14.89 kg/s of black liquor (75% solid content) combustion in the recovery boiler and producing 28.3 MW of electricity. Assuming a demand of 550 kWh/adt of electricity [
25], this corresponds to 3.2 MW of net electricity output. It should be noted that the steam and electricity production of a black liquor recovery boiler is more than enough to satisfy the demands of a typical kraft pulp mill [
25], hence a bark boiler was not added to the model.
Figure 4b illustrates the hot grand composite curves of the three clusters (83.8 MW in total) that are cooled using the water network. Among the hot thermal streams and water unit operations in the case study, several consume freshwater at 20
C (under the current operating conditions) as provided in
Table 3.
Other streams/units are cooled via the water management system in which three water tanks manage and distribute water. Hence, it can be assumed that total water consumption is the summation of freshwater directly used in the above-mentioned processes: 821.1 kg/s.
5.2. Thermal Integration
Considering all hot and cold thermal streams in the system (
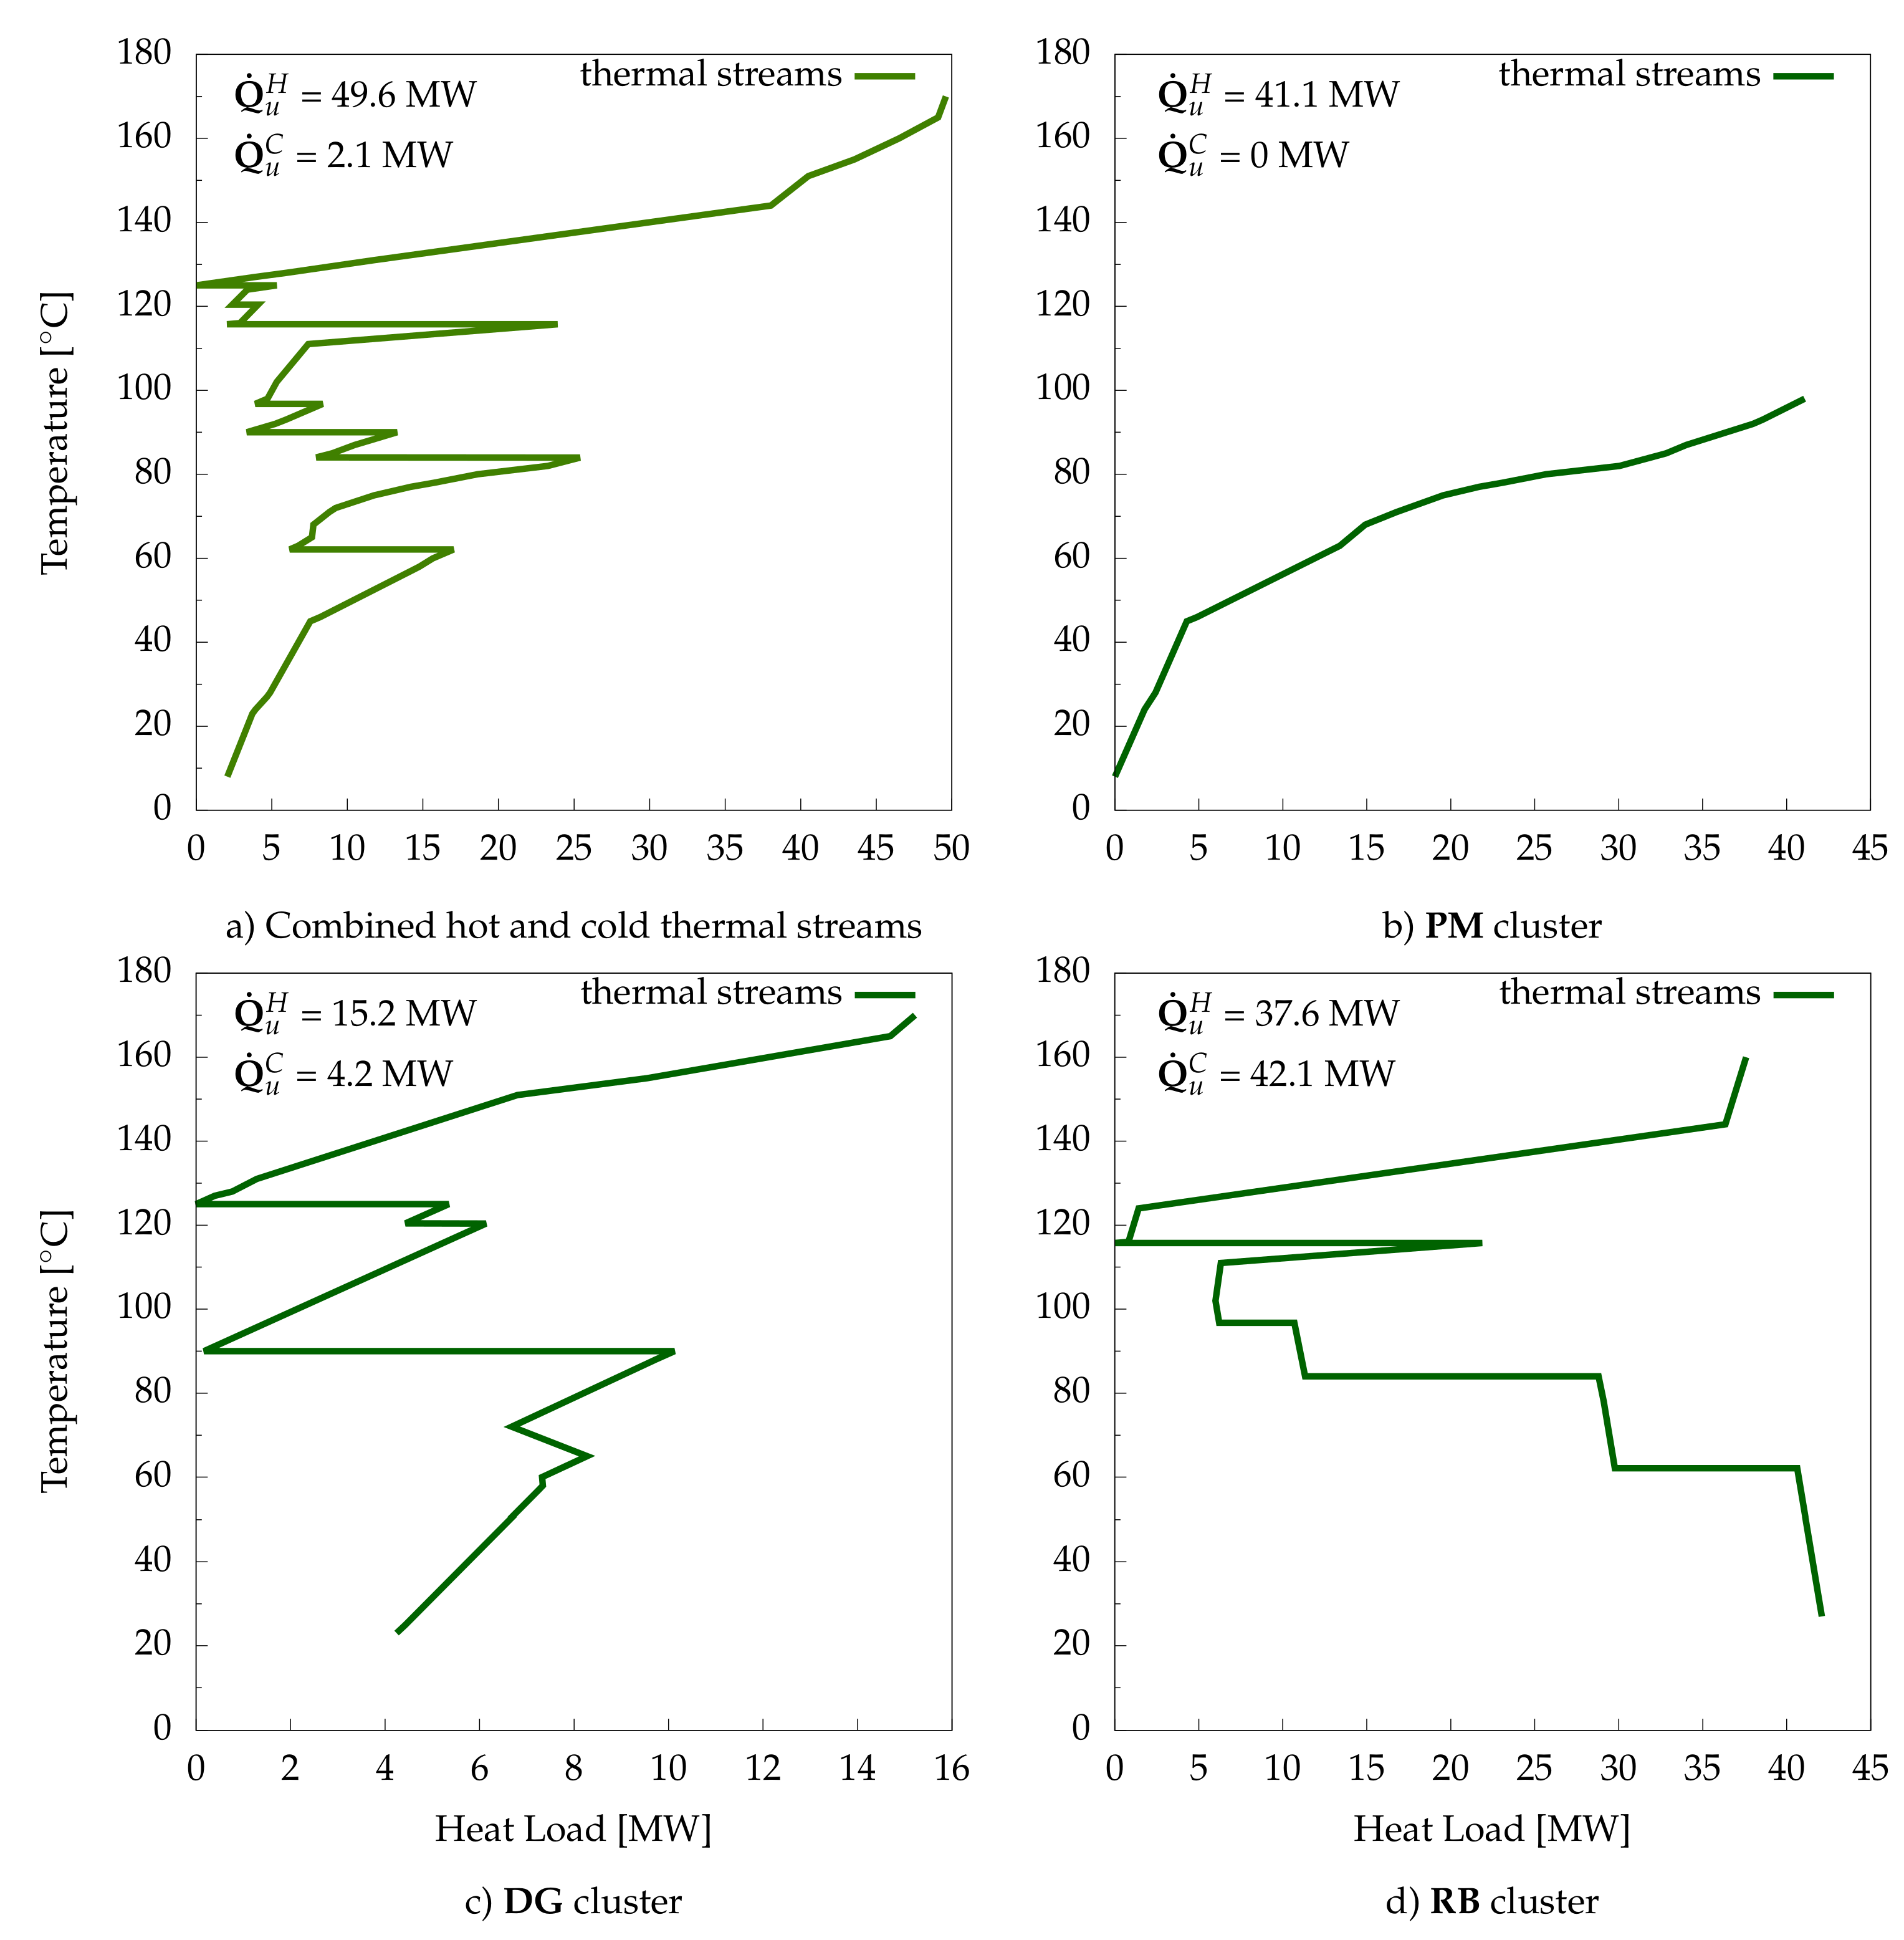
Figure 5a), the minimum hot and cold energy requirements was estimated to be 49.6 and 2.1 MW, respectively, which shows an 81.8 MW heat recovery potential between thermal streams. This presents the ideal case where all thermal streams can exchange heat; however, this is unrealistic for several reasons, many of which related to plant layout.
Figure 5b–d illustrate heat integration potentials within each industrial cluster. In total, 93.9 MW of hot utility and 46.3 MW of cold utility are required, exhibiting a difference of 44.2 MW compared to the total site minimum energy requirement (MER), due to cluster distribution and forbidden matches. Heat recycling among clusters can alleviate this increase in utility consumption. Notably, the pulp machine cluster requires heat at low temperatures (below 100
C), which can be partially satisfied by available medium-temperature waste heat from the other two clusters. Heat recovery between clusters can be achieved via the water network or through an ORC. An ORC can be integrated such that thermal streams in the pulp machine cluster act as a condenser while heat is transferred, and electricity is produced.
5.3. ORC and Potential Working Fluids
It can be observed from
Figure 5b–d that there is a large potential for integrating an ORC with the kraft process which can act as heat transfer mechanism while producing electricity from medium to low temperature heat (90–125
C, as shown in
Figure 5). An ORC superstructure with four pressure levels was modeled for this purpose. The two highest pressure levels are in evaporators and can feed turbines. The superstructure encompasses turbine-bleeding, reheating, regeneration, and multi-stage cycles [
16]. Several criteria are considered in selecting potential working fluids (this set is selected using the interactive parallel coordinate visualization tool developed by Kermani et al. [
16]):
the critical temperature of working fluids is limited between 100–240 C;
the global warming potential (GWP) of working fluids is limited to 200;
working fluids with a flammability hazard [
36] higher than 2 are excluded;
fluids, such as R21 and R123 that are being phased out for environmental reasons are excluded.
6. Results and Discussion
The optimization was run on a Windows machine with an Intel(R) Xeon(R) E5-2680 v4 2.40 GHz CPU and 32 GB RAM. Due to the large size of the case study, function evaluation was computationally expensive with time required in solving the combined problems
P1 and
P2 ranging between 3–130 s. On average, 2000 evaluations could be performed in a 24-h time horizon. The objective function of problem
P1 was selected to be the weighted total annualized cost (TAC) to better explore the trade-off between operating and investment costs [
16]:
Table 4 presents the set of decision variables for the current case study. It comprises the steam cycle decision variables (pressures and level of superheating at the highest pressure level), ORC (pressures, levels of superheating, reheating, and the working fluid), and water network (tank temperatures and HRAT of water thermal streams). Solver options used in the outer and inner optimization levels are also provided in
Appendix B. Similar to the approach in [
16], Dakota’s JEGA library [
37,
38] was used for the outer level, while the commercial solver CPLEX [
39] within AMPL [
40] was used for the inner MILP problems
P1 and
P2. Each instance of problem
P1 had 1129–1359 binary variables and 7588–9053 constraints. In contrast, problem
P2 consisted of 101–361 binary variables (i.e., potential thermal matches) and 1021–3012 constraints. The number of solutions in each generation of GA was fixed at 400 to reduce the number of mutations and crossovers while maintaining diversity within the Pareto frontier. In what follows, the last two generations (after 80,000 function evaluations) are combined and presented.
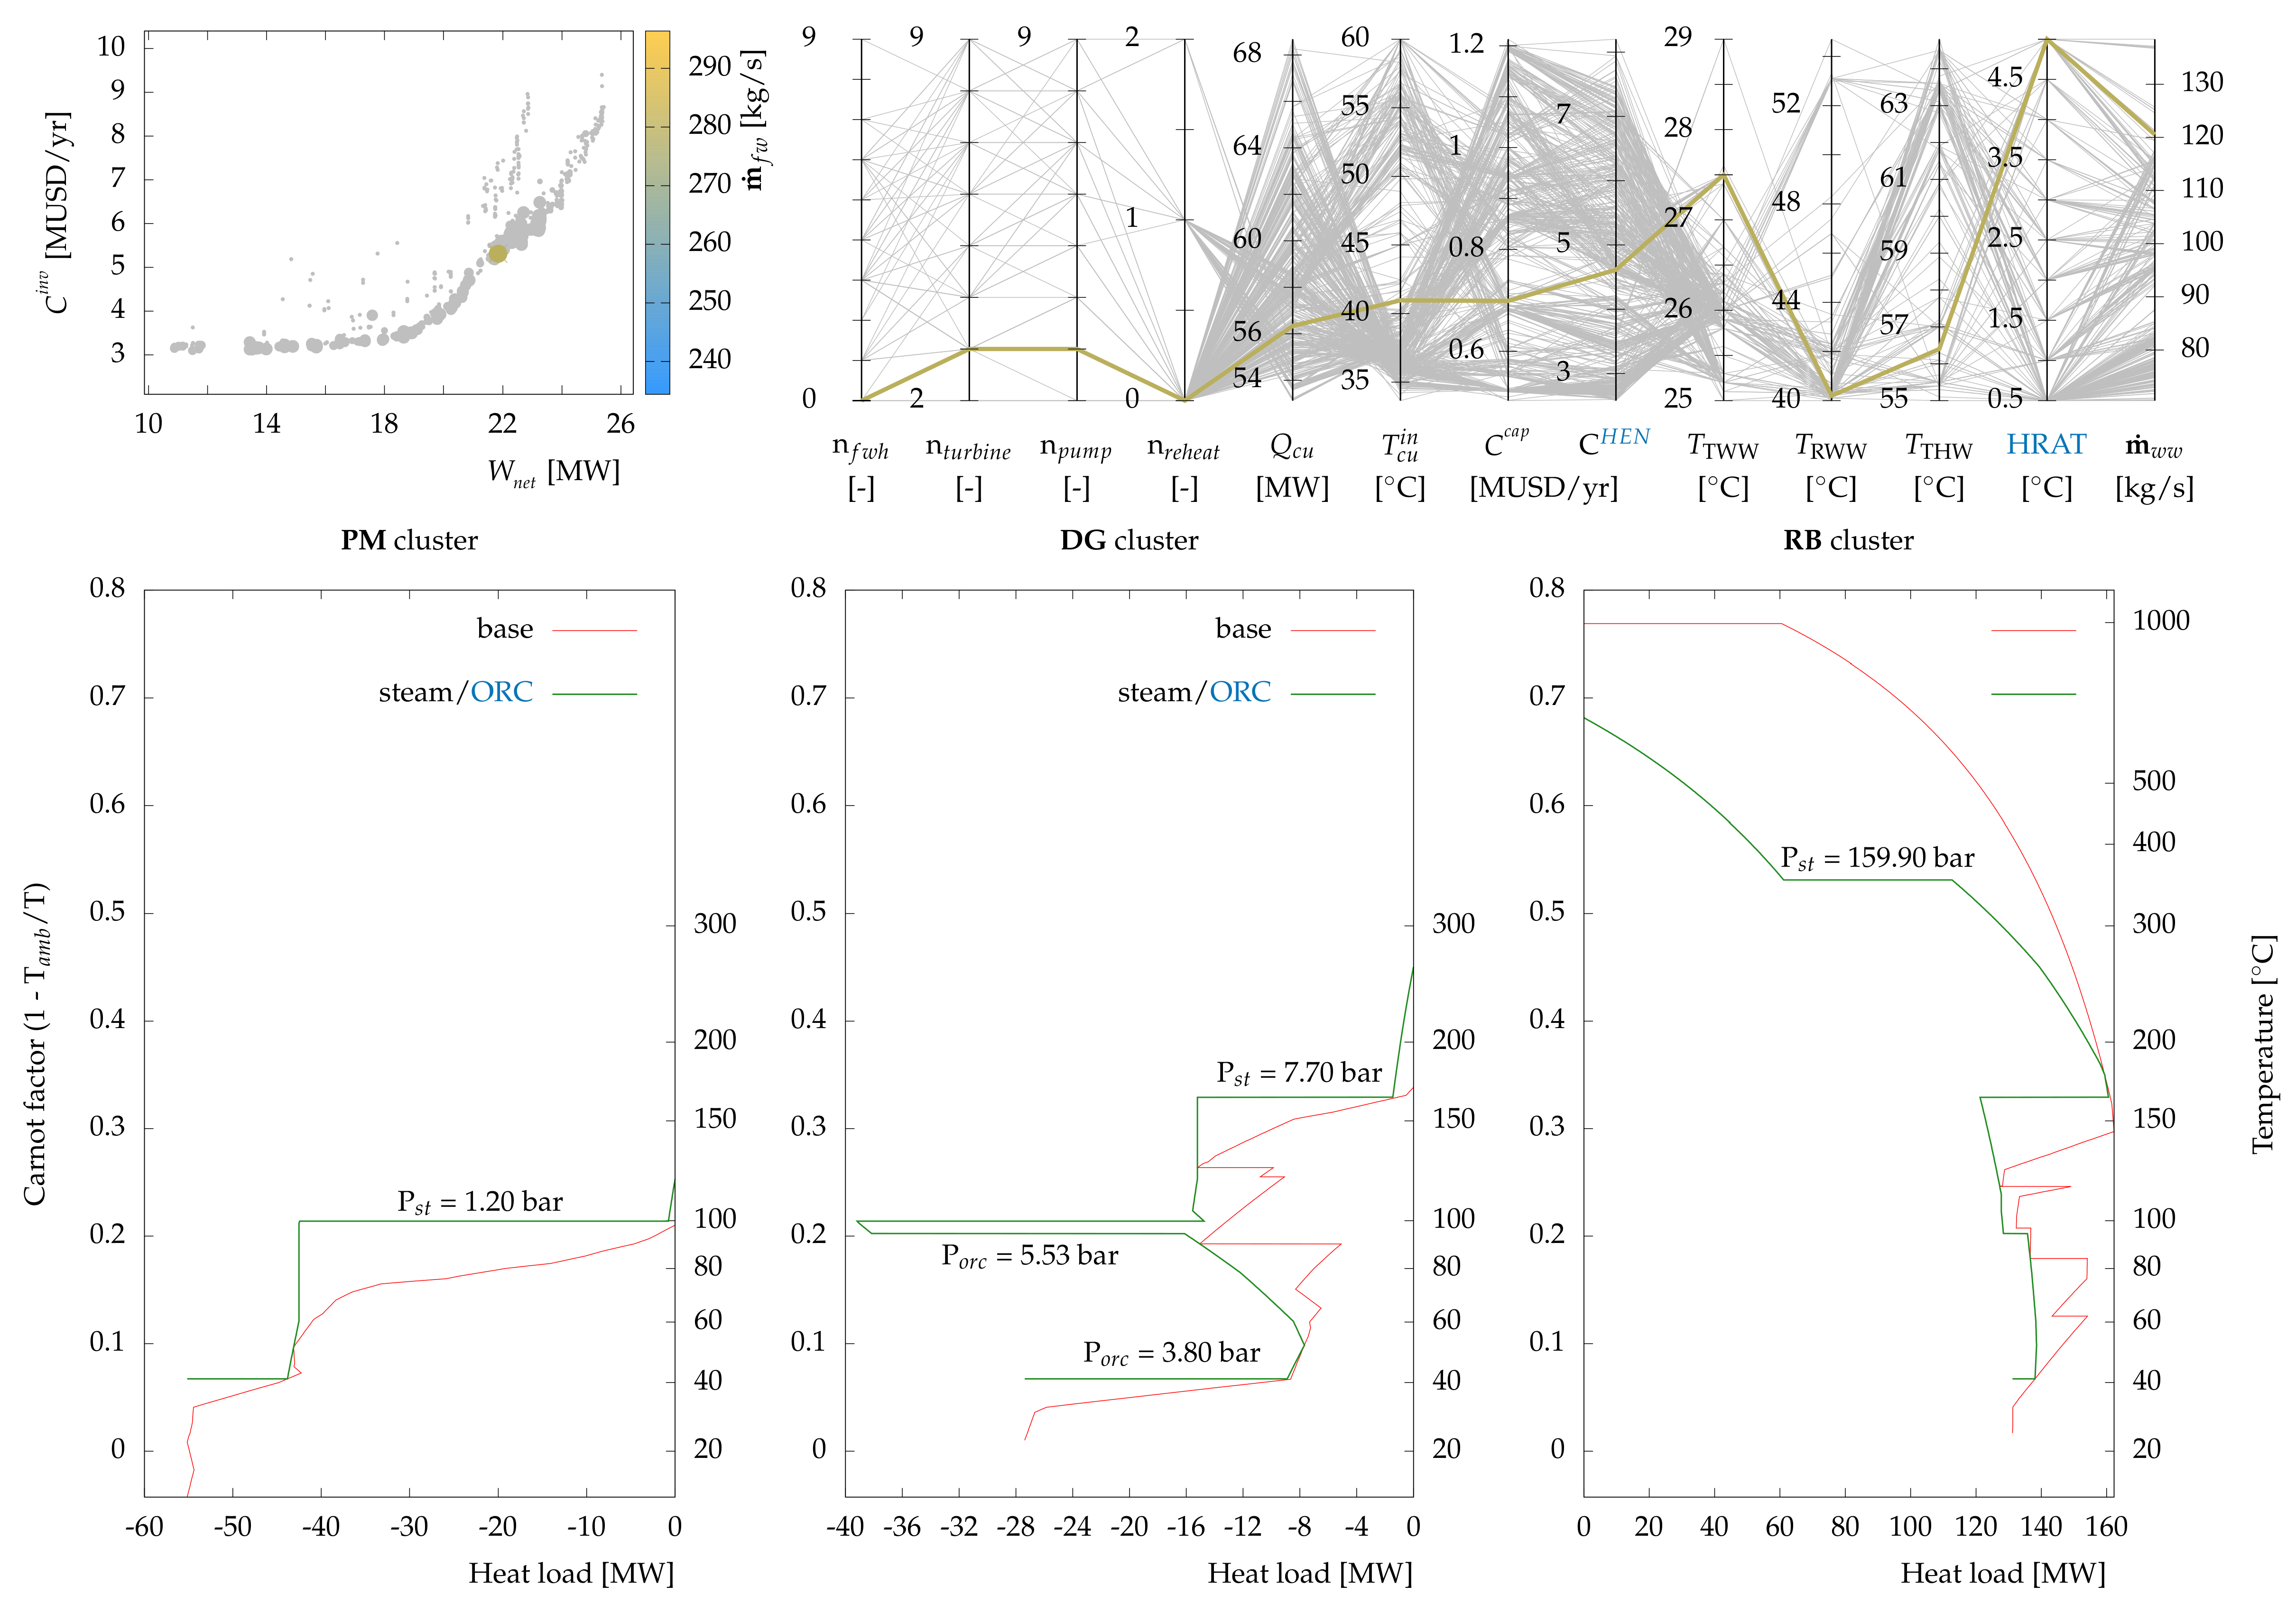
6.1. Pareto Frontiers
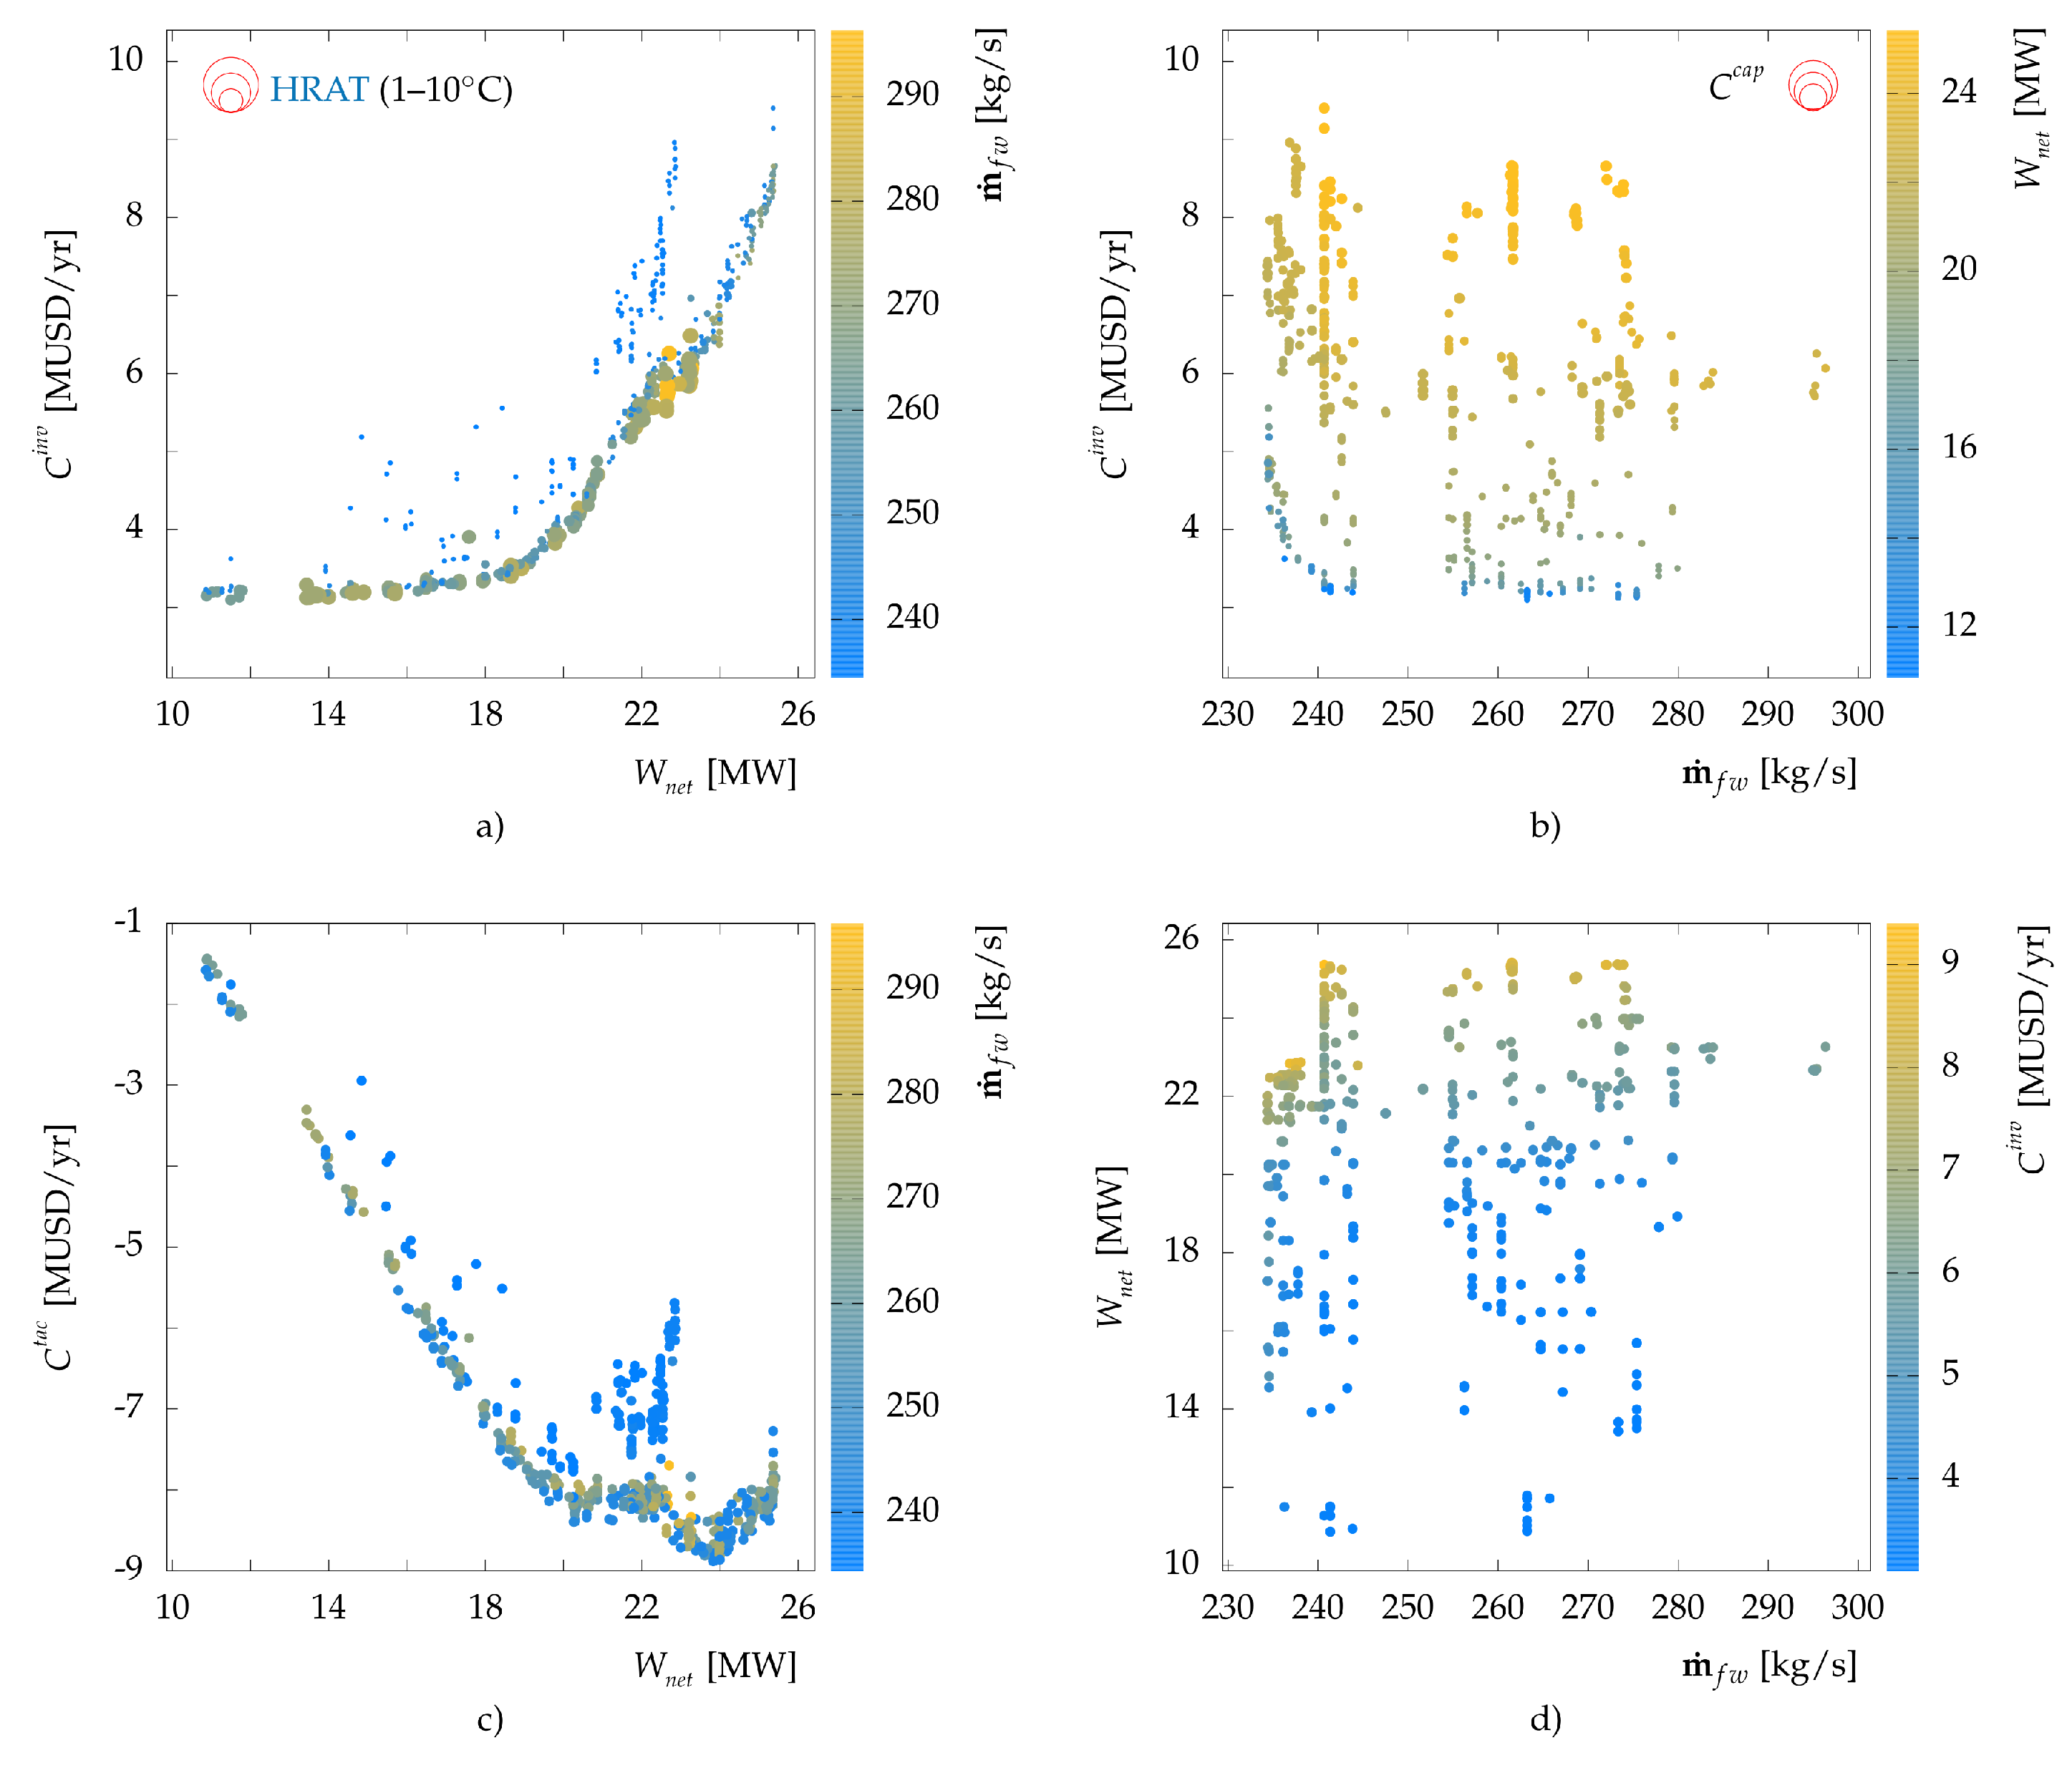
Overall results of the optimization are shown in
Figure 6. Freshwater consumption of the optimal solutions ranged between 230–295 kg/s, (less than 35% of the current consumption), while net power output increased from 3.2 MW in the current conditions to 10–25.4 MW. The main reasons of the large increase in the electricity production can be attributed to many factors:
increased heat recovery among hot and cold process streams which reduced the steam demand of the processes, resulting in higher amount of steam available for the turbines. In addition, the condensation temperature at the outlet of turbines (consequently the pressure) was lower in these cases;
higher pressure and temperature of the produced steam in the recovery boiler;
better water management among clusters that resulted in reduced cooling duties and hence less heat sent to the environment which is valorized via ORC or the process itself; and,
use of ORC to further increase the net electricity production.
Figure 6a presents the Pareto frontier of the investment cost vs. the net power output with colors representing the freshwater consumption and the point size representing the HRAT of water thermal streams. Higher HRAT values exhibit lower investment cost (HEN cost was the dominant element in the total investment cost of the solutions) while less electricity was produced. Investment cost vs. freshwater consumption also exhibits Pareto frontiers at each level of power production (
Figure 6b), i.e., for a specific net power, decreasing the freshwater consumption results in an increase in the investment cost. The TAC of the system is also shown in
Figure 6c. The price of freshwater was set at 375 USD/t [
3] while the price of electricity was set at 10 USD/MWh (average in Europe).
From the economic perspective, it should be noted that although economic parameters might change, minimum freshwater and maximum electricity production potential will remain the same as long as the cost correlations remain relevant (
Figure 6d). With current environmental conditions and concerns, reducing resource consumption and increasing resource efficiency should be of utmost priority. Moreover, TAC of a project must not be the sole criterion for decision-makers to choose from. The solution strategy adapted in this paper puts emphasis on increasing the resource efficiency while providing a set of good solutions (
Figure 6) which exhibit different performances with respect to the relevant indicators. The project manager and the mill experts are then able to analyze these solutions and decide which roadmap to select.
6.2. Analysis
It should be noted here that the cooling utility has variable make-up and power consumptions proportional to its cooling duty (
Table 2). For this reason, reducing the cooling duty by, e.g., 1 MW
, potentially increases the electricity production by 1.03 MW
(electricity demand of the cooling utility reduces by 30 kW
/MW
), while more water remains in the system due to less make-up water demand in the cooling utility. These interactions manifest intertwined relations among these elements. The aim of this subsection is to analyze these relations to some extent by studying several selected scenarios. For each scenario, the integrated grand composite curve of each cluster is provided. This type of figure illustrates how steam and ORCs are thermally integrated with the process. Furthermore, for few selected scenarios, example HLDs are also shown. Analysis of the results of HLD provides insight into possible heat recovery opportunities that should be further analyzed by mill experts to evaluate their feasibilities.
6.2.1. Visualization of all Solutions by Several Indicators
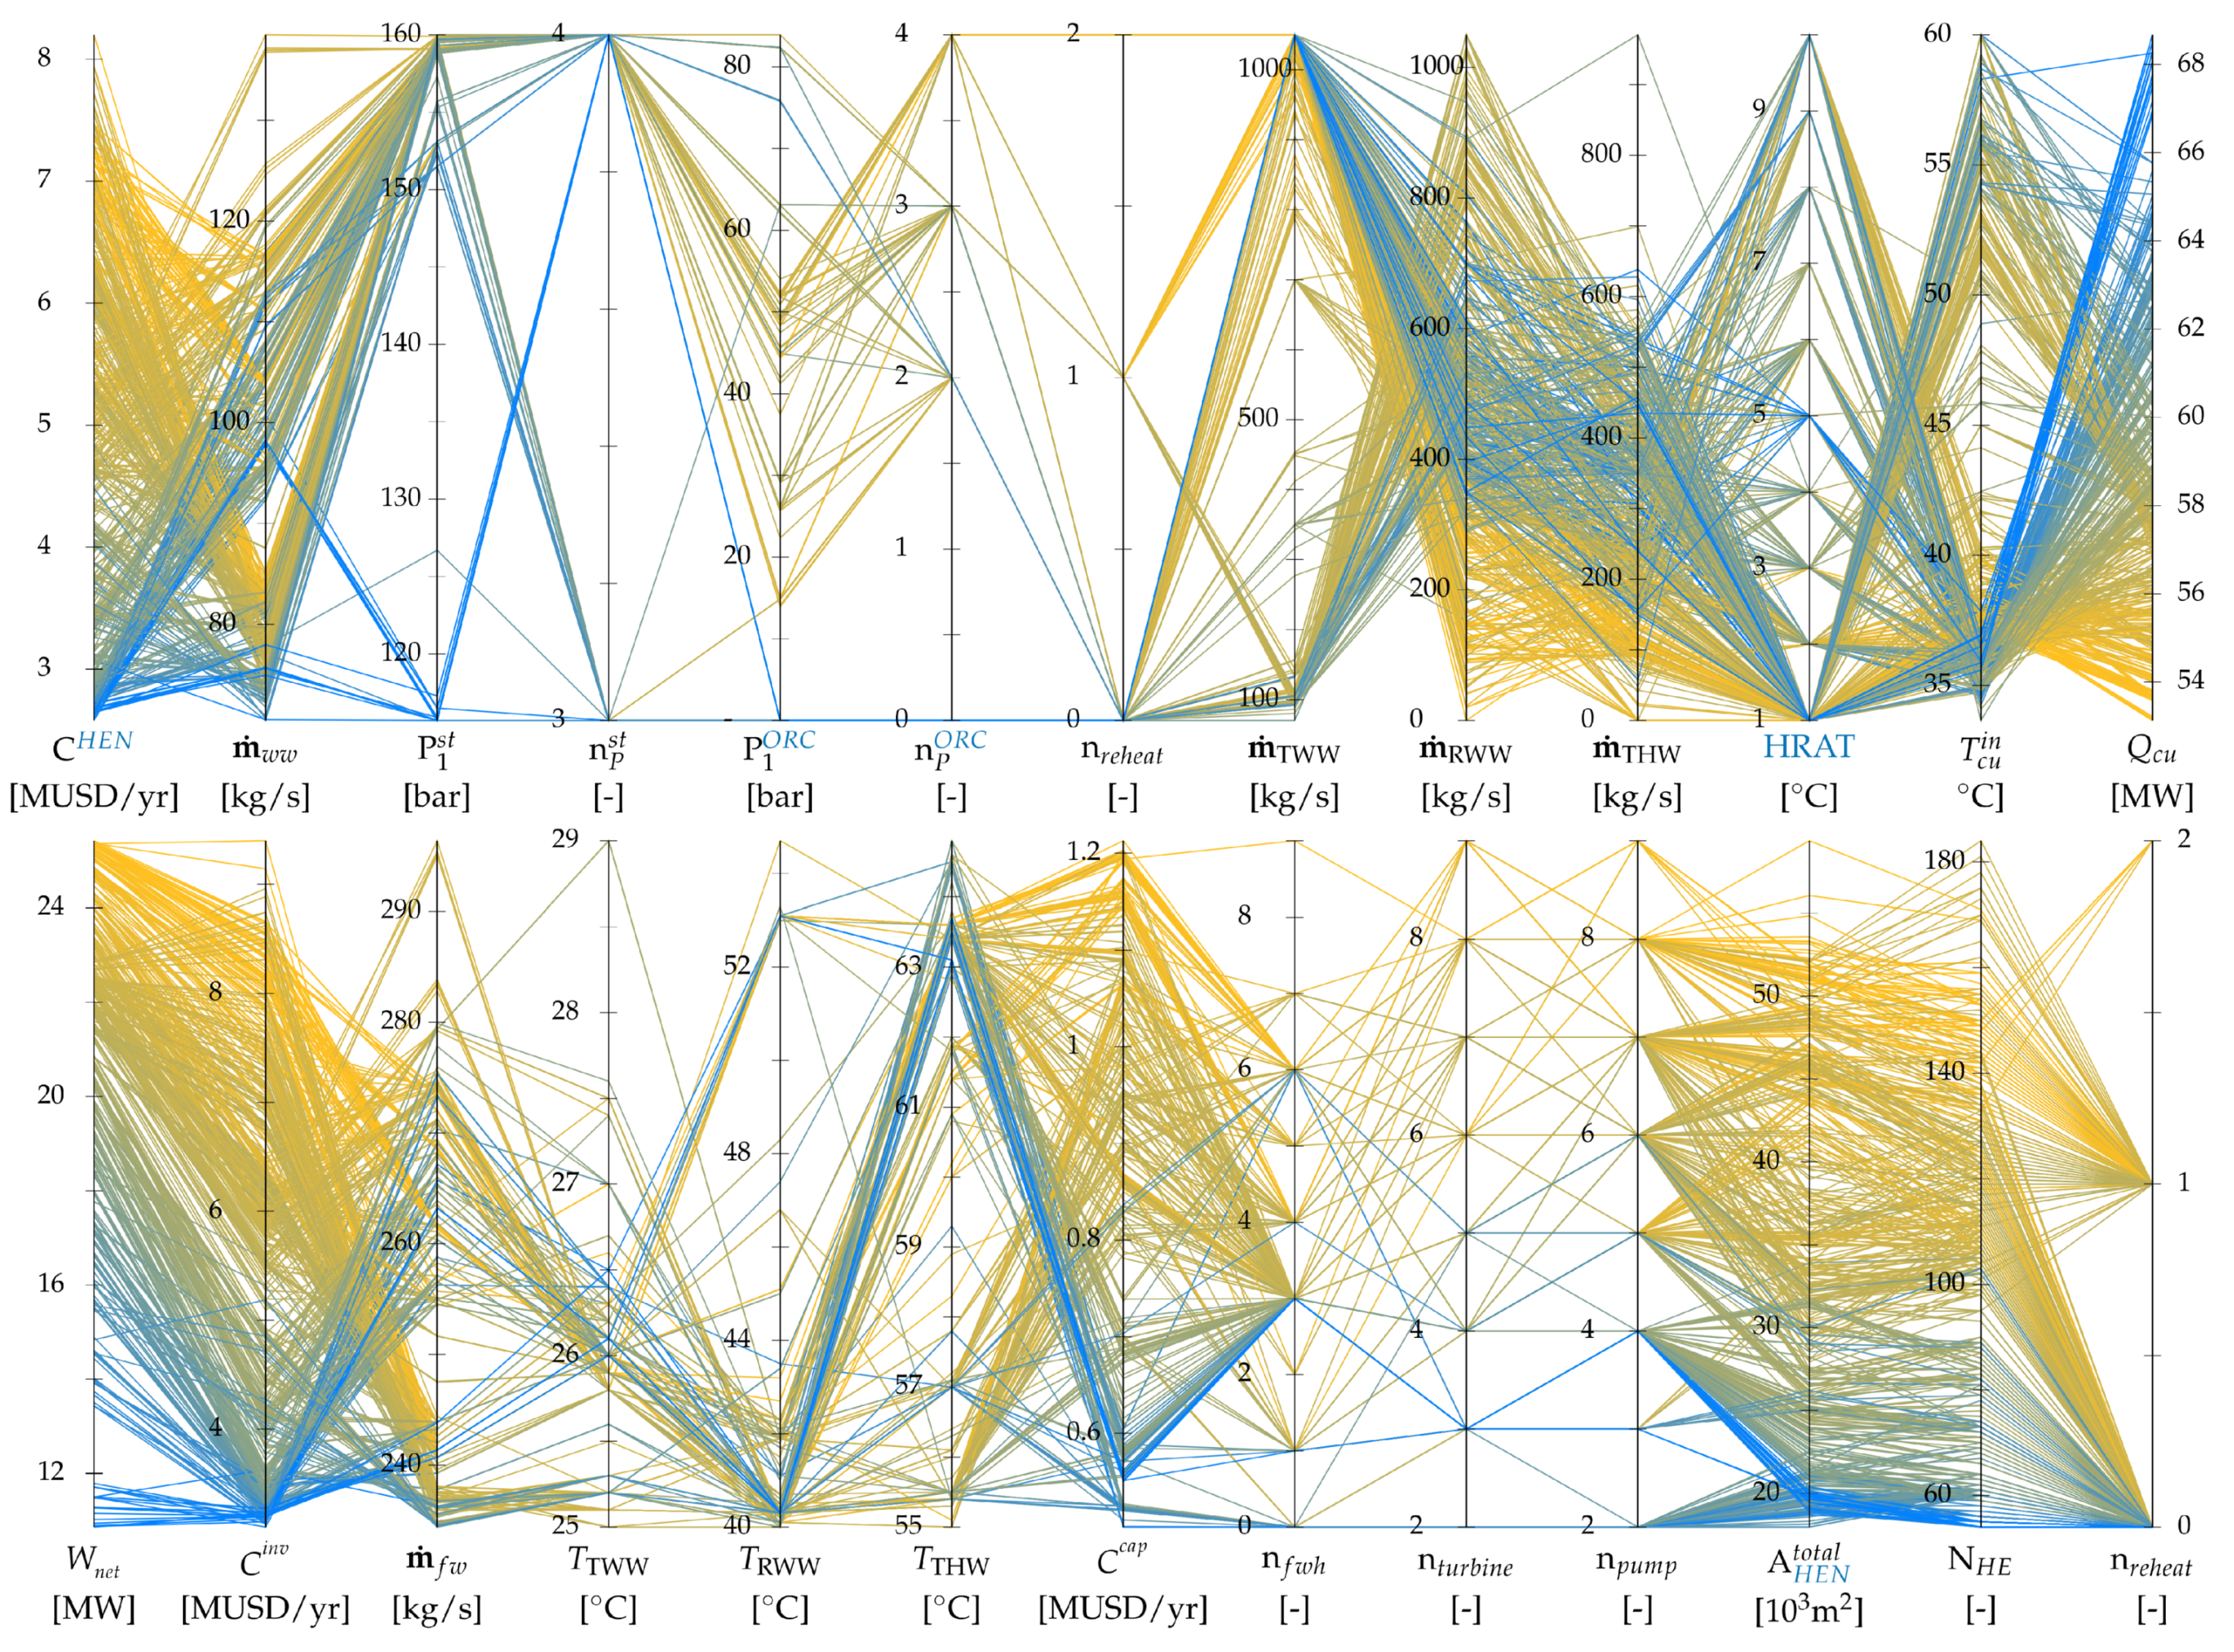
Figure 7 presents several indicators for all solutions in the Pareto frontiers. Several observations are made:
The treated warm water tank temperature was mainly influenced by the return temperature of the cooling tower, i.e., it fluctuated around 26 C.
For solutions with lower electricity production, the temperature of the treated hot water tank was in higher ranges (62–64 C). This is due to heat recovery using hot water loops among clusters. Furthermore, the freshwater flow was higher for these solutions which was due to higher cooling loads in the cooling tower and hence higher demand of make-up water.
The steam production in the recovery boiler occurred at very high pressure levels (150–160 bar) for high power output. As mentioned in
Section 4.2.1 this level of pressure does not pose any upgrade work and hence does not influence the investment cost of the system. For lower power outputs, the pressure was lower, and no ORC was integrated within the process (
Figure 8).
Higher electricity production required more stream matches and higher heat exchange areas indicating a highly integrated system.
For high cooling loads, the temperature of cooling water was lower (around 35–40 C). The reason can be attributed to lower cost of heat exchangers in these cases due to higher approach temperatures.
The visualization of other indicators illustrates the range of differences and similarities between solutions, necessitating the application of multi-criteria decision-making tools in evaluating different solutions.
6.2.2. Extreme Points
Figure 9 illustrates the Pareto frontier by highlighting the solutions with minimum and maximum values of the different objectives. Three solutions reached the minimum freshwater consumption of 234 kg/s with electricity production ranging between 17–25 MW
.
Figure 9 also presents some of the main indicators of these solutions using parallel coordinates. It can be observed that the number of feed liquid heaters increased for higher values of electricity production. Furthermore, the inlet temperature to the cooling tower is inversely proportional to freshwater consumption.
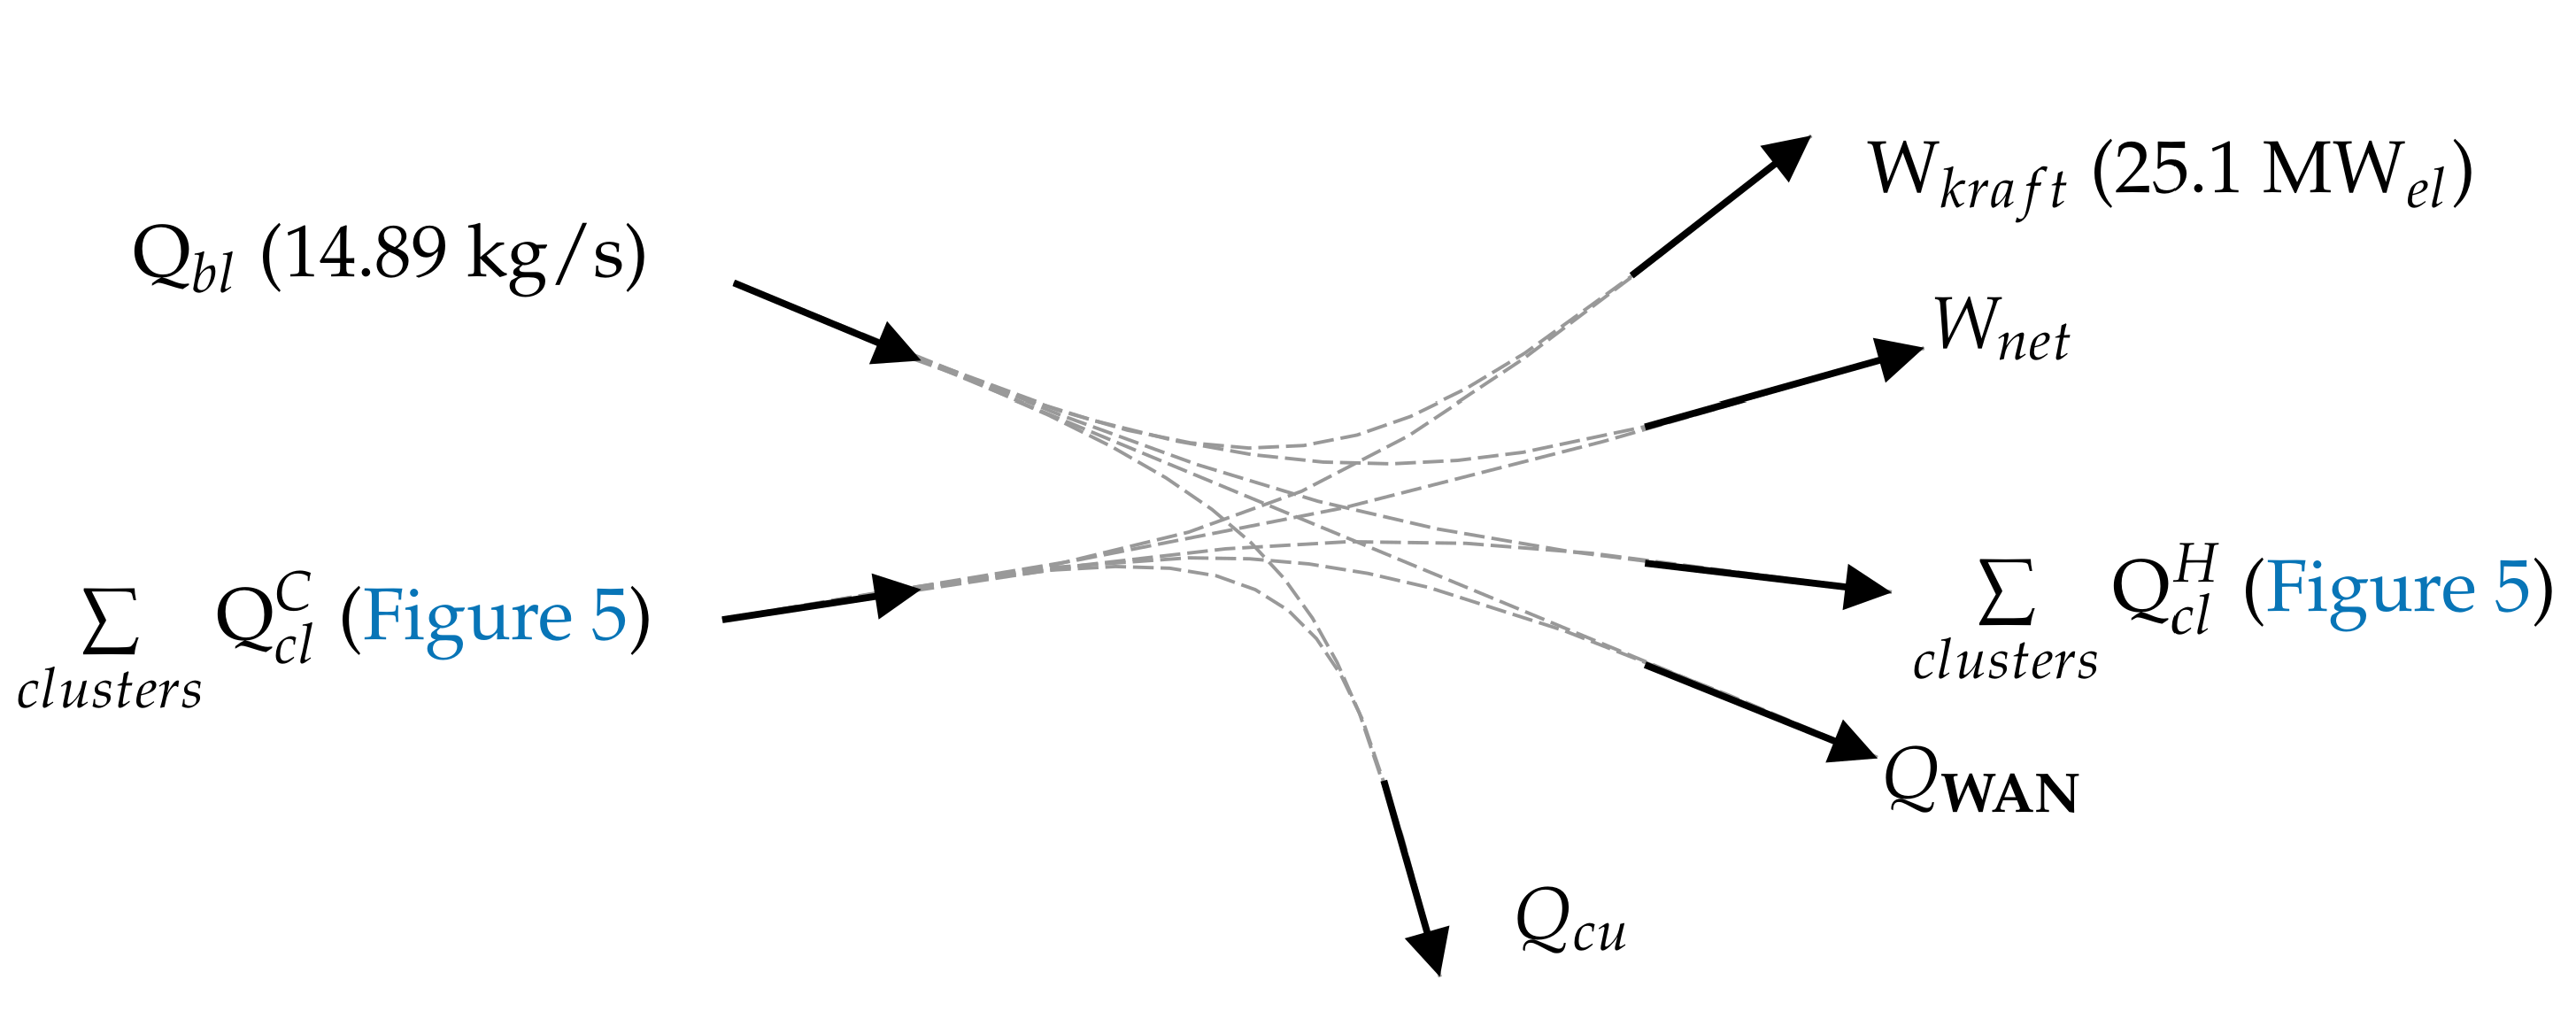
6.2.3. Cooling Utility, Freshwater Consumption, and Net Power Output
Figure 10 presents a simple schematic of the energy balance of the case study. Every dashed line represents a potential combination of energy conversion technologies and heat exchangers; for instance, available heat in terms of cooling demands of the clusters,
, can be converted into electricity, W
or
, by using ORC, while it can satisfy the heating demands of the clusters,
, by heat recovery among clusters via hot water loops or ORC (i.e., condensation and evaporation at two different pressure levels). By rearranging the elements of the energy balance (Equation (
3)), a simple correlation can be derived among cooling duty, electricity consumption and freshwater consumption (proportional to the amount of heat in the water network) which is shown in Equation (
4), where Q denotes a constant heat value:
Equation (
4) states that for a given value of any of these three elements, a negative correlation exists among the other two. This was observed in the solutions of the optimization and is shown in
Figure 11. For a given freshwater consumption, reducing the cooling utility by 1 MW
increases the net power output by 1.03 MW
. However, this also reduces the demand of make-up water by 0.556 kg/s which, for a given amount of freshwater consumption, means an increase in the flowrate of wastewater and evacuating 23.33 kW
(0.556 [kg/s] × 4.2 [kJ/kgK] × (T
(30)−T
(20))) heat to the wastewater sink, resulting in overall 1.006 MW
of power production. This is visible in
Figure 11a by the near-45-degree lines of constant freshwater consumption. The same reasoning can be applied for constant net power production as shown in
Figure 11b where every line is formulated as
. Thus, for a specific net power output, the reduction in cooling duty (i.e., potential increase in power production) should be compensated by increasing the freshwater consumption and hence increasing the wastewater flow. If the increase in the freshwater flow is less than
, this amount of thermal energy should be converted to electricity, hence increasing the electricity production while increasing freshwater consumption.
6.3. Heat Integration and Heat Load Distribution
In this section, several solutions were selected and analyzed from the Pareto frontiers by applying multiple criteria. Similar to the tool developed by Kermani et al. [
16] for fluid selection, parallel coordinates [
41] were used to facilitate the procedure. For each selected solution, four graphs were plotted:
Pareto frontier of the investment cost vs. the net power output: to position the selected solution with respect to all the solutions based on the values of the three objectives;
parallel coordinates: similar to
Figure 9, to highlight the value of other indicators of the selected solution with respect to all solutions;
integrated grand composite curve: to illustrate how a steam cycle and/or ORC are integrated with other processes, and how heat is transferred among the three clusters;
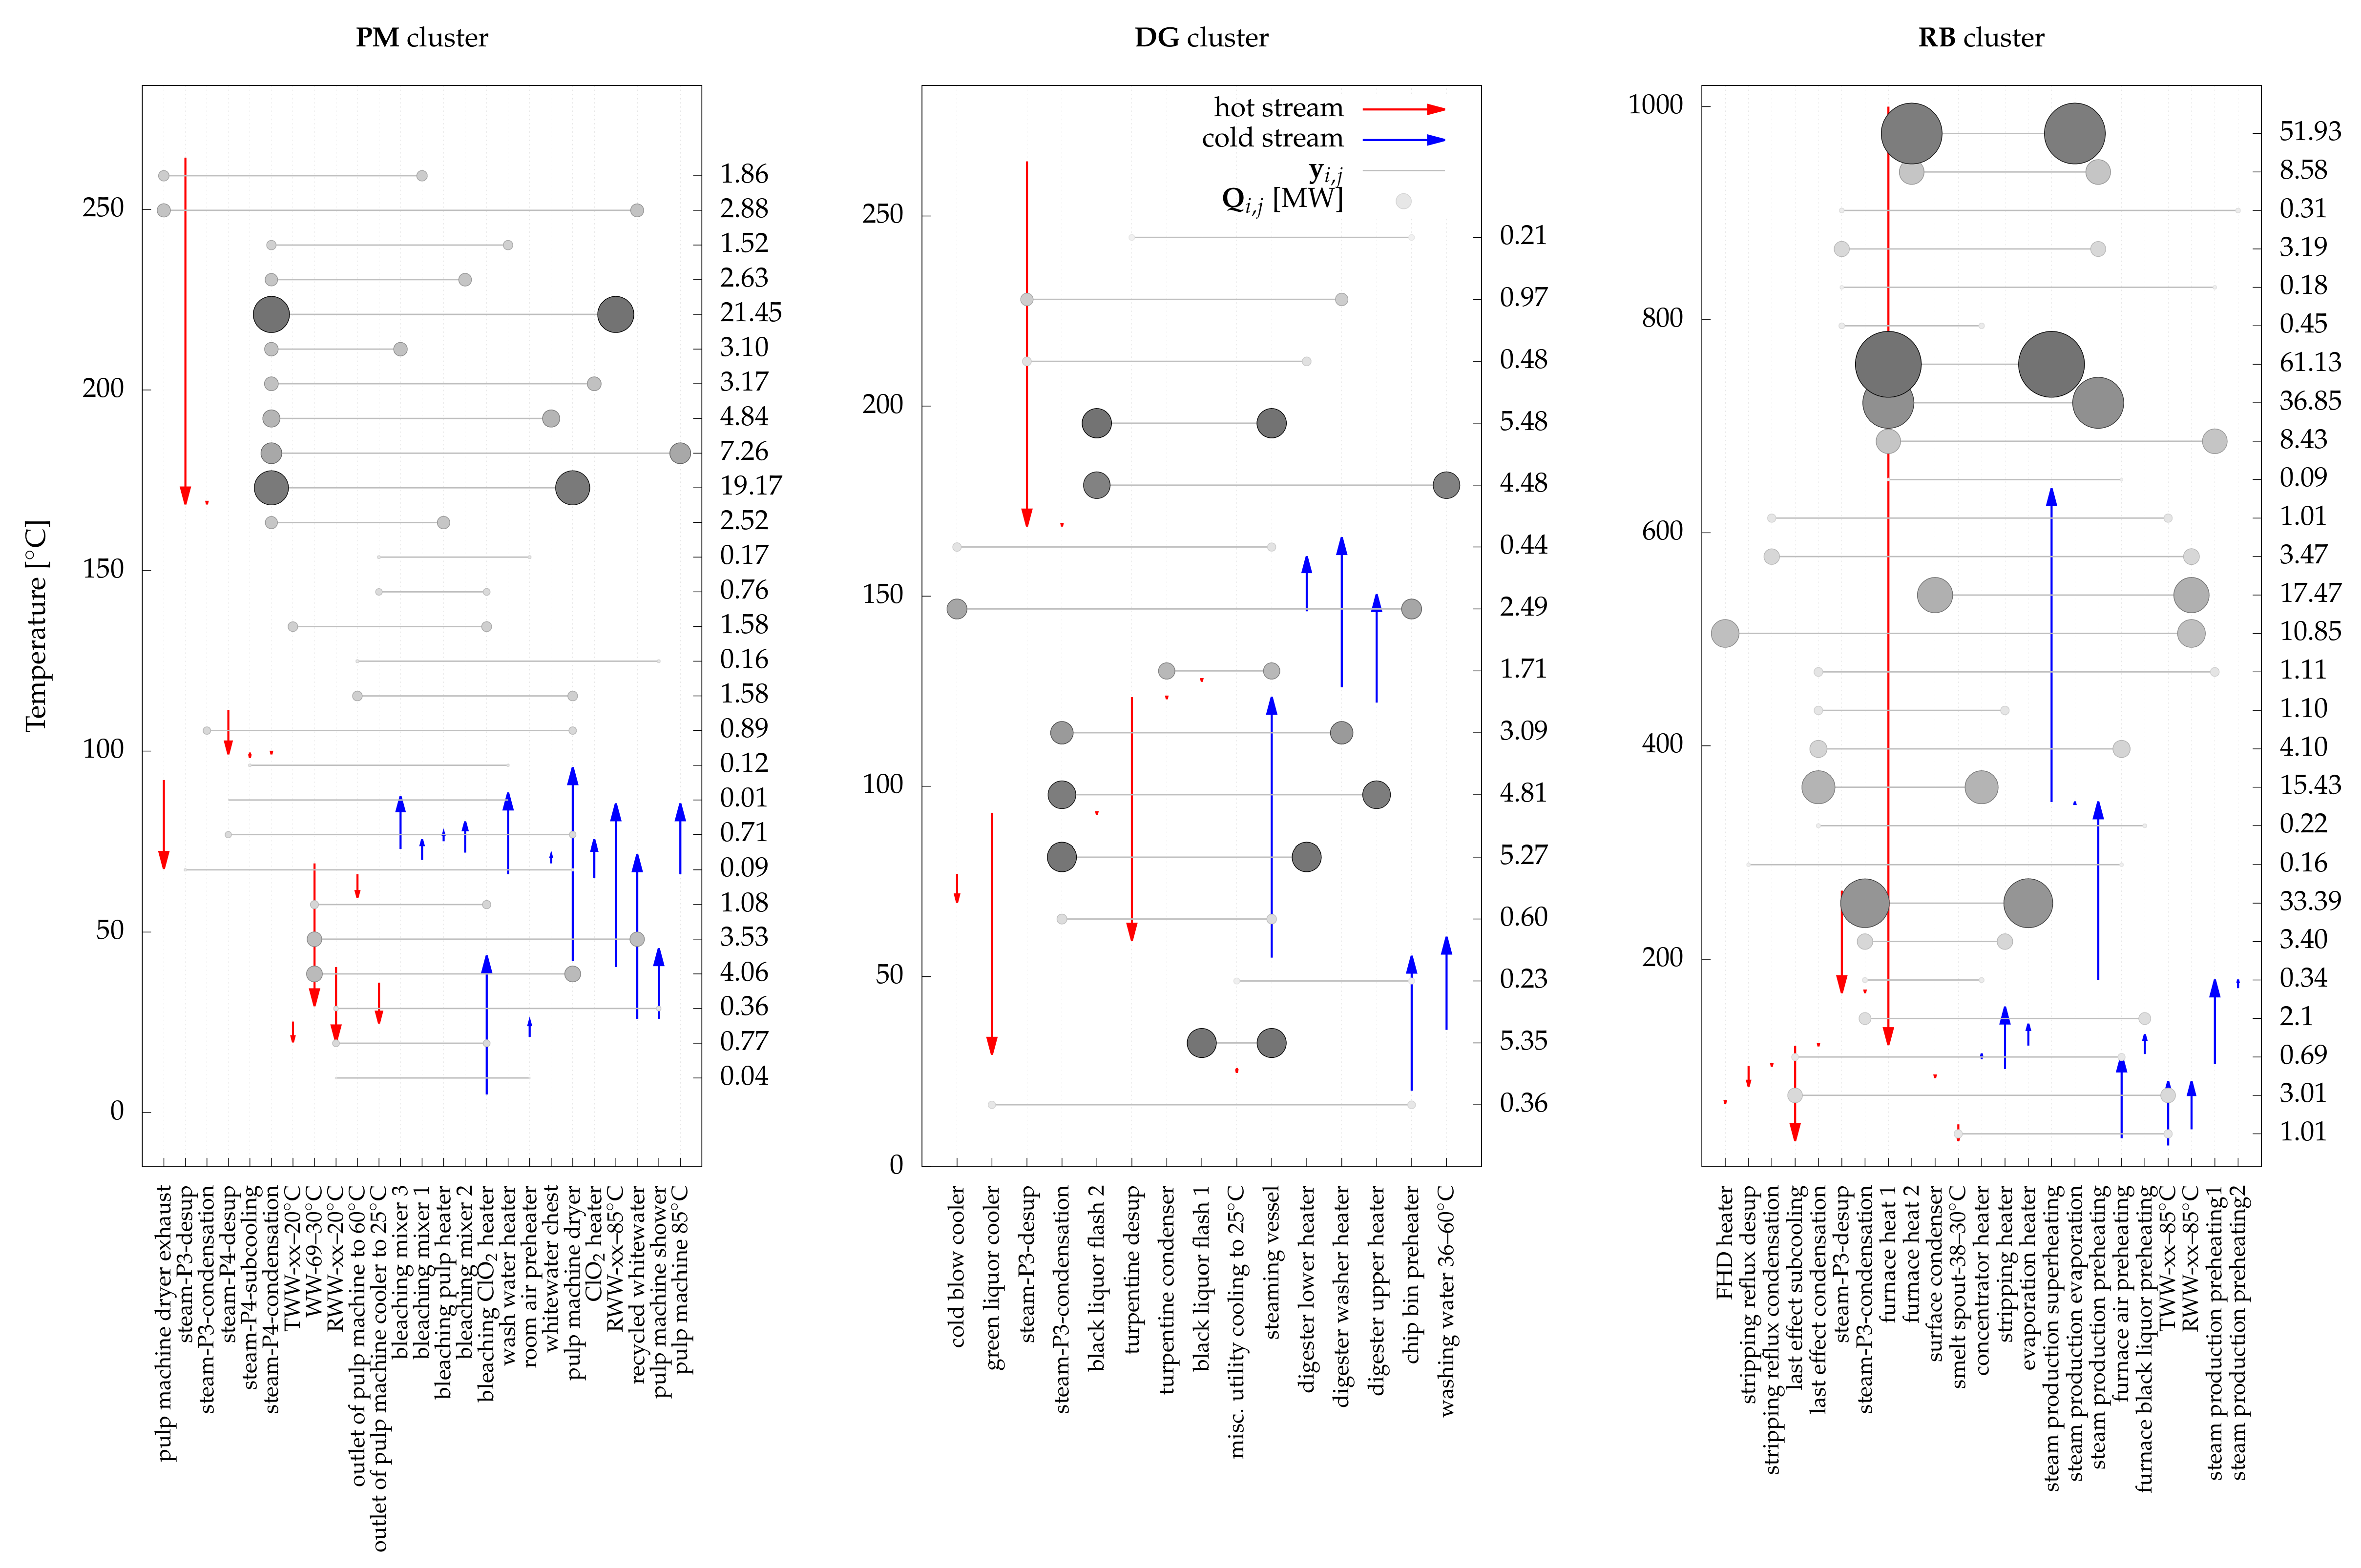
HLD: to find potential thermal matches prior to the HEN design. Several HLD configurations are available for any solution of problem P1. For each of these configurations, large heat exchanges can be identified as potential opportunities for further economic, physical, and thermodynamic feasibility evaluation. This requires deep knowledge of the process and hence should be performed in collaboration with mill personnel. In this section, only the first solution of problem P2 is presented. Furthermore, several heat recovery opportunities are extracted; however, the likelihood of implementation is not discussed here.
6.3.1. Case I—No ORC Integration
Among all proposed solutions with maximum net power output which did not require an ORC, the solution which exhibits minimum freshwater consumption and minimum annualized investment cost was selected as the first case. The selected solution is shown in
Figure 12. The net power output was 18.7 MW
with freshwater consumption of 234.7 kg/s (0.4 kg/s higher than the minimum freshwater consumption). The optimal steam network comprised four pressure levels (three of which acted as condensers for the process as shown in
Figure 12). The highest and lowest pressure levels, P
and P
, are at 159.5 and 1 bar, respectively. Sub-ambient pressure levels could have been selected; however, the lowest pressure level creates a pinch point in the
PM cluster. This necessitates increased use of steam at higher pressure and consequently lower electricity production. Within each cluster, the HLD solutions show the potential connections among thermal streams and their associated heat loads (
Figure 13). All these connections satisfy the energy and water targets of the solution of problem
P1. Multiple types of heat exchange can be distinguished by looking at the HLD results including new heat recovery opportunities by the use of a black liquor flash tank (hot stream) in the steaming vessel (
DG cluster: 5.48 MW
) and pre-heating water at the inlet of washing (
DG cluster: 4.48 MW
). Furthermore, low temperature heating demands such as the ClO
heater in the bleaching section can be satisfied using hot water loops instead of consuming steam by transferring excess heat from the
RB cluster via water tanks.
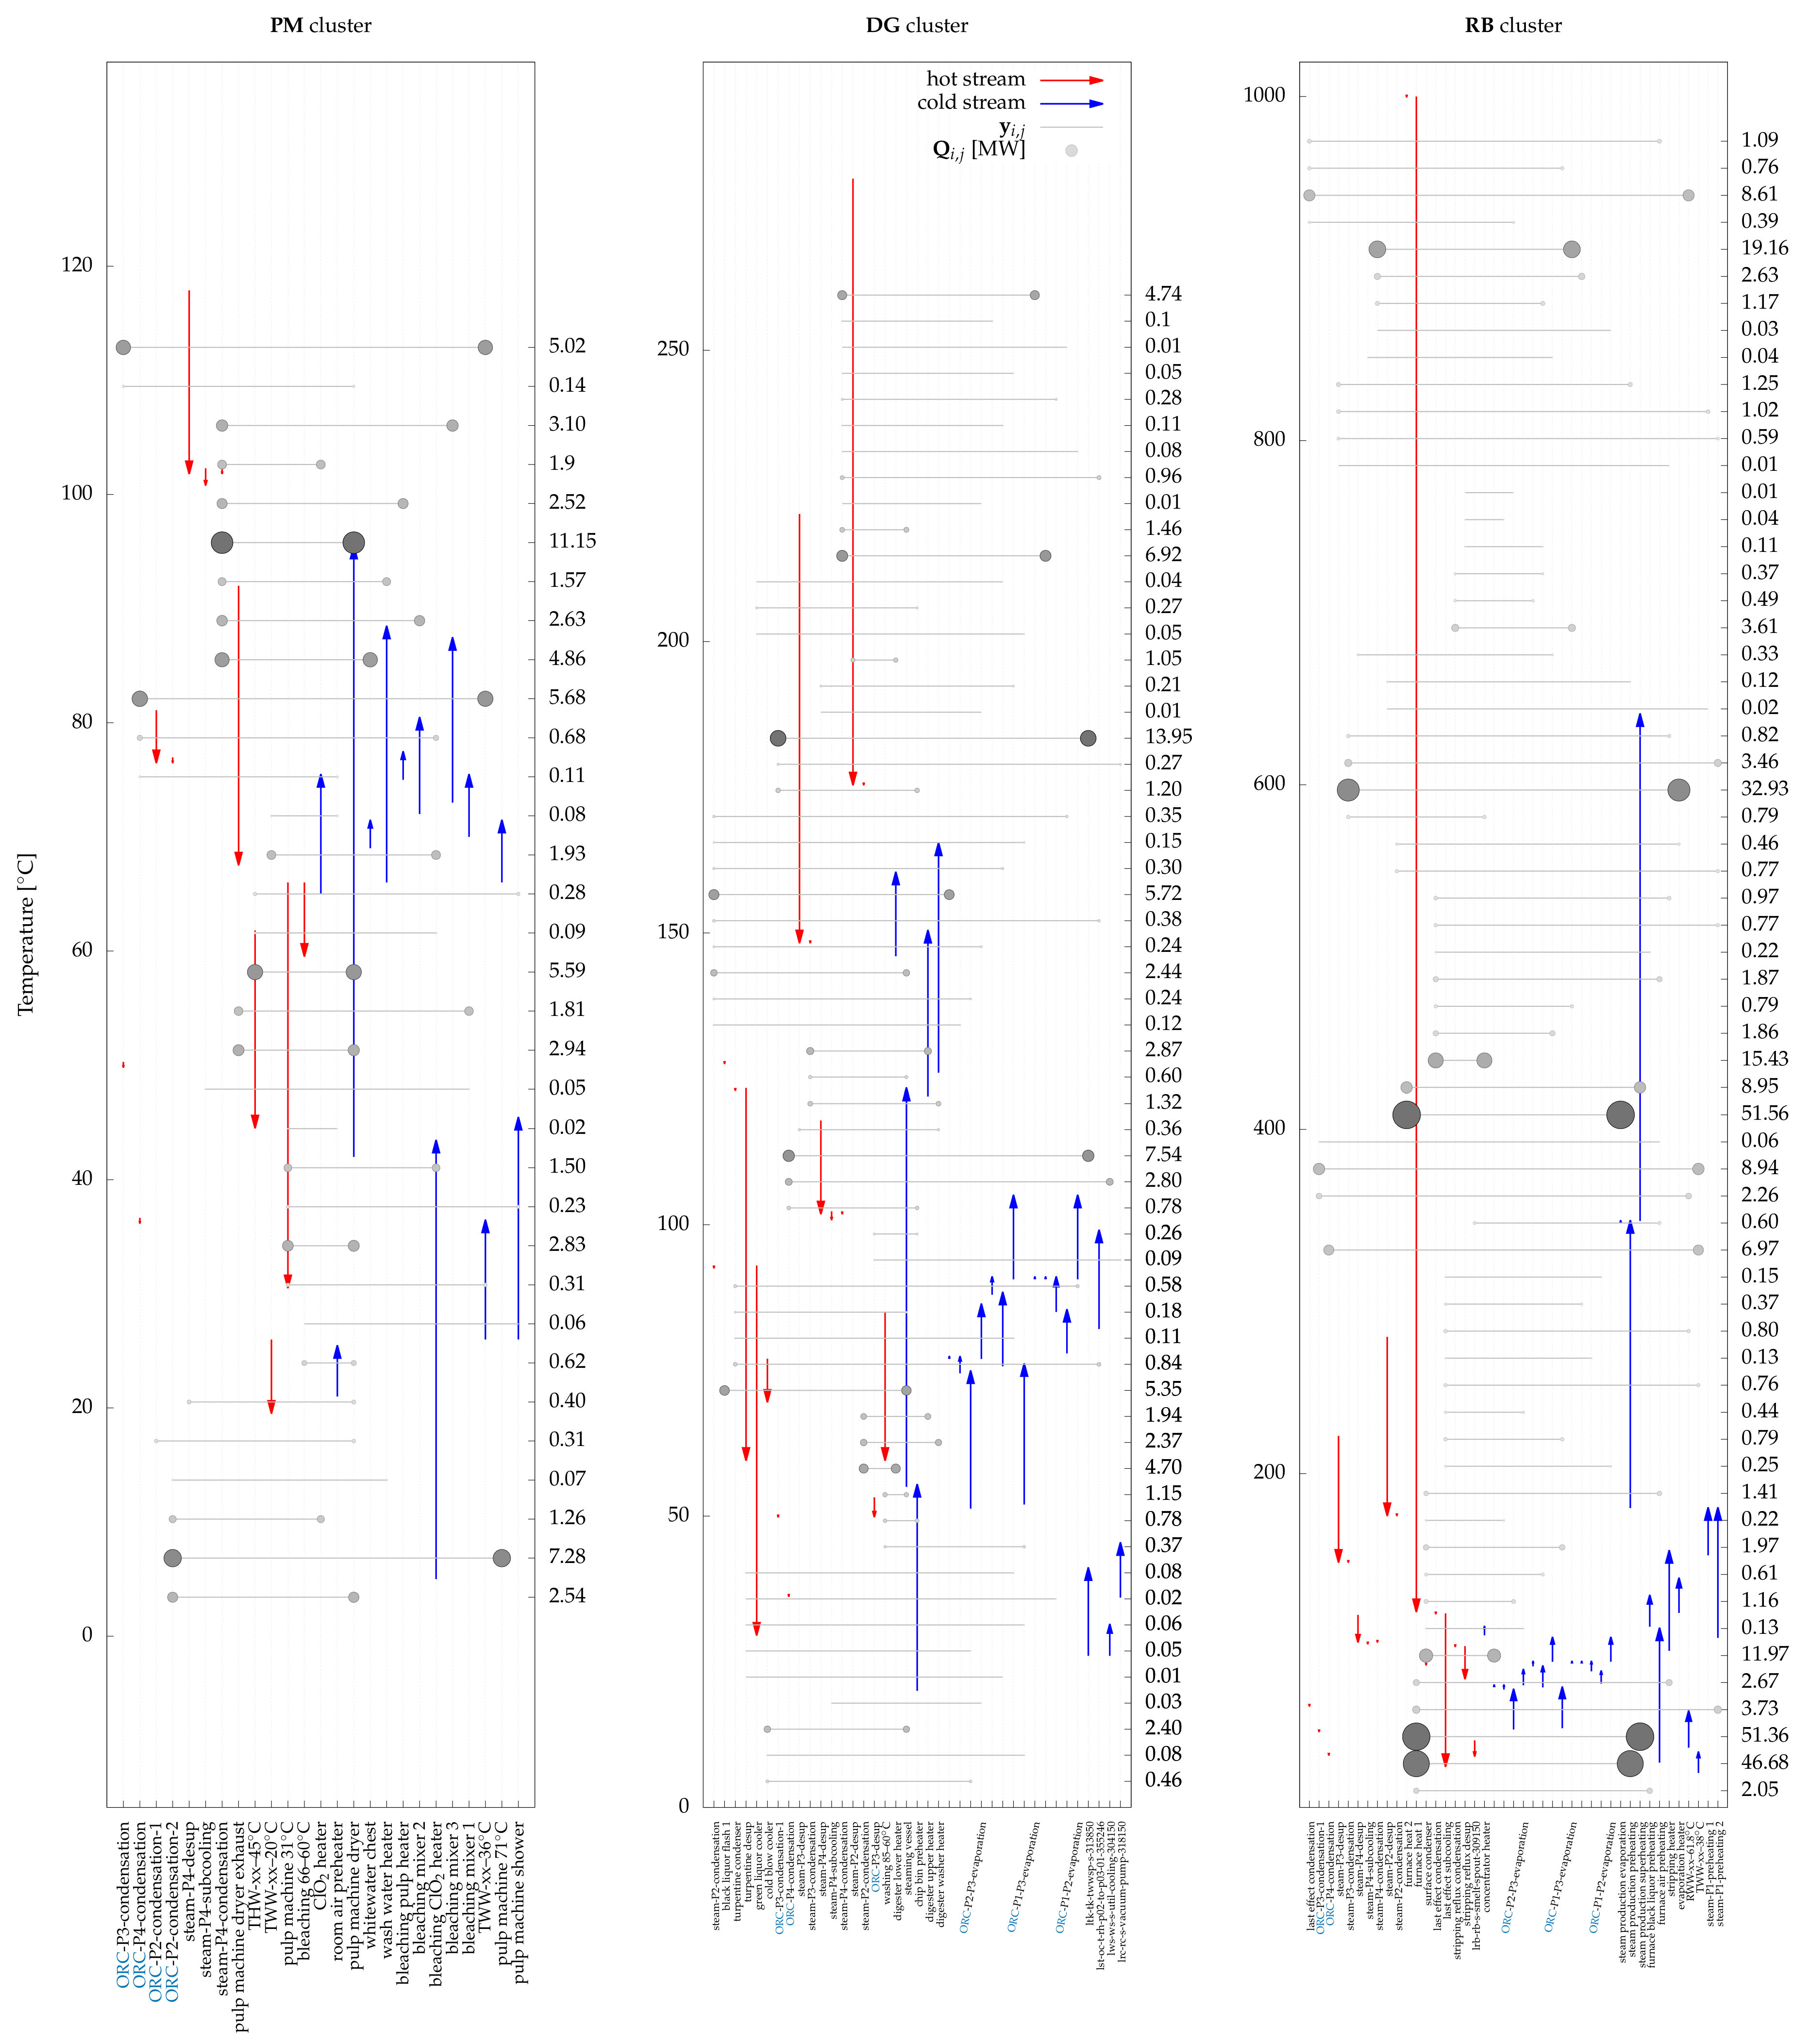
6.3.2. Case II—Maximum Electricity Production
Among all proposed solutions with maximum net power output (with ORC integration), the solution which exhibits minimum freshwater consumption and minimum annualized investment cost was selected as the second case. The selected solution is shown in
Figure 14. The net power output was 25.1 MW
(34.2% higher than case I) with freshwater consumption of 240.7 kg/s (2.4% higher than case I). As shown in
Figure 14) this solution exhibits a highly integrated system with both a steam cycle and ORC (using ammonia as the working fluid) functioning over four pressure levels. The increased value of the lowest pressure level in the steam cycle, P
, from 1 bar (case II) to 1.1 bar, eliminated the use of medium-pressure steam in the
PM cluster, while three condensation levels of the ORC supplied the heating requirements in this cluster.
For each cluster, the HLD results are shown in (
Figure 15). These connections serve to reach the energy and water targets of the solution. These HLD results include new and sometimes unusual heat recovery opportunities such as using dryer exhaust in the pulp machine section to preheat air (
PM cluster: 2.94 MW
). Furthermore, in the
RB cluster, opportunities exist in heat recovery between the condenser of the multi-effect evaporation and pre-heating the inlet of the concentration section (15.43 MW
out of 16.22 MW
demand) that must be evaluated by mill experts. It should be noted that in the current state of the mill, pre-heating is conducted by using steam while cooling is carried out using freshwater at 20
C. This heat recovery opportunity, alone, brings a reduction of 11.7% in steam demand while reducing freshwater consumption by 122.2 kg/s. Assuming that the reduced steam can be used to produce electricity with an efficiency of 24% (between 54.8 and 1 bar, conditions in the current state) and taking into account the water required to cool the condenser of the steam cycle, this simple heat recovery opportunity yields a payback time of 0.7 years. Analyzing the HLD encourages better assessment of reduction projects before detailed system design.
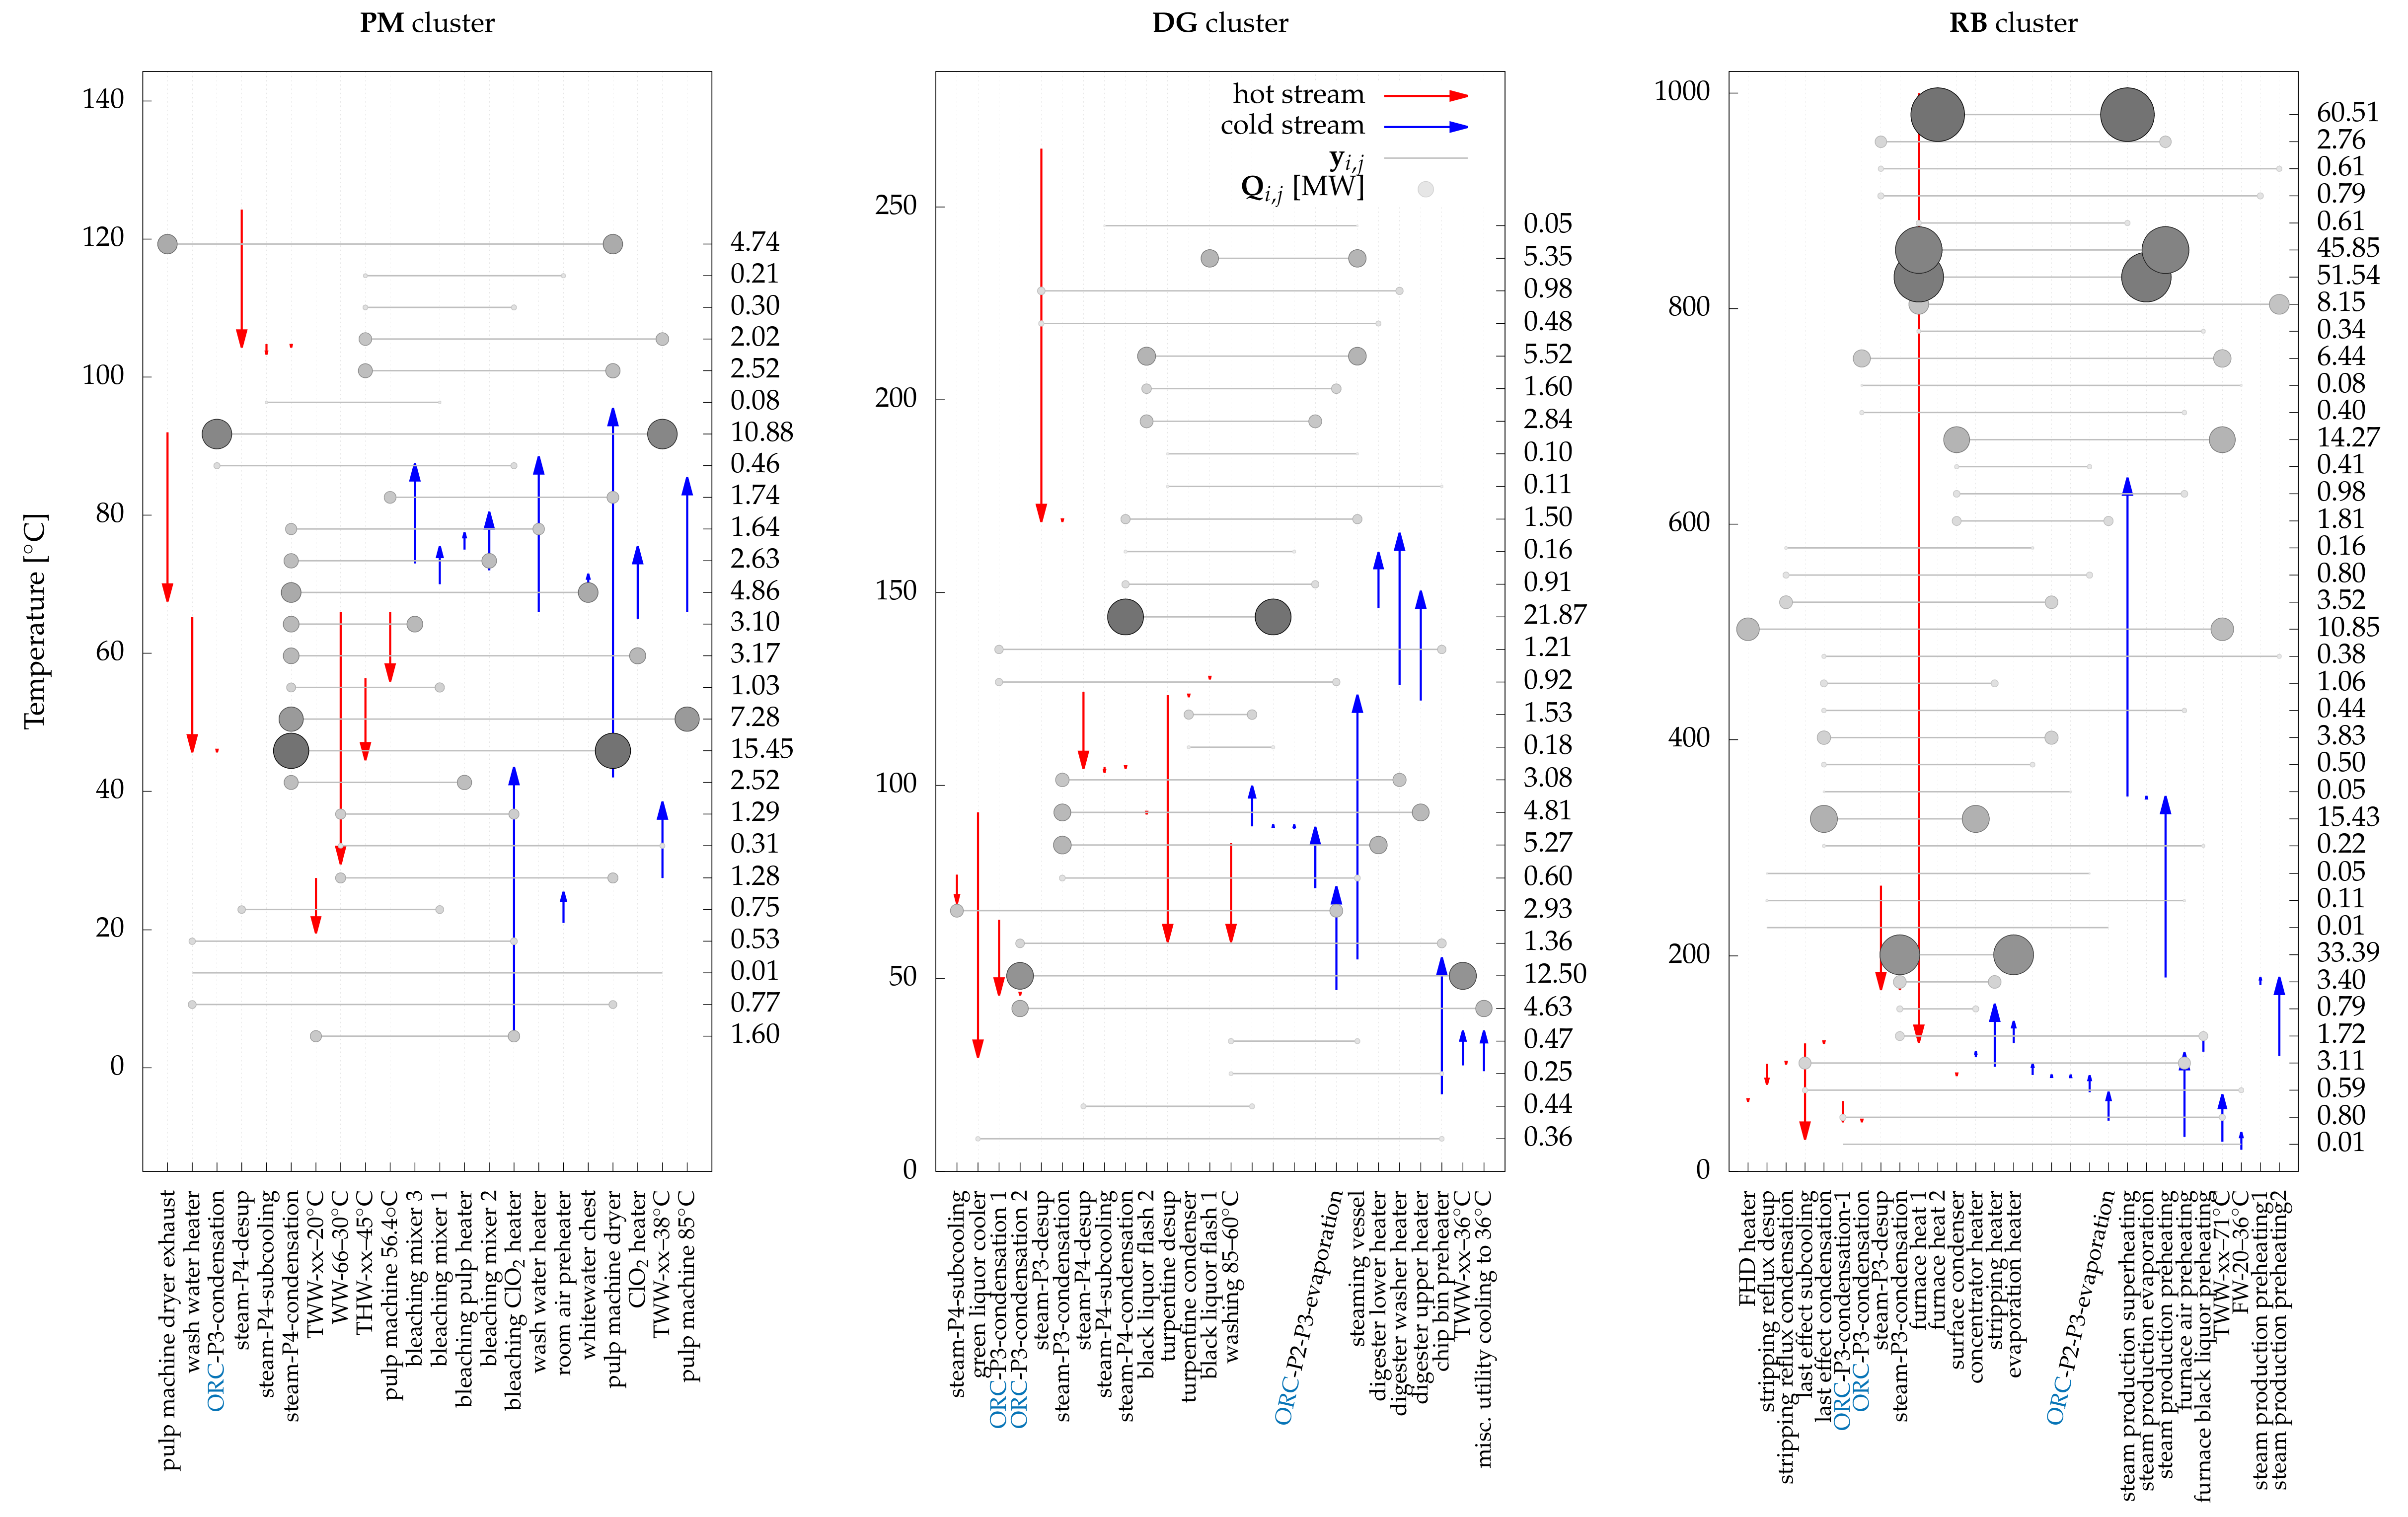
6.3.3. Case III—ORC with Isobutene
The optimal working fluid for the solution of case II was ammonia. Case III studies the potential of other working fluids. Among all proposed solutions integrating a single-stage ORC working with isobutene, the solution which possesses the lowest capital cost of equipment was selected as the third case. The selected solution is shown in
Figure 16. The net power output is found to be 21.8 MW
with freshwater consumption of 279.6 kg/s. The electricity production has decreased by only 13% compared with case II, while the capital cost has reduced by more than 42% and freshwater consumption increased by 16%. Case III highlights the importance of providing multiple solutions to an optimization problem as this solution exhibits a relatively simpler network design (
Figure 17) compared with previous two cases which might be better-suited for facilitated implementation.
7. Conclusions
This paper proposed and applied a holistic approach for simultaneous consideration of heat, water, and power in industrial processes combining the proposed methodologies in [
16,
17,
18] in several stages and making use of stochastic programming and deterministic techniques to optimize the water and energy consumption. The approach can generate a large set of Pareto optimal solutions where no single solution is better than others in all objectives. Parallel coordinates assist in visualizing several indicators and in facilitating the decision-making process for selecting a solution which complies with several criteria.
The methodology was applied to an industrial kraft pulp case study. The objectives were defined as minimizing freshwater consumption, maximizing electricity generation, and minimizing the annualized investment cost. Operating conditions of the steam cycle, ORC, and water tank temperatures were the main decision variables of the outer GA optimization stage. The results indicated the strong interconnectivity among the principle elements of heat, electricity, and water, and demonstrated the necessity of considering them using a holistic approach. It was shown that optimal integration of an ORC and water allocation network (i.e., optimized tank levels) can further increase the electricity production potential of the mill and reduce the cooling duties. Some energy efficiency measures were observed and verified by the solutions: high pressure and temperature in the recovery boiler, reduced outlet pressures of turbines (to the extent of applicability in the process), an increased level of turbine-bleeding, and the recovery of waste heat by pre-heating feedwater heaters. Three cases were selected from the set of solutions and analyzed using several graphical tools such as integrated grand composite curves which illustrate how energy transfer or conversion technologies (such as a steam cycle and/or ORC) can be integrated with each other and the production process. Analyzing the results of HLD for the selected cases revealed promising and sometimes unusual heat recovery opportunities which should be further analyzed by experts in the pulp and paper industry.
The approach in this paper was limited to targeting and preliminary design of the system and hence lacks a detailed design stage. Furthermore, it can be argued that using GA cannot guarantee an optimal solution in a reasonable time horizon due to expensive function evaluations. Although the solution time was long, many promising solutions could be used directly in problem P3 to further optimize the temperature and flowrates of the HIWAN or in a comprehensive MINLP model as very good initialization points. A complex system such as an industrial mill cannot be fully designed by use of strict mathematical programming tools and requires human intervention at various stages to check, analyze, adapt, and improve the process. The proposed multi-stage approach in this paper offers this possibility with the help of various graphical tools at different stages. For improving the solution strategy, interesting future work can also focus on development of hybrid GAs which can account for human insight at various levels of the evolution towards improving the generation of solutions and accelerating the solution strategy. Implementing any of the solutions will affect the application of future energy efficiency measures or considerations and thus it is important to perform a holistic study which also includes potential changes or extensions to the system boundary by addressing network flexibility before making detailed designs.
In the kraft pulp mill case study, several emerging technologies and concepts have not been addressed in this work and will be the focus of future work. One promising concept requiring further research is the integration of biorefineries in the kraft pulp mill via thermochemical pathways, such as gasification or pyrolysis, synthesizing their products into value-added bio-products such as ethanol and methanol, and integration of innovative conversion technologies including solid oxide fuel cells and water electrolysis. Investigation and optimization of the integration of these technologies will require generation and validation of rigorous models followed by reapplication of the techniques discussed throughout this paper to provide highly efficient, integrated bioprocessing systems.
Author Contributions
This study was done as part of M.K.’s doctoral studies supervised by F.M. and A.V.E., I.D.K. and A.S.W. have contributed to this paper through reviewing, editing, and discussion of results. J.G. helped in preparing the manuscript for submission.
Funding
This research project is financially supported by the Swiss Innovation Agency Innosuisse and the European Union’s Horizon 2020 research and innovation programme under grant agreement No 818011.
Acknowledgments
This research project is financially supported by the Swiss Innovation Agency Innosuisse and is part of the Swiss Competence Center for Energy Research SCCER EIP and has received funding from the European Union’s Horizon 2020 research and innovation program under grant agreement No 818011.
Conflicts of Interest
The authors declare that the research was conducted in the absence of any commercial or financial relationships that could be construed as a potential conflict of interest.
Abbreviations
| heat exchanger minimum approach temperature |
| adt | air-dried tons |
| GA | genetic algorithm |
| GWP | global warming potential |
| HEN | heat exchanger network |
| HIWAN | heat-integrated water allocation network |
| HLD | heat load distribution |
| HRAT | heat recovery approach temperature |
| MER | minimum energy requirement |
| MILP | mixed-integer linear programming |
| MINLP | mixed-integer nonlinear programming |
| NLP | nonlinear programming |
| ORC | organic Rankine cycle |
| TAC | total annualized cost |
Appendix A. Kraft Pulp Mill Data
The data in this paper are reproduced from our previous work [
17] by adding several remarks on the state of thermal streams. The value of
/2 of thermal streams are assumed to be 5
C, unless otherwise stated. Moreover, some thermal streams are removed due to their low thermal duties.
Appendix A.1. Water Tanks
There are five (5) water tanks which have the task of managing water flows among processes for process water use and cooling purposes (
Table A1). Freshwater can be fed to any of these tanks. In the current state of the mill, there is no water recycling between water unit operations.
Table A1.
Kraft pulp mill: water tanks.
Table A1.
Kraft pulp mill: water tanks.
| Water Tank | Abbreviation | Current Temperature (C) |
|---|
| Fresh water | FW | 20 |
| Treated warm water | TWW | 28 |
| Raw warm water | RWW | 52 |
| Treated hot water | THW | 60 |
| Waste water | WW | 30 |
Appendix A.2. Cold Process Streams
Overall, there are nineteen (19) cold process streams (
Table A2). In the current state of the mill, they are all being heated with steam.
Table A2.
Kraft pulp mill: thermal streams.
Table A2.
Kraft pulp mill: thermal streams.
| Section/Stream ID | Type * | [C] | [C] | Heat Load [kW] | Remarks |
|---|
| Digester |
| Chip bin heater | C | 20 | 55 | 3290 | /2 = 3 |
| Steaming vessel | C | 55 | 123 | 13,583 | |
| Upper liquor heater | C | 122 | 150 | 4810 | |
| Lower liquor heater | C | 146 | 160 | 5750 | |
| Washer liquor heater | C | 126 | 165 | 4060 | |
| Black liquor flash tank 1 | H | 128 | 128 | 5350 | /2 = 3 |
| Black liquor flash tank 2 | H | 93 | 93 | 9960 | /2 = 3 |
| Turpentine condenser | H | 123.25 | 60 | 1916 | /2 = 3, at 2.2 bar |
| Bleaching |
| Steam mixer 1 | C | 70 | 75 | 1860 | |
| Pulp heater | C | 75 | 77 | 2520 | |
| Steam mixer 2 | C | 72 | 80 | 2630 | |
| Steam mixer 3 | C | 73 | 87 | 3100 | |
| ClO heater | C | 5 | 43 | 4183 | /2 = 3 |
| Pulp machine |
| Wash water heater | C | 66 | 88 | 1640 | |
| Dryer | C | 42 | 95 | 26,510 | /2 = 3 |
| Room air pre-heater | C | 21 | 25 | 210 | /2 = 3 |
| Dryer exhaust - chimney | H | 92 | 68 | 4745 | |
| Evaporators, concentrators, and recovery boiler |
| Evaporator heater (1st) | C | 119 | 139 | 33,390 | |
| Concentrator heater | C | 106 | 111 | 16,220 | |
| Boiler air pre-heater | C | 32 | 110 | 6240.6 | /2 = 3 |
| Black liquor heater | C | 111 | 129 | 1300 | /2 = 3 |
| Stripping and ClO2 |
| Stripping column heater | C | 97 | 155 | 4457 | |
| ClO2 heater before reactor | C | 65 | 75 | 3170 | /2 = 3 |
Appendix A.3. Hot Process Streams
Overall, fifteen (15) hot process streams are being cooled in the water network (
Table A3, combining heat exchangers in series into one hot stream). Several of these streams are cooling duties of machinery.
Appendix A.4. Water Unit Operations
The main water unit operations are presented in
Table A4. The only required data to be extracted are the demand (supply) of each unit together with their operating temperatures. The level of contamination is not measured for any water stream in this kraft pulp mill. To this end, any recycling and reuse opportunity must be added to the superstructure while any infeasible and impractical ones must be forbidden. This requires direct communication with kraft process experts who know the levels of contamination and can propose new options to be investigated. For example, in the pulp machine department, a white water chest collects the water removed from the pulp. This water can be used in the pulp machine via a save-all tank.
Table A3.
Kraft pulp mill industrial case study: thermal streams in water network (see
Table A1 and footnote of
Table A2 for abbreviations).
Table A3.
Kraft pulp mill industrial case study: thermal streams in water network (see
Table A1 and footnote of
Table A2 for abbreviations).
| Section | From | To | Type | [C] | [C] | Heat Load [kW] |
|---|
| Evaporators (modeled as steam at 1.9 bar, 9.932 kg/s, /2 = 3) |
| Primary condenser | FWT | FHD | W | 20 | 50 | 22,650 |
| | | | H | 119 | 55 | |
| Secondary condenser | FWT | FHD | W | 20 | 30 | 2360 |
| | | | H | 119 | 30 | |
| Inter/after condenser | FWT | FWT | W | 20 | 30 | 600 |
| | | | H | | | |
| Flash Heat Double (FHD) (modeled as steam at 0.25 bar, 4.628 kg/s, /2 = 3) |
| Flash heat double cooler | - | RWWT | W | 46 | 54 | 9045 |
| | | | H | 65 | 65 | |
| Non-condensable gas cooler | FWT | FWT | W | 21 | 25 | 460 |
| | | | H | 81 | 81 | |
| Inter/After condenser | FWT | FWT | W | | | 1340 |
| | | | H | 30 | 30 | |
| Recausticizing |
| Green liquor cooler | FWT | FWT | W | 20 | 33 | 364 |
| | | | H | 93 | 30 | |
| Bearing cooler | FWT | THWT | W | 20 | 31 | 385 |
| | | | H | 80 | 40 | |
| Pulp Machine |
| Water cooler | FWT | Press shower | W | 20 | 25 | 70 |
| | | | H | 120 | 105 | |
| Cooler | FWT | Economizer | W | 20 | 36 | 1605 |
| | | | H | 46 | 30 | |
| Stripping (modeled as steam at 1 bar, 1.983 kg/s, /2 = 3) |
| Reflux condenser | FWT | RWWT | W | 20 | 60 | 4634 |
| | | | H | 101 | 81 | |
| Recovery Boiler | | | | | | |
| Main surface condenser | TWWT | THWT | W | 28 | 78 | 13,672 |
| | | | H | 89 | 88 | |
| Auxiliary surface condenser | TWWT | THWT | W | 28 | 70 | 3700 |
| | | | H | 89 | 88 | |
| Fan cooler | TWWT | THWT | W | 28 | 38 | 1346 |
| | | | H | 48 | 38 | |
| Washing | | | | | | |
| Cold blow cooler | FWT | FWT | W | 20 | 34 | 2930 |
| | | | H | 77 | 70 | |
| Miscellaneous cooling | FWT | FWT | W | 20 | 26 | 3360 |
| | | | H | - | - | |
Table A4.
Kraft pulp mill: water unit processes.
Table A4.
Kraft pulp mill: water unit processes.
| Inlet Conditions | | Unit | | Outlet Conditions |
|---|
| Flow [kg/s] | [C] | | | | [C] | Flow [kg/s] |
|---|
| 3.7 | 20 | | digester—chip bin vent | | 60 | 3.7 |
| 69 | 60 | | bleaching | | | |
| 29.8 | 20 | | ClO—absorption | | | |
| 6.7 | 20 | | ClO—shower | | | |
| 33.3 | 20 | | ClO—indirect contact cooler (ICC) | | | |
| 16.5 | 20 | | ClO—barometric condenser | | | |
| 16.7 | 20 | | recausticizing—vacuum pump | | 36 | 16.7 |
| 6.7 | 60 | | recausticizing—pressure disc filter | | | |
| 48 | 20 | | pulp machine—vacuum pump | | 36 | 48 |
| 6.5 | 45 | | pulp machine—shower | | | |
| 578 | 71 | | pulp machine—recycled white water | | 66 | 666 |
| 69 | 60 | | washing | | | |
| 16 | 28 | | smelt spout | | 45 | 16 |
| | | | contaminated condensate | | 85 | 22 |
Appendix A.5. Waste Thermal Streams
Four waste hot streams are available on site (
Table A5).
Table A5.
Kraft pulp mill: waste thermal streams.
Table A5.
Kraft pulp mill: waste thermal streams.
| Section/Stream ID | (C) | [C] | Heat Load [kW] |
|---|
| Bleaching |
| Alkaline bleach effluent | 82 | 35 | 14,852 |
| Acid bleach effluent | 71 | 35 | 11,492 |
| Pulp machine |
| Dryer exhaust | 68 | 35 | 9643 |
| Evaporators |
| Combined condensate | 89 | 35 | 4608 |
Appendix A.6. Thermal Utilities
Steam is being produced at high pressure (∼60 bar) on site in a recovery boiler, auxiliary boilers, and using the waste heat of the on-site gas turbines. This steam is expanded within several steam turbines to meet the electrical and thermal demands of the mill. Nonetheless, only two pressure levels are being provided for process use as shown in
Table A6.
Table A6.
Kraft pulp mill: thermal and mass utilities.
Table A6.
Kraft pulp mill: thermal and mass utilities.
| Utility | Pressure (bar) | Temperature (C) |
|---|
| Steam #60 | 5.13 | 198 |
| Steam #160 | 12 | 228 |
| Freshwater | - | 20 |
Appendix B. Assumptions and Solver Options
The case study is run on a Windows machine with Intel(R) Xeon(R) CPU E5-2680 v4 2.40 GHz 2.4 GHz and 32 GB RAM. The models are written in AMPL programming language [
40].
Table A7.
Assumption and solver options for kraft pulp mill model.
Table A7.
Assumption and solver options for kraft pulp mill model.
| Solver Option | Value | Description (Mainly from Respective Solver’s Manual) |
|---|
| Genetic Algorithm |
| Population size | 400 | Number of initial population |
| Initialization type | unique_random | Creating random initial solutions but enforce uniqueness |
| Crossover type | multi_point_real 1 | Performing a variable switching crossover routing at 1 crossover point in the real valued genome of two designs |
| Crossover rate | 0.8 | Probability of the crossover event |
| Mutation type | bit_random | Performing mutation by flipping a random bit of a randomly chosen design variable |
| Mutation rate | 0.2 | Probability of the mutation event |
| Convergence type | metric_tracker | Converge if metric is below “percent_change” (0.01) for a given consecutive generations (10) |
| Fitness type | domination_count | below_limit = 1; Ranking based on number of dominations |
| Niching type | max_designs = 0.02 | encourage differentiation along the Pareto frontier. Minimum distance between any two points is set at 2% |
| | | num_designs = 400 | Limit the number of solutions that remain in each generation to 400 |
| Number of evaluations | 60,000 | Maximum number of evaluations (a convergence criterion) |
| Number of generations | 100 | Maximum number of generations (a convergence criterion) |
| AMPL |
| reset_initial_guesses | 1 | Reset variables to their initial values between different calls to solve command |
| presolve_eps | variable | Maximum difference between lower and upper bounds in constraint violations; 10 (P1) and 10 (P1) |
| presolve | 1 | Simplifying problem prior to the solver by fixing variables and dropping redundant constraints |
| P1 (CPLEX) |
| mipgap | 5 10 | Relative tolerance for optimizing integer variables: |
| | | | stop if abs((best bound) - (best integer)) < mipgap * (1 + abs(best bound)) |
| integrality | 10 | Amount by which an integer variable can differ from the nearest integer and still be considered feasible. |
| timelimit | 120 | Time limit in seconds |
| P2 (CPLEX) |
| mipgap | 10 | (see above) |
| integrality | 10 | (see above) |
| flowcuts | 1 | Aggressive use of flow cuts in solving MIP |
| mircuts | 1 | Moderate generation of MIP rounding cuts |
| dgradient | 2 | Pricing algorithm for dual simplex (2 = steepest-edge pricing) |
| timelimit | 60 | (see above) |
References
- Kermani, M.; Wallerand, A.S.; Kantor, I.D.; Maréchal, F. A hybrid methodology for combined interplant heat, water, and power integration. In Computer Aided Chemical Engineering; Espuña, A., Graells, M., Puigjaner, L., Eds.; Elsevier: Amsterdam, The Netherlands, 2017; Volume 40, pp. 1969–1974. [Google Scholar]
- Kermani, M.; Kantor, I.D.; Maréchal, F. Synthesis of heat-integrated water allocation networks: A meta-analysis of solution strategies and network features. Energies 2018, 11, 1158. [Google Scholar]
- Ahmetović, E.; Ibrić, N.; Kravanja, Z.; Grossmann, I.E. Water and energy integration: A comprehensive literature review of non-isothermal water network synthesis. Comput. Chem. Eng. 2015, 82, 144–171. [Google Scholar] [CrossRef]
- Zhou, R.J.; Li, L.J.; Dong, H.G.; Grossmann, I.E. Synthesis of interplant water-allocation and heat-exchange networks. Part 2: Integrations between fixed flow rate and fixed contaminant-load processes. Ind. Eng. Chem. Res. 2012, 51, 14793–14805. [Google Scholar] [CrossRef]
- Zhou, R.J.; Li, L.J.; Dong, H.G.; Grossmann, I.E. Synthesis of interplant water-allocation and heat-exchange networks. Part 1: Fixed flow rate processes. Ind. Eng. Chem. Res. 2012, 51, 4299–4312. [Google Scholar] [CrossRef]
- Ibrić, N.; Ahmetović, E.; Kravanja, Z.; Maréchal, F.; Kermani, M. Synthesis of single and interplant non-isothermal water networks. J. Environ. Manag. 2017, 203, 1095–1117. [Google Scholar] [CrossRef]
- Dhole, V.R.; Linnhoff, B. Total site targets for fuel, co-generation, emissions, and cooling. Comput. Chem. Eng. 1993, 17, S101–S109. [Google Scholar] [CrossRef]
- Hu, C.W.; Ahmad, S. Total site heat integration using the utility system. Comput. Chem. Eng. 1994, 18, 729–742. [Google Scholar] [CrossRef]
- Klemeš, J.; Dhole, V.R.; Raissi, K.; Perry, S.J.; Puigjaner, L. Targeting and design methodology for reduction of fuel, power and CO2 on total sites. Appl. Therm. Eng. 1997, 17, 993–1003. [Google Scholar]
- Wang, Y.; Chang, C.; Feng, X. A systematic framework for multi-plants heat integration combining direct and indirect heat integration methods. Energy 2015, 90, 56–67. [Google Scholar] [CrossRef]
- Zhang, B.J.; Li, J.; Zhang, Z.L.; Wang, K.; Chen, Q.L. Simultaneous design of heat exchanger network for heat integration using hot direct discharges/feeds between process plants. Energy 2016, 109, 400–411. [Google Scholar] [CrossRef]
- Chang, C.; Chen, X.; Wang, Y.; Feng, X. An efficient optimization algorithm for waste heat integration using a heat recovery loop between two plants. Appl. Therm. Eng. 2016, 105, 799–806. [Google Scholar] [CrossRef]
- Chang, C.; Chen, X.; Wang, Y.; Feng, X. Simultaneous optimization of multi-plant heat integration using intermediate fluid circles. Energy 2017, 121, 306–317. [Google Scholar] [CrossRef]
- Tarighaleslami, A.H.; Walmsley, T.G.; Atkins, M.J.; Walmsley, M.R.W.; Liew, P.Y.; Neale, J.R. A unified total site heat integration targeting method for isothermal and non-isothermal utilities. Energy 2017, 119, 10–25. [Google Scholar] [CrossRef]
- Liew, P.Y.; Theo, W.L.; Wan Alwi, S.R.; Lim, J.S.; Abdul Manan, Z.; Klemeš, J.J.; Varbanov, P.S. Total site heat integration planning and design for industrial, urban and renewable systems. Renew. Sustain. Energy Rev. 2017, 68, 964–985. [Google Scholar] [CrossRef]
- Kermani, M.; Wallerand, A.S.; Kantor, I.D.; Maréchal, F. Generic superstructure synthesis of organic Rankine cycles for waste heat recovery in industrial processes. Appl. Energy 2018, 212, 1203–1225. [Google Scholar] [CrossRef]
- Kermani, M.; Périn-Levasseur, Z.; Benali, M.; Savulescu, L.; Maréchal, F. A novel MILP approach for simultaneous optimization of water and energy: Application to a Canadian softwood Kraft pulping mill. Comput. Chem. Eng. 2017, 102, 238–257. [Google Scholar] [CrossRef]
- Kermani, M. Methodologies for Simultaneous Optimization of Heat, Mass, and Power in Industrial Processes. Ph.D. Thesis, Swiss Federal Institute of Technology Lausanne (EPFL), Lausanne, Switzerland, 2018. [Google Scholar]
- Wallerand, A.S.; Kermani, M.; Kantor, I.; Maréchal, F. Optimal heat pump integration in industrial processes. Appl. Energy 2018, 219, 68–92. [Google Scholar] [CrossRef]
- Jeżowski, J. Review of water network design methods with literature annotations. Ind. Eng. Chem. Res. 2010, 49, 4475–4516. [Google Scholar] [CrossRef]
- Papoulias, S.A.; Grossmann, I.E. A structural optimization approach in process synthesis—I: Utility systems. Comput. Chem. Eng. 1983, 7, 695–706. [Google Scholar] [CrossRef]
- Maréchal, F.; Kalitventzeff, B. Identification of the optimal pressure levels in steam networks using integrated combined heat and power method. Chem. Eng. Sci. 1997, 52, 2977–2989. [Google Scholar] [CrossRef]
- Abraham, A.; Jain, L.C.; Goldberg, R. Evolutionary Multiobjective Optimization: Theoretical Advances and Applications (Advanced Information and Knowledge Processing); Springer: Berlin/Heidelberg, Germany, 2005. [Google Scholar]
- Huang, B.; Xing, K.; Abhary, K.; Spuzic, S. Optimization of oval-round pass design using genetic algorithm. Robot. Comput. Integr. Manuf. 2012, 28, 493–499. [Google Scholar] [CrossRef]
- Suhr, M.; Klein, G.; Kourti, I.; Gonzalo, M.R.; Santonja, G.G.; Roudier, S.; Sancho, L.D. Best available techniques (BAT) reference document for the production of pulp, paper and board. In JRC Science and Policy Reports; Industrial Emissions Directive 2010/75/EU Integrated Pollution Prevention and Control; European Commission: Brussels, Belgium, 2015. [Google Scholar]
- Liao, Z.W.; Rong, G.; Wang, J.; Yang, Y. Systematic optimization of heat-ontegrated water allocation networks. Ind. Eng. Chem. Res. 2011, 50, 6713–6727. [Google Scholar] [CrossRef]
- Mateos-Espejel, E.; Savulescu, L.; Maréchal, F.; Paris, J. Unified methodology for thermal energy efficiency improvement: Application to Kraft process. Chem. Eng. Sci. 2011, 66, 135–151. [Google Scholar] [CrossRef]
- Chew, I.M.L.; Foo, D.C.Y.; Bonhivers, J.C.; Stuart, P.; Alva-Argaez, A.; Savulescu, L.E. A model-based approach for simultaneous water and energy reduction in a pulp and paper mill. Appl. Therm. Eng. 2013, 51, 393–400. [Google Scholar] [CrossRef]
- Jacob, J.; Kaipe, H.; Couderc, F.; Paris, J. Water network analysis in pulp and paper processes by pinch and linear programming techniques. Chem. Eng. Commun. 2002, 189, 184–206. [Google Scholar] [CrossRef]
- Martinez-Patiño, J.; Picón-Núñez, M.; Serra, L.; Vittorio, V. Exploiting inherent process flexibility for the reduction of water and energy consumption. Application to the pulp and paper industry. Chem. Eng. Trans. 2009, 18, 923–928. [Google Scholar]
- Mateos-Espejel, E.; Marinova, M.; Bararpour, S.; Paris, J. Energy implications of water reduction strategies in kraft process. Part II: Results. Pulp Paper Can. 2010, 111, 38–41. [Google Scholar]
- Vakkilainen, E. Kraft Recovery Boilers—Principles and Practice; Suomen Soodakattilayhdistys r.y.: Vantaa, Finland, 2005. [Google Scholar]
- Cerda, J.; Westerburg, A.W. Synthesizing heat exchanger networks having restricted stream/stream matches using transportation problem formulations. Chem. Eng. Sci. 1983, 38, 1723–1740. [Google Scholar] [CrossRef]
- Marechal, F.; Boursier, I.; Kalitventzeff, B. Synep1: A methodology for energy integration and optimal heat exchanger network synthesis. Comput. Chem. Eng. 1989, 13, 603–610. [Google Scholar]
- Papoulias, S.A.; Grossmann, I.E. A structural optimization approach in process synthesis—II: Heat recovery networks. Comput. Chem. Eng. 1983, 7, 707–721. [Google Scholar] [CrossRef]
- Bell, I.H.; Wronski, J.; Quoilin, S.; Lemort, V. Pure and pseudo-pure fluid thermophysical property evaluation and the open-source thermophysical property library CoolProp. Ind. Eng. Chem. Res. 2014, 53, 2498–2508. [Google Scholar] [CrossRef]
- Adams, B.; Bauman, L.; Bohnhoff, W.; Dalbey, K.; Ebeida, M.; Eddy, J.; Eldred, M.; Hough, P.; Hu, K.; Jakeman, J.; et al. Dakota, a Multilevel Parallel Object-Oriented Framework for Design Optimization, Parameter Estimation, Uncertainty Quantification, and Sensitivity Analysis: Version 6.0 User’s Manual; Sandia Technical Report; SAND2014-4253; Sandia National Laboratories: Livermore, CA, USA, 2015.
- Eddy, J.; Lewis, K. Effective generation of pareto sets using genetic programming. In Proceedings of the ASME Design Engineering Technical Conference, Pittsburgh, PA, USA, 9–12 September 2001. [Google Scholar]
- IBM ILOG CPLEX V12.2: User’s Manual for CPLEX; Technical report; IBM Corporation: Armonk, NY, USA, 2010.
- Fourer, R.; Gay, D.M.; Kernighan, B.W. AMPL: A Modeling Language for Mathematical Programming, 2nd ed.; Cengage: Boston, MA, USA, 2003. [Google Scholar]
- Inselberg, A. The plane with parallel coordinates. Vis. Comput. 1985, 1, 69–91. [Google Scholar] [CrossRef]
Figure 1.
Schematic of the proposed mathematical superstructure for combined heat, mass, and power integration in industrial processes.
Figure 1.
Schematic of the proposed mathematical superstructure for combined heat, mass, and power integration in industrial processes.
Figure 2.
General schematic of water and energy flows in a kraft mill.
Figure 2.
General schematic of water and energy flows in a kraft mill.
Figure 3.
Layout of the industrial case study including thermal streams and water unit operations.
Figure 3.
Layout of the industrial case study including thermal streams and water unit operations.
Figure 4.
Cold (a) and hot (b) grand composite curves of considered clusters for kraft case study, reflecting current consumption.
Figure 4.
Cold (a) and hot (b) grand composite curves of considered clusters for kraft case study, reflecting current consumption.
Figure 5.
Grand composite curves of considered clusters for kraft case study.
Figure 5.
Grand composite curves of considered clusters for kraft case study.
Figure 6.
Pareto frontiers of the kraft case study.
Figure 6.
Pareto frontiers of the kraft case study.
Figure 7.
Visualization of key indicators of solution of the Pareto frontiers (color spectrum is based on electricity production column).
Figure 7.
Visualization of key indicators of solution of the Pareto frontiers (color spectrum is based on electricity production column).
Figure 8.
Pressure level of the recovery boiler and ORC working fluids of the Pareto frontiers.
Figure 8.
Pressure level of the recovery boiler and ORC working fluids of the Pareto frontiers.
Figure 9.
Solutions with minimum and maximum values of the three objectives.
Figure 9.
Solutions with minimum and maximum values of the three objectives.
Figure 10.
Schematic of energy balance in the kraft mill case study.
Figure 10.
Schematic of energy balance in the kraft mill case study.
Figure 11.
Cooling load, freshwater consumption, and net power production correlations.
Figure 11.
Cooling load, freshwater consumption, and net power production correlations.
Figure 12.
Results of case I: position on Pareto frontier (top left) and on parallel coordinates (top right), and integrated grand composite curves (bottom).
Figure 12.
Results of case I: position on Pareto frontier (top left) and on parallel coordinates (top right), and integrated grand composite curves (bottom).
Figure 13.
Heat load distribution of case I (circle sizes are proportional to the heat exchange rate).
Figure 13.
Heat load distribution of case I (circle sizes are proportional to the heat exchange rate).
Figure 14.
Results of case II: position on Pareto frontier (top left) and on parallel coordinates (top right), and integrated grand composite curves (bottom).
Figure 14.
Results of case II: position on Pareto frontier (top left) and on parallel coordinates (top right), and integrated grand composite curves (bottom).
Figure 15.
Heat load distribution of case II (circle sizes are proportional to the heat exchange rate).
Figure 15.
Heat load distribution of case II (circle sizes are proportional to the heat exchange rate).
Figure 16.
Results of case III: position on Pareto frontier (top left) and on parallel coordinates (top right), and integrated grand composite curves (bottom).
Figure 16.
Results of case III: position on Pareto frontier (top left) and on parallel coordinates (top right), and integrated grand composite curves (bottom).
Figure 17.
Heat load distribution of case III (circle sizes are proportional to the heat exchange rate).
Figure 17.
Heat load distribution of case III (circle sizes are proportional to the heat exchange rate).
Table 1.
Parameters for recovery boiler [
32].
Table 1.
Parameters for recovery boiler [
32].
| Parameters | Unit | Value |
|---|
| Solid content of black liquor | % | 75 |
| Adiabatic combustion temperature | C | 1500 |
| Flue gas outlet temperature | C | 120 |
| Boiler thermal efficiency | - | 0.888 |
| Air to fuel ratio | | 4.196 |
| Lower heating value of black liquor | kJ/kg | 12,250 |
| The highest temperature that furnace can reach (radiation temperature) | C | 1000 |
| Temperature of preheated air at the furnace inlet | C | 110 |
| Available heat for steam production (removing air pre-heating) | kJ/kg | 10,880.2 |
Table 2.
Parameters for wet open recirculating cooling systems [
25].
Table 2.
Parameters for wet open recirculating cooling systems [
25].
| Parameters | Unit | Value |
|---|
| Wet bulb temperature | C | 18 |
| Approach temperature | C | 8 |
| Make-up water | m/hr/MW | 2 |
| Specific electricity consumption | kW/MW | 30 |
Table 3.
Freshwater (20 C) consumers in the kraft mill (under the current operating conditions).
Table 3.
Freshwater (20 C) consumers in the kraft mill (under the current operating conditions).
| Section | Unit | Value [kg/s] |
|---|
| ClO plant | all water unit operations | 86.3 |
| Recausticization | bearing cooler and vacuum pump | 25.0 |
| | green liquor cooler | 6.6 |
| Pulp machine | cooler and vacuum pump | 71.9 |
| | cooler and shower | 9.8 |
| Washing | miscellaneous cooling | 183.2 |
| Digester | chip bin vent and turpentine condenser | 15.1 |
| Evaporation | reflux and last effect condensers | 277.8 |
| Concentrator | non-condensable gas and FHD coolers | 59.3 |
| Recovery boiler | surface condenser | 86.1 |
| Total | | 821.1 |
Table 4.
Set of decision variables of the optimization.
Table 4.
Set of decision variables of the optimization.
| Variables | Range | Unit | Type/Increment | Description/Remarks |
|---|
| [0:0.5] | - | continuous | Total annualized cost weight factor; the range is limited to 0.5 to emphasize reduction in operating cost (Equation (2)); |
| [50:160] | bar | step of 0.1 | Boiler pressure; the upper bound is limited to reported values for a typical steam power plant; |
| [9:14] | bar | step of 0.1 | High-pressure steam header |
| [3:8] | bar | step of 0.1 | Medium-pressure steam header |
| [0.5:2] | bar | step of 0.1 | Low-pressure steam header |
| [150:300] | C | continuous | Degree of superheating in the highest pressure level |
| Based on the ORC superstructure proposed in [16] |
| [0.25:1] | - | continuous | Pressure level 1 in ORC, , where , |
| [0:1] | - | continuous | Pressure level 2 in ORC, |
| [0:1] | - | continuous | Pressure level 3 in ORC, |
| [1:16] | bar | continuous | Lowest pressure level in ORC; for selected fluids and given water temperature 20–30 C |
| [−10:1] | C | integer | Degree of reheating relative to the temperature of pressure level 1; it is assumed that only first and second pressure levels are turbines inlets. |
| [0:20] | C | integer | Amount of superheating at highest pressure level p1 |
| [0:20] | C | integer | Amount of superheating at pressure level p2 |
| [1:3] | - | integer | Working fluids for the case study; ammonia, R1234ze(Z), isobutene |
| HRAT | [1:10] | C | integer | HRAT for water streams; the contribution of water thermal stream to the overall HRAT is half of this value. |
| [25:39] | C | step of 0.1 | Temperature of treated warm water tank |
| [55:65] | C | step of 0.1 | Temperature of treated hot water tank |
| [40:55] | C | step of 0.1 | Temperature of raw warm water tank |
© 2019 by the authors. Licensee MDPI, Basel, Switzerland. This article is an open access article distributed under the terms and conditions of the Creative Commons Attribution (CC BY) license (http://creativecommons.org/licenses/by/4.0/).

 ,
, 
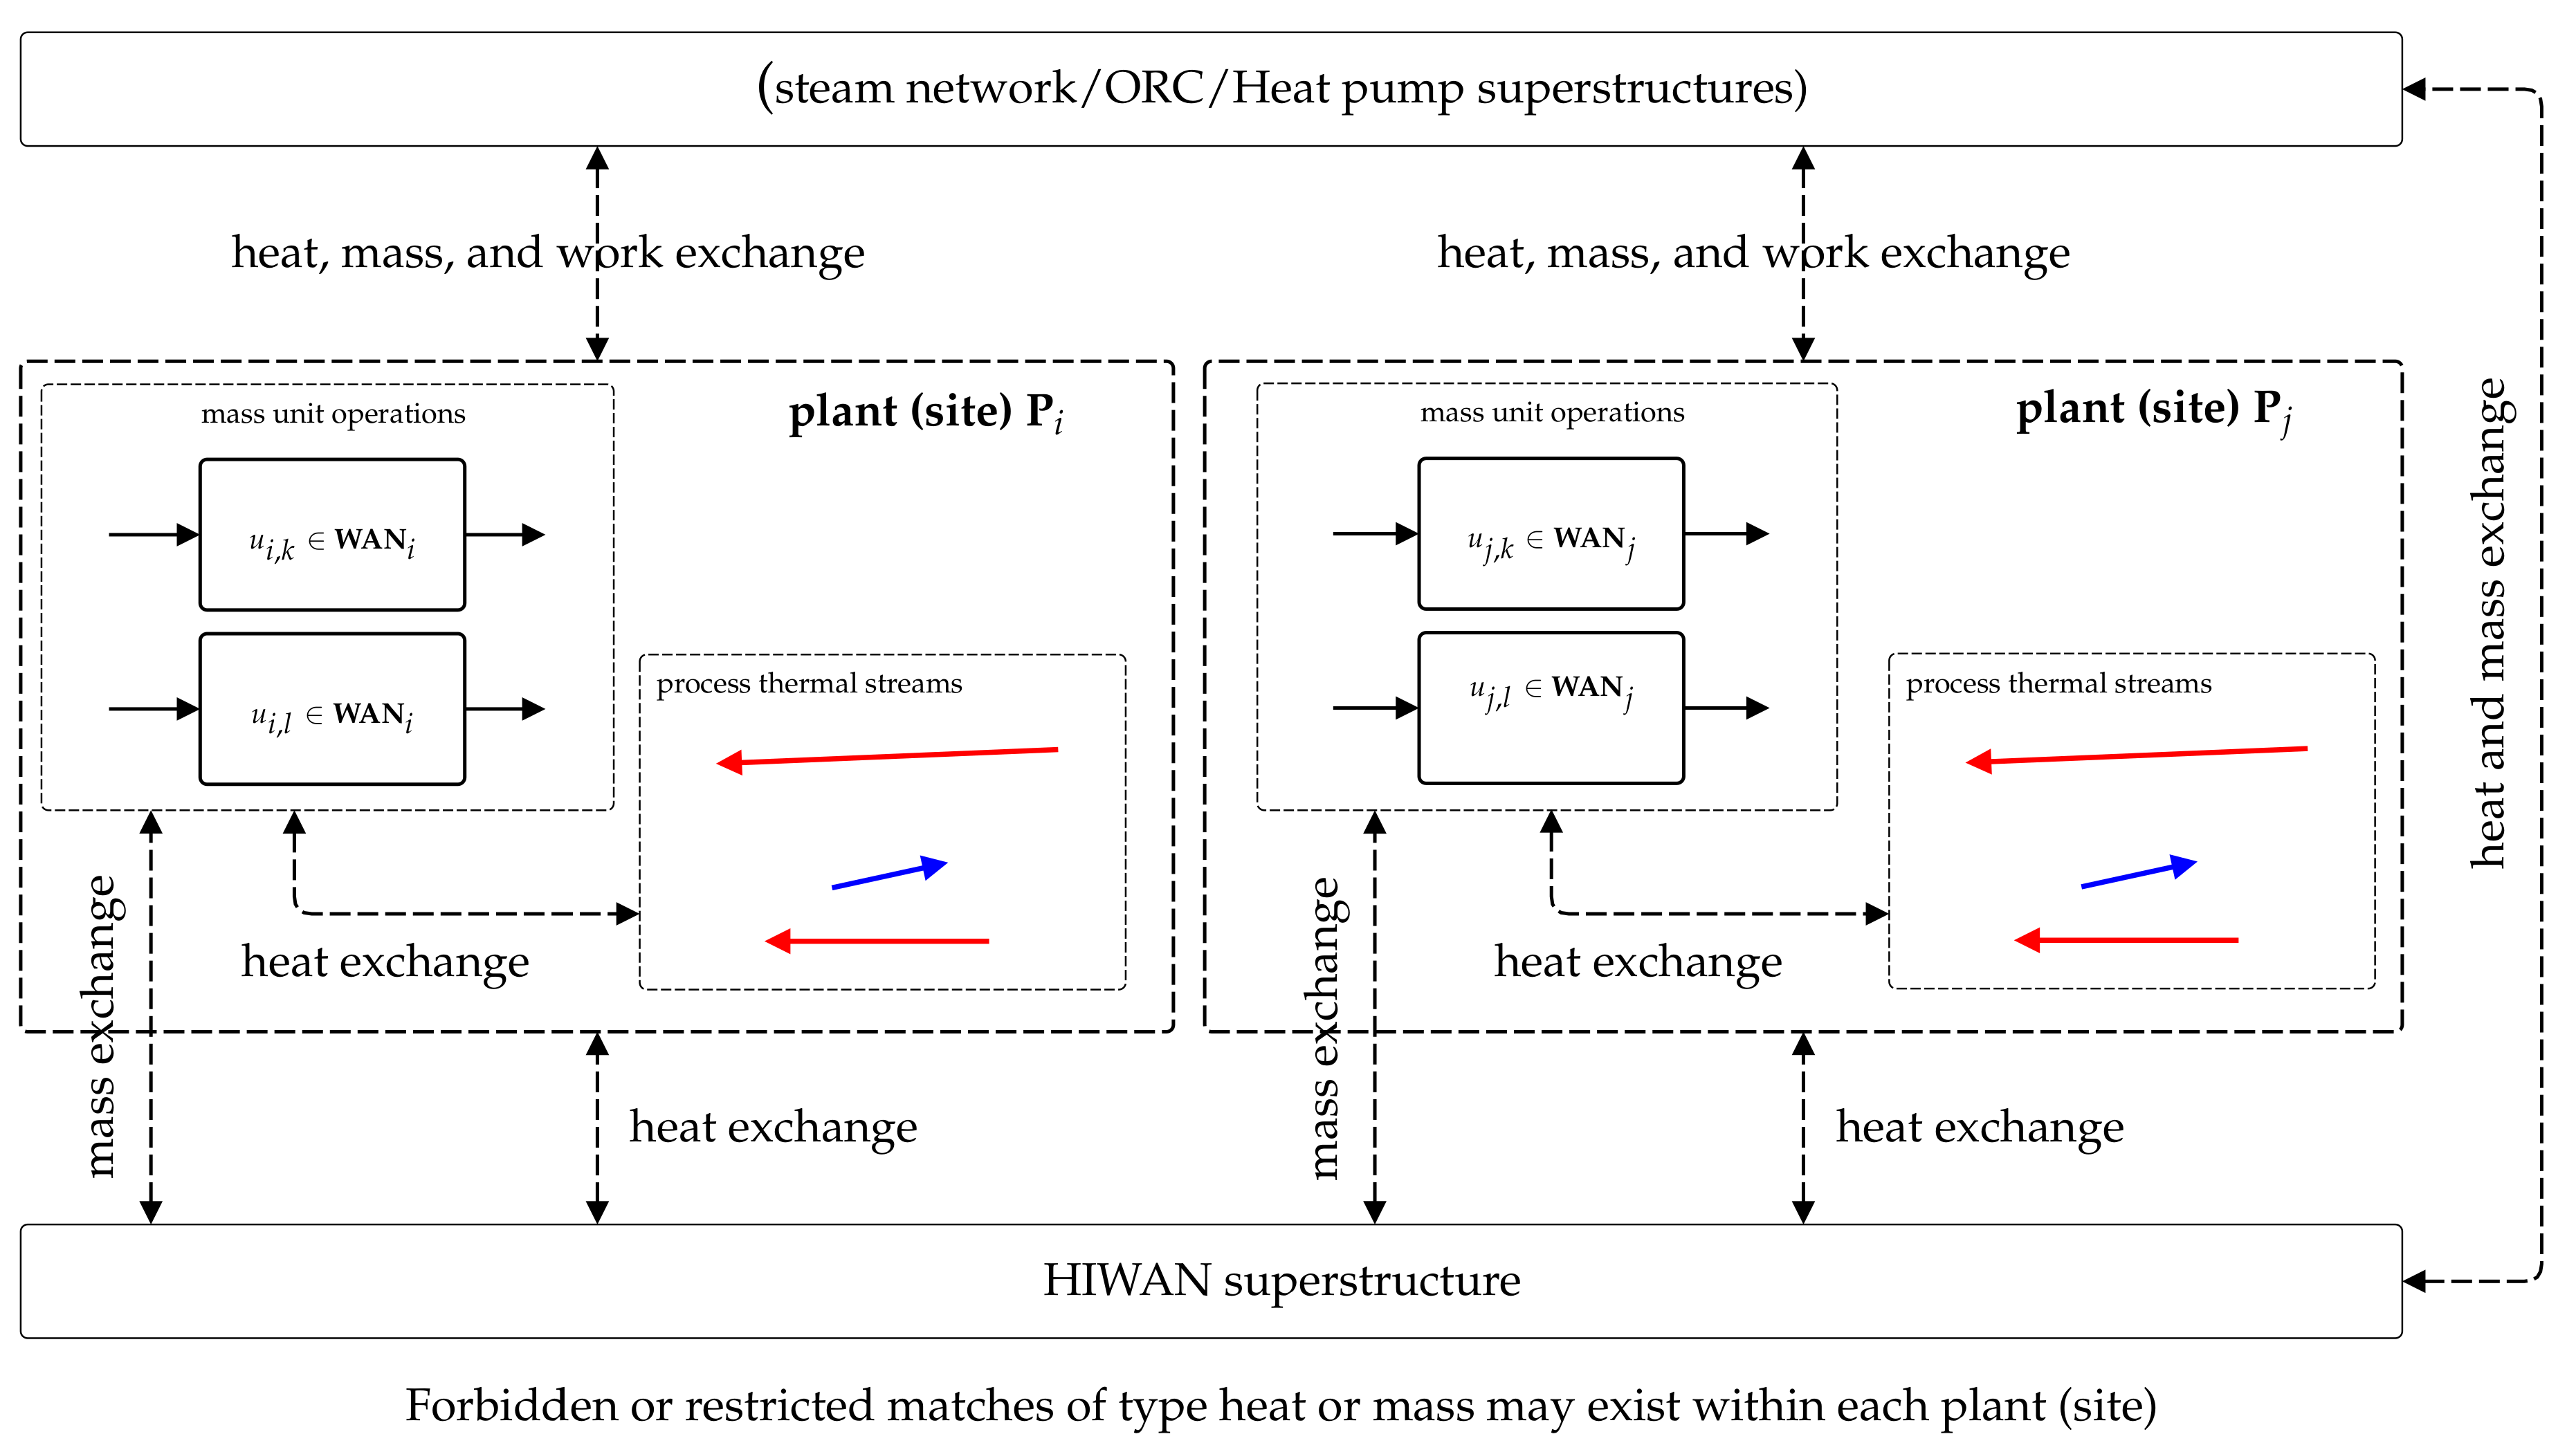
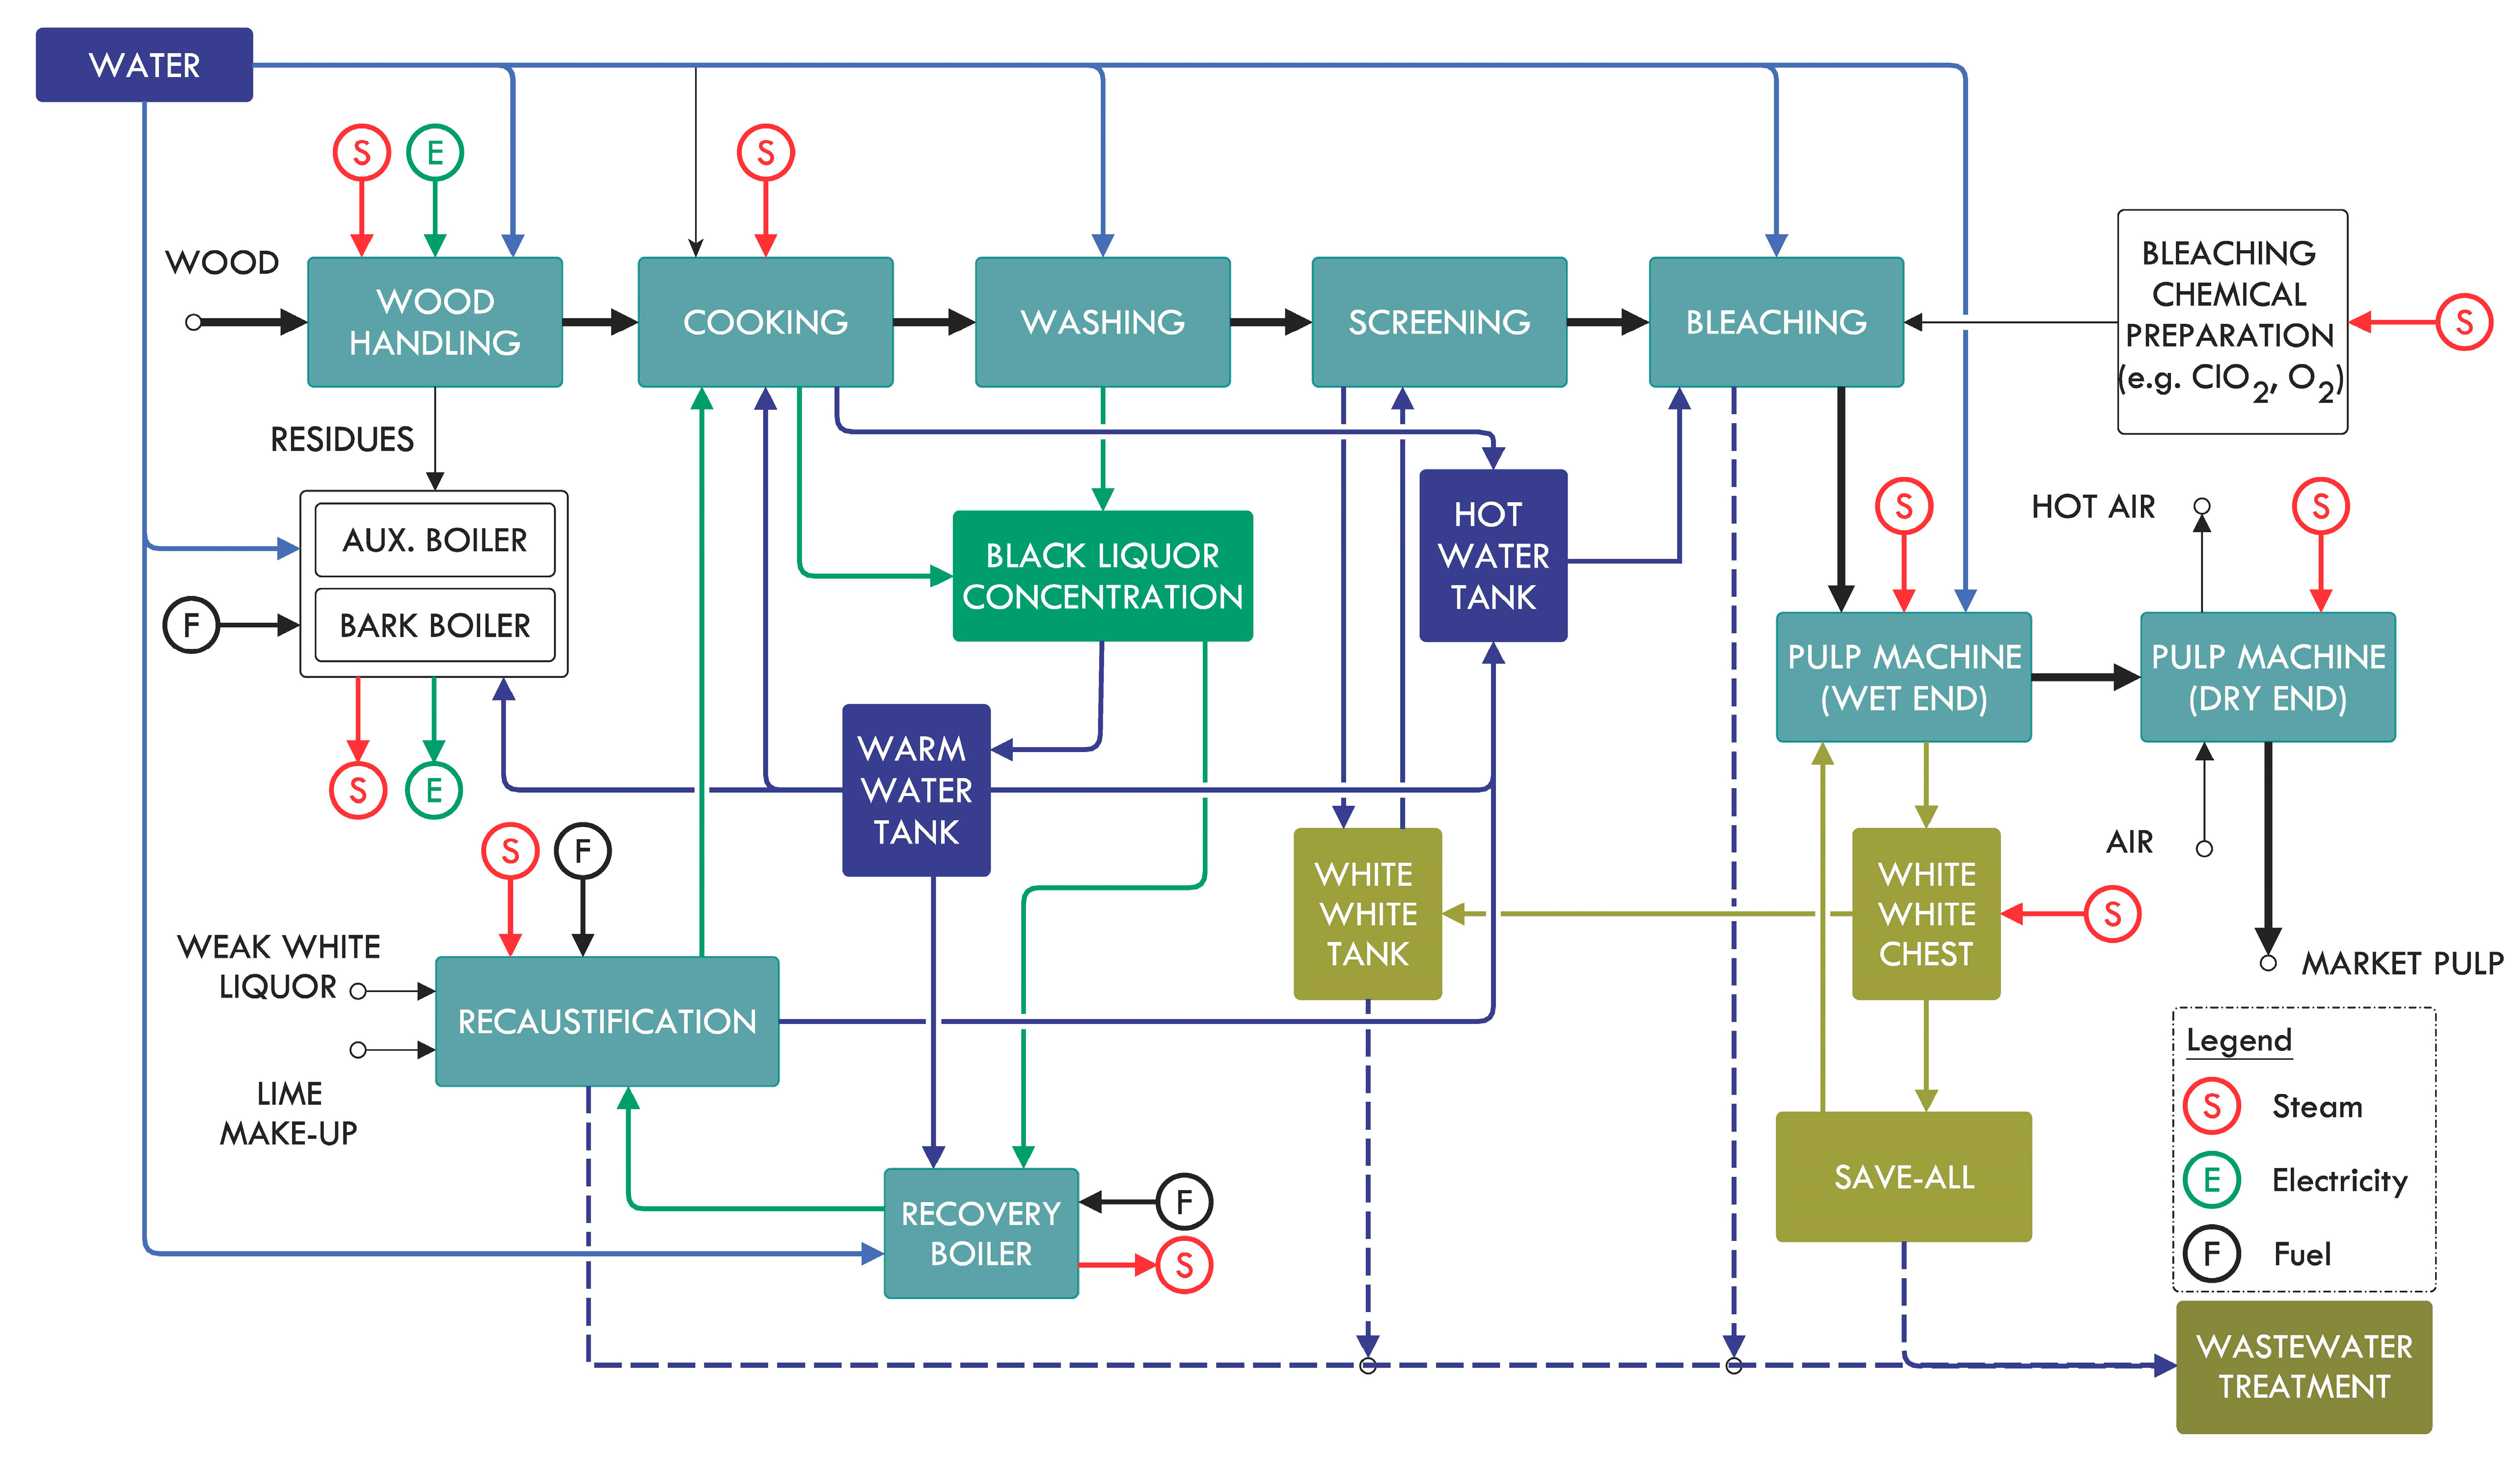
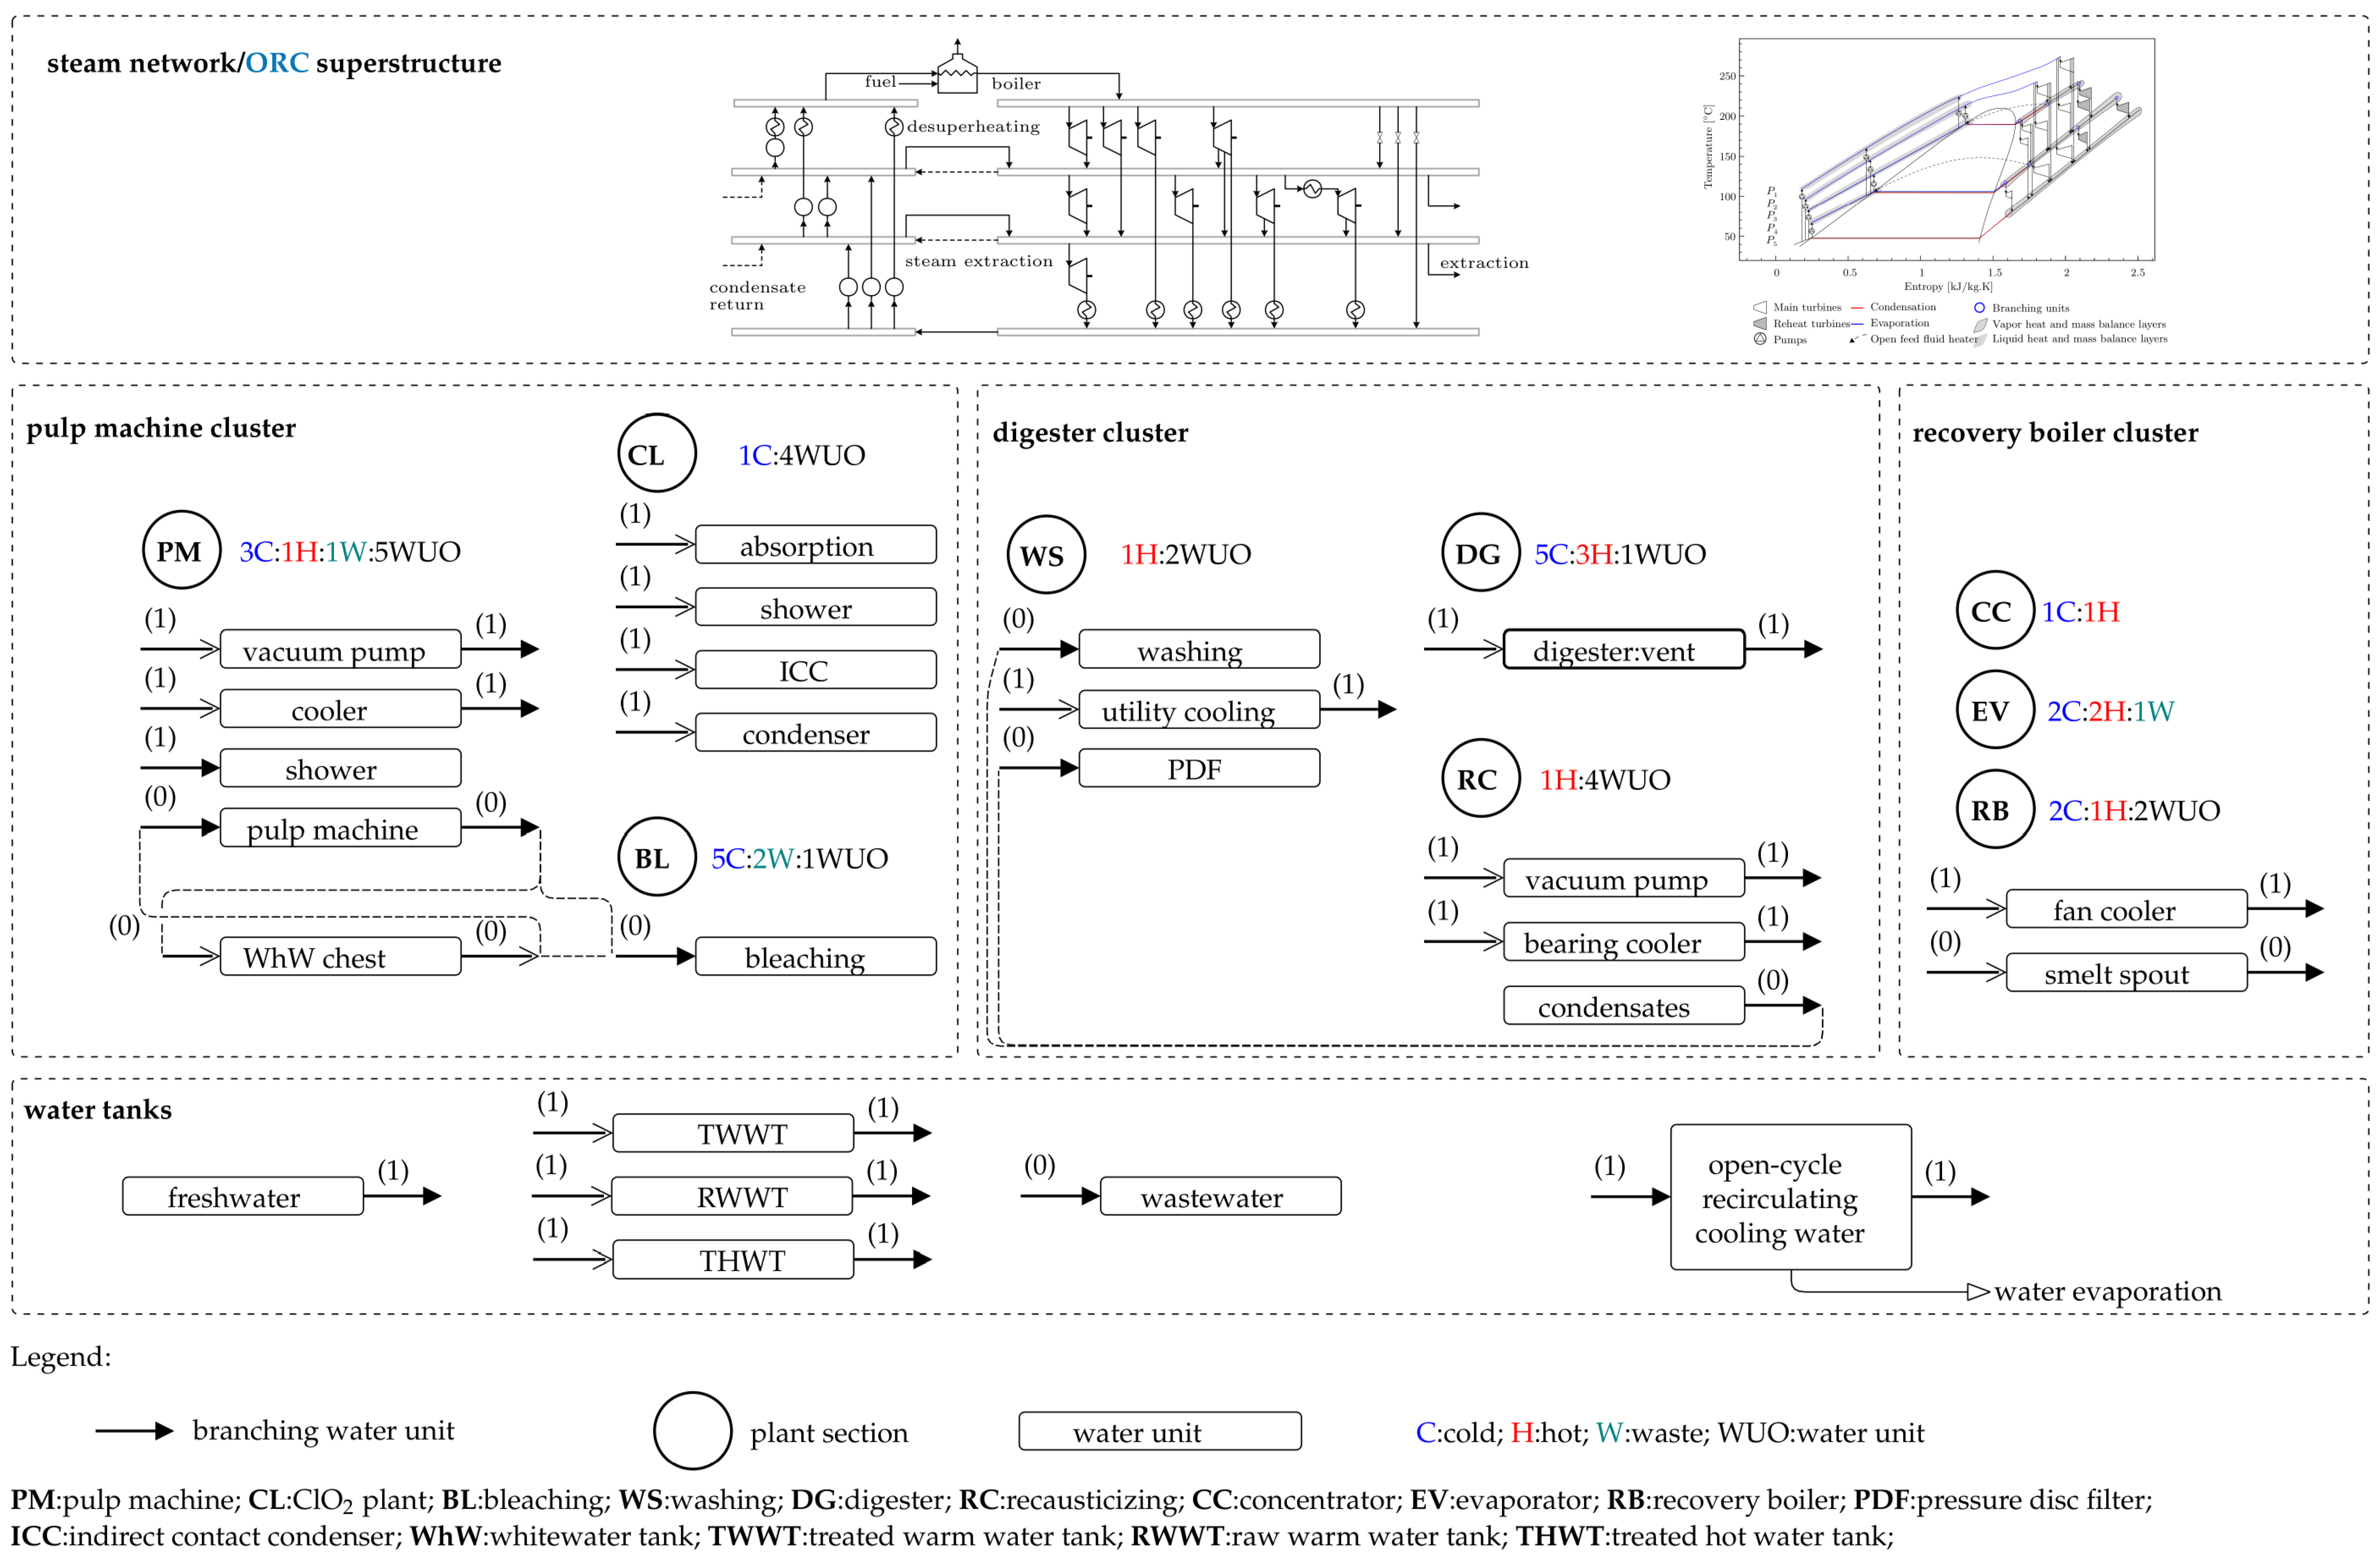
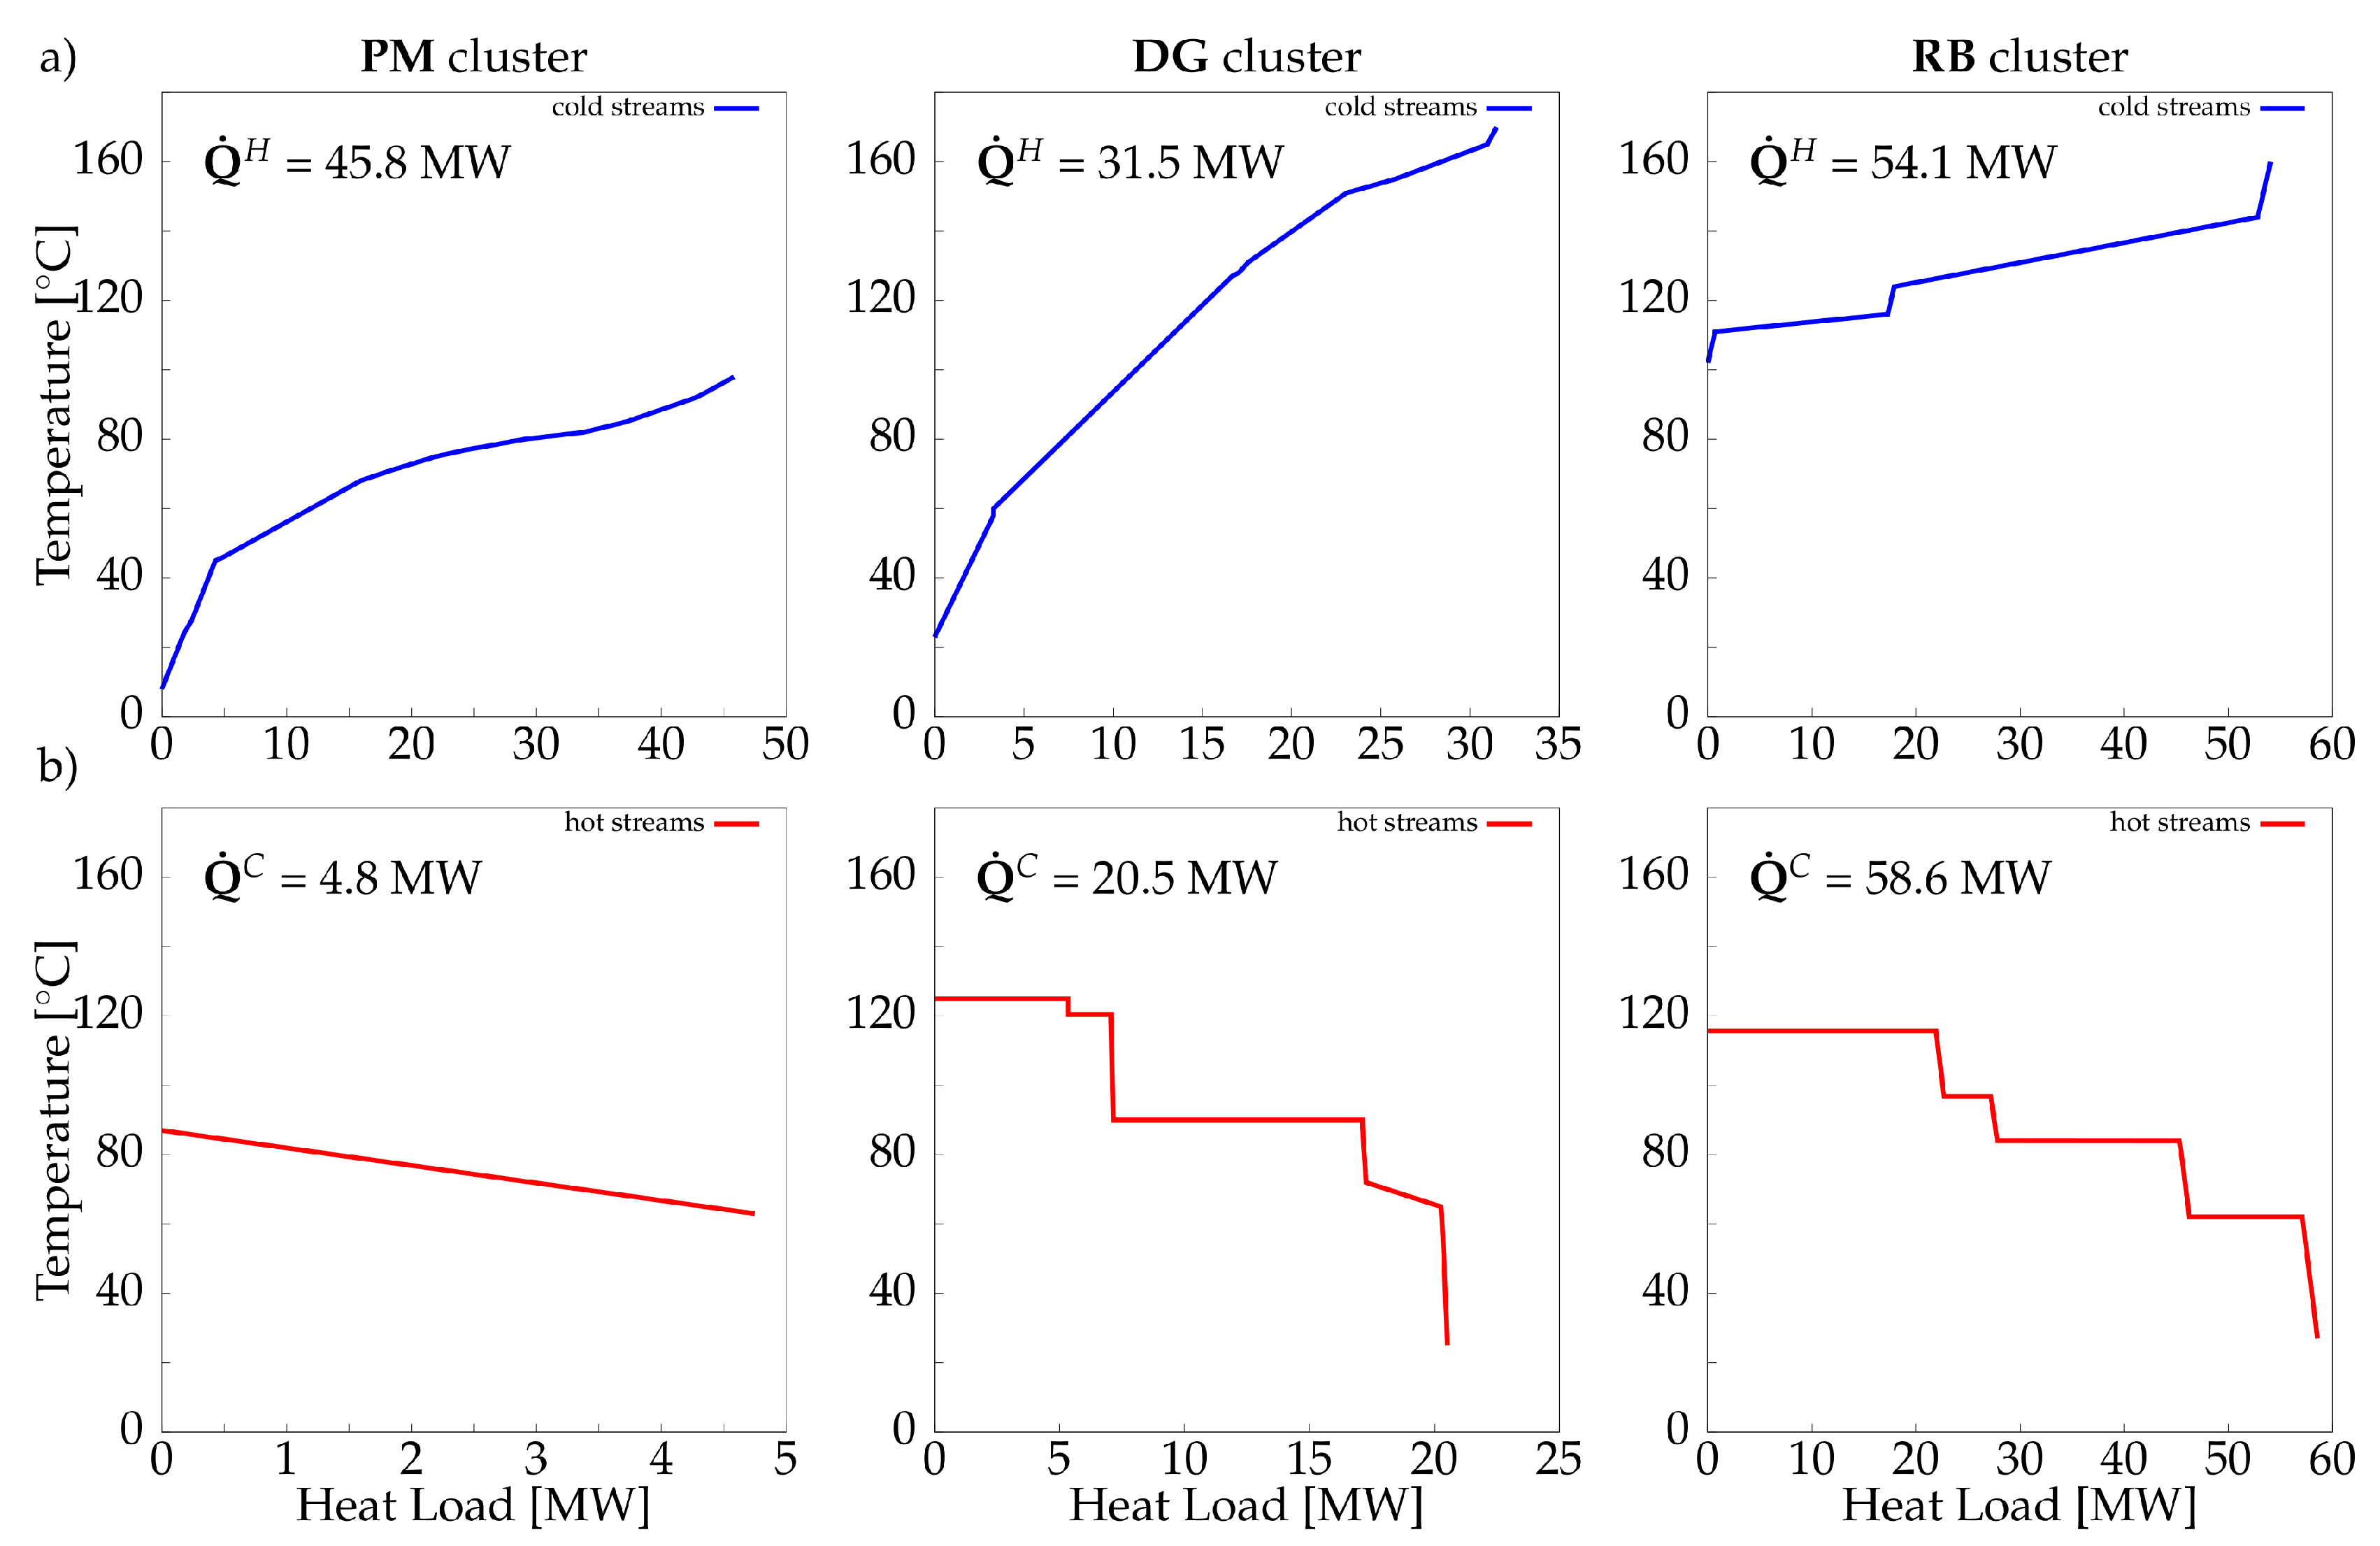