Numerical Delineation of 3D Unsteady Flow Fields in Side Channel Pumps for Engineering Processes

 , ,
, , 
Abstract
:1. Introduction
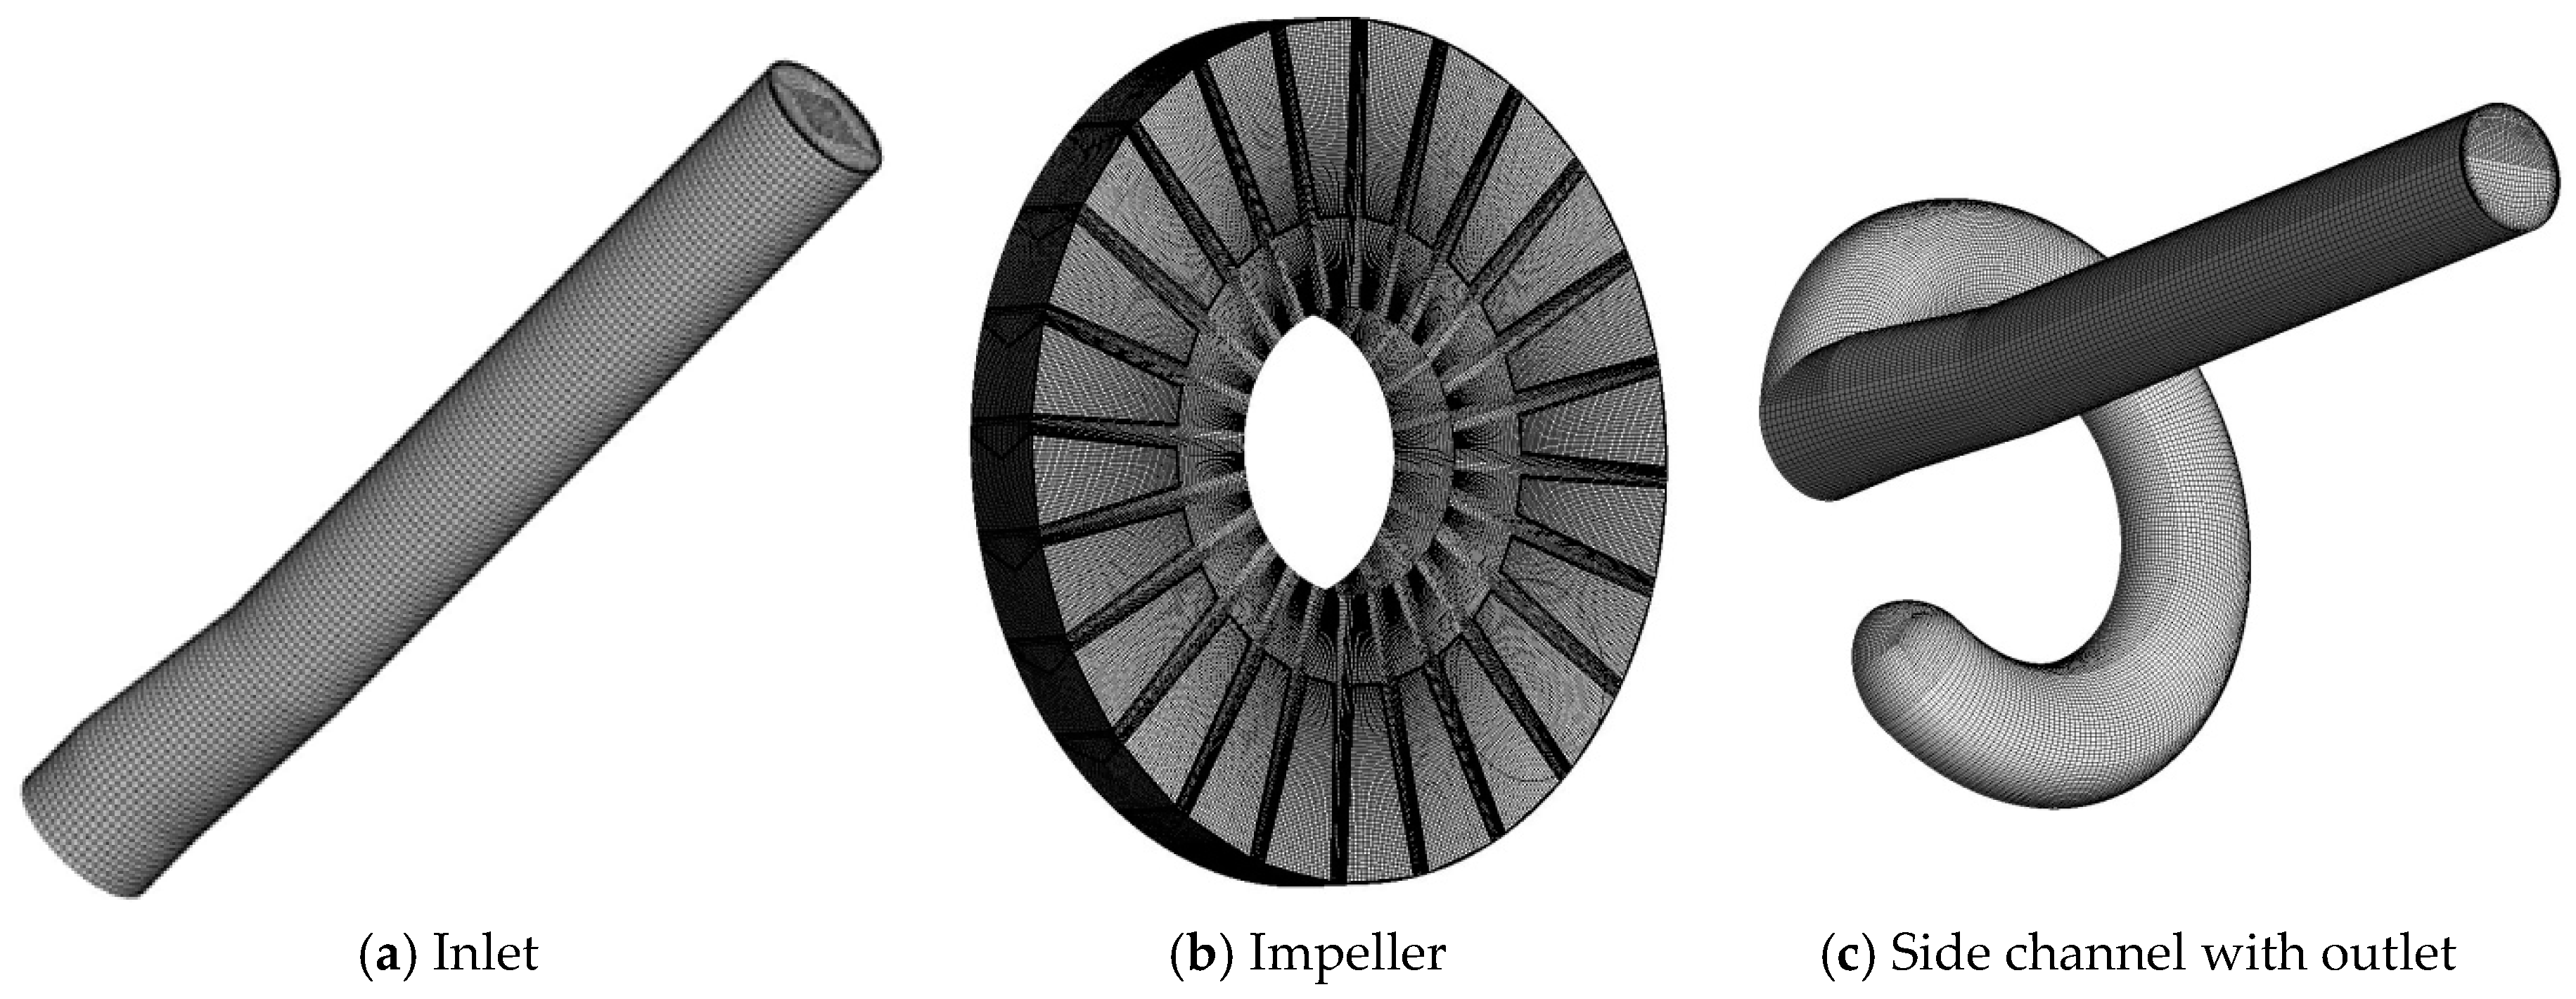
2. Pump Geometry
3. Numerical Calculations (CFD) Setup
3.1. Governing Equations
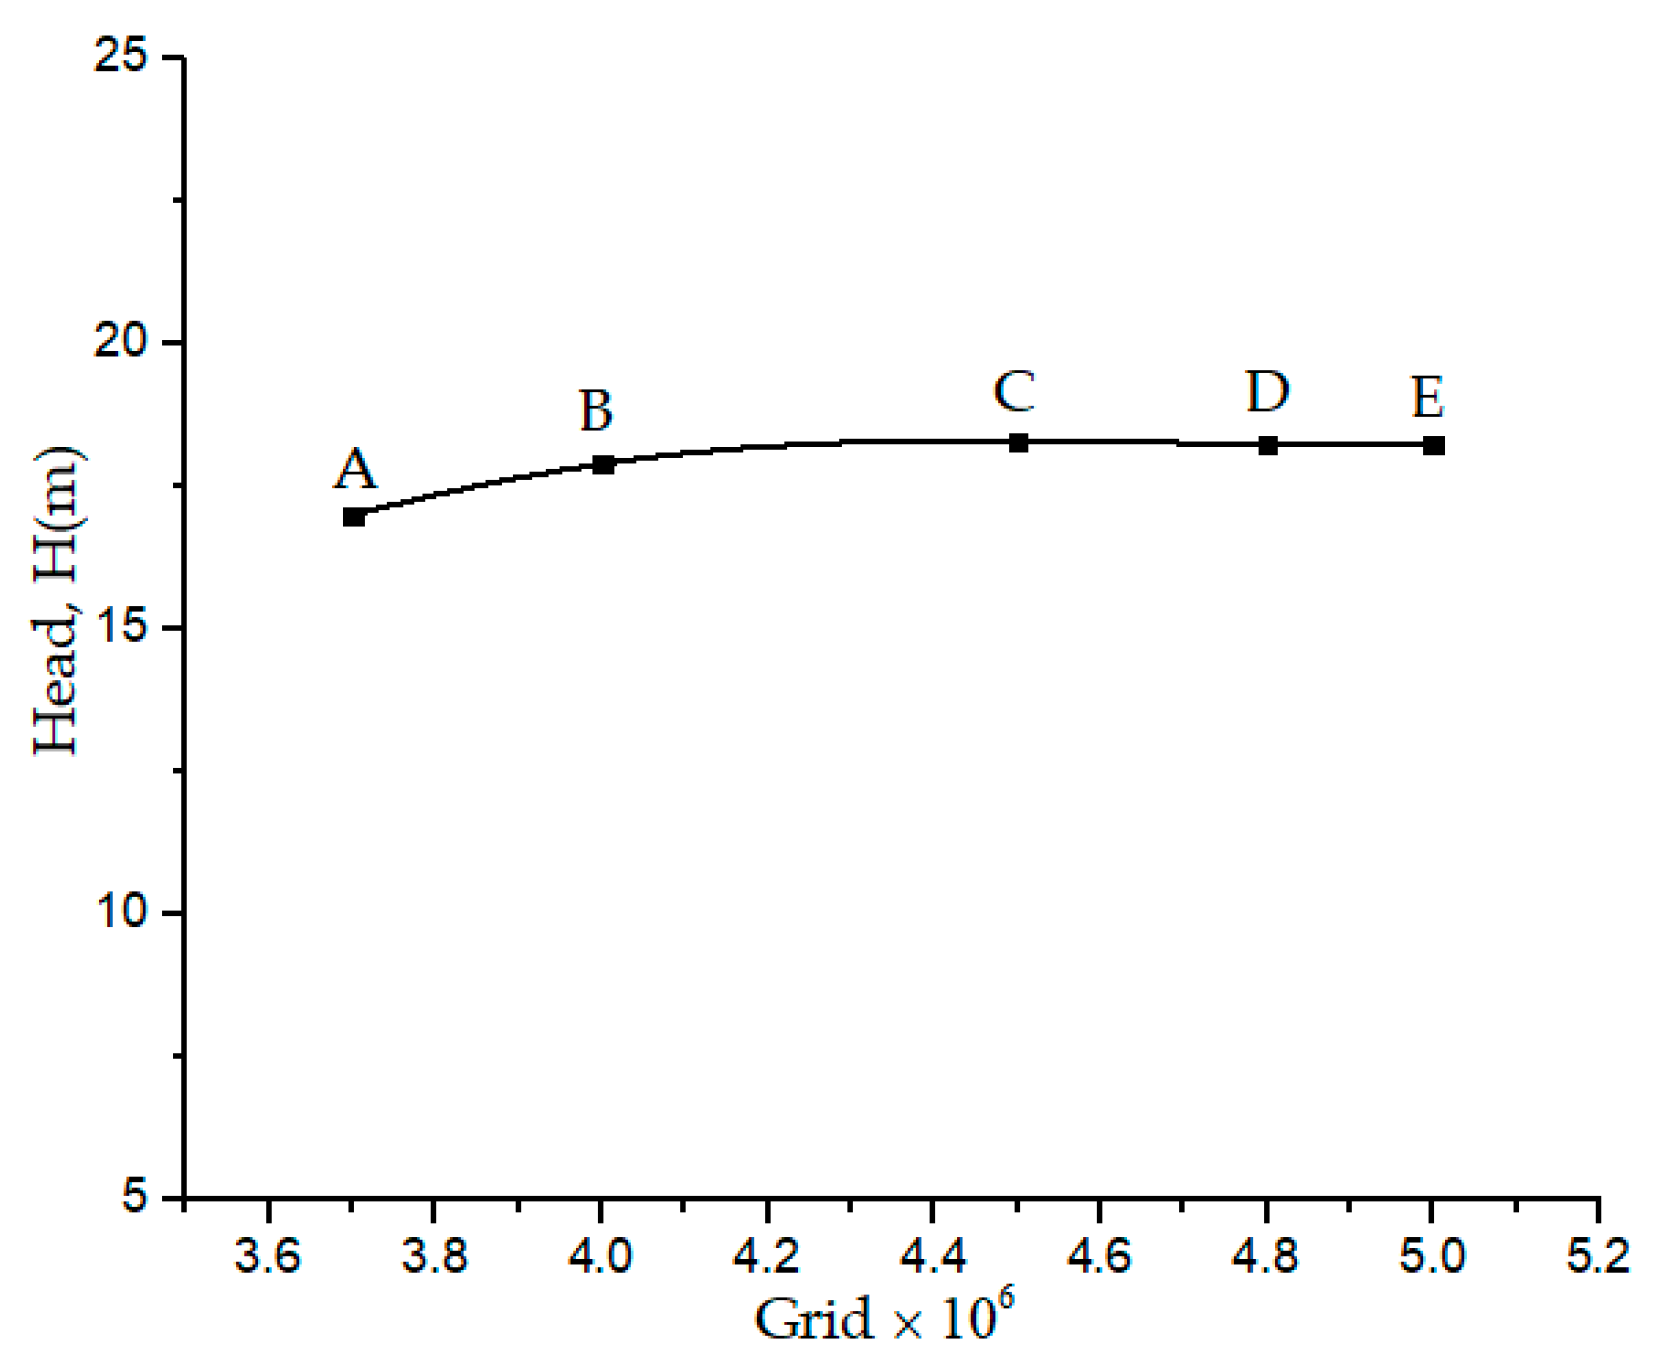
3.2. Mesh Independence Analysis
3.3. Boundary Conditions Settings
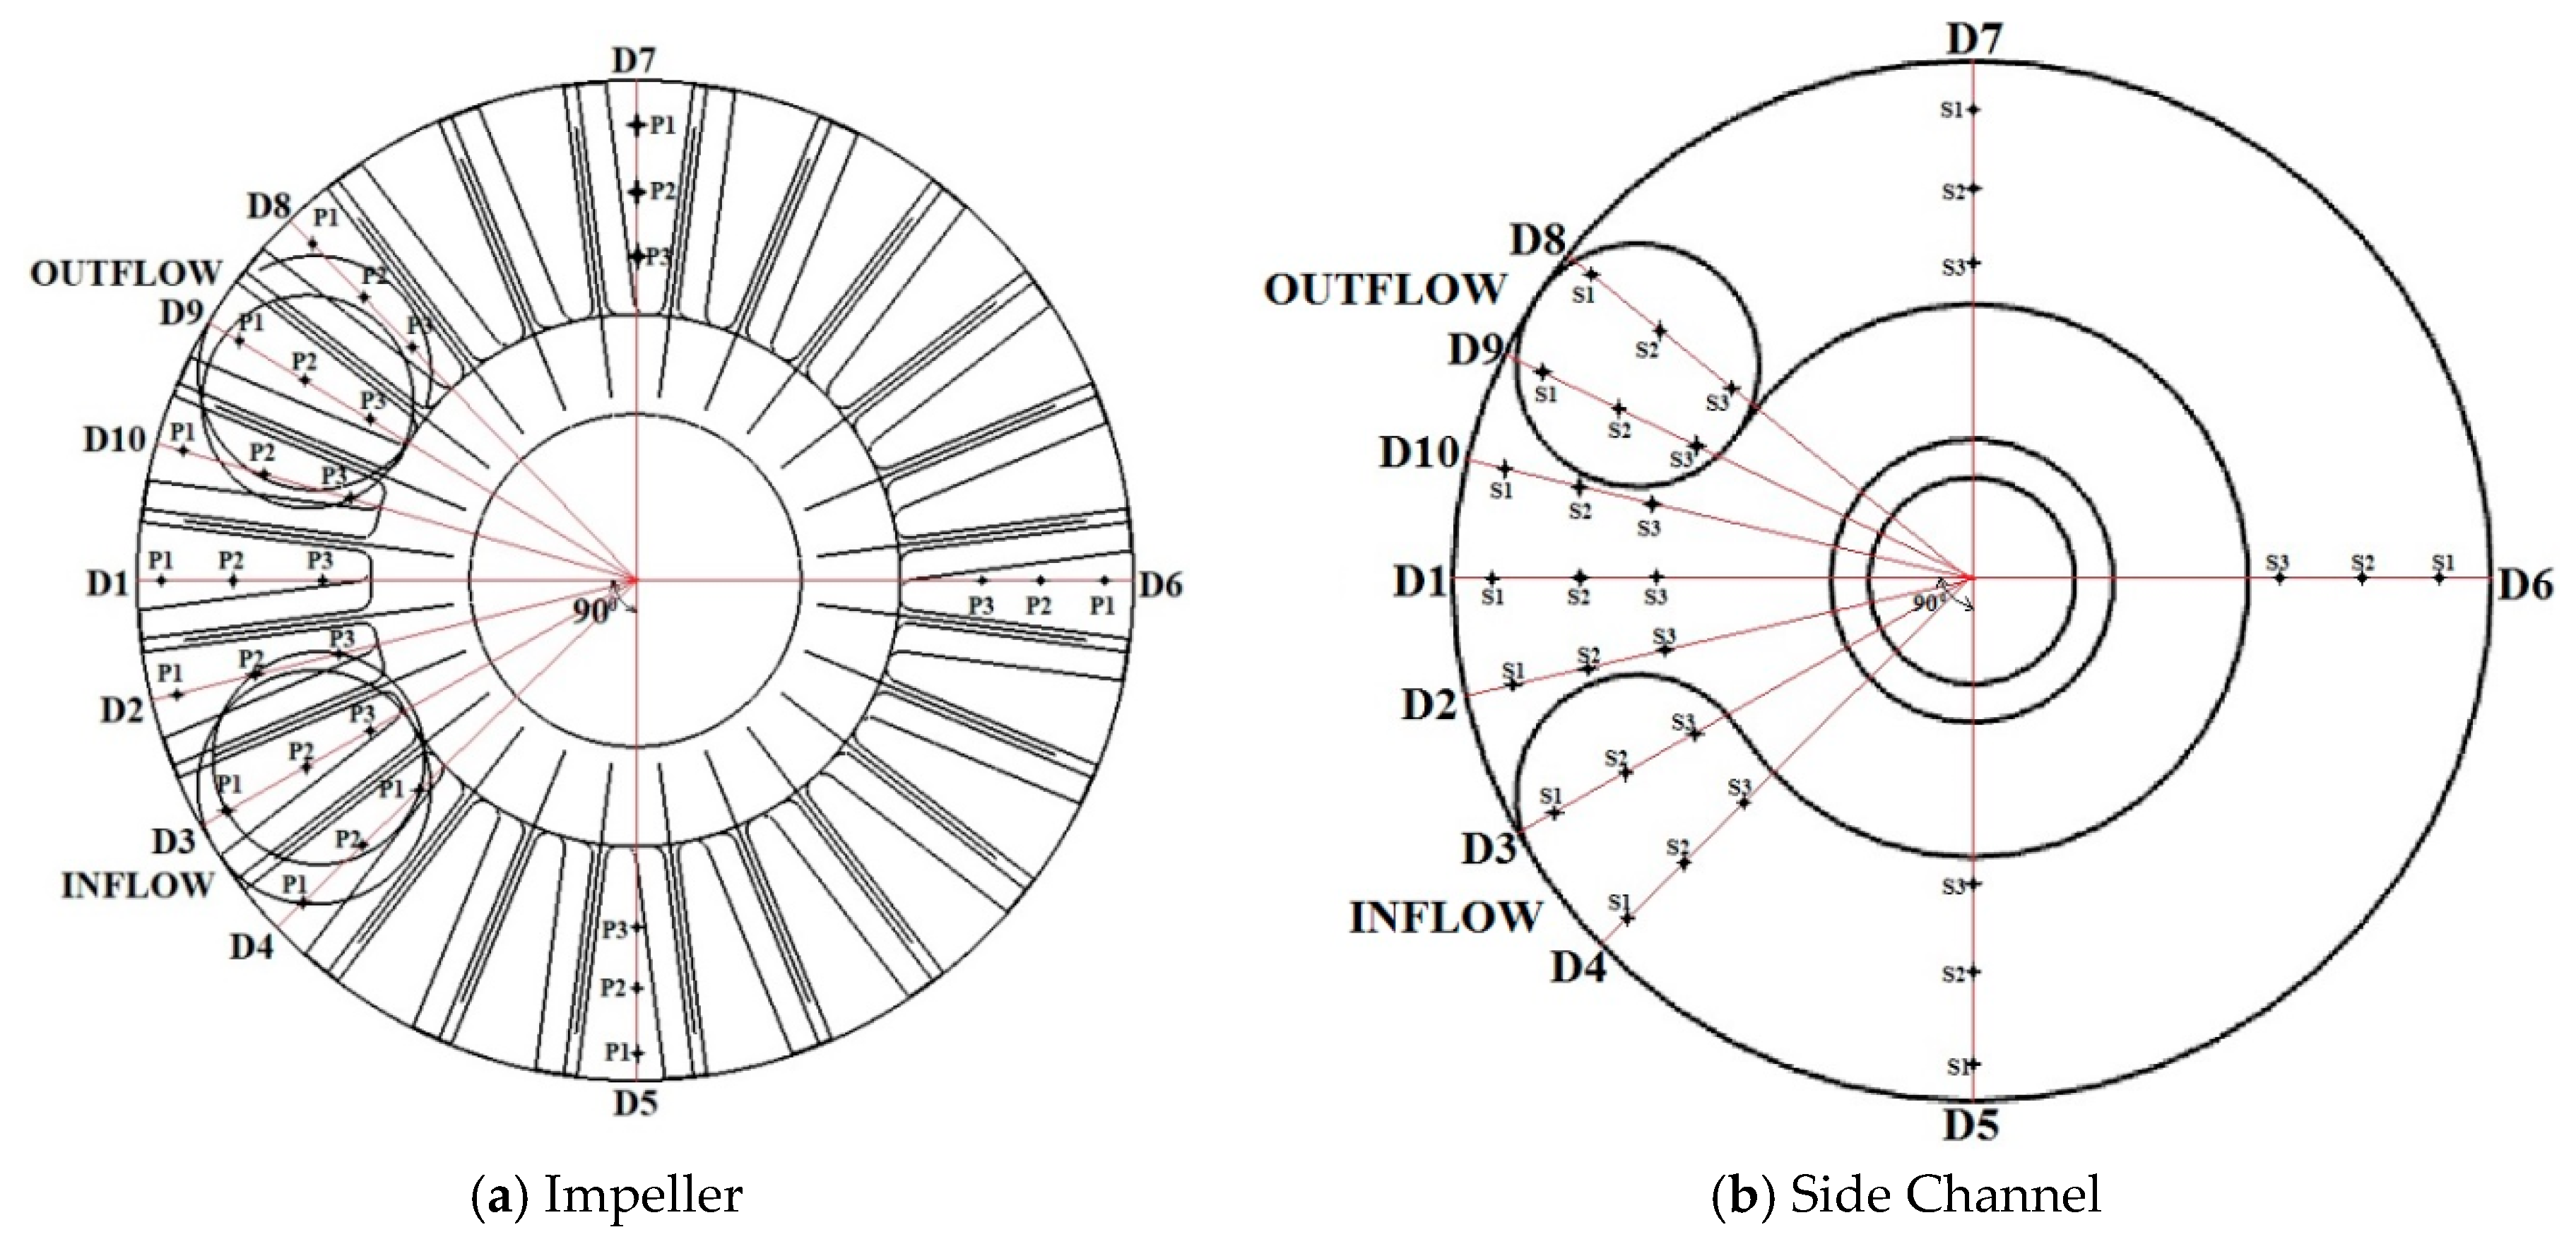
3.4. Monitoring Points
4. Results and Discussion
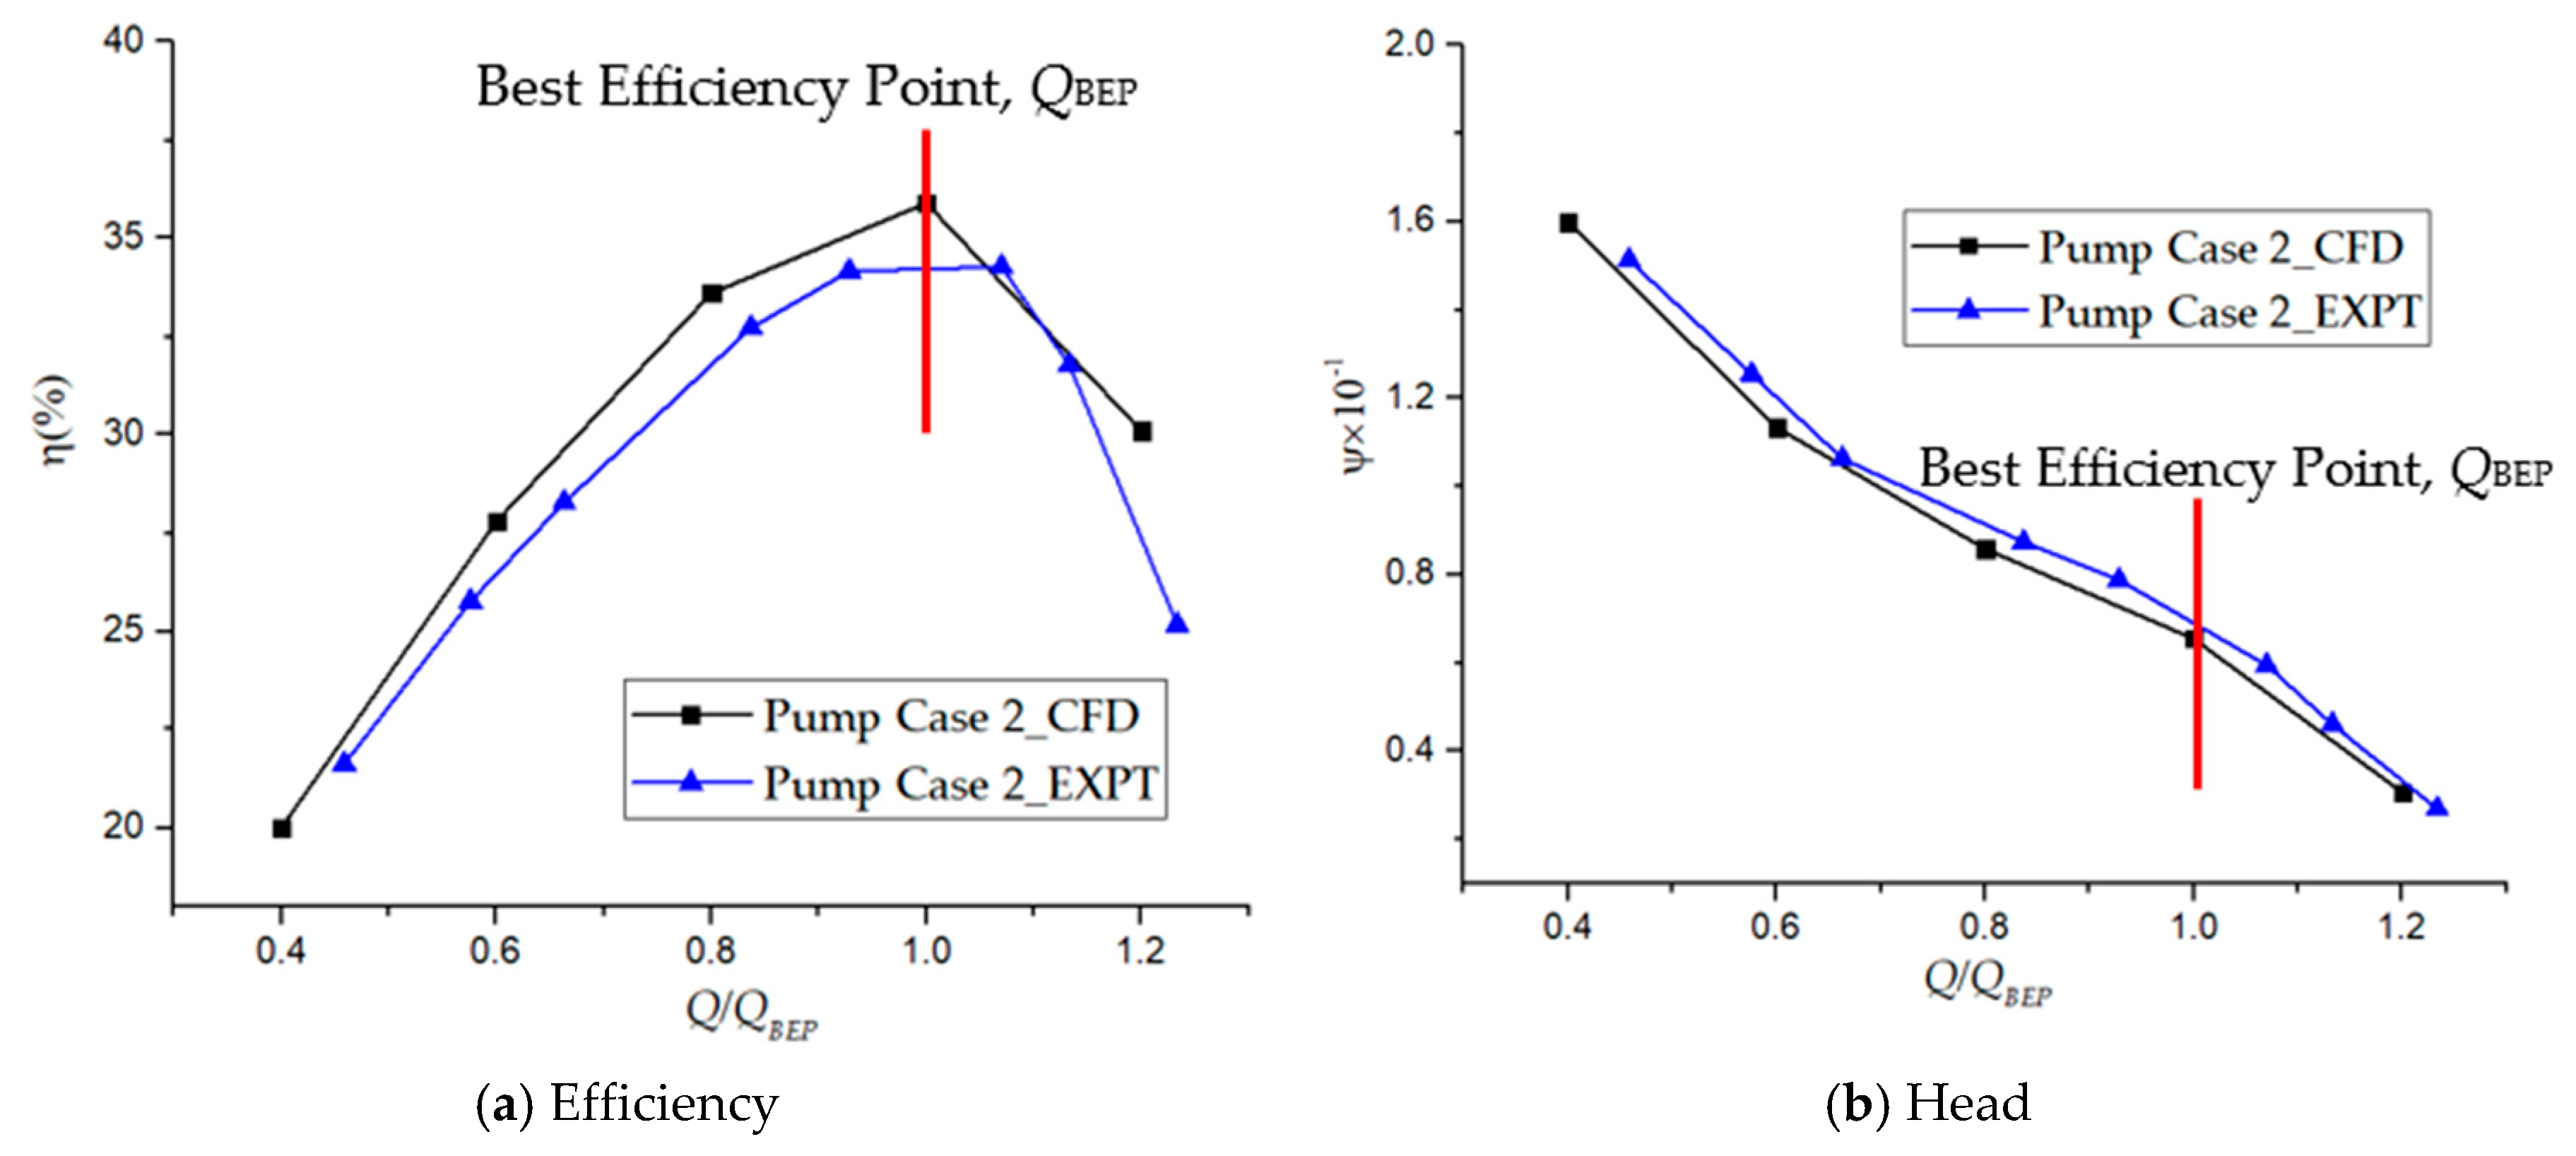
4.1. Hydraulic Performance Characteristics
4.2. Pressure Fluctuation Intensity
4.2.1. Definition of Pressure Fluctuation Intensity
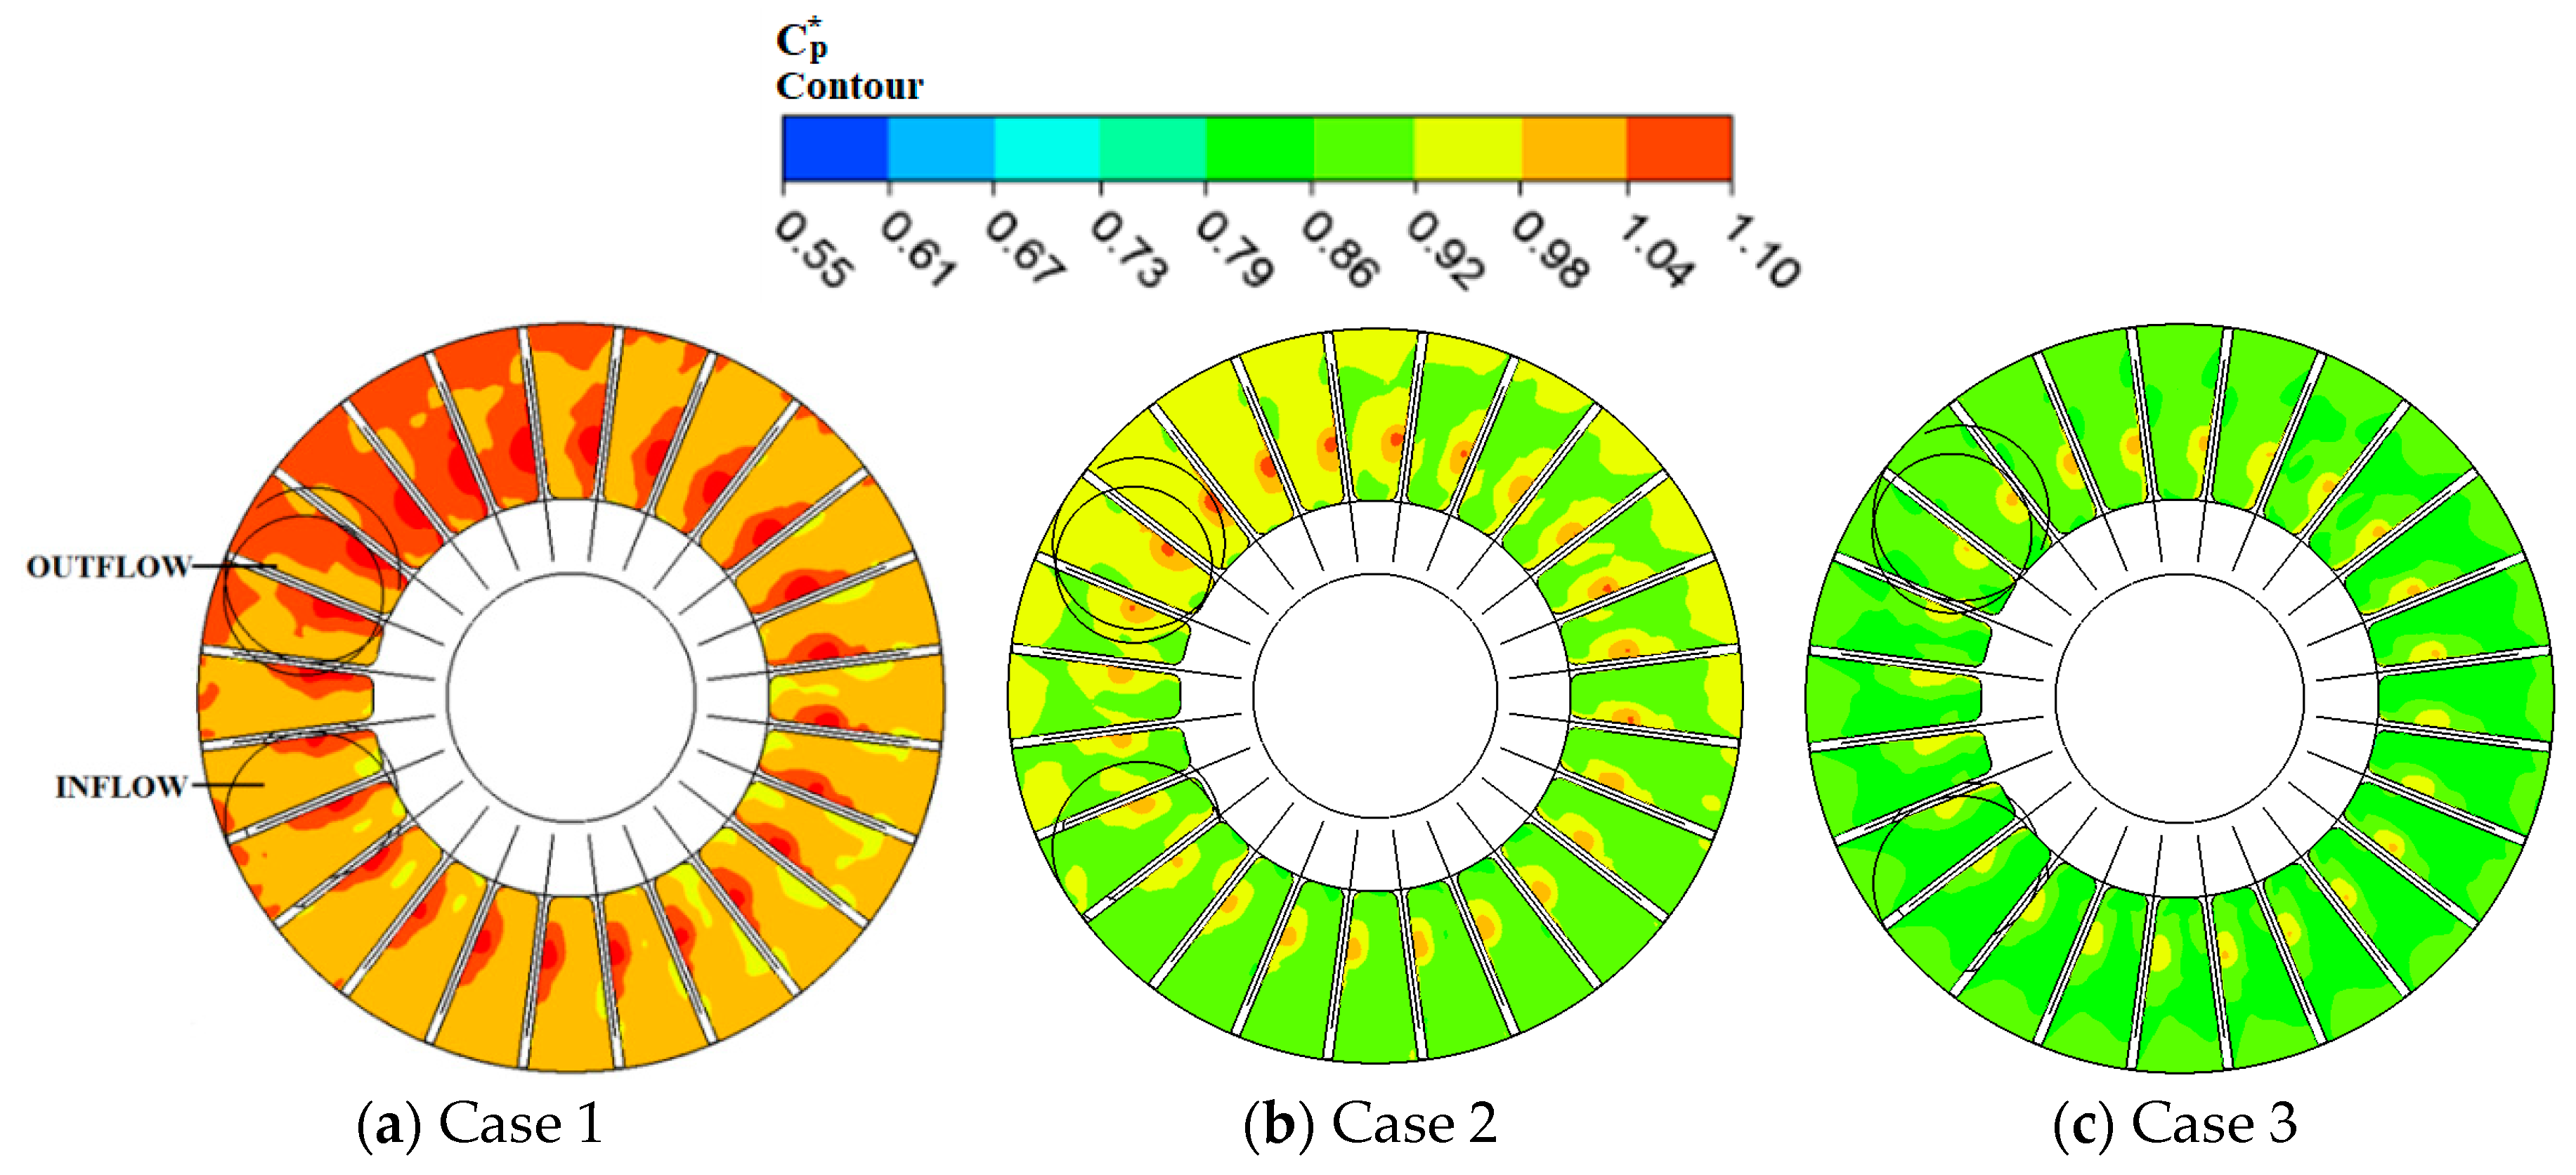
4.2.2. Impeller Passage
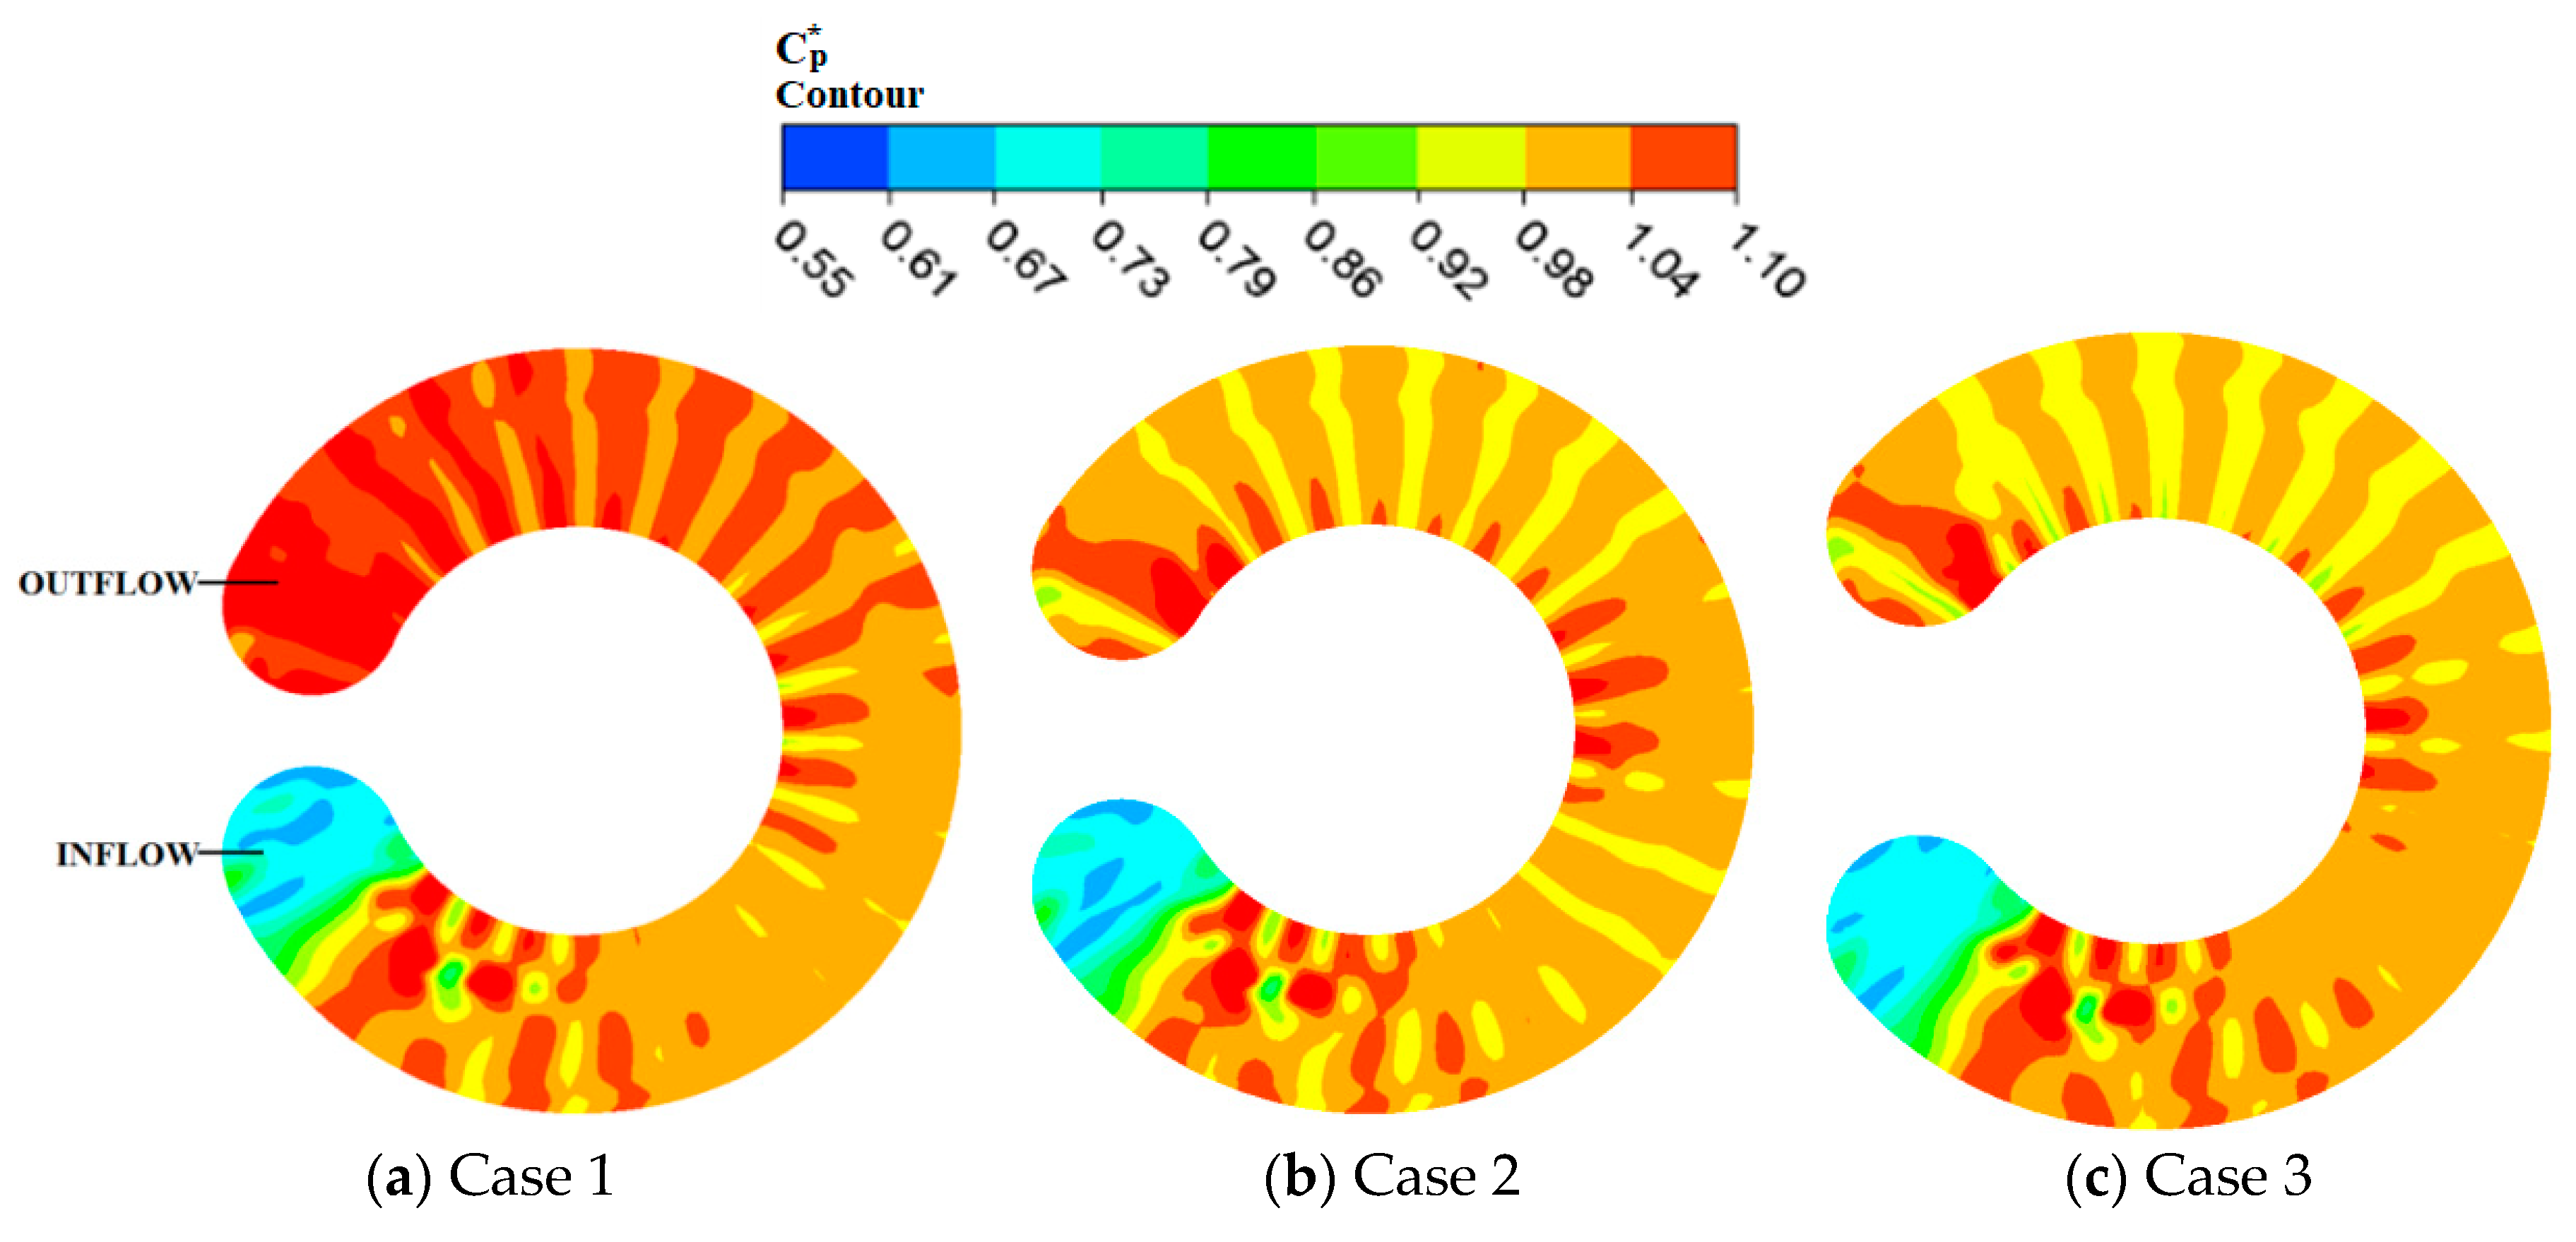
4.2.3. Side Channel Passage
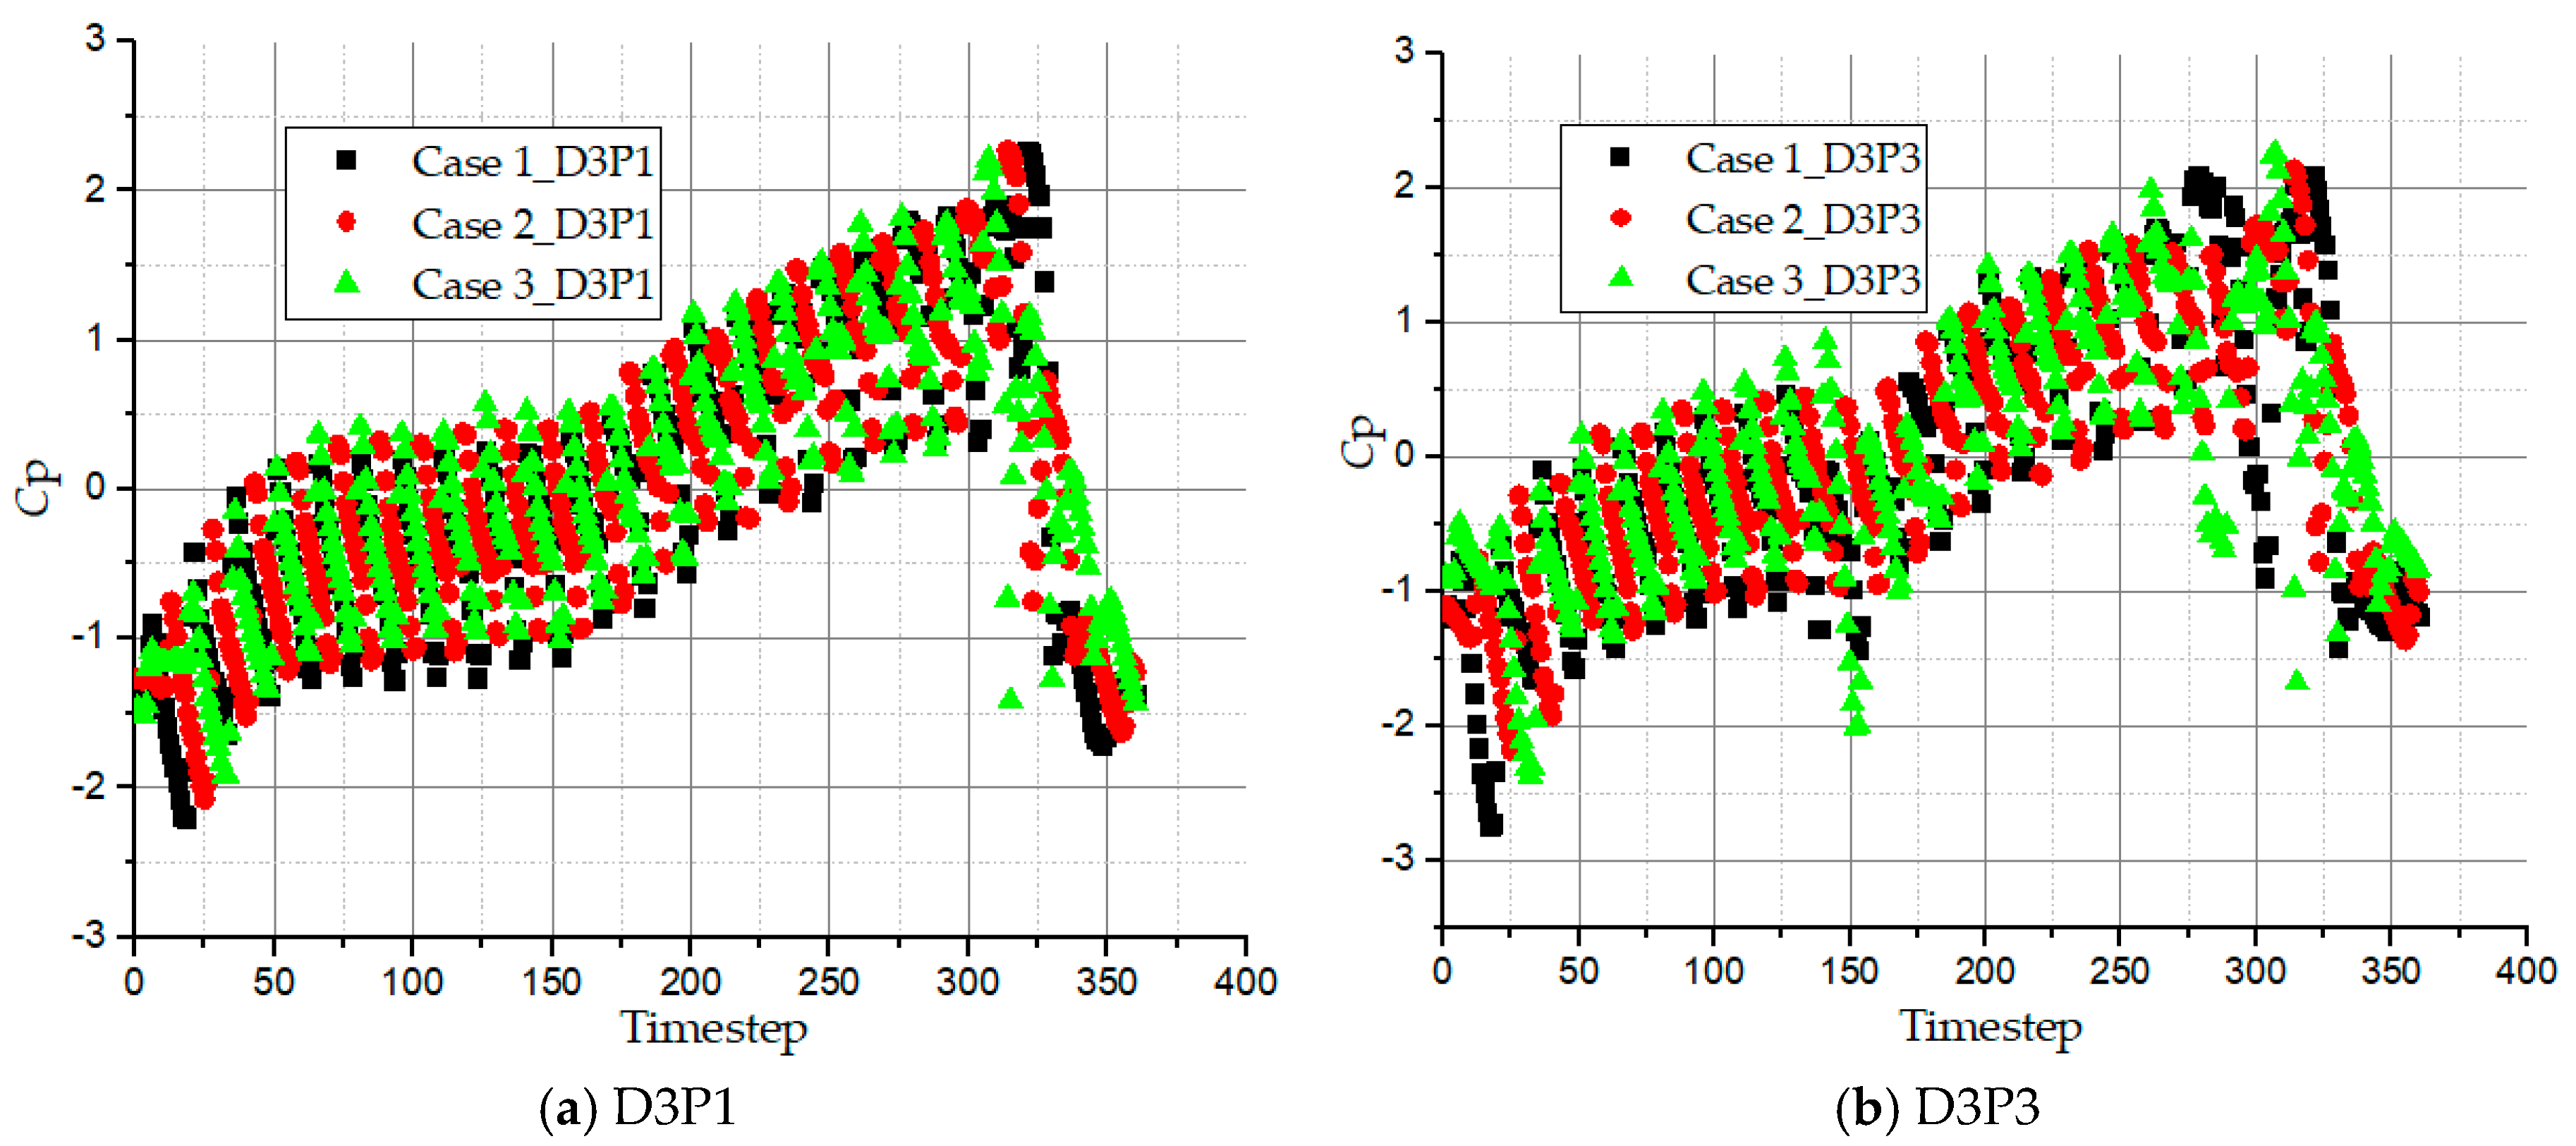
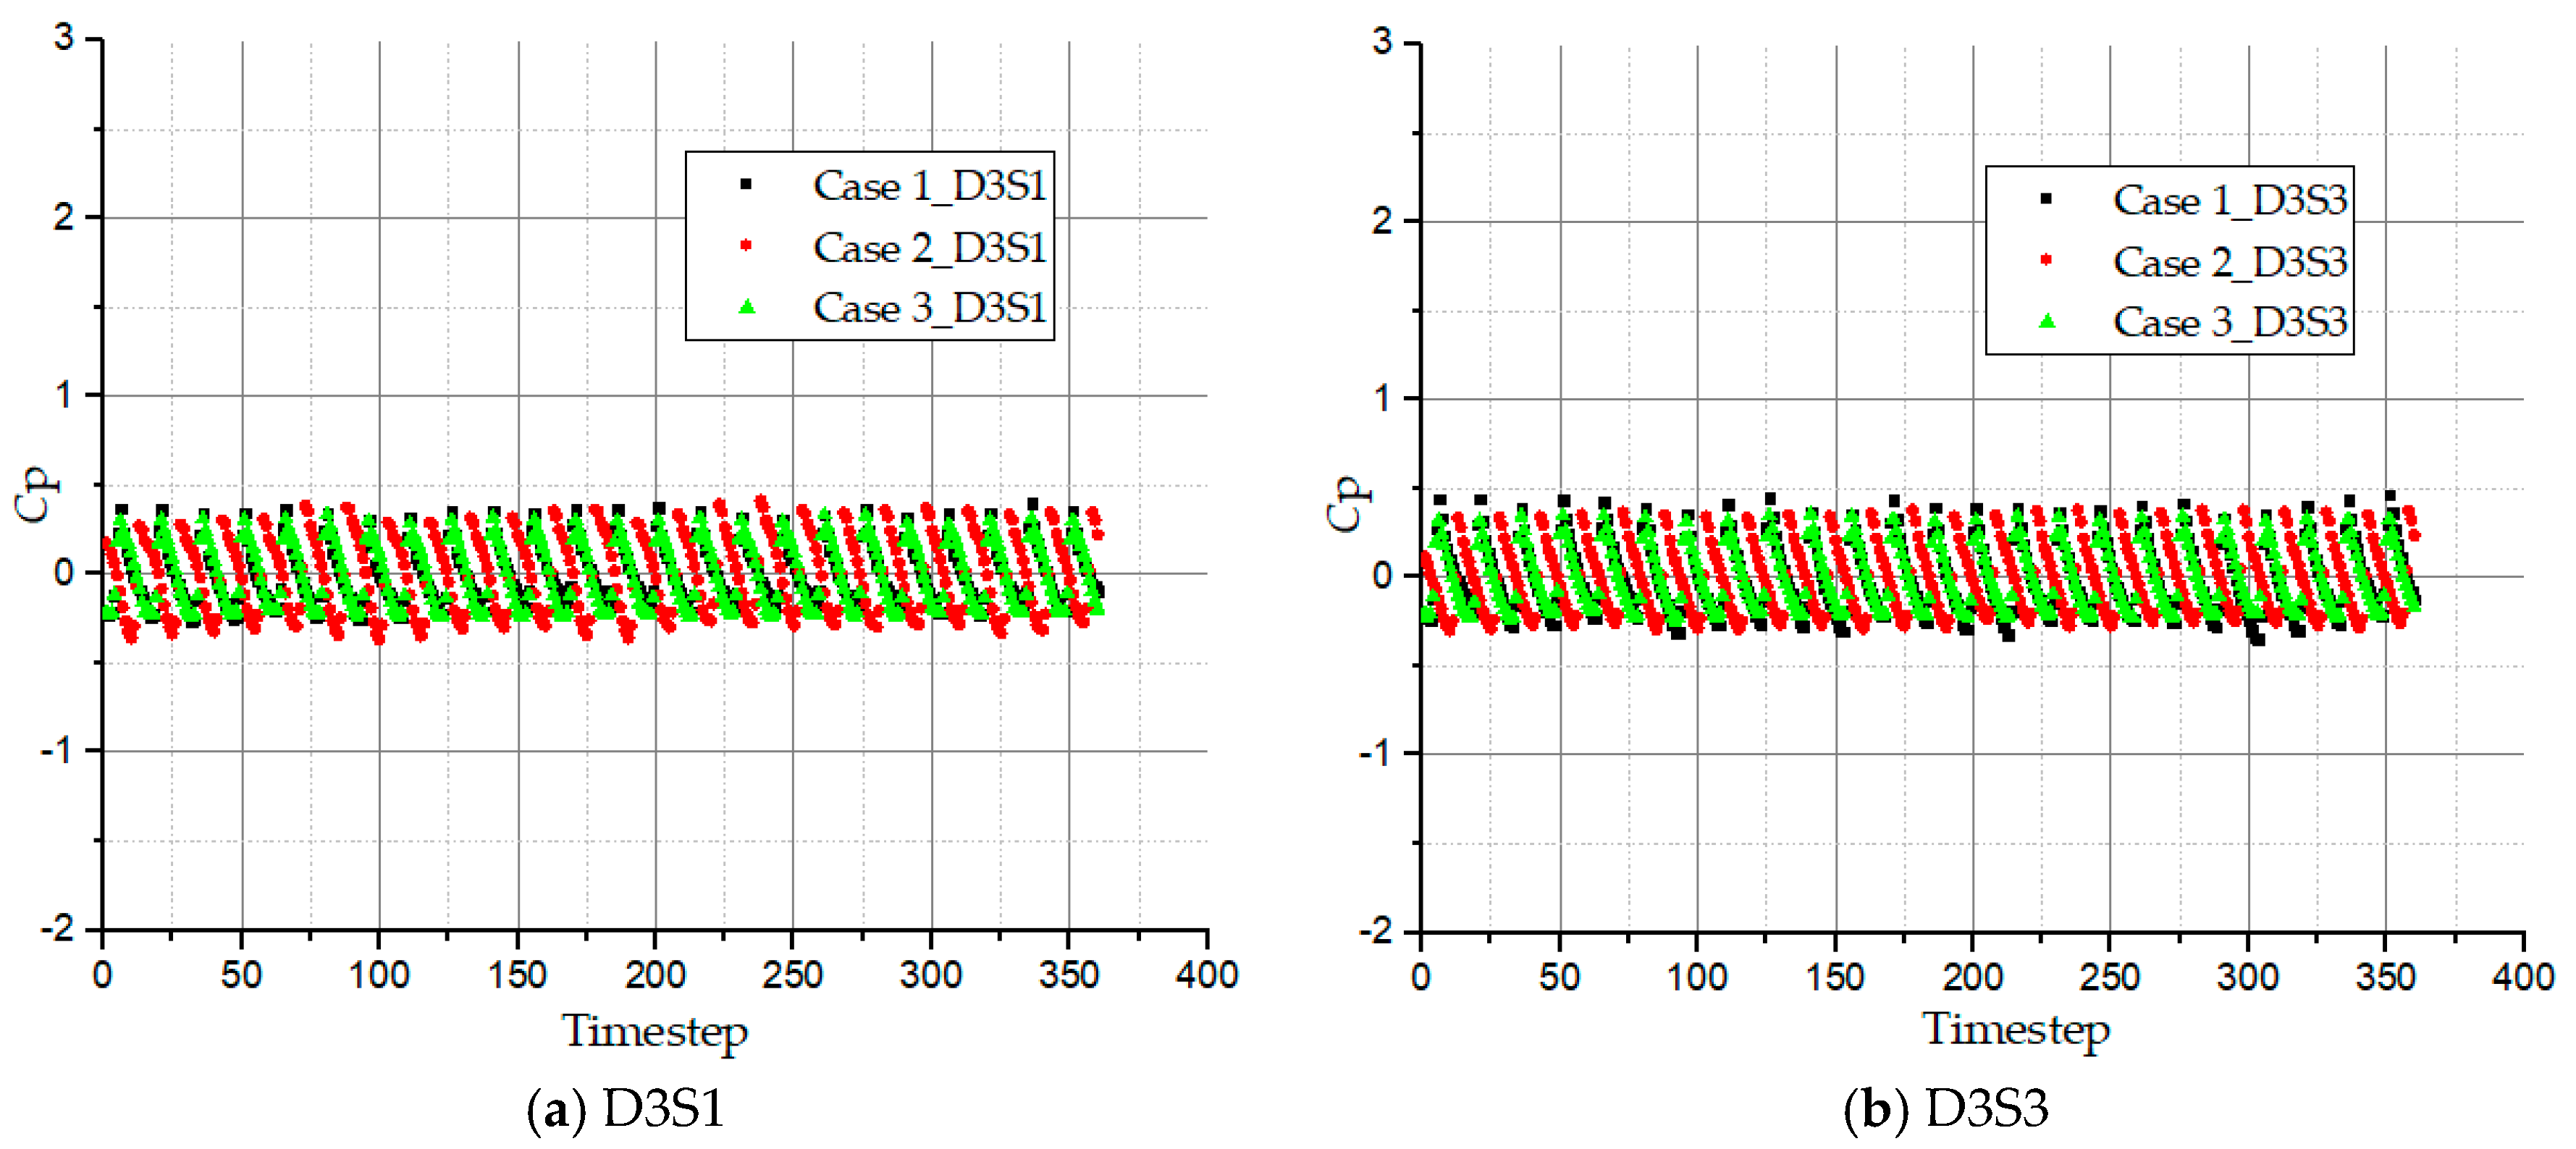
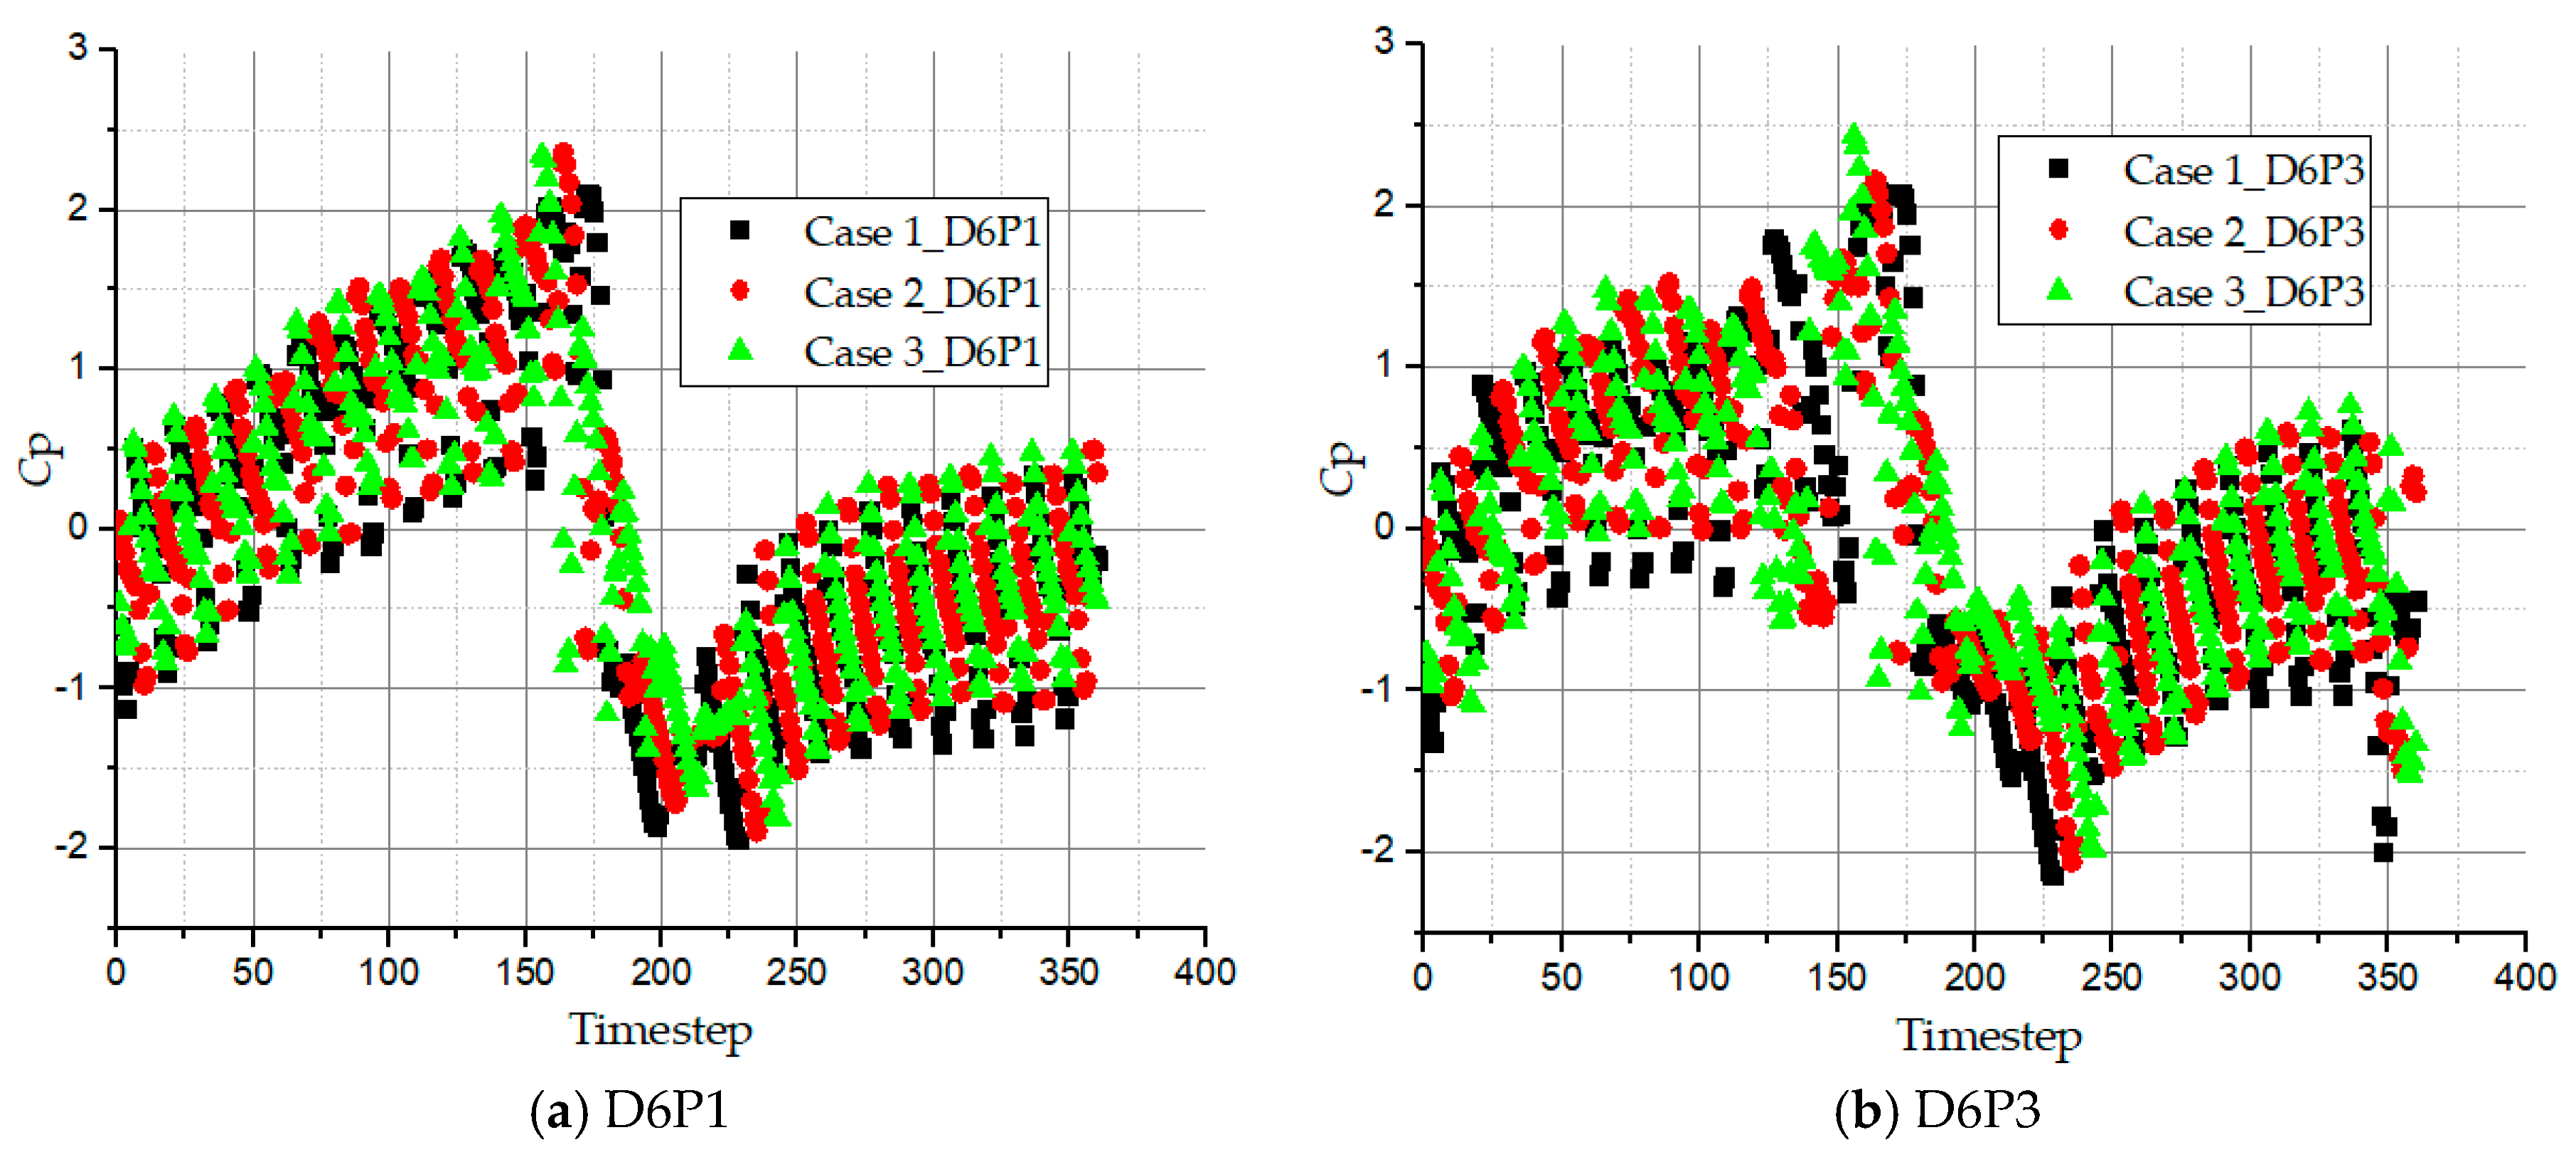
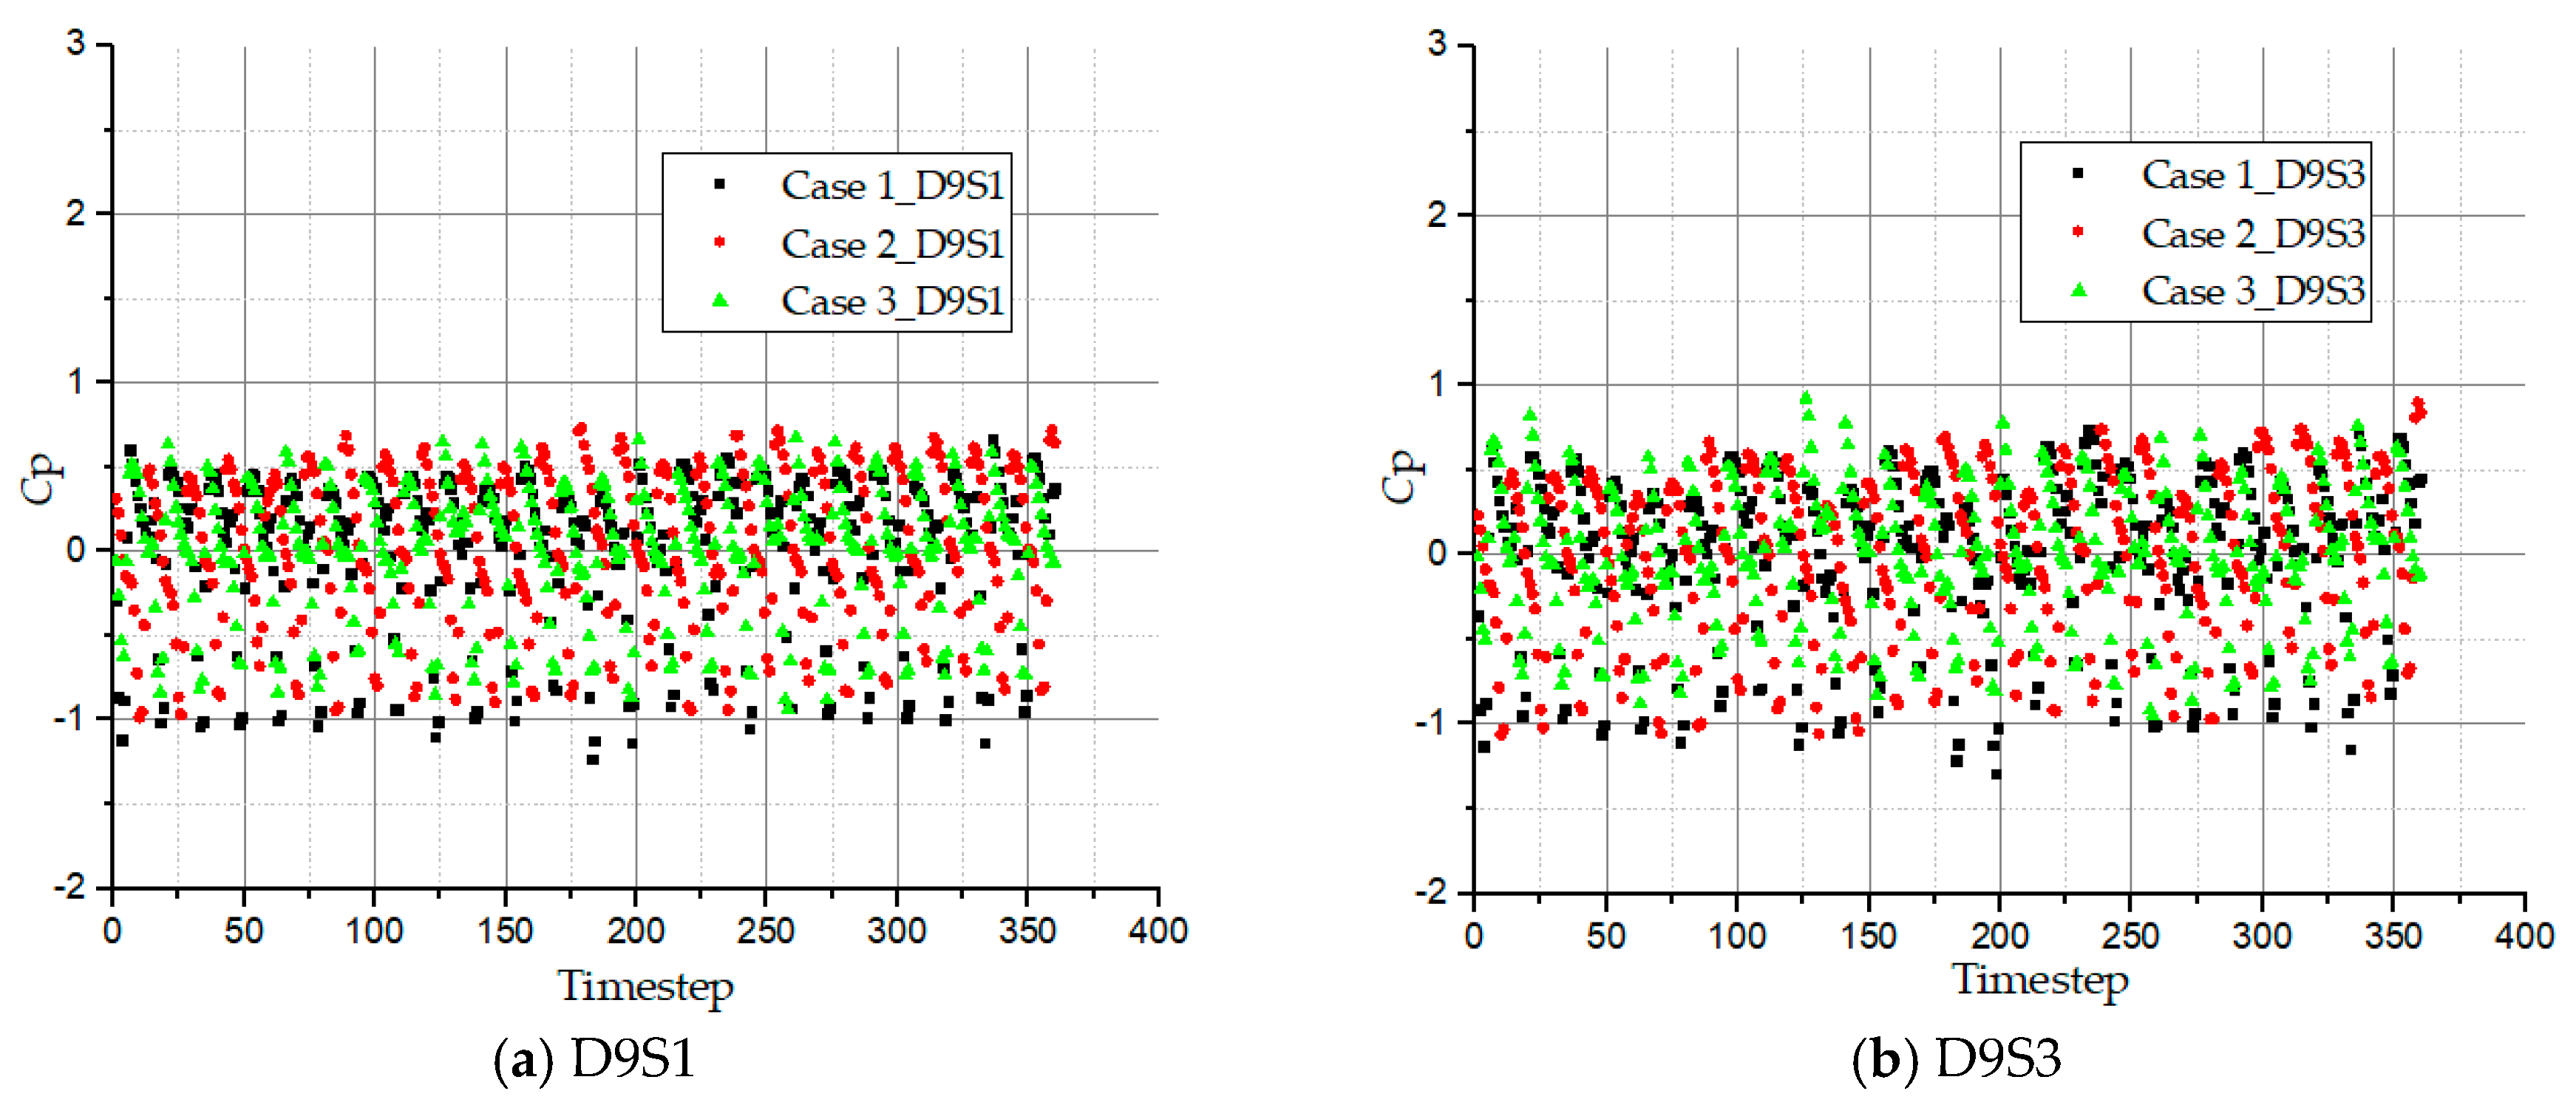
4.3. Time Domain History of Pressure Fluctuation Intensity at Monitoring Points
4.3.1. Inflow Region
4.3.2. 180° Offset Region
4.3.3. Outflow Region
4.3.4. Interrupter Region
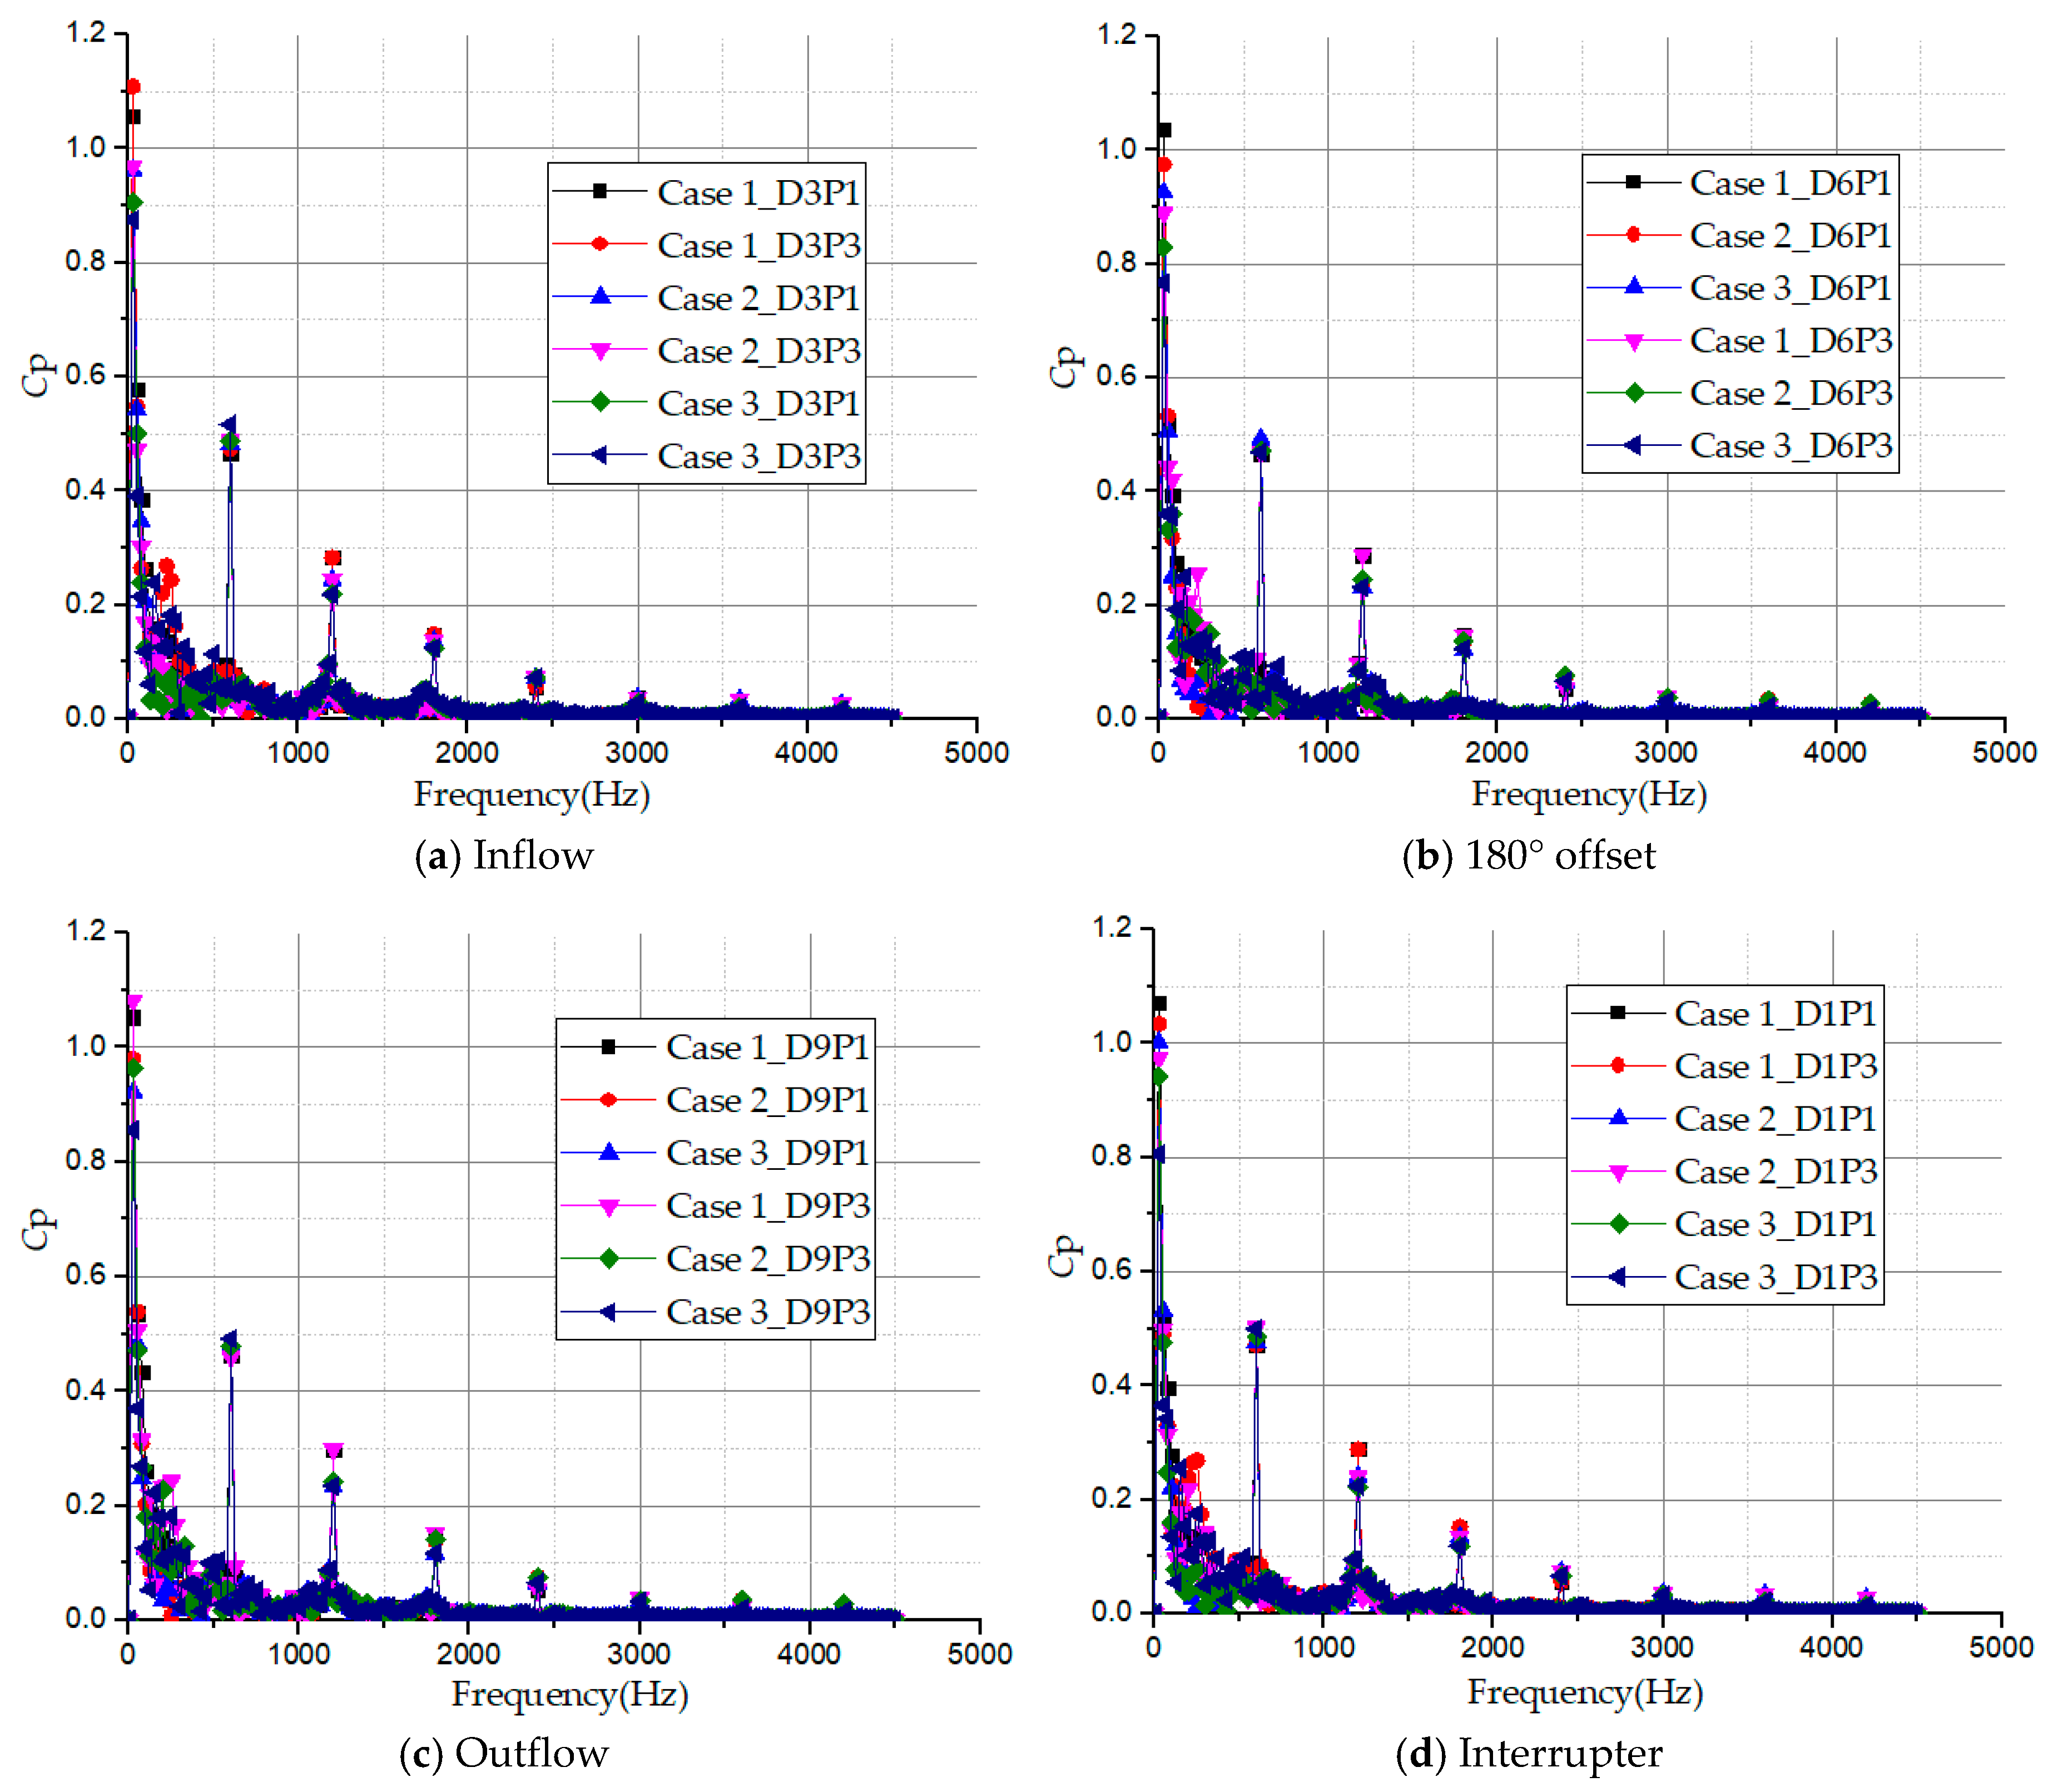
4.4. Frequency Domain History at Monitoring Points
4.4.1. Impeller Passage
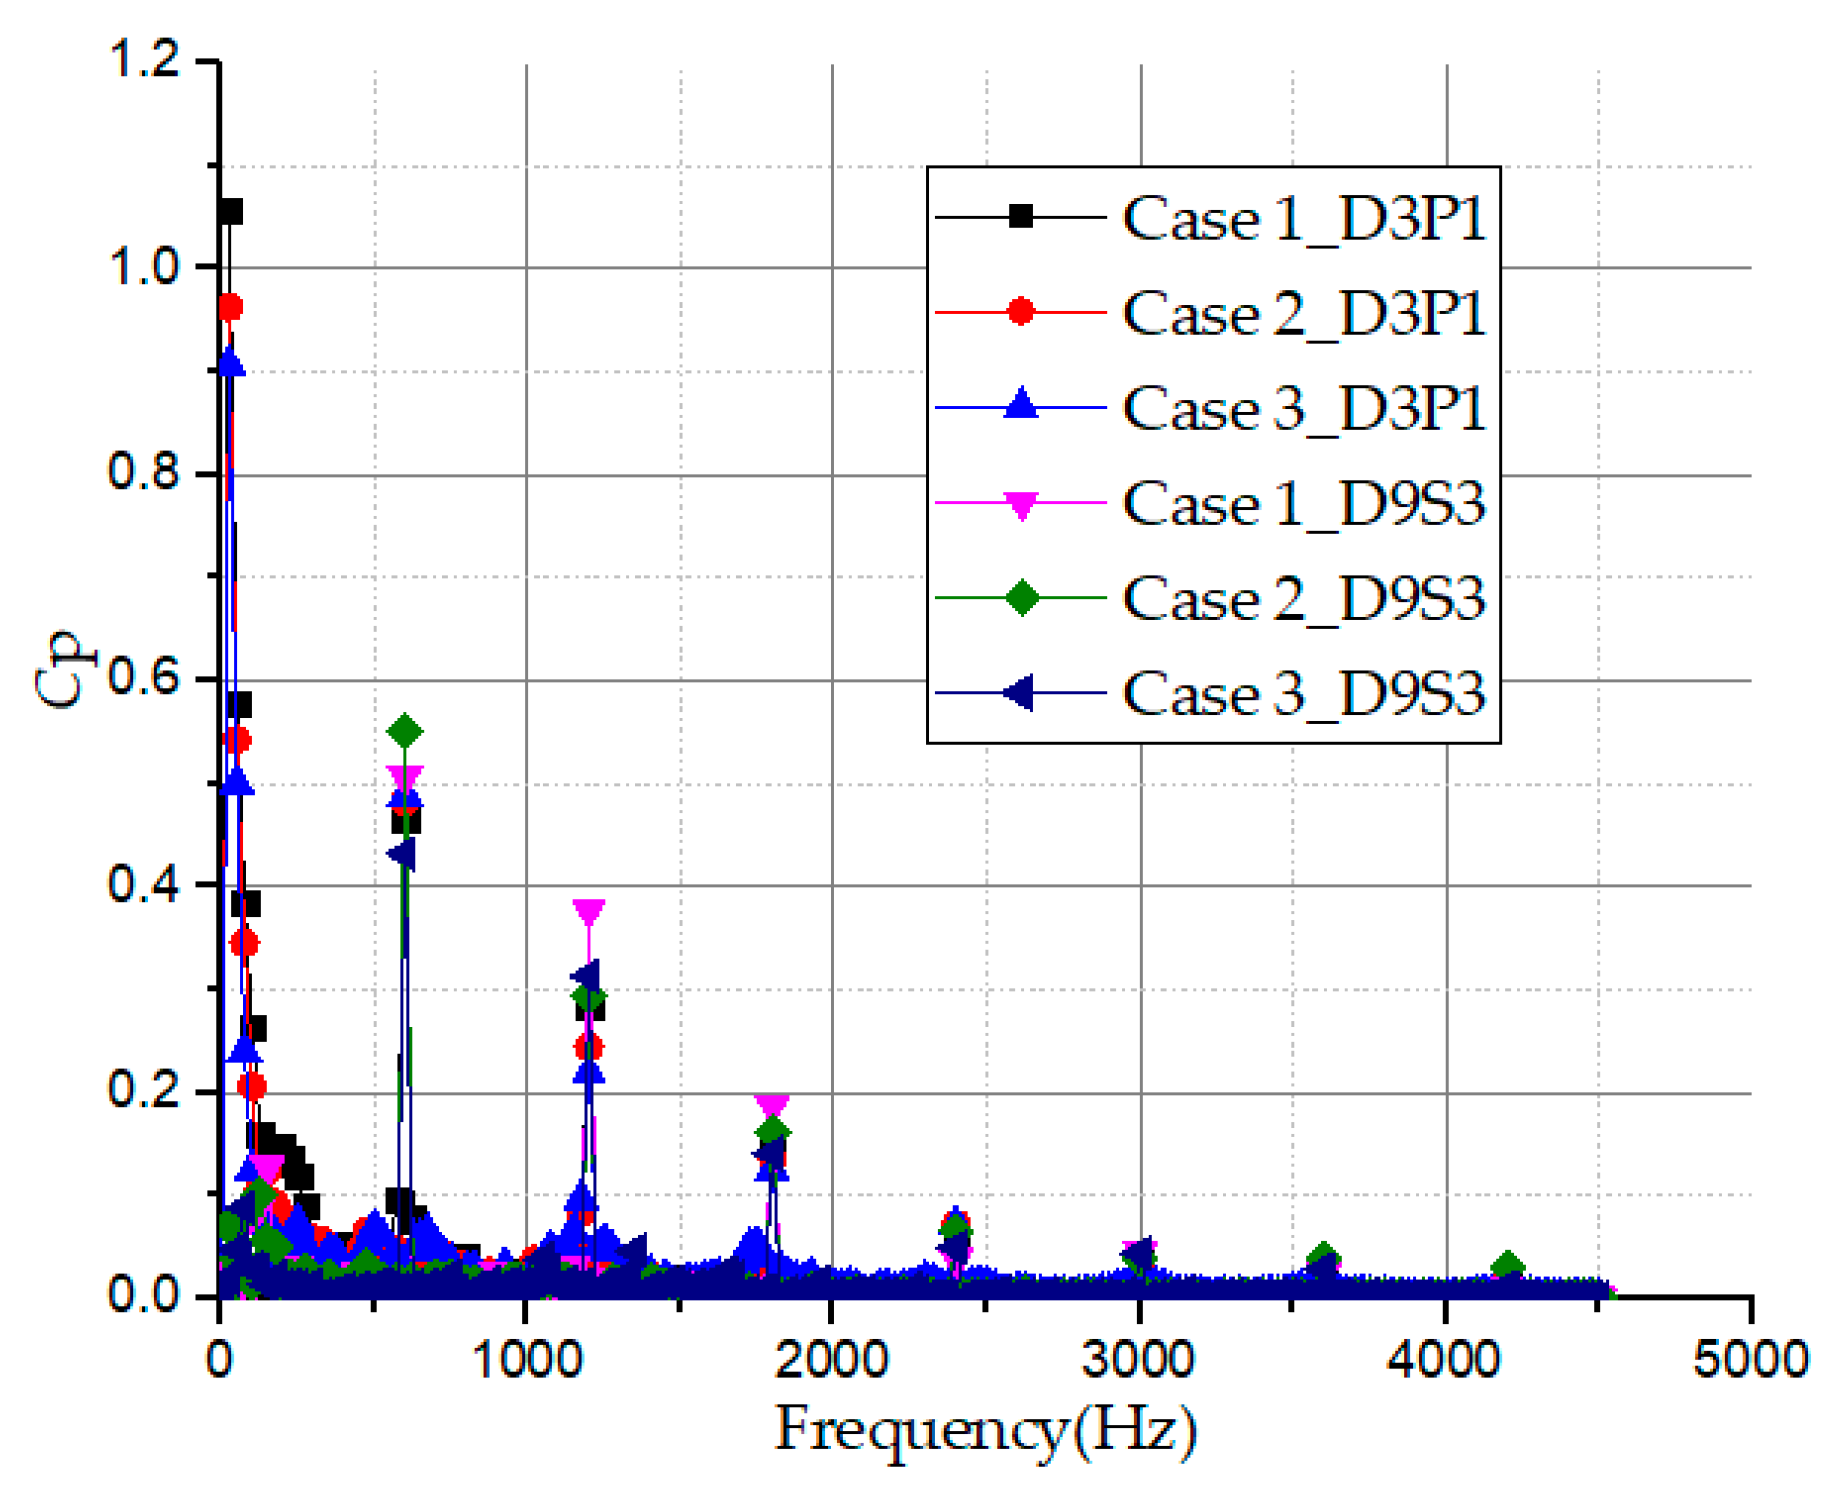
4.4.2. Side Channel Passage
4.4.3. Impeller and Side Channel Passages
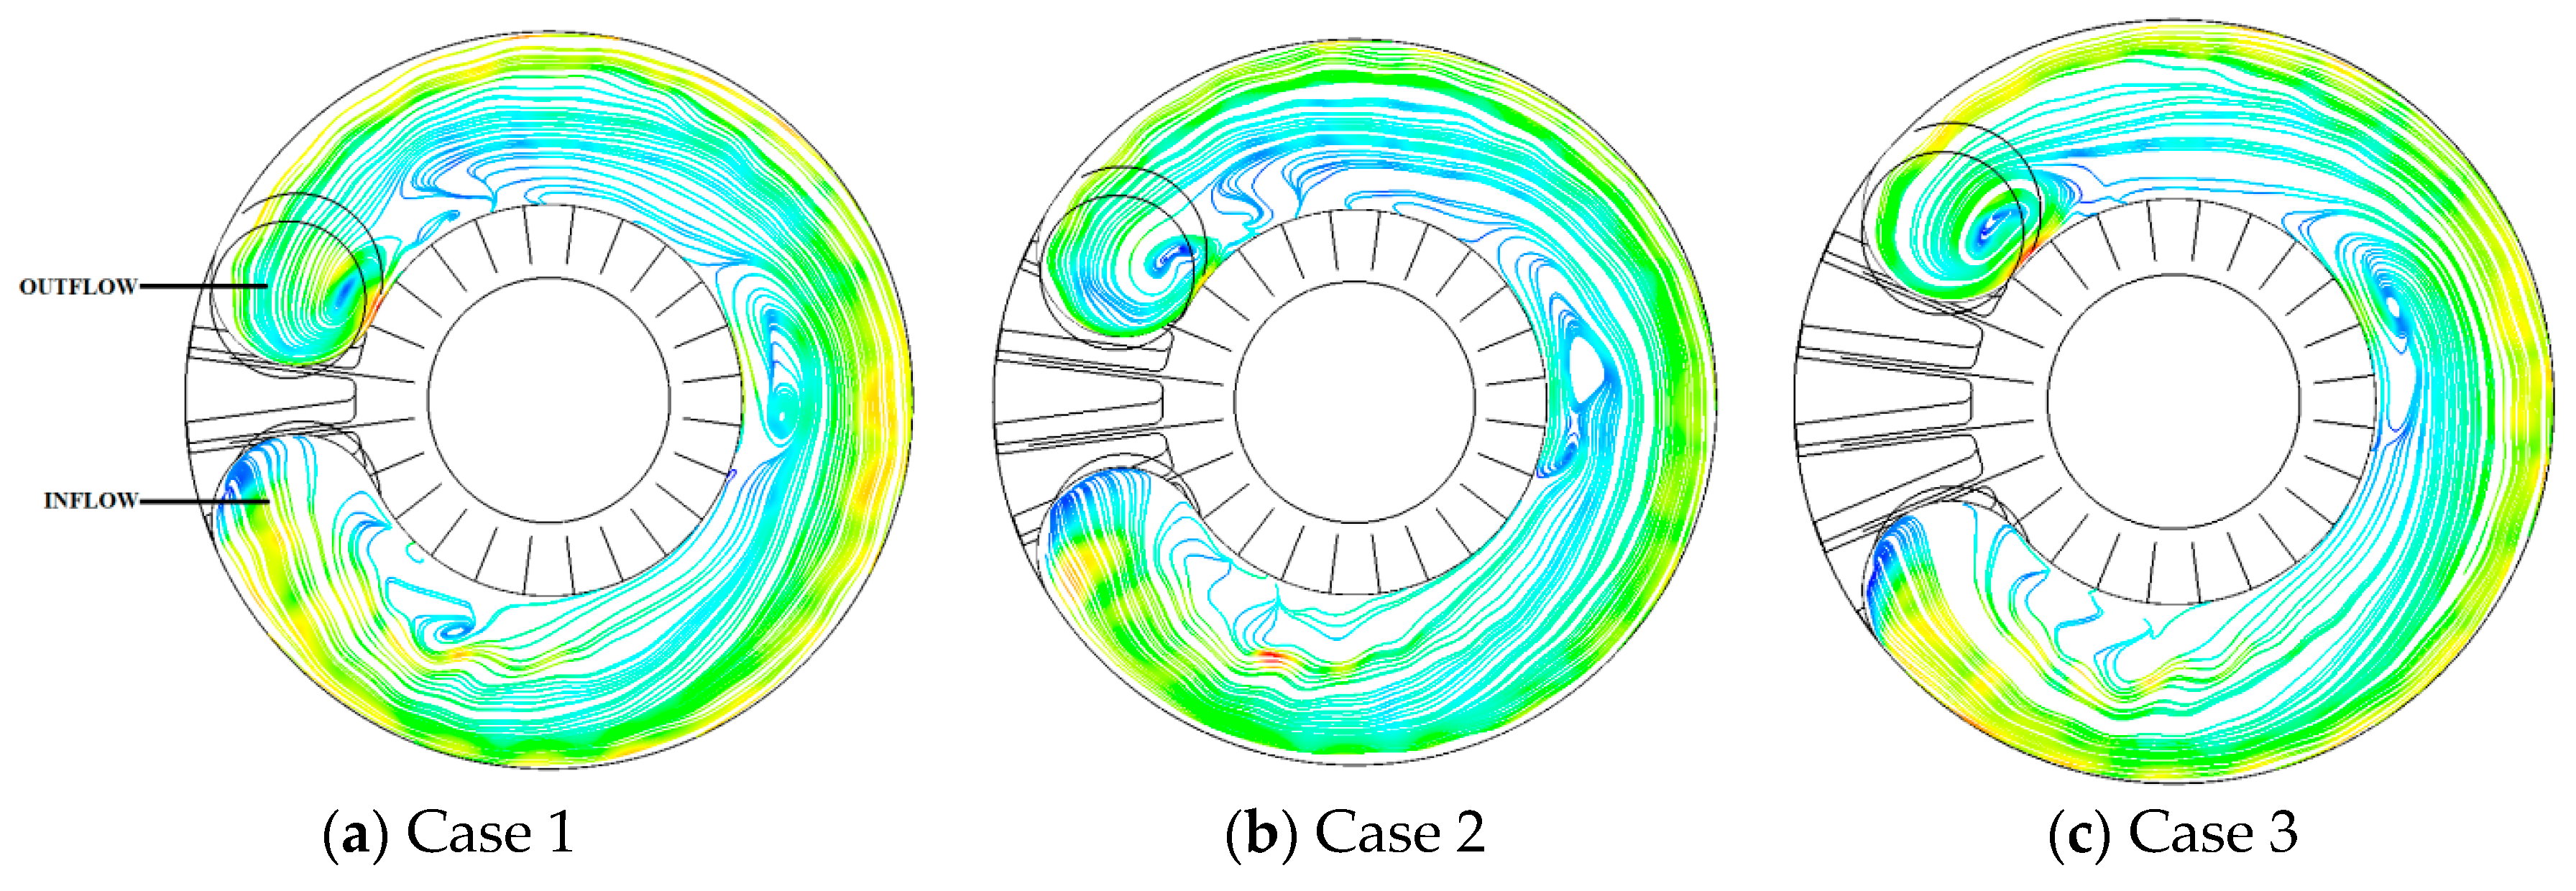
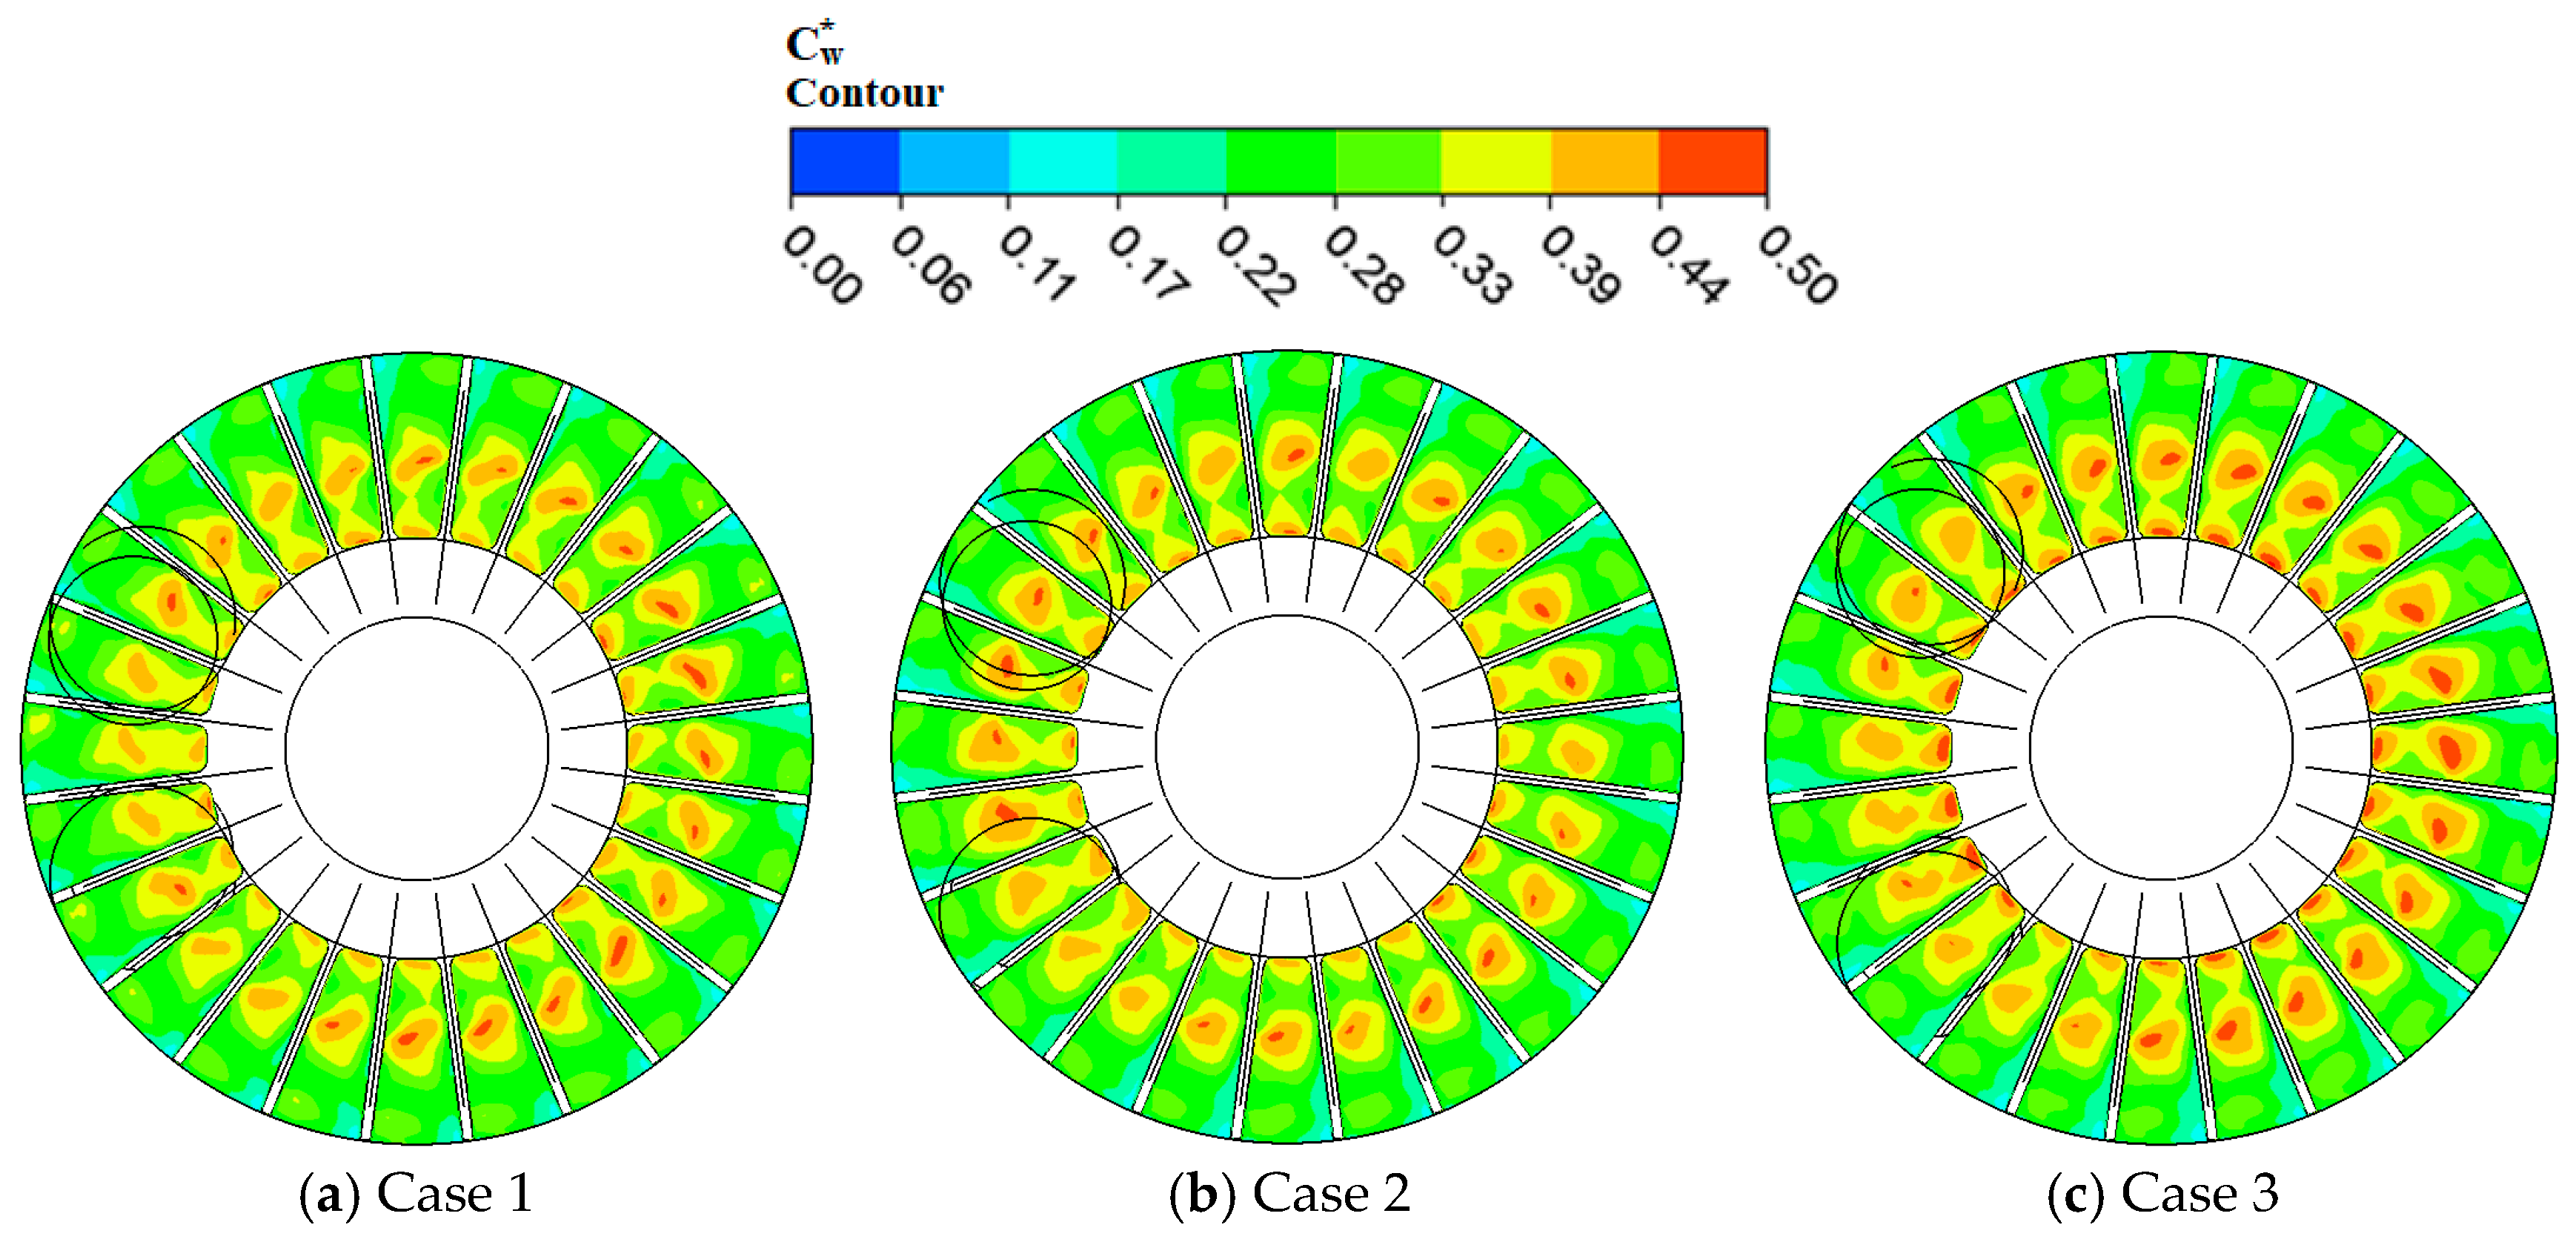
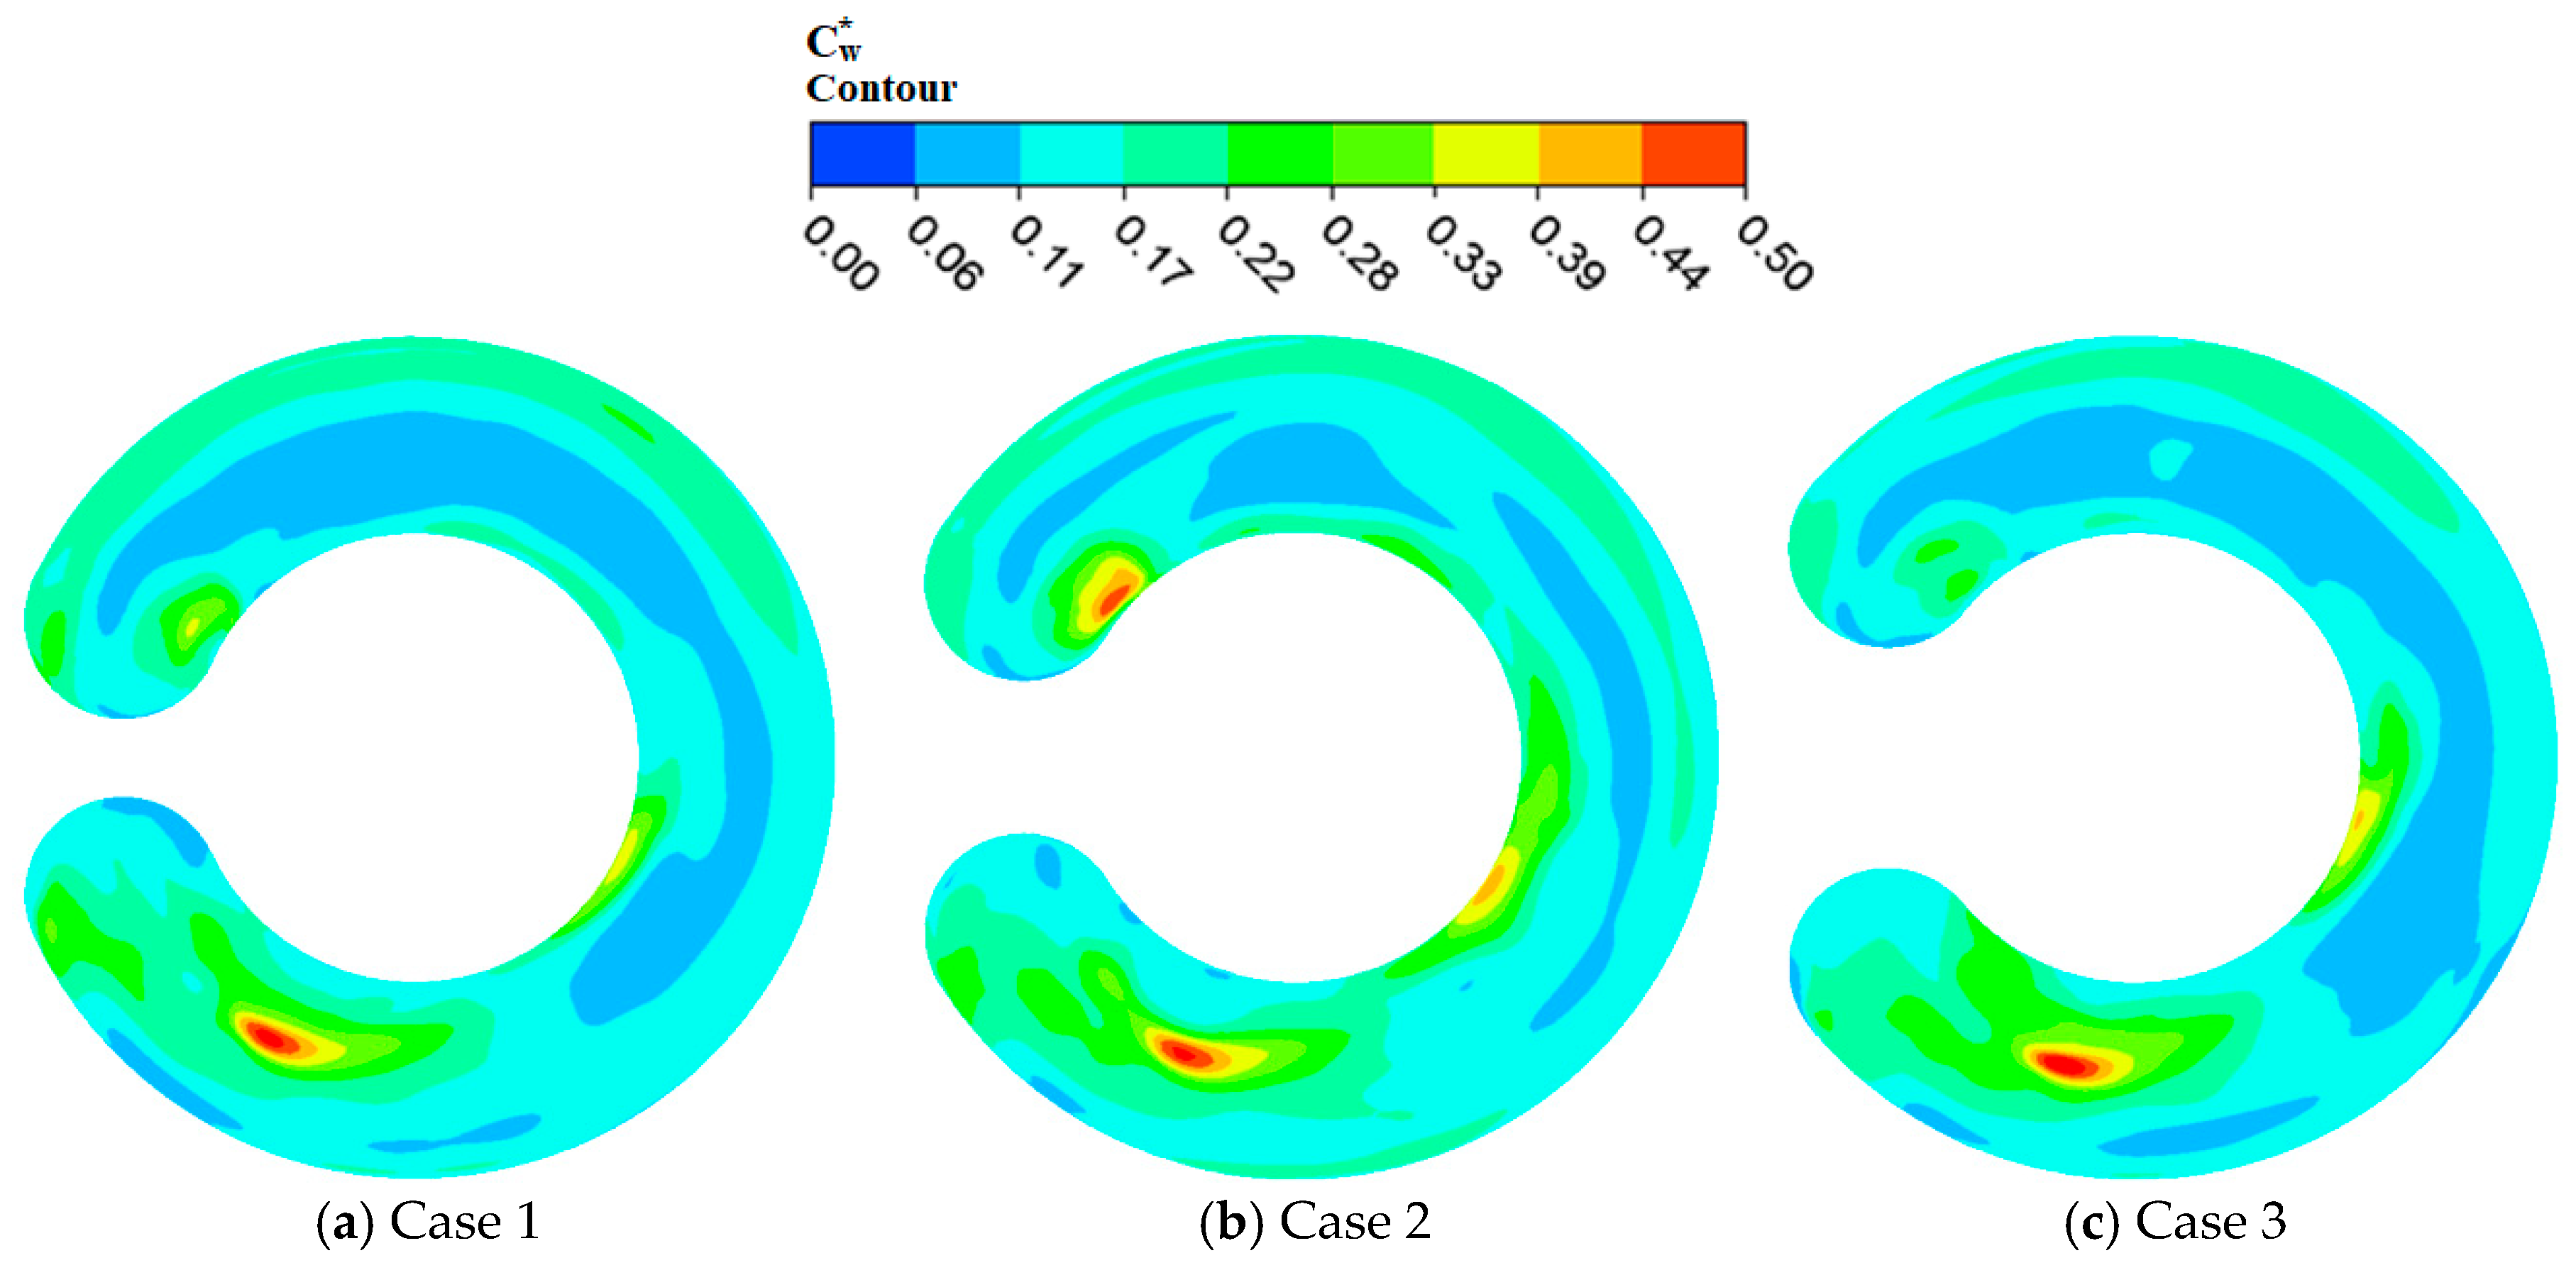
4.5. Relative Velocity Fluctuation Intensity
4.5.1. Definition of Relative Velocity Fluctuation Intensity
4.5.2. Impeller Passage
4.5.3. Side Channel Passage
4.6. Turbulent Kinetic Energy Intensity (TKE)
5. Conclusions
Author Contributions
Funding
Acknowledgments
Conflicts of Interest
Nomenclature
| g | Acceleration due to gravity |
| Ω | Angular speed |
| Γ | Auxillary variables in turbulence model |
| s | Axial and radial clearance width |
| Z | Blade number |
| θ | Blade suction angle |
| F1 | Blending or auxillary functions in turbulence model |
| U2 | Circumferential velocity of impeller outlet |
| Cp | Coefficient of pressure fluctuation intensity |
| Cw | Coefficient of velocity fluctuation intensity |
| x, y, z | Coordinates in stationary frame |
| ρ | Density |
| D | Diameter of impeller |
| Δ | Difference |
| ϵ | Dissipation of kinetic energy of turbulence |
| μ | Dynamic viscosity |
| η | Efficiency |
| Q | Flow rate |
| h | Height of the side height |
| ψ | Head coefficient |
| H | Head |
| h | Height of the side height |
| y+ | Non-dimensional wall distance |
| P | Pressure |
| k | Kinetic energy of turbulence |
| δij | Kronecker’s delta |
| n | Rotational speed |
| Reynolds-stress tensor | |
| w | Relative velocity |
| ω | Specific dissipation of turbulence kinetic energy |
| N | Sample number |
| fo | shaft frequency |
| ns | specific speed |
| t | Time |
| M | Torque |
| β*, γ | Turbulence –model coefficients |
| μT | Turbulent viscosity |
| σk, σω | Turbulence-model coefficients |
| ui | Velocity components (u, v, w) in Cartesian directions: x, y, z |
| φ | Wrapping angle |
Subscripts
| 0 | Origin |
| xi | Cartesian coordinates: x, y, z |
| i, j | Components in different directions |
Abbreviations
| BPF | Blade passing frequency |
| 3-D | Three dimensional |
| CFD | Computational fluid dynamics |
| SST | Shear stress transport |
| RANS | Reynolds-averaged Navier-Stokes |
| BEP | Best efficiency point |
| Ave | Average |
References
- Appiah, D.; Zhang, F.; Yuan, S.; Osman, M.K. Effects of the geometrical conditions on the performance of a side channel pump: A review. Int. J. Energy Res. 2017, 42, 416–428. [Google Scholar] [CrossRef]
- Fathi, A.R.; Jalilvand, R.; Shirani, E. Quantitative Evaluation of Influential Coefficients of Regenerative Pumps. In Exergy for a Better Environment and Improved Sustainability 1; Springer: Berlin/Heidelberg, Germany, 2018; pp. 631–643. [Google Scholar]
- Münsterjohann, S.; Becker, S. Wall Pressure and Blade Surface Pressure in a Side Channel Blower. Int. J. Rotating Mach. 2018, 2018, 2308759. [Google Scholar] [CrossRef]
- Cavazzini, G.; Pavesi, G.; Ardizzon, G.; Dupont, P.; Coudert, S.; Caignaert, G.; Bois, G. Analysis of the rotor-stator interaction in a radial flow pump. La Houille Blanche 2009, 5, 141–151. [Google Scholar] [CrossRef]
- Rodriguez, C.; Egusquiza, E.; Santos, I. Frequencies in the vibration induced by the rotor stator interaction in a centrifugal pump turbine. J. Fluids Eng. 2007, 129, 1428–1435. [Google Scholar] [CrossRef]
- Pavesi, G.; Cavazzini, G.; Ardizzon, G. Time–frequency characterization of the unsteady phenomena in a centrifugal pump. Int. J. Heat Fluid Flow 2008, 29, 1527–1540. [Google Scholar] [CrossRef]
- Qian, Z.; Zheng, B.; Huai, W.; Lee, Y. Analysis of pressure oscillations in a Francis hydraulic turbine with misaligned guide vanes. Proc. Inst. Mech. Eng. Part A J. Power Energy 2010, 224, 139–152. [Google Scholar] [CrossRef]
- Wu, Y.; Liu, S.; Dou, H.-S.; Zhang, L. Simulations of unsteady cavitating turbulent flow in a Francis turbine using the RANS method and the improved mixture model of two-phase flows. Eng. Comput. 2011, 27, 235–250. [Google Scholar] [CrossRef]
- Yin, J.; Wang, D.; Wang, L.; Wu, Y.; Wei, X. Effects of water compressibility on the pressure fluctuation prediction in pump turbine. IOP Conf. Ser. Earth Environ. Sci. 2012, 15, 2030. [Google Scholar] [CrossRef]
- Pei, J.; Yuan, S.; Benra, F.-K.; Dohmen, H.J. Numerical prediction of unsteady pressure field within the whole flow passage of a radial single-blade pump. J. Fluids Eng. 2012, 134, 101103. [Google Scholar] [CrossRef]
- Pei, J.; Wang, W.-J.; Yuan, S.-Q. Statistical analysis of pressure fluctuations during unsteady flow for low-specific-speed centrifugal pumps. J. Cent. South Univ. 2014, 21, 1017–1024. [Google Scholar] [CrossRef]
- Gülich, J.F. Centrifugal Pumps; Springer: Berlin/Heidelberg, Germany, 2008; Volume 2. [Google Scholar]
- Siemen, O.; Hinsch, J. A Circulation Pump Which Acts Partially with Sealing Circling Auxiliary Liquid. Germany Patent No. 413435(3), 1920. [Google Scholar]
- Engels, H. Investigations of Ring Pumps; Tech Hoch Hannover: Hannover, Germany, 1940. [Google Scholar]
- Iversen, H. Performance of the periphery pump. Trans. ASME 1955, 77, 19–22. [Google Scholar]
- Grabow, G. Influence of the number of vanes and vane angle on the suction behaviour of regenerative pumps. In Proceedings of the 5th Conference on Fluid Machinery, Budapest, Hungary, 15–20 September 1975; pp. 351–364. [Google Scholar]
- Badami, M. Theoretical and Experimental Analysis of Traditional and New Periphery Pumps. Available online: https://doi.org/10.4271/971074 (accessed on 6 March 2019).
- Choi, W.C.; Yoo, I.S.; Park, M.R.; Chung, M.K. Experimental study on the effect of blade angle on regenerative pump performance. Proc. Inst. Mech. Eng. Part A J. Power Energy 2013, 227, 585–592. [Google Scholar] [CrossRef]
- Maity, A.; Chandrashekharan, V.; Afzal, M. Experimental and numerical investigation of regenerative centrifugal pump using CFD for performance enhancement. Int. J. Curr. Eng. Technol. 2015, 5, 2898–2903. [Google Scholar]
- Zhang, F.; Martin, B.; Pei, J.; Yuan, S.; Annika, F. Numerical simulation and verification on flow characteristics of impeller axial and radial gaps in side channel pump. Trans. Chin. Soc. Agric. Eng. 2015, 31, 78–83. [Google Scholar]
- Fleder, A.; Böhle, M. A systematical study of the influence of blade length, blade width, and side channel height on the performance of a side channel pump. J. Fluids Eng. 2015, 137, 121102. [Google Scholar] [CrossRef]
- Zhang, F.; Fleder, A.; Böhle, M.; Yuan, S. Effect of suction side blade profile on the performance of a side channel pump. Proc. Inst. Mech. Eng. Part A J. Power Energy 2016, 230, 586–597. [Google Scholar] [CrossRef]
- Zhang, F.; Appiah, D.; Zhang, J.; Yuan, S.; Osman, M.K.; Chen, K. Transient flow characterization in energy conversion of a side channel pump under different blade suction angles. Energy 2018, 161, 635–648. [Google Scholar] [CrossRef]
- Pei, J.; Zhang, F.; Appiah, D.; Hu, B.; Yuan, S.; Chen, K.; Asomani, S. Performance Prediction Based on Effects of Wrapping Angle of a Side Channel Pump. Energies 2019, 12, 139. [Google Scholar] [CrossRef]
- Menter, F. Zonal two equation kw turbulence models for aerodynamic flows. In Proceedings of the 23rd Fluid Dynamics, Plasmadynamics, and Lasers Conference, Orlando, FL, USA, 6–9 July 1993; p. 2906. [Google Scholar]
- Menter, F.R. Two-equation eddy-viscosity turbulence models for engineering applications. AIAA J. 1994, 32, 1598–1605. [Google Scholar] [CrossRef]
- Wilcox, D.C. Comparison of two-equation turbulence models for boundary layers with pressure gradient. AIAA J. 1993, 31, 1414–1421. [Google Scholar] [CrossRef]
- Wilcox, D.C. Turbulence Modeling; DCW Industries: La Cañada Flintridge, CA, USA, 1993. [Google Scholar]
- Wilcox, D.C. Formulation of the kw turbulence model revisited. AIAA J. 2008, 46, 2823–2838. [Google Scholar] [CrossRef]
- ANSYS, Inc. ANSYS Academic Research, Release 15.0, Help System, ANSYS CFX-Solver Theory Guide; 15317; ANSYS, Inc.: Canonsburg, PA, USA, 2013. [Google Scholar]
- Celik, I.B.; Ghia, U.; Roache, P.J. Procedure for estimation and reporting of uncertainty due to discretization in CFD applications. J. Fluids Eng. Trans. ASME 2008, 130, 078001. [Google Scholar]
- Raheel, M.; Engeda, A. Current status, design and performance trends for the regenerative flow compressors and pumps. In Proceedings of the ASME 2002 International Mechanical Engineering Congress and Exposition, New Orleans, LA, USA, 17–22 November 2002; pp. 99–110. [Google Scholar]
- Benra, F.; Feng, J.; Dohmen, H. Numerical study on pressure fluctuations in a complete stage of a centrifugal pump. In Proceedings of the Eleventh International Symposium on Transport Phenomena and Dynamics of Rotating Machinery, Honolulu, HI, USA, 26 February–2 March 2006. Paper No. ISROMAC11-2006-012. [Google Scholar]
- Feng, J.; Benra, F.-K.; Dohmen, H.J. Numerical investigation on pressure fluctuations for different configurations of vaned diffuser pumps. Int. J. Rotating Mach. 2007, 2007, 34752. [Google Scholar] [CrossRef]
- Chen, S.; Pan, Z.; Wu, Y.; Zhang, D. Simulation and experiment of the effect of clearance of impeller wear-rings on the performance of centrifugal pump. IOP Conf. Ser. Earth Environ. Sci. 2012, 15, 2017. [Google Scholar] [CrossRef]


| Domain | Parameters | Value |
|---|---|---|
| Impeller | Outer diameter, D2 (mm) | 150 |
| Inner diameter, D1 (mm) | 80 | |
| Blade width, w (mm) | 15 | |
| Blade thickness, b (mm) | 2 | |
| Suction angle, θ (°) | 30 | |
| Radial clearance, σ (mm) | 0.2 | |
| Axial clearance, s (mm) | 0.2 | |
| Side Channel | Wrapping angle, φ (°) | 15, 30, 45 |
| Diameter, t (mm) | 35.2 |
© 2019 by the authors. Licensee MDPI, Basel, Switzerland. This article is an open access article distributed under the terms and conditions of the Creative Commons Attribution (CC BY) license (http://creativecommons.org/licenses/by/4.0/).
Share and Cite
Zhang, F.; Chen, K.; Appiah, D.; Hu, B.; Yuan, S.; Asomani, S.N. Numerical Delineation of 3D Unsteady Flow Fields in Side Channel Pumps for Engineering Processes. Energies 2019, 12, 1287. https://doi.org/10.3390/en12071287
Zhang F, Chen K, Appiah D, Hu B, Yuan S, Asomani SN. Numerical Delineation of 3D Unsteady Flow Fields in Side Channel Pumps for Engineering Processes. Energies. 2019; 12(7):1287. https://doi.org/10.3390/en12071287
Chicago/Turabian StyleZhang, Fan, Ke Chen, Desmond Appiah, Bo Hu, Shouqi Yuan, and Stephen Ntiri Asomani. 2019. "Numerical Delineation of 3D Unsteady Flow Fields in Side Channel Pumps for Engineering Processes" Energies 12, no. 7: 1287. https://doi.org/10.3390/en12071287
APA StyleZhang, F., Chen, K., Appiah, D., Hu, B., Yuan, S., & Asomani, S. N. (2019). Numerical Delineation of 3D Unsteady Flow Fields in Side Channel Pumps for Engineering Processes. Energies, 12(7), 1287. https://doi.org/10.3390/en12071287