1. Introduction
Electricity market liberalization has been a major challenge for the power systems in different countries [
1,
2]. This situation has been a genuine step forward to improve competitiveness by offering new tariffs from electricity companies. Usually, consumers are free to choose the energy provider and tariff according to the norms of the country. In any case, it should be guaranteed the stability, quality and security of supply required by users [
3,
4]. This is not a trivial issue, especially in smart grids, which has implied that some authors have suggested managing databases with information on usage patterns of loads and electricity price tariffs, among other factors [
5]. In practice, governments may establish certain restrictions to competition or charges and taxes in the electricity tariff. For example, access charges [
6] reflect costs related to the maintenance of the transmission and distribution network infrastructure or costs related to regulated activities.
Generally speaking, the cost-structure usually takes into account many factors related to the type of consumer (domestic, industrial, etc.), quality of service, voltage level, location or season [
7]. However, the vast majority of electrical systems base their tariff structure on three main foundations:
Charges for capacity or access, based on the amount of electrical power (€/kW) demanded from the grid and expected by the user to be guaranteed.
Charges for active energy consumed, based on the cost of the price of the energy (€/kWh) demanded by the end user.
Other charges, such as taxes, environmental commitments, penalties, etc.
In this case, the charges for capacity or access play an important role since they can be an important component in the bill of large consumers. In addition, these charges are subject to an hourly variability within the day and a daily variability within the season of the year. Time-of-use (ToU) is a term that refers to the application of different charges for energy use in different time periods in a way that reflects generation costs and encourages energy consumption in periods that are less critical to the system. Time differentiation (hourly–seasonal) is practised by most countries. For example, in Australia some charges vary by time of use; in United Kingdom peak and off-peak along with seasonal periods are available; France has two seasons and peak/off-peak periods; Italy has four periods as peak, high, medium and off-peak; in the Netherlands, for consumers the kWh charge can be split in off-peak and regular hours; in Norway, where the energy component is time- and regionally-differentiated in winter day, winter night/weekend and summer; while in California the prices vary by season and period [
8].
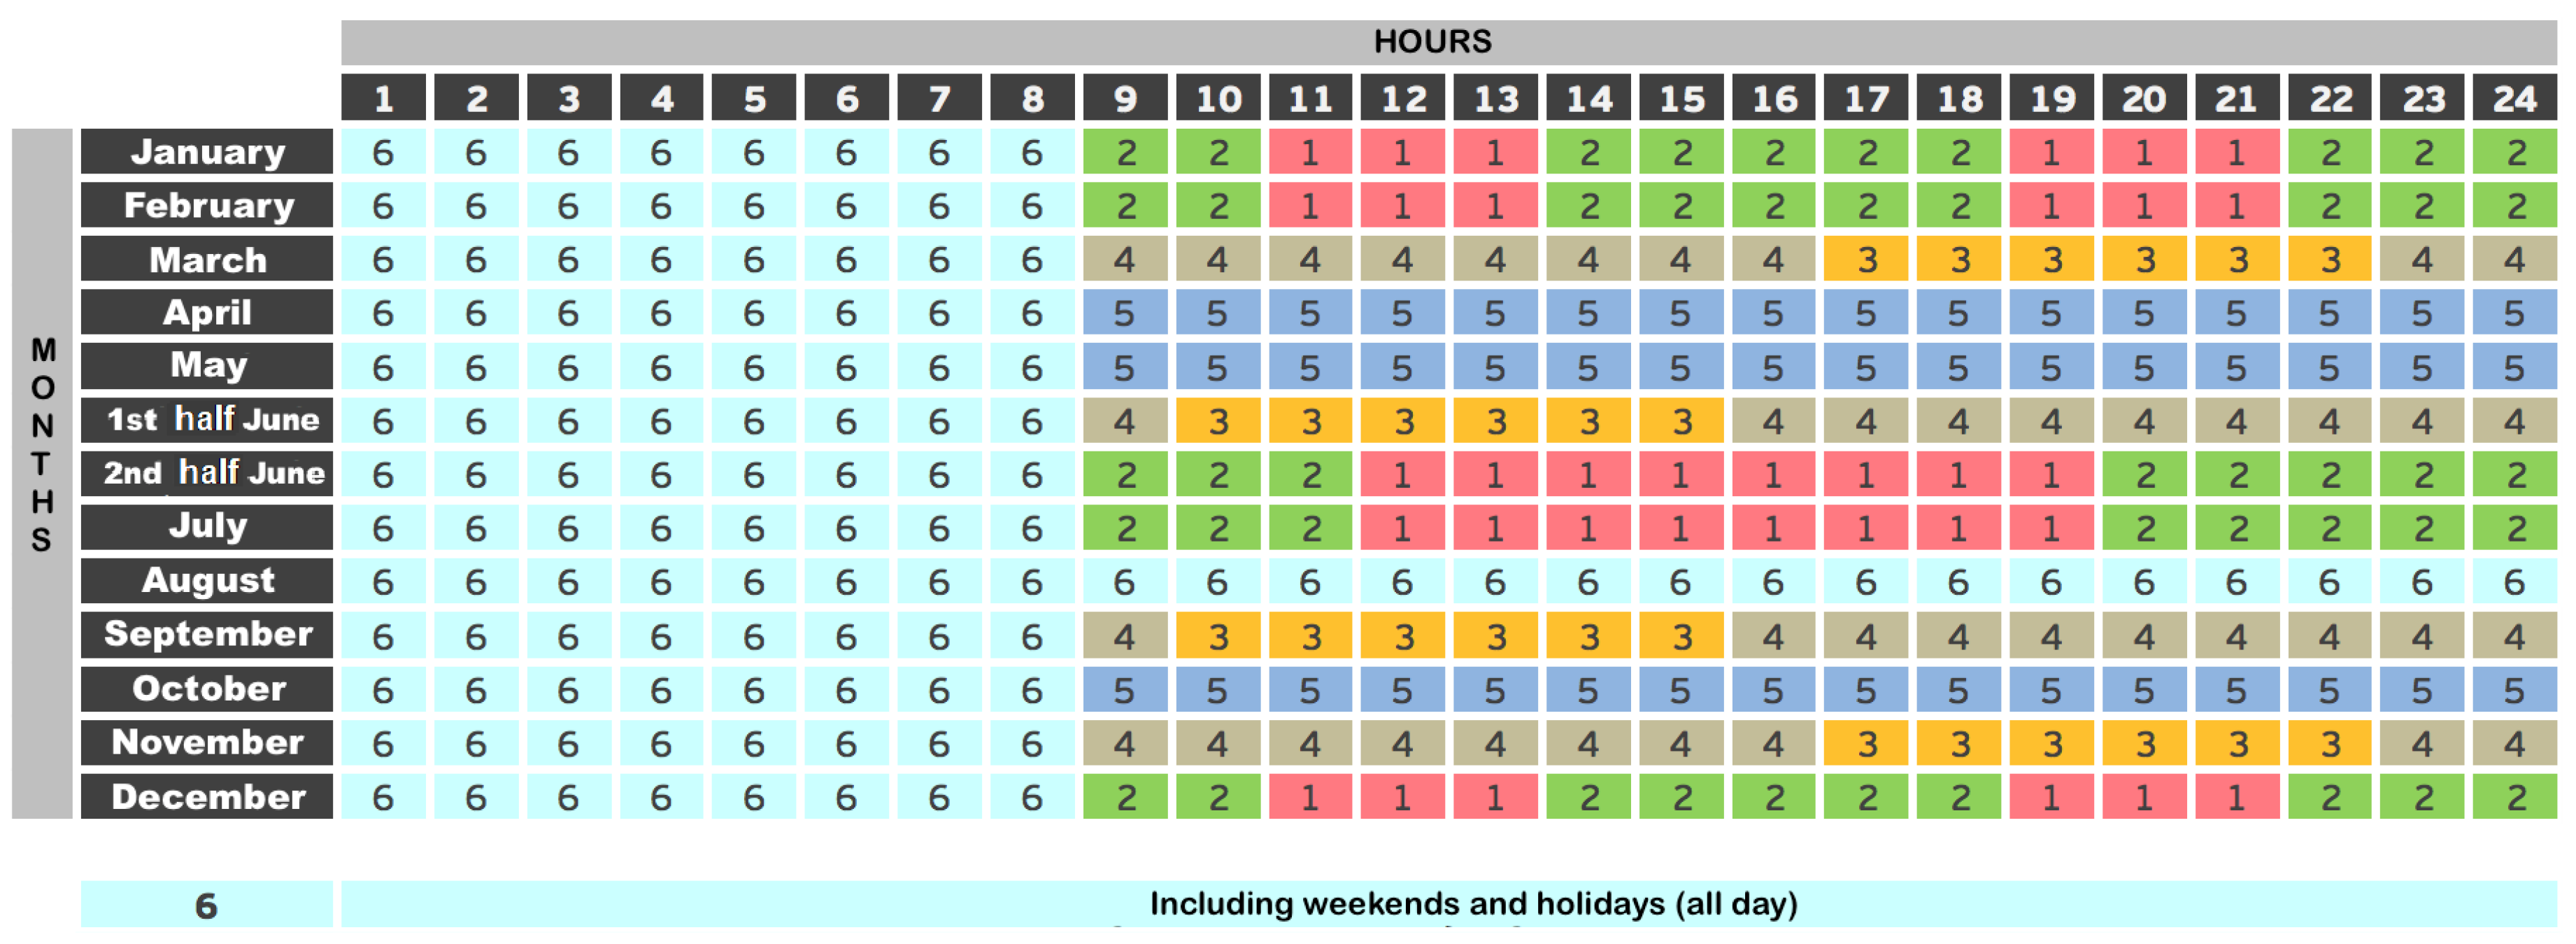
In the case of Spain, it is common to make different charges depending on the time of day, the day of the week, and even the month of the year due to the underlying costs of the system and the need to rationalize the uses of energy by users [
9]. As
Figure 1 shows, consumers with voltage higher than 1 kV and power contracted higher than 450 kW have six periods (P1, P2, P3, P4, P5, and P6) with different energy and power prices. In the case of consumers having a voltage lower than 1 kV, different tariffs apply where one or three periods can be selected (e.g., three periods option include peak, valley and off-peak hours depending on the time of day).
All of the above leads to a clear conclusion, which is that the electricity system should encourage the use of energy in less critical or grid-loaded time periods, i.e., periods in which the load curve is low and the generating plants are more unloaded, as opposed to peak periods in which the variation in system capacity is very limited. Therefore, the price for access capacity, as well as the price of energy will change according to the restrictions referred to above, being the price much more expensive for the power and energy demanded in peak periods versus off-peak periods. Due to these differences in usage times, as well as the different prices that utility companies charge for energy and power, there may be significant charges on the electricity bill for large consumers based on their consumption habits. For example, a large company may incur large costs because its production takes place during expensive periods (e.g., P1 or P2). This implies that strategies that minimize costs in the most expensive periods must be tackled in favour of those where the system is less loaded, and therefore it is cheaper to consume electricity. The problem is that, in many cases, large consumers cannot change their consumption habits either because their production process does not allow for changes in production schedules or because the provision of services must take place at a certain time. For example, in the case of a University, there are administrative and teaching activities that must be carried out in a specific time interval. This does not imply that there are no other mechanisms that allow us to face a reduction in costs based on the contracted electricity power in each of the hourly periods that make up the selected tariff. Normally, users contract a certain amount of power with the utilities for each of the periods of use, but this power may not be suitably adjusted, so that it may be excessively high involving large costs, or lower than the value required so that the utility will apply large penalties. A clear example of this inefficient situation often occur in countries such as Spain, where, as shown in
Figure 1, there are up to six different tariff periods, from P1 (which would be the most expensive) to P6 (which would be the cheapest). The difference in price for both energy and power can be up to seven times higher in period P1 than in P6.
Table 1 contains a summary of the current prices according to the Spanish Ministerial Order IET/2444/2014 for the contracted electric power of the six periods above mentioned. Note the important difference between the most expensive period P1 where the power is about 39 €/kW, as opposed to the cheapest period P6 where the energy is worth about 6.5 €/kW. For energy, the difference is even more evident, reaching almost 10 times the price for period P1 comapred to period P6.
Due to the frequent use of penalties for excess power demand, as well as the high costs of this power in certain time bands, it is suitable to implement cost saving strategies for large consumers, such as factories, universities, hospitals, etc. These organizations often have a large number of employees and/or users, so it is not always possible to effectively manage the loads to ensure that the maximum demand value will never exceed the contracted power. This problem is not so critical in the case of domestic or residential consumers, who are not normally subject to seasonal or periodical tariffs due to the fact that the contracted electric power is usually considerably lower than that of a large consumers. This is why some studies have shown that Spanish people at risk of energy poverty, are largely unaware of energy-supply contract types or details. In the case of large customers, a little attention has been paid to the optimal selection of electric supply tariff. A previous investigation [
8] proposed methods for posteriori choice of contracted capacities, but to our knowledge the paper here presented is the first one that studies the possibility of applying bio-inspired algorithms for optimizing the contracted electric power in real case studies.
2. Problem Description
This paper presents a working methodology to determine the value of the contracted electric power for an annual period of a standard high voltage multiperiod tariff for the different time periods. The aim of this procedure is to benefice the user to pay a minimum electricity bill, i.e., this operation leads to cost savings that make the consumer more competitive. Note that this has nothing to do with the way of consuming electrical energy and may be the subject of a future research. In the specific case of Spain, certain limitations must also be taken into account due to national regulations. For example, there are restrictions to change the contracted electric power within the current year, so that a consumer may not allowed to change this power or tariff more than once a year.
Electricity tariffs often have two main terms: energy term and power term. The energy term is the variable part of the energy bill that represents the price for the energy consumption (kWh) according to use of electrical energy made by the consumer. The power term accounts for the price of electric energy availability at the consumer side in units of power (kW), that will be paid independently of the use of electricity made by the customer. The sum of these two terms constitutes the basic tariff that will always appear in all invoicing, regardless of the type of tariff contracted by the subscriber. There are some complementary factors that can be applied to the above terms, including: hourly discrimination; reactive energy; seasonality; interruptibility. Moreover, there are other additional concepts for the Spanish case, such as the electric tax, the energy meter rental (if the customer is not the owner), and VAT tax (21%).
As commented above, most large Spanish consumers use the tariff 6.1A, which is organized into six daily periods. This division traditionally reflects the power load level of the system, so that the P1 period is the most overloaded, while the P6 period is the least loaded. A characteristic of tariff 6.1A is that the contracted electric power must respect the restriction given in the Equation (
1), i.e., those customers should contract higher power in those periods where the price is cheaper (see
Table 1).
On the one hand, the costs for contracting power are linear and correspond to a typical expression such as that given in the Equation (
2) for each of the hourly periods considered.
where
is the cost of the annual contracted electric power,
is the contracted electric power for the period
i,
is the cost of the power for that period
i and
N is the number of periods to be considered (
in the case of tariff 6.1A).
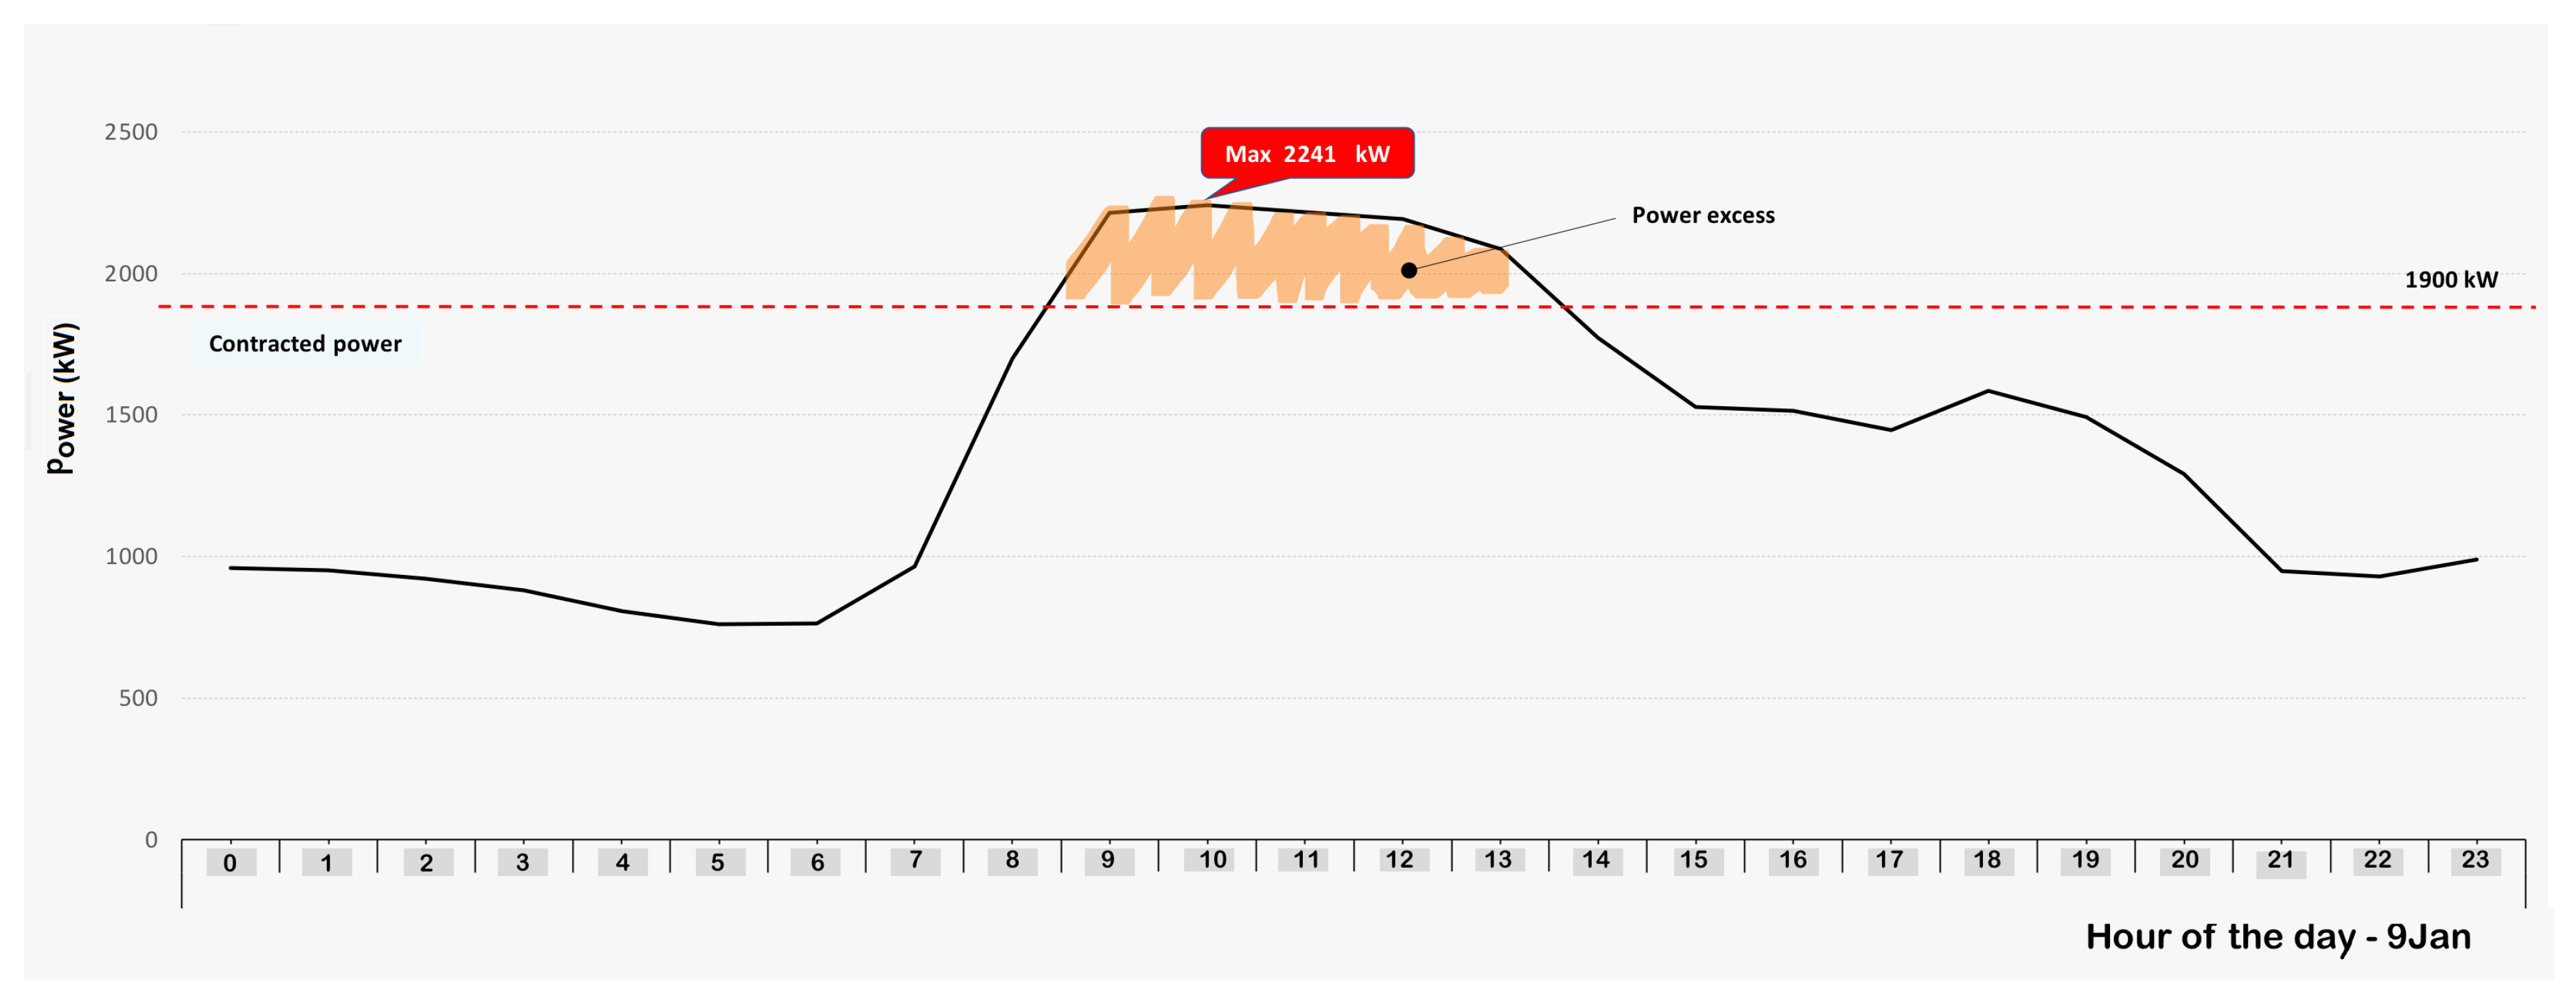
On the other hand, it is necessary to consider the excess of power demand. This term may vary from one country to another according to the specific regulations, but it is common to find penalties if the power demanded exceeds the contracted electric power. A maximum demand register processes the maximum power value, usually the average of 15 minutes (this average time may vary depending on the country) reached during the billing period, such that when the value is higher than the contracted power, the customer will pay a penalty on the electricity bill. This penalty may also vary according to the hourly period. In the case of Spain, the penalty is proportional to the sum of the square differences between the contracted power and the power consumed for each quarter-hour segment of each billing period. The other penalty often applied in several countries is the excessive consumption of reactive energy (kVArh).
Equation (
3) represents the total invoice to be paid by the consumer for the terms power, energy (active and reactive) and taxes. In this paper, the aim is to minimize the term “power” included in Equation (
3), while the terms corresponding to active energy, reactive energy and taxes will not be taken into account as they are not subject to optimization.
where
Therefore, the total cost of the power term is obtained on the basis of costs per contracted power and penalties for excess power demand.
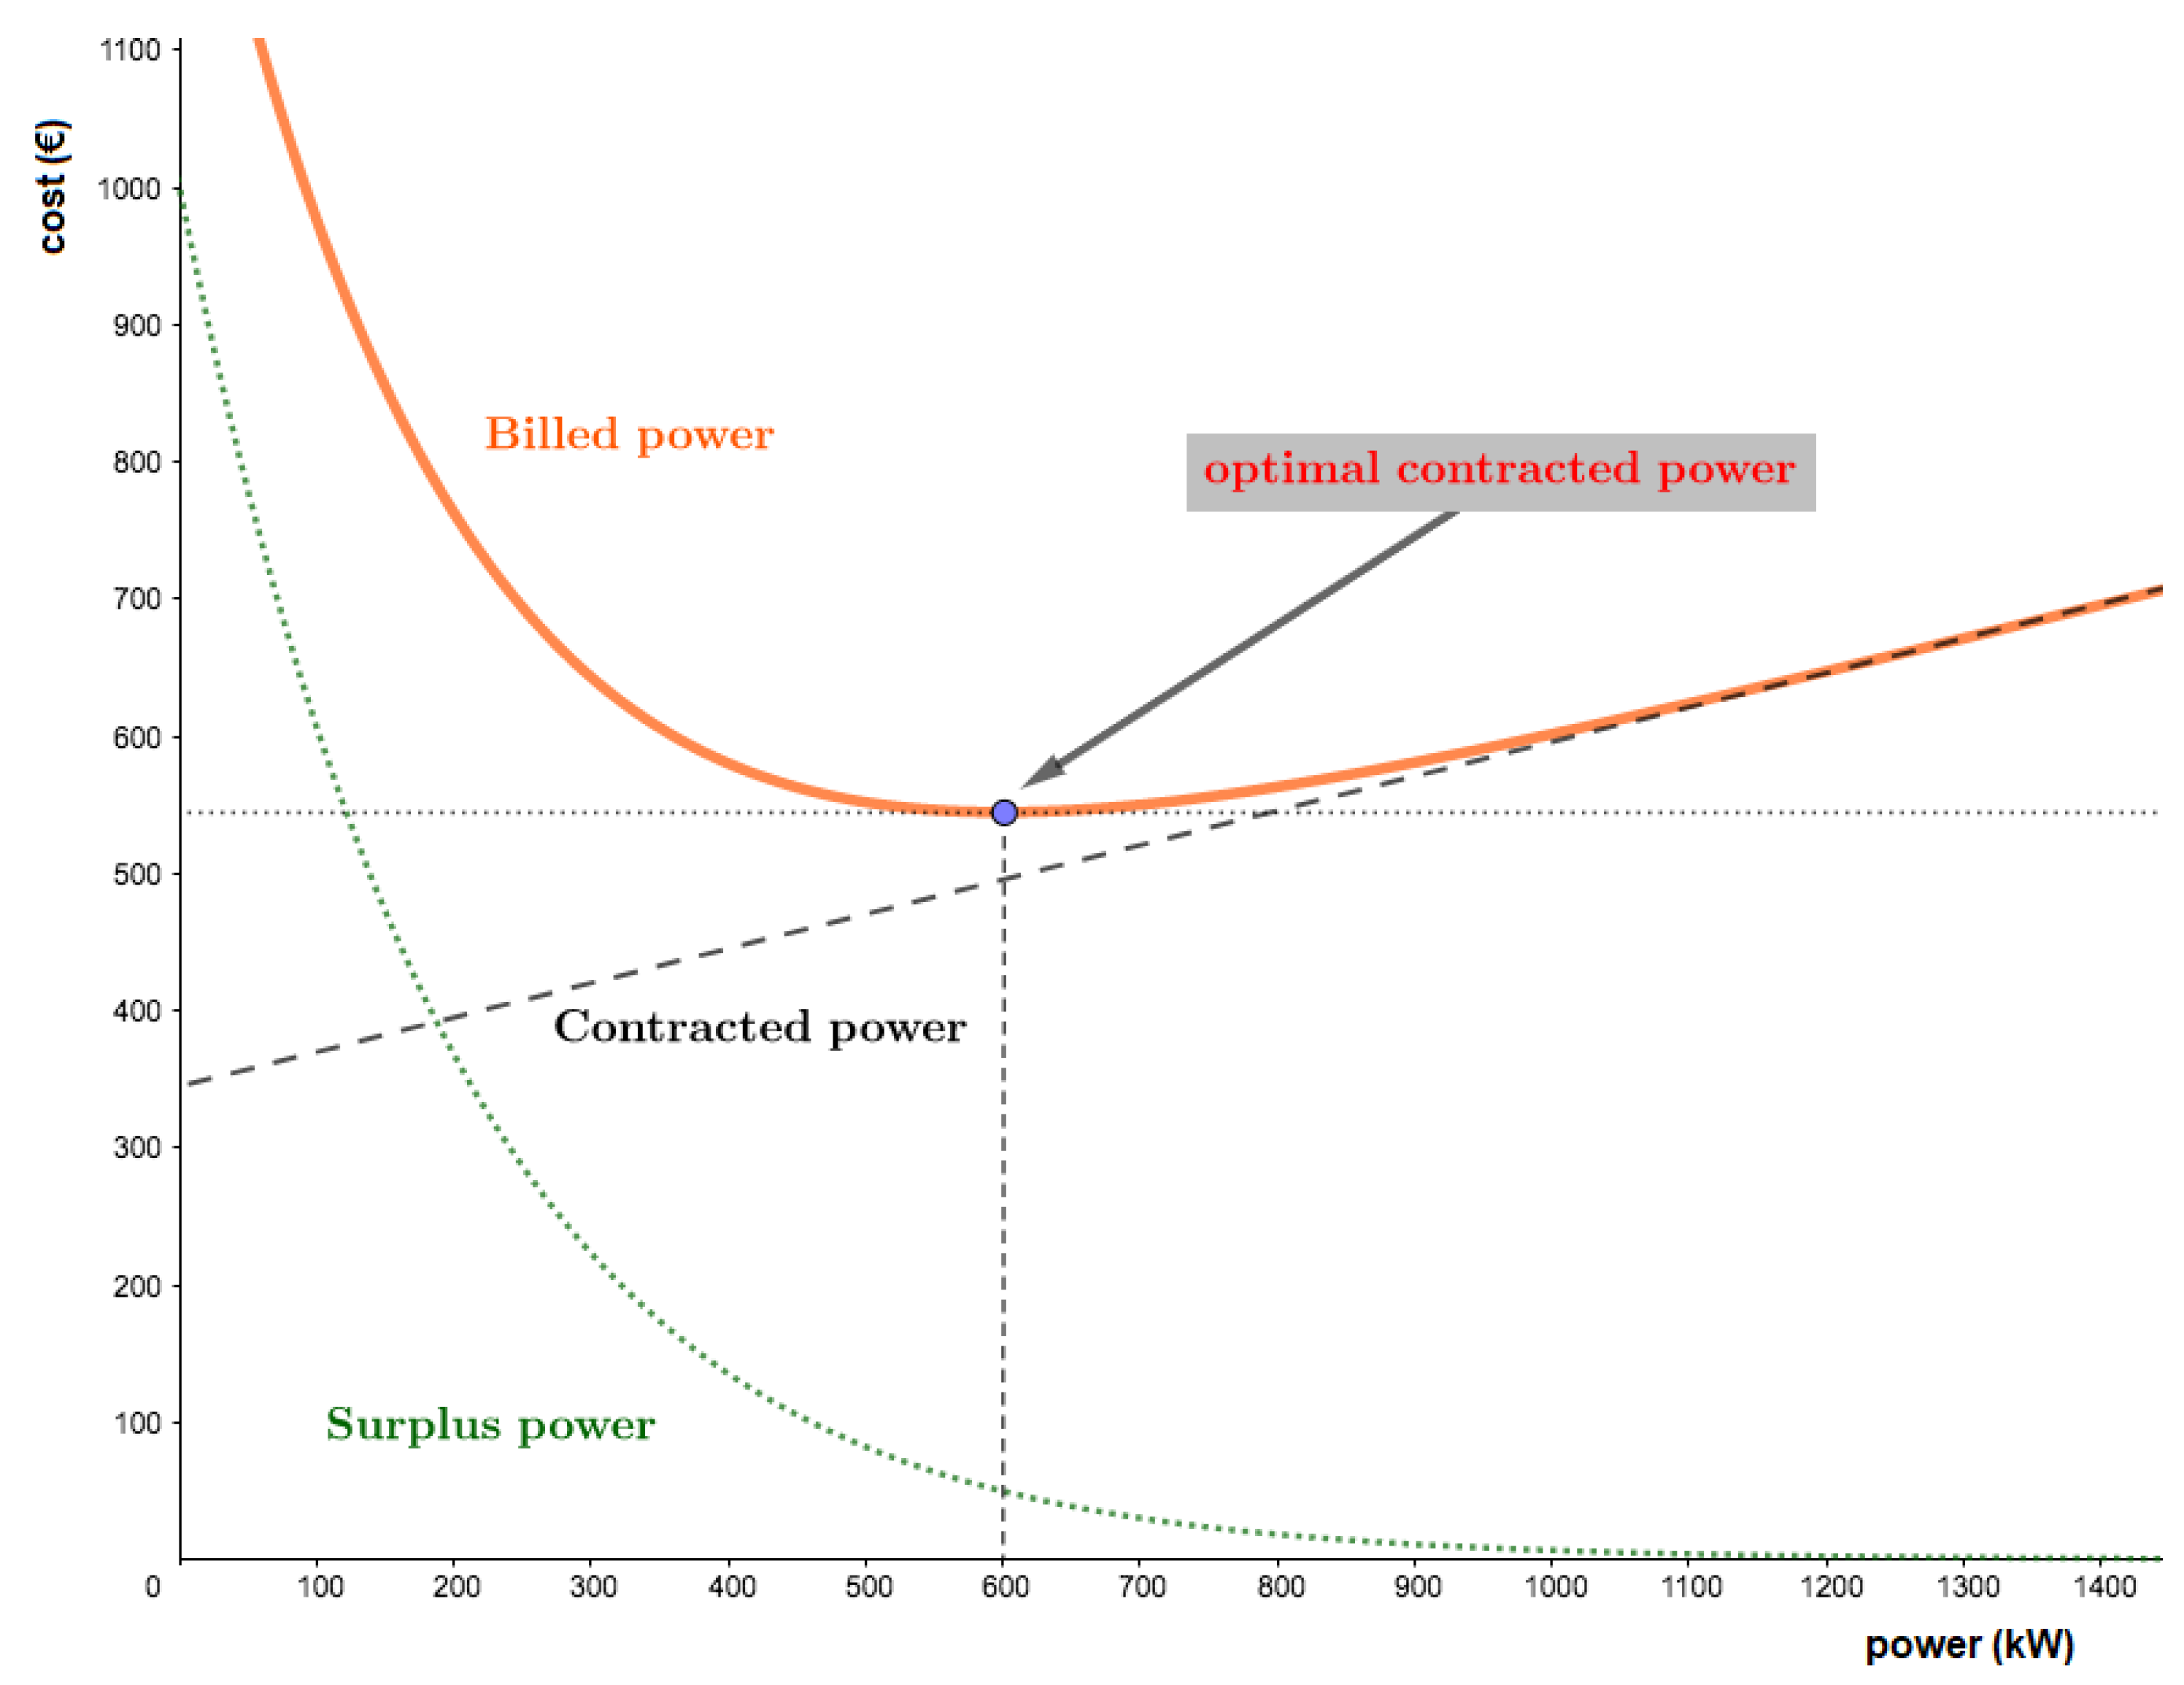
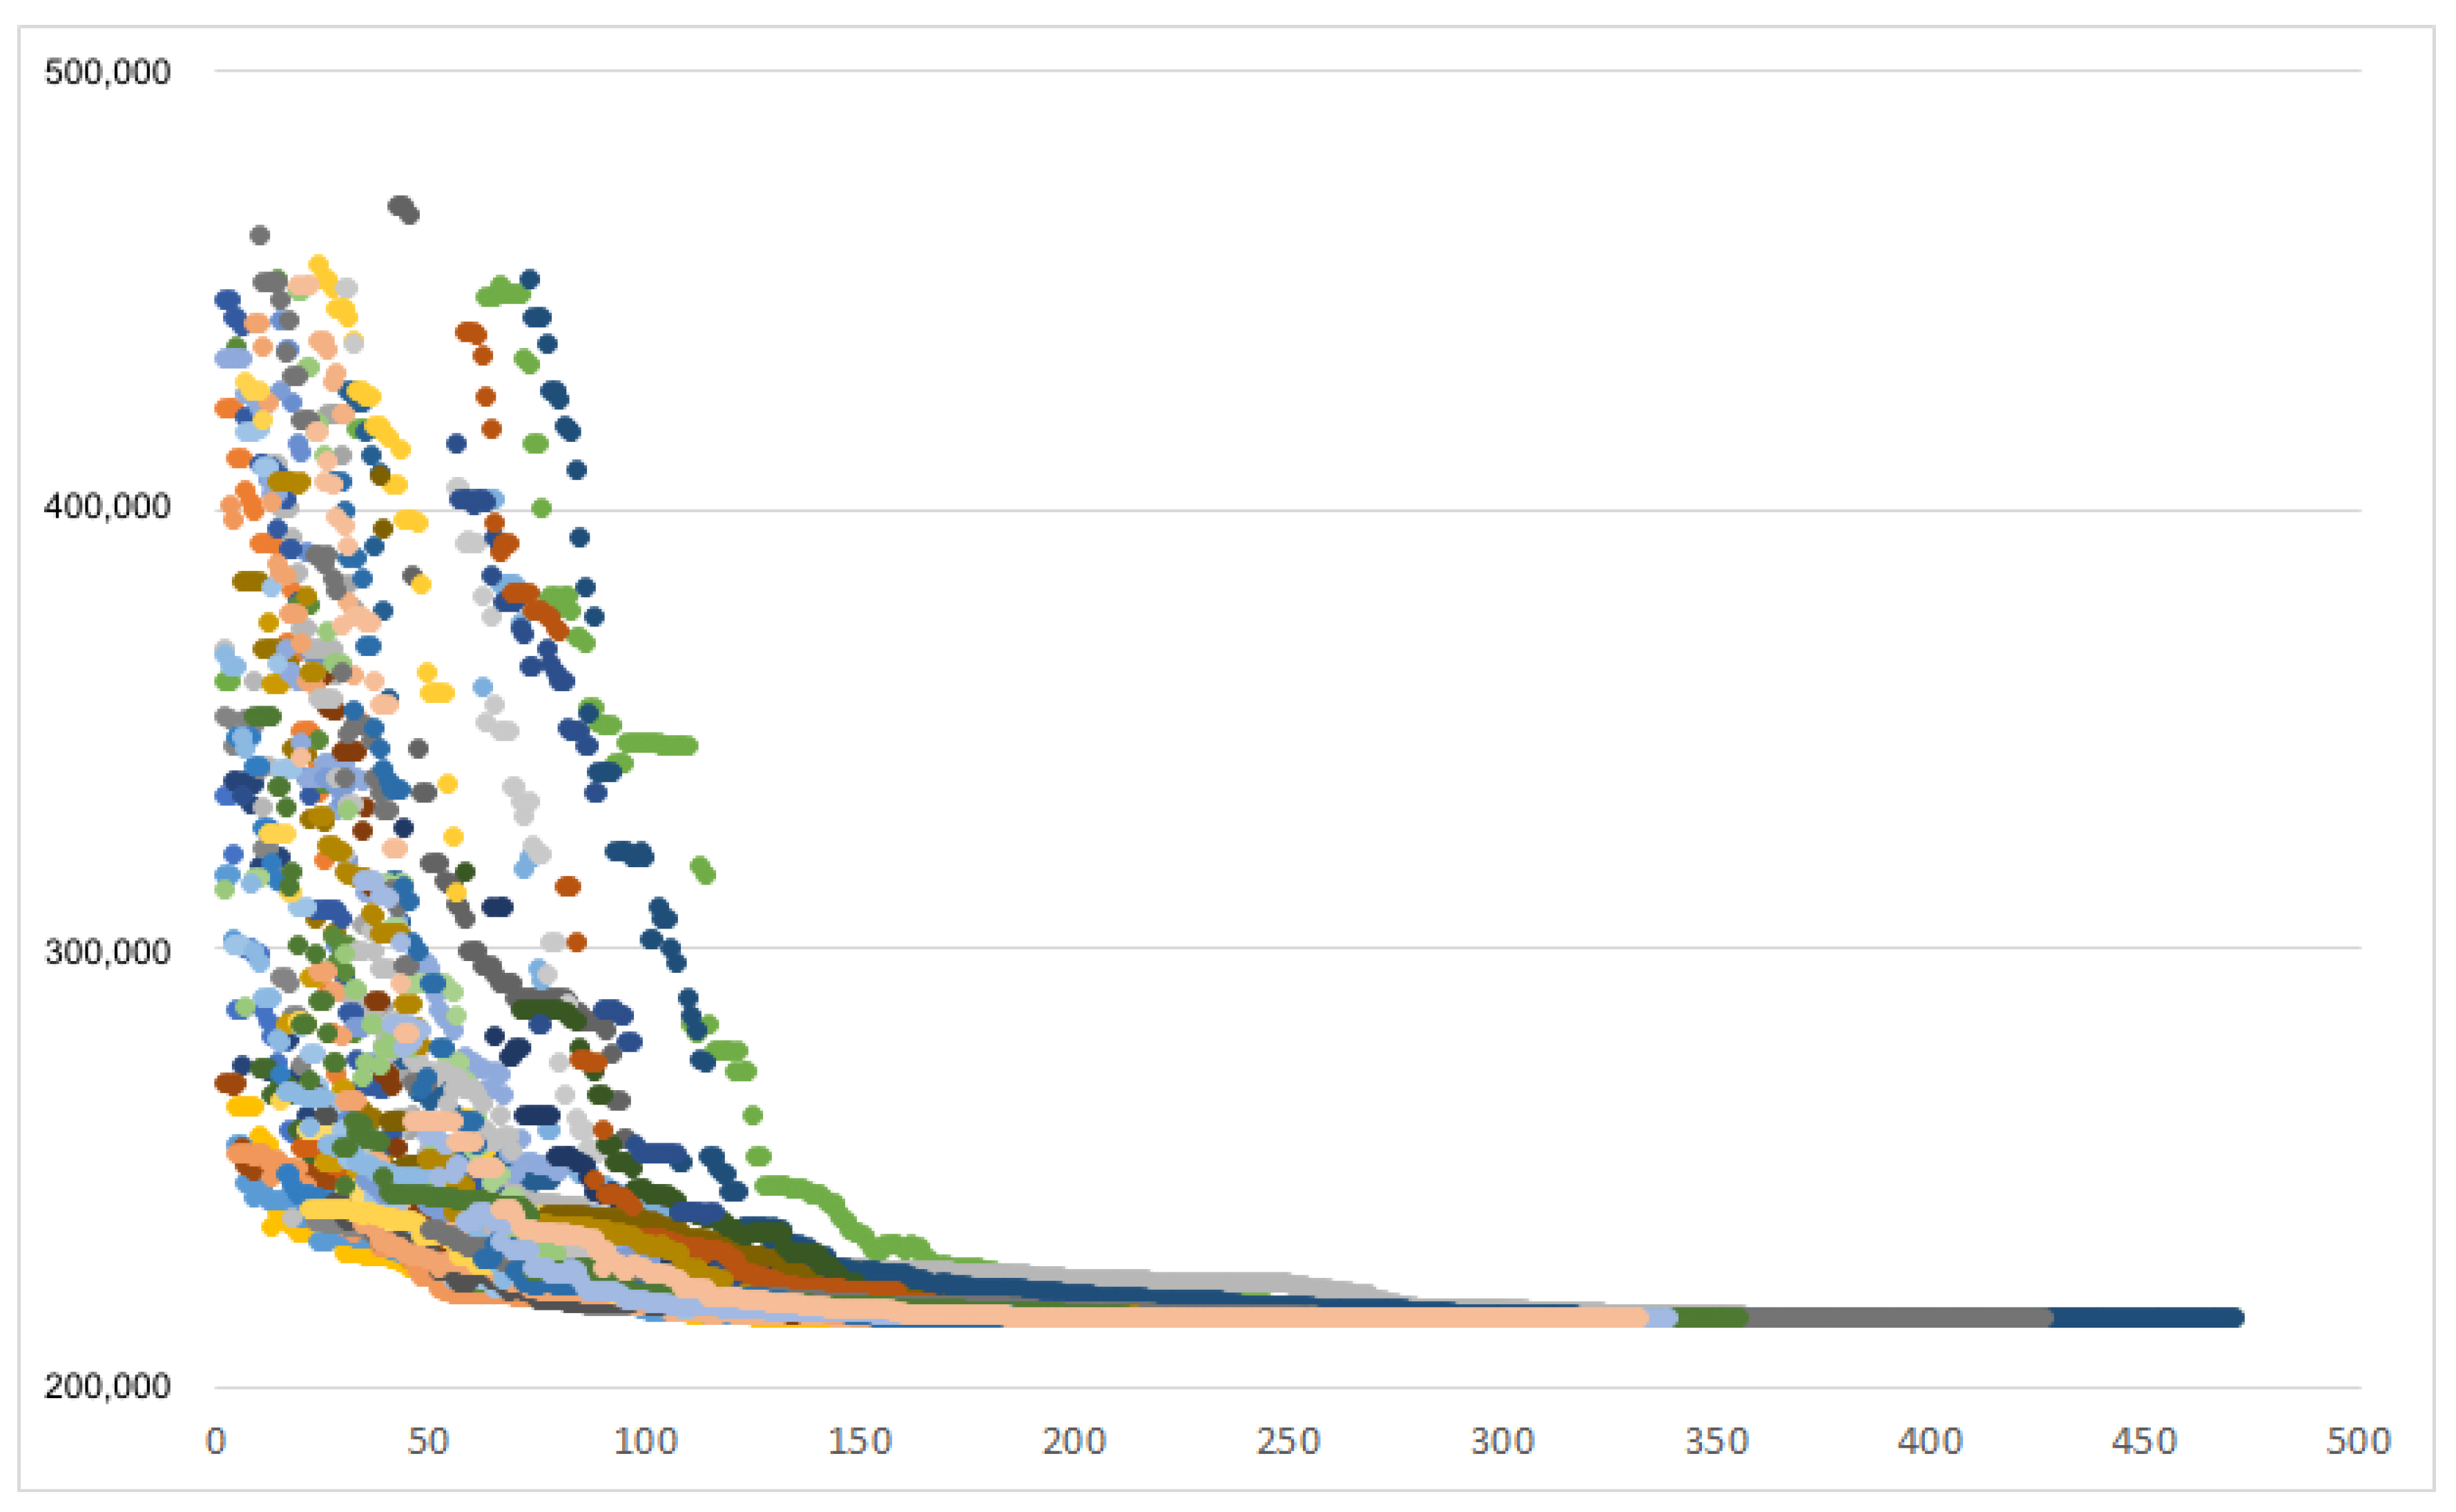
Figure 2 shows how adding surplus power (green color) plus contracted power (black color) gives the billed power (orange color). The surplus curve has that shape because it corresponds to the term
, which is a quadratic term, as can be seen in Equation (
3). The goal here is to reduce the total cost by optimizing the contracted power (term “power” included in Equation (
3)) in each of the six periods while satisfying the restriction given in Equation (
1).
This optimization process can be carried out using non-linear quadratic optimization or, alternatively, by means of approximated methods such as meta-heuristics. Meta-heuristic algorithms provide greater flexibility since it is not necessary to have prior information of the problem at hand in order to find optimal or quasi-optimal solutions while satisfying a set of constraints.
3. Solution Method
Having in mind the difficulty of selecting the contract electric power, it is necessary to provide efficient procedures that obtain high quality solutions. Many authors have proposed exact and approximated methods for solving a large variety of problems. The main drawback of Lagrangian relaxation, branch and bound, and other exact approaches is that the runtime increases with the size of the problem instance, being not suitable to solve very large-sized problems. On the contrary, approximated methods sacrifice the guarantee of finding the optimum results in favor of providing an acceptable solution within a reasonable runtime. Among the approximated methods, meta-heuristics are commonly used since they provide quasi-optimal solutions in a fast way. A large number of meta-heuristics have been proposed in the past, including single point search (simulated annealing, tabu search, variable neighborhood search, etc.) and population-based approaches (evolutionary algorithms, particle swarm optimization, ant colony optimization, etc.) [
10,
11]. Evolutionary algorithms have shown to be efficient methods, and are probably the most commonly used since they are problem-solving procedures that include evolutionary processes as the key design elements, such that a population of individuals is continually and selectively evolved until a termination criteria is fulfilled. Genetic algorithms (GAs) [
12] are possibly the most widely used evolutionary techniques for solving a large variety of problems in the field of electrical systems [
13,
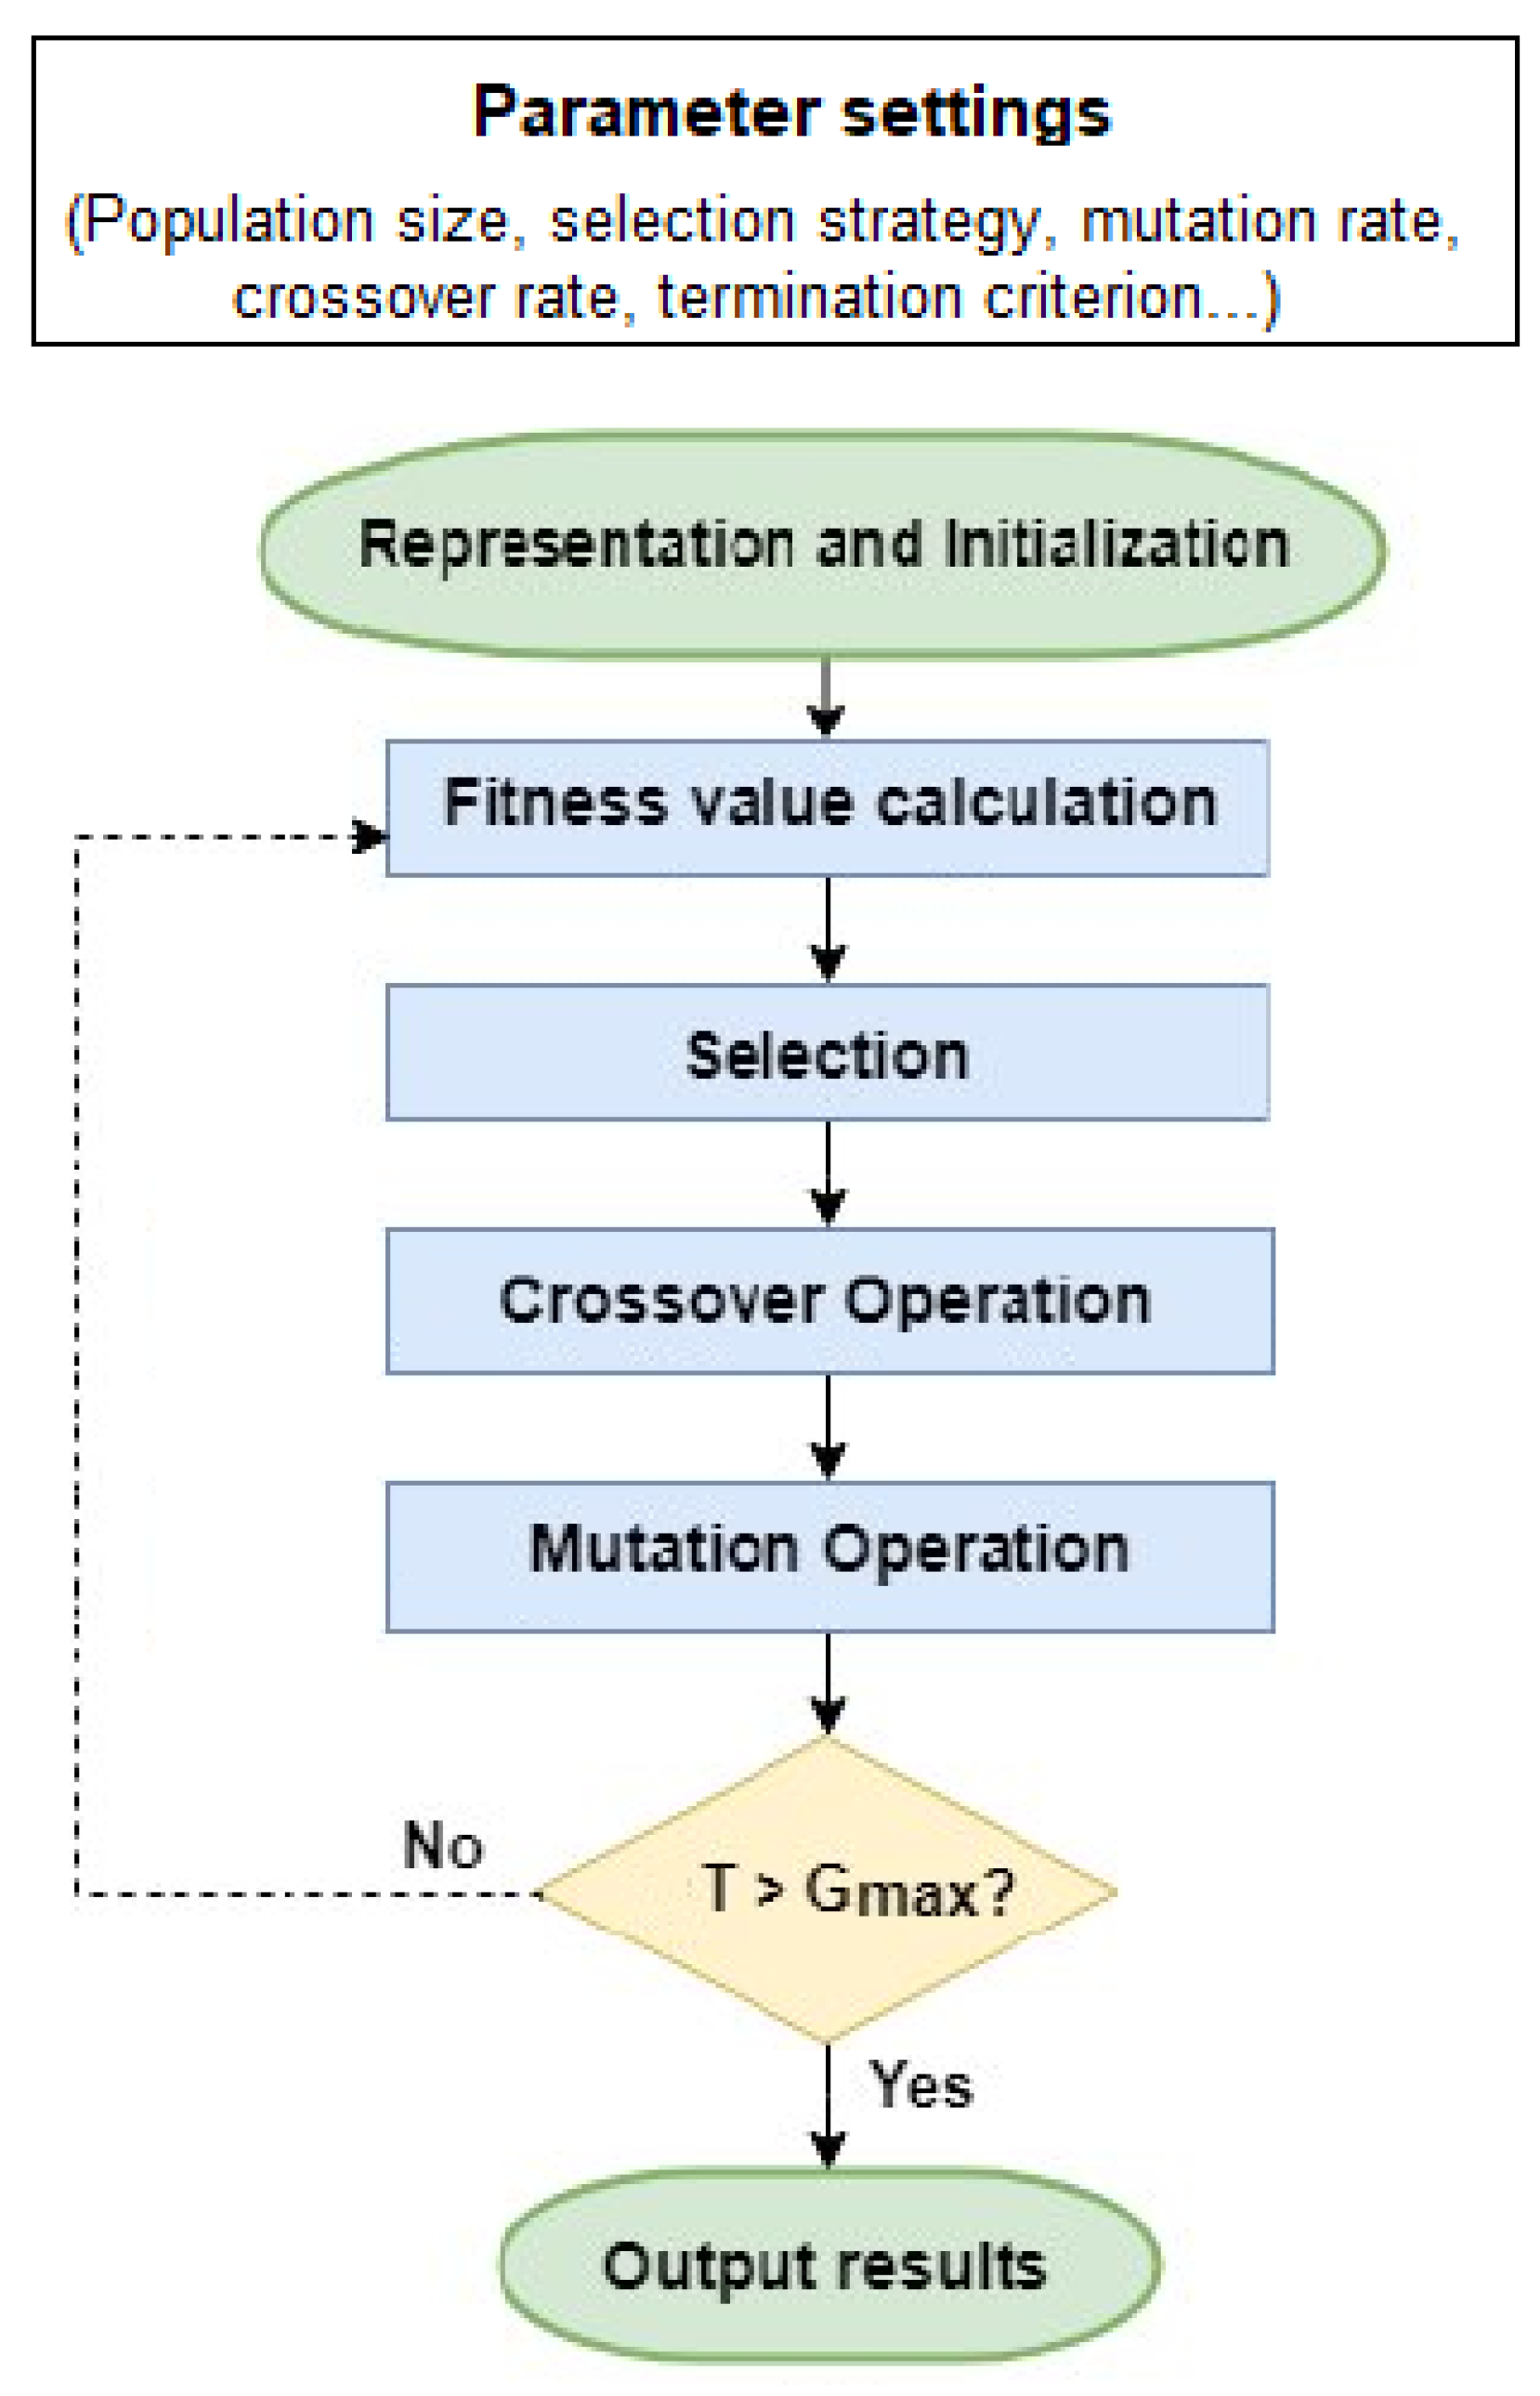
14]. As it can be seen in
Figure 3, a genetic algorithm mimics natural selection by evolving over time a population of individual solutions to the problem at hand until a termination condition is fulfilled and the best individual is returned as result of the algorithm.
In this paper, it is proposed to apply a genetic algorithm to solve the problem of selecting the contracted electric power. Although randomized, GAs exploit historical information to direct the search into the region of better performance within the search space. The basic techniques of the GAs are designed to simulate processes in natural systems necessary for evolution. A genetic algorithm has several strategy parameters, including the population size, mutation operator and mutation rate, the crossover operator and crossover rate, the selection mechanism and selective pressure, etc. An adequate parameter setting can be determinant to obtain high quality solutions. The parameters used in our implementation were:
Population size: This parameter controls the sample size for each population. 100 individuals.
Crossover operator and crossover rate: The crossover operator creates a new chromosome by combining parts of two (or more) parent chromosomes. In this paper, linear crossover, which consists of taking two chromosome (treating it as vectors) and creating a linear combination of this vectors as result, was used. The crossover rate used here was 0.8 (80%).
Mutation operator and mutation rate: the mutation operator mutates a specific gene over the whole population, and prevents a population from converging to a local minimum by stopping the solution to become too close to one another. Although most of the search was performed by crossover, mutation can be vital to provide the diversity to the population. The mutation rate used here was 0.03 (3%).
Selection mechanism: selectors are responsible for selecting a given number of individuals from the population, then obtaining survivors and offspring. The selection mechanism used here was the roulette-wheel selector, which is a fitness proportional selector that applies less selective pressure over than other strategies such as tournament selector.
Termination condition: termination condition is the criteria to determine when the genetic algorithm should end. The termination condition used here was that the algorithm to stop its steady state. In our case, the algorithm stopped when it reached the 100th generation without improvement.
In particular, a custom adaptation of the open-source Jenetics library [
15] written in Java2, which provides the genetic algorithm, and genetic programming implementations was used. It has no runtime dependencies to other libraries, except the Java 8 runtime. Jenetics allows you to minimize or maximize a given fitness function without tweaking it. Since it is an open source library, it was possible to include the necessary modifications and adapt the source code to the problem at hand.
Although the aim of the paper was not to present a new genetic algorithm, but to use the implementation of the Jenetics library [
15] to solve a specific problem, some comments about the performance of the genetic algorithm are provided using typical considerations [
16]. On one hand, the space complexity of an algorithm is the amount of memory space required to solve an instance of a problem as a function of the size of the input. In our case, the space complexity of the genetic algorithm was linear since it did not use a cost matrix, but a cost array of length equal to the population size. On the other hand, time complexity of an algorithm is the amount of processing time it needs to run to completion. According to [
17], when computing the time complexity, the impact of decision variables and objectives are generally ignored as they are much smaller than the population size. In our case, the time complexity of the genetic algorithm was determined by measuring the maximum number of fitness function evaluations. If the population size, maximum number of generations, and other parameters are fixed, then the maximum number of fitness function evaluations will not change when the size of the input is doubled (e.g., considering data of two years instead of one), although the time needed to evaluate a single fitness function call will be twice as long. Therefore the time complexity was determined to be linear.


