Article

Organic Matter Pore Characterization of the Wufeng-Longmaxi Shales from the Fuling Gas Field, Sichuan Basin: Evidence from Organic Matter Isolation and Low-Pressure CO2 and N2 Adsorption

1
State Key Laboratory of Petroleum Resources and Prospecting, China University of Petroleum, Beijing 102249, China
2
Unconventional Natural Gas Research Institute, China University of Petroleum, Beijing 102249, China
*
Author to whom correspondence should be addressed.
Energies 2019, 12(7), 1207; https://doi.org/10.3390/en12071207
Submission received: 15 January 2019 / Revised: 16 March 2019 / Accepted: 26 March 2019 / Published: 28 March 2019
(This article belongs to the Special Issue Shale Oil and Shale Gas Resources)

Abstract

:
Organic matter (OM) pores are significant for shale gas accumulation and flow mechanisms. The pores of Wufeng-Longmaxi (W-L) shale in the Sichuan Basin, China have been extensively characterized, however, the proportion of OM pores in this shale have not been adequately discussed. In this study, the contribution of OM pores to the total pore volume of W-L shale was quantitatively studied through the analysis of OM isolation, field emission scanning electron microscopy (FE-SEM) and low-pressure CO2 and N2 adsorption (LPGA). FE-SEM images showed abundant OM pores, interparticle pores and intraparticle pores with various shapes and widths in the W-L shales. The pore size distribution (PSD) of the isolated OM from five shale samples showed a consistent, unimodal pattern. The pore volume of isolated OM was greater than that of the bulk shale samples, suggesting that OM is more porous than the inorganic compositions in shales. The average contribution of OM to the volumes of micropores, mesopores and macropores was 58.42%, 10.34% and 10.72%, respectively. Therefore, the pore volume of the W-L shale was dominantly related to inorganic minerals. This was probably due to the small weight ratio of OM in the shale samples (1.5 wt%–4.2 wt%). The findings of this study reveal the different effects of OM and minerals on pore development, and provide new insights into the quantitative contribution of OM pores to the total pore volume of the W-L shale.

1. Introduction

Organic shales commonly contain complex pore systems with various pore types, pore geometry and multiscale pore widths [1,2,3]. The pores in shale are commonly classified as interparticle (interP), intraparticle (intraP), and organic matter (OM) pores or microfractures, using direct imaging techniques [2]. In addition, the pore size of shale can be sorted. The categories include micropore (pore width smaller than 2 nm), mesopore (pore width between 2 and 50 nm) and macropore (pore width larger than 50 nm), following the international union of pure and applied chemistry (IUPAC) classification [4]. Due to the nanoscale organic and inorganic pores within the shale formations, the solid–fluid interaction becomes non-trivial, causing the gas flow to derivate from classical Darcy’s law [5,6]. Recently researchers have reported some pore-scale studies of fluid flows in shale, however, most of them focused on a single nano-tube with the mean pore-throat radius. All the derived formulas are based on gas molecular dynamics, which might not be applicable to shale formations, especially the organic pores. Therefore, molecular dynamic simulations are also used to investigate the gas state and flow mechanisms within organic pores [7,8]. Assuming shale formations to be fractal porous media, non-Darcy flows were further investigated. However, the real pore structures within the shale formations are much more complex than the studies stated. Naraghi and Javadpour (2015) first proposed their stochastic model by representing organic patches randomly scattered within inorganic pores [9], and this idea was further adopted by Naraghi et al. (2018) [10,11]. Therefore, characterization of the pores in gas shale is critical to understanding gas storage and gas flow mechanisms [12].
Pores in shale can be characterized by direct observation [2,13,14,15,16,17], radiation detection [3,18,19,20], and fluid intrusion techniques [1,21,22,23,24]. Recently, the multi-scale pore structure (e.g., pore types, shapes, size and connectivity) of shales has been studied extensively using various methods [20]. For example, field emission-scanning electron microscopy (FE-SEM) [2,13,14,15,16,17], small angle neutron scattering (SANS) [3,19,20], nuclear magnetic resonance (NMR) [25,26,27,28,29], nano-scale X-ray computed tomography (Nano-CT) [18,30,31,32], low-pressure gas physisorption (LPGA) and mercury intrusion capillary pressure (MICP) [1,21,22,23,24,33,34,35,36,37,38] were applied to characterize the pores in shales. Of these techniques, FE-SEM and Nano-CT were effectively applied to the quantitative characterization of OM pores, with the help of image processing, data extraction and electron tomography of subnanometric resolution to characterize the porous network in organic matter [13,14,15,16,17,18,30,31,32]. However, these measurements have the drawbacks, the tiny sample preparation for Nano-CT and the limited observation areas for FE-SEM. The results of microscopic observation methods, considering the heterogeneity of organic shales and the small observation area, may not be representative [31]. In addition, OM pores were poorly characterized with the fluid intrusion (LPGA and MICP) techniques because these methods cannot distinguish OM from inorganic mineral compositions [35]. Rexer et al. (2014) proposed an effective OM isolation process that does not alter the pore structure [39]. Therefore, OM isolation from bulk shale provides an effective way to characterize OM pores [39,40,41].
OM pores are proposed to be the significant pore type in shale [2,13,15,16,17] and the major contributor to the gas storage capacity for both adsorbed gas and free gas [42,43,44,45,46]. Porosity within OM particles could be larger than 40% based on SEM images [13,15,16,47,48]. OM porosity is promoted by high total organic carbon (TOC) content and appropriate thermal maturity, whereas excessive maturity may reduce the number of OM pores [49,50,51]. The contribution of OM pores is suggested to be significant in many gas shales [2,13]. Loucks et al. (2012) estimated the proportion of OM pore to porosity of shales using SEM images [2]. Tian et al. (2013) calculated the contribution of OM to pores according to the regression line of TOC content versus porosity [3]. Considering that the pore structure of gas shales may also be controlled by inorganic minerals [13,14,17,31,46,47,48,50], the accuracy of the results of Loucks et al. (2012) and Tian et al. (2013) may be low [41].
The pore characteristics of Wufeng-Longmaxi (W-L) shale in China were studied by Chinese scholars using various techniques. Quantitative pore structure parameters (i.e., pore size distribution, pore volume and surface area, and pore connectivity) were studied by fluid intrusion methods [20,33,34,35,36,37,40,42,52,53,54]. OM pore characterization of W-L shale in China has gained increasing research attention and OM types and OM pore networks have been qualitatively investigated by the FE-SEM imaging technique [14,31,32,35,36]. Ji et al. (2017) reported that OM pores in W-L shale were characterized using isolated OM samples [40]. However, they did not quantitatively study the proportions of OM pores. The contribution of OM pores to the total pore volume of the W-L shale requires further study. Therefore, the objectives of this study are to: (1) prepare isolated OM samples from bulk W-L shale, (2) compare the pore characteristics of isolated OM and the corresponding bulk shale using FE-SEM and LPGA (CO2 and N2) methods, and (3) quantitatively investigate the contributions of OM and mineral compositions to the pore volumes of the W-L shale. The findings of this paper will provide new insights into the quantitative contribution results of OM and mineral compositions to the total pore volume of W-L shale.

2. Materials and Methods

2.1. Materials

A total of five W-L core samples were collected from well J-4 in the Fuling gas field, Sichuan Basin, China. The geological settings of the Wufeng-Longmaxi Formation in the study area have been reported in previous works [36,42]. Briefly, this field is situated in the southeast margin of the Sichuan Basin, which has experienced multiple stages of tectonic movements, including the Sinian-Silurian Caledonian, Devonian-Permian Hercynian, Triassic Indosinian, Jurassic-Cretaceous Yanshanian, and Tertiary-Quaternary Himalayan movements [36]. The W-L organic shale in the study area is mainly deposited in deep water shelves with low-energy and anoxic environments [41]. The graptolite-rich W-L shale, with a present-day thickness of about 60–110 m, consists of black carbonaceous shale, carbonaceous mudstone, argillaceous siltstone, and siliceous shale [36]. The shale samples in this study were selected from the bottom of the W-L Formation.
The core samples were prepared as rock chips for FE-SEM and crushed to 60 mesh for OM isolation, and 100 mesh for TOC, XRD, and LPGA (CO2 and N2) measurements. The particle size used for gas adsorption porosimetry strongly influences porosimetric results and the 60–140 mesh particle size of organic shale is recommended for LPGA experiments [55,56].

2.2. Methods

2.2.1. OM Isolation

OM (mixture of kerogen and bitumen) samples were prepared using the chemical treatments proposed by Rexer et al. (2014) [39]. Specifically, each shale sample, with a particle size of 100 mesh, was first treated with HCl for about 24 h to remove carbonates. After washing several times with distilled water, the residue was treated with HF for 12 h to remove silicate minerals. The residual solids were washed and treated with CrCl2 for 12 h to remove pyrite, and then washed again with distilled water. The OM samples were separated via filtering. The OM samples were prepared after the residues were washed with distilled water and dried at −5 °C. The bitumen in the W-L shale was preserved, considering that abundant bitumen pores exist in more mature shales [31,42].

2.2.2. TOC and XRD

TOC and XRD measurements were conducted following the Chinese national standard (GB/T 31483-2015). Specifically, shale samples of 100 mesh were treated with HCl (10%) to remove carbonates, washed with distilled water and dried for 24 h at 70 °C before the TOC experiments commenced. The TOC content was measured on a Leco CS 230 carbon/sulfur analyzer (LECO Corporation, St. Joseph, MI, USA).
For bulk mineral composition measurements, the samples were mixed with ethanol, mounted on glass slides and measured on a Bruker D8 Discover diffractometer (Bruker AXS Corporation, Karlsruhe, Germany). The diffracted beam was measured with a scintillation detector with a counting time of 20 s for each step of 0.02° 2θ. The quantitative phase analysis was performed by Rietveld refinement, with customized clay mineral structure models [57].

2.2.3. FE-SEM

Shale sections of 1 cm × 1 cm in area were Ar-ion milled to create an ultra-smooth surface and then coated with carbon. Each carbon-coated section was inspected using an FEI Helios NanoLab™ 650 FE-SEM (Thermo Fisher Scientific, Waltham, MA, USA). The FE-SEM images of the shale sample surface, with a resolution of 2.5 nm at 2 kV accelerating voltage and a working distance of 4 mm, were collected.

2.2.4. LPGA

LPGA (CO2 and N2) experiments were performed on Micromeritics ASAP-2460 surface area analyzers (Micromeritics, Atlanta, GA, USA). The OM and shale samples were degassed at about 110 °C for about 12 h before the LPGA experiments. The parameters were set at 0 °C and −196 °C. The relative pressure (P/P0) for N2 and CO2 adsorption ranged from 0.0001 to 0.995 and from 0.0001 to 0.03, respectively. The adsorption isotherms were generated and the surface areas, pore volumes, and pore distributions were calculated [13]. Micropore volumes and surface areas were calculated using a Density Functional Theory (DFT) model based on CO2 physisorption data [37]. The Barrett-Joyner-Halenda (BJH) volumes were calculated using low-pressure N2 adsorption data [33,34,35,36,37].

3. Results

3.1. Organic Geochemistry and Mineralogy
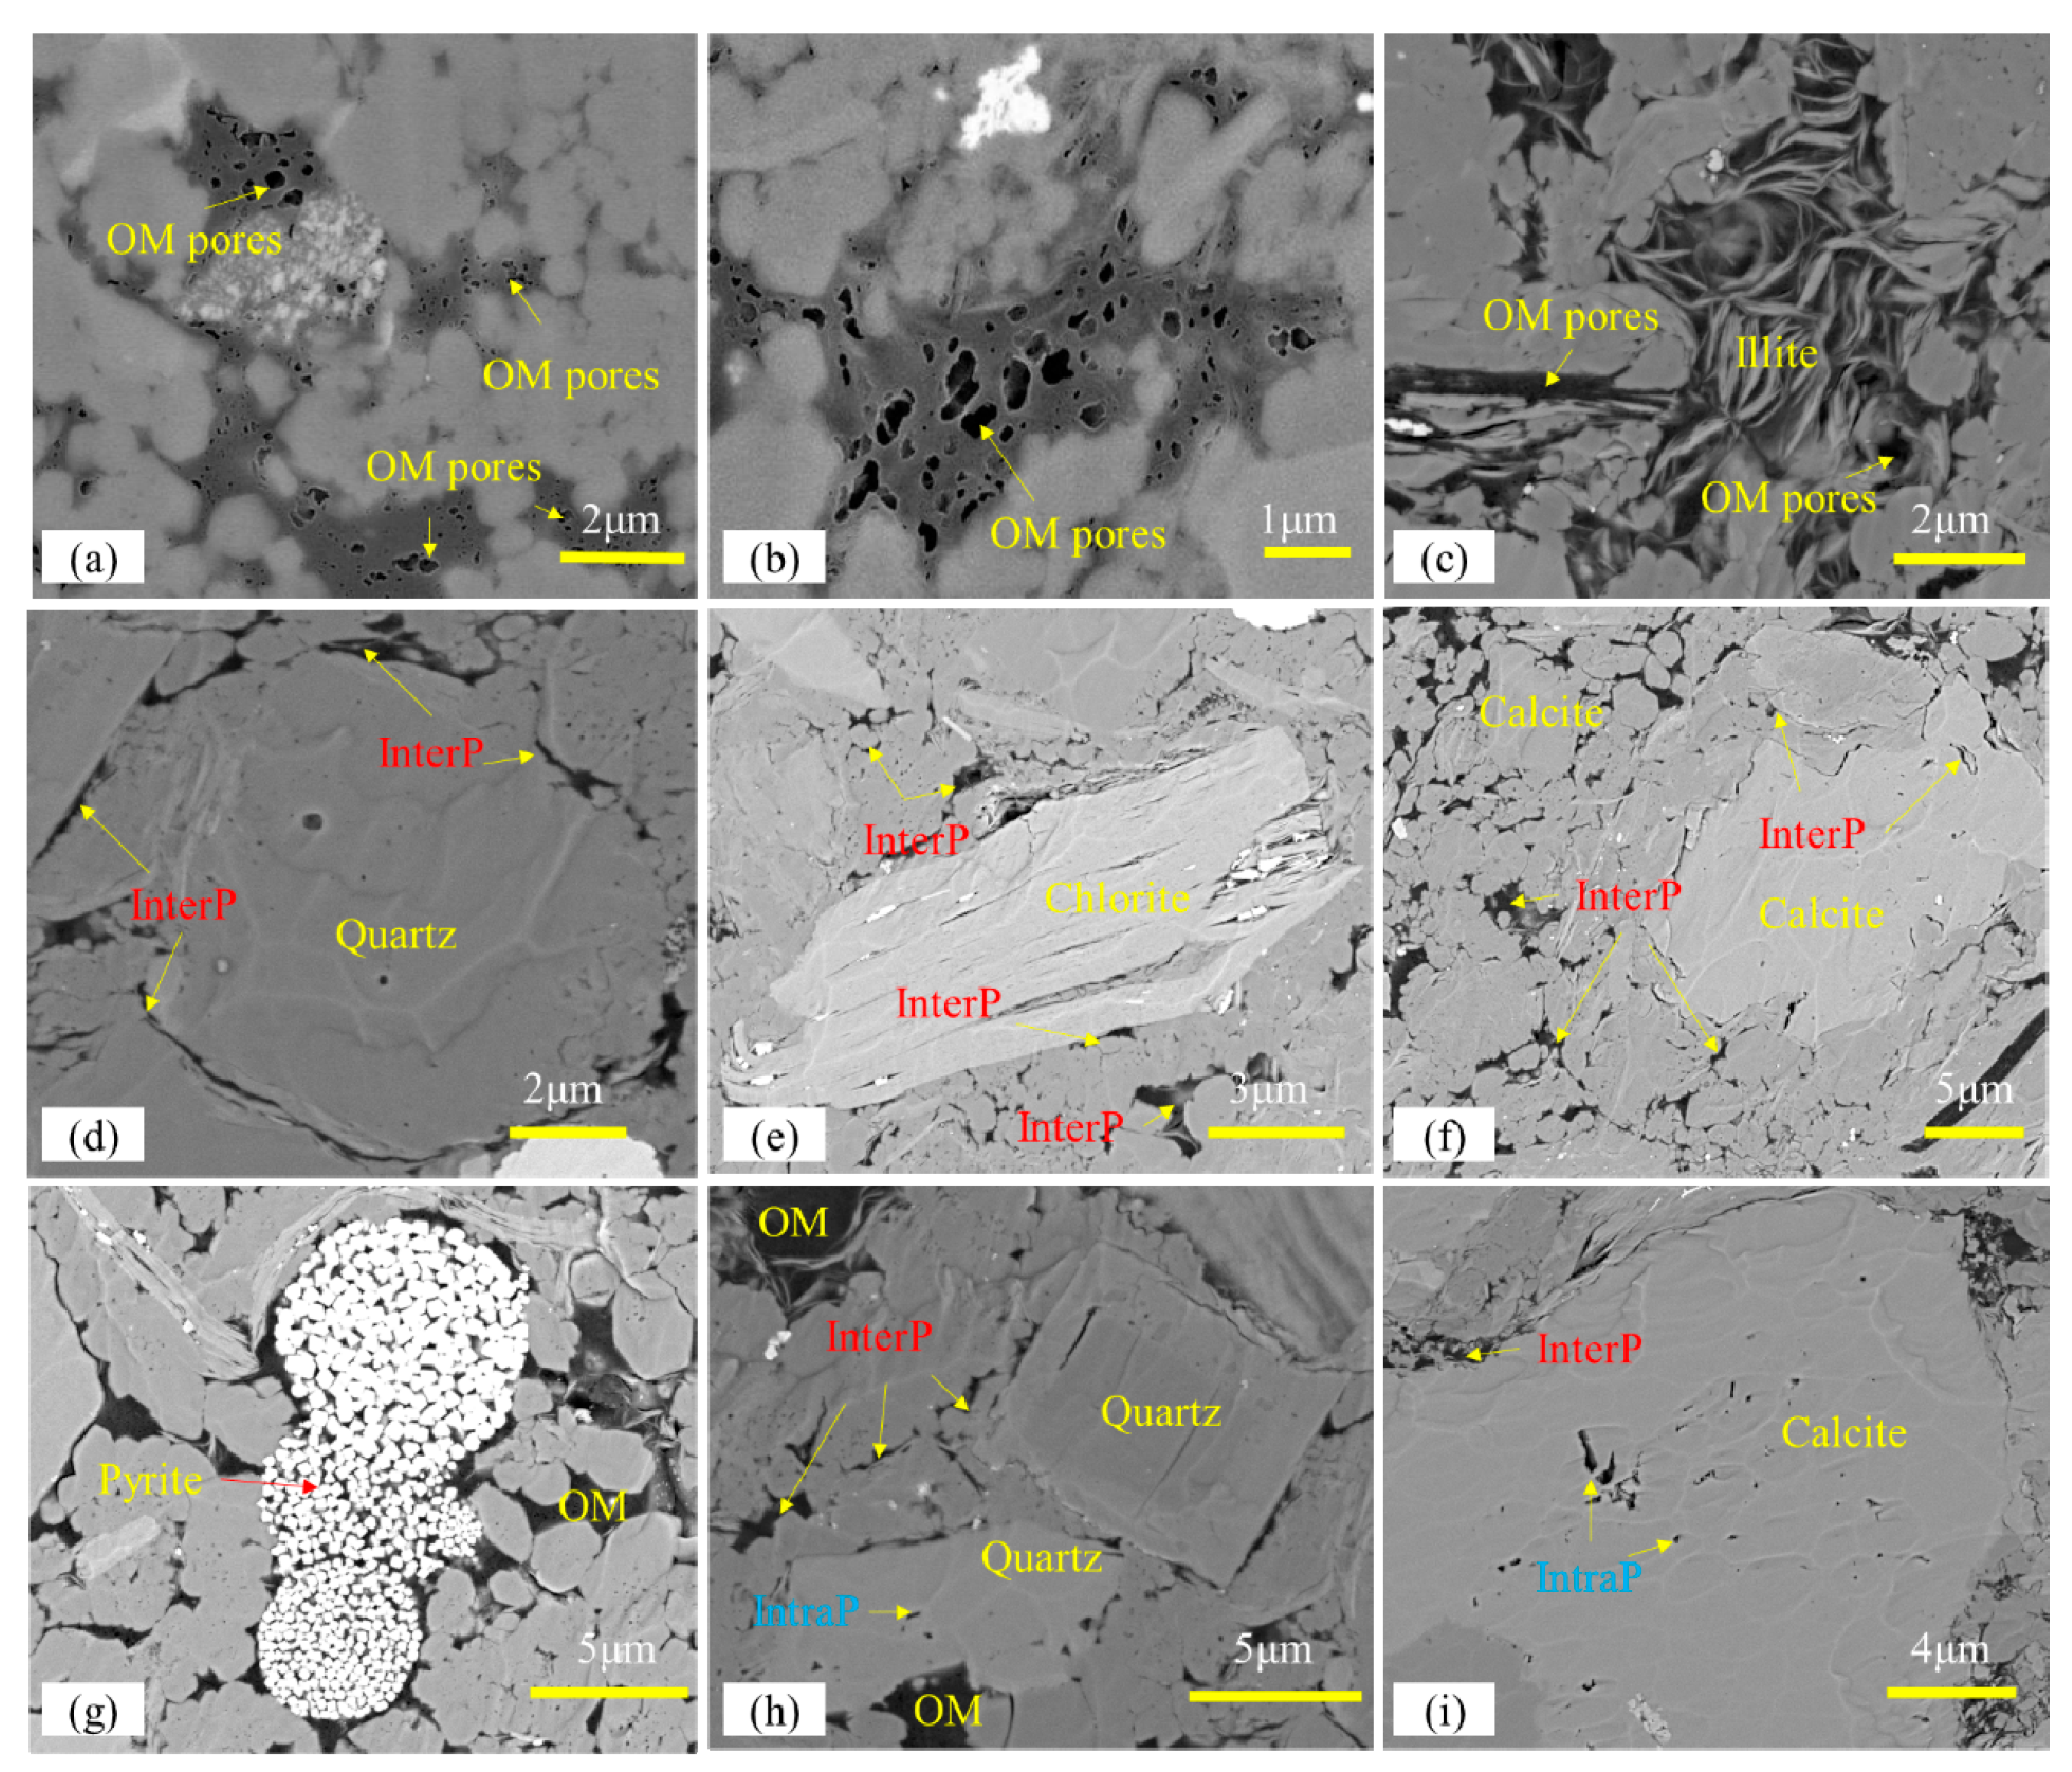
The mineral compositions and geochemical results of the W-L shale samples are listed in Table 1. The TOC content ranged from 1.5 wt% to 4.2 wt%, with an average content of 2.75 wt%. The equivalent vitrinite reflectance values, converted from bitumen reflectance, were in the range of 2.35–2.60%, suggesting a mature dry gas generation. The dominant mineral compositions in the shale were quartz and clay, with average proportions of 40.8% (35.6–51.1%) and 38.9% (38.3–41.1%), respectively. The average values of feldspar, carbonate minerals (calcite and dolomite) and pyrite were 9.6%, 4.8%, 2.7%, respectively.

3.2. FE-SEM Imaging

FE-SEM images were obtained to study the pore characteristics of the W-L shale samples (Figure 1). According to the classification of Loucks et al. (2012) [2], OM pores, interparticle pores (interP pores) and intraparticle pores (intraP pores) were observed. OM pores with various pore shapes and sizes were identified (Figure 1a–c). OM pores with elliptical bubbles and irregular polygon shapes were heterogeneously distributed (Figure 1a–b). Within large OM particles, the pores extended toward each other, forming complex and connected pore networks in three dimensions (Figure 1b). Pores between the illite interlayers were also filled with OM, which formed complex pore networks (Figure 1c). These observations were consistent with the results of the W-L Formation in the Sichuan Basin [14,31,32,35,36]. InterP pores are primarily formed between quartz, clay minerals, and calcite grains with, mainly, slit shape (Figure 1 d–f). Such pores are commonly filled with OM, pyrite framboids, and clay minerals (Figure 1 g–h). IntraP pores are also observed within quartz (Figure 1d), and calcite grain (Figure 1i). Pyrite framboids with inter crystal pores filled with OM (Figure 1g) were commonly observed in the samples.

3.3. LPGA (CO2 and N2)

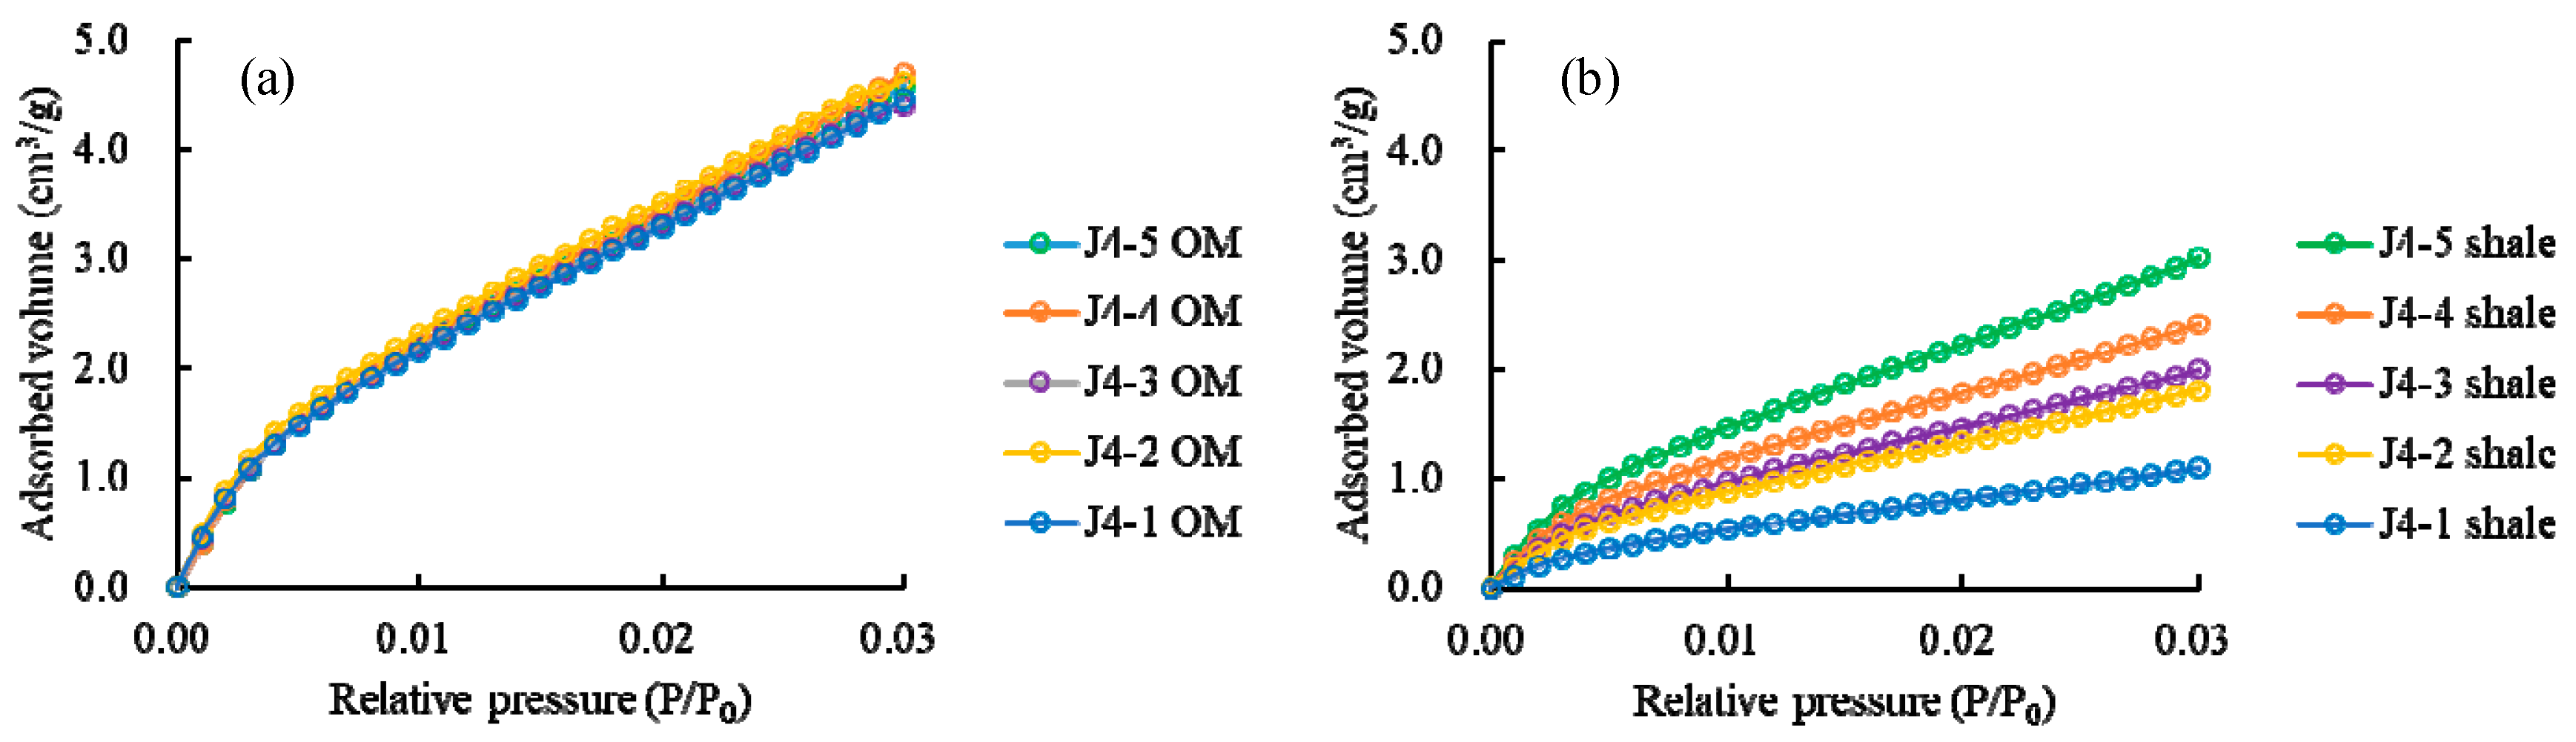
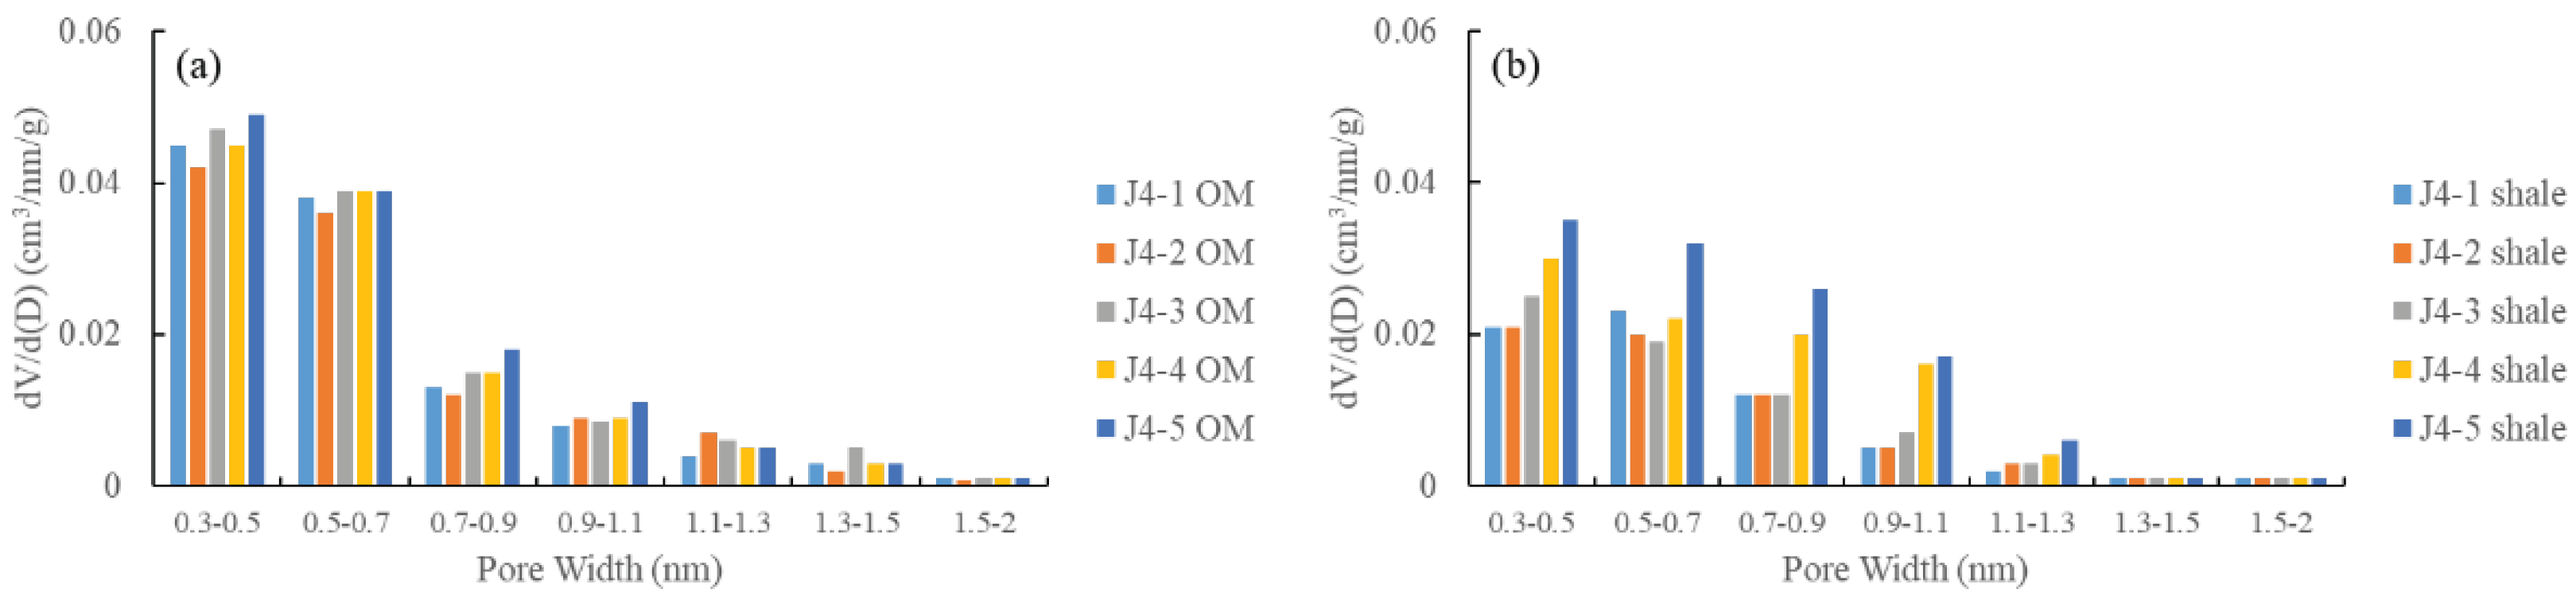
3.3.1. Low-Pressure CO2 Adsorption

The low-pressure CO2 adsorption isotherms of the isolated OM and bulk shale samples are shown in Figure 2. The OM samples had slightly higher adsorption volumes than the related bulk shale samples, suggesting the formation of micropores in OM matter. Isotherms with similar shapes were observed in the isolated OM samples (Figure 2a). For the bulk shale samples, the J4-1 shale with the lowest TOC content had the lowest CO2 adsorption volume, while sample J4-5 with the higher OM richness had the highest CO2 adsorption volume (Figure 2b).
The pore volumes and surface areas calculated by DFT model are listed in Table 2. The DFT surface area of isolated OM ranges from 30.98 to 34.85 m2/g, with an average of 32.58 m2/g, which is nearly two times larger than the related shale samples with a mean value of 9.32 m2/g (12.68–28.95 m2/g). The DFT pore volume of the isolated OM samples varies from 12.6 to 13.2 cm/100g, which is greater than that of the corresponding bulk shales (0.32–1.12 cm3/100g). In addition, when the TOC content increased, the DFT pore volume of all bulk shale samples increased. The pore volumes of the OM samples were normalized to bulk shale weight by multiplying the TOC values of the bulk shale. The normalized pore volumes of OM are in the range 0.19–0.55 cm3/100g shale (Table 2).
The PSDs of isolated OM and bulk shale samples obtained from CO2 adsorption data are shown in Figure 3. Pores with diameters smaller than 0.7 nm are the primary proportions of pore volume in both isolated OM and bulk shales (Figure 3). The shapes of PSD curves of both isolated OM and bulk shale samples are similar. These results are consistent with previous studies of W-L shale in the Sichuan Basin [35,36,37].

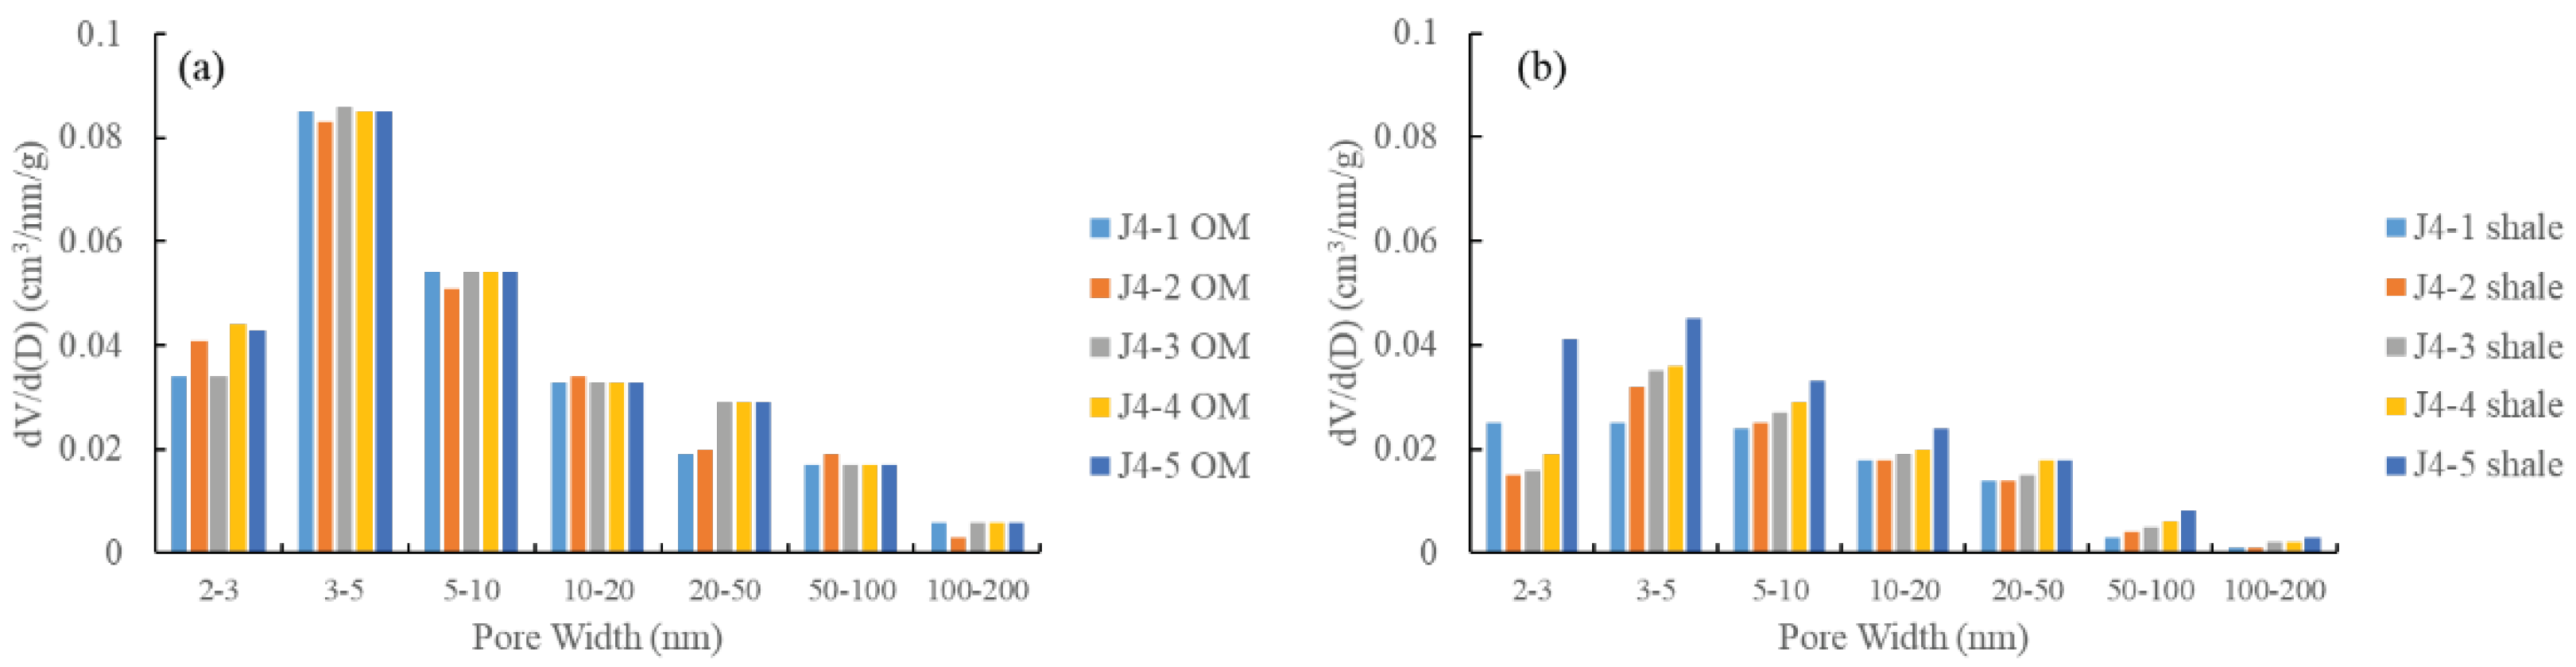
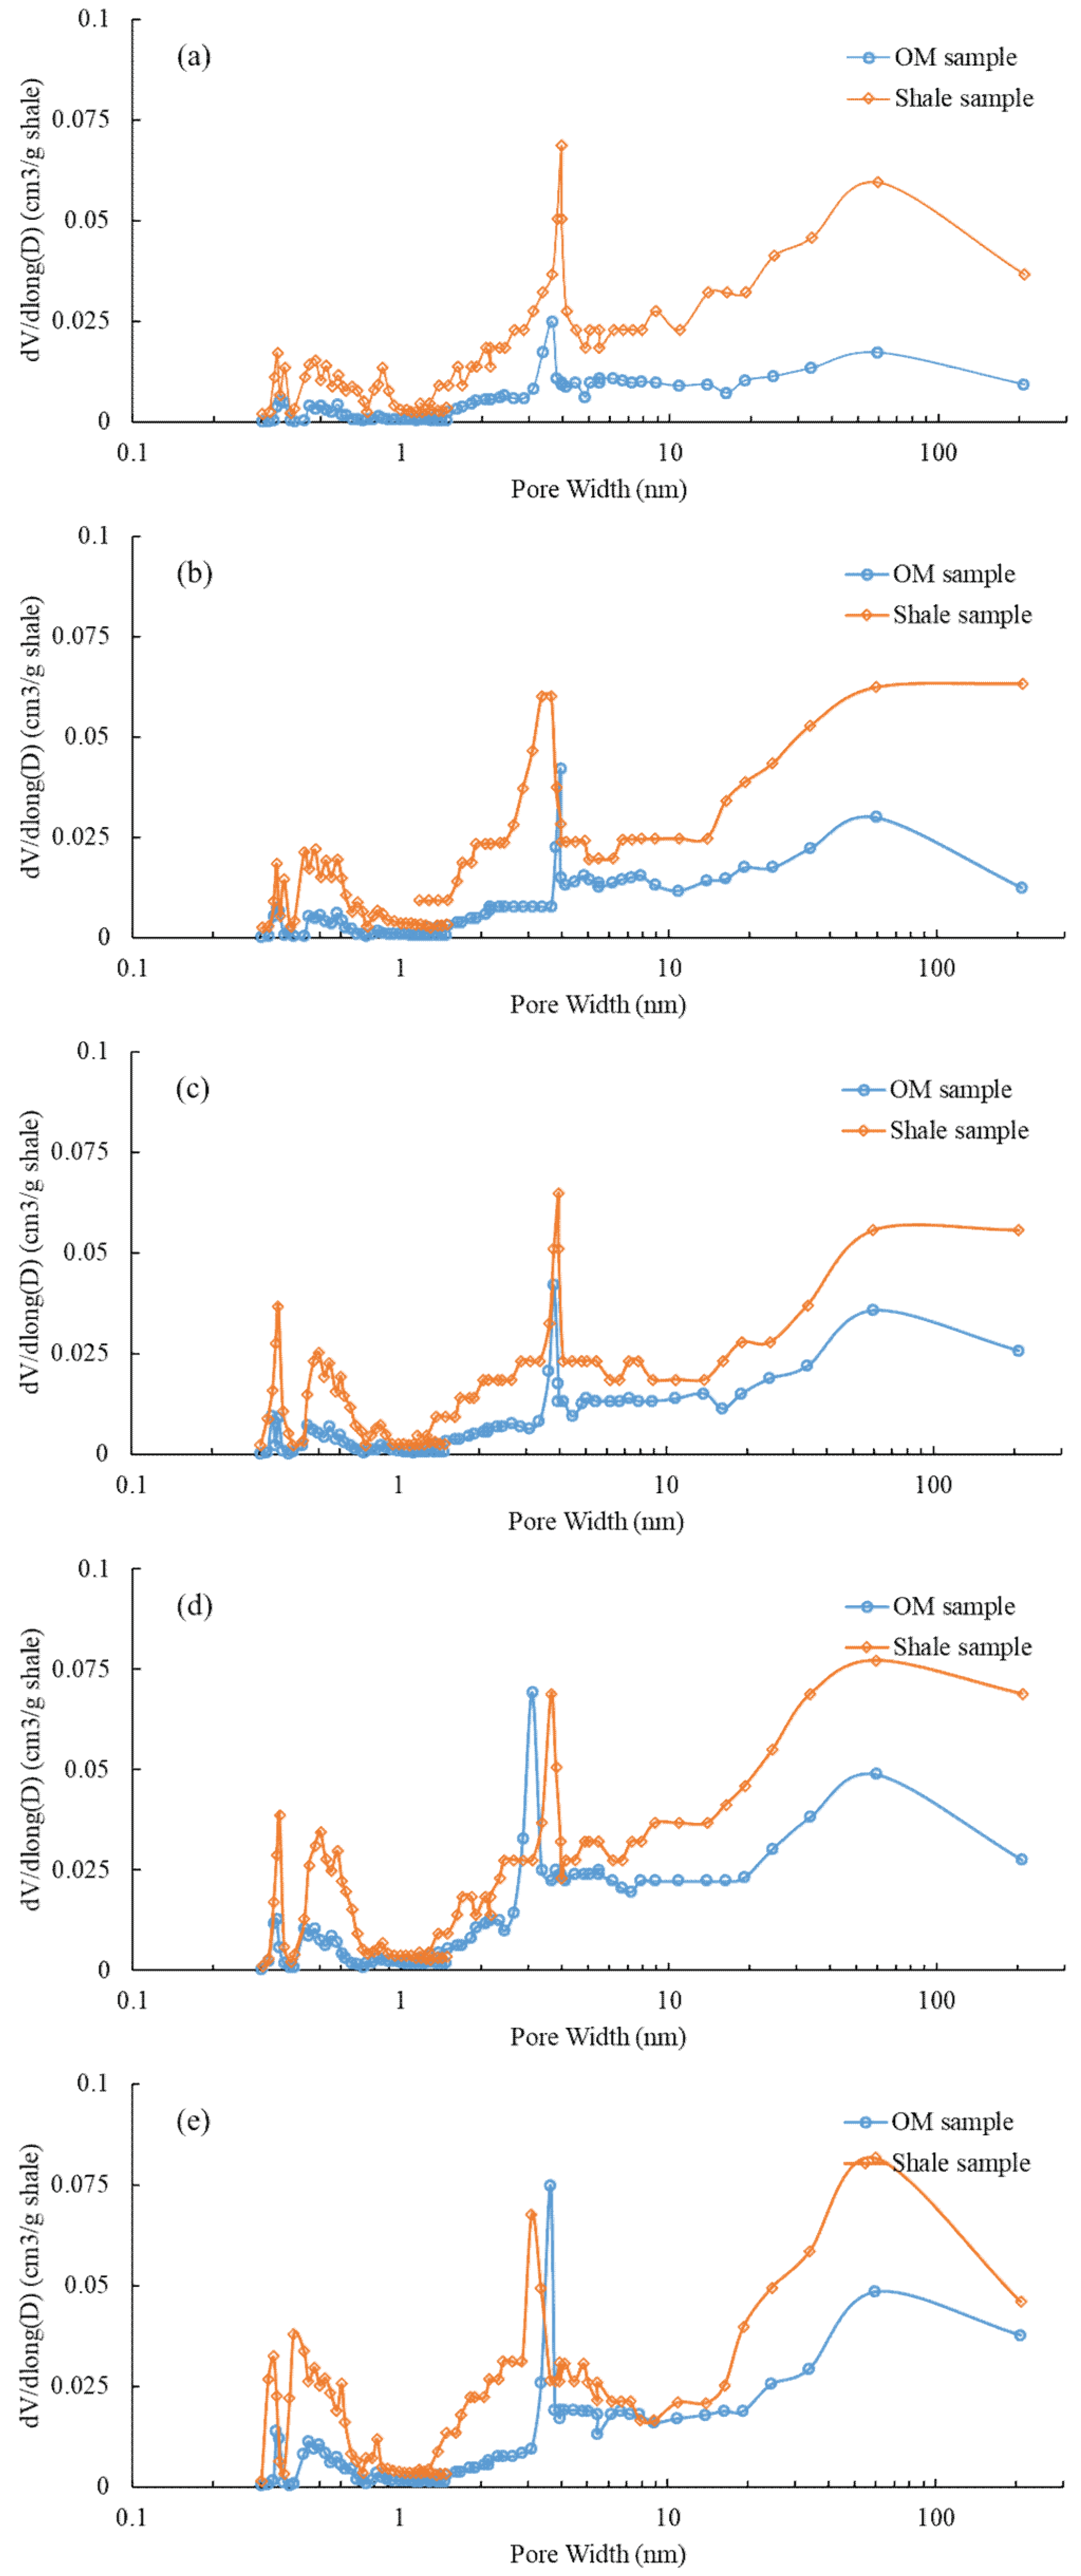
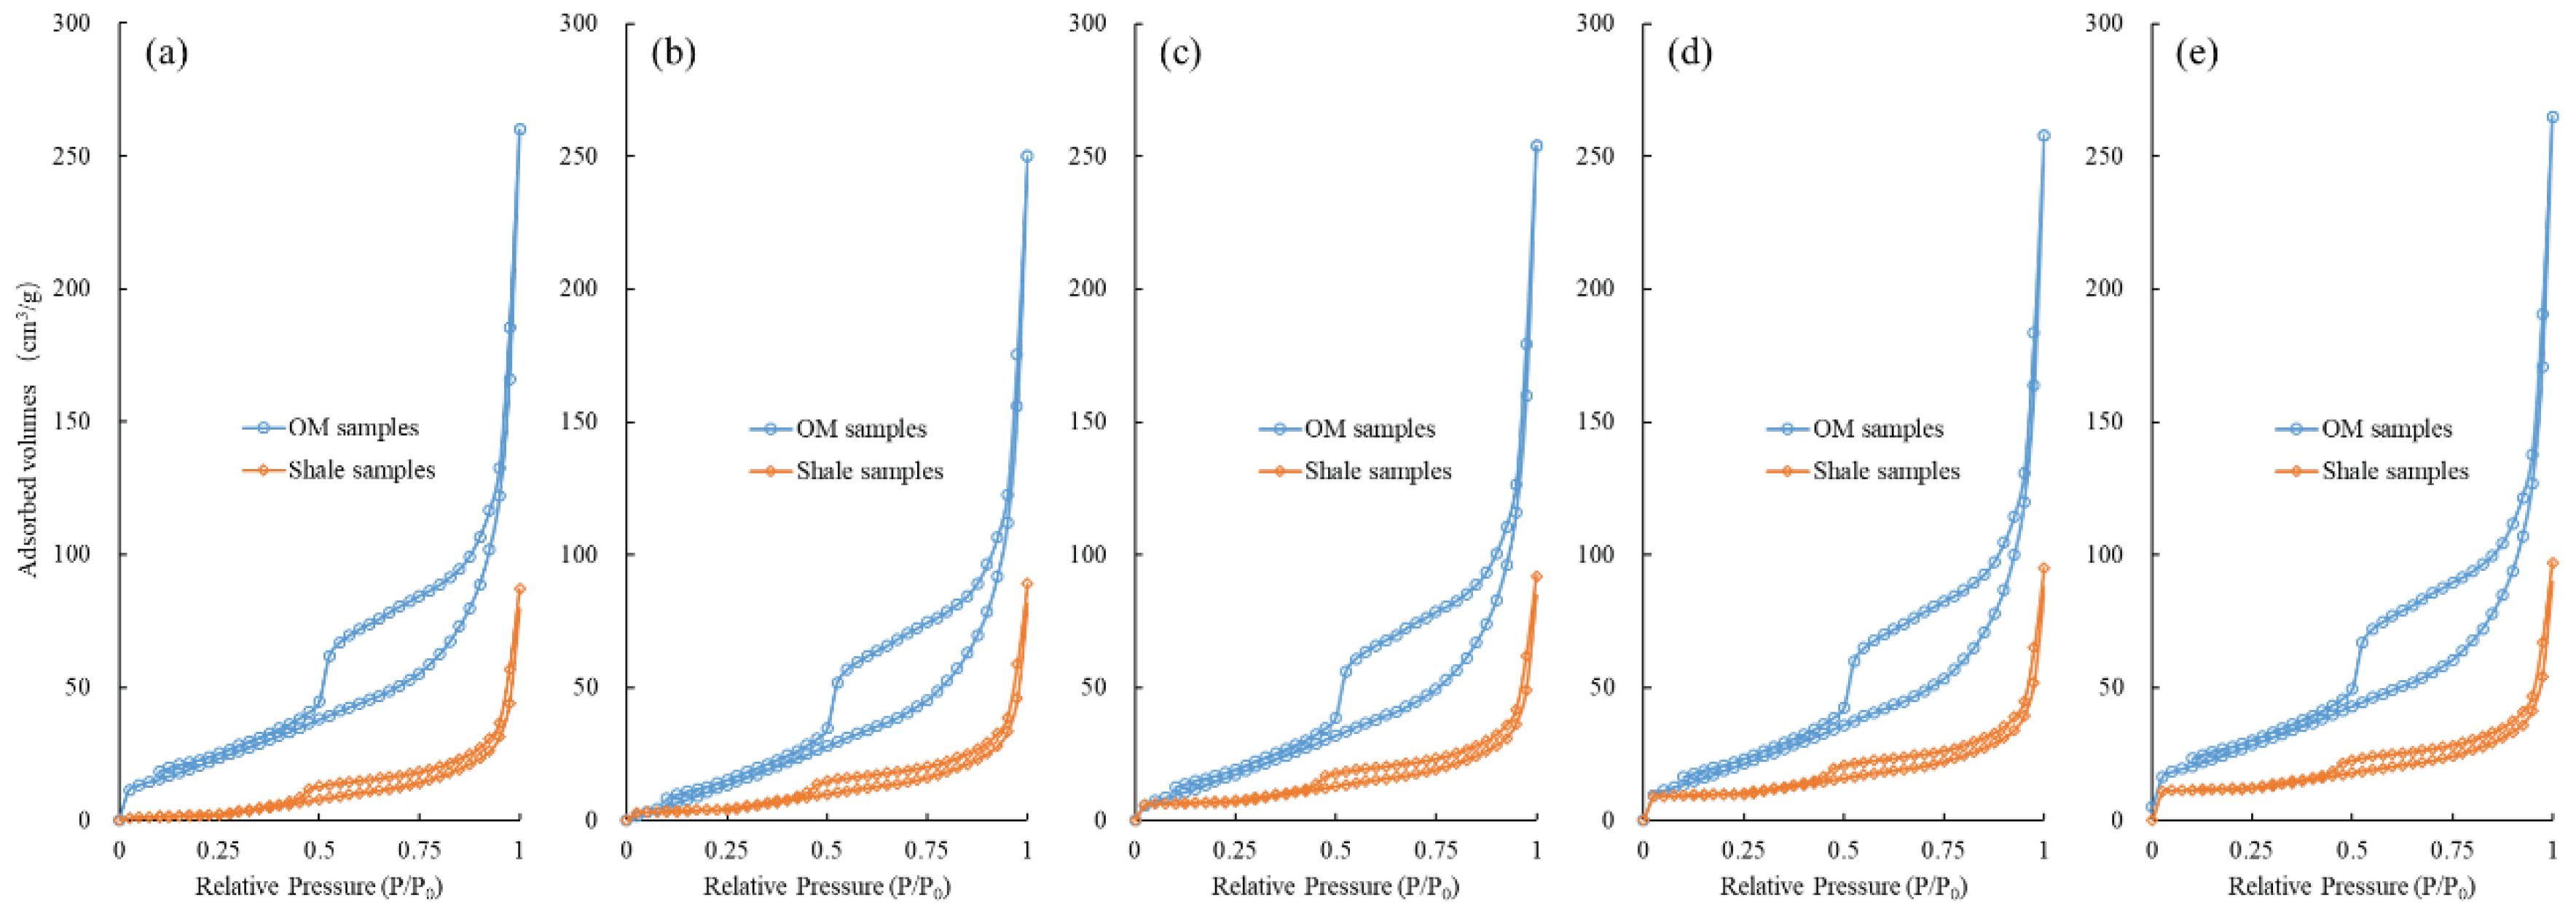
3.3.2. Low-Pressure N2 Physisorption

The low-pressure N2 physisorption isotherms of isolated OM and bulk shale samples are illustrated in Figure 4. Type IV isotherms can be identified [55]. These isotherms represent both mesopores and macropores in isolated OM and bulk shales. Isotherms of samples J4-3, J4-4 and J4-5 (TOC > 2.5 wt%) show adsorption at a low relative pressure, indicating the existence of micropores [13,40,58]. These characteristics are consistent with the low-pressure CO2 adsorption data. OM samples have more N2 adsorption volume than related bulk shale samples, indicating that OM is more porous than other fractions of the studied shale samples.
The pore structure parameters obtained from N2 adsorption isotherms are presented in Table 3. The average Brunauer-Emmett-Teller (BET) surface area of the isolated OM in this study was 79.16 m2/g (70.22–86.23 m2/g), which is nearly three times larger than that of the bulk shale, 28.86 m2/g (27.21–32.34 m2/g). The Barrett-Joyner-Halenda (BJH) pore volume of isolated OM varied from 35.43 to 40.80 cm3/g, with a mean value of 37.64 cm3/g. This was about three times greater than that of the bulk shale samples, which ranged from 8.2 to 14.27 cm3/g, with a mean value of 10.92 cm3/g. The pore volumes of the OM samples were normalized to bulk shale weight, and the normalized BJH pore volumes of OM ranged from 0.53–1.46 cm3/100g shale (Table 3).
The PSDs calculated using low-pressure N2 adsorption data of isolated OM and bulk shales are shown in Figure 5. The PSDs calculated from the desorption branch of isotherms created fake peaks at around 4 nm, due to the tensile strength effect [58]. Therefore, the adsorption branches were used to calculate PSD. The PSD spectra of the OM and bulk shale samples showed similar trends with an obvious unimodal nature of the curves within the pore size of about 3–5nm. This result is consistent with other results of Longmaxi shale from the Sichuan Basin [33,34,35,36,37,52,53,54].

4. Discussion

4.1. Comparison of PSDs between Isolated OM and Bulk Shales

The PSDs of isolated OM and bulk shale samples were compared to understand the different impacts of OM and inorganic minerals on pore characteristics in shale. The pore volumes of the OM samples were normalized to bulk shale weight by multiplying the TOC values of the bulk shale (Figure 6). The curves of dV/dlog(D) represented the derivative of the y-axis value, which was amplified for larger pores to better illustrate the characteristics [3]. The dV/dlog(D) spectra of both isolated OM and bulk shale showed multimodal characteristics in the pore sizes of 0.3–0.8 nm, 3–5 nm and 70–100 nm (Figure 6).
The PSDs of the isolated OM samples showed similar shapes and trends (Figure 6a–e), indicating that OM pores may have similar shapes and pore widths. The homogeneities of OM type and thermal maturity in the W-L shale samples in this work evidence the similar PSD curves of the isolated OM. In addition, the similar shapes of the PSD curves may also support the application of OM isolation from bulk shale for the characterization of OM pores [39,40,45].
The PSD curves of the bulk shale samples present slightly different trends according to diverse TOC contents. When the TOC content increased, the pore volumes of the bulk shale samples all increased (Figure 6). The divergences of the PSD curves between the isolated OM and their corresponding bulk shale samples may provide information for the different effects of OM and minerals on pore development in the W-L gas shales [40]. The smaller the divergence, the greater the proportion of OM pore to bulk shale. The larger the divergence, the greater the proportion of inorganic mineral host pore to bulk shale. As can be seen in Figure 6, with the TOC content of the bulk shale increasing, the divergences of the PSD curves of the isolated OM samples and their bulk shale samples gradually decreased (Figure 6). These results suggest that inorganic minerals host abundant pores and that mineral compositions may contribute mainly to the macropores in gas shale.

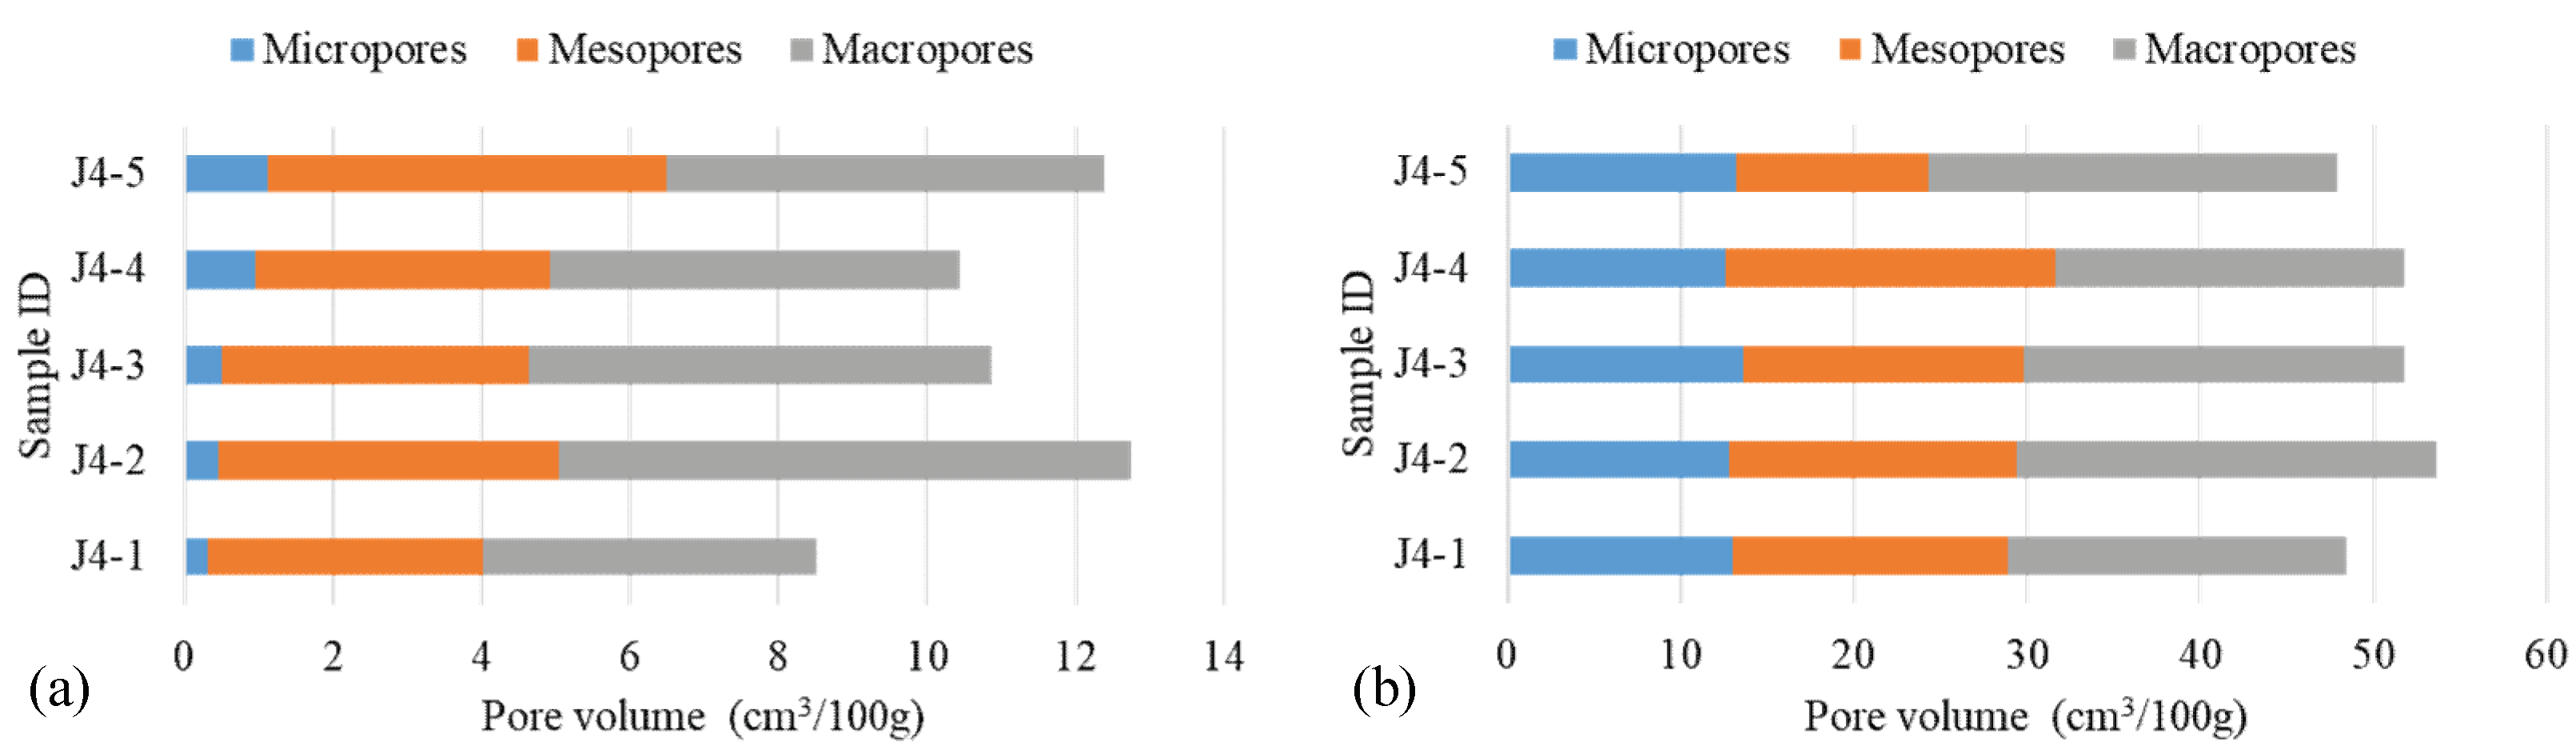
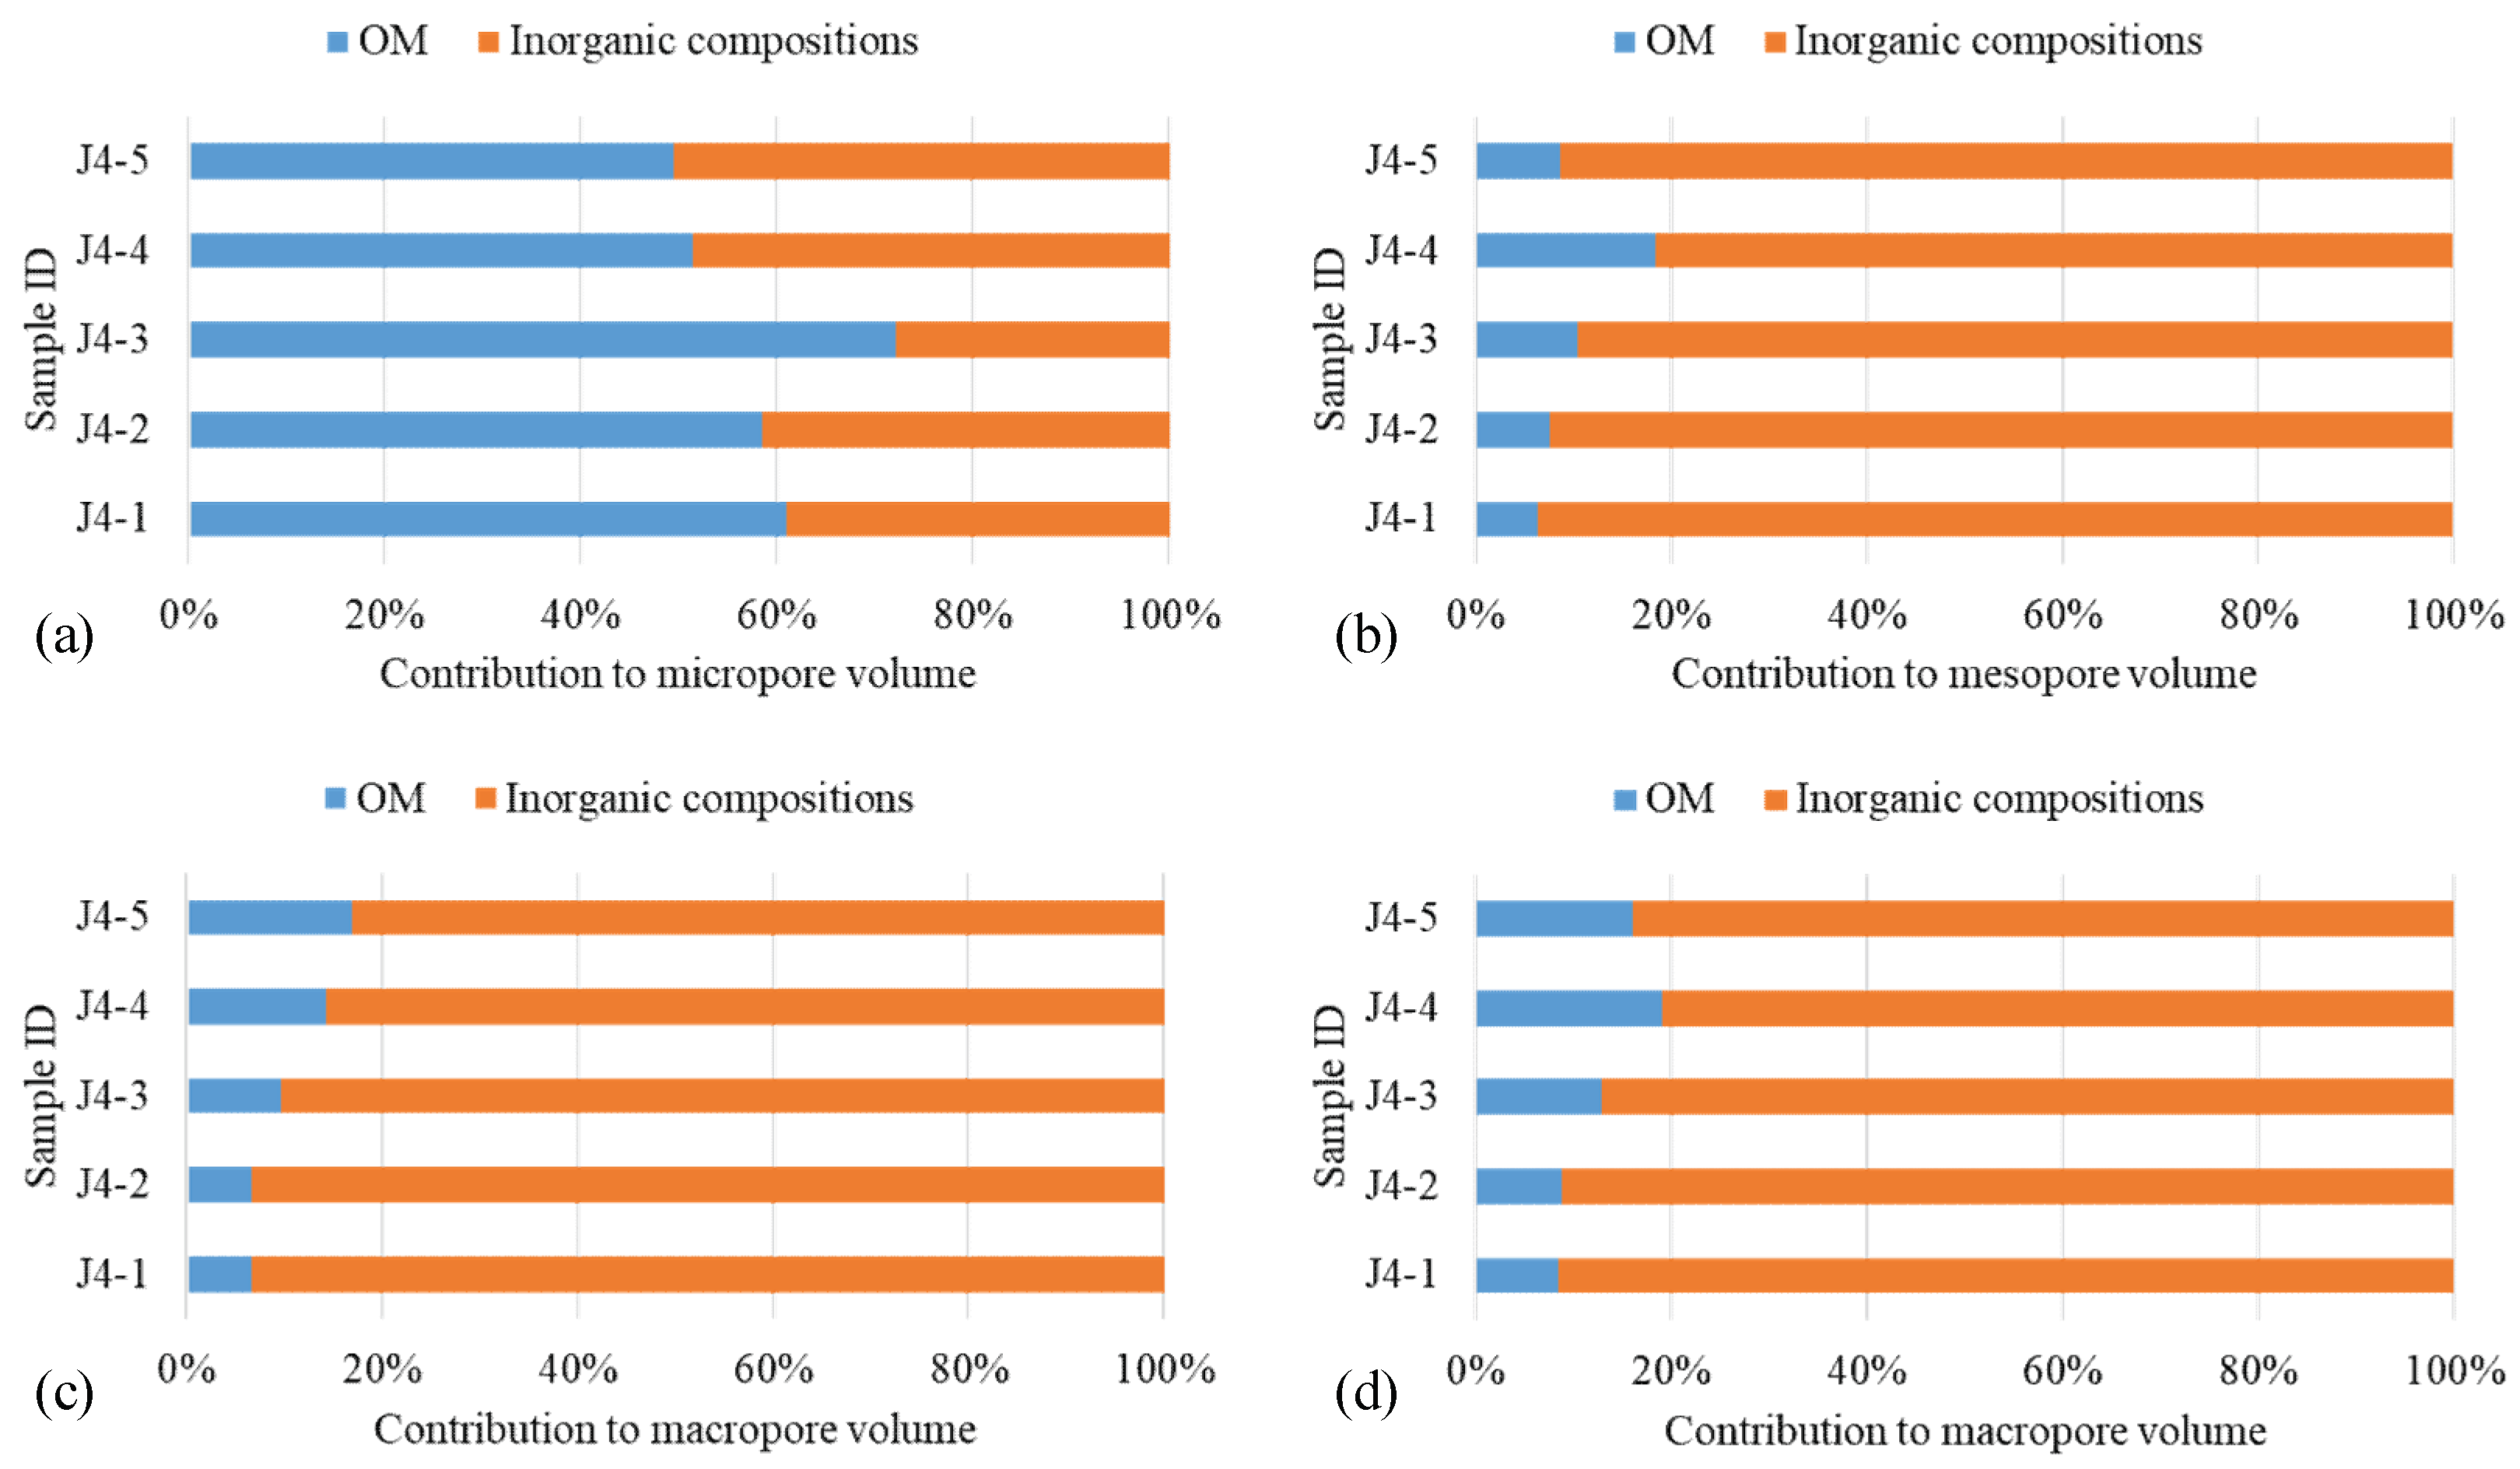
4.2. Contributions of OM Pore Volumes

The pore volumes of micropore (<2 nm), mesopore (2–50 nm) and macropore (>50 nm) calculated from LPGA data are shown in Table 4 and Figure 7. The pore volumes of the OM samples are much larger than those in the corresponding shale samples. The micropore volumes were calculated based on CO2 adsorption data. Mesopore and macropore volumes were obtained from N2 adsorption data. For the bulk shale samples, the micropore, mesopore, and macropore volumes varied in the ranges of 0.32–1.12, 3.7–5.38 and 4.5–7.71 cm3/100 g, respectively. For the OM samples, the pore volumes of the micropores varied from 12.6 to 13.6 cm3/100 g. The pore volumes of the mesopores and macropores were in the ranges 11.11–19.05 and 19.6–22.23 cm3/100 g, respectively (Figure 7). The gas (CO2 and N2) volumes, pore volumes, surface areas, PSD lines and porosities of the organic matter samples were all larger than those of the shale samples, which indicates that organic matter (OM) is more porous than other fractions of the studied shale samples. The results are consistent with the previous study of the Longmaxi shale by Tian et al. (2013), who proposed that OM had more micropores and fine mesopores than clay minerals in Longmaxi shale [23].
OM porosity is primarily controlled by organic richness and thermal maturity [13,16,59,60,61]. Previous studies reported that there were positive correlations between porosity and TOC content, suggesting that the TOC content is the primary control of the organic porosity [15,16,19,23,33,34,36,37,38]. When equivalent vitrinite reflectance values are in the range of 2.0–2.5%, the OM pores in shale commonly have large diameters, up to tens of hundreds of nanometers in FE-SEM images [16,49,59,60,61,62]. The eq. Ro values of the W-L shale samples in this work were in the range 2.35–2.60%, during the generation of shale gas, shale porosity significantly increased, which was supported by the FE-SEM images showing large OM pores in the samples (Figure 1a–b). In addition, the PSD spectra of the isolated OM samples showed the obvious unimodal nature of the curves within a pore size of about 0.3–0.8, 3–5 and 70–100 nm (Figure 6). The positive correlations were slight in many gas shales, which was probably due to the minor amount of OM in the shale samples [35,36,37].
The pore structure in gas shales may also be controlled by inorganic minerals. Numerous studies have proposed the importance of clay minerals for shale porosity [13,17,33,63] and pore structure [31,32,33]. In this study, the framework of clay flakes exerts an important influence on the formation of pores in clay minerals (Figure 1e–f). These pores are mostly developed in the pressure shadow of hard grains with compaction resistance [61]. Quartz can form rigid frameworks to prevent pores from collapsing so that the primary porosity is well preserved [2]. Highly-mature shale is commonly buried deep. Therefore, OM pores may be lost during compaction due to the soft and ductile nature of the OM [2,16,17]. FE-SEM images showed that the OM pores surrounded by rigid framework minerals were more easily preserved (Figure 1d–i). IntraP pores within calcite grain suggested that dissolution of carbonate minerals is a vital mechanism for the development of intraparticle pores in shale [2]. The pores related to mineral compositions resulted in more complicated and heterogeneous pore size characteristics of bulk shales [2,64].
The contributions of OM and inorganic composition to the total pore volumes were calculated by converting all pore volume per OM weight to per shale weight (cm3/100 g OM to cm3/100 g shale). The results are shown in Table 5 and Figure 8. The contributions of OM to the micropore volume ranged from 49.5% to 72.0%, with an average of 58.42%. The contributions of OM to mesopore volume were between 6.4% and 18.5%, and averaged 10.34%. The contributions of OM to macropore volume were in the range 6.5–16.8%, with an average of 10.72%. In total, OM pores accounted for 8.5–19.2% of the total volume of the W-L shale (Figure 8 a–c).
The contributions of OM pores to the total pore volumes (Figure 8d) were lower than those of the inorganic composition. This result is consistent with a previous study of the contribution of OM porosity to Longmaxi shale (31.3–62.6%) [23], but inconsistent with the corresponding contribution value of Barnett shale (95.2%). Tian et al. (2013) [23] calculated the contribution of OM pores in Longmaxi shale using the correlation of the TOC content versus porosity. In their calculation they assumed that the contribution of inorganic mineral host pores was constant. Loucks et al. (2012) [2] estimated the contribution of OM pores to the total pore volume of Barnett shale using FE-SEM images. However, SEM is not appropriate for pores smaller than 5 nm [17]. In addition, the spatial limitation and biased selection of the observed areas may not be able to catch representative images, resulting in the relatively high contribution of OM pores (95.2%). Therefore, this paper may provide more accurate results and new evidences of the contributions of OM and mineral compositions to the total pore volume of W-L shale.

5. Conclusions

The contributions of OM to the total pore volume of W-L shale from the Fuling gas field, Sichuan Basin were investigated through FE-SEM observation, OM isolation, and LPGA (CO2 and N2) analysis. Based on our results, the following conclusions can be drawn.
(1) Abundant OM pores and inorganic pores with various pore shapes and widths can be observed in FE-SEM images in the W-L shales.
(2) The LPGA adsorption volume, pore volume, and pore surface area of the OM samples were all larger than those of the bulk shale samples, indicating that OM is more porous than inorganic compositions in W-L shale.
(3) The average contribution of organic matter to the volume of micropore, mesopore and macropore were 58.42%, 10.34% and 10.72%, respectively. The contributions of OM to the total pore volume were lower than those of the inorganic compositions, probably due to the small weight ratio of OM in shale samples (1.5 wt%–4.2 wt%).
(4) OM has more micropores than inorganic compositions, which makes their PSD more complicated.

Author Contributions

Z.L. (Zhuo Li) and Z.J. designed the project; Z.L. (Zhikai Liang) performed the experiments and analyzed the data; Z.L. (Zhuo Li) wrote this paper and Z.J. corrected it; Z.L. (Zhikai Liang) and H.Y. modified the formats.

Funding

This study was supported by the by the National Natural Science Foundation of China (No. 41502123 and No. U1562215) and the National Major Project of China (No. 2017ZX05035-002 and No. 201605034-001).

Acknowledgments

We would like to thank the Jianghan Oil Field Company Branch, SINOPEC for providing the shale samples. We would also like to thank the Research Institute of Petroleum Exploration and Development, Petrochina for providing the laboratory for the OM isolation. We are grateful to the editors and reviewers for their constructive comments and suggestions.

Conflicts of Interest

The authors declare no conflicts of interest.

References

  1. Ross, D.; Bustin, R. The importance of shale composition and pore structure upon gas storage potential of shale gas reservoirs. Mar. Pet. Geol. 2009, 26, 916–927. [Google Scholar] [CrossRef]
  2. Loucks, R.; Reed, R.; Ruppel, S.; Hammes, U. Spectrum of pore types and networks in mudrocks and a descriptive classification for matrix-related mudrock pores. AAPG Bull. 2012, 96, 1071–1098. [Google Scholar] [CrossRef]
  3. Clarkson, C.R.; Solano, N.; Bustin, R.M.; Bustin, A.M.M.; Chalmers, G.R.L.; He, L.; Melnichenko, Y.B.; Radlinski, A.P.; Blach, T.P. Pore structure characterization of North American shale gas reservoirs: Using USANS/SANS, gas adsorption, and mercury intrusion. Fuel. 2013, 103, 606–616. [Google Scholar] [CrossRef]
  4. Sing, K.S.; Everett, D.H.; Haul, R.A.W.; Moscou, L.; Pierotti, R.A.; Rouquerol, J.; Siemieniewsha, T. Reporting physisorption data for gas/solid systems with special reference to the determination of surface area and porosity. Pure Appl.Chem. 1985, 57, 603–619. [Google Scholar] [CrossRef]
  5. Wu, K.L.; Chen, Z.X.; Li, X.F. Real gas transport through nanopores of varying cross-section type and shape in shale gas reservoirs. Chem. Eng. J. 2015, 281, 813–825. [Google Scholar] [CrossRef]
  6. Wu, K.L.; Chen, Z.X.; Li, X.F.; Xu, J.Z.; Li, J.; Wang, K. Flow behavior of gas confined in nanoporous shale at high pressure: Real gas effect. Fuel 2017, 205, 173–183. [Google Scholar] [CrossRef]
  7. Collell, J.; Galliero, G.; Vermorel, R.; Ungerer, P.; Yiannourakou, M.; Montel, F. Transport of multicomponent hydrocarbon mixtures in shale organic matter by molecular simulations. J. Phys. Chem. C 2015, 119, 22587–22595. [Google Scholar] [CrossRef]
  8. Lee, T.; Bocquet, L.; Coasne, B. Activated desorption at heterogeneous interfaces and long-time kinetics of hydrocarbon recovery from nanoporous media. Nat. Commun. 2016, 7, 11890. [Google Scholar] [CrossRef] [PubMed] [Green Version]
  9. Javadpour, F.; McClure, M.; Naraghi, M.E. Slip-corrected liquid permeability and its effect on hydraulic fracturing and fluid loss in shale. Fuel 2015, 160, 549–559. [Google Scholar] [CrossRef]
  10. Naraghi, M.E.; Javadpour, F. A stochastic permeability model for the shale-gas systems. Int. J. Coal Geol. 2015, 140, 111–124. [Google Scholar] [CrossRef]
  11. Naraghi, M.E.; Javadpour, F.; Ko, L.T. An object-based shale permeability model: Non-Darcy gas flow, sorption, and surface diffusion effects. Transp. Porous Med. 2018, 125, 23–39. [Google Scholar] [CrossRef]
  12. Berthonneau, J.; Obliger, A.; Valdenaire, P.L.; Grauby, O.; Ferry, D.; Chaudanson, D. Mesoscale structure, mechanics, and transport properties of source rocks’ organic pore networks. Proc. Nat. Acad. Sci. 2018, 115, 12365–12370. [Google Scholar] [CrossRef]
  13. Loucks, R.G.; Reed, R.M.; Ruppel, S.C.; Jarvie, D.M. Morphology, genesis, and distribution of nanometer-scale pores in siliceous mudstones of the Mississippian Barnett Shale. J. Sediment. Res. 2009, 79, 848–861. [Google Scholar] [CrossRef]
  14. Wang, P.; Jiang, Z.; Ji, W.; Zhang, C.; Yuan, Y.; Chen, L. Heterogeneity of intergranular, intraparticle and organic pores in Longmaxi shale in Sichuan basin, south China: Evidence from SEM digital images and fractal and multifractal geometries. Mar. Pet. Geol. 2016, 72, 122–138. [Google Scholar] [CrossRef]
  15. Milliken, K.L.; Esch, W.L.; Reed, R.M.; Zhang, T. Grain assemblages and strong diagenetic overprinting in siliceous mudrocks, Barnett Shale (Mississippian), Fort Worth Basin, Texas, U.S.A. AAPG Bull. 2012, 96, 1553–1578. [Google Scholar] [CrossRef]
  16. Milliken, K.L.; Rudnicki, M.; Awwiller, D.N.; Zhang, T. Organic matter-hosted pore system, Marcellus Formation (Devonian), Pennsylvania. AAPG Bull. 2013, 97, 177–200. [Google Scholar] [CrossRef]
  17. Chalmers, G.R.; Bustin, R.M.; Power, I.M. Characterization of gas shale pore systems by porosimetry, pycnometry, surface area, and field emission scanning electron microscopy/transmission electron microscopy image analyses: Examples from the Barnett, Woodford, Haynesville, Marcellus, and Doig units. AAPG Bull. 2012, 96, 1099–1119. [Google Scholar]
  18. Jiang, F.J.; Chen, J.; Xu, Z.; Wang, Z.F.; Hu, T.; Chen, D. Organic matter pore characterization in lacustrine shales with variable maturity using nanometer-scale resolution X-ray computed tomography. Energ. Fuel. 2017, 31, 2669–2680. [Google Scholar] [CrossRef]
  19. Mastalerz, M.; He, L.; Melnichenko, Y.B.; Rupp, J.A. Porosity of coal and shale: Insights from gas adsorption and SANS/USANS techniques. Energ. Fuel. 2012, 26, 5109–5120. [Google Scholar] [CrossRef]
  20. Sun, M.; Yu, B.; Hu, Q.; Zhang, Y.; Li, B.; Yang, R.; Melnichenkoe, Y.B.; Cheng, G. Pore characteristics of Longmaxi shale gas reservoir in the Northwest of Guizhou, China: Investigations using small-angle neutron scattering (SANS), helium pycnometry, and gas sorption isotherm. Int. J. Coal Geol. 2017, 171, 61–68. [Google Scholar] [CrossRef]
  21. Wang, G.; Ju, Y.; Yan, Z.; Li, Q. Pore structure characteristics of coal-bearing shale using fluid invasion methods: A case study in the Huainan–Huaibei Coalfield in China. Mar. Pet. Geol. 2015, 62, 1–13. [Google Scholar] [CrossRef]
  22. Labani, M.M.; Rezaee, R.; Saeedi, A.; Al Hinai, A. Evaluation of pore size spectrum of gas shale reservoirs using low pressure nitrogen adsorption, gas expansion and mercury porosimetry: A case study from the Perth and Canning Basins, Western Australia. J. Petrol. Sci. Eng. 2013, 112, 7–16. [Google Scholar] [CrossRef]
  23. Tian, H.; Pan, L.; Xiao, X.M.; Wilkins, R.W.T.; Meng, Z.P.; Huang, B.J. A preliminary study on the pore characterization of Lower Silurian black shales in the Chuandong Thrust Fold Belt, southwestern China using low pressure N2 adsorption and FE-SEM methods. Mar. Pet. Geol. 2013, 48, 8–19. [Google Scholar] [CrossRef]
  24. Sigal, R.F. Pore-size distributions for organic-shale-reservoir rocks from nuclear magnetic resonance spectra combined with adsorption measurements. SPE J. 2015, 20, 1–7. [Google Scholar] [CrossRef]
  25. Fleury, M.; Romero-Sarmiento, M. Characterization of shales using T1–T2 NMR maps. J. Petrol. Sci. Eng. 2016, 137, 55–62. [Google Scholar] [CrossRef]
  26. Meng, M.; Ge, H.; Ji, W.; Shen, Y.; Shuai, S. Monitor the process of shale spontaneous imbibition in co-current and counter-current displacing gas by using low field nuclear magnetic resonance method. J. Nat. Gas. Sci. Eng. 2015, 27, 336–345. [Google Scholar] [CrossRef]
  27. Zhang, P.; Lu, S.; Li, J.; Chen, C.; Xue, H.; Zhang, J. Petrophysical characterization of oil-bearing shales by low-field nuclear magnetic resonance (NMR). Mar. Petrol. Geol. 2018, 9, 775–785. [Google Scholar] [CrossRef]
  28. Li, A.; Ding, W.; Jiu, K.; Wang, Z.; Wang, R.; He, J. Investigation of the pore structures and fractal characteristics of marine shale reservoirs using NMR experiments and image analyses: A case study of the Lower Cambrian Niutitang Formation in northern Guizhou Province, South China. Mar. Pet. Geol. 2018, 89, 530–540. [Google Scholar] [CrossRef]
  29. Zhou, L.; Kang, Z. Fractal characterization of pores in shales using NMR: A case study from the Lower Cambrian Niutitang Formation in the Middle Yangtze Platform, Southwest China. J. Nat. Gas. Sci. Eng. 2016, 35, 860–872. [Google Scholar] [CrossRef]
  30. Wang, Y.; Pu, J.; Wang, L.H.; Wang, J.Q.; Jiang, Z.; Song, F.Y. Characterization of typical 3D pore networks of Jiulaodong formation shale using nano-transmission X-ray microscopy. Fuel 2016, 170, 84–91. [Google Scholar] [CrossRef]
  31. Tang, X.L.; Jiang, Z.X.; Jiang, S.; Li, Z. Heterogeneous nanoporosity of the Silurian Longmaxi Formation shale gas reservoir in the Sichuan Basin using the QEMSCAN, FIB-SEM, and nano-CT methods. Mar. Petrol. Geol. 2016, 78, 99–109. [Google Scholar] [CrossRef]
  32. Wang, P.F.; Jiang, Z.X.; Chen, L.; Yin, L.S.; Li, Z.; Zhang, C.; Tang, X.L.; Wang, G.Z. Pore structure characterization for the Longmaxi and Niutitang shales in the Upper Yangtze Platform, South China: Evidence from focused ion beam-He ion microscopy, nano-computerized tomography and gas adsorption analysis. Mar. Petrol. Geol. 2016, 77, 1323–1337. [Google Scholar] [CrossRef]
  33. Yang, F.; Ning, Z.F.; Wang, Q.; Zhang, R.; Krooss, B.M. Pore structure characteristics of lower Silurian shales in the southern Sichuan Basin, China: Insights to pore development and gas storage mechanism. Int. J. Coal Geol. 2016, 156, 12–24. [Google Scholar] [CrossRef]
  34. Shao, X.; Pang, X.; Li, Q.; Wang, P.; Di, C.; Shen, W. Pore structure and fractal characteristics of organic-rich shales: A case study of the lower Silurian Longmaxi shales in the Sichuan basin, SW china. Mar. Pet. Geol. 2017, 80, 192–202. [Google Scholar] [CrossRef]
  35. Jiang, Z.X.; Tang, X.H.; Cheng, L.J.; Li, Z.; Zhang, Y.Y.; Bai, Y.Q. Characterization and origin of the Silurian Wufeng-Longmaxi Formation shale multiscale heterogeneity in southeastern Sichuan Basin, China. Interpretation 2015, 3, 61–74. [Google Scholar] [CrossRef]
  36. Yang, R.; He, S.; Yi, J.; Hu, Q.H. Nano-scale pore structure and fractal dimension of organic-rich Wufeng-Longmaxi shale from Jiaoshiba area, Sichuan Basin: Investigations using FE-SEM, gas adsorption and helium pycnometry. Mar. Petrol. Geol. 2016, 70, 27–45. [Google Scholar] [CrossRef]
  37. Chen, L.; Jiang, Z.X.; Liu, K.Y.; Tan, J.; Gao, F.L.; Wang, P.F. Pore structure characterization for organic-rich Lower Silurian shale in the Upper Yangtze Platform, South China: A possible mechanism for pore development. J. Nat. Gas. Sci. Eng. 2017, 46, 1–15. [Google Scholar] [CrossRef]
  38. Yang, F.; Ning, Z.; Wang, Q.; Liu, H.Q. Pore structure of Cambrian shales from the Sichuan Basin in China and implications to gas storage. Mar. Petrol. Geol. 2016, 70, 14–26. [Google Scholar] [CrossRef]
  39. Rexer, T.F.; Mathia, E.J.; Aplin, A.C.; Thomas, K.M. High-pressure methane adsorption and characterization of pores in Posidonia shales and isolated kerogens. Energy Fuels 2014, 28, 2886–2901. [Google Scholar] [CrossRef]
  40. Ji, W.M.; Song, Y.; Rui, Z.; Meng, M.M.; Huang, H.X. Pore characterization of isolated organic matter from high matured gas shale reservoir. Int. J. Coal. Geol. 2017, 174, 31–40. [Google Scholar] [CrossRef]
  41. Han, H.; Pang, P.; Li, Z.L.; Shi, P.T.; Guo, C.; Liu, Y.; Chen, S.J.; Lu, J.G.; Gao, Y. Controls of organic and inorganic compositions on pore structure of lacustrine shales of Chang 7 member from Triassic Yanchang Formation in the Ordos Basin, China. Mar. Petrol. Geol. 2019, 100, 270–284. [Google Scholar] [CrossRef]
  42. Ji, W.M.; Song, Y.; Jiang, Z.X.; Chen, L.; Li, Z.; Yang, X.; Meng, M.M. Estimation of marine shale methane adsorption capacity based on experimental investigations of Lower Silurian Longmaxi formation in the Upper Yangtze Platform, south China. Mar. Pet. Geol. 2015, 68, 94–106. [Google Scholar] [CrossRef]
  43. Jarvie, D.M.; Hill, R.J.; Ruble, T.E.; Pollastro, R.M. Unconventional shale-gas systems: The Mississippian Barnett Shale of northcentral Texas as one model for thermogenic shale-gas assessment. AAPG Bull. 2007, 91, 475–499. [Google Scholar] [CrossRef]
  44. Zhang, T.W.; Ellis, G.S.; Ruppel, S.C.; Milliken, K.; Yang, R.S. Effect of organicmatter type and thermal maturity on methane adsorption in shale-gas systems. Org. Geochem. 2012, 47, 120–131. [Google Scholar] [CrossRef]
  45. Gasparik, M.; Bertier, P.; Gensterblum, Y.; Ghanizadeh, A.; Krooss, B.M.; Littke, R. Geological controls on the methane storage capacity in organic-rich shales. Int. J. Coal. Geol. 2014, 123, 34–51. [Google Scholar] [CrossRef]
  46. Jiang, F.J.; Chen, D.; Wang, Z.F.; Xu, Z.Y.; Chen, J.; Liu, L. Pore characteristic analysis of a lacustrine shale: A case study in the Ordos Basin, NW China. Mar. Petrol. Geol. 2016, 73, 554–571. [Google Scholar] [CrossRef]
  47. Curtis, M.E.; Ambrose, R.J.; Sondergeld, C.H. Structural Characterization of Gas Shales on the Micro-and Nano-Scales. In Proceedings of the Canadian Unconventional Resources and International Petroleum Conference, Calgary, Alberta, Canada, 19–21 October 2010. [Google Scholar]
  48. Sondergeld, C.H.; Ambrose, R.J.; Rai, C.S.; Moncrieff, J. Microstructural studies of gas shales. SPE J. 2010, 2, 23–25. [Google Scholar]
  49. Curtis, M.E.; Cardott, B.J.; Sondergeld, C.H.; Rai, C.S. Development of organic porosity in the Woodford shale with increasing thermal maturity. Int. J. Coal. Geol. 2012, 103, 26–31. [Google Scholar] [CrossRef]
  50. Ma, Y.; Zhong, N.N.; Li, D.H.; Pan, Z.J.; Liu, K.Y. Organic matter/clay mineral intergranular pores in the Lower Cambrian Lujiaping Shale in the north-eastern part of the upper Yangtze area, China: A possible microscopic mechanism for gas preservation. Int. J. Coal Geol. 2015, 137, 38–54. [Google Scholar] [CrossRef]
  51. Chalmers, G.R.L.; Bustin, R.M. A multidisciplinary approach in determining the maceral (kerogen type) and mineralogical composition of Upper Cretaceous Eagle Ford Formation: Impact on pore development and pore size distribution. Int. J. Coal Geol. 2017, 171, 93–110. [Google Scholar] [CrossRef]
  52. Sun, M.D.; Yu, B.S.; Hu, Q.H.; Yang, R.; Zhang, Y.F.; Li, B. Pore connectivity and tracer migration of typical shales in south China. Fuel 2017, 203, 32–46. [Google Scholar] [CrossRef]
  53. Zhang, H.; Zhu, Y.; Wang, Y.; Kang, W.; Chen, S.B. Comparison of organic matter occurrence and organic nanopore structure within marine and terrestrial shale. J. Nat. Gas. Sci. Eng. 2016, 32, 356–363. [Google Scholar] [CrossRef]
  54. Liang, C.; Jiang, Z.X.; Yang, Y.T.; Wei, X.J. Shale lithofacies and reservoir space of the Wufeng–Longmaxi formation, Sichuan Basin, China. Pet. Explor. Dev. 2012, 39, 736–743. [Google Scholar] [CrossRef]
  55. Han, H.; Cao, Y.; Chen, S.; Lu, J.G.; Huang, C.X.; Zhu, H.H. Influence of particle size on gas-adsorption experiments of shales: An example from a Longmaxi Shale sample from the Sichuan Basin, China. Fuel 2016, 186, 750–757. [Google Scholar] [CrossRef]
  56. Wei, M.M.; Xiong, Y.Q.; Zhang, L.; Li, J.H.; Peng, P.A. The effect of sample particle size on the determination of pore structure parameters in shales. Int. J. Coal Geol. 2016, 163, 177–185. [Google Scholar] [CrossRef] [Green Version]
  57. Ufer, K.; Stanjek, H.; Roth, G.; Dohrmann, R.; Kleeberg, R.; Kaufhold, S. Quantitative phase analysis of bentonites by the Rietveld method. Clays Clay Miner. 2008, 56, 272–282. [Google Scholar] [CrossRef]
  58. Rouquerol, J.; Avnir, D.; Fairbridge, C.W.; Everett, D.H.; Haynes, J.H.; Pernicone, N.; Ramsay, J.D.F.; Sing, K.S.W.; Unger, K.K. Recommendations for the characterization of porous solids (Technical report). Pure Appl. Chem. 1994, 66, 1739–1758. [Google Scholar] [CrossRef]
  59. Mastalerz, M.; Schimmelmann, A.; Drobniak, A.; Chen, Y.Y. Porosity of Devonian and Mississippian New Albany Shale across a maturation gradient: Insights from organic petrology, gas adsorption, and mercury intrusion. AAPG Bull. 2013, 97, 1621–1643. [Google Scholar] [CrossRef]
  60. Schieber, J. Common themes in the formation and preservation of intrinsic porosity in shales and mudstones: Illustrated with examples from across the Phanerozoic. SPE J. 2010, 2, 23–25. [Google Scholar]
  61. Pommer, M.; Milliken, K. Pore types and pore-size distributions across thermal maturity, Eagle Ford Formation, southern Texas. AAPG Bull. 2015, 99, 1713–1744. [Google Scholar] [CrossRef]
  62. Wang, G.; Ju, Y.; Han, K. Early Paleozoic shale properties and gas potential evaluation in Xiuwu basin, western lower Yangtze platform. J. Nat. Gas. Sci. Eng. 2015, 22, 489–497. [Google Scholar] [CrossRef]
  63. Slatt, R.M.; O’Brien, N.R. Pore types in the Barnett and Woodford gas shales: Contribution to understanding gas storage and migration pathways in fine-grained rocks. AAPG Bull. 2011, 95, 2017–2030. [Google Scholar] [CrossRef]
  64. Kuila, U.; McCarty, D.K.; Derkowski, A.; Fischer, T.B.; Topór, T.; Prasad, M. Nano-scale texture and porosity of organic matter and clay minerals in organic-rich mudrocks. Fuel 2014, 135, 359–373. [Google Scholar] [CrossRef] [Green Version]
Figure 1. Example of pores in W-L shale sample J4-5. (a)–(b) Large organic matter (OM) particles with elliptical bubbles and irregular polygon shapes; (c) complex OM pores within the illite interlayers; (d)–(f) interP pores between quartz, clay minerals, and calcite grain rims; (g)–(h) quartz and pyrite framboids with inter crystal pores filled with OM and with OM pores; (i) intraP pores observed within calcite grain.
Energies 12 01207 g001
Figure 2. Comparison of low-pressure CO2 adsorption isotherms of (a) isolated OM samples and (b) bulk shale samples.
Energies 12 01207 g002
Figure 3. Pore volumes (a)–(b) distribution derived from low-pressure CO2 adsorption isotherms for (a) OM and (b) bulk shale samples.
Energies 12 01207 g003
Figure 4. Comparison of low-pressure N2 adsorption isotherms of isolated OM and bulk shale samples. From left to right, TOC content of the samples increased; (a) J4-1 sample; (b) J4-2 sample; (c) J4-3 sample; (d) J4-4 sample; (e) J4-5 sample.
Energies 12 01207 g004
Figure 5. Pore volumes (a)–(b) distribution derived from low-pressure CO2 adsorption isotherms for (a) OM and (b) bulk shale samples.
Energies 12 01207 g005
Figure 6. Comparison of pore size distribution between isolated OM and its corresponding bulk shale sample; (a) J4-1 sample; (b) J4-2 sample; (c) J4-3 sample; (d) J4-4 sample; (e) J4-5 sample.
Energies 12 01207 g006
Figure 7. Comparison pore proportions in (a) bulk shales and(b) isolated OM samples.
Energies 12 01207 g007
Figure 8. Contributions of OM and inorganic compositions to (a) micropore volume, (b) mesopore volume, (c) macropore volume and (d) and total pore volume of W-L shale samples.
Energies 12 01207 g008
Table 1. Geochemical characteristics and mineral compositions of Wufeng-Longmaxi (W-L) shale samples.
Sample IDDepth (m)TOC (%)Ro (%)Quartz (%)Feldspar (%)Calcite (%)Dolomite (%)Clay mineral (%)Pyrite (%)
J4-12282.51.52.4935.610.57.11.341.13.1
J4-22354.62.12.5237.313.65.41.237.62.3
J4-32368.12.72.5341.28.83.20.538.33.3
J4-42386.43.22.5539.211.25.11.338.43.2
J4-52408.44.22.651.17.10.10.138.52.1
Table 2. Pore structure parameters of isolated OM and shale from low-pressure CO2 adsorption data.
Sample IDBulk ShalesIsolated OM
DFT Surface Area (m2/g)DFT Pore Volume (cm3/100g shale)DFT Surface Area (m2/g)DFT Pore Volume (cm3/100g)DFT Pore Volume (cm3/100g shale)
J4-112.680.3232.6113.00.19
J4-215.920.4631.1312.80.26
J4-316.880.5133.3413.60.36
J4-424.120.9530.9812.60.40
J4-528.951.1234.8513.20.55
Table 3. Pore structure parameters of isolated OM and shale from low-pressure N2 adsorption data.
Sample IDBulk ShalesIsolated OM
BET Surface Area (m2/g)BJH Pore volume (cm3/100 g)Average Pore Size (nm)BET Surface Area (m2/g)BJH Pore Volume (cm3/100 g)BJH Pore Volume (cm3/100 g shale)Average Pore Size (nm)
J4-127.218.29.1686.2335.430.5317.78
J4-228.2012.2911.4483.2840.800.8619.72
J4-329.3310.359.5980.2138.131.0319.75
J4-427.249.4811.4875.8739.171.2522.02
J4-532.3411.2714.1570.2234.671.4621.72
Table 4. Pore volumes of isolated OM and shale obtained from low pressure gas (CO2 and N2) adsorption (LPGA) data.
Sample IDBulk Shales (cm3/100 g)Isolated OM (cm3/100 g)
MicroporesMesoporesMacroporesTotalMicroporesMesoporesMacroporesTotal
J4-10.323.704.508.5213.0415.8319.6048.43
J4-20.464.587.7112.7512.8016.5724.2353.60
J4-30.514.146.2110.8613.6216.1721.9651.73
J4-40.953.985.5010.4312.6119.0520.1251.77
J4-51.125.385.8912.3913.2111.1123.5647.87
Table 5. Contributions of OM and inorganic minerals to the total pore volume of the W-L shales.
Sample IDContributions to the Total Volume of Shales
OMInorganic Compositions
Micropores (%)Mesopores (%)Macropores (%)Total (%)Micropores (%)Mesopores (%)Macropores (%)Total (%)
J4-160.96.46.58.539.193.693.591.5
J4-258.47.66.68.841.692.493.491.2
J4-372.010.59.512.928.089.590.587.1
J4-451.318.514.219.248.781.585.880.8
J4-549.58.716.816.250.591.383.283.8

