Article

Corrective Control by Line Switching for Relieving Voltage Violations Based on A Three-Stage Methodology

1
School of Electrical and Information Engineering, Tianjin University, Tianjin 300072, China
2
State Key Laboratory of Power Grid Security and Energy Conservation, China Electric Power Research Institute, Haidian District, Beijing 100192, China
3
Department of Power Supply Technology Center, State Grid Gansu Electric Power Research Institute, Lanzhou 730070, Gansu Province, China
*
Author to whom correspondence should be addressed.
Energies 2019, 12(7), 1206; https://doi.org/10.3390/en12071206
Submission received: 13 February 2019 / Revised: 21 March 2019 / Accepted: 26 March 2019 / Published: 28 March 2019
(This article belongs to the Special Issue Intelligent Control in Energy Systems)

Abstract

:
An online line switching methodology to relieve voltage violations is proposed. This novel online methodology is based on a three-stage strategy, including screening, ranking, and detailed analysis and assessment stages for high speed (online application) and accuracy. The proposed online methodology performs the tasks of rapidly identifying effective candidate lines, ranking the effective candidates, performing detailed analysis of the top ranked candidates, and supplying a set of solutions for the power system. The post-switching power systems, after executing the proposed line switching action, meet the operational and engineering constraints. The results provided by the exact Alternating Current (AC) power flow are used as a benchmark to compare the speed and accuracy of the proposed three-stage methodology. One feature of the methodology is that it can provide a set of high-quality switching solutions from which operators may choose a preferred solution. The effectiveness of the proposed online line switching methodology in providing single-line switching and multiple-line switching solutions to relieve voltage violations is evaluated on the IEEE 39-bus and 2746-bus power system. The CPU time of the proposed methodology compared with that under AC power flow constitutes a speed-up of 9905.32% on a 2746-bus power system, showing good potential for online application in a large-scale power system.

1. Introduction

It is widely known that the modern power grid is a large-scale and extremely complex interconnected network. Fulfilling the demand for electric power is essential from economic, protective, and societal standpoints [1,2]. Unfortunately, it is not easy to keep the grid running at a stable point all the time: voltage variation problems seriously affect the stable operation of the system.
Line switching is a cost-effective measure to improve the operational stability of power systems. There are several instances where line switching is employed for corrective applications by the industry today. One of the line switching operations mentioned in the Pennsylvania-New Jersey-Maryland Interconnection (PJM) transmission operations manual is described below: Loadings on the Sunnyside–Warner–Torrey 138 kV for the loss of the S. Canton–Torrey 138 kV can be controlled by opening the S.E. Canton–Sunnyside 138 kV line at Sunnyside via supervisory control. Contingency loadings need to be watched on the SE Canton–Canton Central 138 kV and S. Canton–Torrey 138 kV circuits when this procedure is implemented [3].
Hedman [4] and Rolim [5] presented the development and applications of line switching. Compared with other methods, line switching has more advantages in terms of cost reduction, fast speed, and accuracy improvement [6,7]. Relevant work has illustrated the effectiveness of line switching in relieving line overloads [8,9,10,11,12,13,14,15], reducing transmission losses and generation cost [16,17,18,19,20], assisting in load recovery, improving voltage profiles, relieving system congestion, and enhancing system reliability [21,22,23,24,25,26].
Guo [27] proposed that for extra-high-voltage power systems, line switching can be used to relieve voltage violations at low-load periods. In order to avoid computational intractability, a basic mixed-integer nonlinear program formula is transformed into a mixed-integer linear program in this reference. Based on fast decoupled power flow with finite iterations, a new algorithm was proposed by Shao [28] to find the best line and bus bar switching action to relieve overloads and voltage violations caused by system faults. Although the algorithm developed in references [27,28] can relieve the problem of voltage violation, it is very time-consuming and difficult to implement in a practical power system.
However, the effectiveness of line switching depends on the selection of lines to be switched off. It is well recognized that linear methods are usually satisfactory in speed but not in accuracy, while nonlinear methods are usually accurate but can be slow [29]. In other words, by simplifying the size of the network that linear methods perform linear algebra operations, the speed is improved but the accuracy is reduced. In order to further improve the speed and accuracy, a novel online line switching methodology is proposed in this paper to relieve voltage violations. Instead of dealing with the combinatorial character of optimal transmission switching (OTS), the proposed methodology combines linear and nonlinear methods to achieve the goal of online application. The proposed methodology employs a three-stage strategy combining linear and nonlinear methods: (i) a screening stage using a linear method, (ii) a ranking stage using a PQ decoupled method, and (iii) a detailed analysis stage which utilizes AC power flow.
The task of the screening stage is to quickly select effective lines from the list of credible candidate lines that can relieve voltage violations after switching. The effective candidates selected by the screening stage are ranked in order in the ranking stage. The detailed analysis stage performs a detailed evaluation of the several top-ranked lines of stage (ii) and provides multiple high-quality solutions that can relieve voltage violations, while the post-switching system satisfies operational and engineering constraints.
The innovation of the proposed methodology in this paper is mainly reflected in the following aspects:
(1)
It can find the “best” line switching scheme to relieve bus voltage violations for the power system.
(2)
It can provide a variety of high-quality line switching schemes for multiple-line switching, from which the system operator can select a “desired” one.
(3)
It shows fast speed, which means that it is suitable for determining switching lines of large-scale power systems in an online environment.
The effectiveness of the proposed online switching methodology is evaluated on the IEEE 39-bus and 2746-bus power systems.

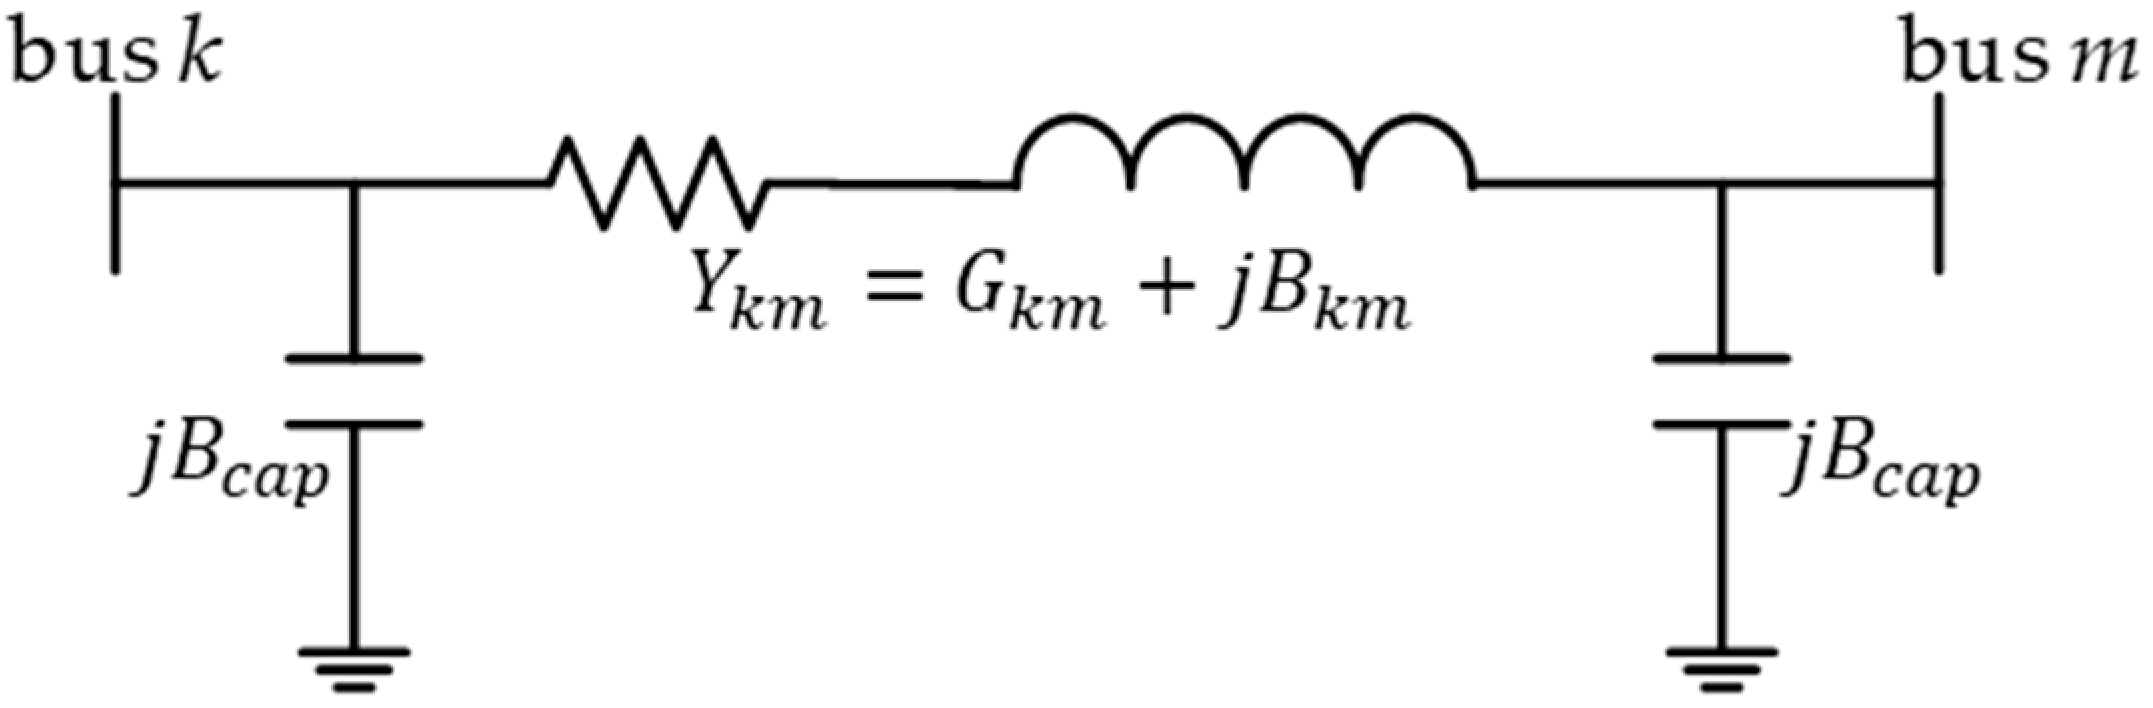
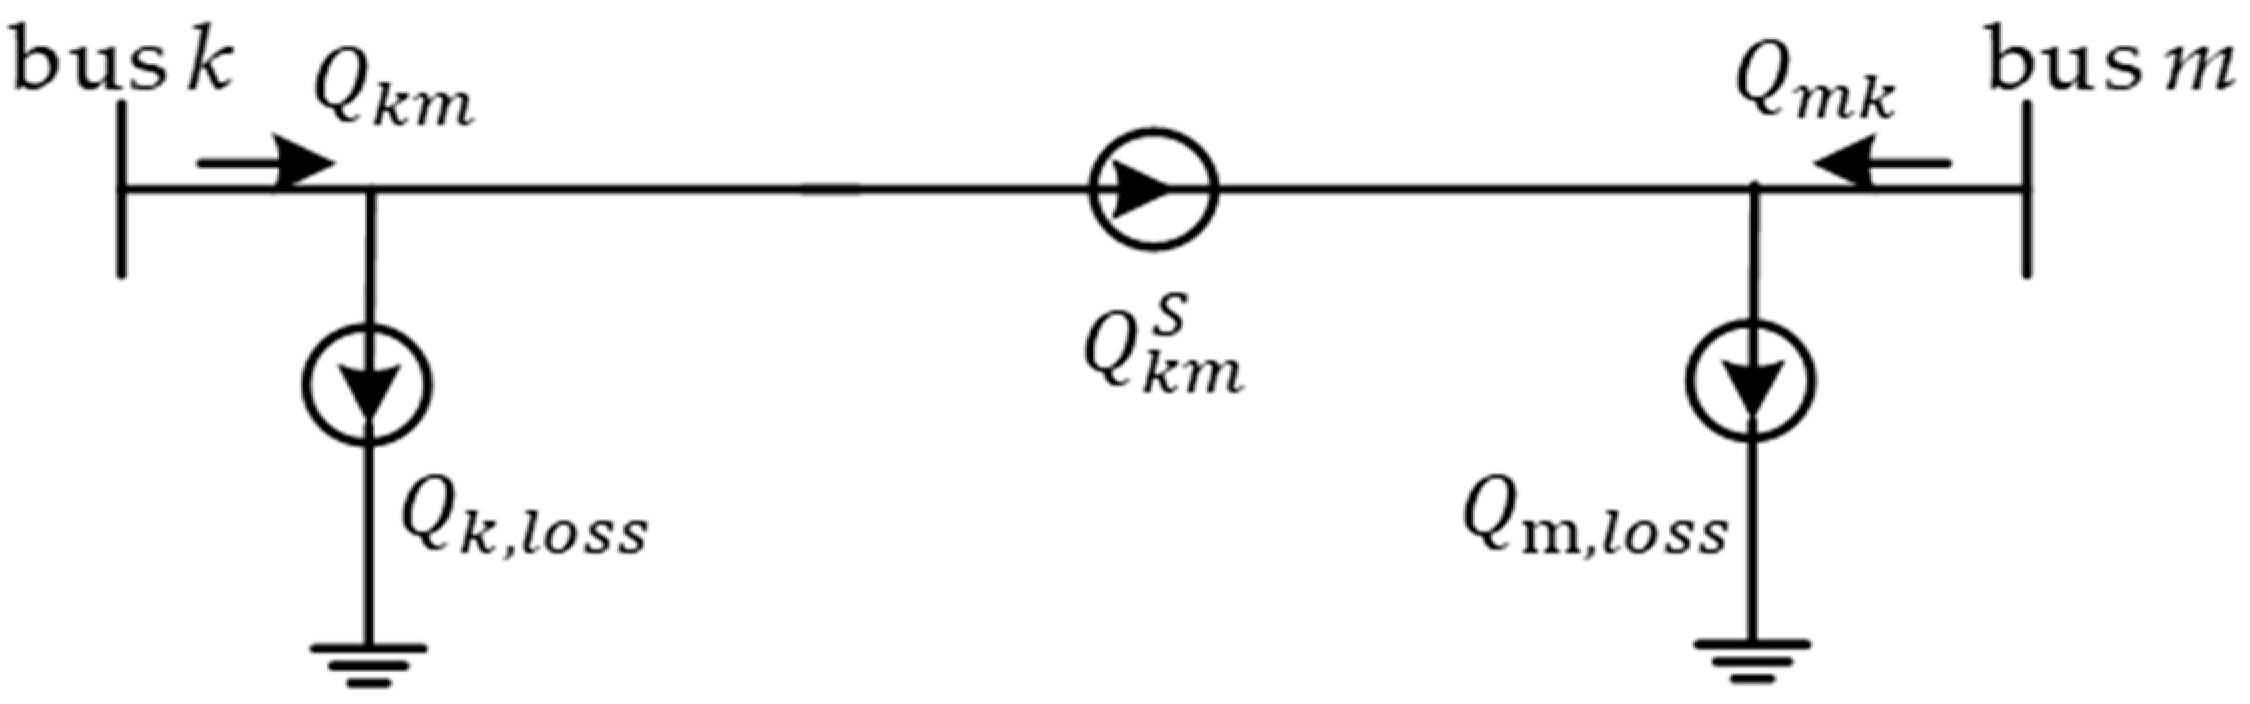
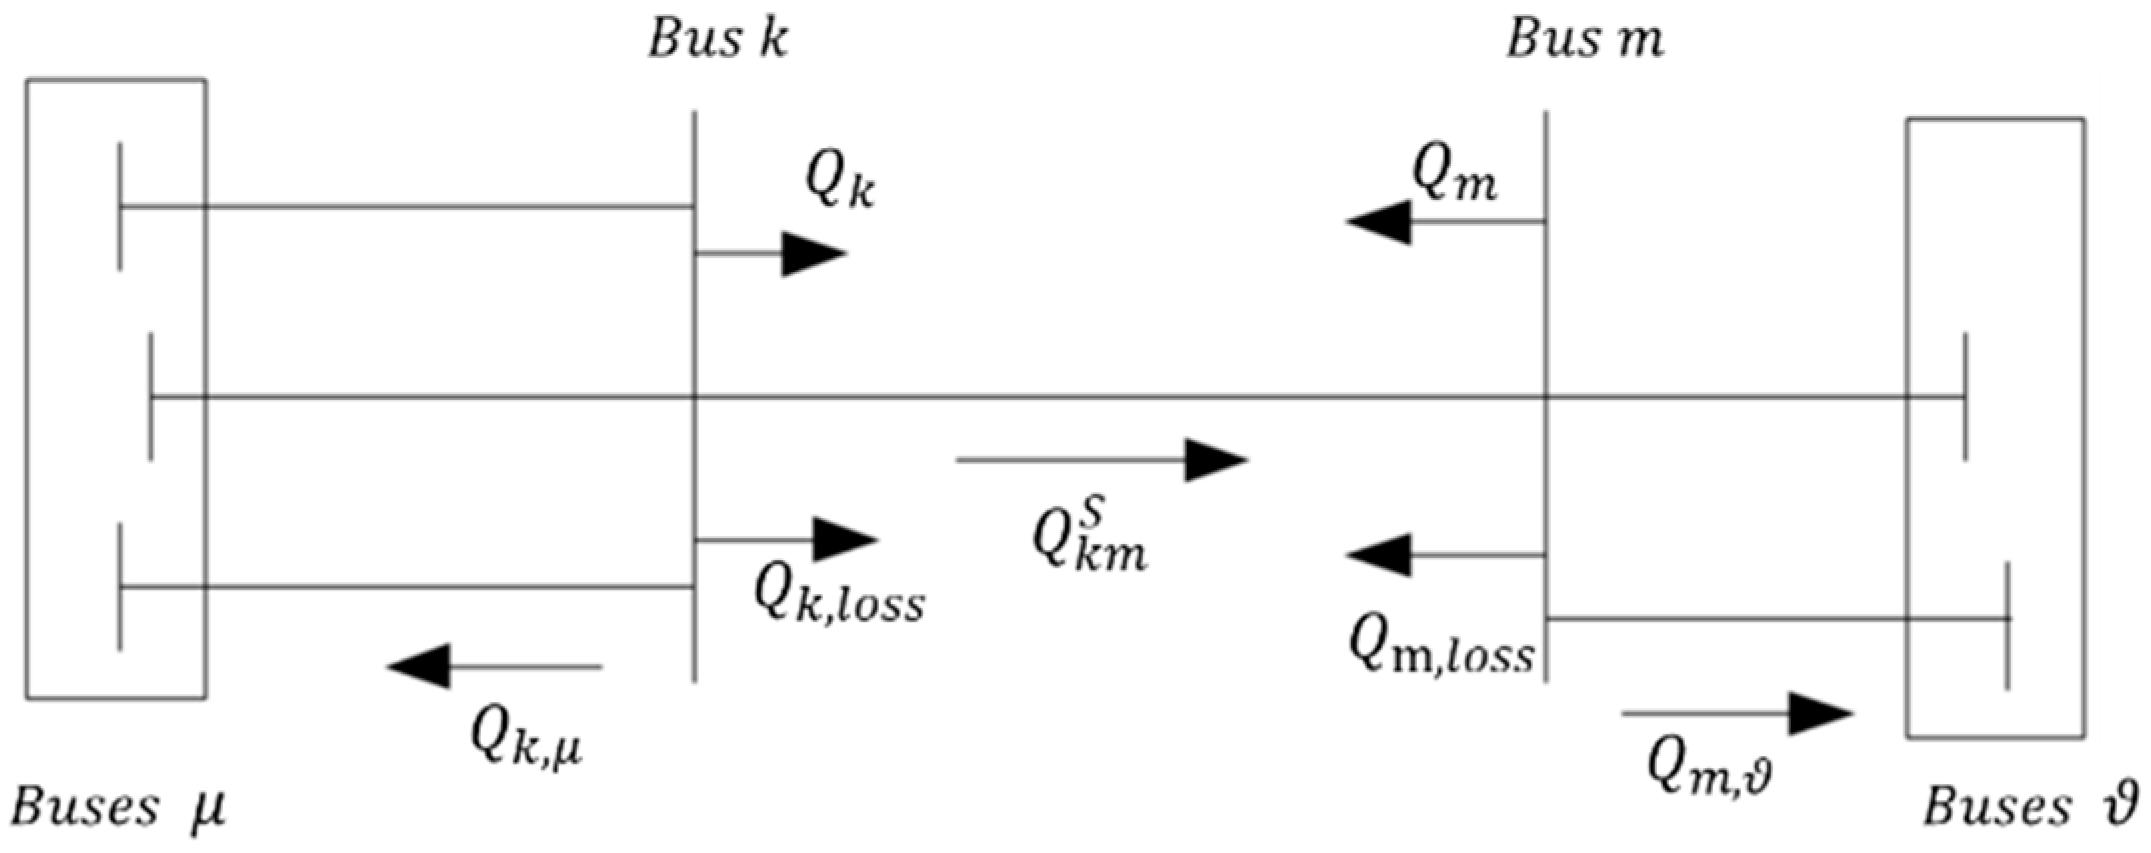
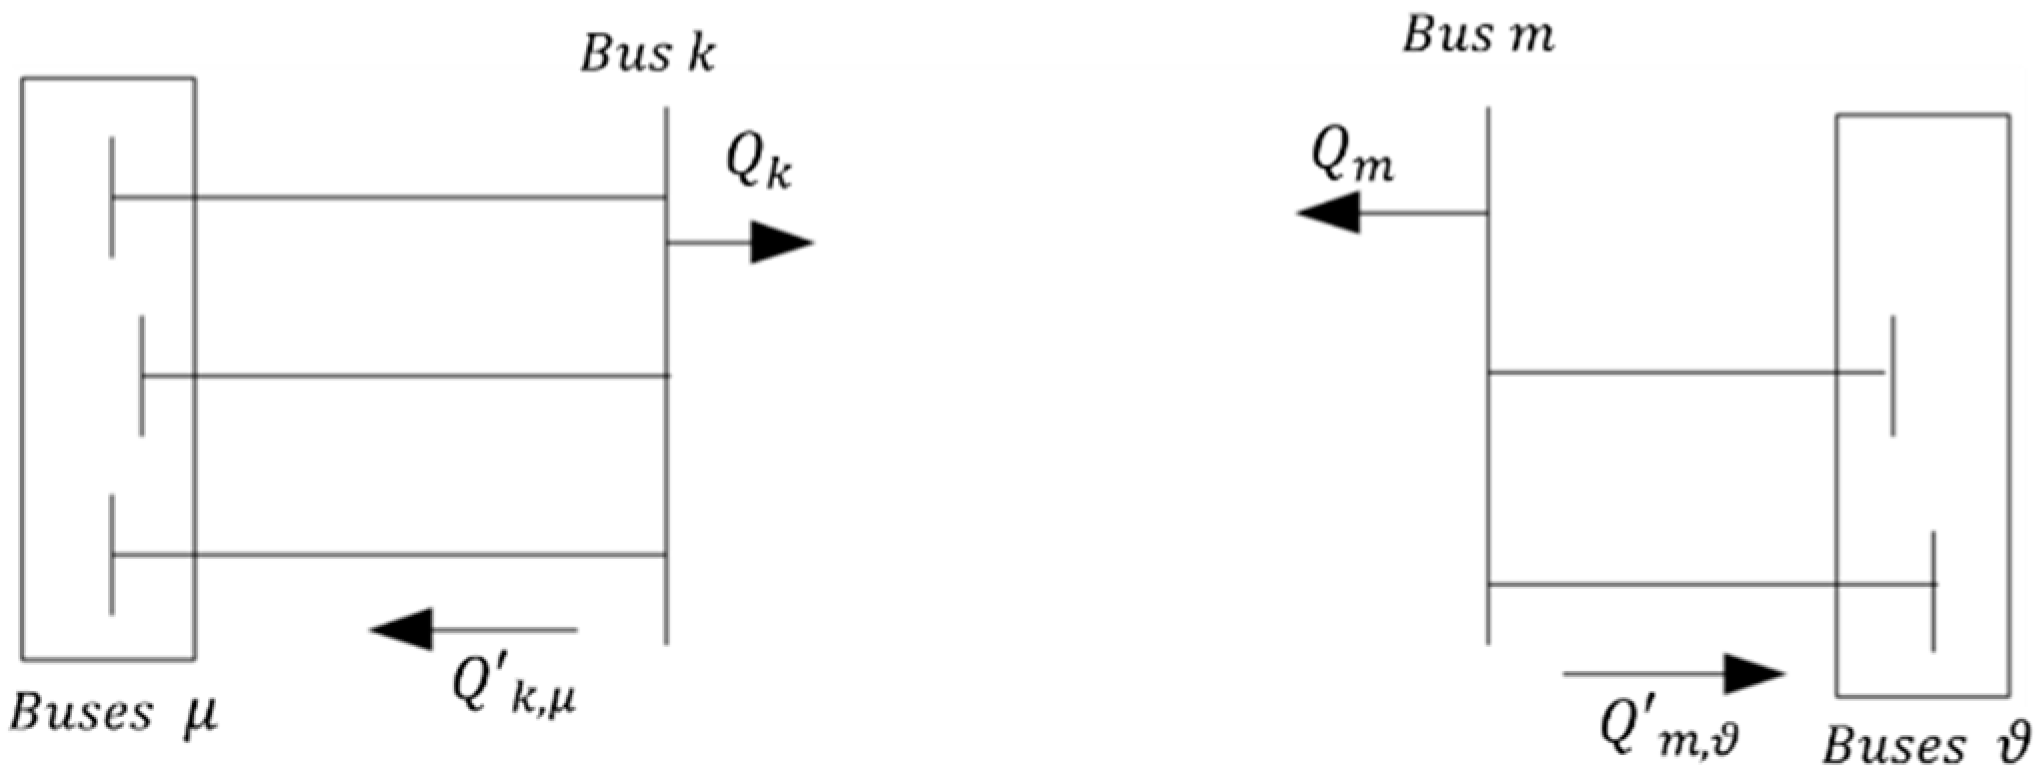
2. Problem Formulations

We consider a comprehensive power system quasi-steady-state model of the following general form:
0 = f ( x )
where x is the vector of state variables.
The proposed line switching problem can be generically expressed as
min N N N u m ( N )
subject to
f N ( x ) = 0
| S i j | = ( P i j 2 + Q i j 2 ) 1 / 2 S i j m a x i , j 1 , 2 , 3 , n ;
V i m i n < V i < V i m a x i 1 , 2 , 3 , n ;
N u m ( N N b a s e ) m
where Equation (2) is the minimum number of switched lines required for relieving voltage violations; N represents the new topology after the lines are switched out; S i j , P i j , and Q i j represent the apparent, active, and reactive power flows, respectively, of branch ij; V i m i n and V i m a x are the minimum and maximum voltage magnitudes at bus i; and S i j m a x is the maximum apparent power flow of line ij. The constraints given by Equations (4) and (5) limit the line flows and voltage violation. N u m ( · ) indicates the number of line switching actions needed to change the network topology N b a s e to the new network topology N , N b a s e denotes the network topology of the base case power system, and m is the upper bound of the number of switching lines allowed.
In this paper, we use the proposed three-stage methodology to relieve voltage violations. Equation (2) is used to search the network topology such that the voltage violation is relieved with a minimum number of lines switched out within the boundaries of the constraints of the power flow equation (Equation (3)), operational and engineering constraints (Equations (4) and (5)), and the upper limit of the number of switched lines (Equation (6)).

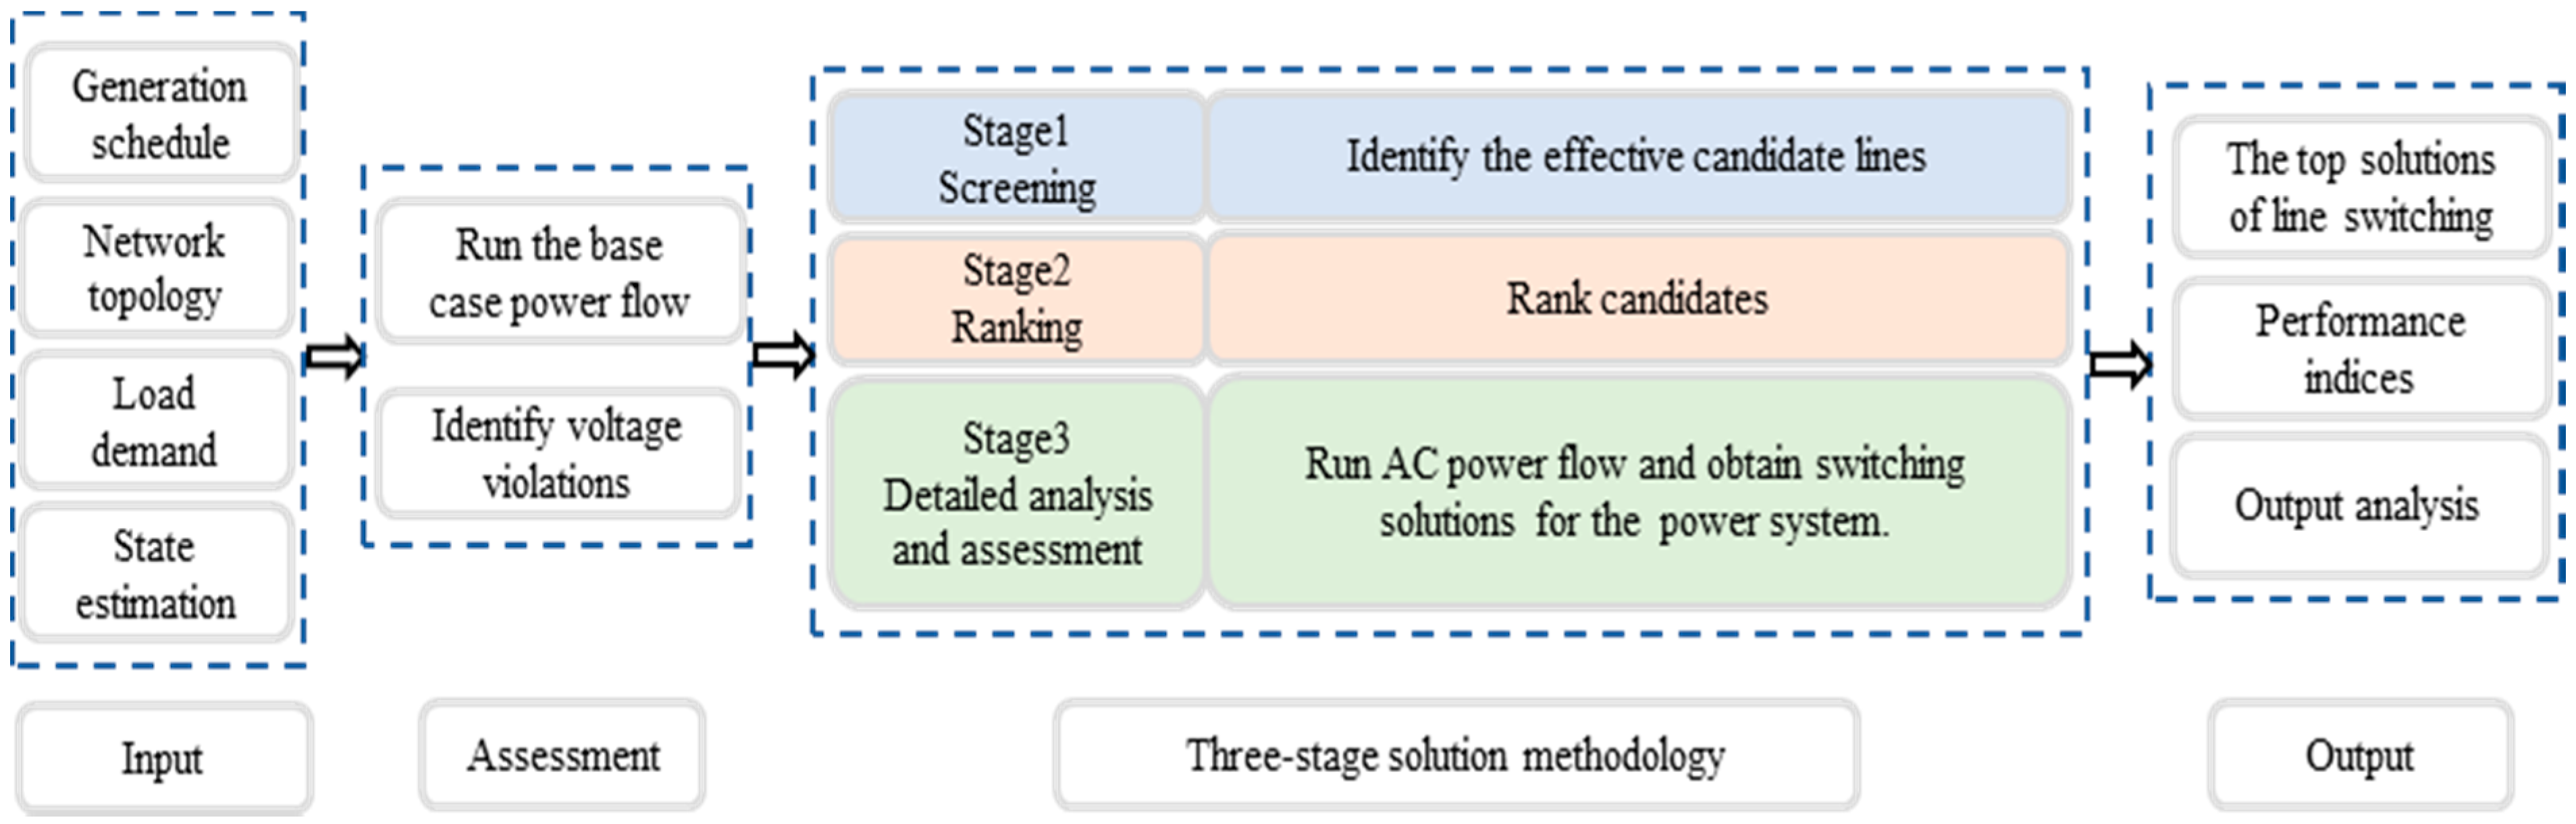
3. Solution Methodology

The proposed methodology employs a three-stage strategy that contains screening, ranking, and detailed analysis and assessment stages. The solution methodology used in each stage is presented as follows: A sensitivity-based method was used to increase the speed of screening to achieve the goal of Stage 1. Stage 2 is based on the PQ decoupled method to achieve fast and accurate ranking goals, while Stage 3 utilizes AC power flow to assess the switching solutions for the post-switching power systems. The architecture of the proposed methodology is shown in Figure 1.

3.1. Stage 1: Screening

The task of this stage is to identify candidate lines whose disconnection may relieve voltage violations. In the screening stage, we use a sensitivity method to rapidly estimate the voltage variations on bus i of the power system due to the switching-out action of each candidate [30].
Assume that the network has n buses and b branches and that we can relieve a voltage violation of bus i by switching line km. Let the base case system impedance be expressed as
Z = [ Z 11 Z 1 n Z n 1 Z n n ]
where Z i j is the impedance between buses i and j.
The current system operating state and the power flow of the post-switching power system will be changed when the lines are switched out. Once the line km has been switched out, its impact on the voltage variation can be described as
Δ V = Z p o s t Δ I
where Δ V , Δ I denote the other branches’ voltage and current variations, respectively, due to switching out km. After line km has been switched out, the system impedance matrix Z p o s t can be expressed as
Z p o s t = [ Z 11 p o s t Z 1 k p o s t Z 1 m p o s t Z 1 n p o s t Z k 1 p o s t Z k k p o s t Z k m p o s t Z k n p o s t Z m 1 p o s t Z m k p o s t Z m m p o s t Z m n p o s t Z n 1 p o s t Z n k p o s t Z n m p o s t Z n n p o s t ]
Then, the voltage variations with lines out of service can be obtained as follows:
Δ V i , k m = Z i k p o s t Δ I k + Z i m p o s t Δ I m = ( Z i k p o s t Z i m p o s t ) I k m
Using the branch-adding method [31], Z i k p o s t and Z i m p o s t are described by the following equations:
Z i k p o s t = Z i k + 1 z k m Z k k Z m m + 2 Z k m ( Z i k Z i m ) ( Z k k Z m m )
Z i m p o s t = Z i m + 1 z k m Z k k Z m m + 2 Z k m ( Z i k Z i m ) ( Z k m Z m m )
where z k m is the impedance of branch km and Z k k , Z m m , Z k m , Z i m , and Z i k are elements of Z .
Then, Equation (10) can be rewritten as
Δ V i , k m = ( Z i k Z i m ) z k m z k m Z k k Z m m + 2 Z k m I k m
where I k m is the current from k to m in the base case power system.
Consider that the reactance in the transmission line is much larger than the resistance; in this paper, we replace the impedance in the above formula with reactance. Then, the voltage variations Δ V i k m on bus i caused by switching line km can be obtained by the following:
Δ V i k m = ( X i k X i m ) x k m x k m X k k X m m + 2 X k m I k m
where X i k , X i m , X k k , X m m , and X k m are the corresponding elements in the reactance matrix X , and x k m represents the reactance of branch km.
We define the impact factor β i k m as the voltage variations on bus i caused by switching line km. with unit current. Then we have
β i k m = ( X i k X i m ) x k m x k m X k k X m m + 2 X k m
The screening stage uses the sensitivity equation (Equation (15)) to rapidly identify effective candidate lines. All of the candidates with β i k m > ε or β i k m < ε (where ε is a pre-defined value) are captured and sent to Stage 2 for further ranking.

3.2. Stage 2: Ranking

In this stage, the effective candidate lines selected in Stage 1 are ranked. The PQ decoupling method is used to compute the voltage of the violation bus with each effective candidate switched out, and the effectiveness of each candidate is ranked based on the calculated voltage variations of the post-switching power system. PQ decoupling is a variation of the Newton–Raphson method that exploits the approximate decoupling of active and reactive flows in well-behaved power networks and additionally fixes the value of the Jacobian matrix during the iteration in order to avoid costly matrix decompositions [32]; it is also referred to as fixed-slope, decoupled Newton–Raphson. Within the algorithm, the Jacobian matrix gets inverted only once and is simplified to form two separate matrices of P and Q. This simplification splits the Jacobian matrix into two small matrices, which means that the PQ decoupling method can return the answer within seconds, whereas the Newton–Raphson method takes much longer.
Figure 2 and Figure 3 show the transmission line π-equivalent model and reactive power flow model [33]:
Q k m = ( B k m B c a p ) V k 2 + G k m V k V m sin ( θ k θ m ) B k m V k V m cos ( θ k θ m )
Q m k = ( B k m B c a p ) V m 2 + G k m V k V m sin ( θ m θ k ) B k m V k V m cos ( θ m θ k )
Q k m = ( B k m B c a p ) ( V k 2 V m 2 ) 2 + G k m V k V m ( θ k θ m )
Q k , l o s s = 1 2 ( B k m B c a p ) ( V k 2 + V m 2 ) B k m V k V m
where Q k m and Q m k denote the reactive power flow from bus k to bus m and bus m to bus k, respectively; B k m and G k m are the imaginary and real parts, respectively, of the reactance for branch km; B c a p is the admittance to ground of branch km; and θ k and θ m are the voltage phase angles of bus k and bus m, respectively.
Figure 4 shows the pre-switch power system. We have
Q k = Q k , μ + Q k m S + Q k , l o s s
Q m = Q m , ϑ + Q m k S + Q m , l o s s
where buses μ is the set of buses connected to bus k excluding bus m and buses ϑ is the set of buses connected to bus m excluding bus k; Q k , μ and Q m , ϑ are the reactive power flows in lines connecting bus k and bus m to buses μ and buses ϑ , respectively; Q k m S represents the reactive power flow of the transmission part; and Q k , l o s s , Q m , l o s s are the reactive power flows of the loss part.
As shown in Figure 5, with line km out of service, we have
Q k = Q k , μ
Q m = Q m , ϑ
where Q k , μ and Q m , ϑ are the reactive power flows in lines connecting bus k and bus m to buses μ and buses ϑ , respectively, after line km is taken out of service.
Assume that bus k and bus m still connect, as shown in Figure 6, then the simulated line part of reactive power flow from bus k to bus m ( Q k m S ) and the simulated loss part of reactive power flow in bus k and bus m ( Q k , l o s s ) can be described as
Q k m S = Δ Q k 1 = Δ Q m 1 = Q m k S
Q k , l o s s = Δ Q k 2 = Δ Q m 2 = Q m , l o s s
where Δ Q k 1 , Δ Q m 1 are the injected reactive powers with values equal to Q k m S and Q m k S and Δ Q k 2 , Δ Q m 2 are the injected reactive powers with values equal to Q k , l o s s and Q m , l o s s , respectively.
Then
Q k + Δ Q k 1 + Δ Q k 2 = Q k , μ + Q k m S + Q k , l o s s
Q m + Δ Q m 1 + Δ Q m 2 = Q m , ϑ + Q m k S + Q m , l o s s
Then, the voltage variations of bus i can be rewritten as
Δ V i = α i k m Q k m S + δ i k m Q k , l o s s
In the equation above,
{ α i k m = X i k X i m 1 a ( X k k X k m ) b ( X m k X m m ) δ i k m = X i k + X i m 1 g ( X k k + X k m ) h ( X m k + X m m )
{ a = V k ( B k m B c a p ) + G k m V m ( θ k θ m ) b = V m ( B k m B c a p ) + G k m V k ( θ k θ m ) g = V k ( B k m B c a p ) + B k m V m h = V m ( B k m B c a p ) + B k m V k
where X i k , X i m , X k k , X k m , X m k , and X m m are the corresponding elements in the reactance matrix X and X is the inverse matrix of the coefficient matrix of the PQ decoupling method [31].
We calculate the alleviation contribution Δ V i of each candidate line out of service on the violated bus using Equation (28) and rank them in order.

3.3. Stage 3: Detailed Analysis and Assessment

To perform a detailed analysis of the several top candidates ranked at the ranking stage, the AC power flow is employed to compute the exact post-switching bus voltage. Based on the exact calculation of the AC power flow, the optimal network topology of the post-switching power system and the needed action of line switching are assessed.
We define the performance index NAM as follows:
N A M = m i n { V i _ m a x V i N V i _ m a x , V i N V i _ m i n V i _ m i n } 100 % i 1 , 2 , 3 , n ;
where V i _ m a x and V i _ m i n are the maximum and minimum voltage magnitudes of bus i, and V i N is the actual voltage magnitude of bus i with line km switched out. By using Equation (31), the line switching solutions list is assessed.

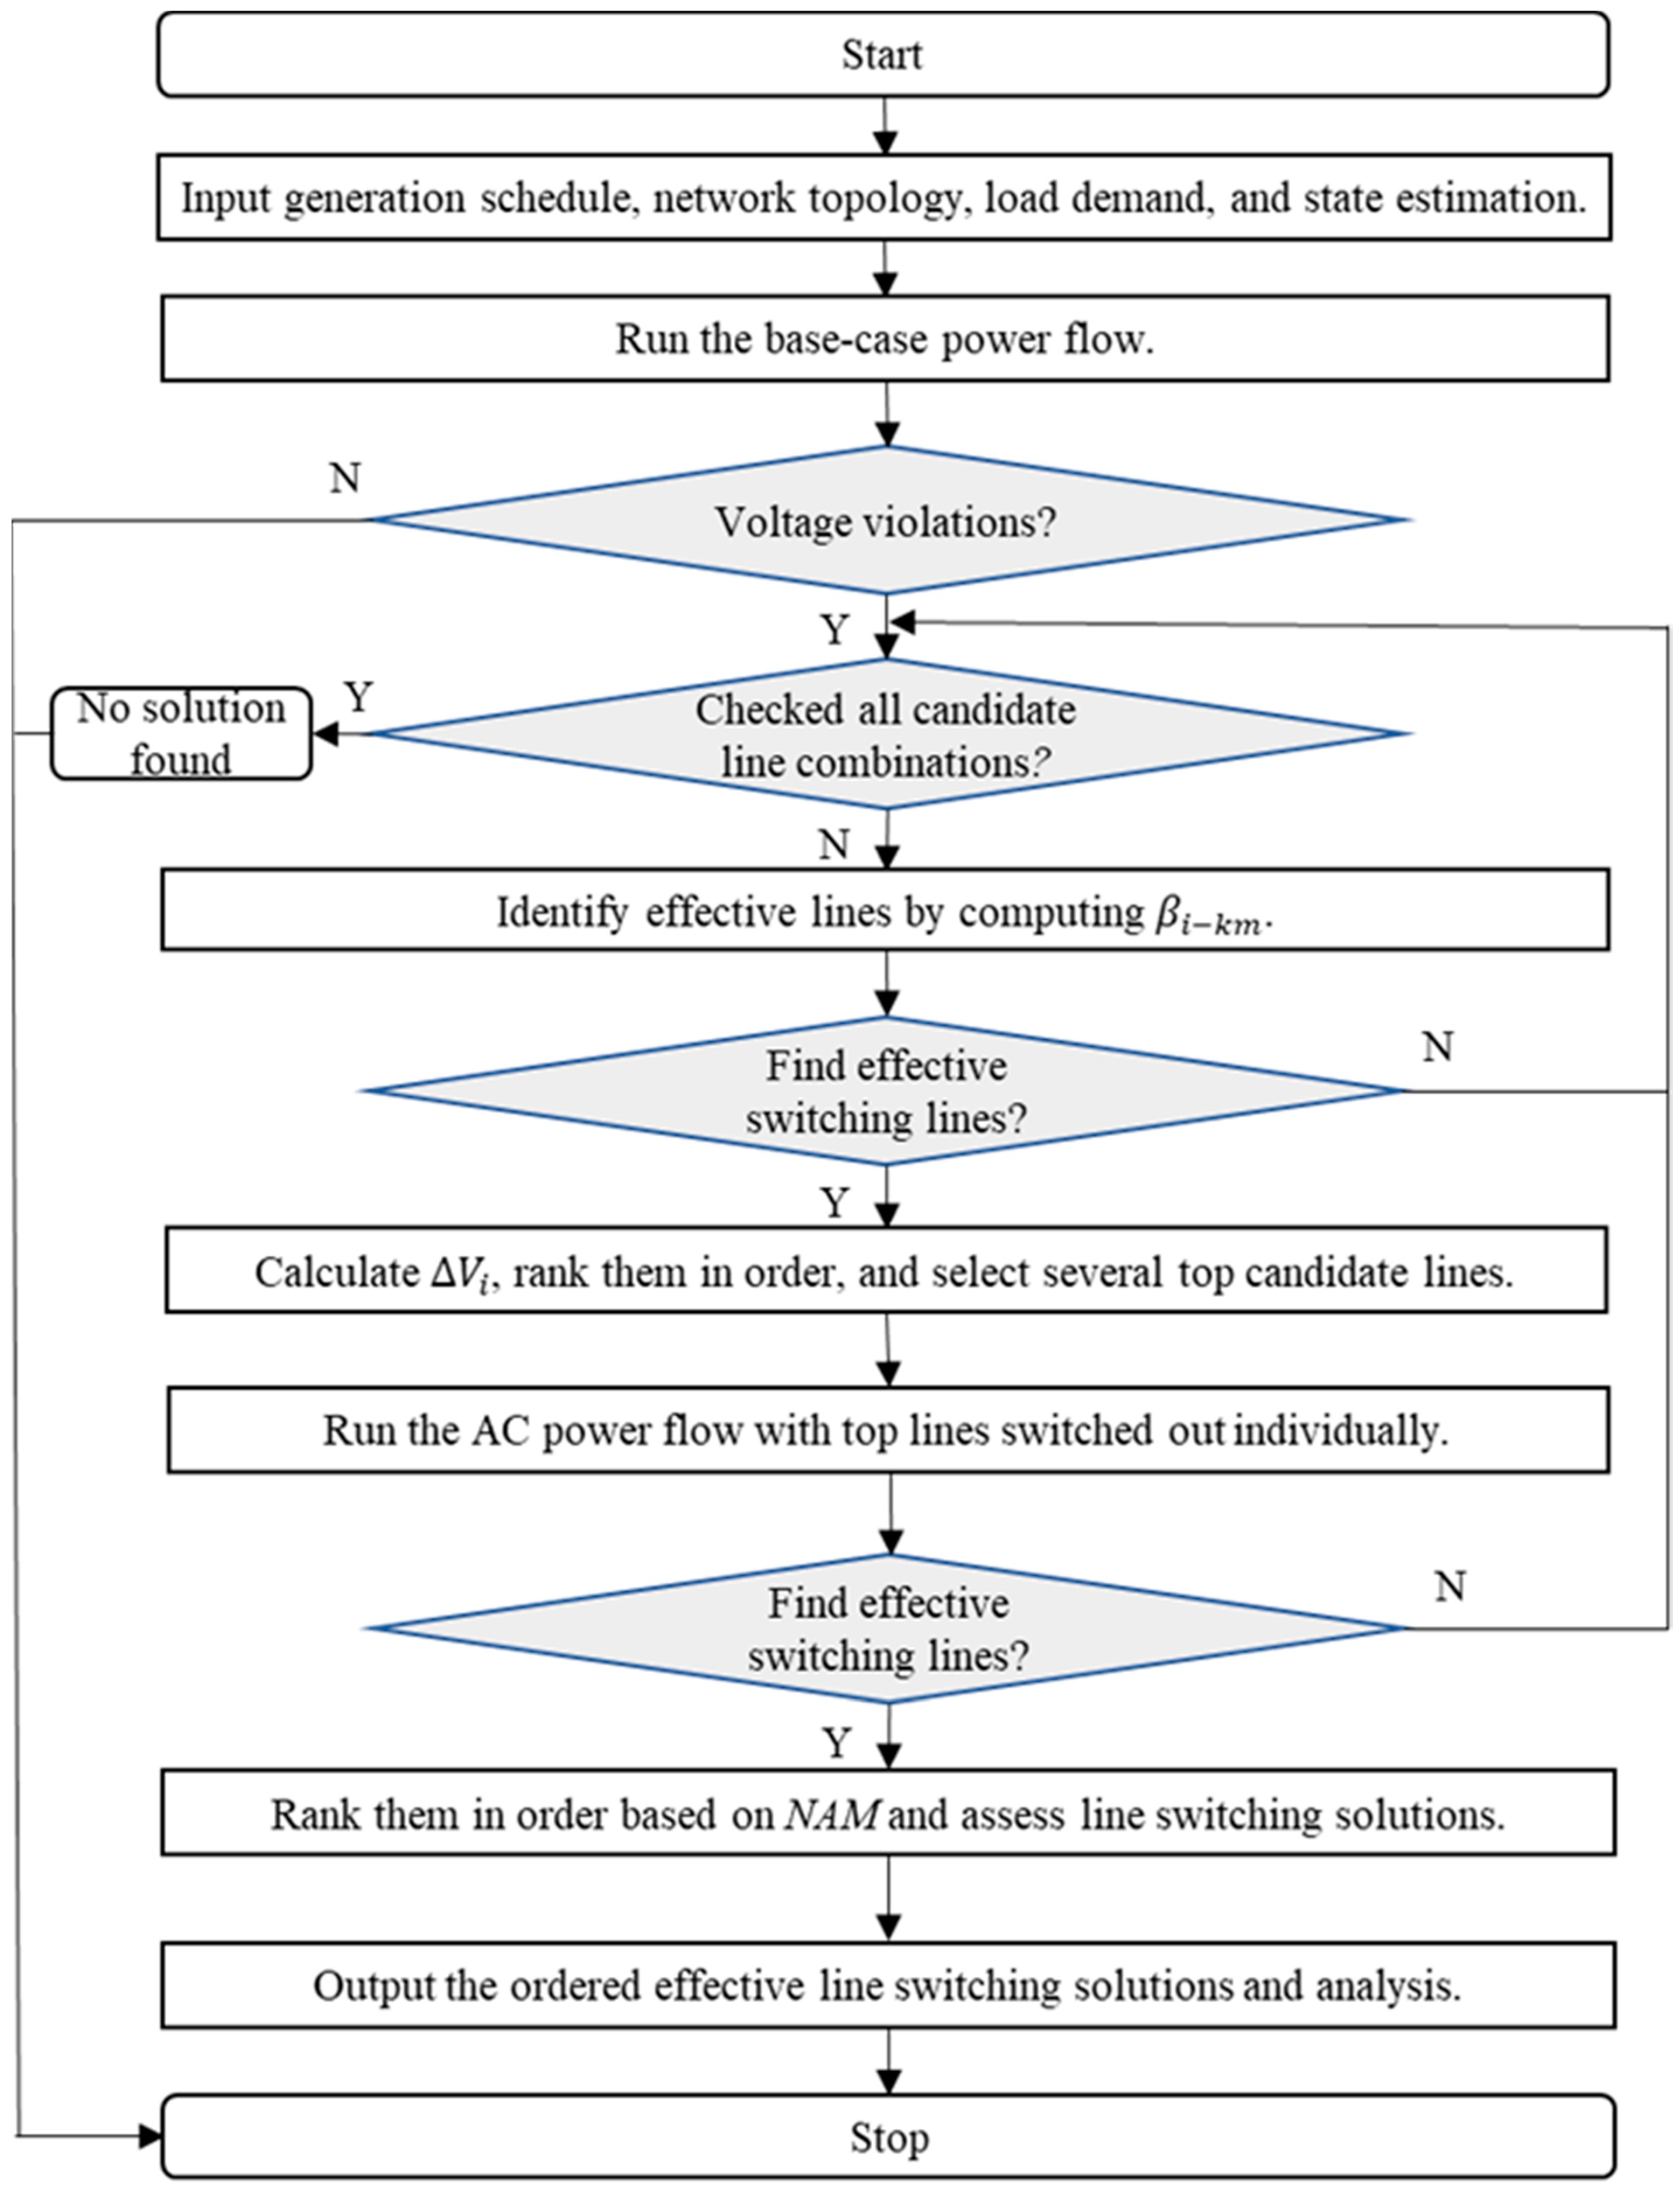
4. The Overall Solution Methodology

A step-by-step description of the proposed three-stage methodology for online applications is summarized in the following steps and shown in Figure 7.
Step 1: Input the online data, including the generation schedule, load demands, state estimation, network topology, and candidate lines for online line switching action.
Step 2: Run the AC power flow according to the given operating state. If voltage violations exist, go to Step 3; otherwise, stop and output the base case assessment results.
Step 3: If all candidate line combinations have been checked, stop and output “no solution found”; otherwise, go to Step 4.
Step 4: Apply the sensitivity formula (Equation (15)) to each candidate line.
Step 5: If effective candidate lines are found, then send them to Step 6 for ranking. Otherwise, go to Step 3.
Step 6: Apply Equation (28) to calculate the alleviation contribution ∆Vi of each line from Step 5 and rank them in order. Send the top candidate lines to Step 7 for detailed analysis.
Step 7: Apply AC power flow to compute the post-switching bus voltage corresponding to each top-ranked line switching and assess the line switching solutions for the power system.
Step 8: Rank the line switching solutions in order using NAM.
Step 9: Output the ordered effective line switching solutions and analysis; if no effective line is found, go to Step 3.

5. Numerical Schemes

The proposed online line switching methodology was applied to the IEEE 39-bus and 2746-bus power systems to validate its effectiveness and accuracy. The proposed methodology was implemented in MATPOWER 6.0 on a ThinkPad PC with Intel Core 2.50 GHz i5–7200U CPU and 8 GB of memory. The results provided by the exact AC power flow were used as a benchmark to compare the speed and accuracy of the proposed three-stage methodology.

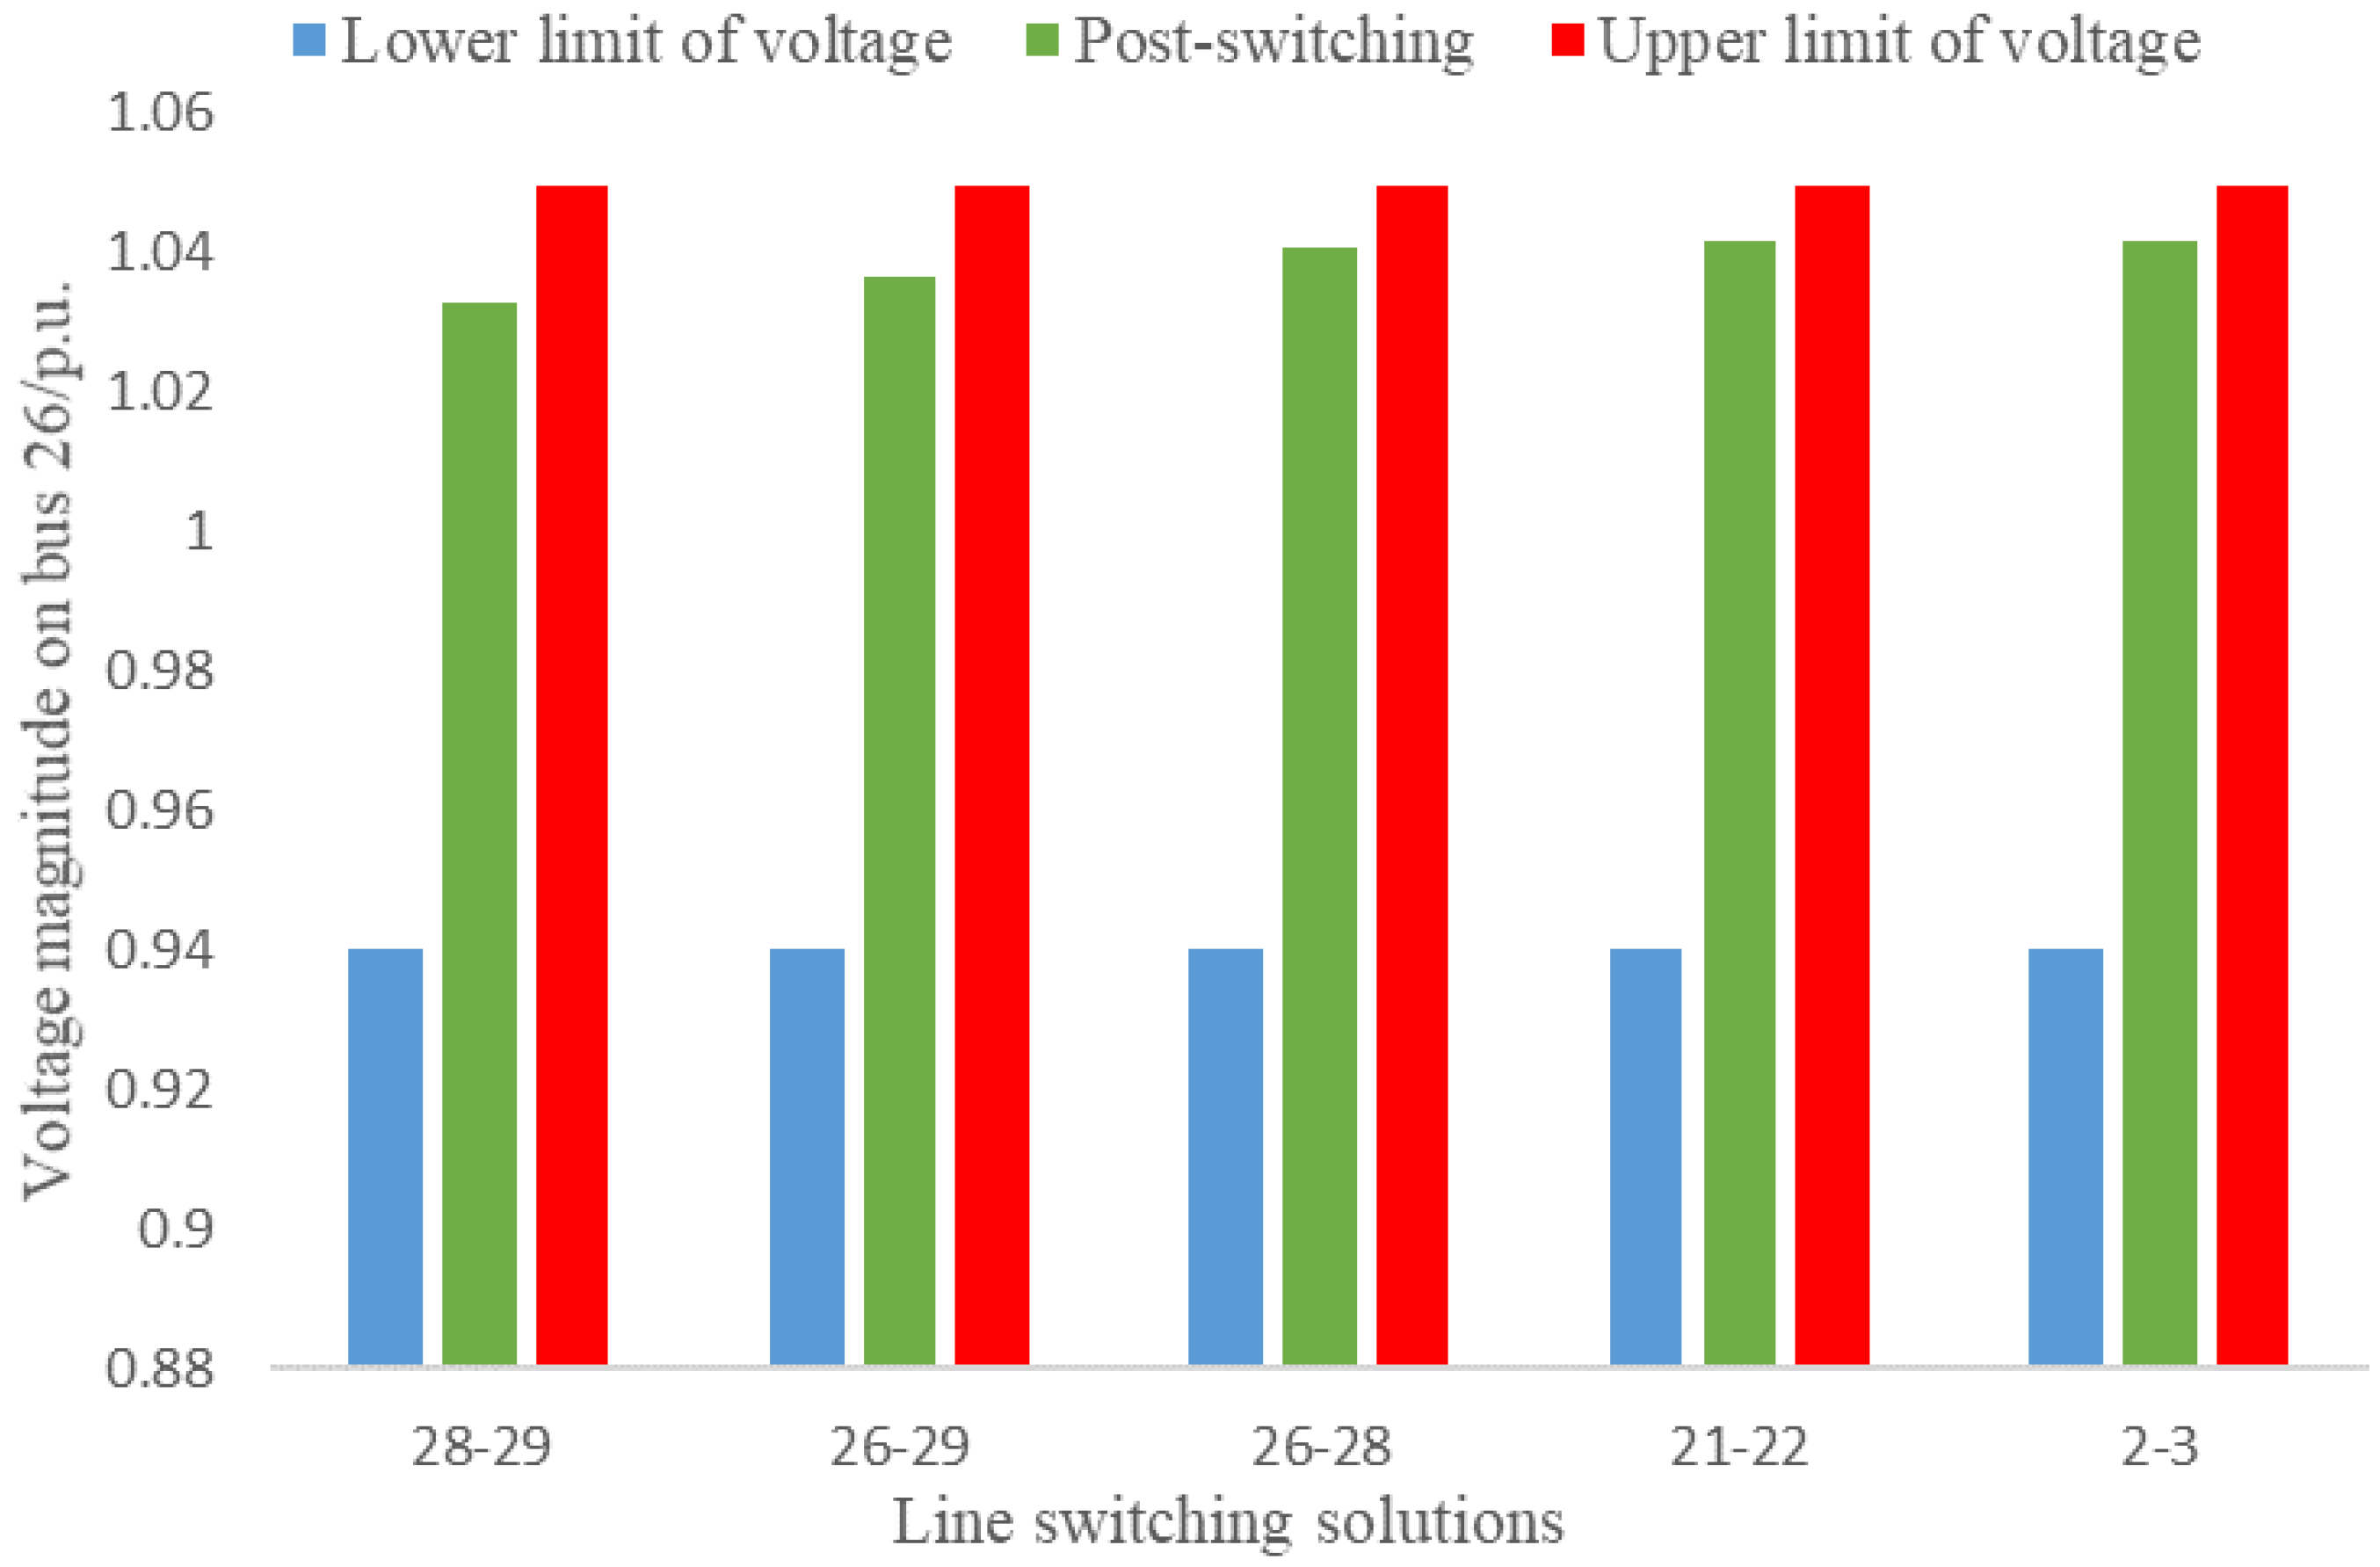
5.1. Single-Line Switching

The IEEE 39-bus system has 46 branches and 10 generators, and the active power of total loads is 6254.2 MW. The maximum and minimum voltage magnitudes of bus 26 are 1.0494 p.u. and 0.94 p.u., respectively; those of the other buses are 0.94~1.060 p.u. The power flow was run at current operating conditions and a voltage violation was found on bus 26.
By applying the proposed methodology, several solutions were assessed to relieve the voltage violation of bus 26. The screening, ranking, and detailed analysis results are shown in Table 1, and the CPU time for this example is displayed in Table 2. The voltages of bus 26 for the pre-switching and post-switching power systems are shown in Figure 8. We made the following observations from the results:
  • Stage 1: By using β i k m , 20 effective candidate lines were identified from 45 candidate lines.
  • Stage 2: The Δ V i of each line (20 effective candidates from Stage 1) was calculated to select the top seven lines and rank them in order: lines 26–29, 26–28, 26–27, 2–3, 28–29, 16–21, and 21–22.
  • Stage 3: The AC power flow was used to check for any voltage violation at the current operating point with the top seven lines switched out individually. With lines 26–27 and 16–21 switched out individually, we found that there were still voltage violations on bus 26 of 1.0740 p.u. and 1.0497 p.u., respectively. Thus, the high-quality line switching solutions found to relieve voltage violation of bus 26 were lines 28–29,26–29, 26–28, 21–22, and 2–3. With each of these top five lines switched out, the voltage magnitudes on bus 26 were 1.0326 p.u. (NAM = 1.6009), 1.0366 p.u. (NAM = 1.2197), 1.0404 p.u. (NAM = 0.8576), 1.0414 p.u. (NAM = 0.7623), and 1.0416 p.u. (NAM = 0.7433).
To evaluate the speed and accuracy of the proposed methodology, all 45 candidate lines were switched out individually and then lines 28–29, 26–29, 26–28, 21–22, and 2–3 were selected to relieve the voltage violation by using AC power flow. With the five lines switched out individually, the voltages on bus 26 were 1.0326 p.u., 1.0366 p.u., 1.0404 p.u., 1.0414 p.u., and 1.0416 p.u., respectively. This is consistent with the solutions assessed by the proposed methodology. It is noteworthy that the scheme given in this example is locally optimal when evaluated using full AC power flow.
The total CPU time of the proposed methodology in this study was 0.1054 s, whereas full AC power flow takes 0.9766 s. Compared with AC power flow, the CPU time speed-up given by the method in this study is 826.57%, as shown in Table 2.
We then compared the speed and accuracy of the proposed methodology with Shao’s method in [28]. Lines 28–29, 26–29, and 26–28 are given to relieve the violation on bus 26 by using the method in [28], and the CPU time is 0.3816 s. From the results we can see that compared with the method in [28], the proposed methodology can provide more effective solutions and the speed is faster.
As can be seen from Figure 8, the line switching solutions obtained using the proposed methodology relieved the voltage violation on bus 26 in this study.
The above results illustrate the effectiveness of the proposed methodology in relieving voltage violations by switching out single lines compared with AC power flow. This study also shows the accuracy and fast speed of the proposed methodology compared with Shao’s method in [28].
It is worth noting that considering the existence of errors in stage 1 and 2, the solutions provided in this paper may omit some solutions, but the proposed method can still provide a set of high-quality schemes to relieve voltage violations. All high-quality solutions are given in this study.

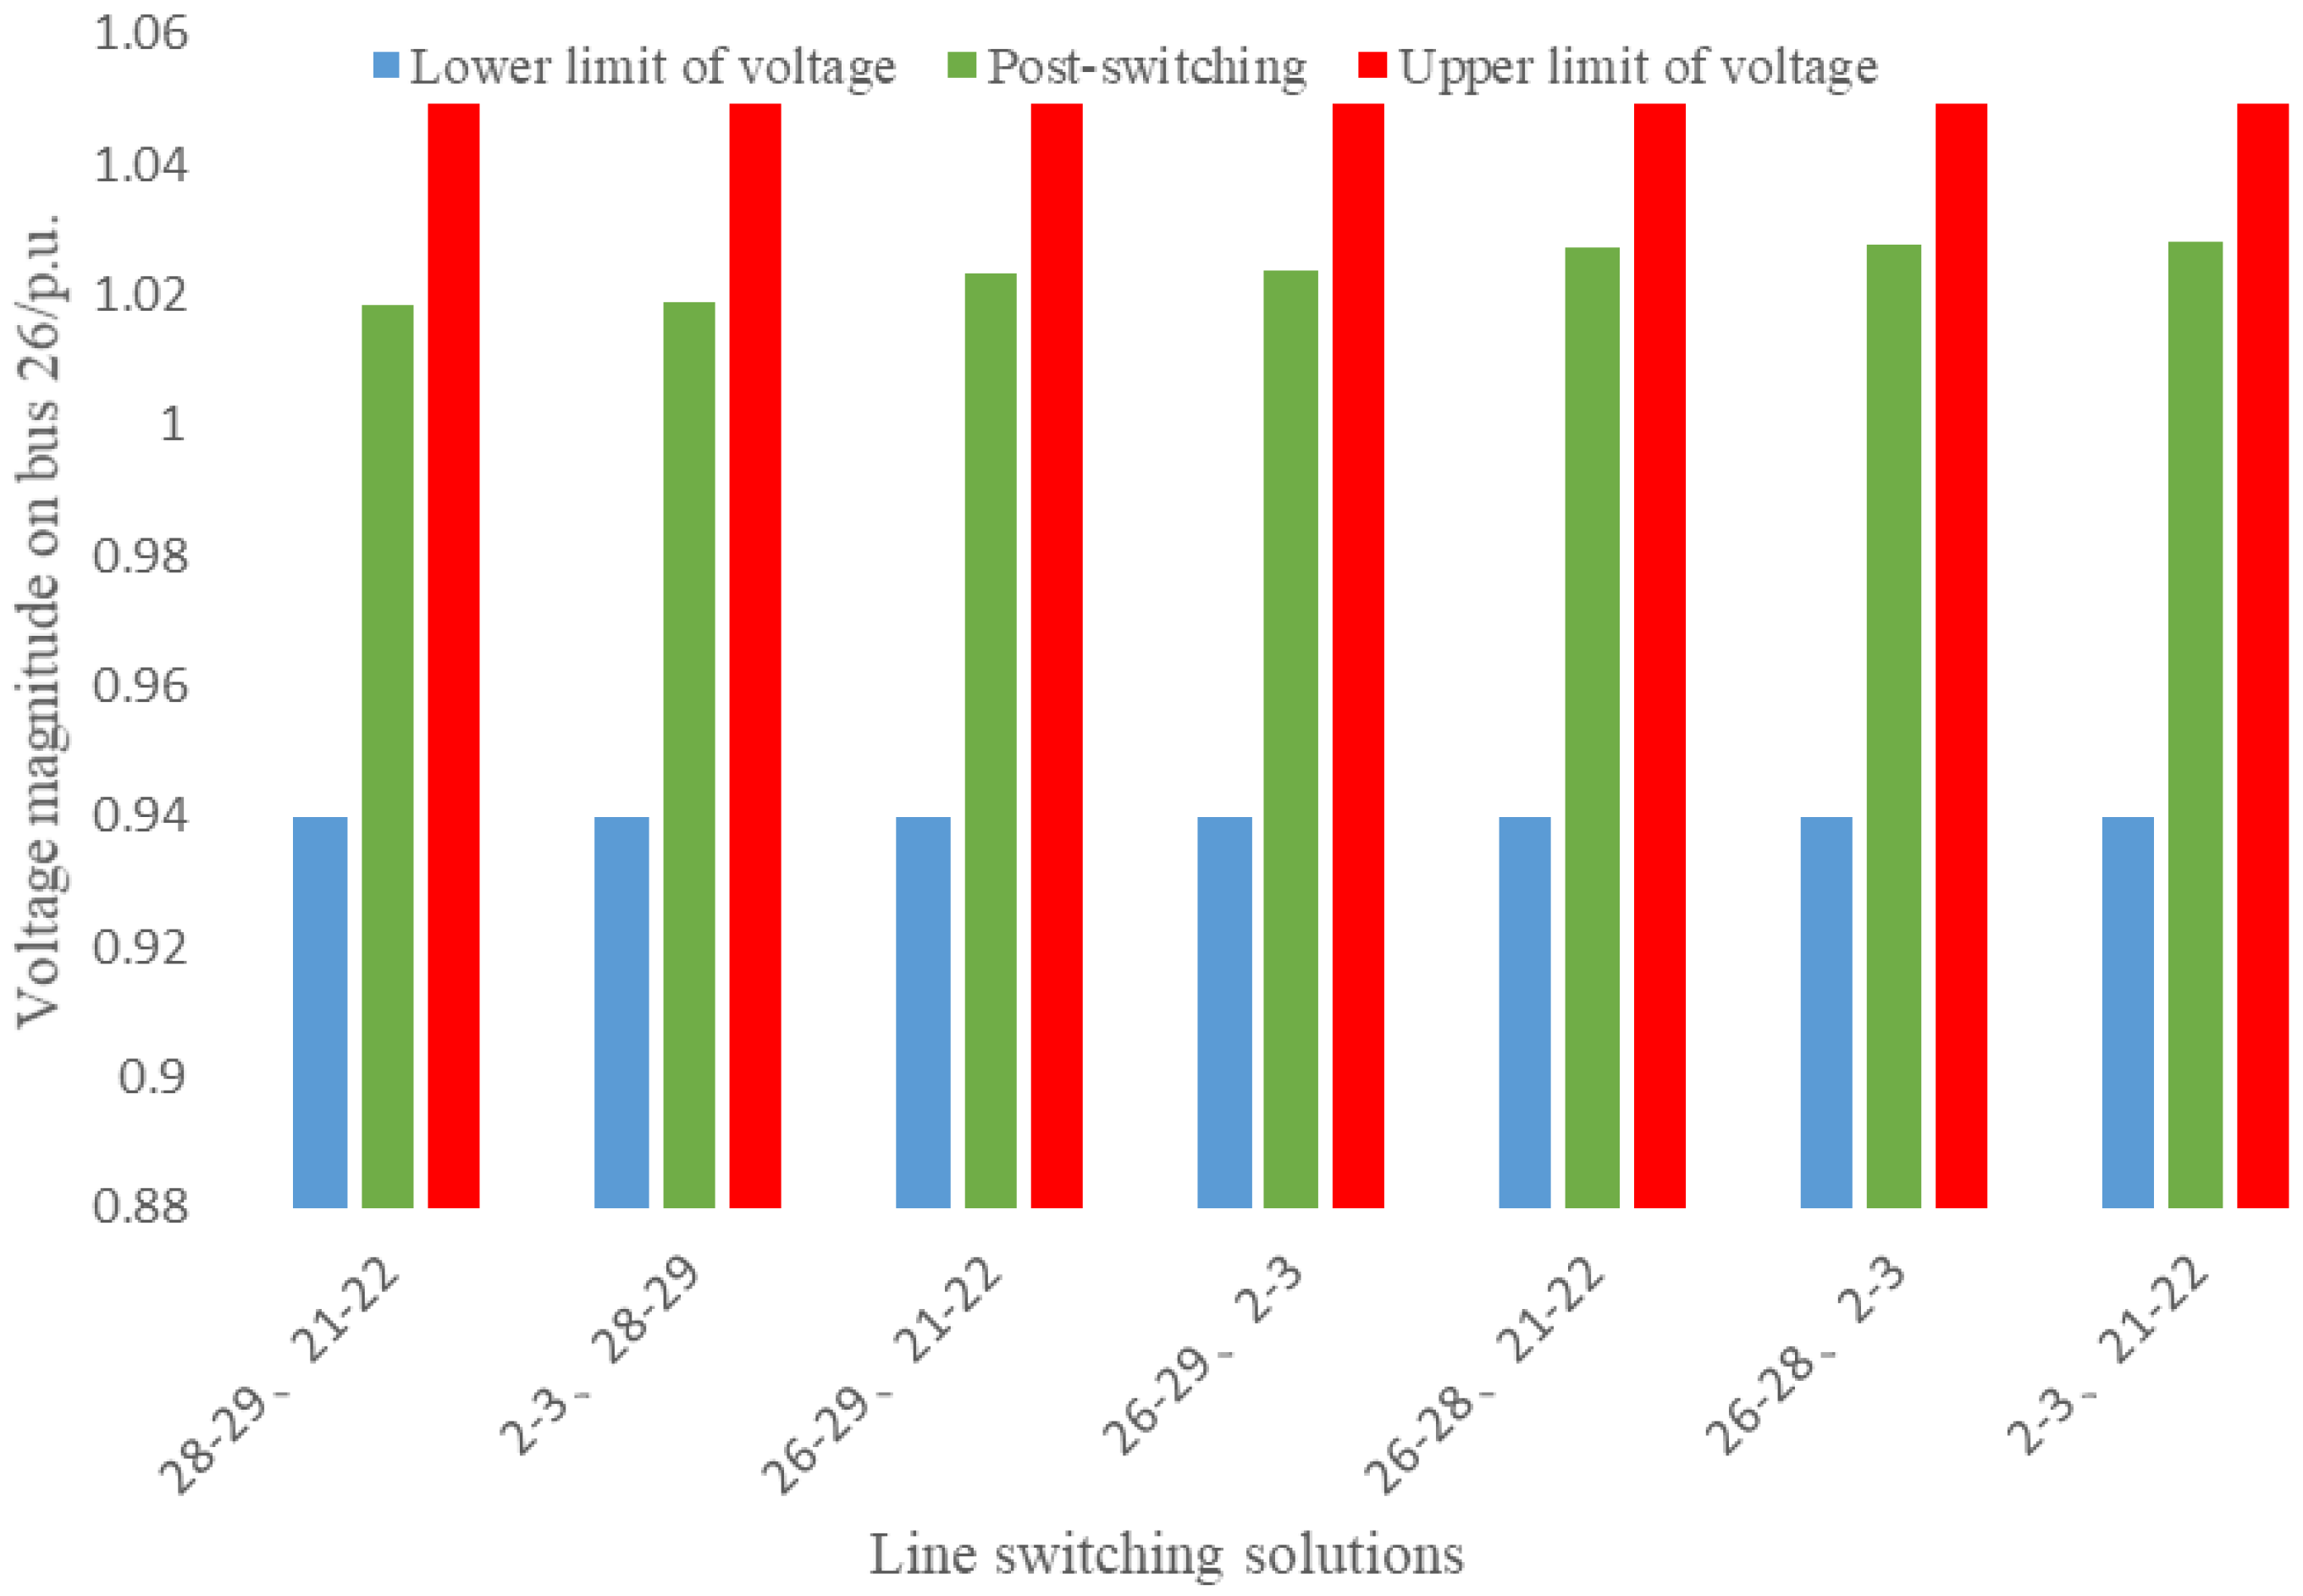
5.2. Multiple-Line Switching

The IEEE 39-bus system has 46 branches; the maximum and minimum voltage magnitudes of bus 26 are 1.0494 p.u. and 0.94 p.u., respectively, and those of the other buses are 0.94~1.060 p.u. The power flow was run at current operating conditions and a voltage violation was found on bus 26: V26 = 1.0526 p.u. A single line switched off cannot effectively relieve this voltage violation, so we increased the number of switching lines by 1 and utilized the proposed methodology to provide a set of multiple-line switching solutions. In this study, we set the number of switching lines at 2. The obtained solutions are summarized in Table 3 and the CPU times are displayed in Table 4. The voltages of bus 26 for the pre-switching and post-switching systems are shown in Figure 9.
We made the following observations from the results:
Twenty-one candidates were identified from 45 candidate lines at Stage 1 and sent to Stage 2 for ranking. The top seven single lines were identified: lines 26–29, 26–28, 26–27, 2–3, 28–29, 16–21, and 21–22, as in Section 5.1. We combined the top seven single switching lines in pairs and calculated the Δ V i of each candidate solution. Then, the seven most highly ranked multiple-line candidates were captured and sent to Stage 3 for detailed analysis and assessment: lines 28–29 and 21–22, lines 2–3 and 28–29, lines 26–29 and 21–22, lines 26–28 and 21–22, lines 26–28 and 2–3, lines 26–29 and 2–3, and lines 2–3 and 21–22.
Lines 28–29 and 21–22, lines 2–3 and 28–29, lines 26–29 and 21–22, lines 26–29 and 2–3, lines 26–28 and 21–22, lines 26–28 and 2–3, and lines 2–3 and 21–22 were assessed to relieve the voltage violation of bus 26 for the current power system by using AC power flow at Stage 3. For the successful line switching solutions, the voltage violations on bus 26 were 1.0184 p.u. (NAM = 2.9541), 1.0190 p.u. (NAM = 2.8969), 1.0233 p.u. (NAM = 2.4871), 1.0237 p.u. (NAM = 2.4490), 1.0273 p.u. (NAM = 2.1060), 1.0276 p.u. (NAM = 2.0774), and 1.0281 p.u. (NAM = 2.0297) in the current power system, respectively.
To verify the effectiveness of the obtained solutions, we performed an exhaustive search with all 45 candidate lines combined in pairs and then switched out. Switching solutions including lines 28–29 and 21–22, lines 2–3 and 28–29, lines 26–29 and 21–22, lines 26–29 and 2–3, lines 26–28 and 21–22, lines 26–28 and 2–3, and lines 2–3 and 21–22 were obtained to relieve the voltage violation by using AC power flow. It can be clearly seen that the effective line switching solutions obtained by the proposed methodology are the same as those in the AC power results.
The CPU time of the proposed methodology in this case was 0.1372 s, while the exhaustive search based on AC power flow took 7.3152 s. The speed-up was 5231.78%. Figure 9 shows the effectiveness of the proposed methodology for relieving the voltage violation of bus 26.
Similarly, lines 2–3 and 28–29, lines 26–28 and 2–3, lines 26–29 and 2–3, and lines 2–3 and 21–22 are provided by using the method in [28], and the CPU time is 0.8293s. Compared with the method in [28], the proposed method shows more advantages in accuracy and speed.
This study shows that the proposed methodology can provide several high-quality multiple-line switching solutions to relieve voltage violations. The CPU time test verifies the fast speed of the three-stage methodology.

5.3. The 2746-Bus System

The proposed online methodology for line switching was evaluated on a 2746-bus power system containing 3514 transmission lines; the voltage limit on bus 249 was 0.94~1.06 p.u. and the actual voltage magnitude of the base case power system on bus 249 was 1.0829 p.u., meaning the existence of a voltage violation on bus 249.
The line switching solutions obtained after applying the proposed methodology are summarized in Table 5. The voltages of bus 249 for the pre-switching and post-switching systems are shown in Figure 10. The output from each stage is summarized as follows:
  • Stage 1: There were 79 candidates identified from 2836 candidate lines. Due to space limitations, Table 5 displays 21 effective candidates.
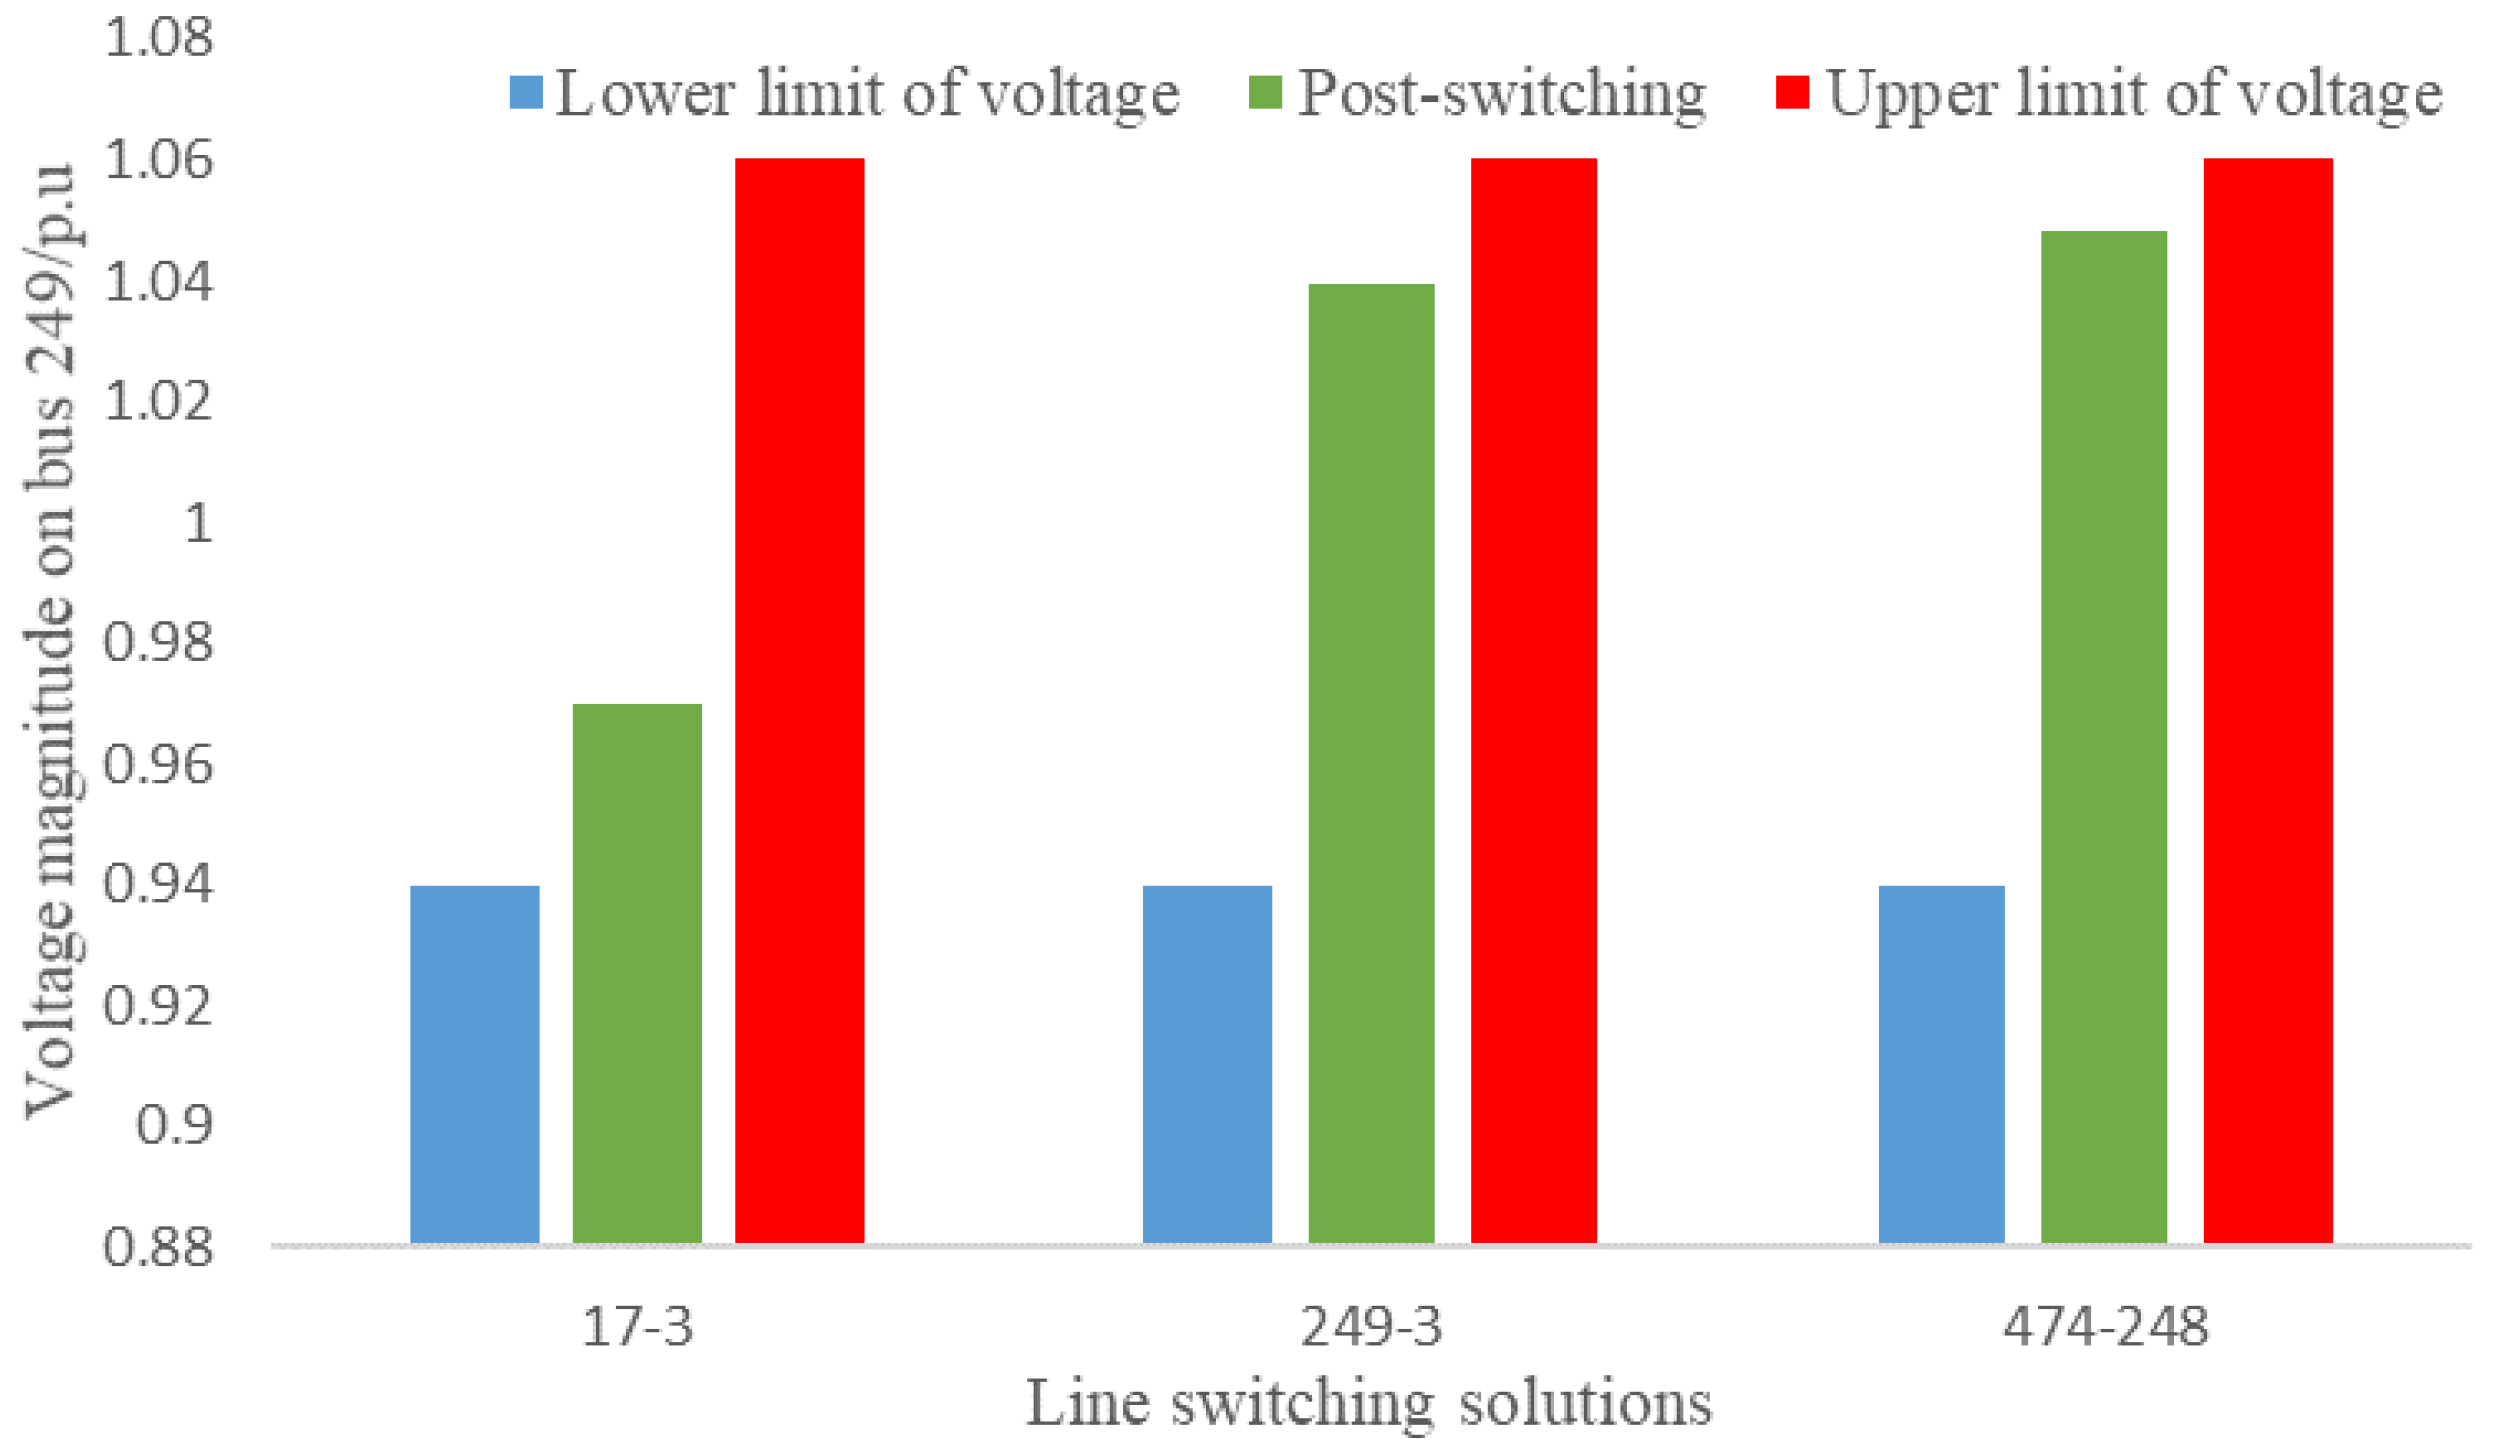
  • Stage 2: The 79 candidates were ranked, and the top seven candidates are selected for detailed analysis and assessment to be performed at Stage 3: lines 17–3, 249–3, 474–210, 474–248, 471–210, 249–247, and 374–247.
  • Stage 3: For each top candidate line, AC power flow was performed to assess the effectiveness of each candidate. Consequently, lines 17–3, 249–3, and 474–248 were assessed to be most effective for relieving the voltage violation in the power system.
To evaluate the speed and accuracy of the proposed methodology, all 2836 candidate lines were switched out individually, and lines 17–3, 249–3, and 474–248 were found to relieve the voltage violation by using AC power flow. This is consistent with the solutions obtained by the proposed methodology.
As shown in Table 6, the total CPU time of the proposed methodology in this study was 2.3093 s, whereas the exhaustive search based on AC power flow took 231.0528 s—an improvement in speed by the proposed methodology of 9905.32%.
Figure 10 shows that all the line switching solutions provided by the proposed methodology relieved the voltage violation on bus 249.
Simulation studies on the 2746-bus system showed that the proposed methodology is able to effectively solve the problems of voltage violations, and that the computation time is also satisfactory for online application in large-scale systems.

6. Conclusions

This paper proposed a novel online methodology of line switching for relieving voltage violations. The proposed methodology employs a three-stage strategy that contains screening, ranking, and detailed analysis and assessment stages. The proposed methodology balances speed and accuracy for online applications by combining linear and nonlinear methods to relieve voltage violations.
One distinguishing feature of the proposed methodology is that it can provide a set of high-quality solutions from which operators may select a preferred solution. Numerical schemes and methods were developed and implemented for each stage of the proposed methodology. It was evaluated on the IEEE 39-bus and 2746-bus power systems with promising results. The results provided by exact AC power flow were used as a benchmark to compare the speed and accuracy of the proposed three-stage methodology.
The results showed that the proposed methodology can provide single-line switching as well as multiple-line switching to relieve voltage violations. Compared with the method in [28], the proposed method shows more advantages in accuracy and speed. In addition, compared with AC power flow, the three-stage methodology requires less CPU time, especially in a large-scale system. A numerical study was conducted on the 2746-bus power system and revealed the fast speed (a speed-up of 9905.32% over AC power flow) and effectiveness of the proposed methodology when applied to large-scale systems, showing good potential for online applications.

Author Contributions

Conceptualization, Z.S.; Methodology, Z.S.; Software, Z.S.; Validation, Z.S.; Writing—Original Draft Preparation, Z.S.; Writing—Review and Editing, Z.S.; Supervision, Y.T.; Data Curation, J.Y., B.Z., C.C., G.Z.

Funding

This research was funded by National Key Research and Development Plan of China (2016YFB0900602); Science and Technology Project of State Grid Corporation of China (XT71-16-032).

Acknowledgments

The authors would like to thank National Key Research and Development Plan of China (2016YFB0900602) and Science and Technology Project of State Grid Corporation of China (XT71-16-032) for its financial support.

Conflicts of Interest

The authors declare no conflict of interest.

References

  1. Song, F.; Wang, Y.; Yan, H.; Zhou, X.; Niu, Z. Increasing the utilization of transmission lines capacity by quasi-dynamic thermal ratings. Energy 2019, 12, 792. [Google Scholar] [CrossRef]
  2. The, J.; Ooi, C.A.; Cheng, Y.H. Composite reliability evaluation of load demand side management and dynamic thermal rating systems. Energy 2018, 11, 466. [Google Scholar] [CrossRef]
  3. PJM Manual 03: Transmission Operations, Revision: 54. 2018. Available online: http://www.pjm.com/~/media/documents/manuals/m03.ashx (accessed on 27 March 2019).
  4. Hedman, W.K.; Oren, S.S.; O’Neil, P.R. A Review of Transmission Switching and Network Topology Optimization. In Proceedings of the IEEE Power and Energy Society General Meeting, Detroit, MI, USA, 24–29 July 2011; pp. 1–7. [Google Scholar]
  5. Rolim, J.G.; Machado, L.J.B. A study of the use of corrective switching in transmission systems. IEEE Trans. Power Syst. 1999, 14, 336–341. [Google Scholar] [CrossRef]
  6. Wang, L.; Chiang, H.D. Toward online bus-bar splitting for increasing load margins to static stability limit. IEEE Trans. Power Syst. 2017, 32, 3715–3725. [Google Scholar] [CrossRef]
  7. Henneaux, P.; Kirschen, D.S. Probabilistic security analysis of optimal transmission switching. IEEE Trans. Power Syst. 2016, 31, 508–517. [Google Scholar] [CrossRef]
  8. Li, M.; Luh, P.B.; Michel, L.D.; Zhao, Q.; Luo, X. Corrective line switching with security constraints for the base and contingency cases. IEEE Trans. Power Syst. 2008, 23, 125–133. [Google Scholar] [CrossRef]
  9. Shao, W.; Vittal, V. Corrective switching algorithm for relieving overloads and voltage violations. IEEE Trans. Power Syst. 2005, 20, 1877–1885. [Google Scholar] [CrossRef]
  10. Shao, W.; Vittal, V. BIP-based OPF for line and bus-bar switching to relieve overloads and voltage violations. In Proceedings of the IEEE Power and Energy Society General Meeting, Atlanta, GA, USA, 29 October–1 November 2006; pp. 2090–2095. [Google Scholar]
  11. Liu, W.L.; Chiang, H.D. Toward On-Line Line Switching Method for Relieving Overloads in Power Systems. In Proceedings of the IEEE Power and Energy Society General Meeting, Denver, CO, USA, 26–30 July 2015; pp. 1–5. [Google Scholar]
  12. Mazi, A.A.; Wollenberg, B.F.; Hesse, M.H. Corrective control of power system flows by line and bus-bar switching. IEEE Trans. Power Syst. 1986, 1, 258–264. [Google Scholar] [CrossRef]
  13. Bacher, R.; Glavitsch, H. Network topology optimization with security constraints. IEEE Trans. Power Syst. 1986, 1, 103–111. [Google Scholar] [CrossRef]
  14. Khanabadi, M.; Ghasemi, H.; Doostizadeh, M. Optimal transmission switching considering voltage security and N–1 contingency analysis. IEEE Trans. Power Syst. 2013, 28, 542–550. [Google Scholar] [CrossRef]
  15. Wrubel, J.N.; Rapcienski, P.S.; Lee, K.L.; Gisin, B.S.; Woodzell, G.W. Practical experience with corrective switching algorithm for on-line applications. IEEE Trans. Power Syst. 1996, 11, 415–421. [Google Scholar] [CrossRef]
  16. Hedman, K.W.; O’Neil, R.P.; Fisher, E.B.; Oren, S.S. Optimal transmission switching-sensitivity analysis and extensions. IEEE Trans. Power Syst. 2008, 23, 1469–1479. [Google Scholar] [CrossRef]
  17. Hou, L.R.; Chian, H.D. Toward Online Line Switching Method for Reducing Transmission Loss in Power Systems. In Proceedings of the IEEE Power and Energy Society General Meeting, Boston, MA, USA, 17–21 July 2016; pp. 1–5. [Google Scholar]
  18. Hedman, K.W.; O’Neil, R.P.; Fisher, E.B.; Oren, S.S. Optimal transmission switching with contingency analysis. IEEE Trans. Power Syst. 2009, 24, 1577–1578. [Google Scholar] [CrossRef]
  19. Escobedo, A.R.; Moreno-Centeno, E.; Hedman, K.W. Topology control for load shed recovery. IEEE Trans. Power Syst. 2014, 29, 908–916. [Google Scholar] [CrossRef]
  20. Fisher, E.B.; O’Neil, R.P.; Ferris, M.C. Optimal transmission switching. IEEE Trans. Power Syst. 2008, 23, 1346–1355. [Google Scholar] [CrossRef]
  21. Mak, T.W.K.; Hentenryck, P.V.; Hiskens, I.A. A Nonlinear Optimization Model for Transient Stable Line Switching. In Proceedings of the American Control Conference (ACC), Seattle, WA, USA, 24–26 May 2017; pp. 2085–2092. [Google Scholar]
  22. Sahraei-Ardakani, M.; Li, X.; Balasubramanian, P.; Hedman, K.W.; Abdi-Khorsand, M. Real-time contingency analysis with transmission switching on real power system data. IEEE Trans. Power Syst. 2016, 31, 2501–2502. [Google Scholar] [CrossRef]
  23. Khodaei, A.; Shahidehpour, M. Transmission switching in security-constrained unit commitment. IEEE Trans. Power Syst. 2010, 24, 1937–1945. [Google Scholar] [CrossRef]
  24. Li, C.; Chiang, H.D.; Du, Z. Investigation of an effective strategy for computing small-signal security margins. IEEE Trans. Power Syst. 2018, 33, 5437–5445. [Google Scholar] [CrossRef]
  25. Wang, L.; Chiang, H.D. Toward online line switching for increasing load margins to static stability limit. IEEE Trans. Power Syst. 2015, 31, 1744–1751. [Google Scholar] [CrossRef]
  26. Liu, C.; Wang, J.; Ostrowski, J. Static switching security in multi-period transmission switching. IEEE Trans. Power Syst. 2012, 27, 1850–1858. [Google Scholar] [CrossRef]
  27. Guo, W.M.; Wei, Q.; Liu, G.J.; Yang, M.; Zhang, X.K. Transmission Switching to Relieve Voltage Violations in Low Load Period. In Proceedings of the IEEE Region, Lyngby, Denmark, 6–9 October 2013; pp. 1–4. [Google Scholar]
  28. Shao, W.; Vittal, V. A New Algorithm for Relieving Overloads and Voltage Violations by Transmission Line and Bus-Bar Switching. In Proceedings of the IEEE PES Power Systems and Exposition, New York, NY, USA, 10–13 October 2004; Volume 1, pp. 322–327. [Google Scholar]
  29. Fu, B.; Ouyang, C.X.; Li, C.S.; Wang, J.W.; Gui, E. An improved mixed integer linear programming approach based on symmetry diminishing for unit commitment of hybrid power system. Energy 2019, 12, 833. [Google Scholar] [CrossRef]
  30. El-Abiad, A.H.; Stagg, G.W. Automatic evaluation of power system performance-effects of line and transformer outages. AIEE Trans. Power Appar. Syst. 1963, 81, 712–715. [Google Scholar] [CrossRef]
  31. Chen, M.; Shi, D.; Li, Y.; Zhu, L.; Liu, H. Research on Branches Group Based Method for Adding Mutual Inductance Branches to Y-Matrix and Z-Matrix. In Proceedings of the IEEE PES Power Systems and Exposition, Boston, MA, USA, 17–21 July 2014; pp. 1–5. [Google Scholar]
  32. Stott, B.; Alsac, O. Fast decoupled load flow. IEEE Trans. Power Appar. Syst. 1974, PAS-93, 859–869. [Google Scholar] [CrossRef]
  33. Lee, C.Y.; Chen, N. Distribution factors of reactive power flow in transmission line and transformer outage studies. IEEE Trans. Power Syst. 1992, 7, 194–200. [Google Scholar] [CrossRef]
Figure 1. Architecture of the proposed three-stage solution methodology.
Energies 12 01206 g001
Figure 2. Transmission line π-equivalent model.
Energies 12 01206 g002
Figure 3. Transmission line reactive power flow model.
Energies 12 01206 g003
Figure 4. Pre-switch state of the power system.
Energies 12 01206 g004
Figure 5. Post-switch state of the power system.
Energies 12 01206 g005
Figure 6. Simulated state of the power system.
Energies 12 01206 g006
Figure 7. Flow chart of the proposed methodology.
Energies 12 01206 g007
Figure 8. The voltage of bus 26 for the pre-switching and post-switching systems.
Energies 12 01206 g008
Figure 9. The voltage of bus 26 for the pre-switching and post-switching systems.
Energies 12 01206 g009
Figure 10. The voltages of bus 249 for the pre-switching and post-switching systems.
Energies 12 01206 g010
Table 1. Result of single lines switched off.
Stage 1
Screening
Stage 2
Ranking
Stage 3
Detailed Analysis and Assessment
Effective CandidatesHighly Ranked CandidatesΔV26ErrorTop CandidatesNAMV26/p.u.
2–35–68–926–29−0.0109−0.001928–291.60091.0326
3–47–821–2226–28−0.0062−0.002826–291.21971.0366
4–146–716–2126–27−0.00220.026826–280.85761.0404
6–1116–2428–292–3−0.0010−0.006821–220.76231.0414
17–1822–234–528–29−0.0008−0.01602–30.74331.0416
10–1126–2726–2916–21−0.00070.0010/
5–826–28/21–22−0.0006−0.0074
The error is the difference between the actual voltage variation and the calculated value ΔV26.
Table 2. CPU time required for the example (seconds).
The Proposed MethodologyAC Power FlowSpeed-Up
Stage 1Stage 2Stage 3Total
0.00070.00260.10210.10540.9766826.57%
Table 3. Results of multiple lines switched off.
Stage 1
Screening
Stage 2
Ranking
Stage 3
Detailed Analysis and Assessment
Effective CandidatesHighly Ranked CandidatesΔV26ErrorTop CandidatesNAMV26/p.u.
2–35–68–928–29, 21–22−0.0317−0.002528–29, 21–222.95411.0184
3–47–821–222–3, 28–29−0.0315−0.00212–3, 28–292.89691.0190
4–146–716–2126–29, 21–22−0.0272−0.002126–29, 21–222.48711.0233
6–1116–2428–2926–28, 21–22−0.0216−0.003726–29, 2–32.44901.0237
17–1822–234–526–28, 2–3−0.0197−0.005326–28, 21–222.10601.0273
10–1126–2726–2926–29, 2–3−0.0181−0.010826–28, 2–32.07741.0276
5–826–28/2–3, 21–22−0.0159−0.00862–3, 21–222.02971.0281
The error is the difference between the actual voltage variation and the calculated value ΔV26.
Table 4. CPU time required for the example (seconds).
The Proposed MethodologyAC Power FlowSpeed-Up
Stage 1Stage 2Stage 3Total
0.00070.00470.13180.13727.31525231.78%
Table 5. Result of lines switched off.
Stage 1
Screening
Stage 2
Ranking
Stage 3
Detailed Analysis and Assessment
Effective CandidatesHighly Ranked CandidatesTop CandidatesNAMV249/p.u.
7–8350–287249–24717–317–33.21280.9702
7–172588–2460471–437249–3249–31.96231.0392
17–3287–218474–210474–210474–2481.12261.0481
249–3370–2862714–2604474–248/
25–192374–2472460–2714471–210
383–370474–248513–278249–247
374–270471–210553–299374–247
Table 6. CPU time required for the example (seconds).
The Proposed MethodologyAC Power FlowSpeed-Up
Stage 1Stage 2Stage 3Total
0.19690.85921.25322.3093231.05289905.32%

