Article

Insulator Detection Method in Inspection Image Based on Improved Faster R-CNN

School of Electrical and Electronic Engineering, North China Electric Power University, Baoding 071003, China
*
Author to whom correspondence should be addressed.
Energies 2019, 12(7), 1204; https://doi.org/10.3390/en12071204
Submission received: 20 February 2019 / Revised: 20 March 2019 / Accepted: 25 March 2019 / Published: 28 March 2019

Abstract

:
The detection of insulators in power transmission and transformation inspection images is the basis for insulator state detection and fault diagnosis in thereafter. Aiming at the detection of insulators with different aspect ratios and scales and ones with mutual occlusion, a method of insulator inspection image based on the improved faster region-convolutional neural network (R-CNN) is put forward in this paper. By constructing a power transmission and transformation insulation equipment detection dataset and fine-tuning the faster R-CNN model, the anchor generation method and non-maximum suppression (NMS) in the region proposal network (RPN) of the faster R-CNN model were improved, thus realizing a better detection of insulators. The experimental results show that the average precision (AP) value of the faster R-CNN model was increased to 0.818 with the improved anchor generation method under the VGG-16 Net. In addition, the detection effect of different aspect ratios and different scales of insulators in the inspection images was improved significantly, and the occlusion of insulators could be effectively distinguished and detected using the improved NMS.

1. Introduction

As one of the most important infrastructures in power systems, insulators play an important role in the safe operation of transmission lines and substations [1]. However, insulators mostly work outdoors, which makes them prone to becoming dirty, cracked, and damaged, and thus threatens the safety and stability of power grids. For the insulator state detection and fault diagnosis thereafter, the accurate detection of insulators in power transmission and transformation inspection images provides a foundation and is of great importance.
In recent years, the continuous development of helicopters, unmanned aerial vehicles (UAVs), and other high-altitude operation platforms has brought new opportunities to power transmission and transformation inspection work [2]. However, there are the following limitations in the process of manually judging patrol images: Firstly, it relies on inspection personnel with rich professional experience to avoid misjudgments or omissions; secondly, the flood of generated images or video data makes the maintenance speed too slow and the cost too high when only using manual judgment [3]. Therefore, the application of computer vision technologies for the detection of insulators in patrol inspection images has great significance for the running state of intelligent detection of insulators, and it can greatly save manpower and materials whilst also improving monitoring efficiency [4].
At present, the existing insulator image detection methods are mainly divided into two categories: One based on pixels or artificial features, the other based on the deep learning model. In the detection methods of insulators based on pixels or artificial features, the idea of threshold segmentation was adopted in [5], which basically relies on the saturation of the image to extract insulator objects; however, the relatively poor ability to distinguish objects with similar saturation makes it unpractical. In the insulator detection methods based on the deep learning model, Tao G [6] learned insulator characteristics through the convolution neural network in complex aerial images, and then those characteristics were applied to identify a variety of insulators. However, the detection effect of this method is not satisfactory. Deep convolutional neural networks [7] were adopted in [8] to realize insulator status detection. The experimental results showed that a result obtained by the pre-trained model for classification was more accurate than the shallow features by hand-crafted models, which verifies the effectiveness of deep learning to extract object features. The fast region-convolutional neural network (R-CNN) [9] model was adopted in [10] to realize insulator detection in the background of complex aerial photography. This method can only detect the insulators in visible images with a relatively low accuracy. The faster R-CNN [11] was introduced in [12] to detect the spacer bar, pressure sharing ring, and shockproof hammer in the images in power systems; but it is only a direct application of faster R-CNN. The faster R-CNN was introduced in [13] to detect insulators in the images with complex backgrounds, but no improvements were made on the basis of the external characteristics of the insulators and the accuracy was low.
The method based on the deep learning model is rarely applied in insulator detection [14]. When setting the parameters, such as the shape of the object and the object scales, it only satisfies the detection requirements of general objects, and so is not suitable for the insulator object when applying the faster R-CNN directly to insulator image detection as it causes false detection, missed detection, and other problems. Therefore, further study is needed into the faster R-CNN model which also considers the intrinsic characteristics of insulators. In view of this, a method for insulator detection in inspection images based on an improved faster R-CNN is presented in this paper.

2. Description of Problem

It is extremely difficult to detect insulators accurately in transmission lines with deep learning. The difficulties mainly lie in the following two aspects: First, in the power system, the insulators have different aspect ratios and dimensions due to the special functions of the insulators and the different distances away of the inspection machines; second, the insulators have serious occlusion problems due to the complexity of the outdoor environment. These problems greatly increase the difficulty of insulator detection based on the deep learning detection model.

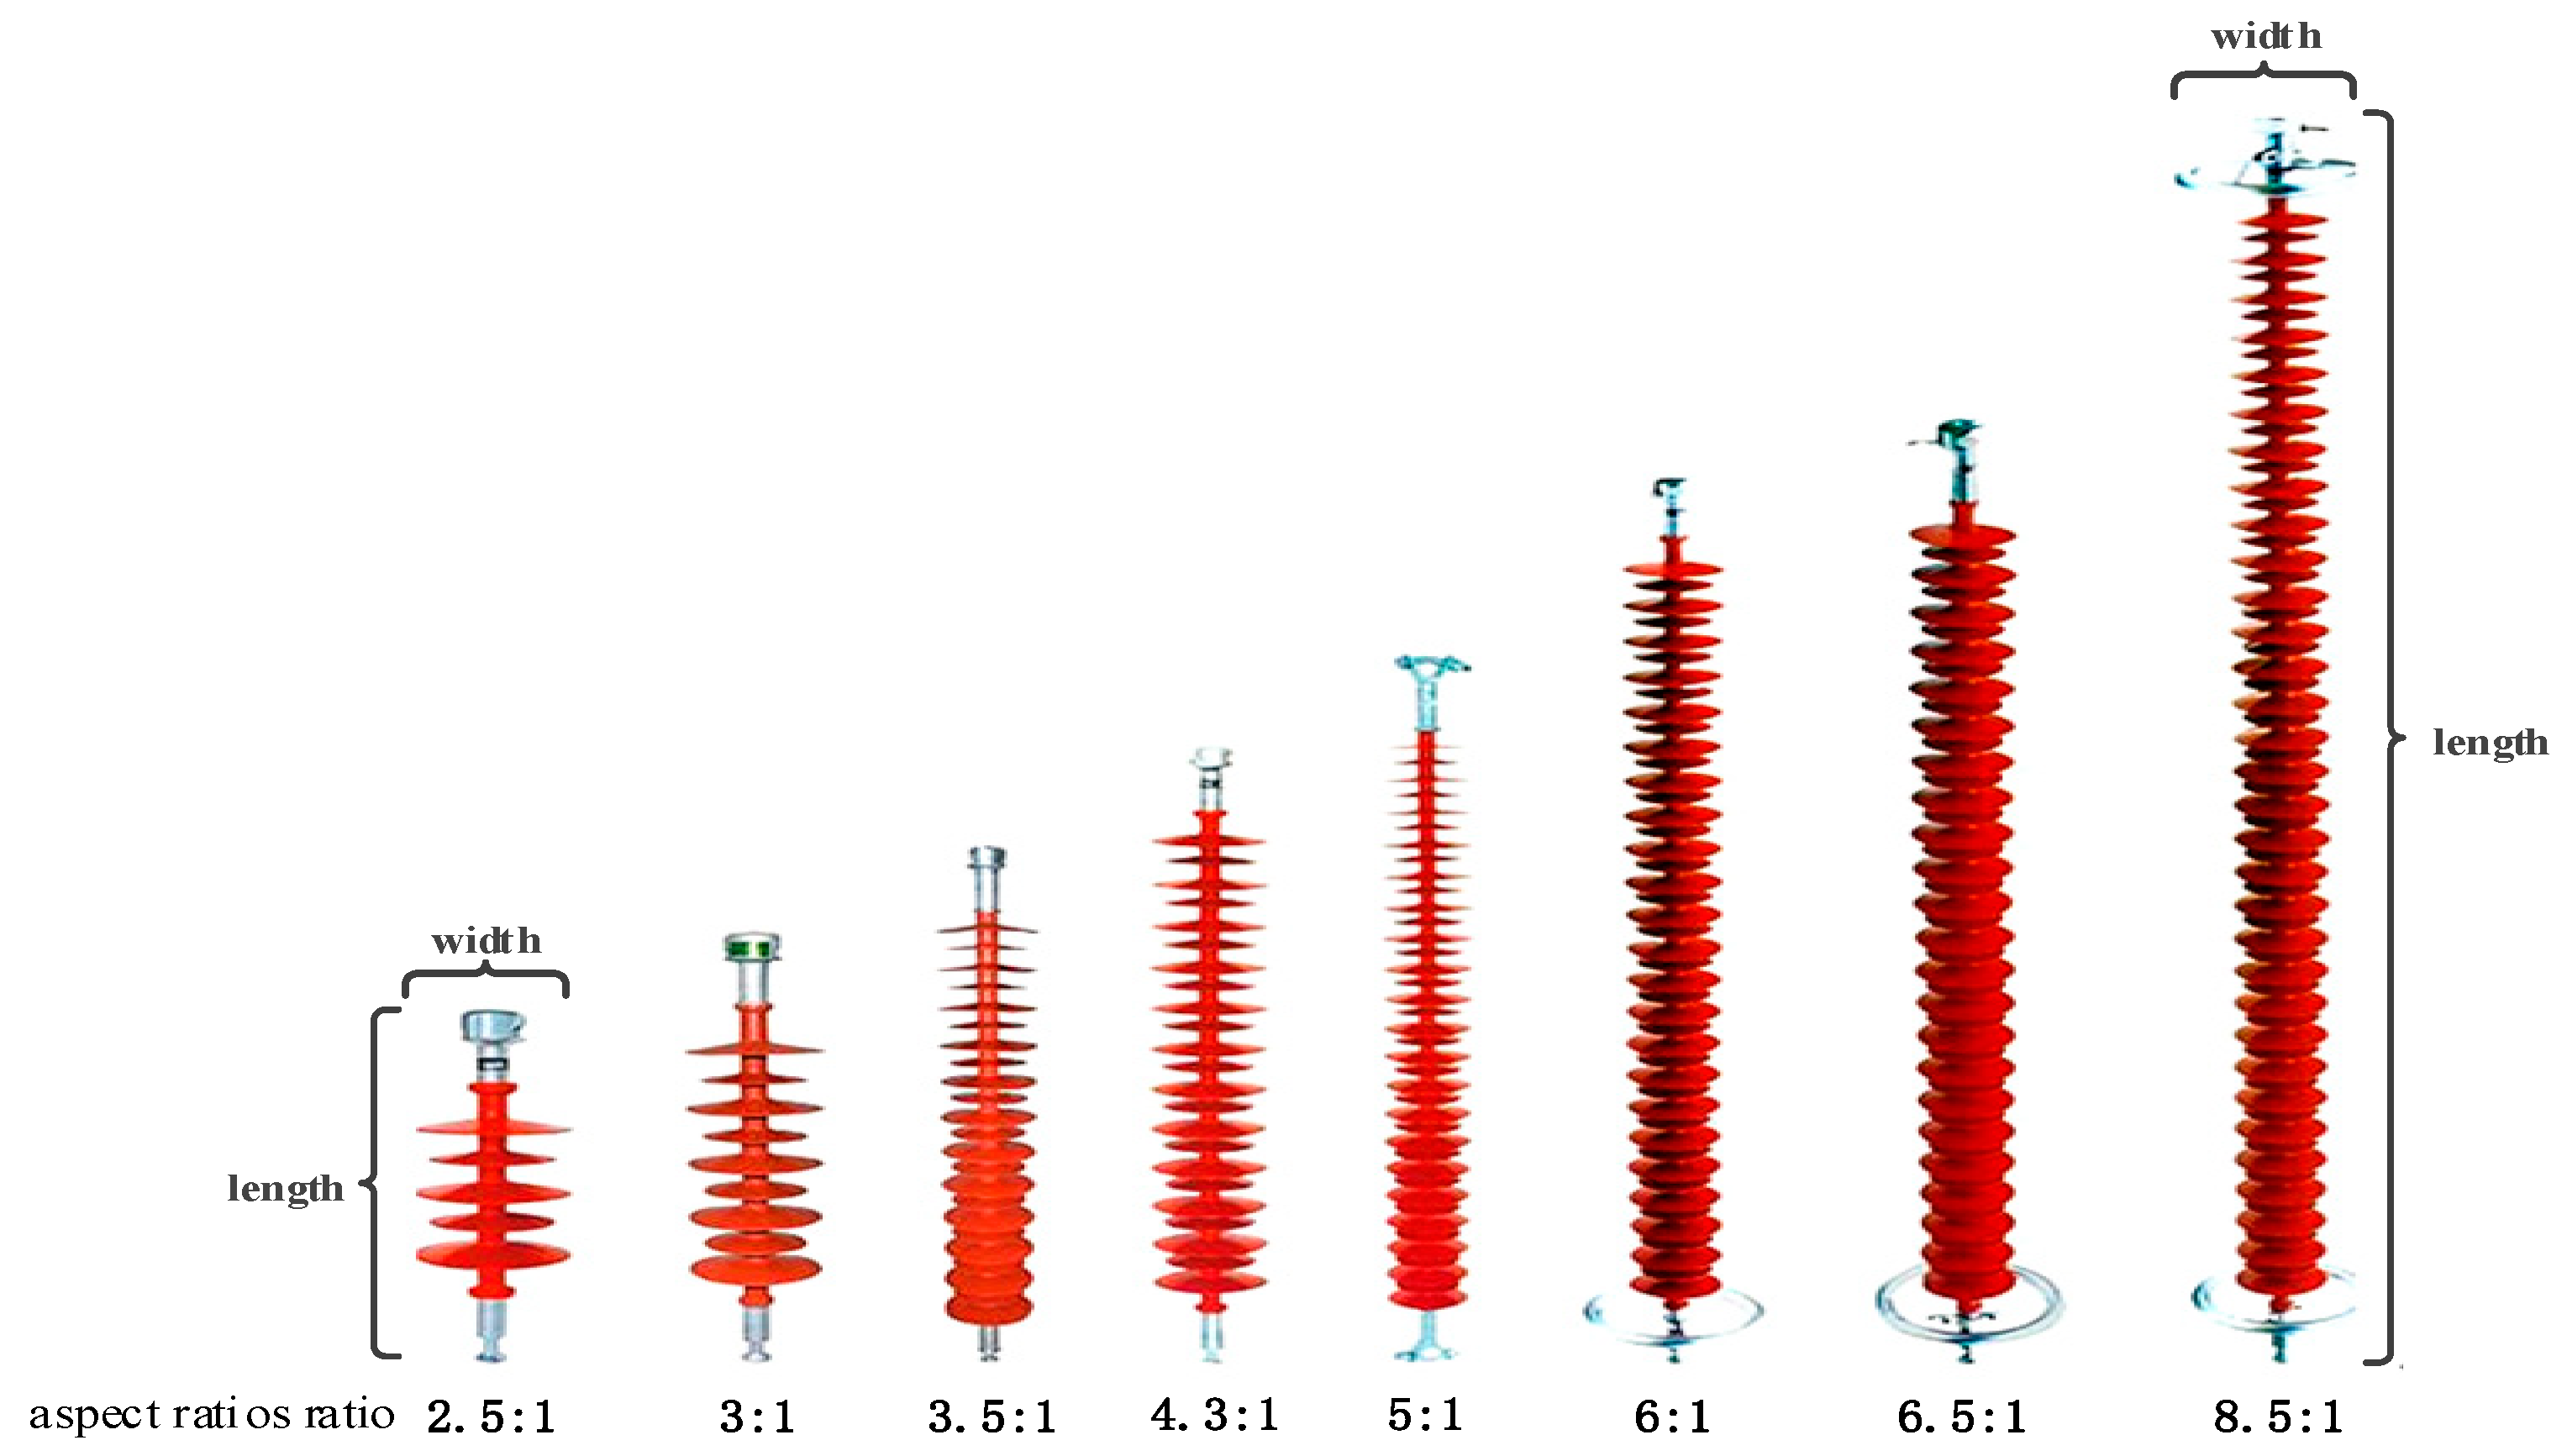
2.1. Insulator Detection with Different Aspect Ratios and Different Scales

In the classic faster R-CNN models, the setting of an anchor in the region proposal network (RPN) only meets the general object detection requirements; when it comes to the detection of an insulator in inspection images, the detection results are not satisfactory. Some cases of poor insulator detection results in power transmission and transformation inspection images after fine-tuning of faster R-CNN are demonstrated in Figure 1. There are two horizontal insulators whose color is close to the background in Figure 1a. Only a small part of one insulator can be detected, and the size of the output box does not fit the insulator well. In Figure 1b, there are two tilting insulators. The shape of the left insulator umbrella disc is not obvious and it is close to a column. The application of the classical faster R-CNN model fails to detect it. In Figure 1c, the insulators are of various scales. For the insulator in the lower-right corner, because it is small, it is missed in the detection frequently. In Figure 1d, there are two nearly vertical insulators, but the complex background and the mutual-occlusion cause a failure in the detection of both insulators, and furthermore, a false detection is generated. Therefore, it is far from enough to fine-tune the faster R-CNN model by using the constructed professional database. The anchor generation method in the RPN needs to be improved according to the characteristics of insulators from a deeper level.
It can be observed that the insulators have a specific outer shape which is generally slender, and their aspect ratio is numerically slightly larger than general objects. As shown in Figure 2, the aspect ratio of the insulators varies from 2.5:1 to 8.5:1. This inherent characteristic of insulators makes it necessary to adjust the aspect ratio of the anchor in the parameter setting part of the RPN.
In addition, most of the insulator images from the field also vary in size. The reference anchor with the size of 16 × 16 in the original RPN does not meet the requirements for accurate detection of smaller-scale insulators in power transmission and transformation inspection images. Furthermore, after a magnification of the benchmark anchor for three scales (8, 16, 32), the ability to detect small-scale insulators is reduced.
In view of the above two points, to achieve accurate detection of insulators with different aspect ratios and different scales in power transmission and transformation inspection images, the inherent characteristics should be considered and incorporated into the faster R-CNN, and the anchor generation method in the RPN should be modified according to the insulator characteristics.

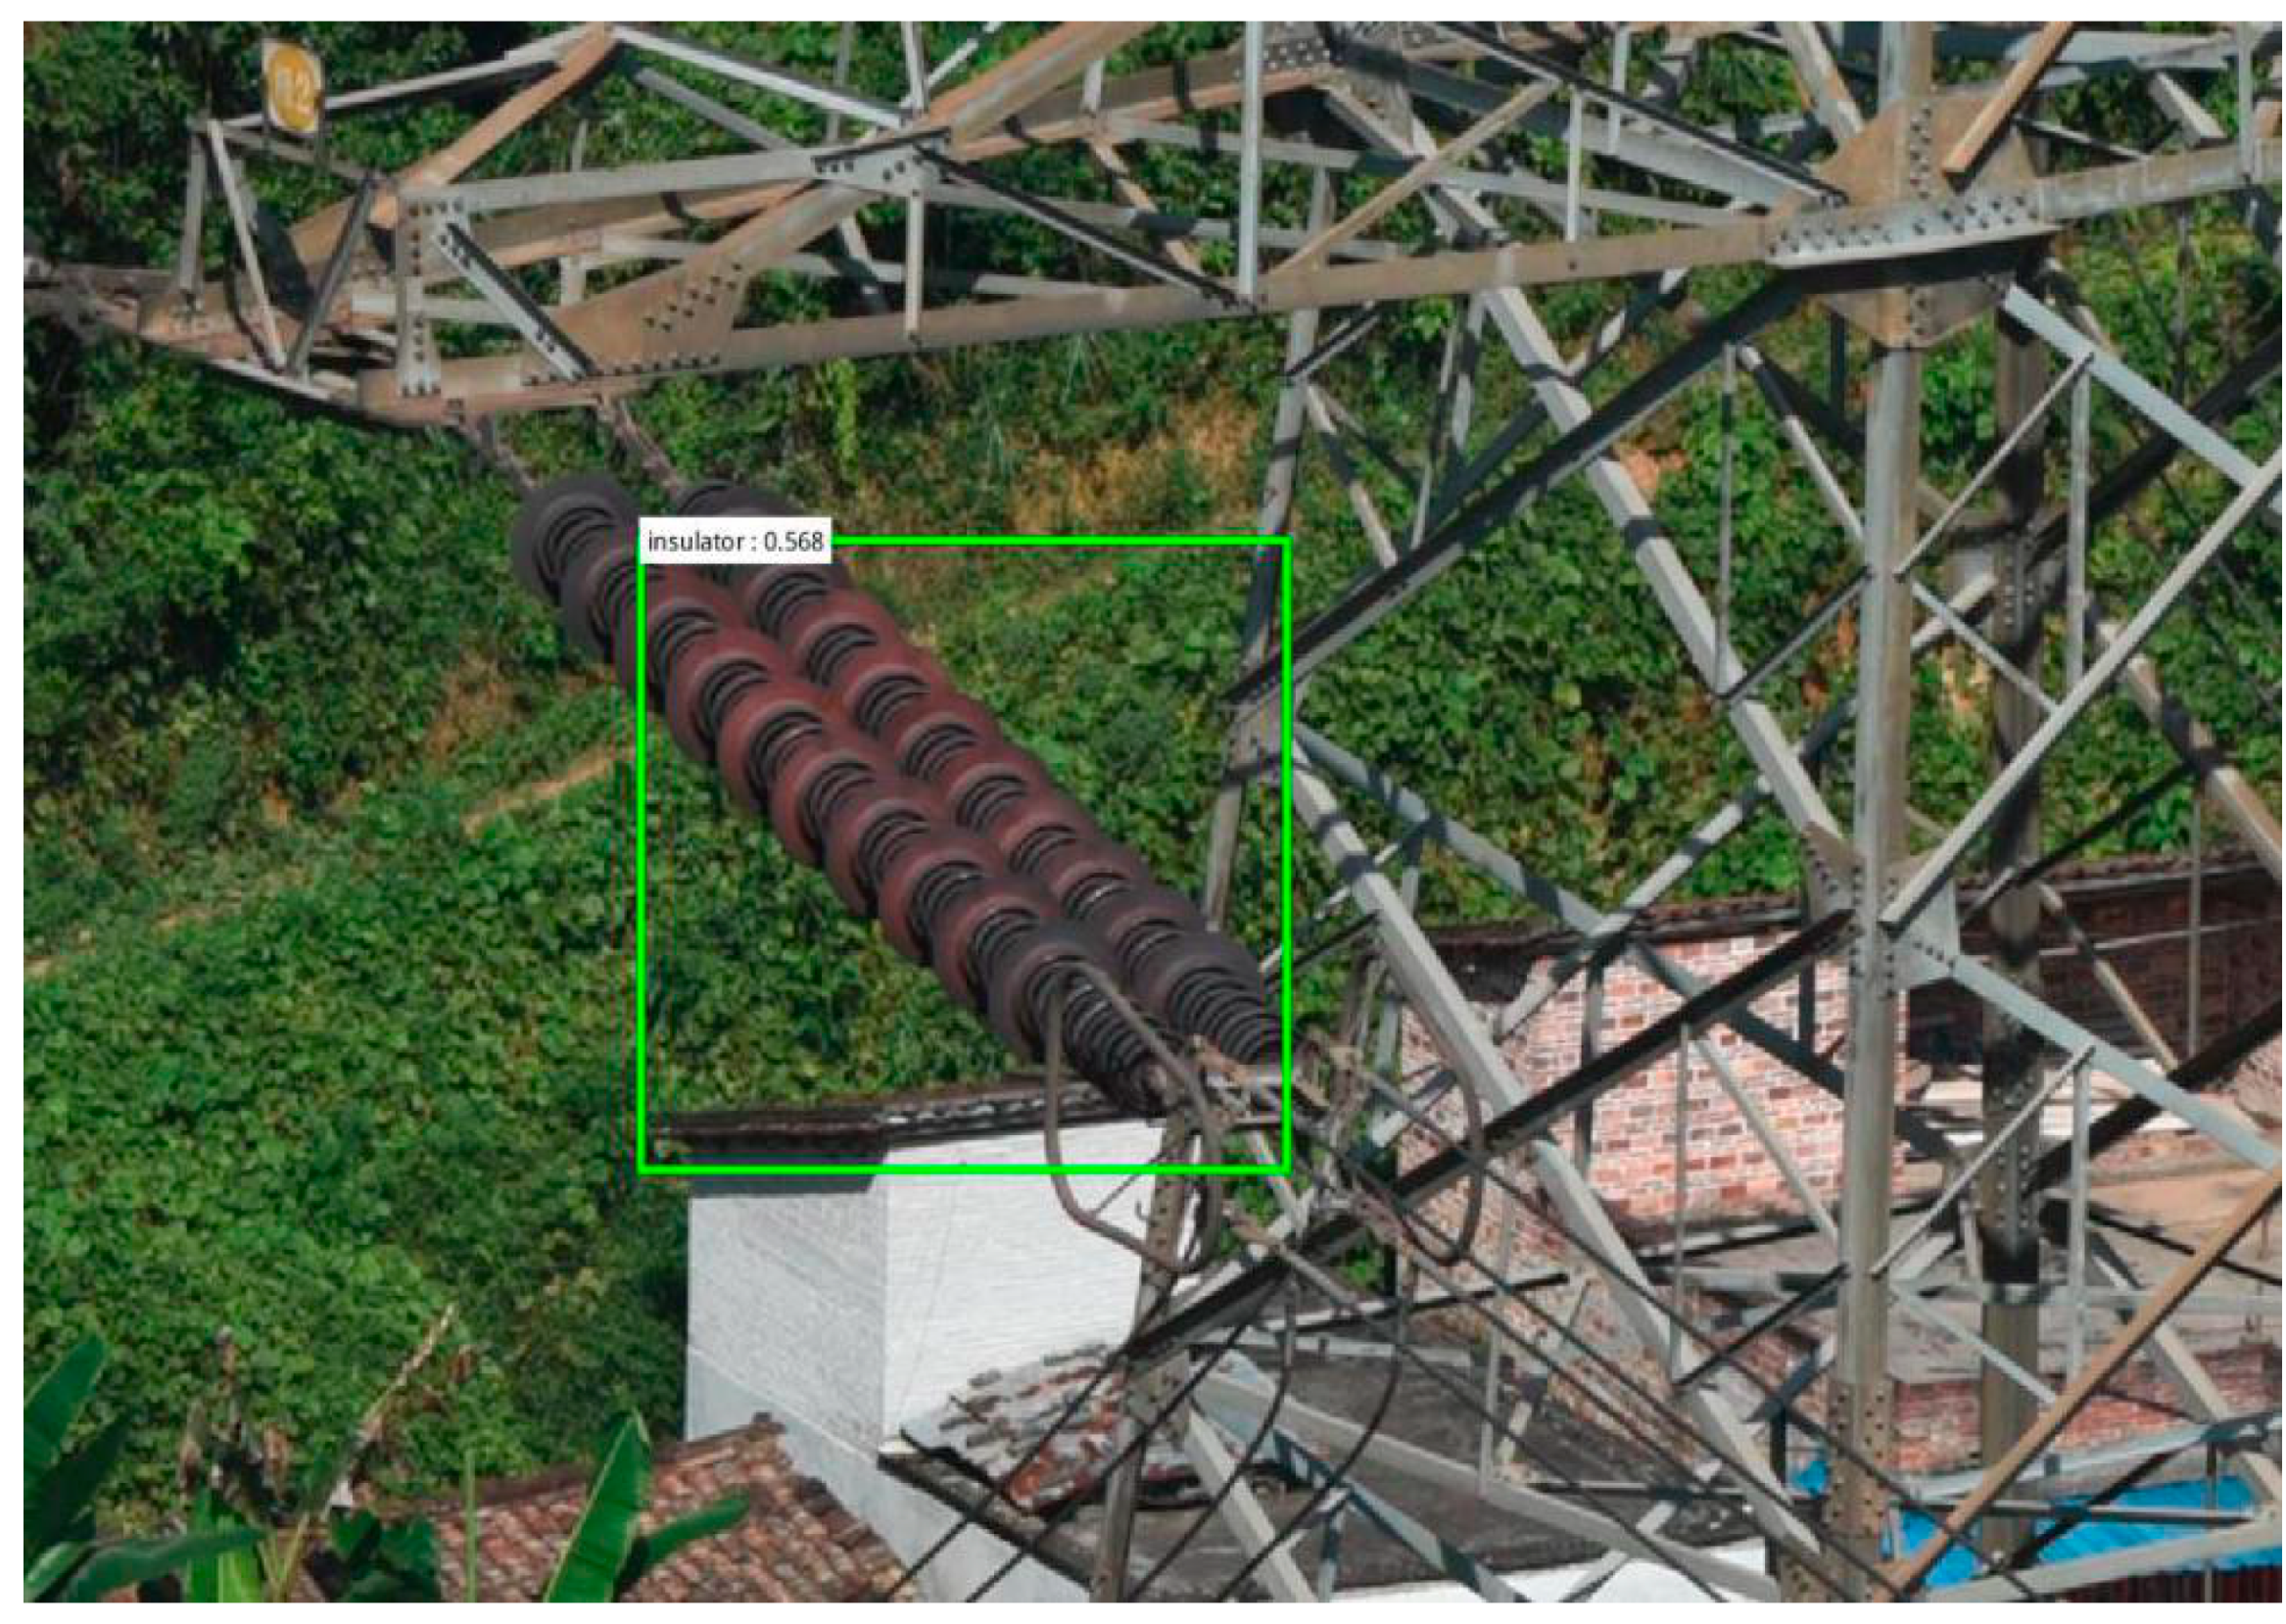
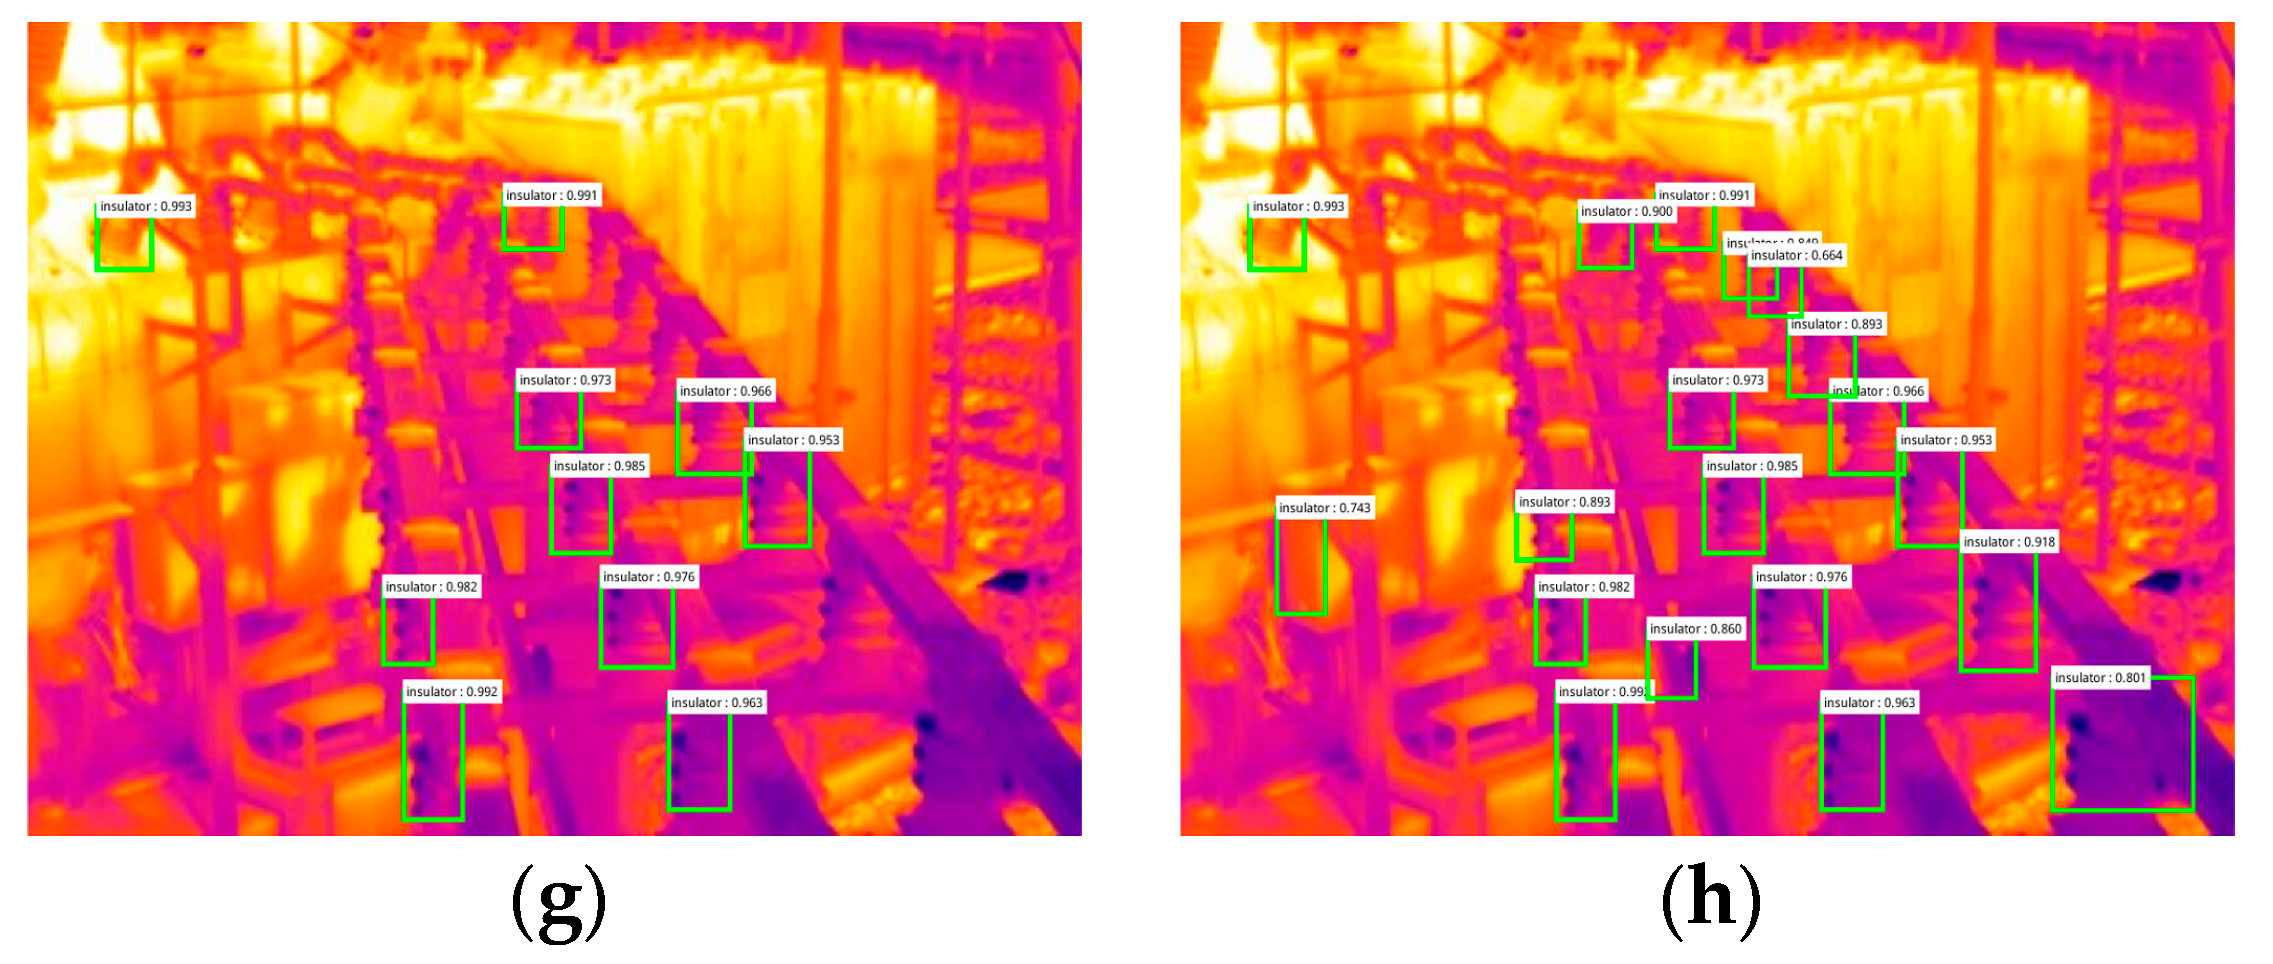
2.2. Insulator Detection Under Mutual Occlusion

Non-maximum suppression (NMS) is a widely applied post-processing algorithm to perform redundant removal in object detections. The traditional NMS which performs greedy clustering based on a fixed threshold is manually designed. It greedily selects the detection results with high scores and deletes those adjacent results that exceed the threshold. Specifically, the bounding boxes are sorted according to the score, and the one with the highest score is retained; while the boxes whose overlapping area with the retained one is larger than a certain ratio are removed. However, as can be seen in Figure 3, this method has the following problem: Only one output box remains for the two insulators blocking each other in the figure after operation of the traditional NMS, that is to say, the two insulators are not accurately detected.
The traditional NMS method mainly suppresses the bounding boxes through the intersection over union (IoU) threshold, but the IoU threshold needs to be manually set. If the IoU threshold is set too high, the bounding box suppression may be insufficient; on the contrary, too low a threshold may lead to multiple correct bounding boxes coming back together. In insulator images obtained in power transmission and patrol inspection, the insulator superposition and occlusion problem often occurs. Aiming specifically at this phenomenon, this paper proposes a more reasonable suppression method based on the traditional NMS algorithm to solve the problem of mutual occlusion of insulators in the image.

3. Insulator Detection Method Based on Improved faster R-CNN

By analyzing the insulator characteristics and the faster R-CNN model, we propose a detection model for the insulator features. The anchor generation method and NMS in the RPN of the faster R-CNN model are improved, respectively. The specific improvement method is as follows.

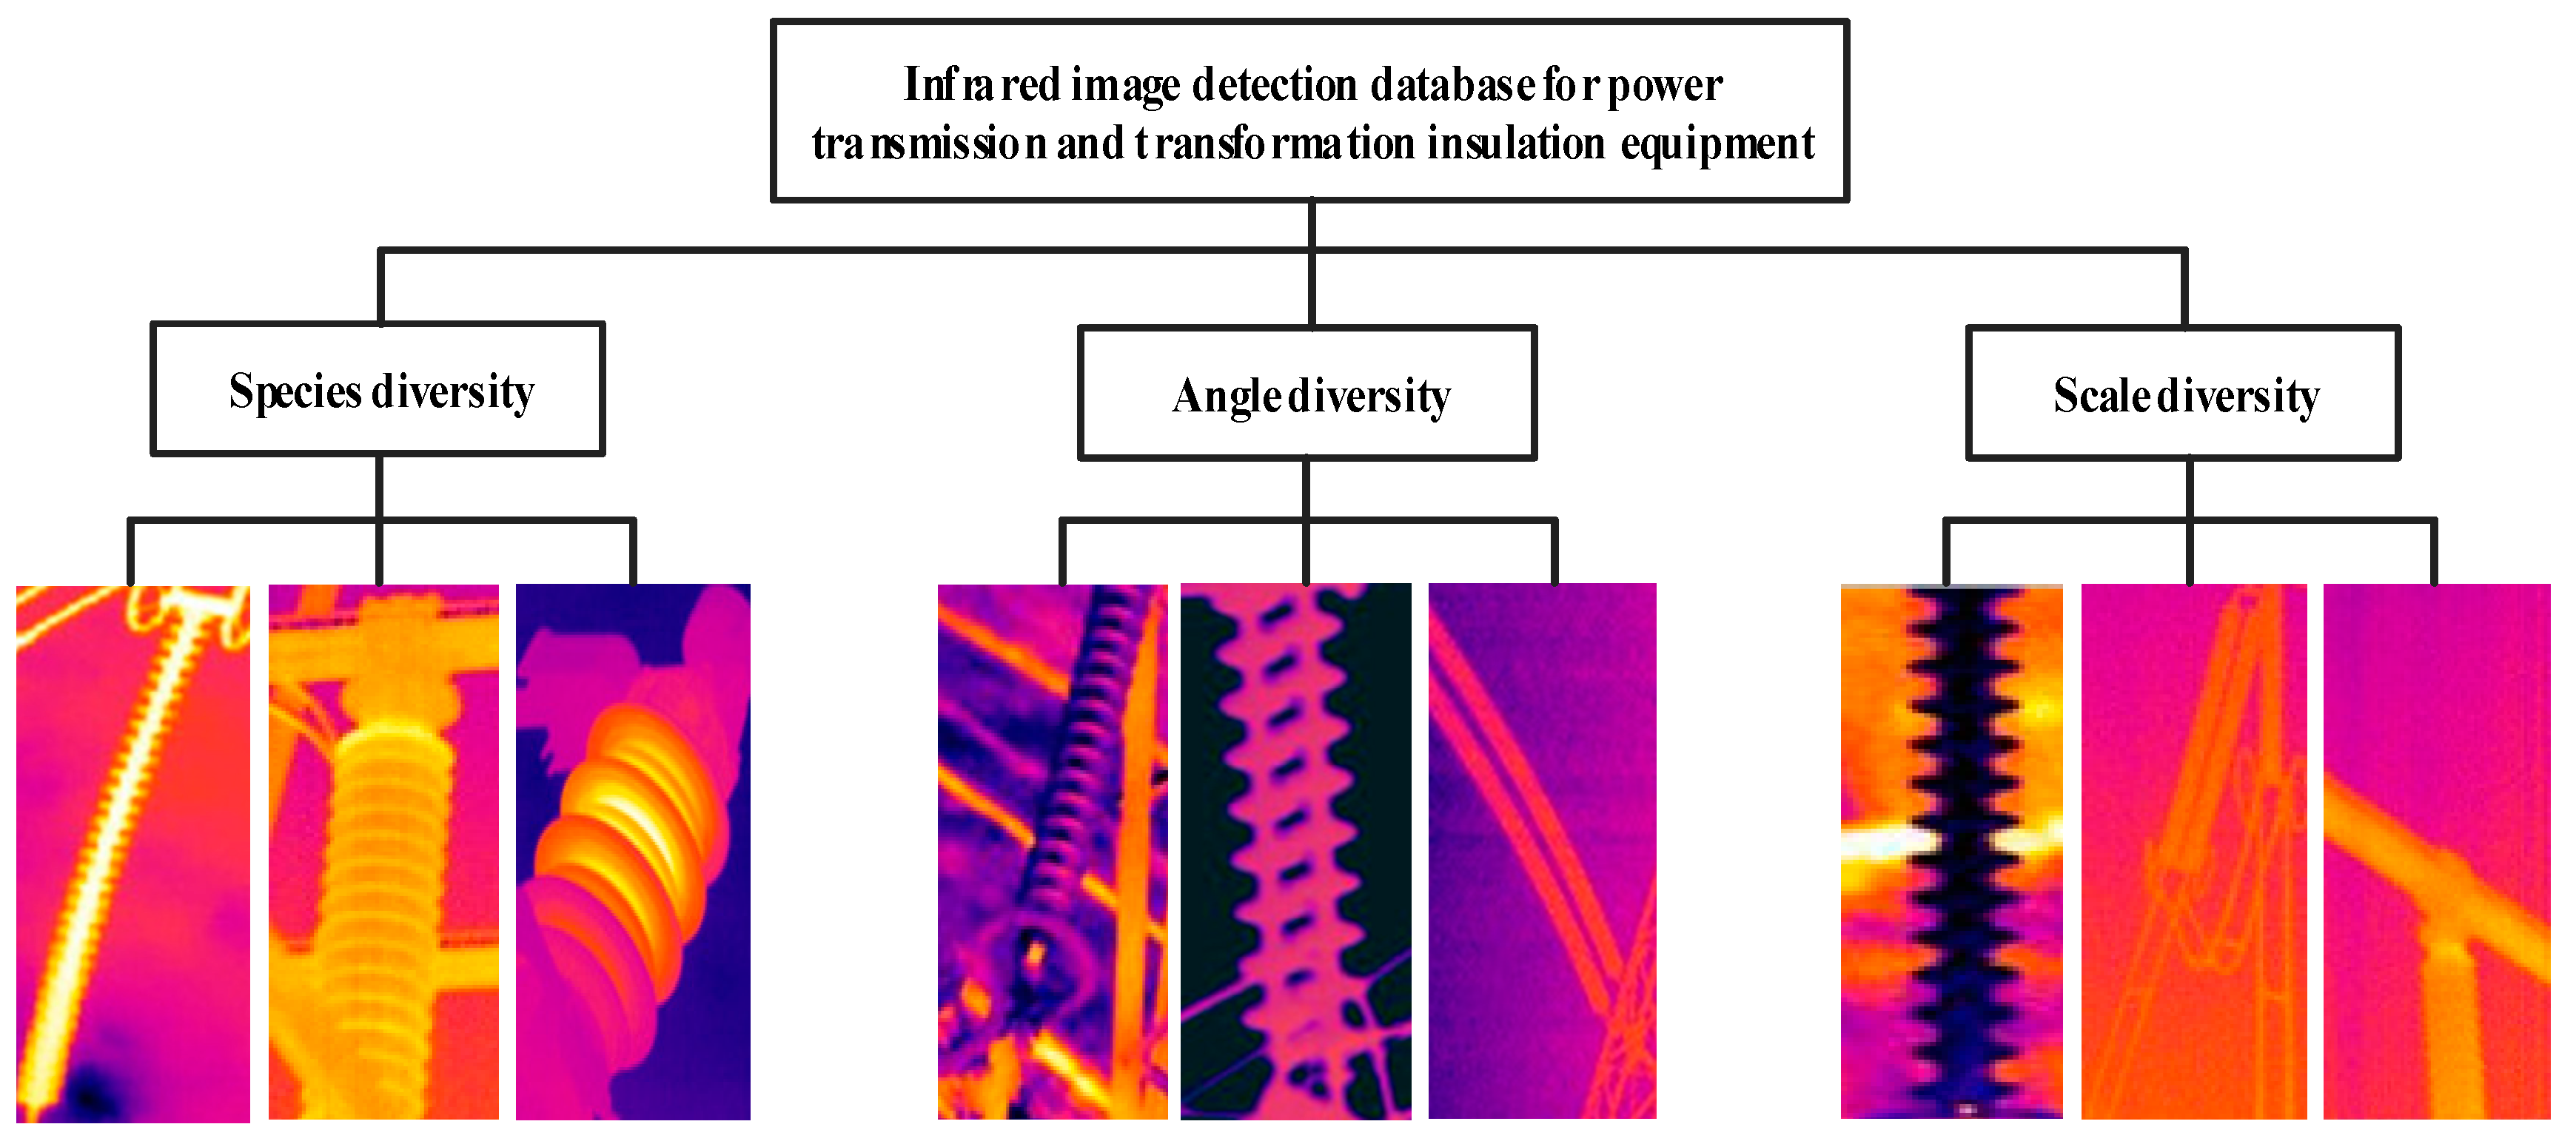
3.1. Construction of Transmission and Transformation Insulation Equipment Detection Database

Deep learning, as a multi-layer and hidden layer representation learning method, is constructed by simple nonlinear modules [15]. These nonlinear modules not only convert the input representation into a more abstract representation but also automatically learn very complex functions [16]. Deep learning relies on a large number of sample images for the training of the models. Therefore, in order to achieve higher insulator detection accuracy, a large number of insulator images are needed as a training set, which enables the neural network to learn features in line with the object characteristics. At present, the design and application of deep learning models is mostly aimed at public data sets of visible light, such as MNIST [17], ImageNet [18], and PASCAL VOC [19], but transformation devices in power system [20] are not included. In order to better understand the characteristics of the insulator, this paper first constructs a professional transmission and transformation electrical insulation equipment detection dataset that only contains transmission and transformation line insulation equipment. It provides a base for studying the method of insulator object detection.
The database of power transmission and transformation equipment constructed in this paper contains 2535 infrared transmission images, with 7343 insulators being labeled. The images acquired on-site are infrared images, which meet the needs of practical applications. Various situations were considered during the selection of the images. About 33 transmission lines, four substations, one converter station, and several indoor high-voltage laboratories of 110~500 kV of different grades across the country were chosen. As regards the materials, the insulators made of glass, porcelain, and composite were all considered; besides, insulators with different angles and different scales, such as top view, bottom view, and head view were selected as well. Figure 4 demonstrates the diversity of the constructed dataset. Altogether, 85% of the total images were used as a training set, and for the remaining images, a total of 380 images and 200 visible images were used as test sets. It is worth noting that we had previously conducted a large number of experiments, indicating that the model trained only with infrared images has no effect on the detection of visible light images, so only the infrared images were trained to avoid repeated work [21]. Using the constructed database to fine-tune the faster R-CNN under the VGG-16 Net [22], the insulator detection effect in the power transmission and patrol images was improved significantly. The average precision (AP) value of the faster R-CNN in the VGG-16 Net reached 0.640. However, the improvement in the method with only fine-tuning does not meet the requirements of insulator detection in the inspection images. How to further improve the detection accuracy on this basis became the issue we focused on.

3.2. Framework of Method

In view of the two problems mentioned above, this paper proposes the faster R-CNN model, which can be considered as a combination of the RPN and the fast R-CNN. Firstly, the RPN and the fast R-CNN part were fine-tuned using the constructed power transmission and transformation equipment detection database. After that, considering the inherent characteristics of the insulator, the anchor generation method and the NMS in the RPN were improved in the fine-tuned RPN. Finally, the improved RPN and the fine-tuned fast R-CNN part were combined to form the improved faster R-CNN model. At this time, the power transmission and patrol images were applied as the test images for insulator detection. In such a way, a more accurate detection effect was achieved. The block diagram of the insulator image detection method based on the improved faster R-CNN model is demonstrated in Figure 5.

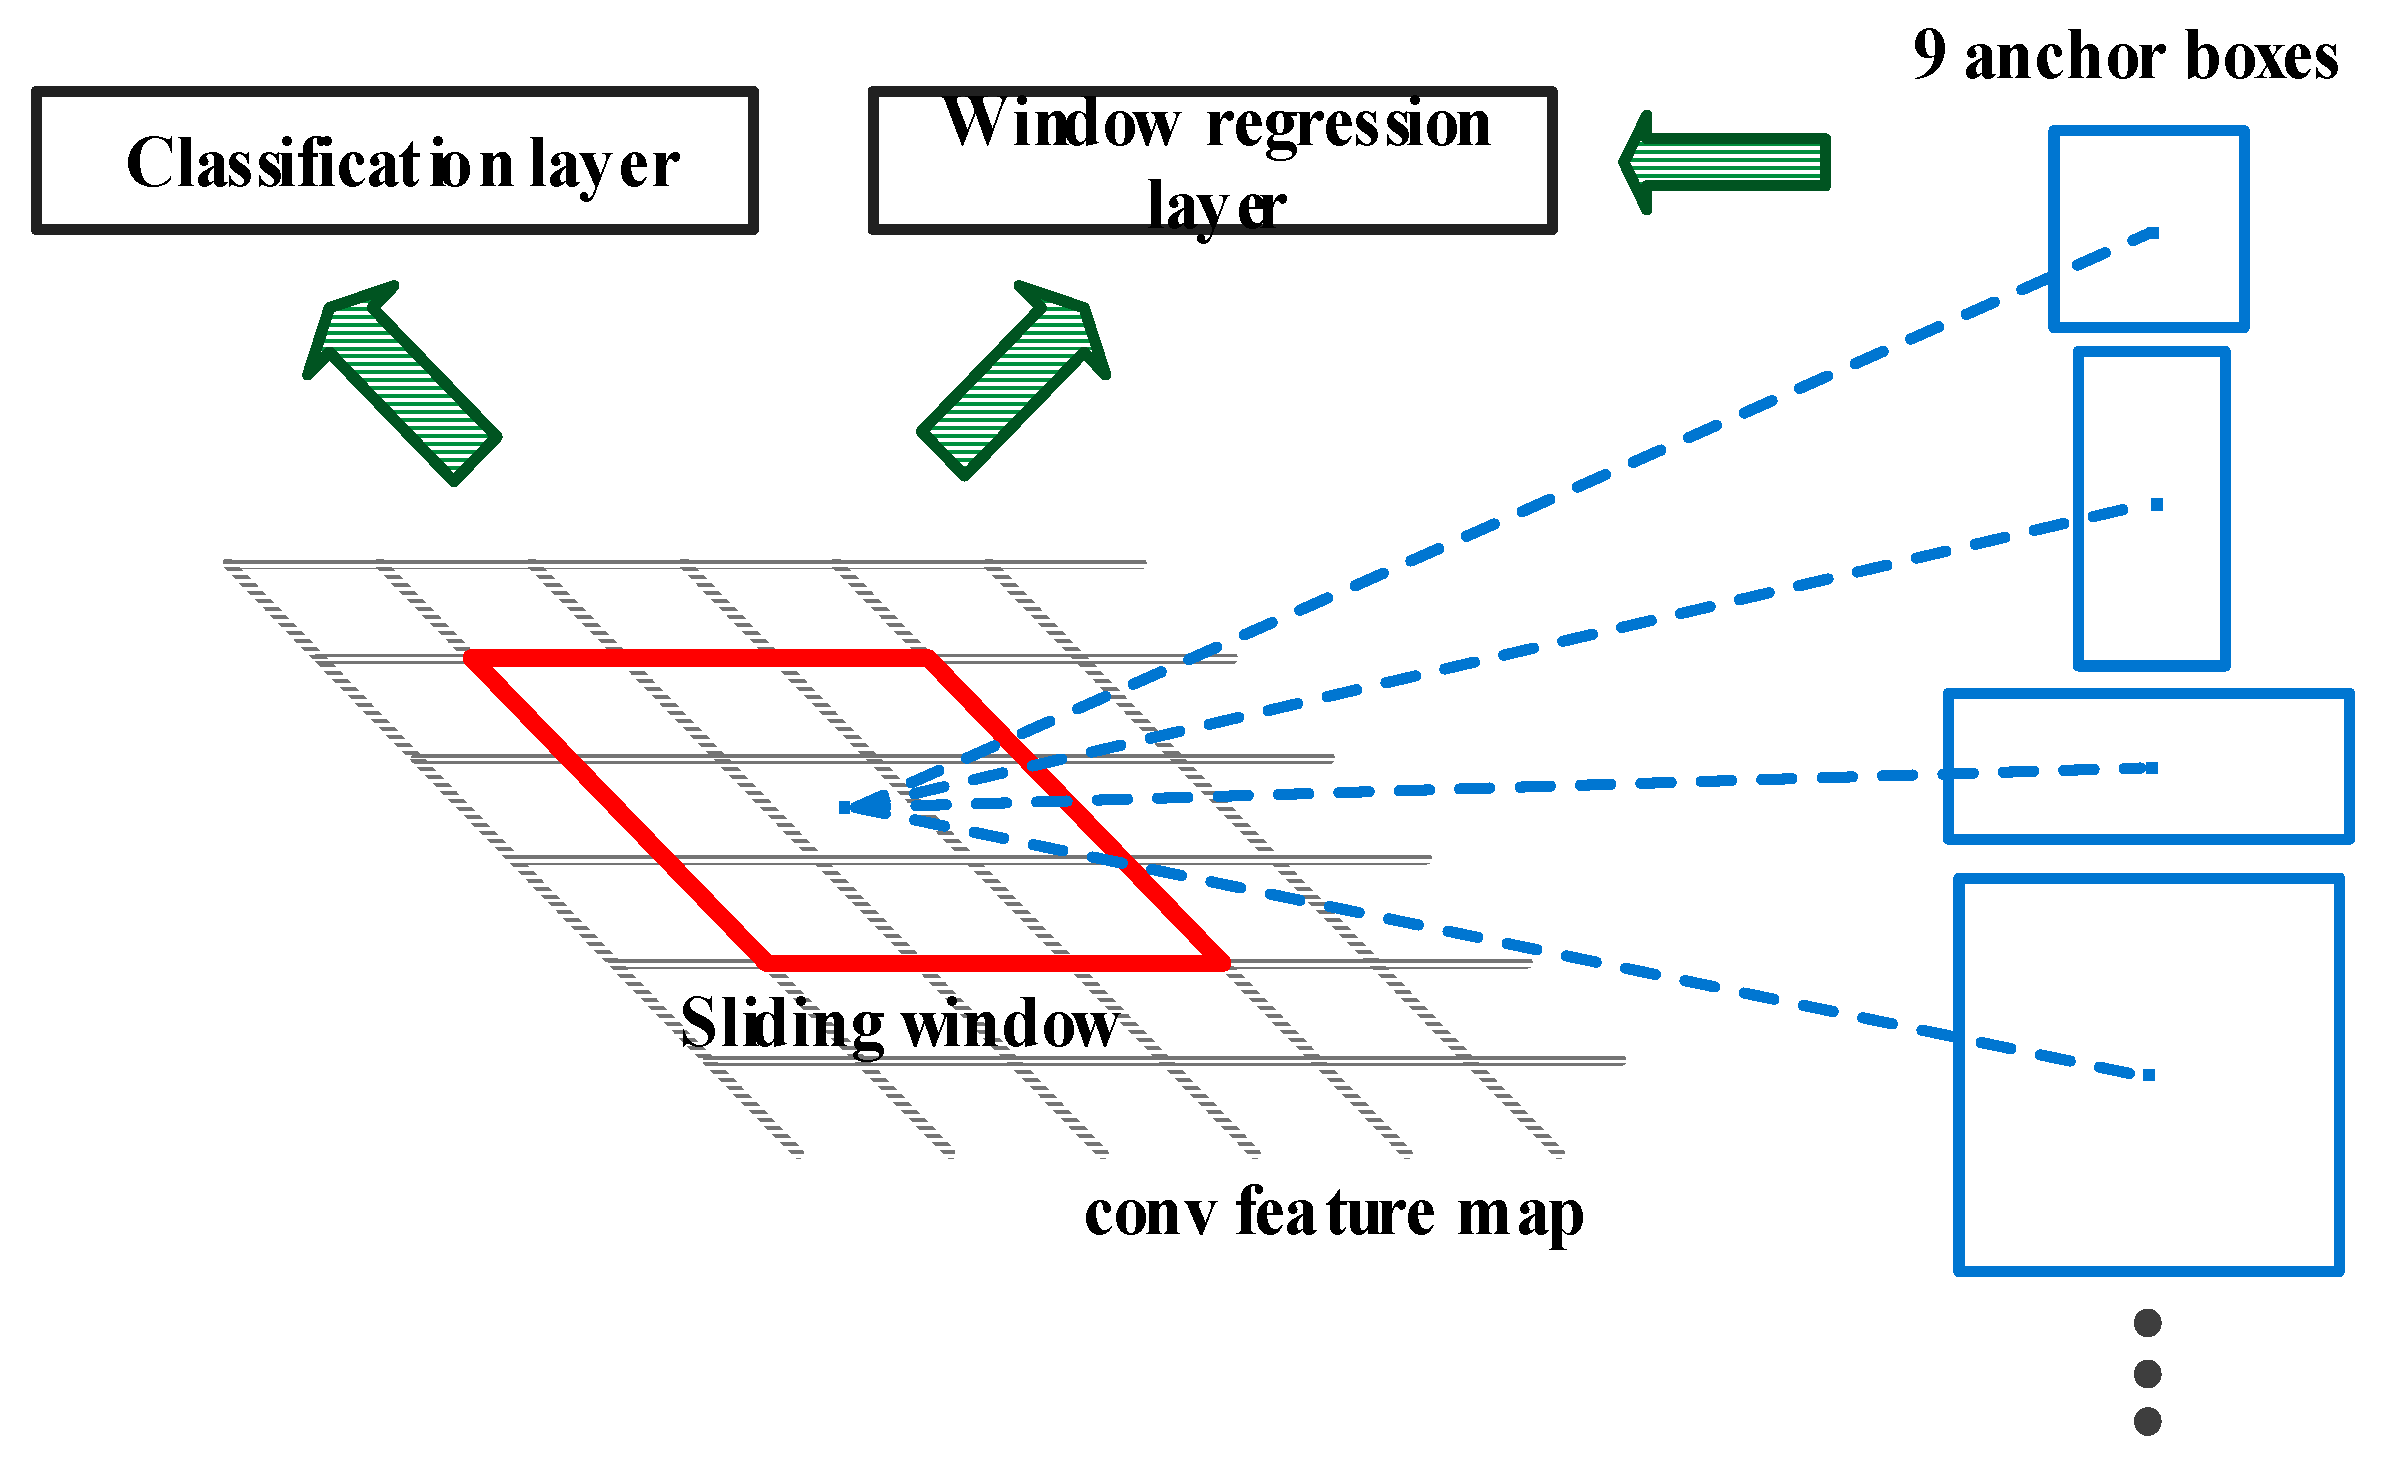
3.3. Anchor Generation Method Improvement

The core of the faster R-CNN model is the use of the RPN to generate candidate object regions. Unlike traditional multi-scale sliding window approaches, the faster R-CNN applies the sliding window to the convolutional feature map generated by the convolutional neural network in the RPN. In order to effectively deal with object detection with different scales, the RPN uses three different types of anchors. The aspect ratios of each anchor are 1:1, 1:2, and 2:1, respectively. Meanwhile, three different scales are applied to each anchor for zooming. To be specific, a reference anchor is set first, and the size of this reference anchor in the faster R-CNN model is 16 × 16. Then, with the reference anchor area staying unchanged, its aspect ratio is set to 1:1, 1:2, and 2:1. The anchors of the three different aspect ratios are then zoomed in by three scales (8, 16, 32), and finally a total of nine anchors are obtained. Figure 6 shows the structure of the generation of region proposals using the RPN, and Figure 7 shows an example of nine different-scale anchors.
Considering the two problems found when detecting the insulators with different aspect ratios and different scales in power transmission and transformation inspection images, to make the detection method more suitable for insulators, the new RPN adopts five different aspect ratios to combine six scaling scales in the improvement of the RPN in the faster R-CNN model. Thus, a total of 30 anchors were obtained. The five aspect ratios are 1:1, 1:2, 1:3, 2:1, and 3:1, and the six scaling scales are 2, 4, 8, 16, 32, and 64, respectively. In order to fit the new scaling scale better, the new anchor size of the benchmark changes from 16 × 16 to 8 × 8.

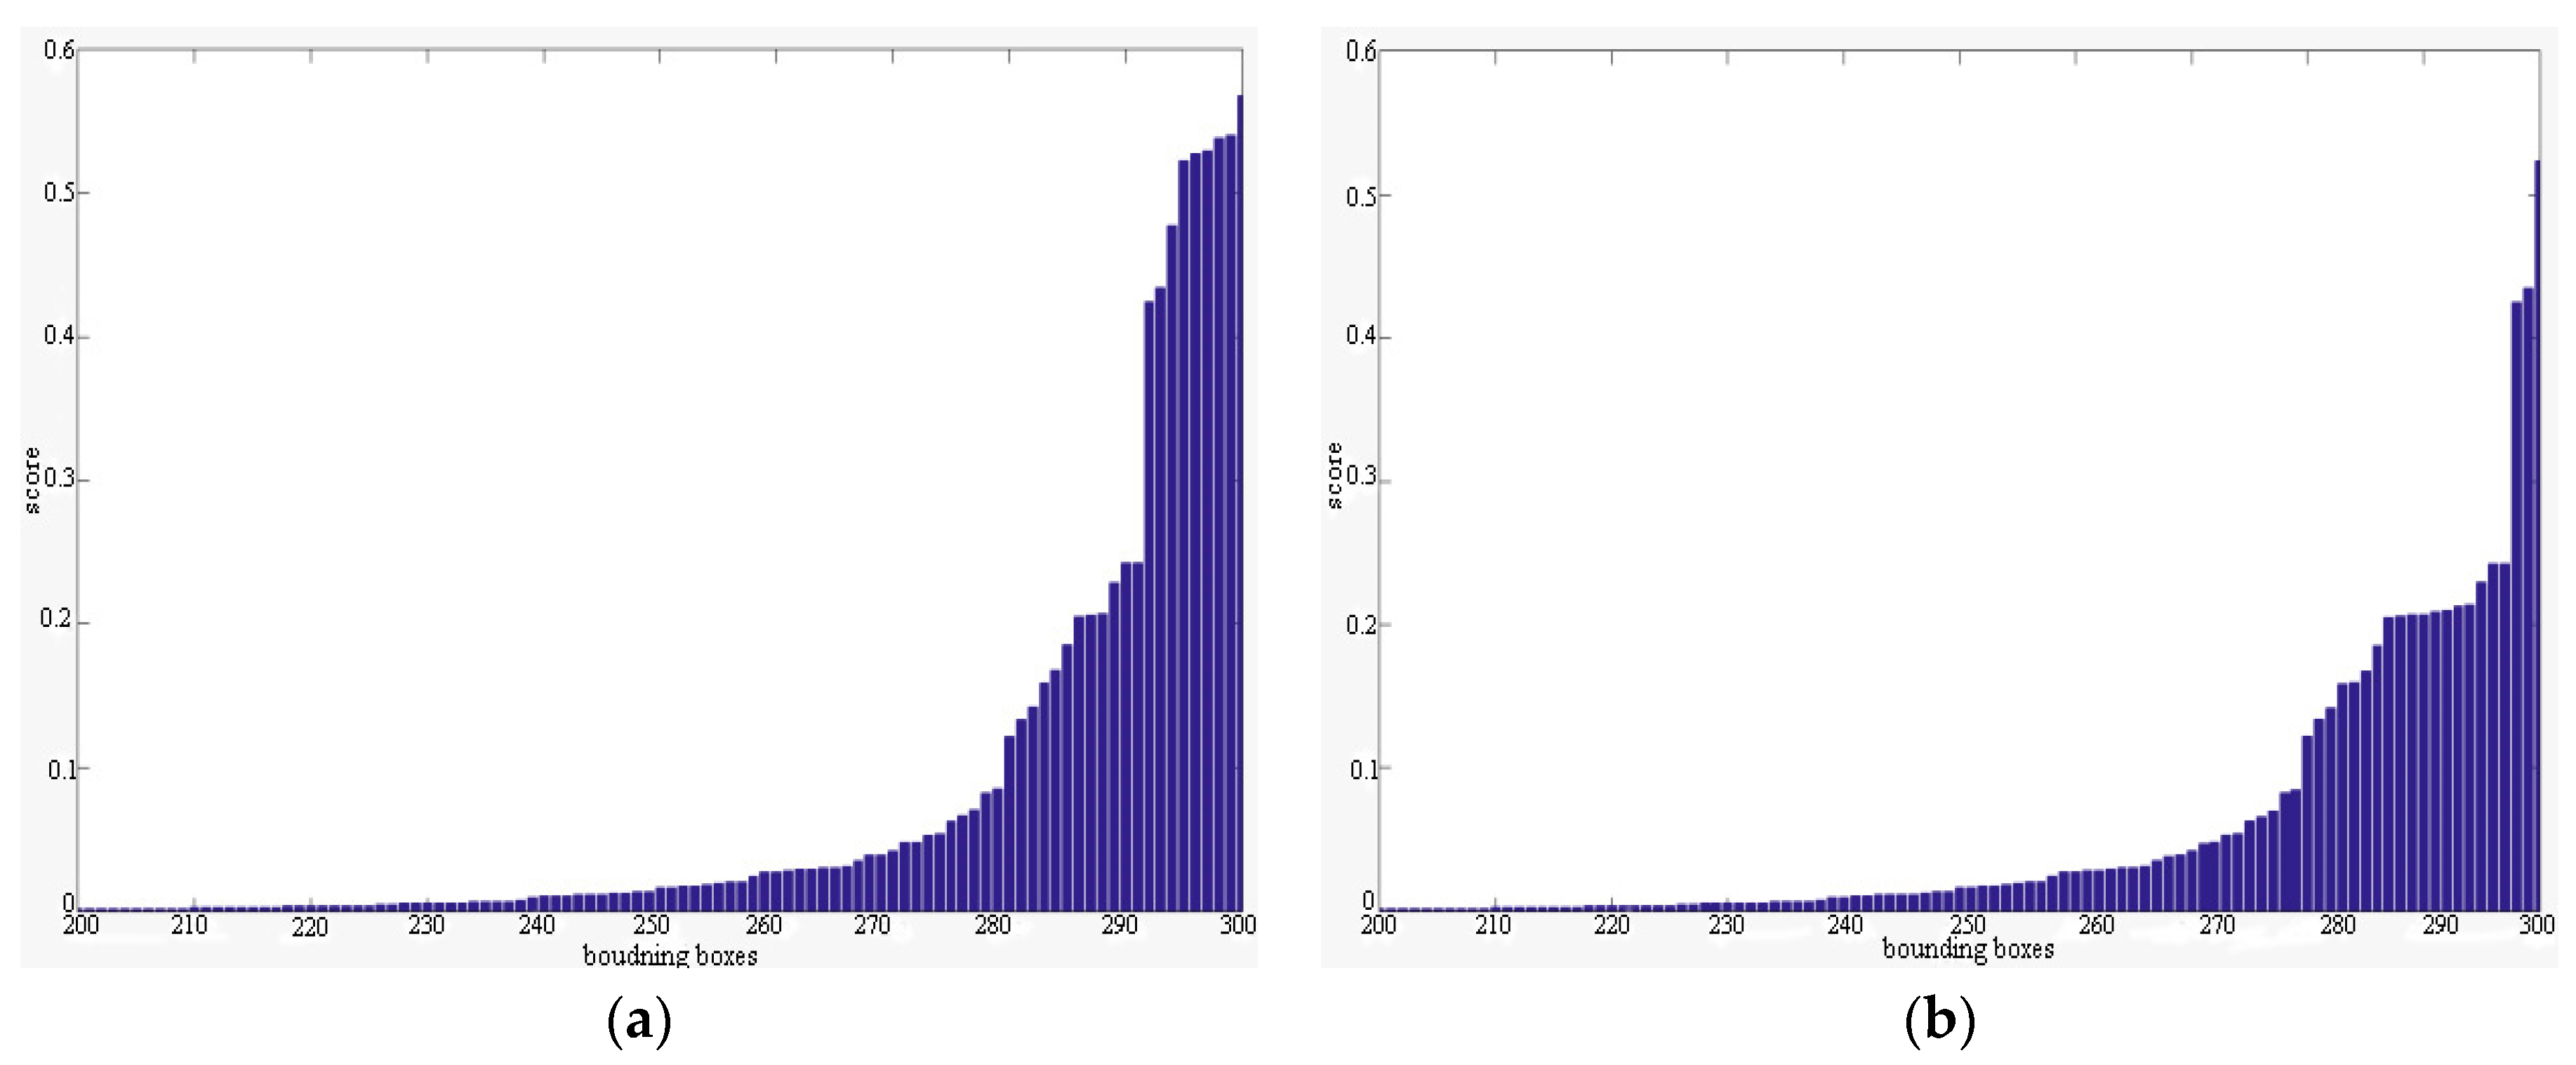
3.4. NMS Improvements

Differing from traditional NMS methods, the improved NMS in this paper reorders the scores according to the function to suppress the obtained bounding box. For the regions generated by faster R-CNN and their corresponding score si, the bounding box M with the highest score is first sorted, and then the remaining bounding box bi and the IoU value of the bounding box iou(M, bi) are calculated (iou(M, bi) ∈ [0,1]). The conventional NMS method reserves a bounding box in which iou(M, bi) is smaller than the threshold according to the manually set IoU threshold Nt, and deletes the bounding box in which iou(M, bi) exceeds the threshold, as shown in Equation (1). In the improvement of the NMS, instead of discarding the box with the IoU value greater than the threshold in the traditional NMS, the scores are reduced by a certain function and then reordered after the transformation, and the final detection result is obtained.
s i = { s i , iou ( M , b i ) < N t 0 , iou ( M , b i ) N t
s i = { s i , iou ( M , b i ) < N t s i e iou ( M , b i ) 2 2 , iou ( M , b i ) N t
Specifically, the bounding boxes score si is transformed according to Equation (2). It can be seen from Equation (2) that through the improved transformation, the higher the overlapping area of the to-be-processed box bi and the highest score box M, the lower the score si of the bi; and the smaller the iou(M, bi) value, the slower the si decreases. Similarly, the larger the iou(M, bi) value, the faster the si decreases. This stops the remaining insulators from being directly removed when there are multiple mutually occluded insulators in the input image, even if the IoU values of the two boxes are too large. At the same time, the IoU value score can be appropriately reduced so that the output result can be displayed as the final detection result.

4. Experimental Results and Analysis

In order to verify the effectiveness of our method, several test pictures in the infrared image detection database of the power transmission and transformation equipment were used to test and observe the experimental results. The analysis of the experimental results was carried out both qualitatively and quantitatively.

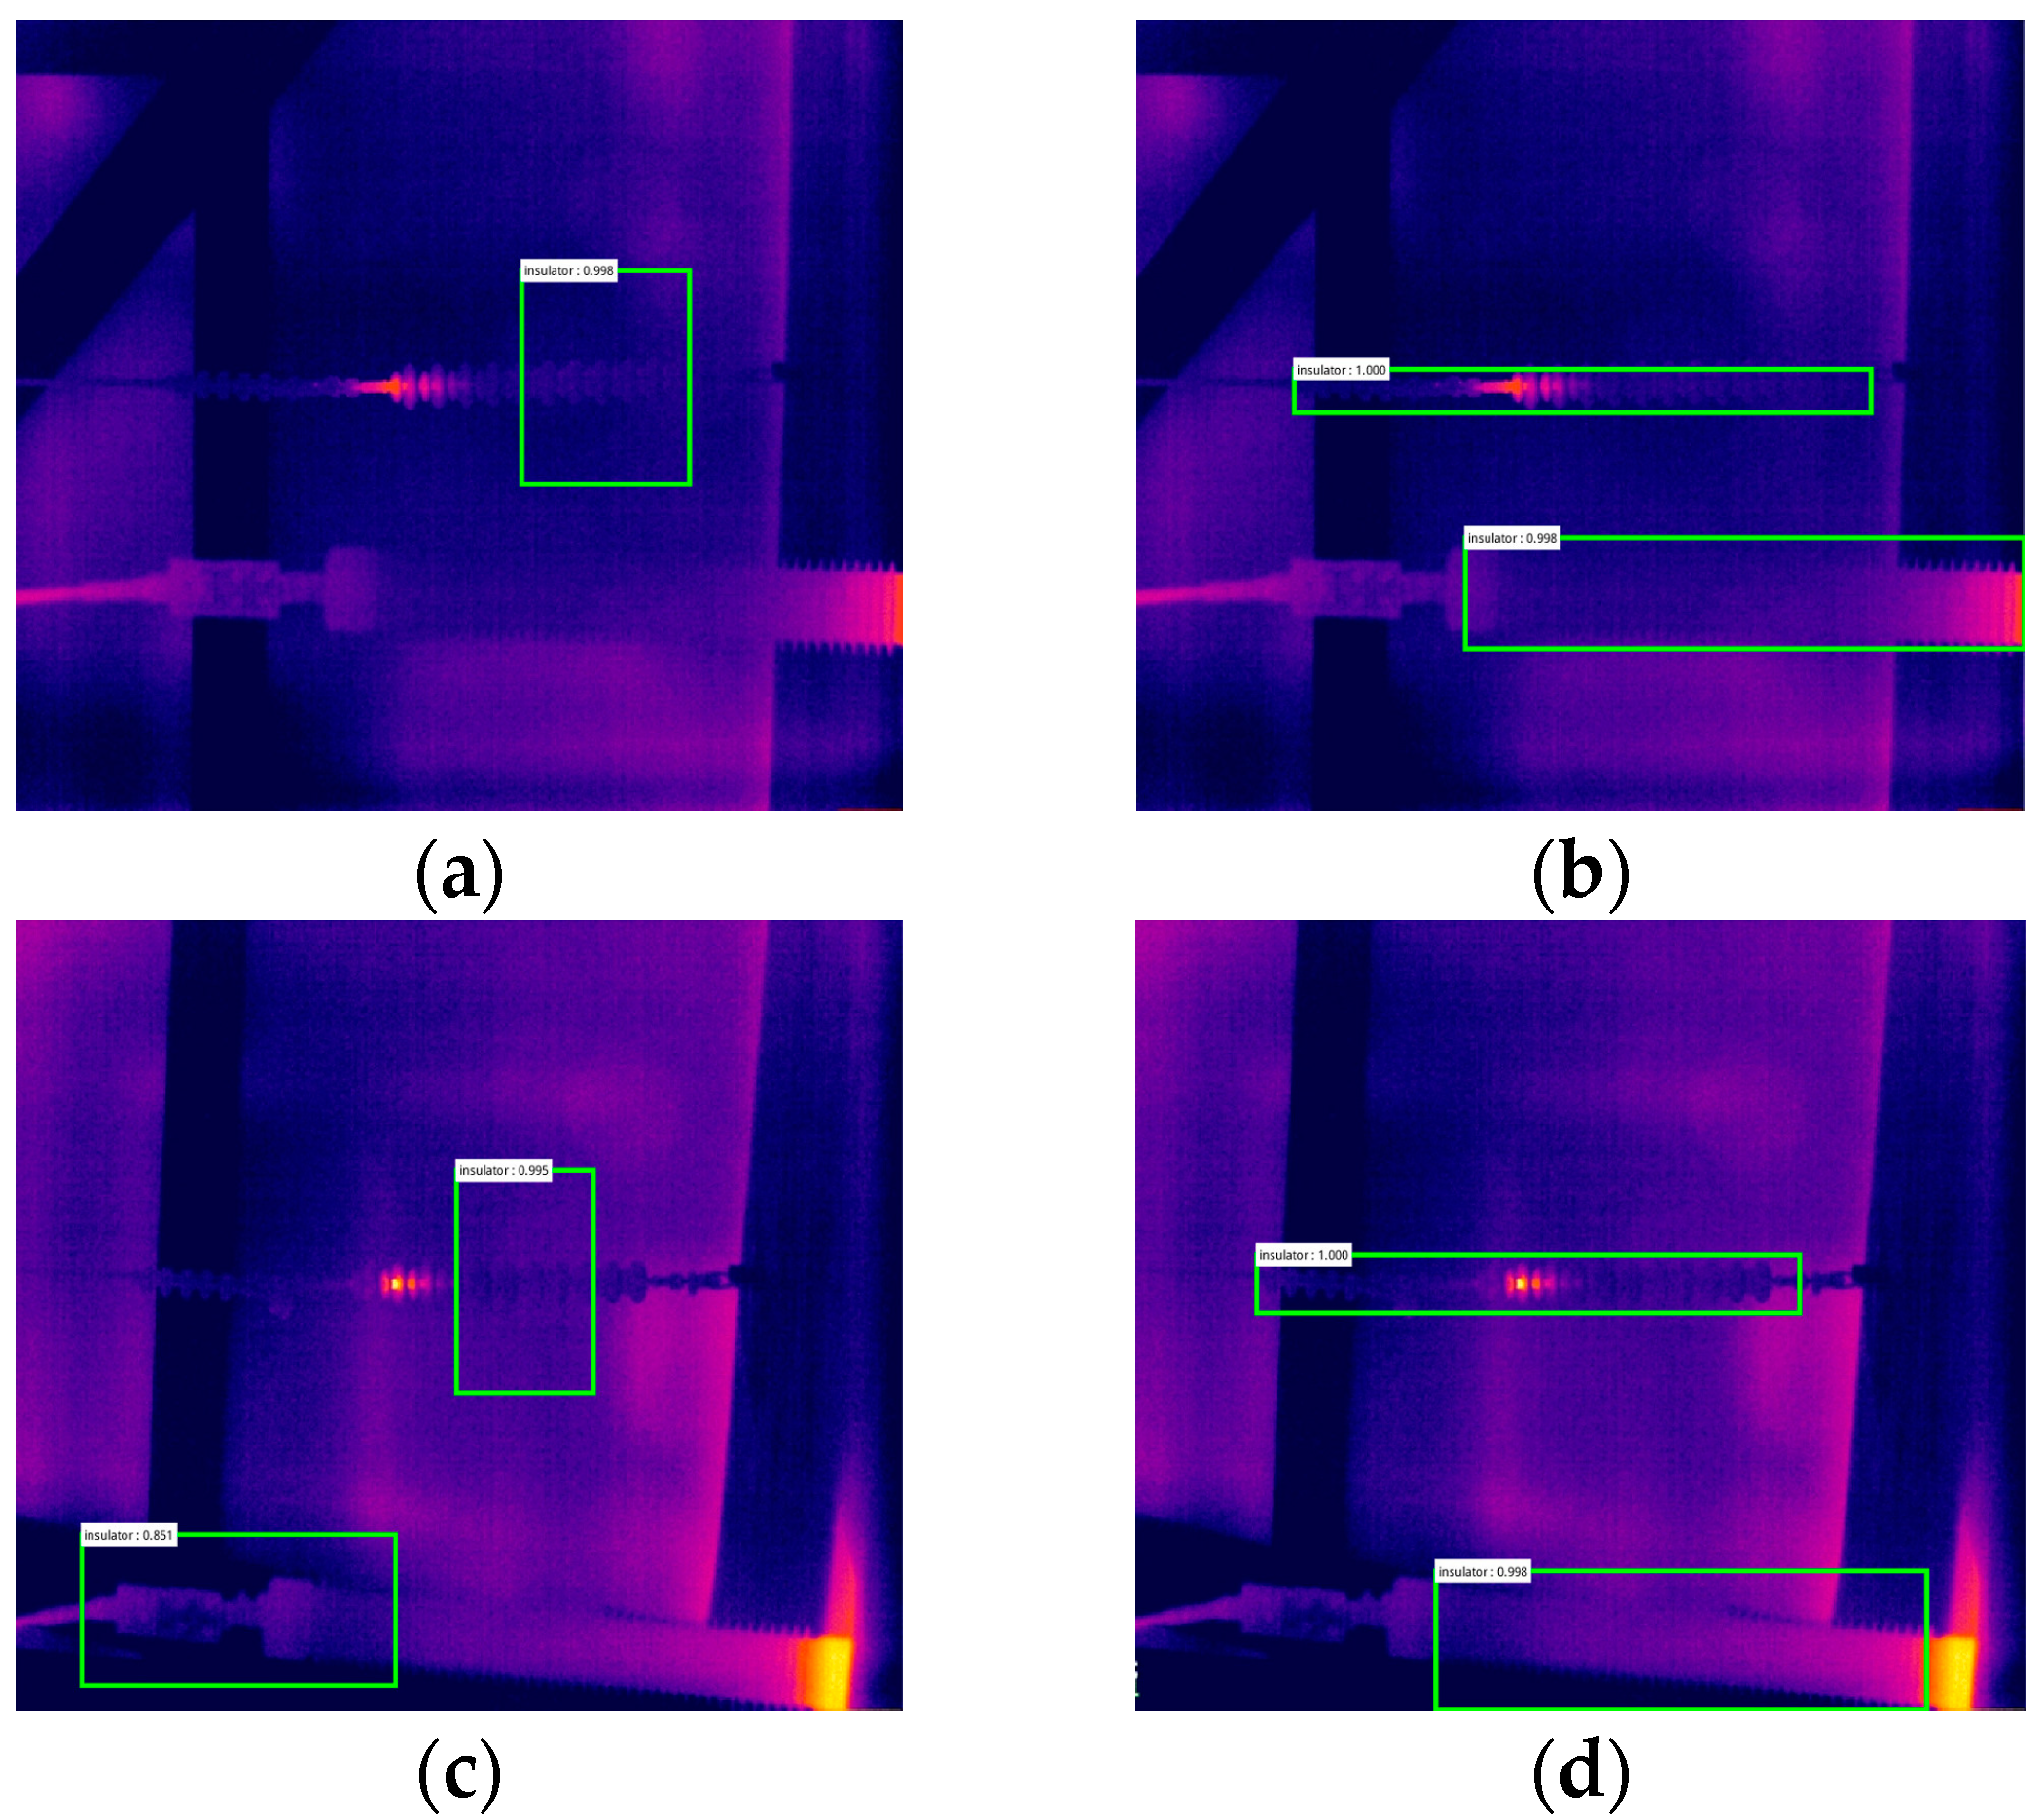
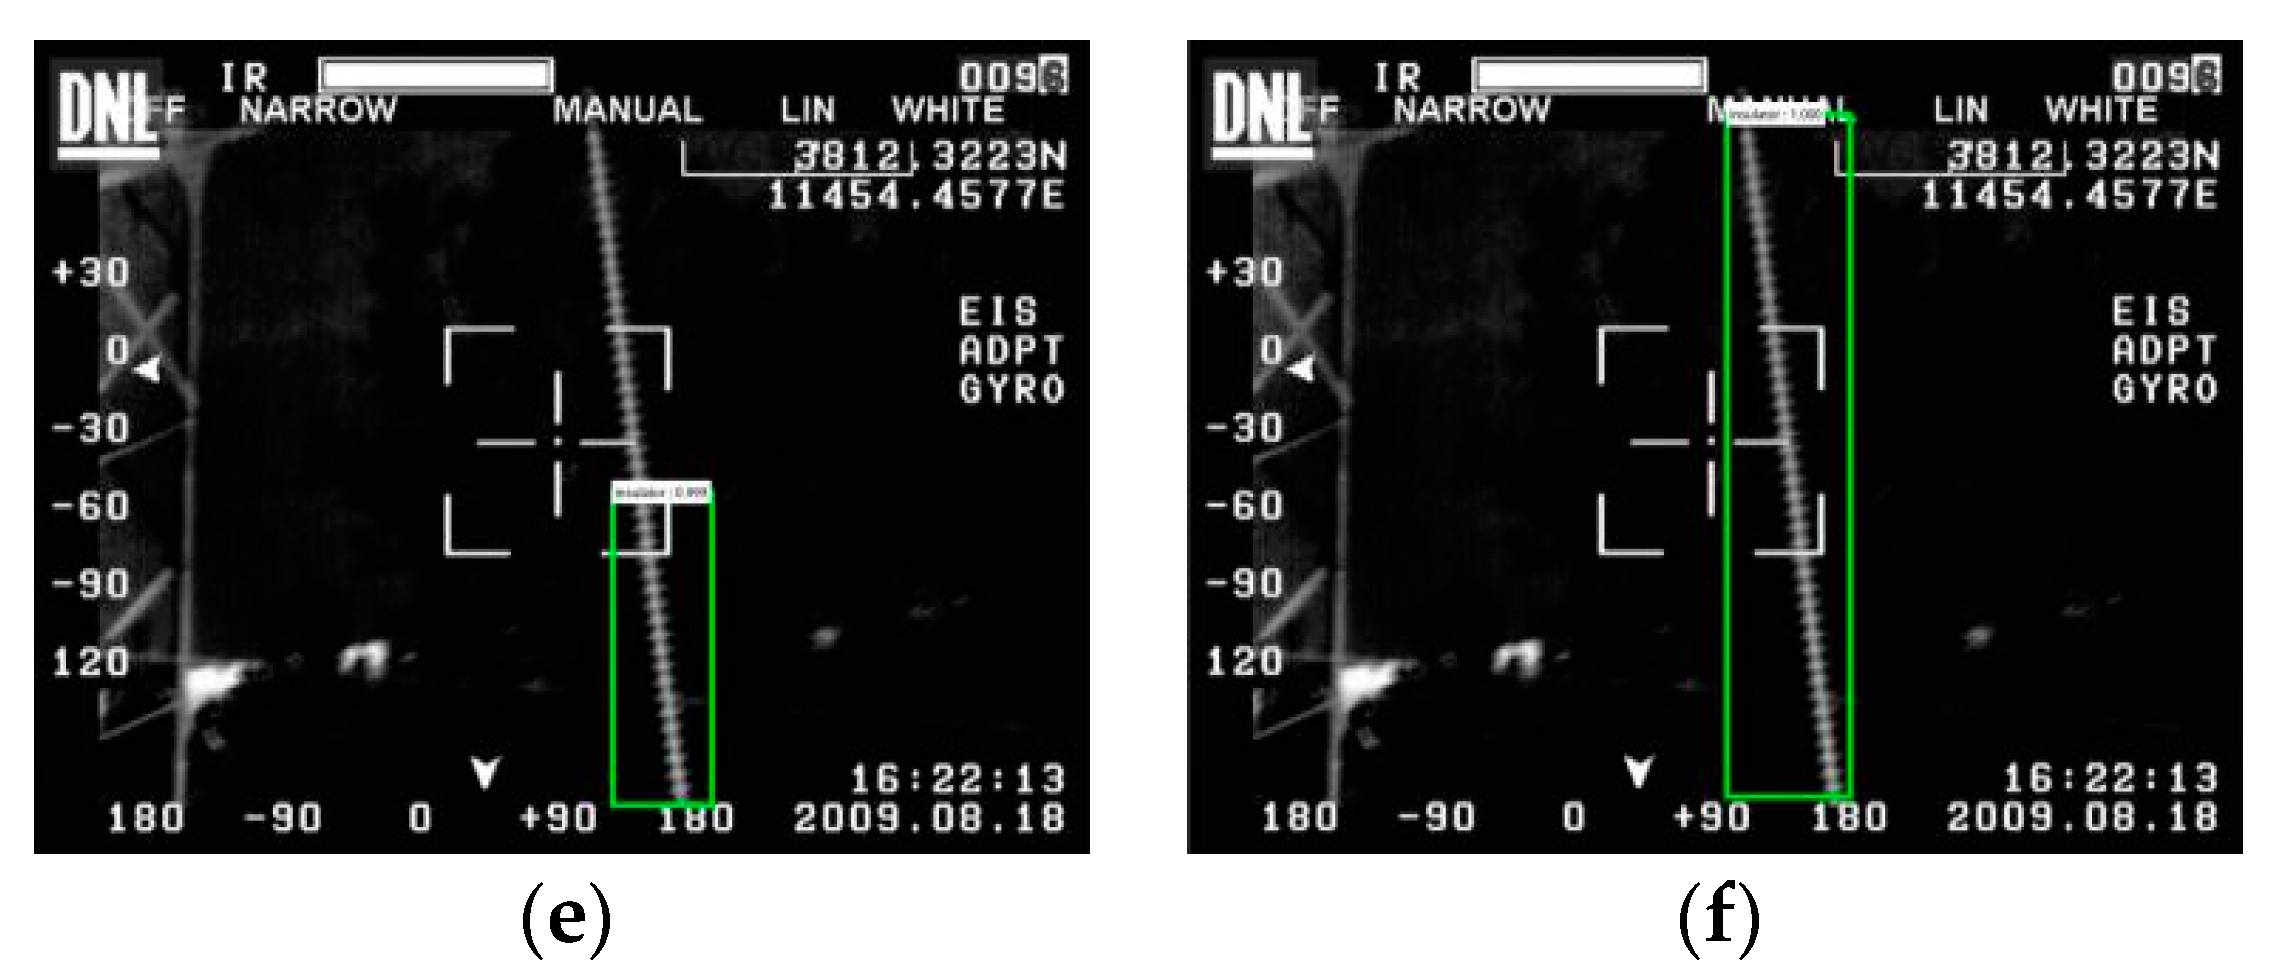
4.1. Detection Experiment of Insulators with Different Aspect Ratios

In order to verify the improved RPN, the detection experiments of different aspect ratio insulators were carried out. A comparison of the detection results of the insulators in power transmission and transformation inspection images by the traditional RPN and the improved RPN is demonstrated in Figure 8. Figure 8a,c,e are the experimental results obtained by traditional RPN while Figure 8b,d,f are the experimental results obtained by the improved RPN. In Figure 8a,c, the aspect ratio of the output boxes is 1:1 or 1:2, which is not a suitable size for insulators. In Figure 8b,d, the aspect ratio of the final output boxes is significantly larger, and the narrow insulator object almost completely fits. In Figure 8e, to some extent, the insulator object is blocked by the framing frame of the infrared camera so that the final output of the output boxes does not completely contain the insulator. In Figure 8f, the final test results effectively overcome the isolation of the infrared camera frame and the detection accuracy is significantly improved.

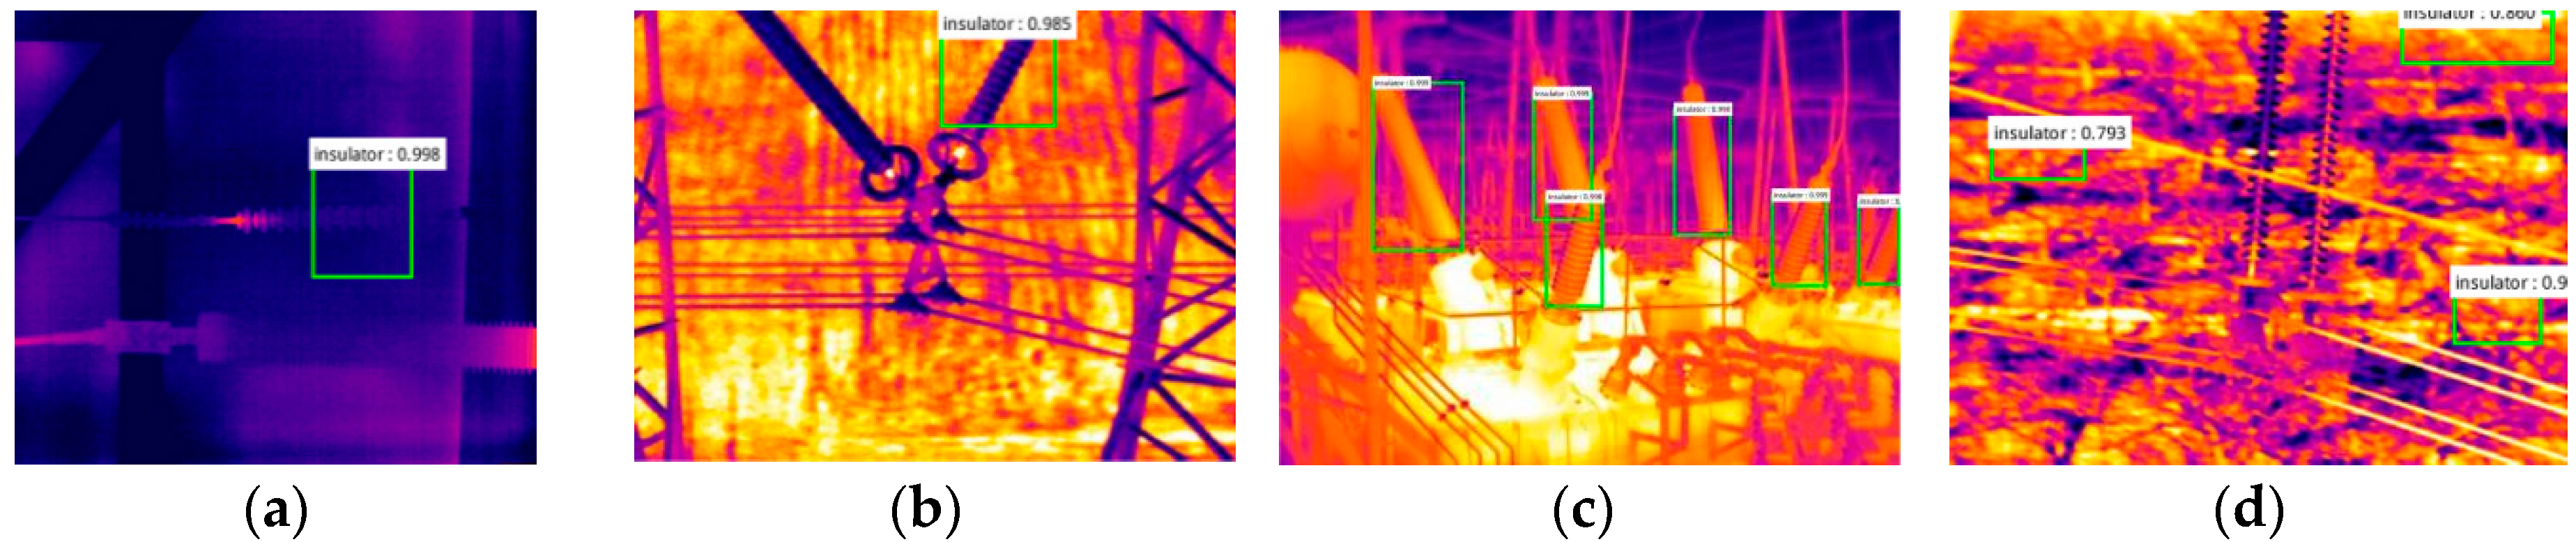
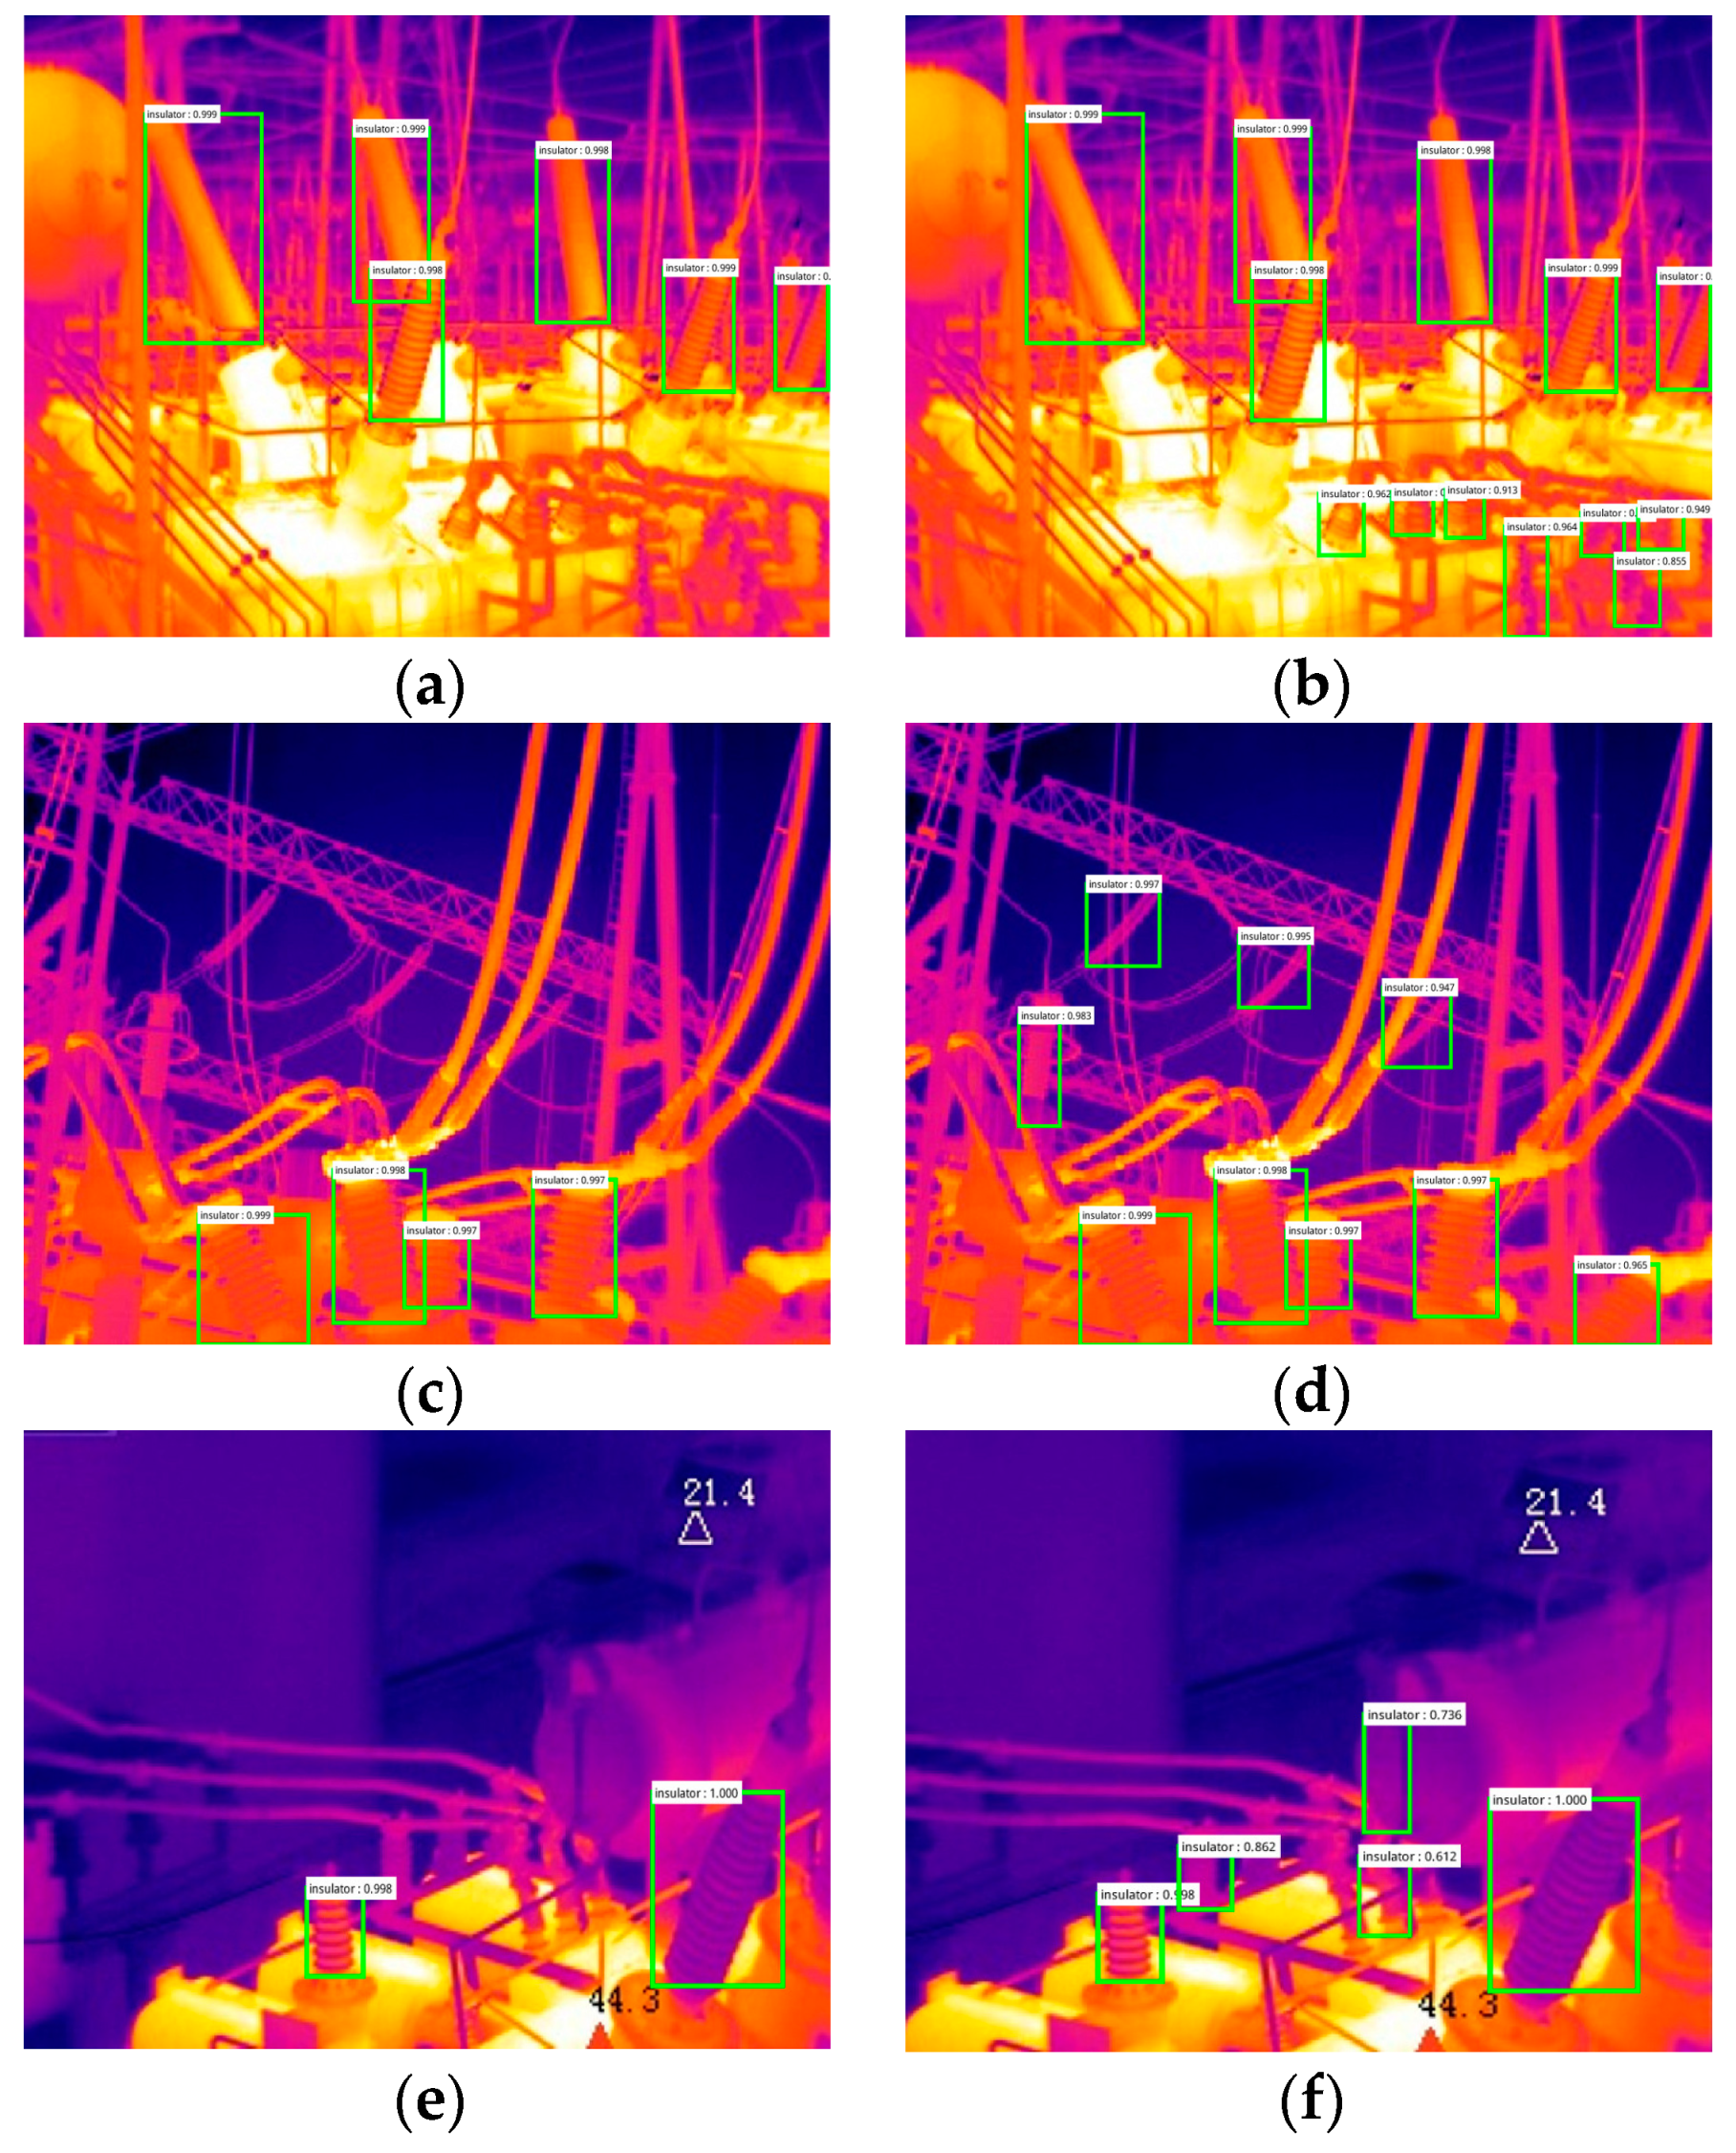
4.2. Detection Experiment of Insulators with Different Scales

In order to verify the detection effect for different scale insulators by using the improved RPN, experiments on insulators with different scales were carried out. A comparison of the detection results of the insulators using the traditional RPN and the improved RPN in power transmission and transformation inspection images was performed and is demonstrated in Figure 9; dealing specifically with insulators with different scales. Figure 9a,c,e,g are show the experimental results obtained by traditional RPN, while Figure 9b,d,f,h show the experimental results obtained by the improved RPN. As can be seen in Figure 9a,c,e,g, the faster R-CNN model can detect larger-scale insulators more accurately, but the missed detection rate for small-scale insulators is extremely high. In Figure 9b,d,f,h, after the application of the small-scale reference anchor in the RPN, the detection problem for small-scale insulators is greatly improved and small insulators in the image can also be detected accurately.

4.3. Detection Experiment of Insulators Under Mutual Occlusion

In order to verify the detection effect of the NMS on the mutual occluded insulators, a mutual occluded insulator test was carried out. Figure 10 is the score distribution of each bounding box output by Figure 3. Figure 10a represents for the distribution of the bounding box scores before the improvement of the NMS, while Figure 10b is the distribution of the bounding box scores after the improvement of the NMS. For the sake of easy observation, the scores of the top 100 test boxes out of 300 were selected to clearly show the trend of the score change. It can be seen from the score distribution that after the improvement of the score mapping relationship in the traditional NMS, the improved bounding box score reduces the redundancy of error detection under the top 10 boxes with the highest scores. At the same time, the two insulators in the middle of Figure 3 can be detected separately. The final detection results are shown in Figure 11.

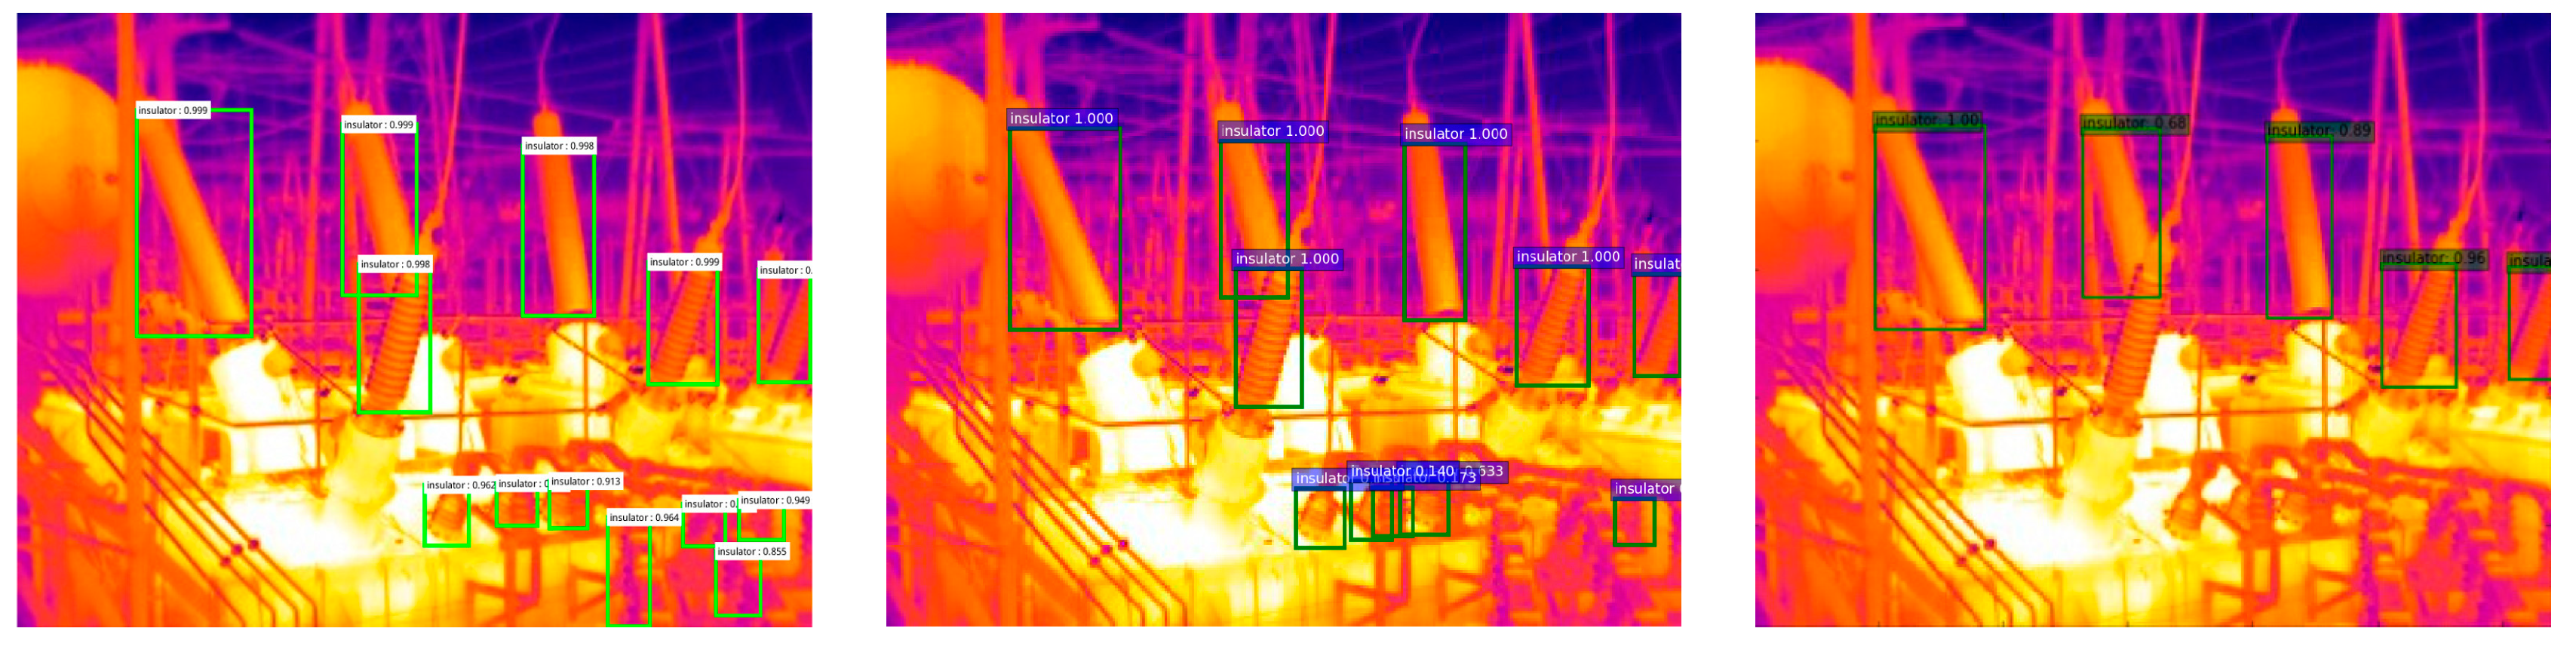
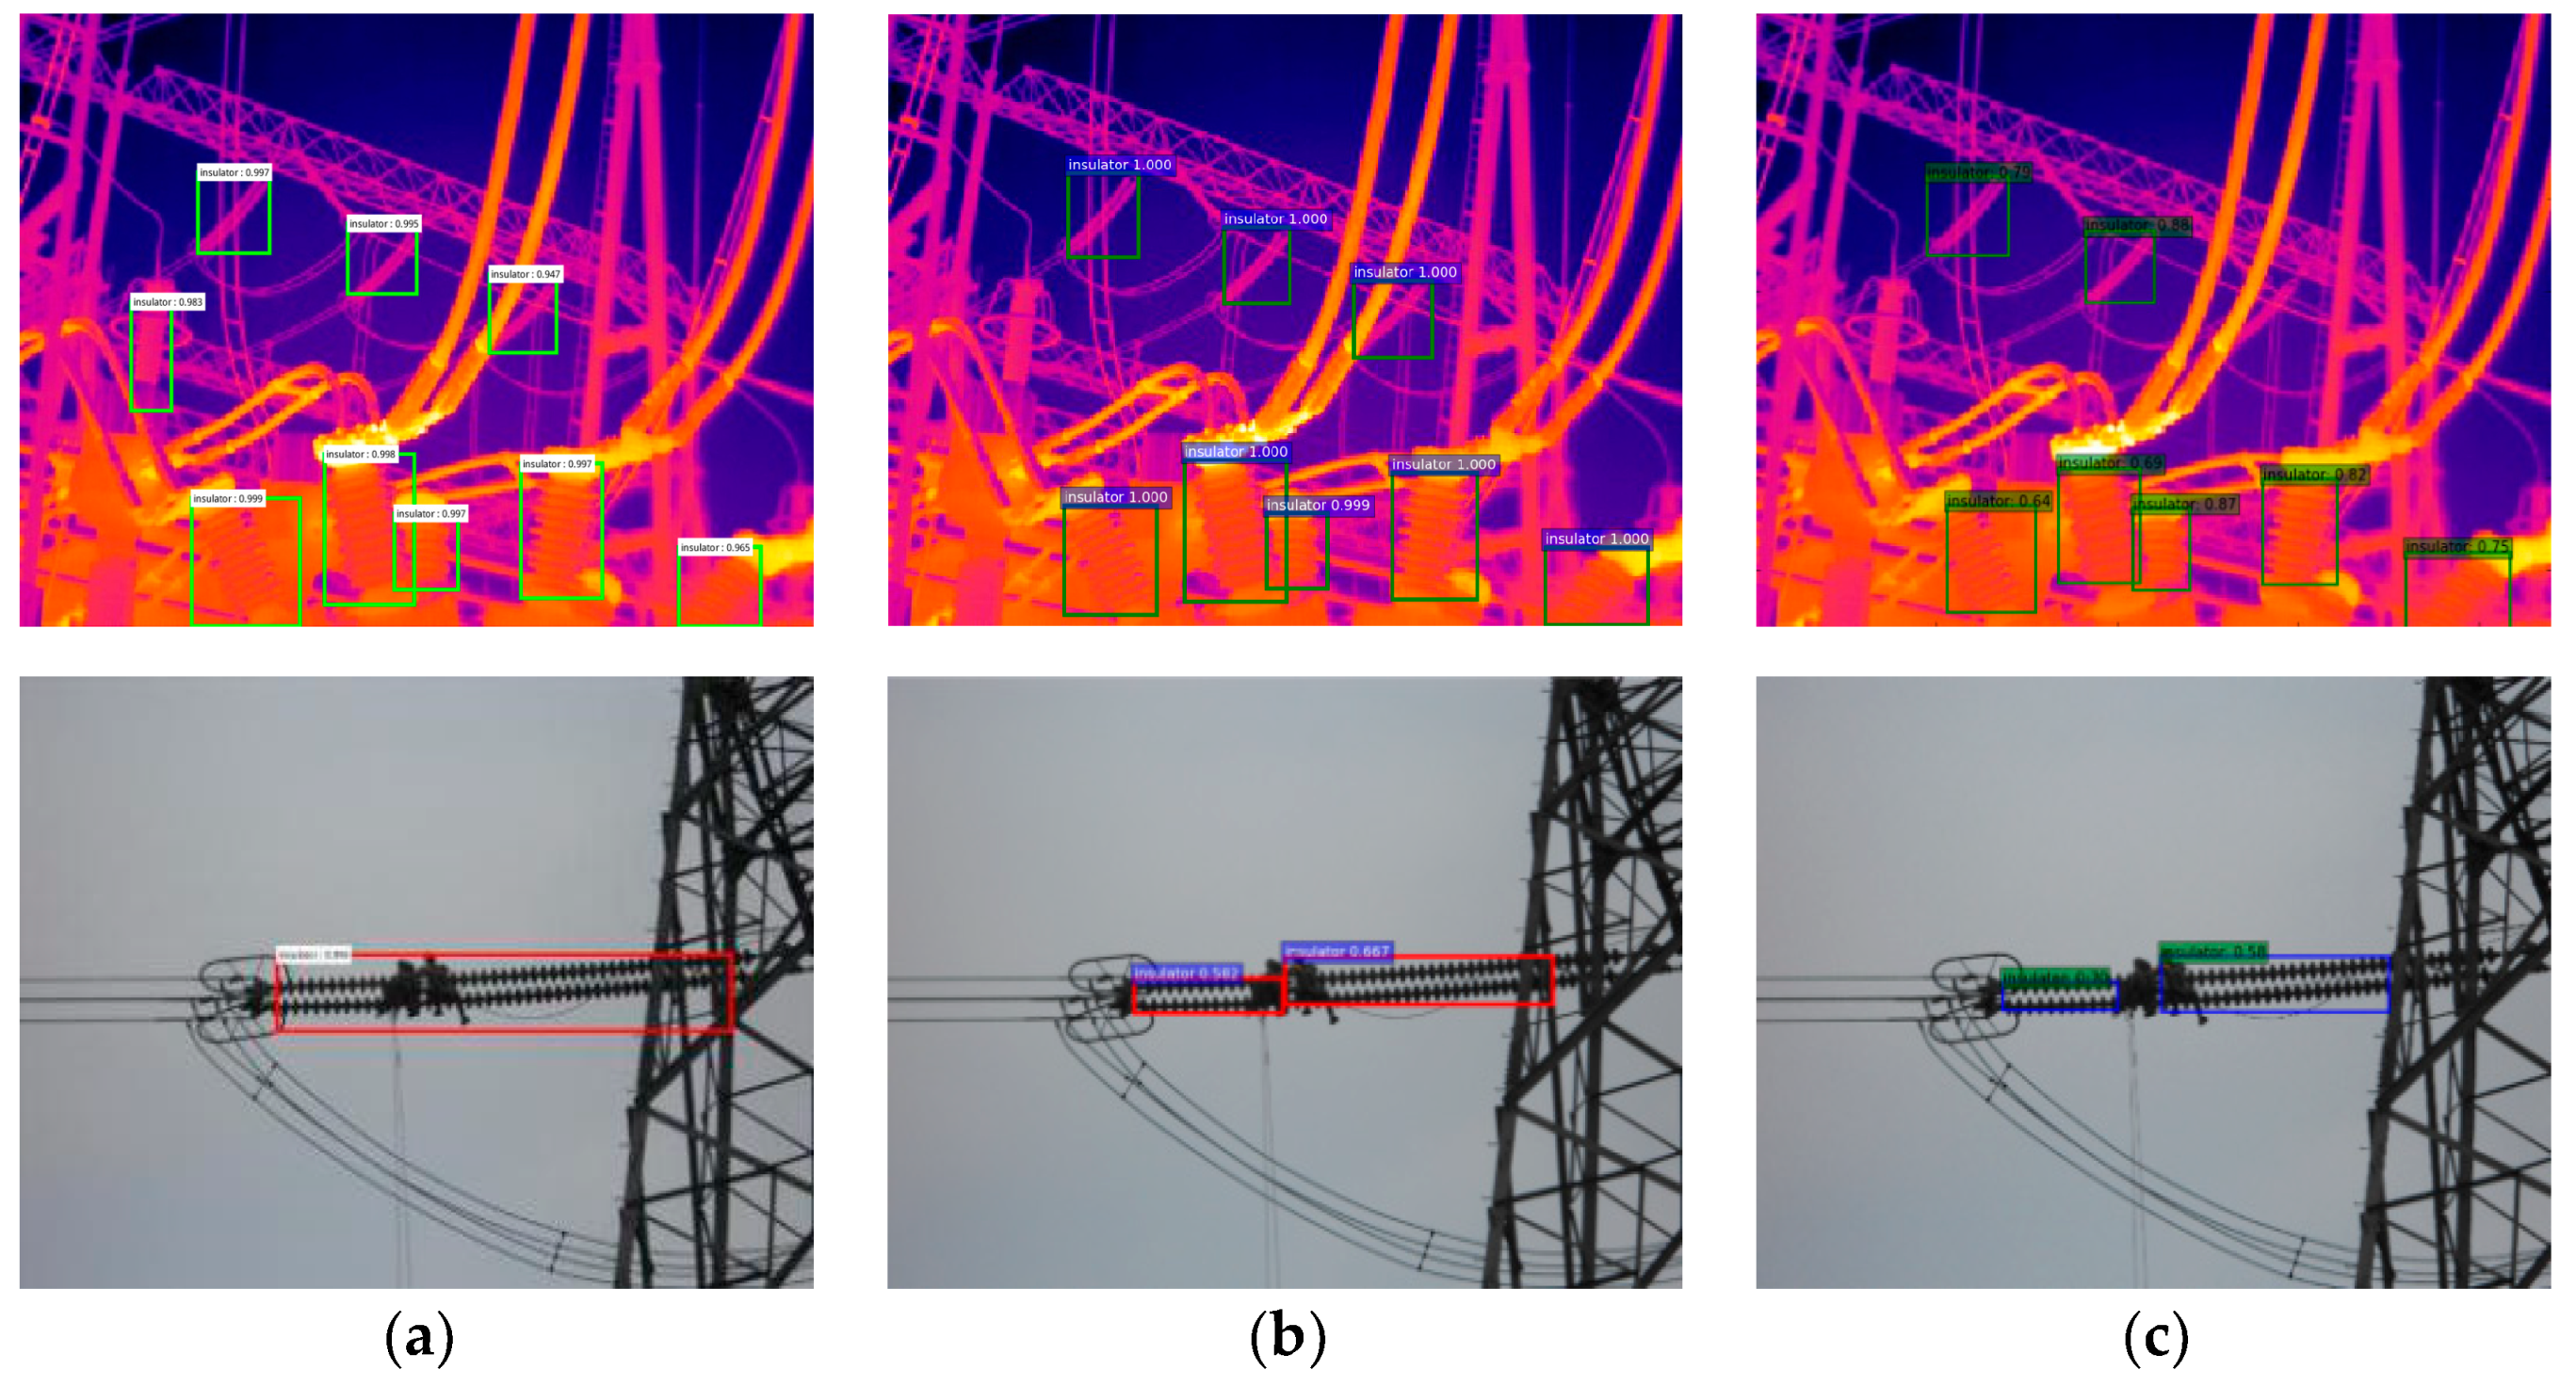
4.4. Comparison Experiment with Other R-CNN Object Detection Models

In the R-CNN series model, the region-based fully convolutional networks (R-FCN) [23] and single shot multibox detector (SSD) [24] are two new object detection models proposed after the faster R-CNN model. R-FCN uses a region-based full convolutional network for object detection, which can realize fully shared computation between the outputs of each convolutional layer. SSD is based on the idea of regression and is combined with the anchor generation mechanism in the faster R-CNN model. It makes use of the multi-scale region features at various locations of the full figure to make regressions while generating candidate object regions.
A comparison of the detection results among the RPN in the faster R-CNN model, the R-FCN, and the SSD methods are made in Figure 12 and Figure 13. Figure 12a shows the experimental results obtained by the method proposed in this paper, while Figure 12b,c shows the experimental results obtained by the R-FCN and SSD methods, respectively. Figure 13a shows the recall-accuracy results obtained by the method proposed herein, while Figure 13b,c shows the recall-accuracy results obtained by the R-FCN and SSD methods, respectively. It can be seen from the figures that through the improvement of the RPN and NMS method of the faster R-CNN model, the detection accuracy of the insulator in power transmission and transformation inspection images is higher than that of the R-FCN and SSD methods. The method in this paper effectively solves the problem of insulator detection with different aspect ratios and different scales. At the same time, the missed detection rate is also significantly reduced.

4.5. Quantitative Analysis on Experimental Results

In addition to the qualitative observation of the experimental results, this paper also makes a quantitative analysis of the performance difference before and after the improvement from a numerical perspective. The experimental results were quantitatively analyzed mainly by precision recall (PR) curve and AP value. The horizontal axis of the PR curve is the recall rate of the object detection, while the vertical axis is the accuracy of the object detection, which demonstrates the relationship between accuracy and recall rate. The AP value is the area surrounded by the PR curve and the horizontal and vertical axis. Figure 14 shows the PR and the AP values for the faster R-CNN model using the VGG-16 Net before and after modification by the proposed method. After using the transmission and transformation electrical insulation equipment detection database to fine-tune the faster R-CNN model, the AP value of the faster R-CNN model using the VGG-16 Net reached 0.640. On this basis, after the improvement of the anchor generation method and NMS in the RPN, the AP value of faster R-CNN using the VGG-16 Net is increased to 0.818, which is 27.81% higher than before the improvement. The PR curve is also smoother and closer to the upper-right corner, which proves the effectiveness of the method.

5. Conclusions

This paper proposes an insulator detection method based on the detection data set of insulation equipment trained by a fine-tuned faster R-CNN model. It can detect insulators with different aspect ratios and different scales as well as mutually occluded ones in the power transmission and inspection images effectively. In this paper, the anchor generation method and NMS method in the faster R-CNN model RPN are improved, respectively. The experimental results show that the improvement of the anchor generation method increases the AP value of the faster R-CNN model to 0.818 by using VGG-16 Net. The detection effect of different aspect ratios and different scales of insulators in inspection images is improved significantly. Meanwhile, the problem of missed insulators as a result of occlusion is also resolved with the proposed NMS improvement method. It can effectively realize the separate detection of the insulators in the image, which lays a solid foundation for further state detection and fault diagnosis of insulators.
It is noted that different types of insulators are not distinguished in our method. In order to provide a more reliable guarantee for state detection and fault diagnosis of insulators, further research on high-quality detection methods for different types of insulators will be done in the future.

Author Contributions

Z.Z. (Zhenbing Zhao), L.Z. and Y.Q. developed the system modeling and algorithm design; Z.Z. (Zhen Zhen) and L.Z. performed the experiments; Y.K. and K.Z. analyzed the experimental data; Z.Z. (Zhenbing Zhao), Z.Z. (Zhen Zhen), and L.Z. wrote the paper.

Funding

This research is supported in part by the National Natural Science Foundation of China (NSFC) under grant number 61871182, 61401154, 61773160, 61302163, by Beijing Natural Science Foundation under grant number 4192055, by the Natural Science Foundation of Hebei Province of China under grant number F2016502101, F2017502016, F2015502062, by the Fundamental Research Funds for the Central Universities under grant number 2018MS095, 2018MS094, and by the Open Project Program of the National Laboratory of Pattern Recognition (NLPR).

Conflicts of Interest

The authors declare no conflict of interest.

References

  1. Wang, M.; Du, Y.; Zhang, Z.R. Study on power transmission lines inspection using unmanned aerial vehicle and image recognition of insulator defect. J. Electron. Meas. Instrum. 2015, 26, 1862–1869. [Google Scholar]
  2. Huang, X.B.; Liu, X.H.; Zhang, W. Classification and identification method of aerial insulator based on red-blue difference and improved K-means algorithm. High Volt. Technol. 2018, 44, 1528–1534. [Google Scholar]
  3. Huang, X.O.; Li, J.Q.; Zhang, Y.; Zhang, F. The recognition and detection technology of ice-covered insulators under complex environment. High Volt. Eng. 2017, 43, 891–899. [Google Scholar]
  4. Tong, W.G.; Yuan, J.S.; Li, B.S. Application of Image Processing in Patrol Inspection of Overhead Transmission Line by Helicopter. Power Syst. Technol. 2010, 34, 204–208. [Google Scholar]
  5. Huang, X.N.; Zhang, Z.L. A Method to Extract Insulator Image from Aerial Image of Helicopter Patrol. Power Syst. Technol. 2010, 34, 194–197. [Google Scholar]
  6. Tao, G.; Fengxiang, C.; Wei, W.; Ping, S.; Lei, S.; Tianzhu, C. Electric insulator detection of UAV images based on depth learning. In Proceedings of the IEEE 2017 2nd International Conference on Power and Renewable Energy (ICPRE), Chengdu, China, 20–23 September 2017; pp. 37–41. [Google Scholar]
  7. Krizhevsky, A.; Sutskever, I.; Hinton, G.E. Imagenet classification with deep convolutional neural networks. In Proceedings of the Advances in Neural Information Processing Systems, Lake Tahoe, NV, USA, 3–6 December 2012; pp. 1097–1105. [Google Scholar]
  8. Zhao, Z.; Xu, G.; Qi, Y.; Liu, N.; Zhang, T. Multi-patch deep features for power line insulator status classification from aerial images. In Proceedings of the IEEE 2016 International Joint Conference on Neural Networks (IJCNN), Vancouver, BC, Canada, 24–29 July 2016; pp. 3187–3194. [Google Scholar]
  9. Girshick, R. Fast R-CNN. In Proceedings of the IEEE International Conference on Computer Vision (ICCV), Araucano Park, Chile, 11–18 December 2015; pp. 1440–1448. [Google Scholar]
  10. Chen, Q.; Yan, B.; Ye, R.; Zhou, X.J. Insulator detection and recognition of explosion fault based on convolutional neural networks. J. Electron. Meas. Instrum. 2017, 31, 942–953. [Google Scholar]
  11. Ren, S.; He, K.; Girshick, R.; Sun, J. Faster R-CNN: towards real-time object detection with region proposal networks. In Proceedings of the International Conference on Neural Information Processing Systems (NIPS), Palais des congrès de Montréal, Montreal, QC Canada, 7–12 December 2015; pp. 91–99. [Google Scholar]
  12. Wang, W.G.; Tian, B.; Liu, Y.; Liu, L.; Li, J.X. Study on the Electrical Devices Detection in UAV Images based on Region Based Convolutional Neural Networks. J. Geo-Inf. Sci. 2017, 19, 256–263. [Google Scholar]
  13. Ma, L.; Xu, C.; Zuo, G.; Bo, B. Detection Method of Insulator Based on Faster R-CNN. In Proceedings of the IEEE 2017 7th Annual International Conference on CYBER Technology in Automation, Control, and Intelligent Systems (CYBER), Sheraton Princess Kaiulani, HI, USA, 31 July–4 August 2017; pp. 1410–1414. [Google Scholar]
  14. Li, J.F.; Wang, Q.R.; Li, M. Image recognition of power equipment combined with deep learning and random forest. High Volt. Eng. 2017, 43, 3705–3711. [Google Scholar]
  15. Li, S.M.; Lei, G.Q.; Fan, R. Depth Map Super-resolution Reconstruction Based on Convolutional Neural Network. Acta Opt. Sin. 2017, 37, 1210002. [Google Scholar]
  16. Fu, W.B.; Sun, T.; Liang, L.; Yan, B.W.; Fan, F.X. A Review of the Principles and Applications of Deep Learning. Comput. Sci. 2018, 45, 11–15. [Google Scholar]
  17. Deng, L. The MNIST Database of Handwritten Digit Images for Machine Learning Research. IEEE Signal Process. Mag. 2012, 29, 141–142. [Google Scholar] [CrossRef]
  18. Deng, J.; Dong, W.; Socher, R.; Li, L.-J.; Li, K.; Li, F.-F. ImageNet: A large-scale hierarchical image database. In Proceedings of the Computer Vision and Pattern Recognition (CVPR), Xiami Beach, FL, USA, 20–25 June 2009; pp. 248–255. [Google Scholar]
  19. Everingham, M.; Gool, L.V.; Williams, C.K.I.; Winn, J.; Zisserman, A. The Pascal Visual Object Classes (VOC) Challenge. Int. J. Comput. Vis. 2010, 88, 303–338. [Google Scholar] [CrossRef]
  20. Fu, B.; Jiang, Y.; Wang, H.G.; Jiang, W.D.; Song, Q.F.; Wang, C.C.; Chu, Q.L.; Zhao, Y.P. Intelligent Diagnosis System for Patrol Check Images of Power Transmission Lines. CAAI Trans. Intell. Syst. 2016, 11, 70–77. [Google Scholar]
  21. Xu, G.Z. Research on Infrared Image Positioning Method of Insulator Based on Depth Feature Expression; North China Electric Power University: Beijing, China, 2017. [Google Scholar]
  22. Simonyan, K.; Zisserman, A. Very Deep Convolutional Networks for Large-Scale Image Recognition. In Proceedings of the International Conference on Learning Representations (ICLR), San Diego, CA, USA, 7–9 May 2015; pp. 1–14. [Google Scholar]
  23. Dai, J.F.; Li, Y.; He, K.M.; Sun, J. R-FCN: Object Detection via Region-based Fully Convolutional Networks. In Proceedings of the Conference and Workshop on Neural Information Processing Systems (NIPS), Barcelona, Spain, 5–10 December 2016; pp. 379–387. [Google Scholar]
  24. Liu, W.; Anguelov, D.; Erhan, D.; Szegedy, C.; Reed, S.; Fu, C.; Berg, A.C. SSD: Single Shot MultiBox Detector. In Proceedings of the European Conference on Computer Vision (ECCV), Amsterdam, The Netherlands, 8–16 October 2016; pp. 21–37. [Google Scholar]
Figure 1. Insulator detection images obtained by fine-tuning the faster R-CNN: (a) Detection of insulators with color close to background; (b) detection of tilting insulators; (c) detection of insulators with different scales; (d) detection of insulators with occlusion problems.
Energies 12 01204 g001
Figure 2. Schematic diagram of insulators with different aspect ratios.
Energies 12 01204 g002
Figure 3. Result of removing redundant boxes by original non-maximum suppression (NMS).
Energies 12 01204 g003
Figure 4. Diversity display of infrared image detection database for power transmission and transformation insulation equipment.
Energies 12 01204 g004
Figure 5. Framework of insulator images detection method based on improved the faster region-convolutional neural network (R-CNN).
Energies 12 01204 g005
Figure 6. Process of generate candidate object area structure using RPN.
Energies 12 01204 g006
Figure 7. Anchor examples with nine different scales.
Energies 12 01204 g007
Figure 8. Detection results of insulators with different aspect ratios. (a,c,e) Results obtained by traditional RPN; (b,d,f) results obtained by improved RPN.
Energies 12 01204 g008aEnergies 12 01204 g008b
Figure 9. Detection results of insulators with different scales. (a,c,e,g) Results obtained by traditional RPN; (b,d,f,h) results obtained by improved RPN.
Energies 12 01204 g009aEnergies 12 01204 g009b
Figure 10. Score distribution of bounding boxes. (a) Before improvement; (b) after improvement.
Energies 12 01204 g010
Figure 11. Results of eliminating redundant boxes with improved NMS.
Energies 12 01204 g011
Figure 12. The detection results of our method, and the R-FCN and SSD methods. (a) Proposed method; (b) R-FCN; (c) SSD.
Energies 12 01204 g012aEnergies 12 01204 g012b
Figure 13. Result comparison of the proposed method, and the R-FCN and SSD methods. (a) Proposed method; (b) R-FCN; (c) SSD.
Energies 12 01204 g013
Figure 14. Precision recall (PR) curve and average precision (AP) value of the faster R-CNN model under VGG-16 Net. (a) Before improvement; (b) after improvement.
Energies 12 01204 g014

