Fault Detection of a Spherical Tank Using a Genetic Algorithm-Based Hybrid Feature Pool and k-Nearest Neighbor Algorithm


Abstract
:1. Introduction
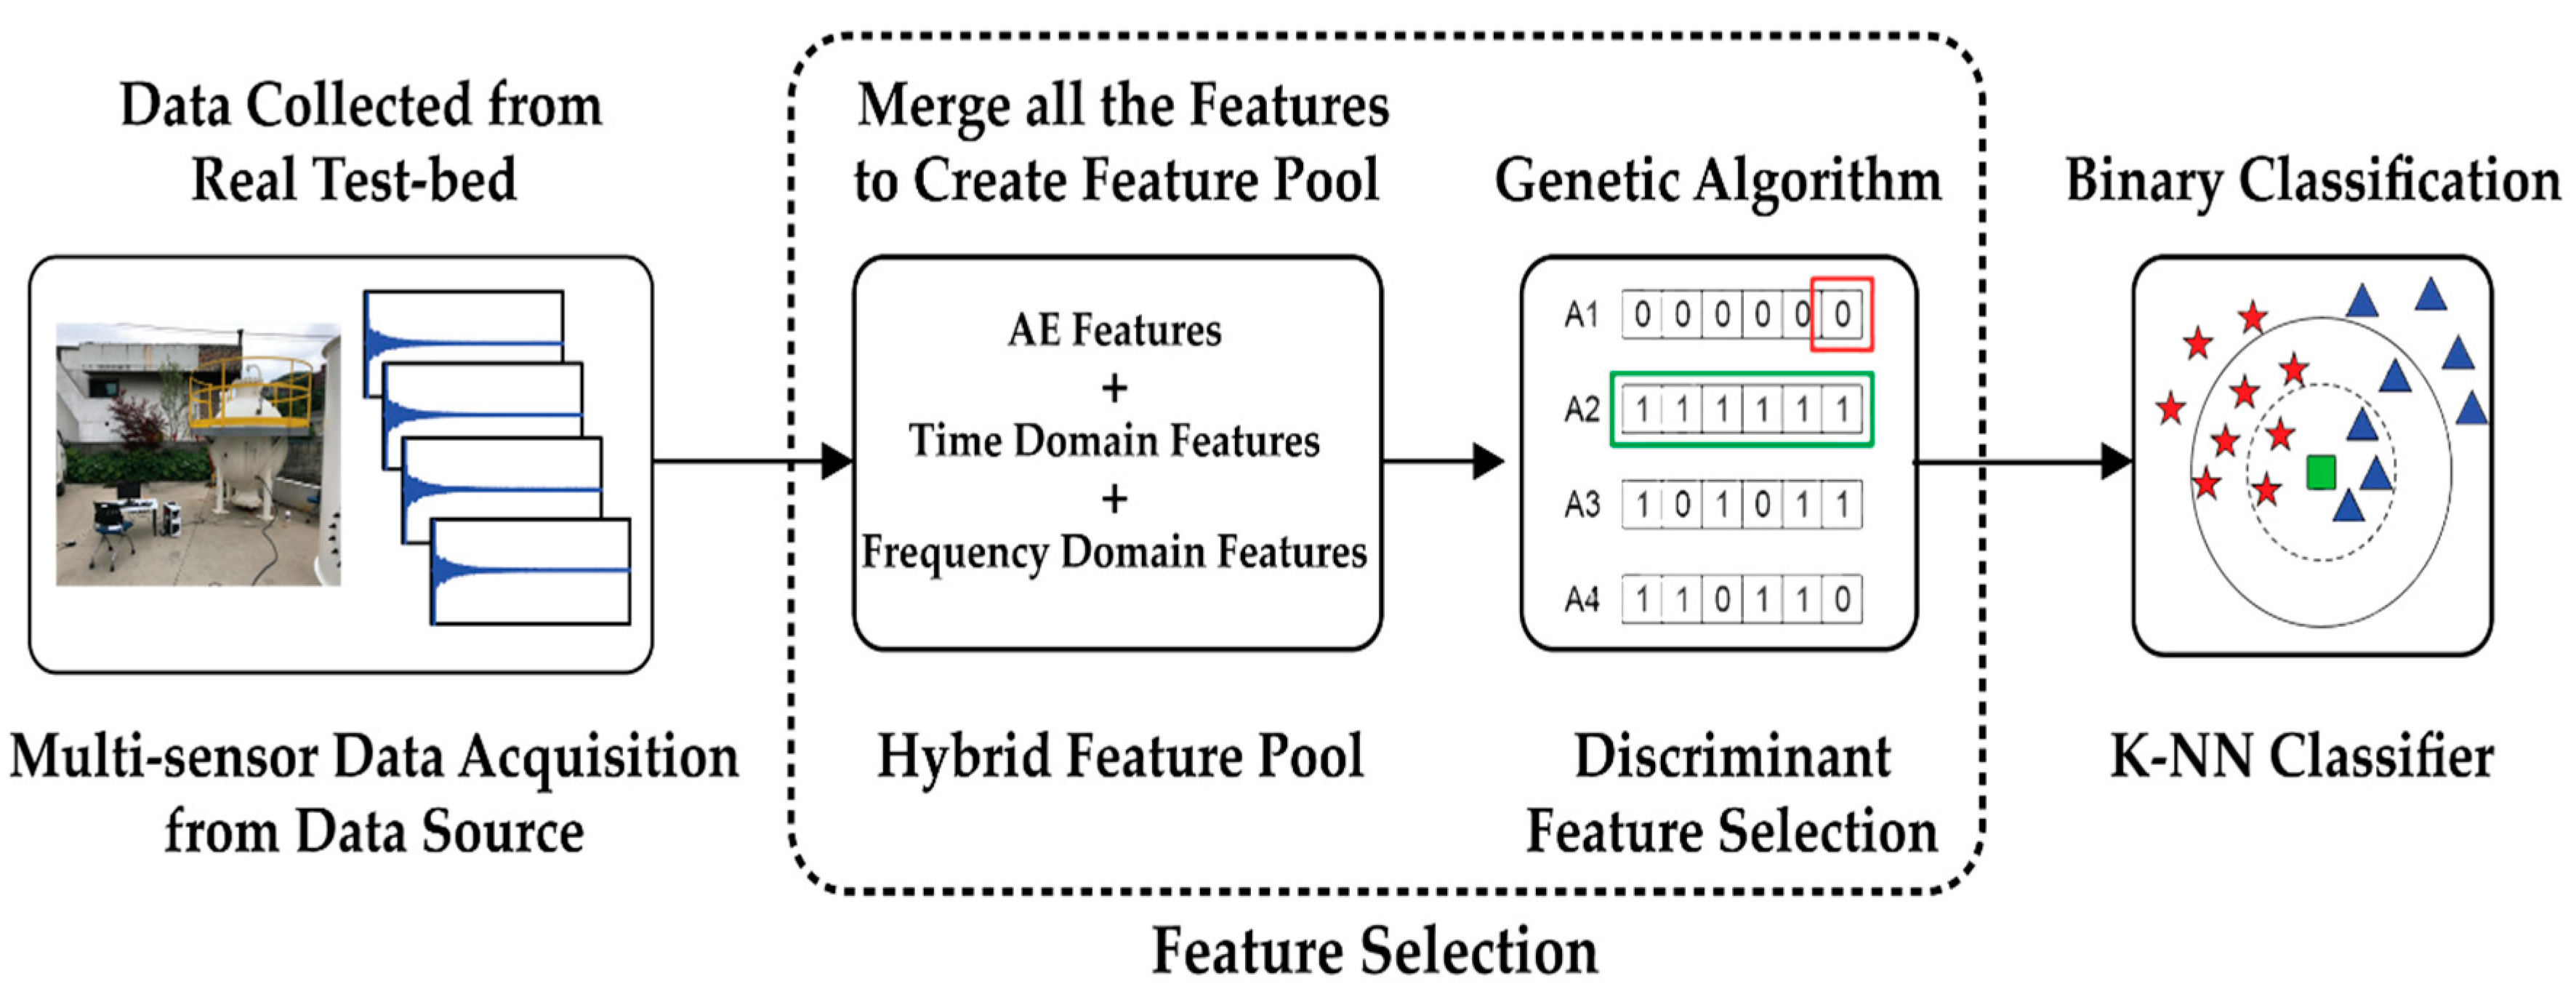
2. Methodology
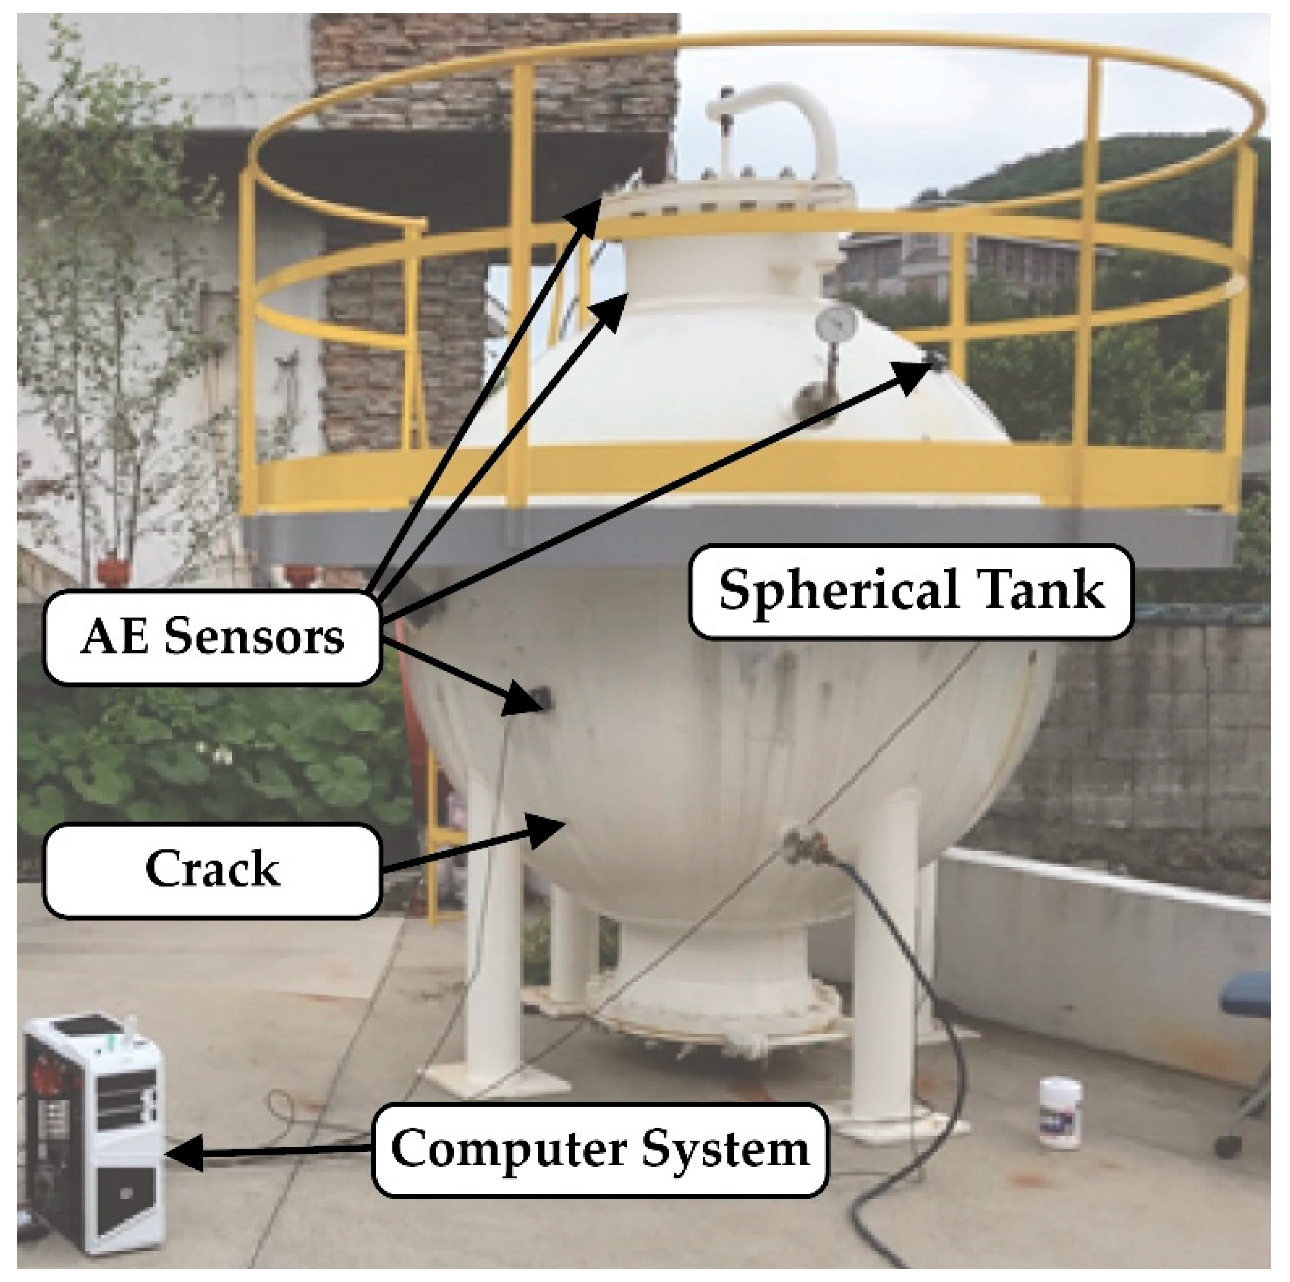
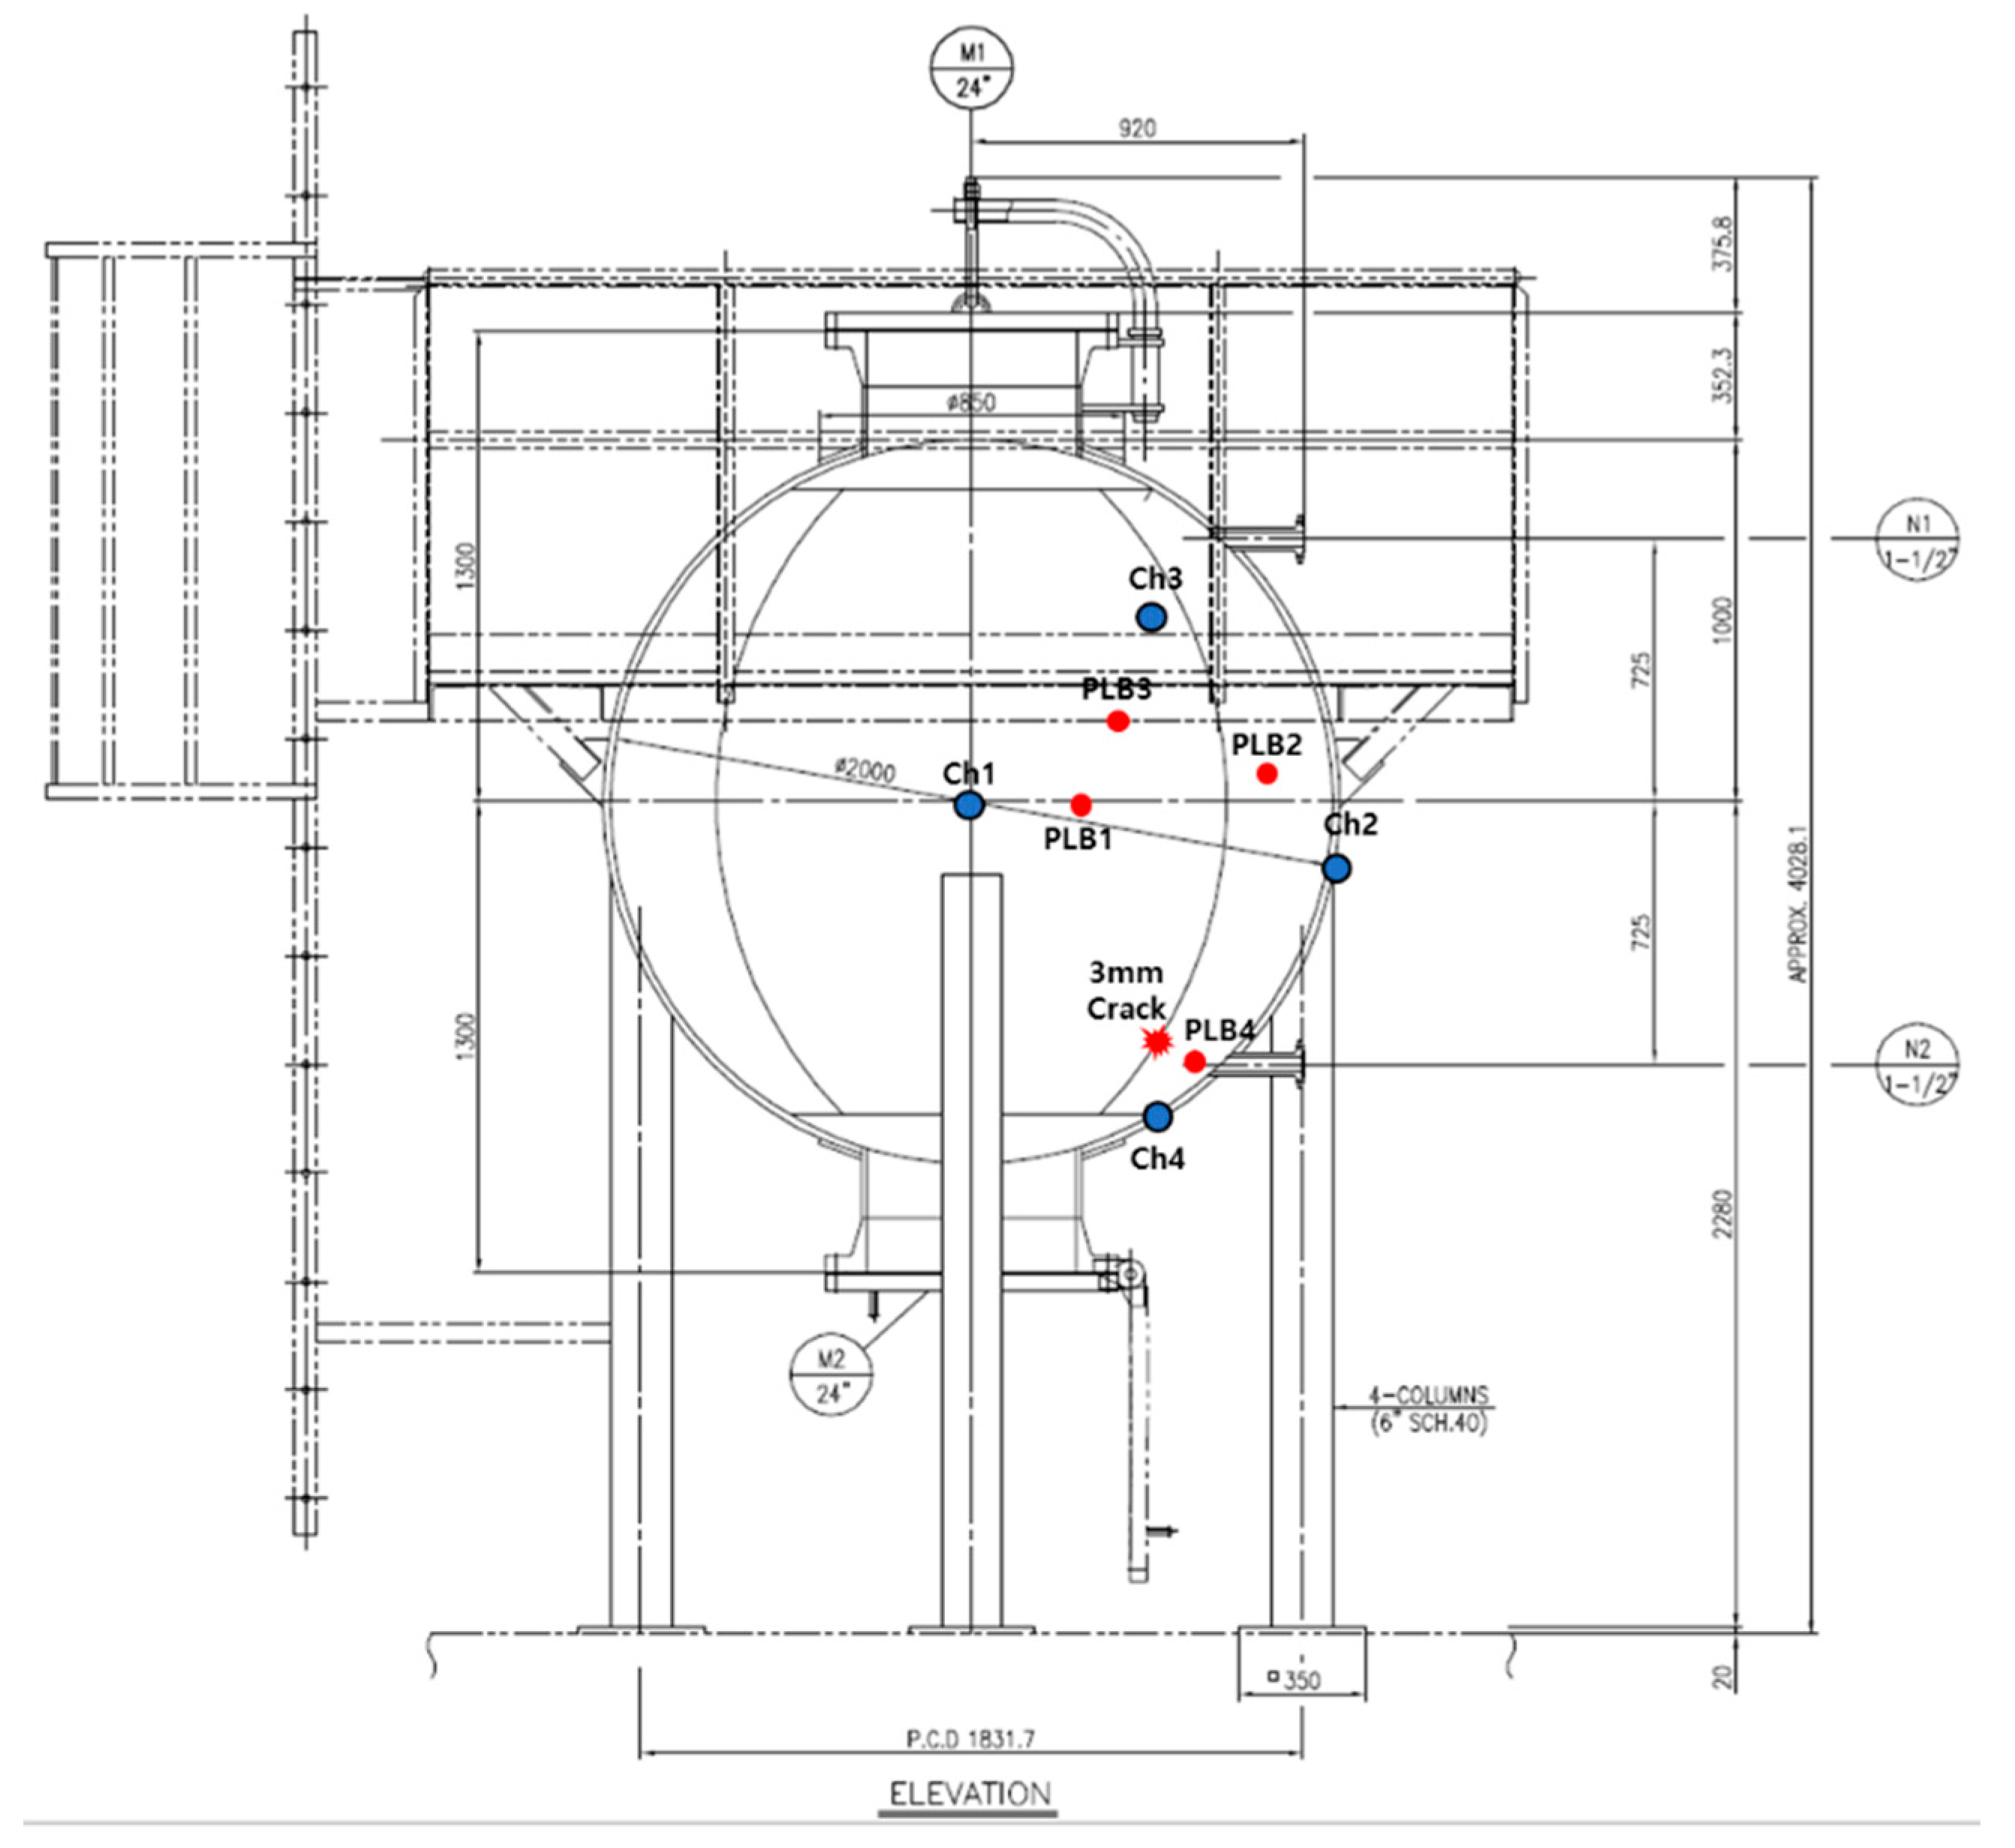
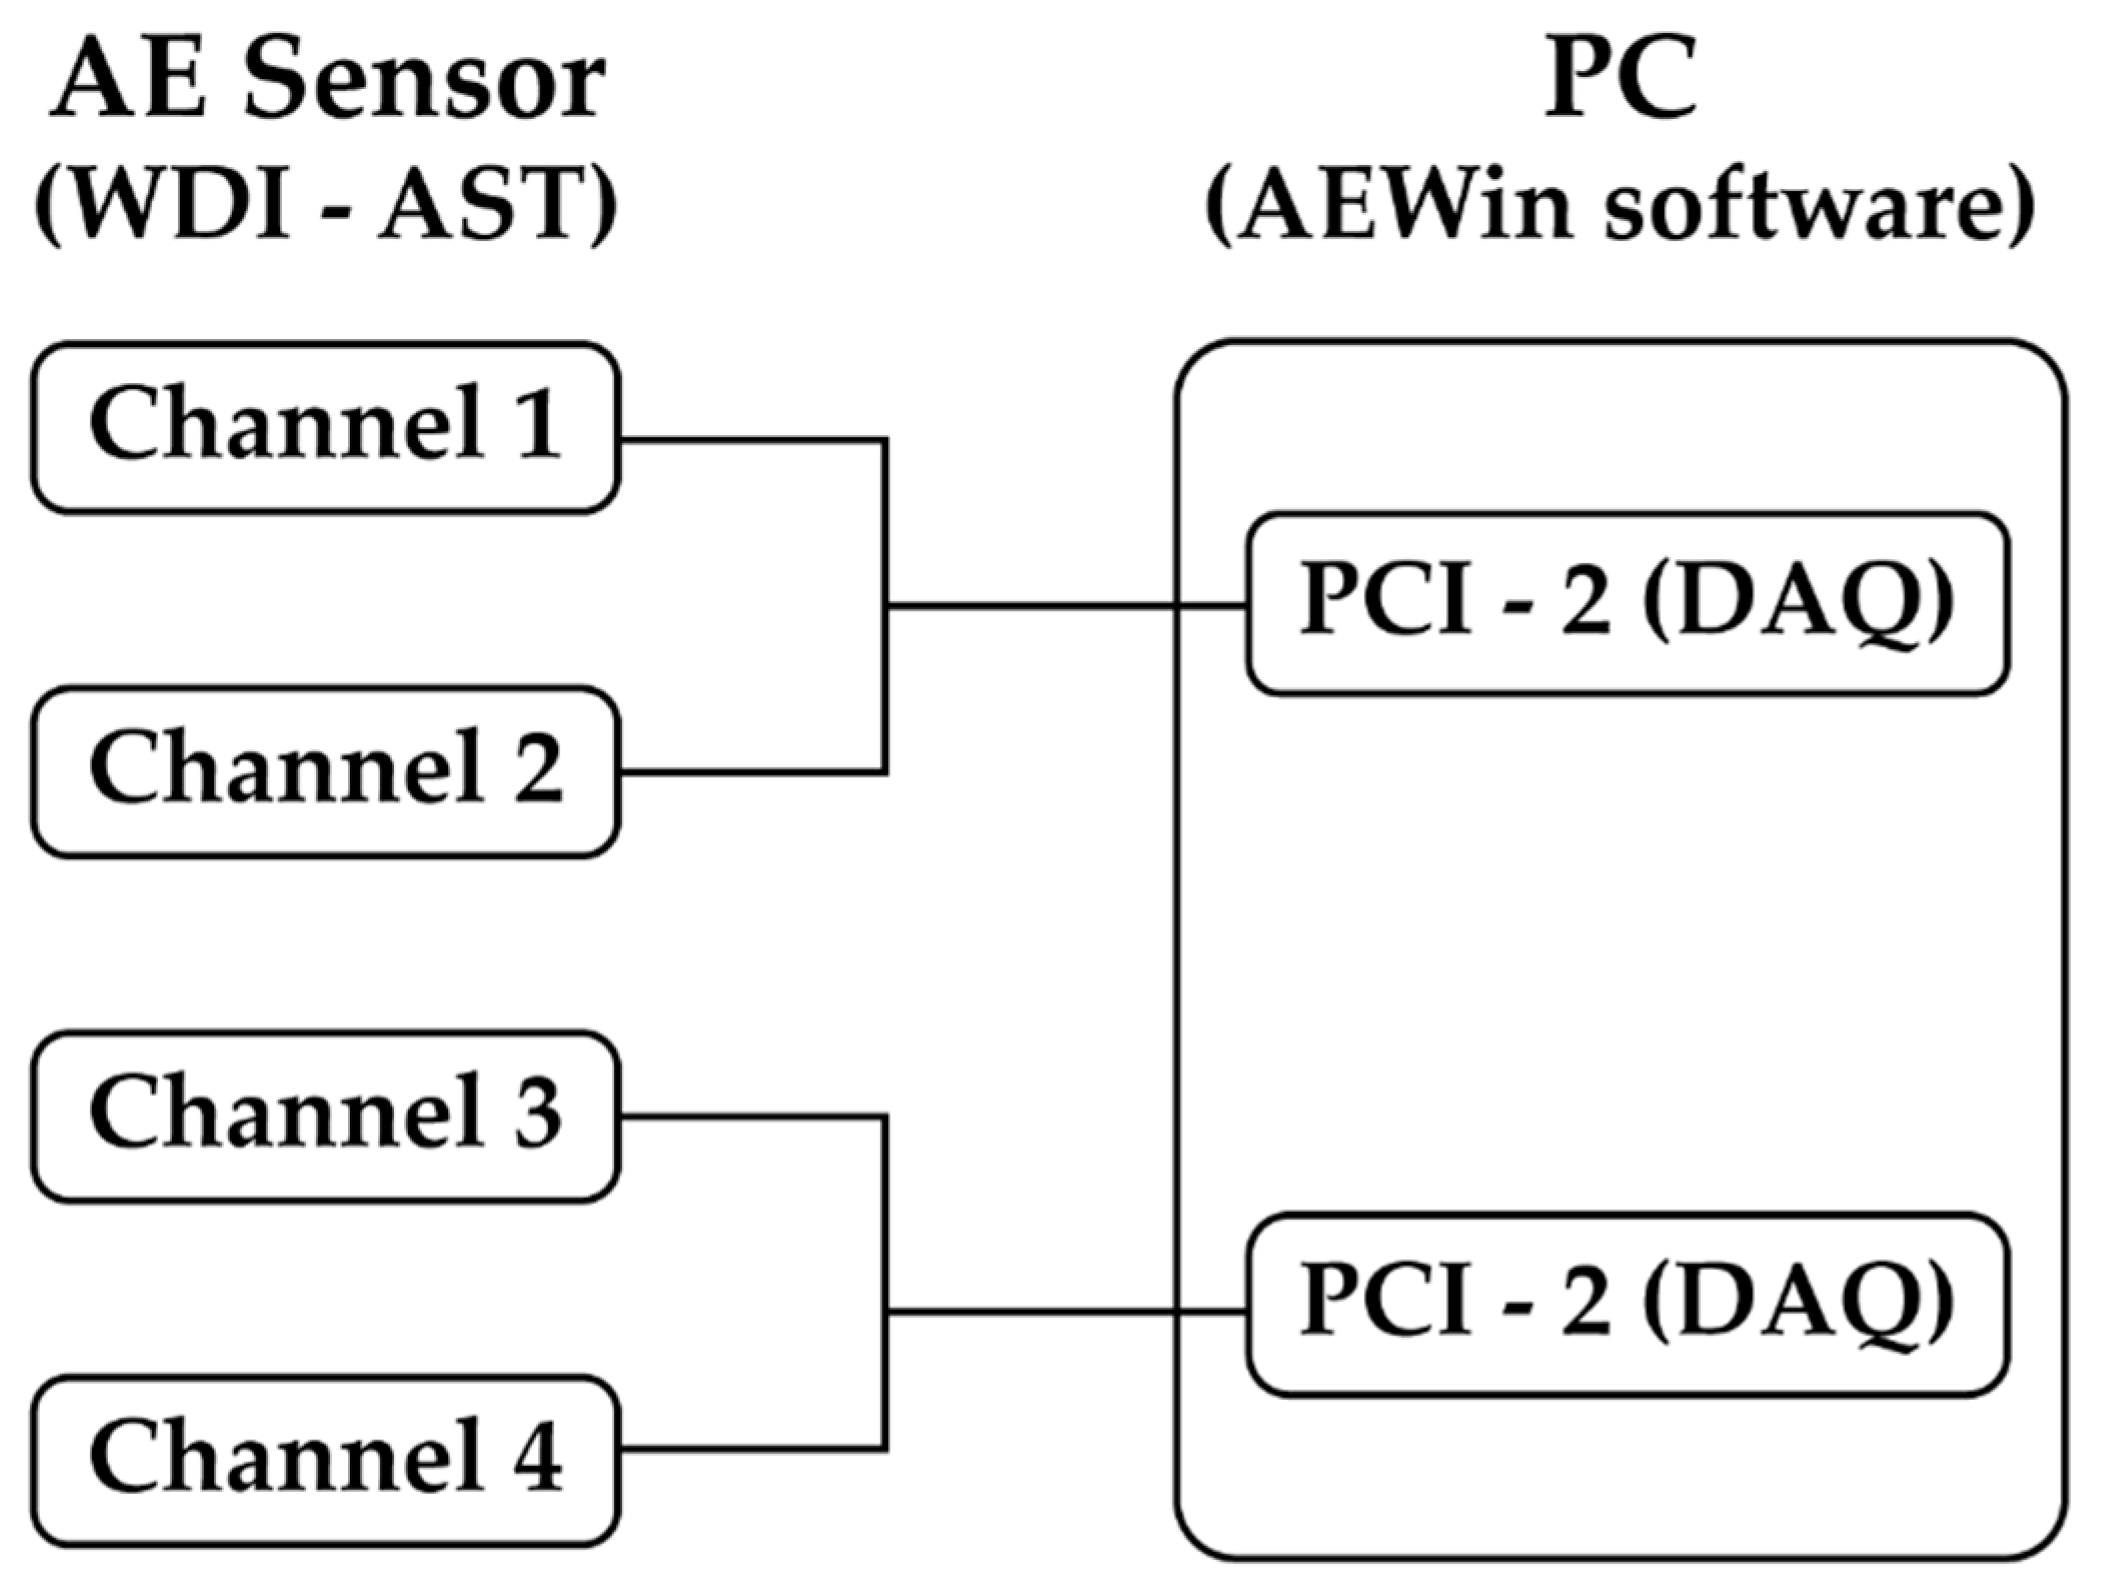
2.1. Experimental Testbed and Dataset Acquisition
2.2. Hybrid Feature Pool
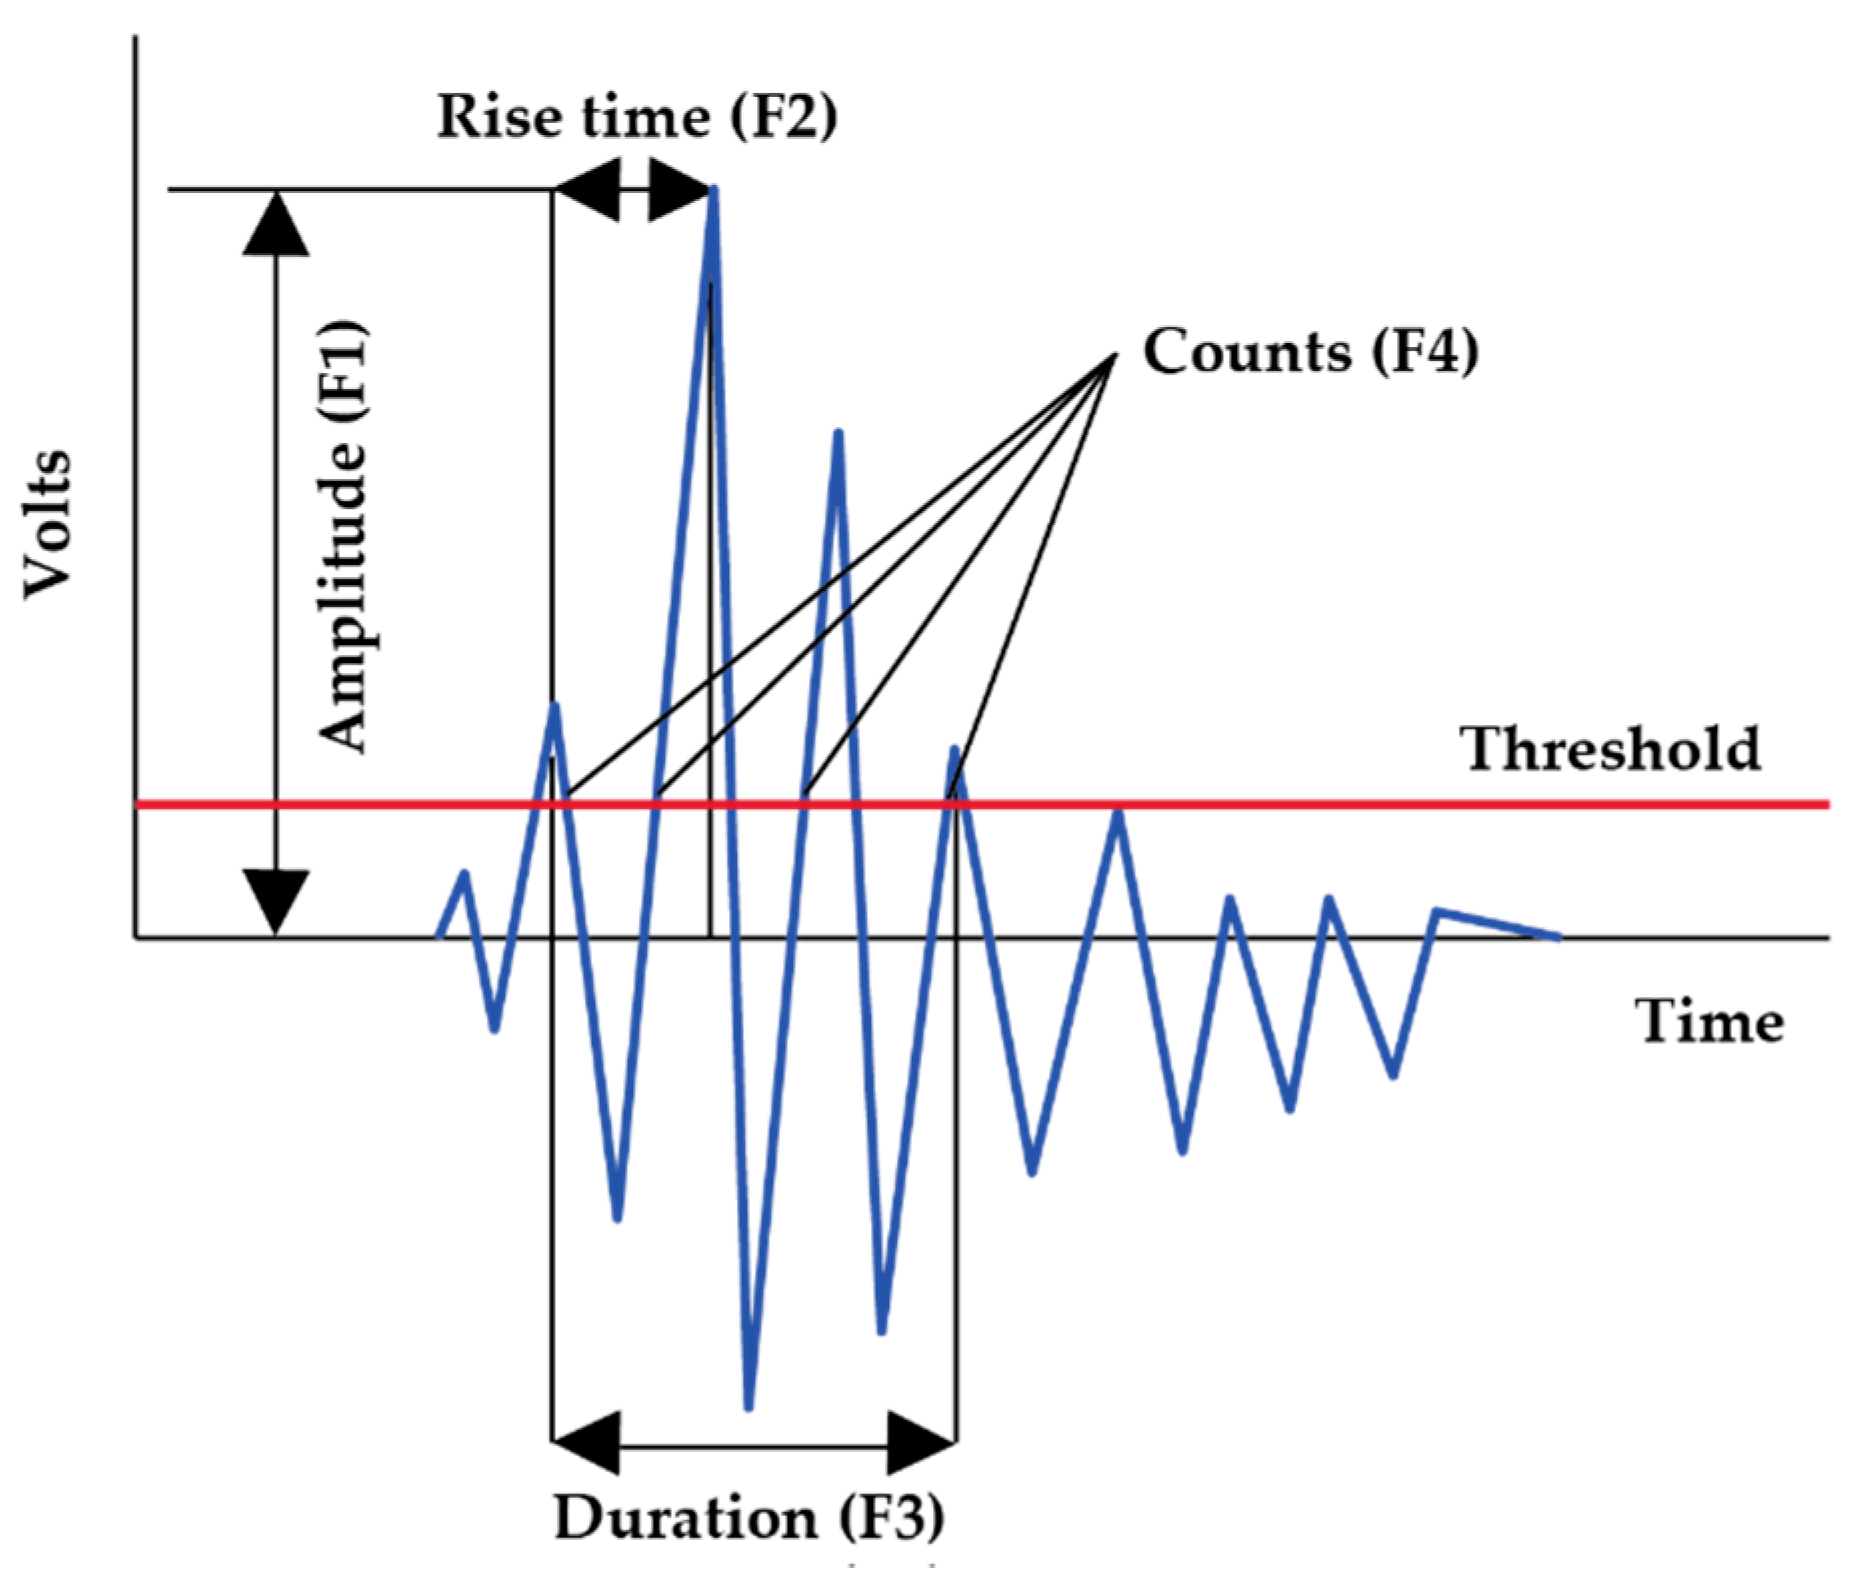
2.3. AE Signal Features
2.4. Classical Statistical Features
2.5. Feature Selection by Genetic Algorithm (GA)
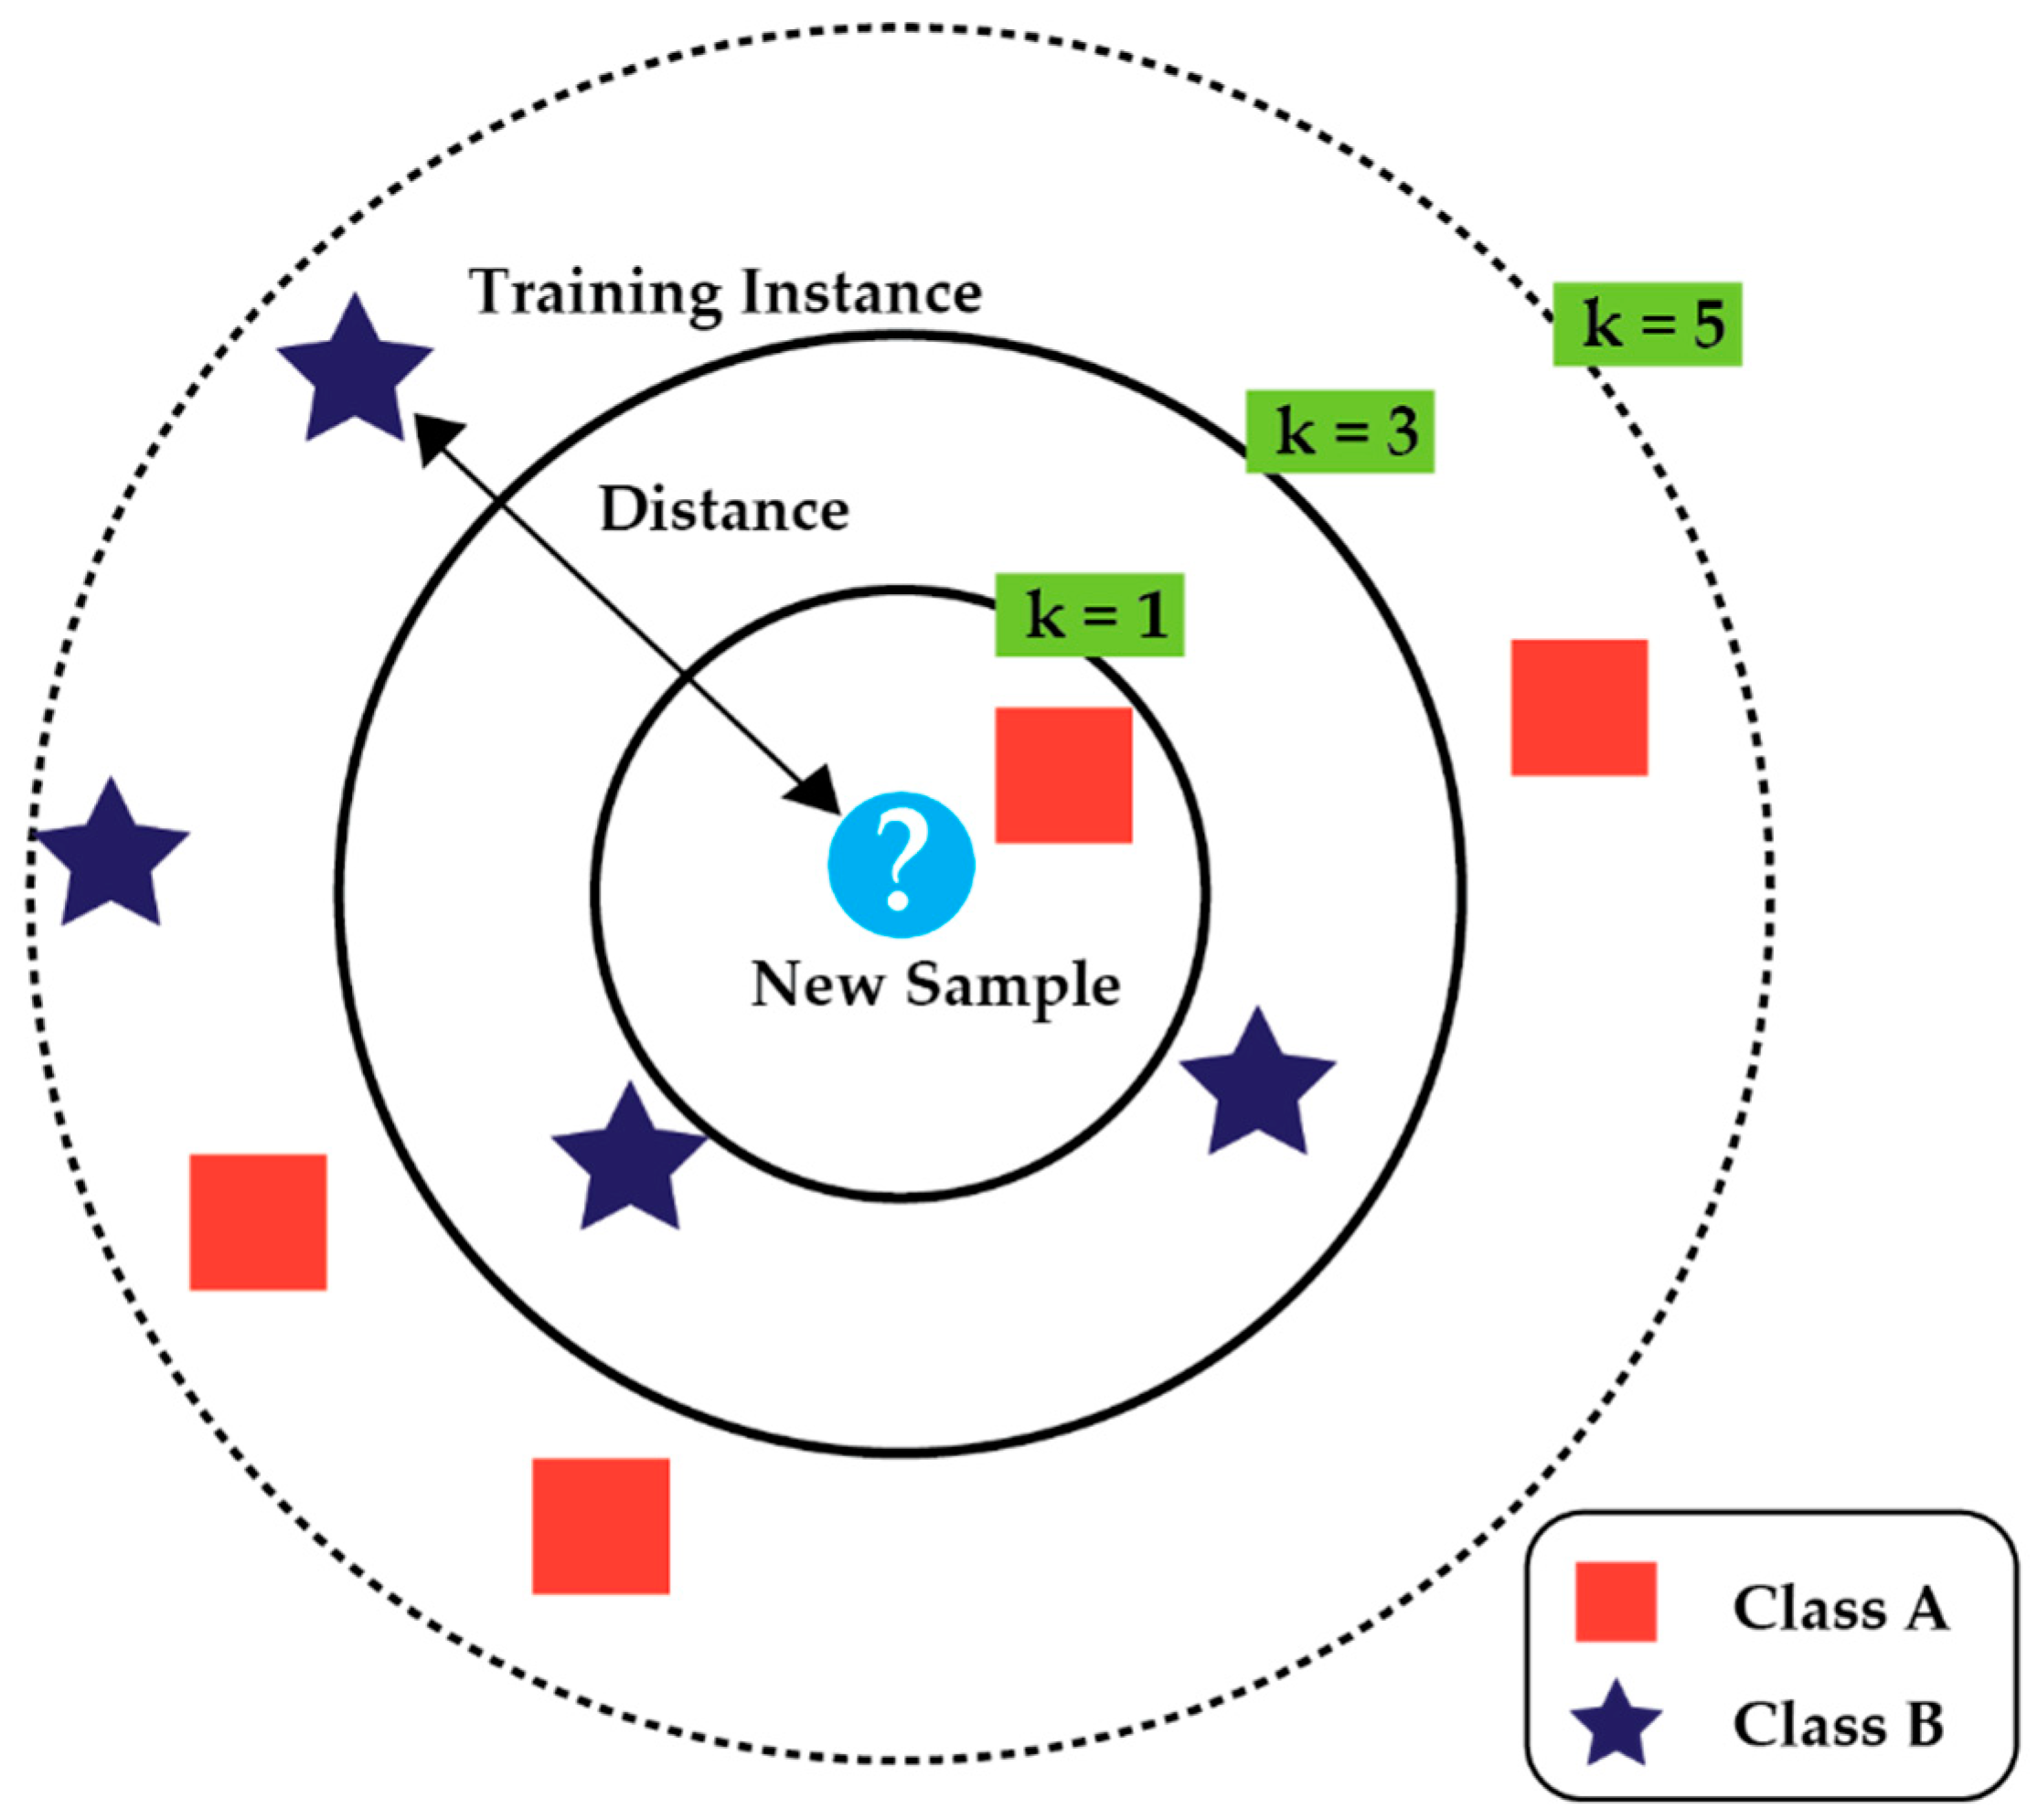
2.6. Fault Classification Using k-Nearest Neighbor (k-NN)
3. Experimental Result Analysis and Discussion
3.1. Dataset Description
3.2. Performance Analysis of the Discriminant Feature Selection by GA from the Hybrid Feature Pool
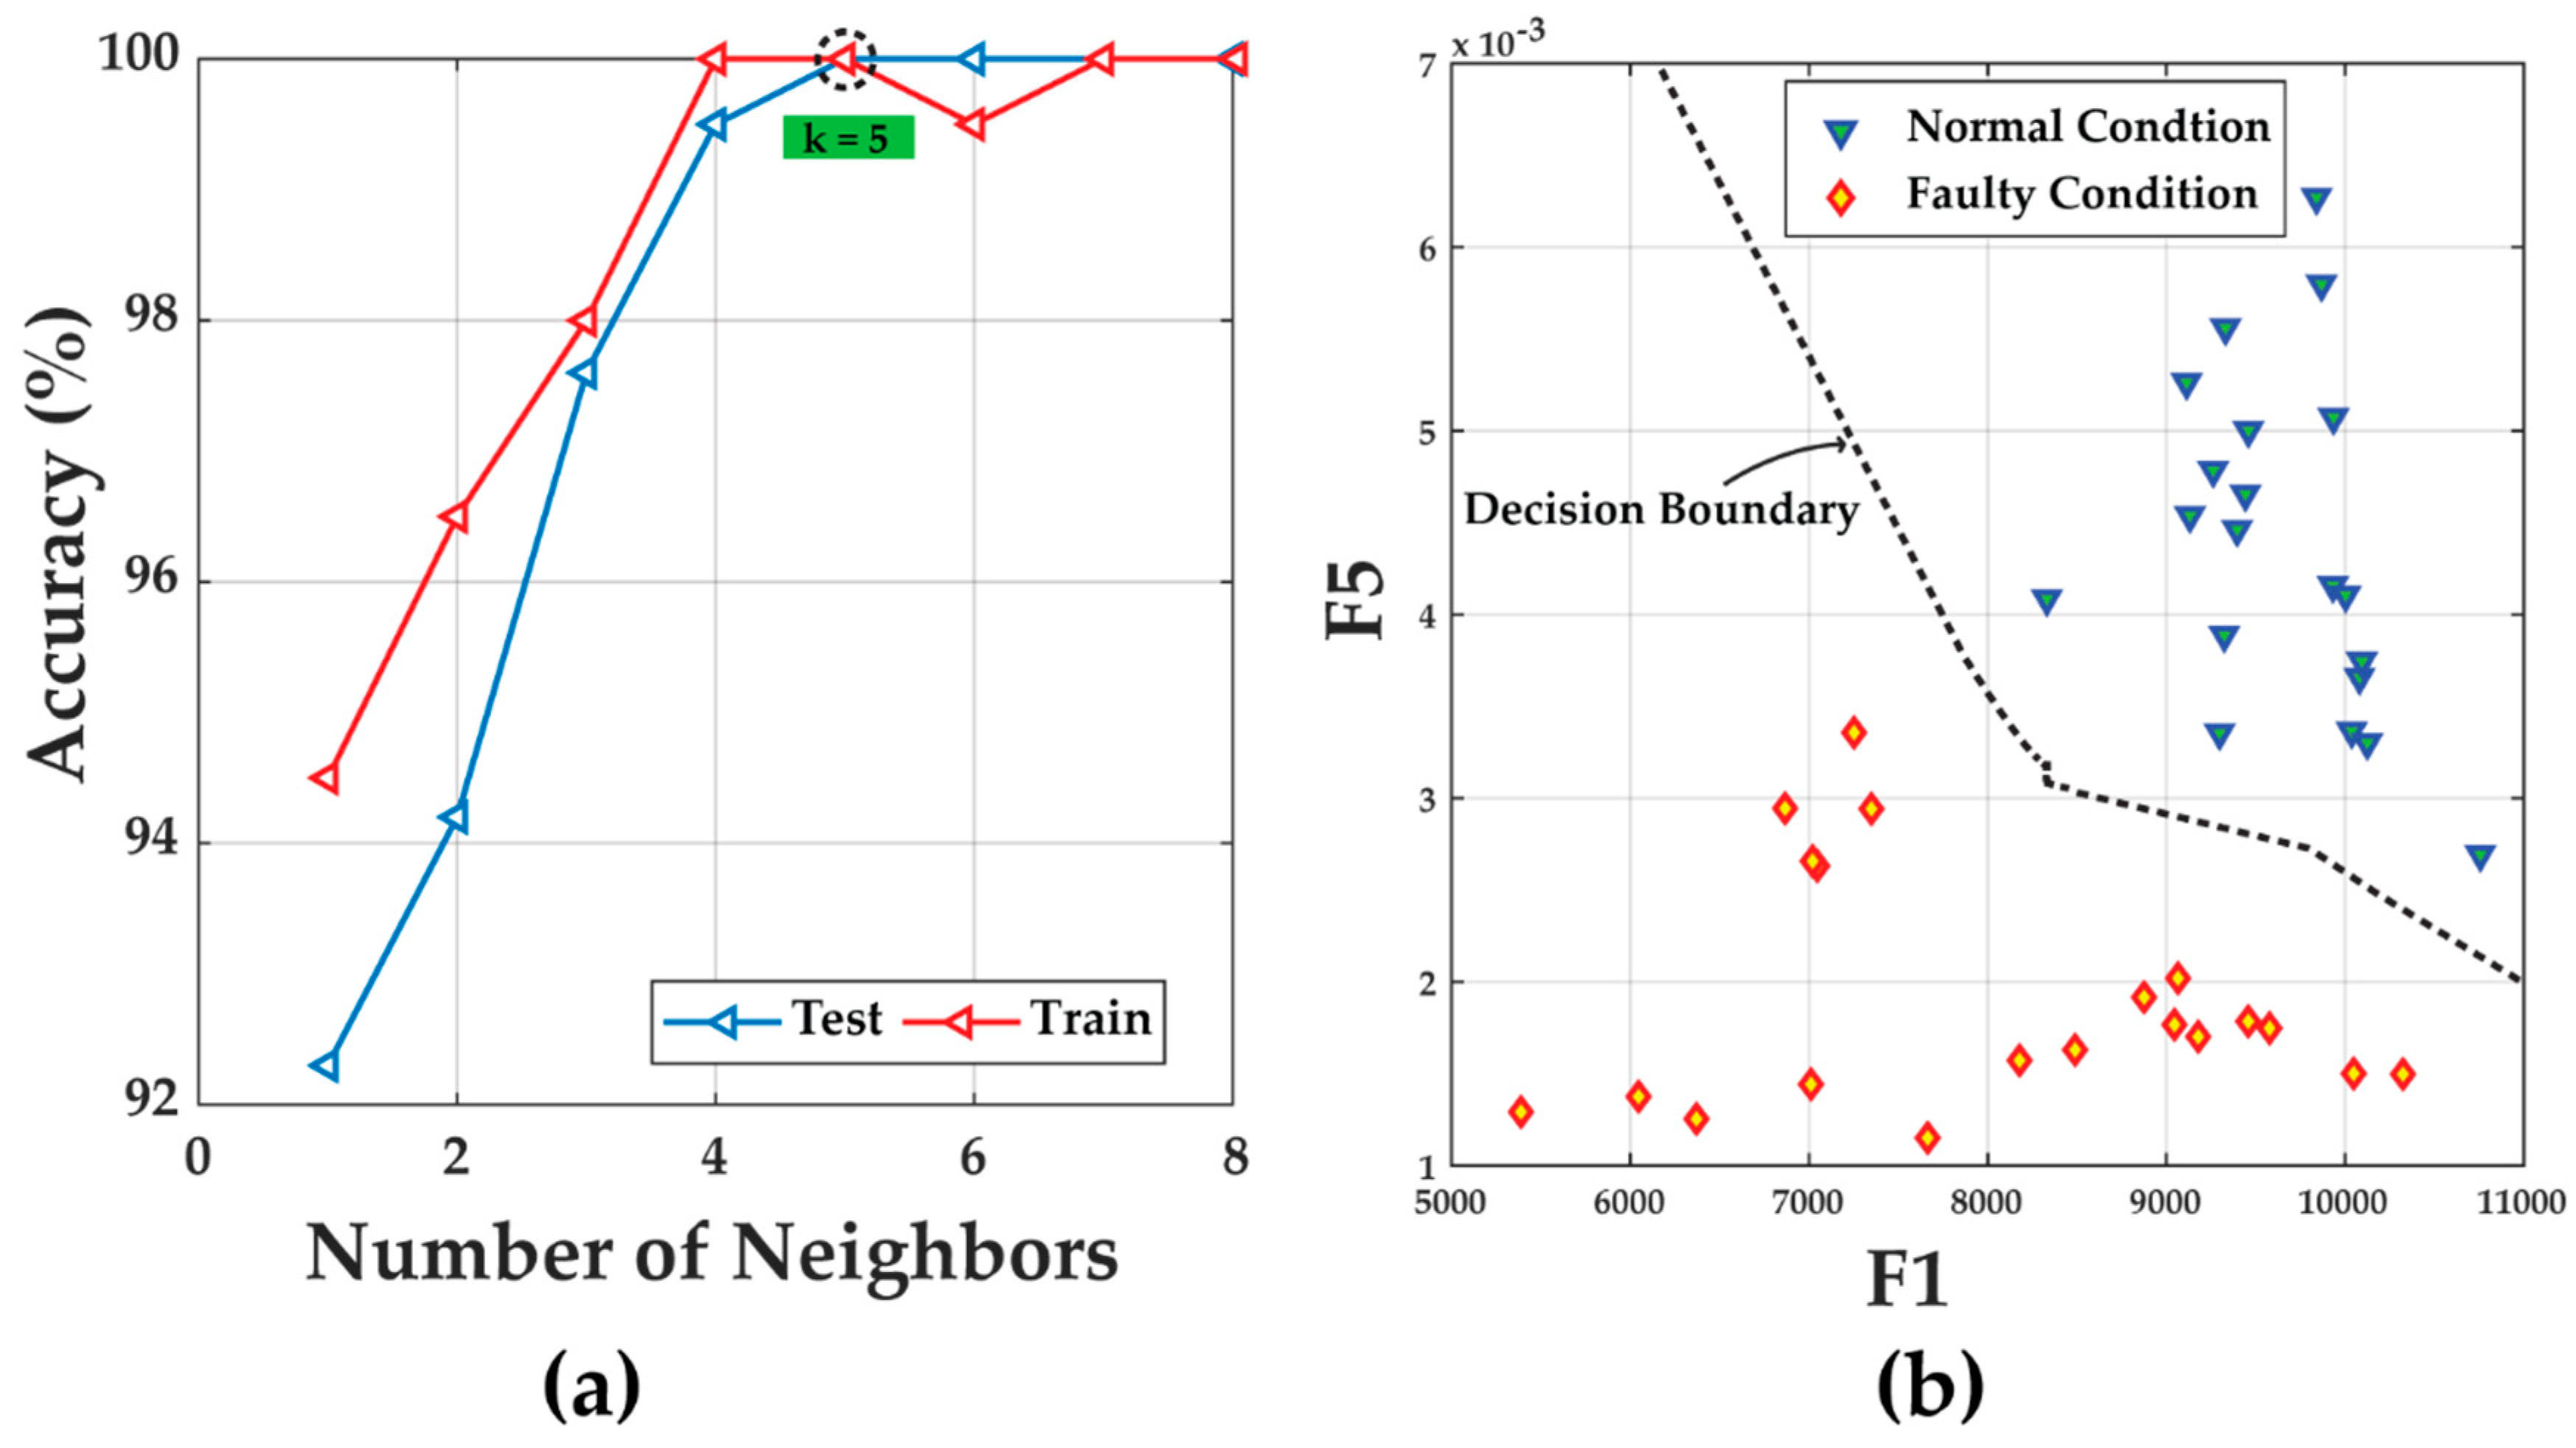
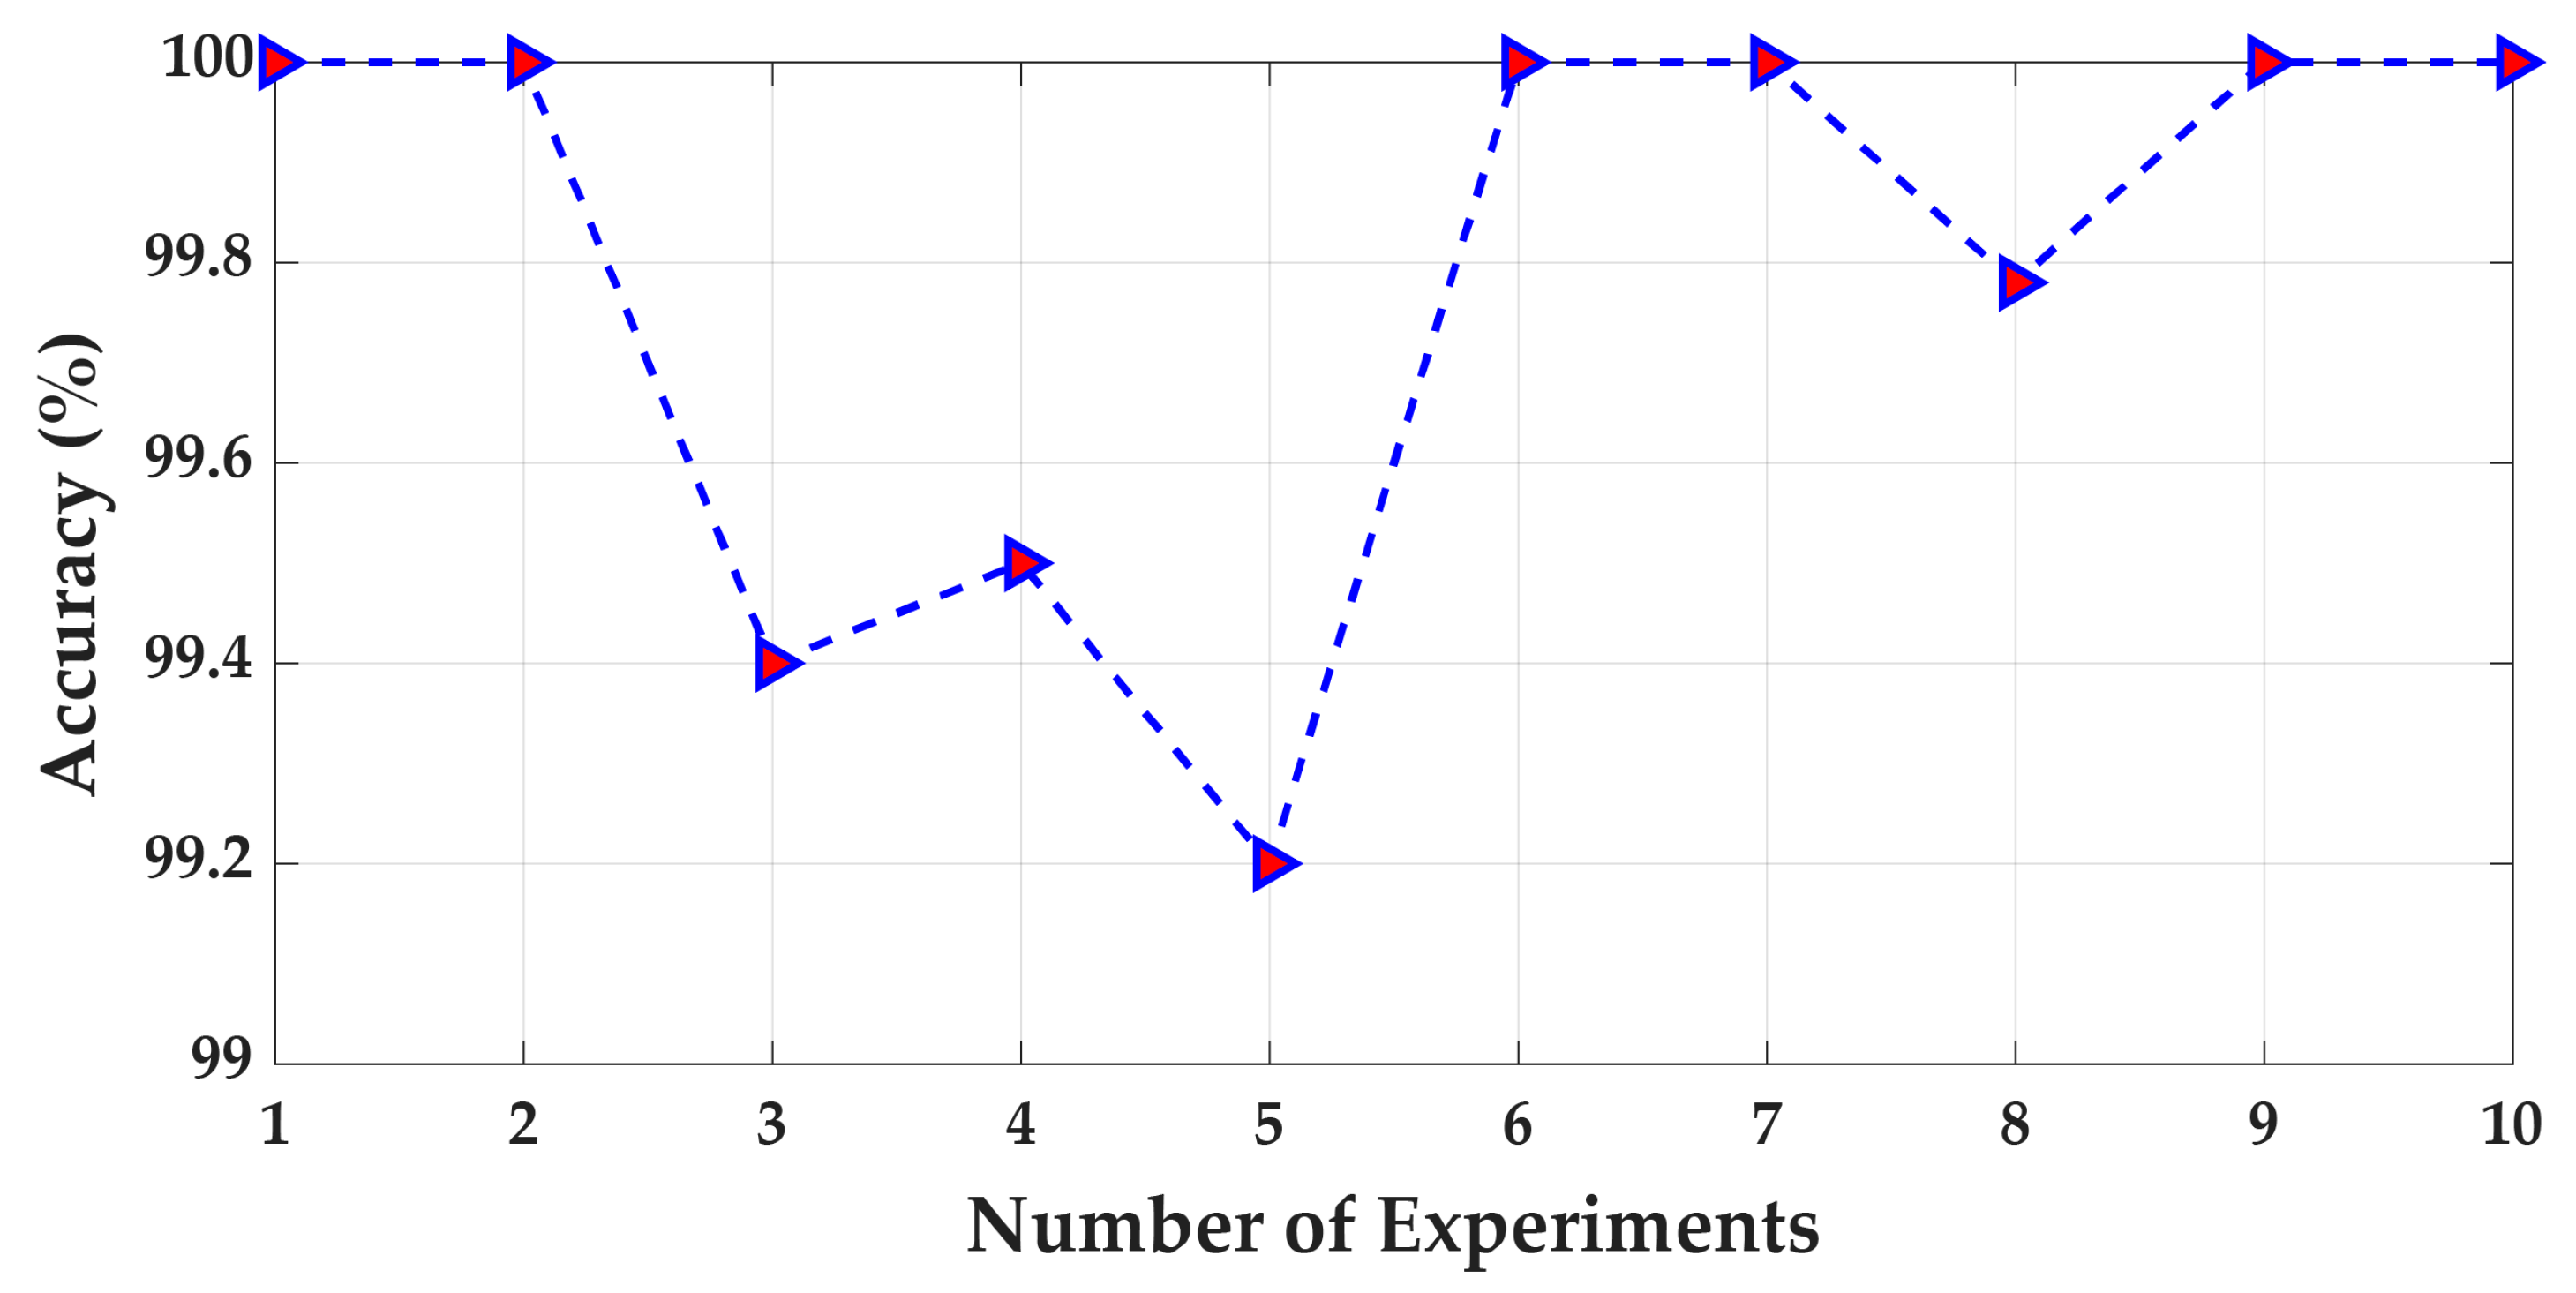
3.3. Performance Analysis of k-Nearest Neighbor Algorithm
3.4. Comparison Analysis
4. Conclusions
Author Contributions
Funding
Conflicts of Interest
References
- Saidur, R. A review on electrical motors energy use and energy savings. Renew. Sustain. Energy Rev. 2010, 14, 877–898. [Google Scholar] [CrossRef]
- Barker, G. Baker Gas Storage Tank. In The Engineer’s Guide to Plant Layout and Piping Design for the Oil and Gas Industries; Gulf Professional Publishing: Houston, TX, USA, 2018; pp. 361–380. [Google Scholar]
- Luo, T.; Wu, C.; Duan, L. Fishbone diagram and risk matrix analysis method and its application in safety assessment of natural gas spherical tank. J. Clean. Prod. 2018, 174, 296–304. [Google Scholar] [CrossRef]
- Morofuji, K.; Tsui, N.; Yamada, M.; Maie, A.; Yuyama, S.; Li, Z.W. Quantitative Study of Acoustic Emission Due To Leaks From Water Tanks. Group 2003, 21, 213–222. [Google Scholar]
- Korkmaz, K.A.; Sari, A.; Carhoglu, A.I. Seismic risk assessment of storage tanks in Turkish industrial facilities. J. Loss Prev. Process Ind. 2011, 24, 314–320. [Google Scholar] [CrossRef]
- Li, W.; Dai, G.; Wang, Y.L.F. Study of Tank Acoustic Emission Testing Signals Analysis Method Based on Wavelet Neural Network. In Proceedings of the ASME 2011 Pressure Vessels and Piping Conference, Baltimore, MD, USA, 17–21 July 2011. [Google Scholar]
- Pandya, D.H.; Upadhyay, S.H.; Harsha, S.P. Fault diagnosis of rolling element bearing with intrinsic mode function of acoustic emission data using APF-KNN. Exp. Syst. Appl. 2013, 40, 4137–4145. [Google Scholar] [CrossRef]
- Niknam, S.A.; Songmene, V.; Au, Y.H.J. The use of acoustic emission information to distinguish between dry and lubricated rolling element bearings in low-speed rotating machines. Int. J. Adv. Manuf. Technol. 2013, 69, 2679–2689. [Google Scholar] [CrossRef]
- Kang, M.; Kim, J.; Kim, J. High-Performance and Energy-Efficient Fault Diagnosis Using Effective Envelope Analysis Processing Unit. IEEE Trans. Power Electron. 2015, 30, 2763–2776. [Google Scholar] [CrossRef]
- Amar, M.; Gondal, I.; Wilson, C. Vibration spectrum imaging: A novel bearing fault classification approach. IEEE Trans. Ind. Electron. 2015, 62, 494–502. [Google Scholar] [CrossRef]
- Sohaib, M.; Kim, C.-H.; Kim, J.-M. A Hybrid Feature Model and Deep-Learning-Based Bearing Fault Diagnosis. Sensors 2017, 17, 2876. [Google Scholar] [CrossRef]
- Islam, M.M.; Kim, J.M. Motor Bearing Fault Diagnosis Using Deep Convolutional Neural Networks with 2D Analysis of Vibration Sign; Springer International Publishing: New York, NY, USA, 2003; Volume 2671, ISBN 978-3-540-40300-5. [Google Scholar]
- Tra, V.; Kim, J.; Khan, S.A.; Kim, J.-M. Bearing Fault Diagnosis under Variable Speed Using Convolutional Neural Networks and the Stochastic Diagonal Levenberg-Marquardt Algorithm. Sensors 2017, 17, 2834. [Google Scholar] [CrossRef]
- Chen, S.W.; Chen, Y.H. Hardware design and implementation of a wavelet de-noising procedure for medical signal preprocessing. Sensors (Switzerland) 2015, 15, 26396–26414. [Google Scholar] [CrossRef]
- Nguyen, P.; Kang, M.; Kim, J.M.; Ahn, B.H.; Ha, J.M.; Choi, B.K. Robust condition monitoring of rolling element bearings using de-noising and envelope analysis with signal decomposition techniques. Exp. Syst. Appl. 2015, 42, 9024–9032. [Google Scholar] [CrossRef]
- Lei, Y.; Li, N.; Lin, J.; Wang, S. Fault diagnosis of rotating machinery based on an adaptive ensemble empirical mode decomposition. Sensors (Switzerland) 2013, 13, 16950–16964. [Google Scholar] [CrossRef]
- Duong, B.-P.; Kim, J.-Y.; Kim, J.-M.; Sohaib, M.; Tra, V. Improving the Performance of Storage Tank Fault Diagnosis by Removing Unwanted Components and Utilizing Wavelet-Based Features. Entropy 2019, 21, 145. [Google Scholar]
- He, J.; Song, Y.; Du, P.; Xu, L. Analysis of Single Channel Blind Source Separation Algorithm for Chaotic Signals. Math. Probl. Eng. 2018, 2018. [Google Scholar] [CrossRef]
- Kang, M.; Kim, J.; Wills, L.M.; Kim, J.M. Time-varying and multiresolution envelope analysis and discriminative feature analysis for bearing fault diagnosis. IEEE Trans. Ind. Electron. 2015, 62, 7749–7761. [Google Scholar] [CrossRef]
- Islam, M.; Sohaib, M.; Kim, J.; Kim, J.-M.; Islam, M.; Sohaib, M.; Kim, J.; Kim, J.-M. Crack Classification of a Pressure Vessel Using Feature Selection and Deep Learning Methods. Sensors 2018, 18, 4379. [Google Scholar] [CrossRef]
- Liu, G.; Yu, Z.; Liang, X.; Ye, C. Vibration-Based Structural Damage Identification and Evaluation for Cylindrical Shells Using Modified Transfer Entropy Theory. J. Press. Vessel Technol. 2018, 140, 61204–61214. [Google Scholar] [CrossRef]
- Physicalacoustics - pci 2. Available online: https://www.physicalacoustics.com/by-product/pci-2/ (accessed on 5 January 2019).
- Physicalacoustics - sensors. Available online: https://www.physicalacoustics.com/by-product/sensors/WDI-AST-100-900-kHz-Wideband-Differential-AE-Sensor (accessed on 5 January 2019).
- Sohaib, M.; Islam, M.; Kim, J.; Jeon, D.-C.; Kim, J.-M. Leakage Detection of a Spherical Water Storage Tank in a Chemical Industry Using Acoustic Emissions. Appl. Sci. 2019, 9, 196. [Google Scholar] [CrossRef]
- Center, N. Resource AE Signal Features. Available online: https://www.nde-ed.org/EducationResources/CommunityCollege/Other Methods/AE/AE_Signal Features.php (accessed on 5 January 2019).
- Zou, S.; Yan, F.; Yang, G.; Sun, W. The identification of the deformation stage of a metal specimen based on acoustic emission data analysis. Sensors (Switzerland) 2017, 17, 789. [Google Scholar] [CrossRef]
- Kang, M.; Islam, M.R.; Kim, J.; Kim, J.M.; Pecht, M. A Hybrid Feature Selection Scheme for Reducing Diagnostic Performance Deterioration Caused by Outliers in Data-Driven Diagnostics. IEEE Trans. Ind. Electron. 2016, 63, 3299–3310. [Google Scholar] [CrossRef]
- Shen, J.; Chang, H.; Li, Y. Pressure vessel state investigation based upon the least squares support vector machine. Math. Comput. Model. 2011, 54, 883–887. [Google Scholar] [CrossRef]
- Bornn, L.; Farrar, C.R.; Park, G.; Farinholt, K. Structural Health Monitoring With Autoregressive Support Vector Machines. J. Vib. Acoust. 2009, 131, 21004–21009. [Google Scholar] [CrossRef]
- Islam, R.; Khan, S.A.; Kim, J.M. Discriminant Feature Distribution Analysis-Based Hybrid Feature Selection for Online Bearing Fault Diagnosis in Induction Motors. J. Sensors 2016, 2016, 1–16. [Google Scholar] [CrossRef]
- Yigit, H. A weighting approach for KNN classifier. In Proceedings of the 2013 International Conference on Electronics, Computer and Computation, Ankara, Turkey, 7–9 November 2013. [Google Scholar]
- Chen, X.; Xu, J.; Guo, W. The research about video surveillance platform based on cloud computing. In Proceedings of the 2013 International Conference on Machine Learning and Cybernetics, Tianjin, China, 14–17 July 2013. [Google Scholar]


| WDI-AST sensor [23] | 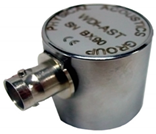 | Peak sensitivity [V/µbar]: −25 dB Operating frequency range: 200 to 900 kHz Directionality: ±1.5 dB Resonant frequency: 650 kHz |
| PCI 2 [22] | 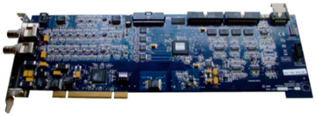 | 18-bit 40 MHz A/D conversion AE input: 2 channels Sensor testing: AST built-in Dynamic range: >85 dB |
| Time-Domain Features | |||||
| Feature | Equation | Feature | Equation | Feature | Equation |
| F5 | F6 | F7 | |||
| F8 | F9 | F10 | |||
| F11 | F12 | F13 | |||
| F14 | F15 | - | - | ||
| Frequency-Domain Features | |||||
| F16 | F17 | F18 | |||
| Health Condition | Crack Type | Crack Size (mm) | Fault Location | Sampling Frequency | Number of Channels |
|---|---|---|---|---|---|
| Normal Condition (NC) | No Crack | No Crack | No Crack | 1 Mhz | 4 |
| Crack Condition (CC) | Crack | 3 | Bottom of the Spherical Tank | 1 Mhz | 4 |
© 2019 by the authors. Licensee MDPI, Basel, Switzerland. This article is an open access article distributed under the terms and conditions of the Creative Commons Attribution (CC BY) license (http://creativecommons.org/licenses/by/4.0/).
Share and Cite
Hasan, M.J.; Kim, J.-M. Fault Detection of a Spherical Tank Using a Genetic Algorithm-Based Hybrid Feature Pool and k-Nearest Neighbor Algorithm. Energies 2019, 12, 991. https://doi.org/10.3390/en12060991
Hasan MJ, Kim J-M. Fault Detection of a Spherical Tank Using a Genetic Algorithm-Based Hybrid Feature Pool and k-Nearest Neighbor Algorithm. Energies. 2019; 12(6):991. https://doi.org/10.3390/en12060991
Chicago/Turabian StyleHasan, Md Junayed, and Jong-Myon Kim. 2019. "Fault Detection of a Spherical Tank Using a Genetic Algorithm-Based Hybrid Feature Pool and k-Nearest Neighbor Algorithm" Energies 12, no. 6: 991. https://doi.org/10.3390/en12060991
APA StyleHasan, M. J., & Kim, J.-M. (2019). Fault Detection of a Spherical Tank Using a Genetic Algorithm-Based Hybrid Feature Pool and k-Nearest Neighbor Algorithm. Energies, 12(6), 991. https://doi.org/10.3390/en12060991