Article

Variation of Petrophysical Properties and Adsorption Capacity in Different Rank Coals: An Experimental Study of Coals from the Junggar, Ordos and Qinshui Basins in China

1
School of Energy Resources, China University of Geosciences, Beijing 100083, China
2
Coal Reservoir Laboratory of National Engineering Research Center of CBM Development & Utilization, China University of Geosciences, Beijing 100083, China
*
Author to whom correspondence should be addressed.
Energies 2019, 12(6), 986; https://doi.org/10.3390/en12060986
Submission received: 29 January 2019 / Revised: 4 March 2019 / Accepted: 11 March 2019 / Published: 13 March 2019
(This article belongs to the Special Issue Development of Unconventional Reservoirs)

Abstract

:
The petrophysical properties of coal will vary during coalification, and thus affect the methane adsorption capacity. In order to clarify the variation rule and its controlling effect on methane adsorption, various petrophysical tests including proximate analysis, moisture measurement, methane isothermal adsorption, mercury injection, etc. were carried out on 60 coal samples collected from the Junggar, Ordos and Qinshui basins in China. In this work, the boundary values of maximum vitrinite reflectance (Ro,m) for dividing low rank, medium rank and high rank coals are set as 0.65% and 2.0%. The results show that vitrinite is the most abundant maceral, but the maceral contents are controlled by sedimentation without any relation to coal rank. Both the moisture content and porosity results show higher values in the low ranks and stabilized with Ro,m beyond 1%. Ro,m and VL (daf) show quadratic correlation with the peak located in Ro,m = 4.5–5%, with the coefficient (R2) reaching 0.86. PL decrease rapidly before Ro,m = 1.5%, then increase slowly. DAP is established to quantify the inhibitory effect of moisture on methane adsorption capacity, which shows periodic relationship with Ro,m: the inhibitory effect in lignite is the weakest and increases during coalification, then remains constant at Ro,m = 1.8% to 3.5%, and finally increases again. In the high metamorphic stage, clay minerals are more moisture-absorbent than coal, and the inherent moisture negatively correlates with the ratio of vitrinite to inertinite (V/I). During coalification, micro gas pores gradually become dominant, fractures tends to be well oriented and extended, and clay filling becomes more common. These findings can help us better understand the variation of petrophysical properties and adsorption capacity in different rank coals.

1. Introduction

Coalbed methane (CBM), a form of natural gas extracted from coal seams, has been widely considered a clean alternative energy in fossil fuel development [1,2,3]. Nevertheless, its accumulation is always deemed a serious safety risk to coal mining [3,4]. Therefore, a deeper understanding of the storage capacity of coal could facilitate safe and effective methane production. Adsorption is the main occurrence state in which CBM exists in most middle and high rank coal reservoirs [3,4,5], thus investigating the factors of coal affecting adsorption is essential for integrated evaluation of CBM recoverability. A previous study [6] has also confirmed free and soluble gases still account for a certain portion of CBM resources. In addition, the physical characteristics of coal functional groups will evolve during coalification, which also influence the methane adsorption [7,8,9]. Therefore, we expect to find a regularity in the variation of the inherent physical properties in the entire coal rank, allowing us to ascertain the main controlling factors of coal adsorption. Different from previous studies, this work also attempts to establish some experimental formulas on the basis of numerous experiments. These formulas and conclusions are expected to have practical significance both in CBM production prediction or mining security risk assessment.
Adsorption capacity is determined by the pressure-temperature (P-T) conditions and the nature of coal, the former has been expressed with Langmuir adsorption isotherm [6,7,8,9,10], but the influence of the latter still remains controversial. Many experiments have been carried out to study the controlling factors of coal adsorption, including coal rank, coal macerals, coal quality, moisture content, pore structure and specific area [8,9,10,11,12,13,14,15,16,17,18]. Coal metamorphism dominates the variation of coal adsorption. Su et al. [19] believed that coal rank and Langmuir volume (VL) present a reverse U relationship. Zhang et al. [20] confirmed this statement and demonstrated that ink bottle pores promote adsorption. In addition, various factors that influence the coal adsorption at different stage of coal metamorphism have been investigated. Weniger et al. [21] concluded that maceral is independent of coal adsorption capacity by comparing CO2 and CH4 adsorption experiments. However, other works [9,20,22] demonstrated that both vitrinite and inertinite can enhance the adsorption capacity. Li et al. [23] proved that the specific surface area is irrelevant to adsorption based on coal adsorption barrier theory, whereas An et al. [24] noted that the specific surface area of small micropores decides the CH4 adsorption in coals.
As an organic rock, coal has a serious heterogeneity, especially regarding the macrolithotype and coal structure, and this heterogeneity has ignored effects on methane adsorption [12,13,14]. Interlayer inhomogeneity in coal seam results in heterogeneity of physical properties. In order to establish a universal change regularity of the physical properties and adsorption capacity in coals with a wide rank, the influence of irrelevant variables originated from various sublayers should be reduced as much as possible. Therefore, coal macrolithotype and coal structure were constrained in this work, and all selected specimens were semi-bright coals and undeformed. All samples underwent proximate analysis, porosity calculations, maceral identification, equilibrium moisture analysis, and isothermal adsorption experiments.

2. Samples and Experiments
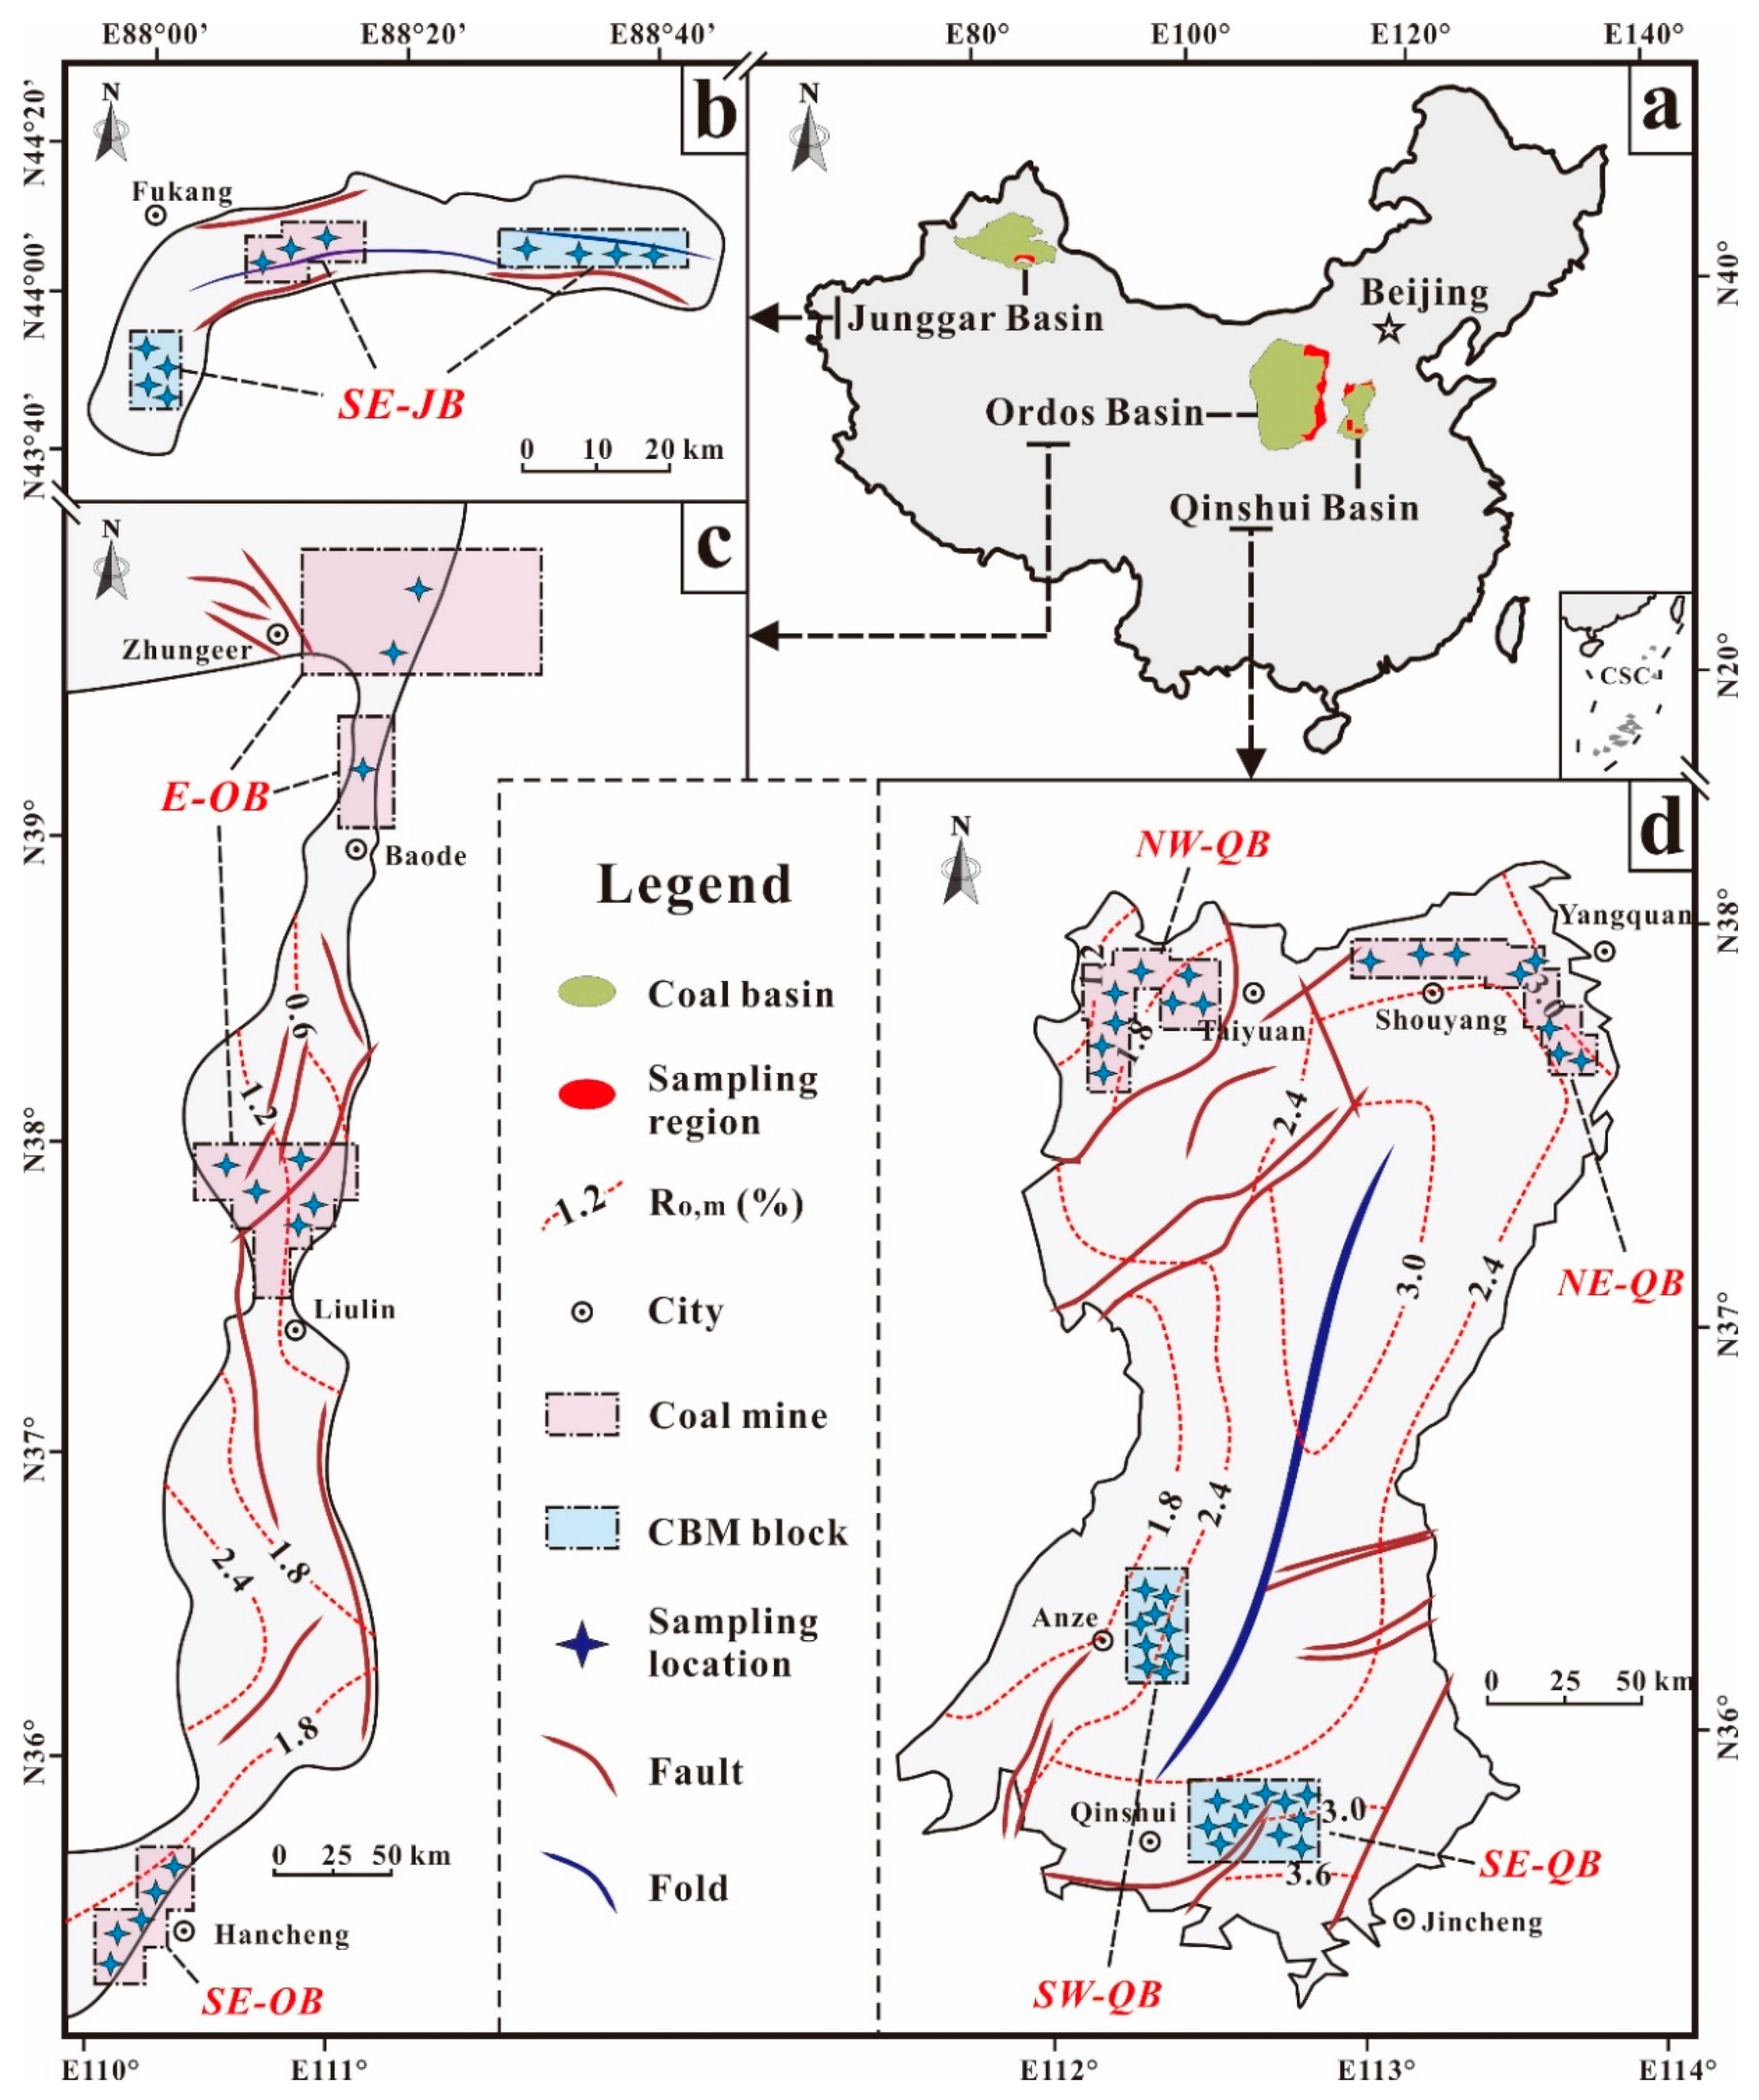
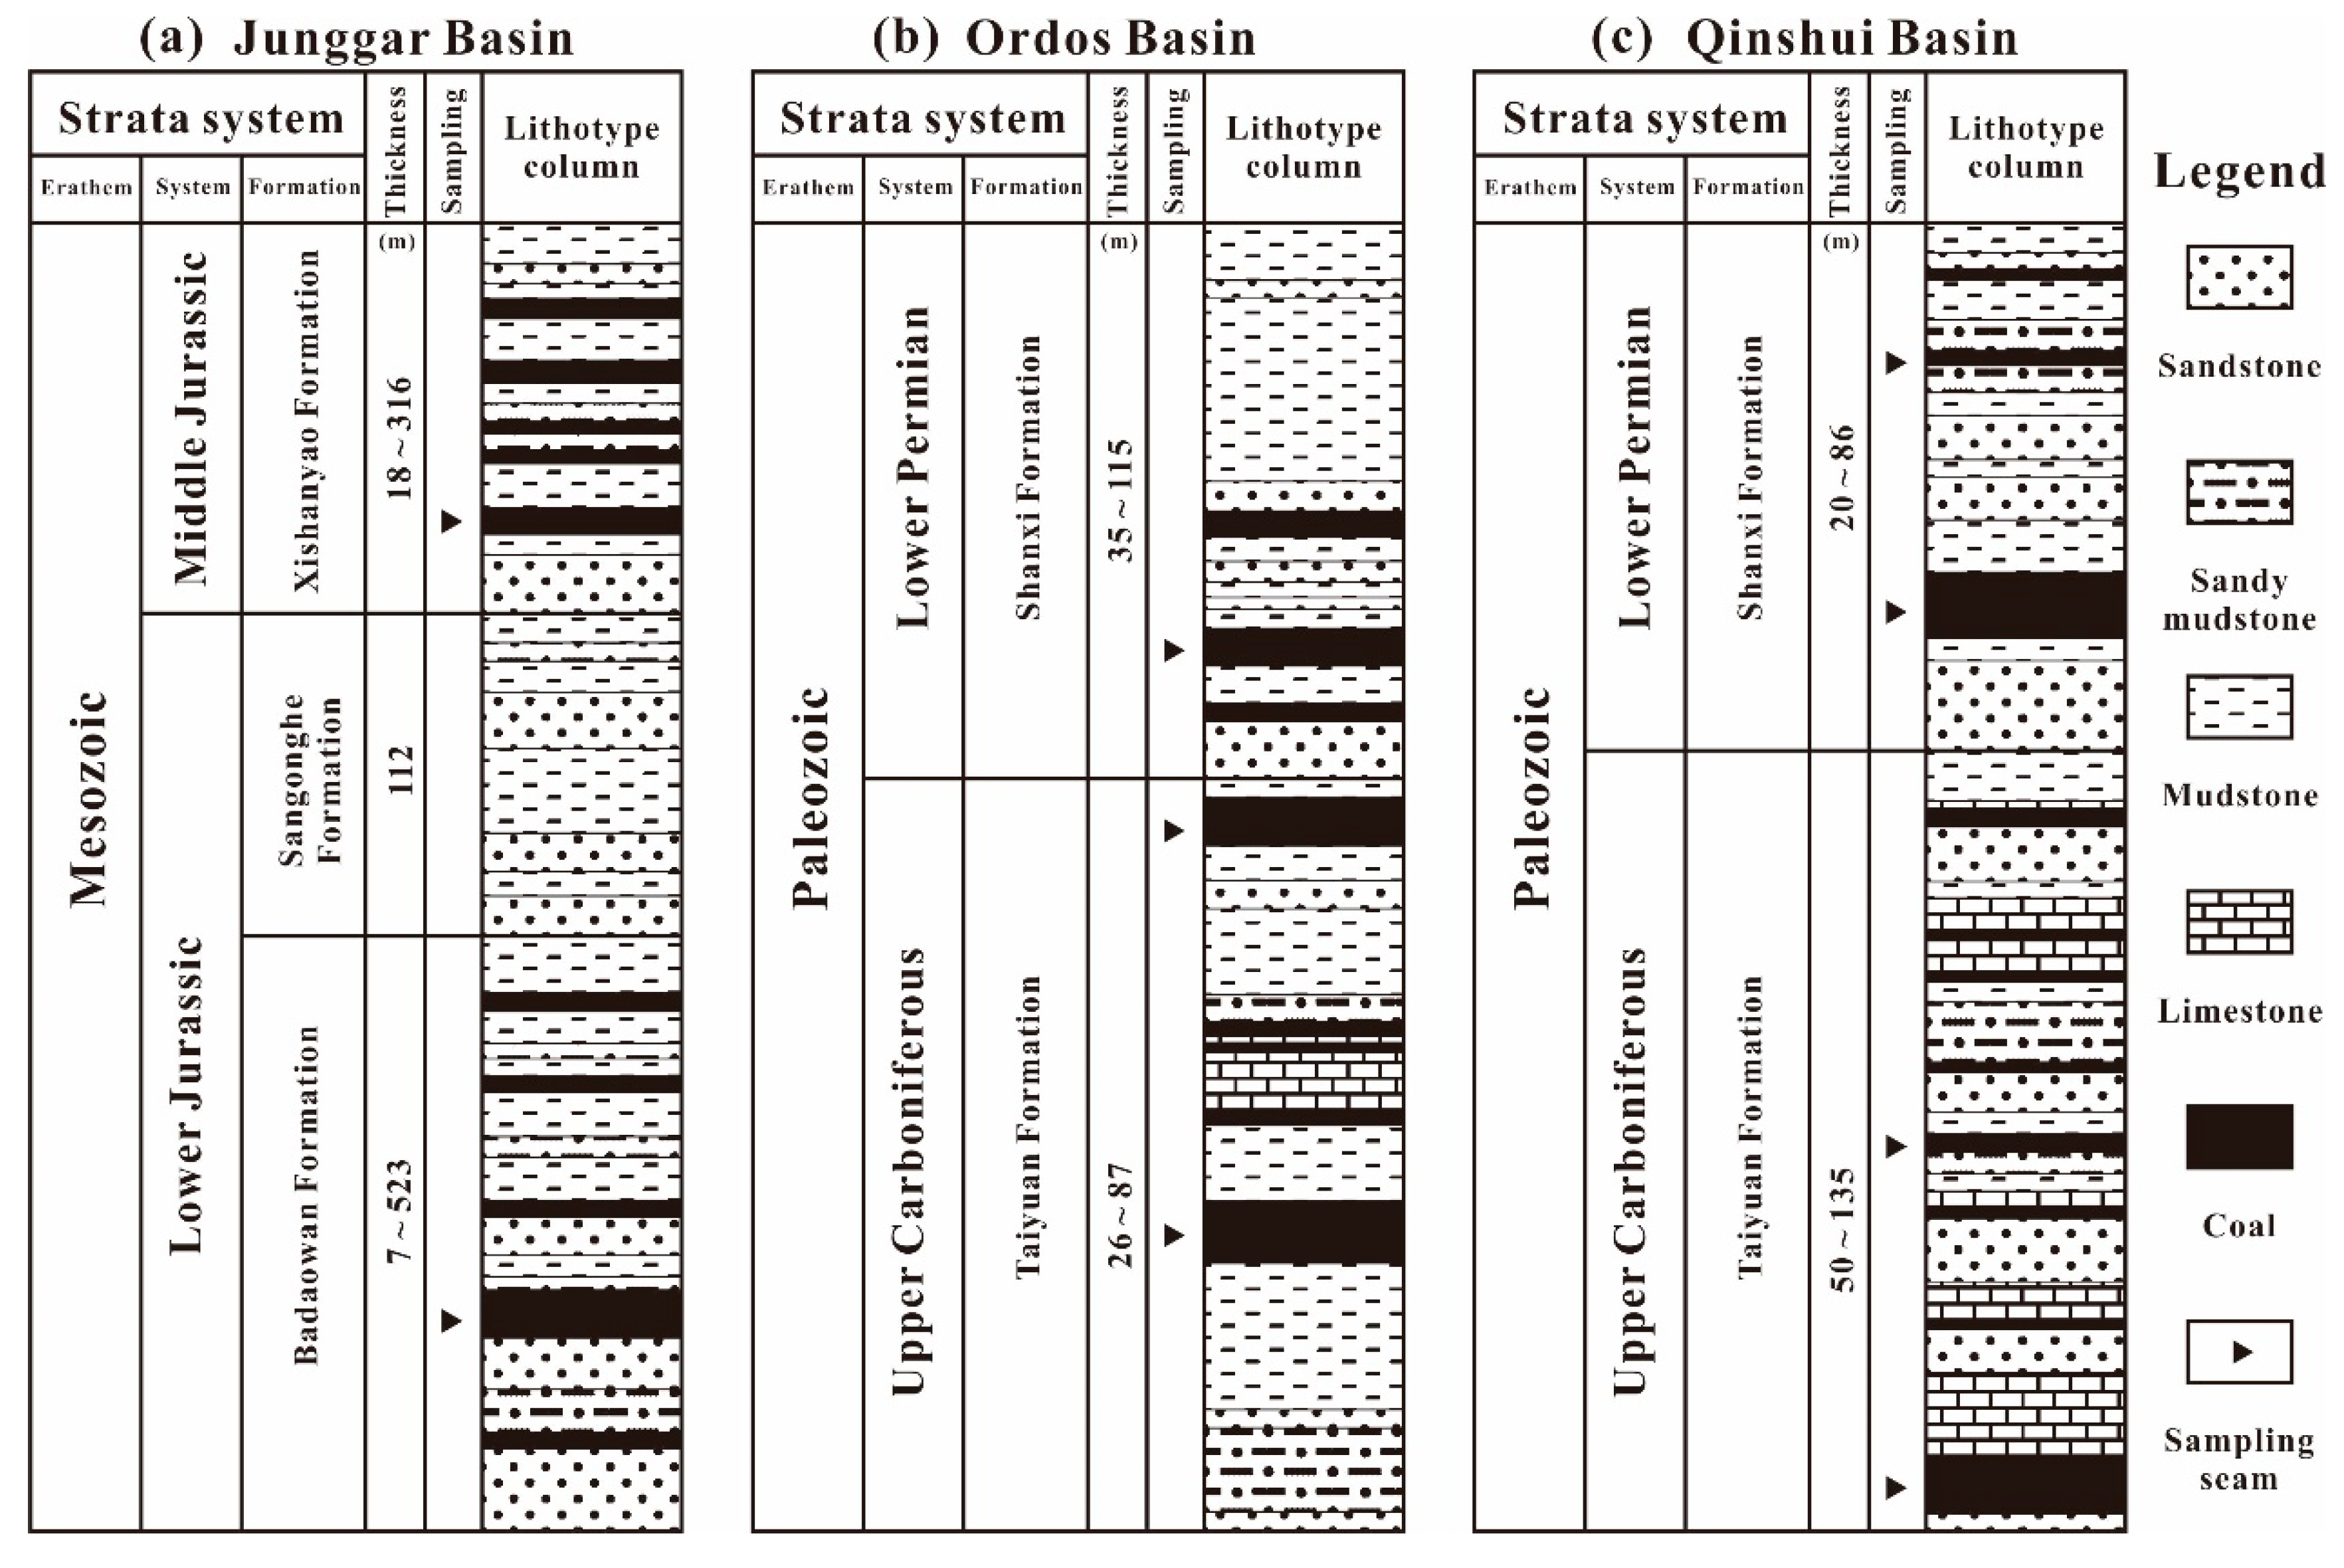
2.1. Sampling Areas

Coal blocks of about 5 kg each were collected using the channel method from the southeastern Junggar basin, and the eastern margin of the Ordos basin and the Qinshui basin (Figure 1a). To prevent sample oxidization and moisture loss, all samples were carefully jacketed with plastic wrap, and then immediately transported to the laboratory for the experiments.
The southeastern Junggar basin (SE-JB) is located between the Junggar basin and the Tianshan orogenic belt (Figure 1b), and the main coal-bearing strata include the Badaowan and Sangonghe formations of the Early Jurassic and the Xishanyao and Toutunhe formations of the Middle Jurassic [25] (Figure 2a). Eleven samples were obtained from two coal mines and a CBM block in SE-JB. The eastern margin of the Ordos basin is a large gentle monoclinal structure of near NS strike and dip NE, and complex secondary folds are developed locally (Figure 1c). The main coal-bearing strata are the Taiyuan formation of the Late Carboniferous and the Shanxi formation of the Early Permian [26] (Figure 2b), and the coal rank increases gradually from north to south. In the Ordos basin, 13 samples were all collected from the east (E-OB) and southeast (SE-OB) (Figure 1c). The remaining 36 samples were all collected from the Qinshui basin, including the Xishan coal field in the northwest (NW-QB) (Figure 1d), the Yangquan-Shouyang coal mine in the northeast (NE-QB), the Jincheng-Qinshui block in the south (S-QB) and the Anze block in the southwest (SW-QB). The Qinshui basin is structurally a large complex monocline with NNE-SSW strike, developing two sets of coal-bearing sedimentary systems in the Shanxi and Taiyuan formations [27,28,29] (Figure 2c), producing medium-high rank coals.

2.2. Methodology

(1) Measurement of coal density and porosity
True density (ρT) was obtained by applying the pycnometry method, and apparent density (ρA) was determined through the waxing method. Porosity (%) of coal can be calculated by Equation (1) with true density (ρT) and apparent density (ρA):
φ = ( ρ T ρ A ) / ρ T × 100 %
where φ is the porosity (%); ρT is true density (g/cm3); and ρA is true density (g/cm3).
(2) Vitrinite reflectance (Ro,m) measurement
Coal rank was described by Ro,m (maximum vitrinite reflectance). After the coal slab was polished, petrologic observations (500 points) were taken in oil immersion apparatus under white light using a magnification of 500× using a photometer system, following the Chinese standard (GB/T) 6948-998.
(3) Coal proximate analysis
Coal proximate analysis, including Aad (ash yield of air dry basis), Vdaf (volatile matter content of dry ash-free basis), Mad (moisture content of air dry basis), and Fad (fixed carbon of air dry basis), was performed on coal samples with a particle size of <0.2 mm based on the ISO 17246-2010 test standard.
(4) CH4 isothermal adsorption analysis
CH4 isothermal adsorption analysis were conducted following the GB/T 19560-2004 standard. Coal samples were prepared by sieving to the same particle size fraction of 0.23–0.45 mm, and then placed in a sample cell, at 30 °C and an equilibrium pressure of 8 MPa. Tests for samples under air dry basis and equilibrium moisture conditions were conducted to get VL(em) and VL(ad), respectively, VL(daf) is calculated by:
V L ( d a f ) = V L ( a d ) × ( 1 M a d A a d )
Before the adsorption experiment, inherent moisture contents (Mad) and ash yields (Aad) of samples were measured by proximate analysis. To obtain the equilibrium moisture content (Me), a crushed sample under air dry basis is soaked in water for 24 h, then it is kept in a sealed chamber, where K2SO4 solution is present to control the vapour partial pressure within the air in the chamber at a relative humidity of approximately 95% at room temperature. The sample moisture content is allowed to equilibrate with this relative humidity over 48 h. This process ensures the moisture in the coal sample reaches equilibrium. Me used in this work is defined as:
M e = m H 2 O / ( m c o a l + m H 2 O ) × 100 %
where Me is the equilibrium moisture content, mH2O is the total mass of water uptake in coal, mcoal is the total mass of the dry coal.
Equilibrium moisture content (Me) indicates external moisture, which occurs predominantly by adsorption on the walls of the micropore network. Langmuir volume (VL) and the Langmuir pressure (PL) were expressed with Equation (4)
V / V L = P / ( P L + P )
where V is the gas adsorbed volume (cm3/g); P is the pressure (MPa); PL is the Langmuir pressure (MPa); and VL is the Langmuir volume (cm3/g).
(5) Scanning electron microscopy (SEM)
The equipment model was FEI Quanta FEG 450: Acceleration Voltage: 0.2–30 kV; resolution: 1.0 nm at 30 kV, 3.0 nm at 1 kV; Magnification: 1,000,000. Sample preparation: Coal fragments with an area of ~1 cm2 were cut and fixed on sample mounts using conductive adhesive, which were then sputter coated with gold. The images of the samples were processed with FEI software.

3. Results

Tested parameters of coal samples, including maceral content, proximate analysis, isothermal adsorption, moisture measurements and vitrinite reflectance results, were listed in attached table (Table A1).

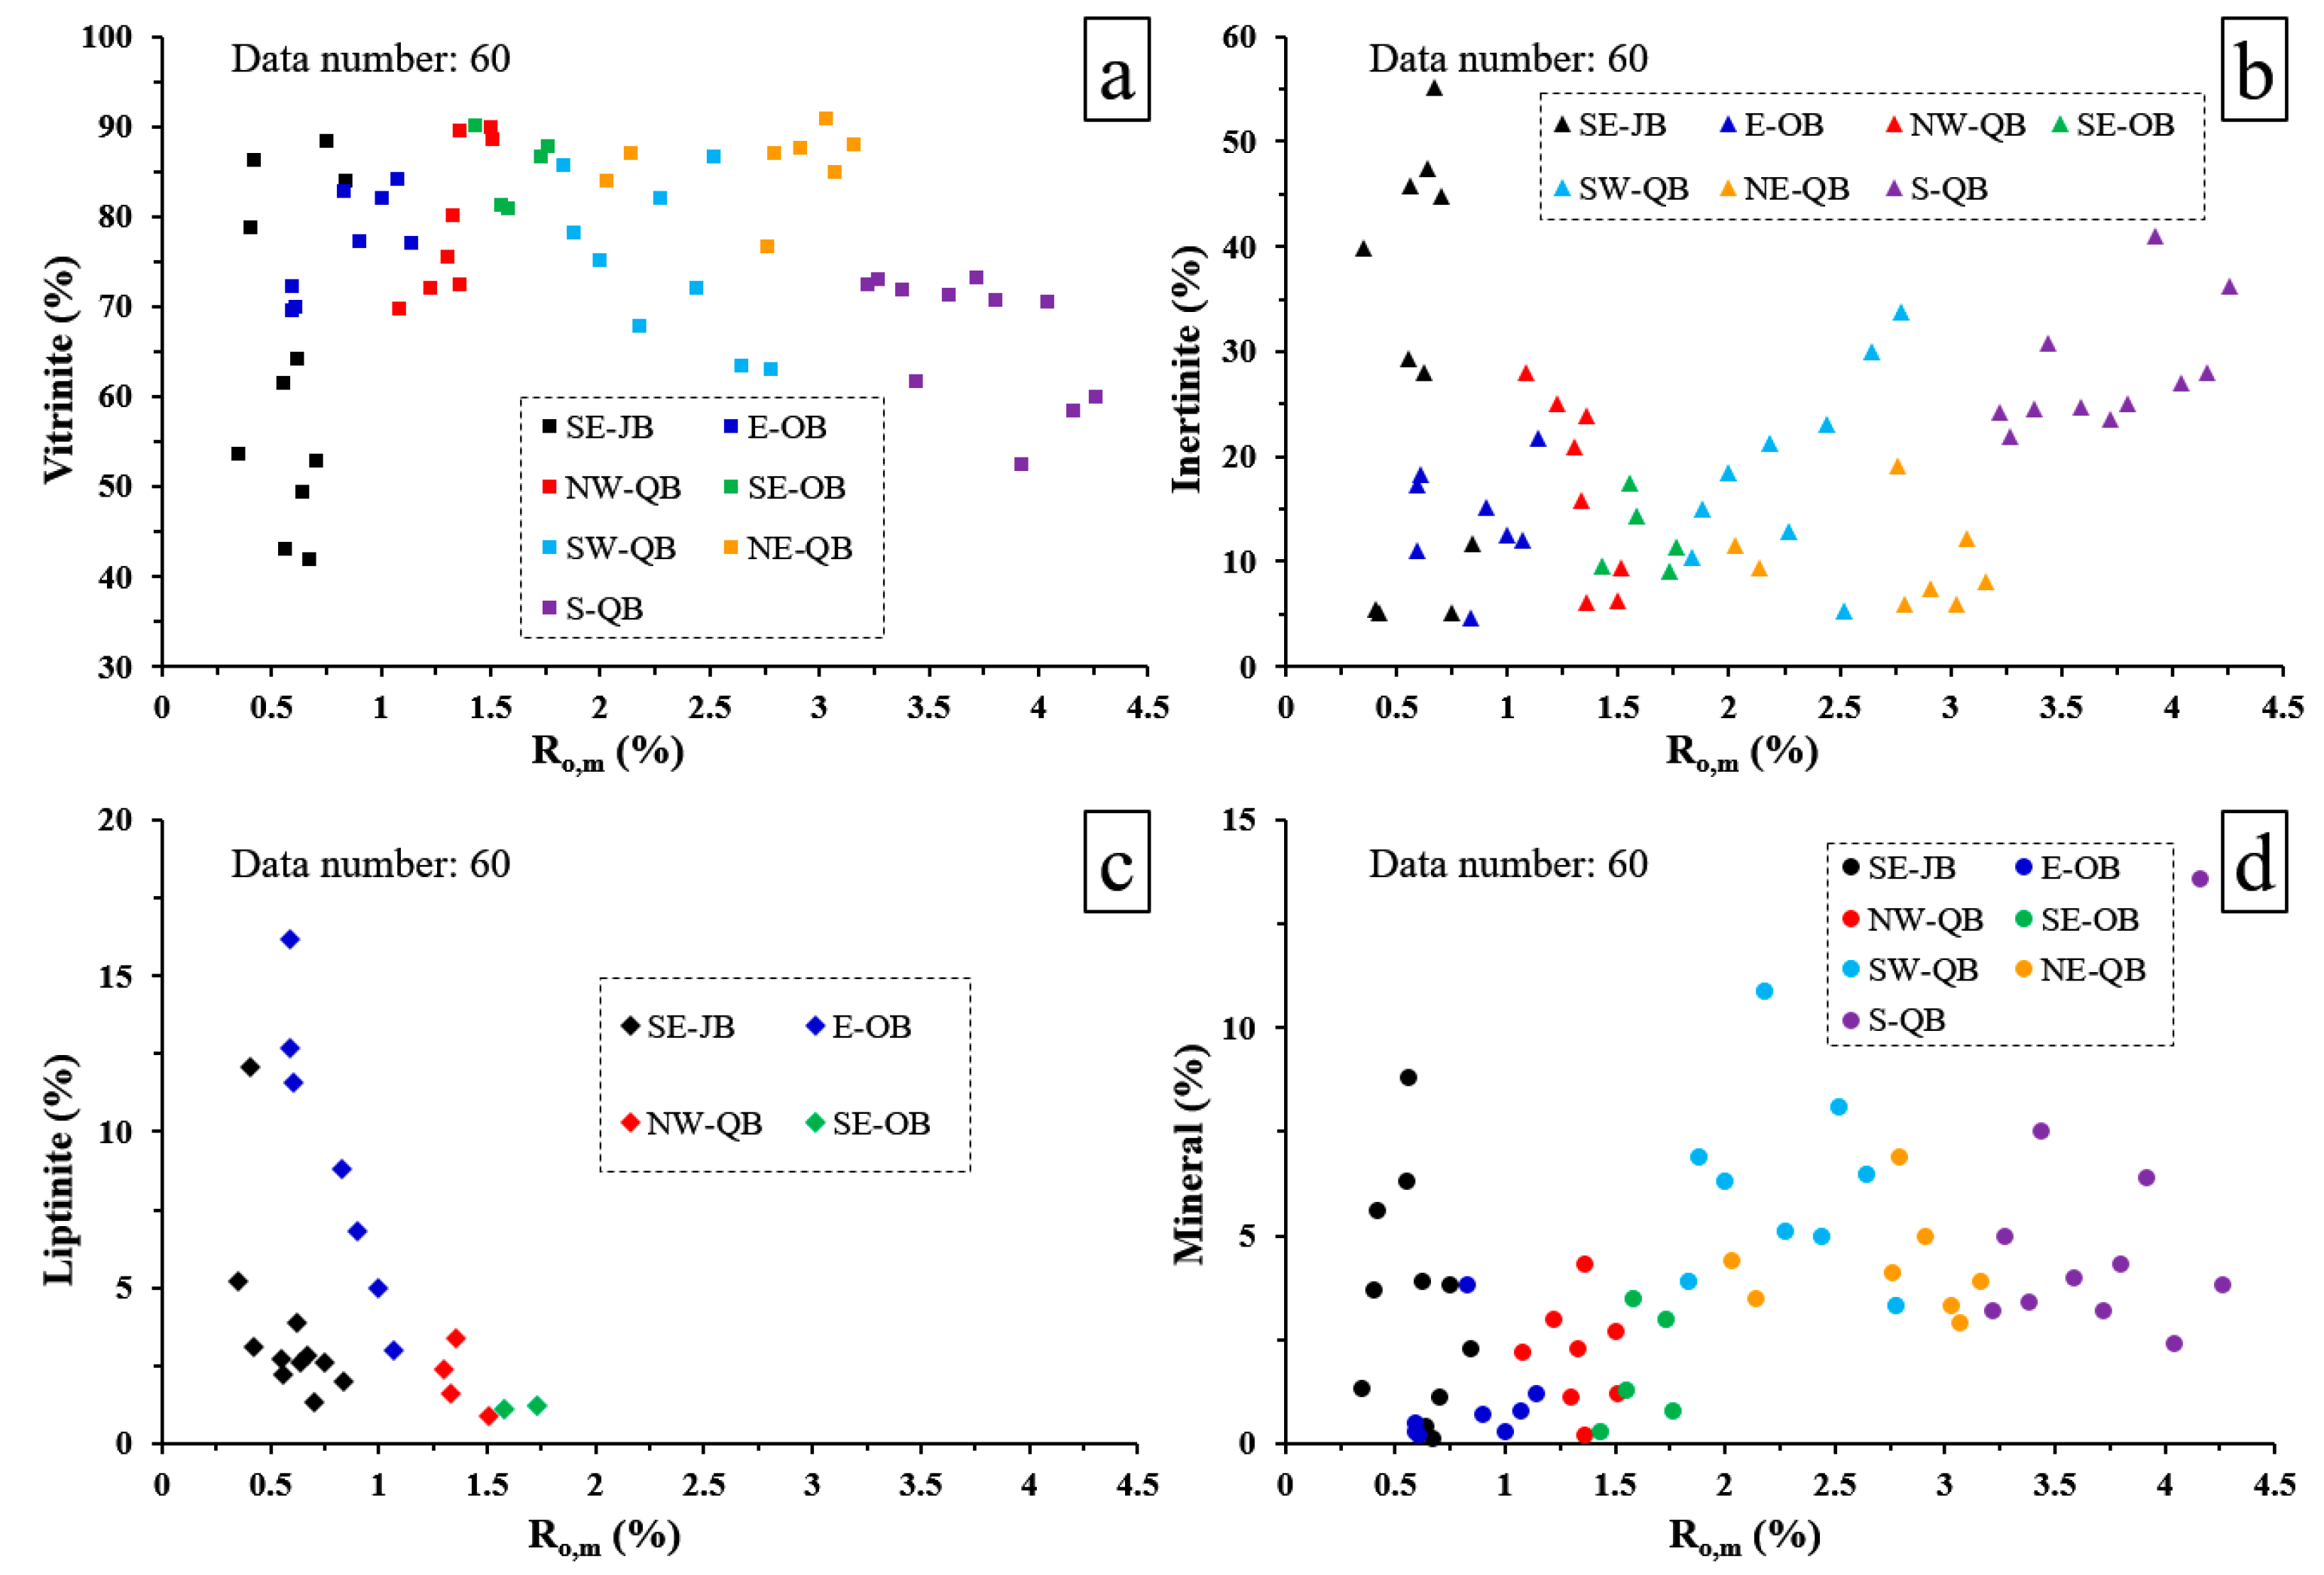
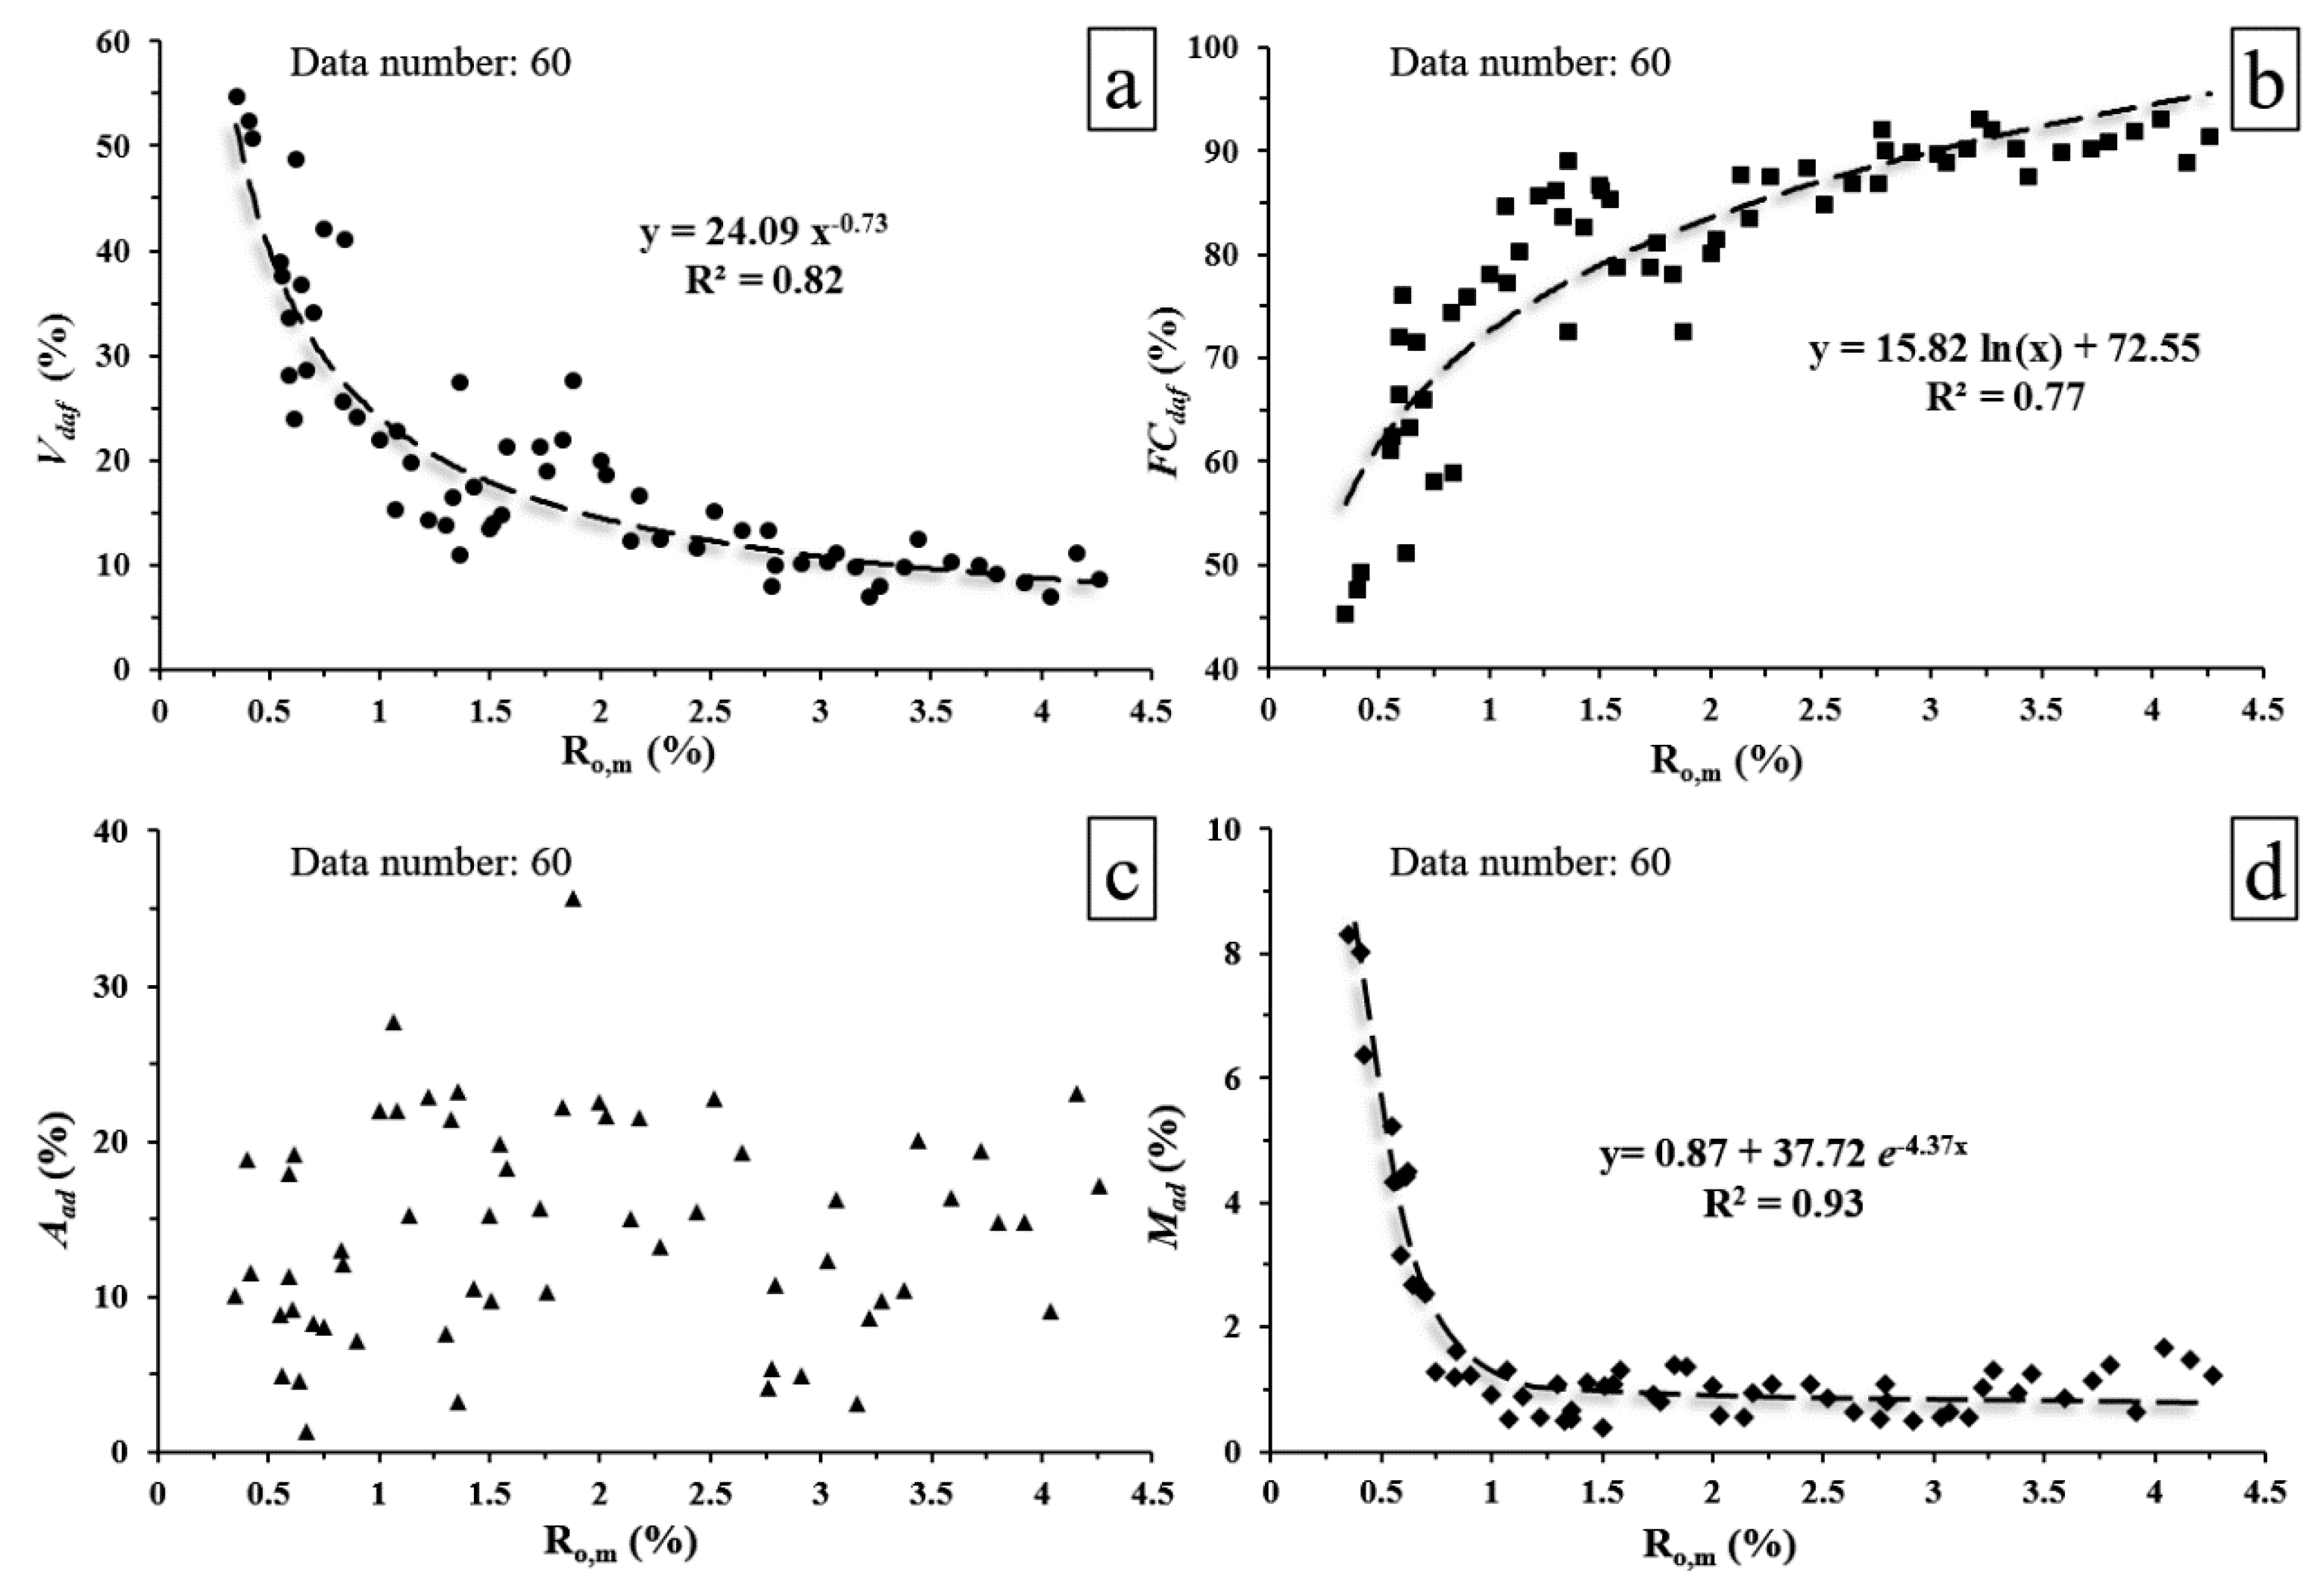
3.1. Coal Compositions

The Ro,m of the coal samples ranges from 0.35% to 4.26%, including all coal types from lignite to anthracite. The samples were divided into low rank coals (LRC-01~LRC-10), middle rank coals (MRC-01~MRC-25) and high rank coals (HRC-01~HRC-25) with boundary values of 0.65%Ro,m and 2.0%Ro,m. The most abundant maceral is vitrinite, which accounts for more than 40% of the organic constituents (Figure 3a), followed by inertinite (Figure 3b). Liptinite decreases with increasing coal rank and disappears at Ro,m of 1.8% (Figure 3c). In fact, liptinite breaks down during coalification and leaves behind materials that greatly resemble either vitrinite or inertinite under reflected light, making it harder to distinguish liptinite against the vitrinite background common at ranks higher than the vitrinite reflectance of about 1.3% Rr [30,31]. However, within some higher rank coals, liptinites can be identified by their morphology [31], for examples, MRCs-12, 13, 15, 18, 20 and 21 in this work. Maceral composition is controlled by peat-forming vegetation type and uncorrelated with coal metamorphism [32]. For example, the vitrinite content in the SE-OB is higher than 80%, that in the NE-QB is higher than 70%, and that in the S-QB is lower than 75%. Minerals generally occupied less than 10%, reaching a minimum at Ro,m of 0.5% to 1.5% (Figure 3d).
Volatile matter content (Vdaf) can also reflect the degree of coal metamorphism, which refers to gas decomposed and escaped from the coal matrix in coal at high temperatures. This composition exhibited a good exponential correlation with coal rank (Ro,m) (Figure 4a). Due to aliphatic polyester splitting and aromatization proceeding during coalification, fixed carbon (FCdaf), the carbon content in the coal, exhibited a high logarithmic correlation with Ro,m (Figure 4b). Ash content is the residue after all combustible materials are incinerated and represents shale and mineral impurities [33], thus the Aad can reflect mineral filling during coalification. In this work, both mineral content and ash yield are not well related to coal rank (Ro,m) (Figure 3d and Figure 4c) and only show a slight increase from 1.5%Ro,m to 2.5%Ro,m, which may indicate that in this stage, partial macropore space can be filled with clays and minerals. Mad is the amount of inherent moisture in coal [34].
Both compaction in diagenesis and coal dehydration during coalification will decrease the moisture content in coal. Besides, the interaction energy between lignite, bituminous, anthracite and water molecules are on order of the combined effect of two strong hydrogen bonds > one hydrogen bond > van der Waals force [34]. Obviously, Mad in low rank coals is much more than that in medium-high rank coals, when Ro,m is greater than 1%, the value stabilizes at around 1% (Figure 4d).

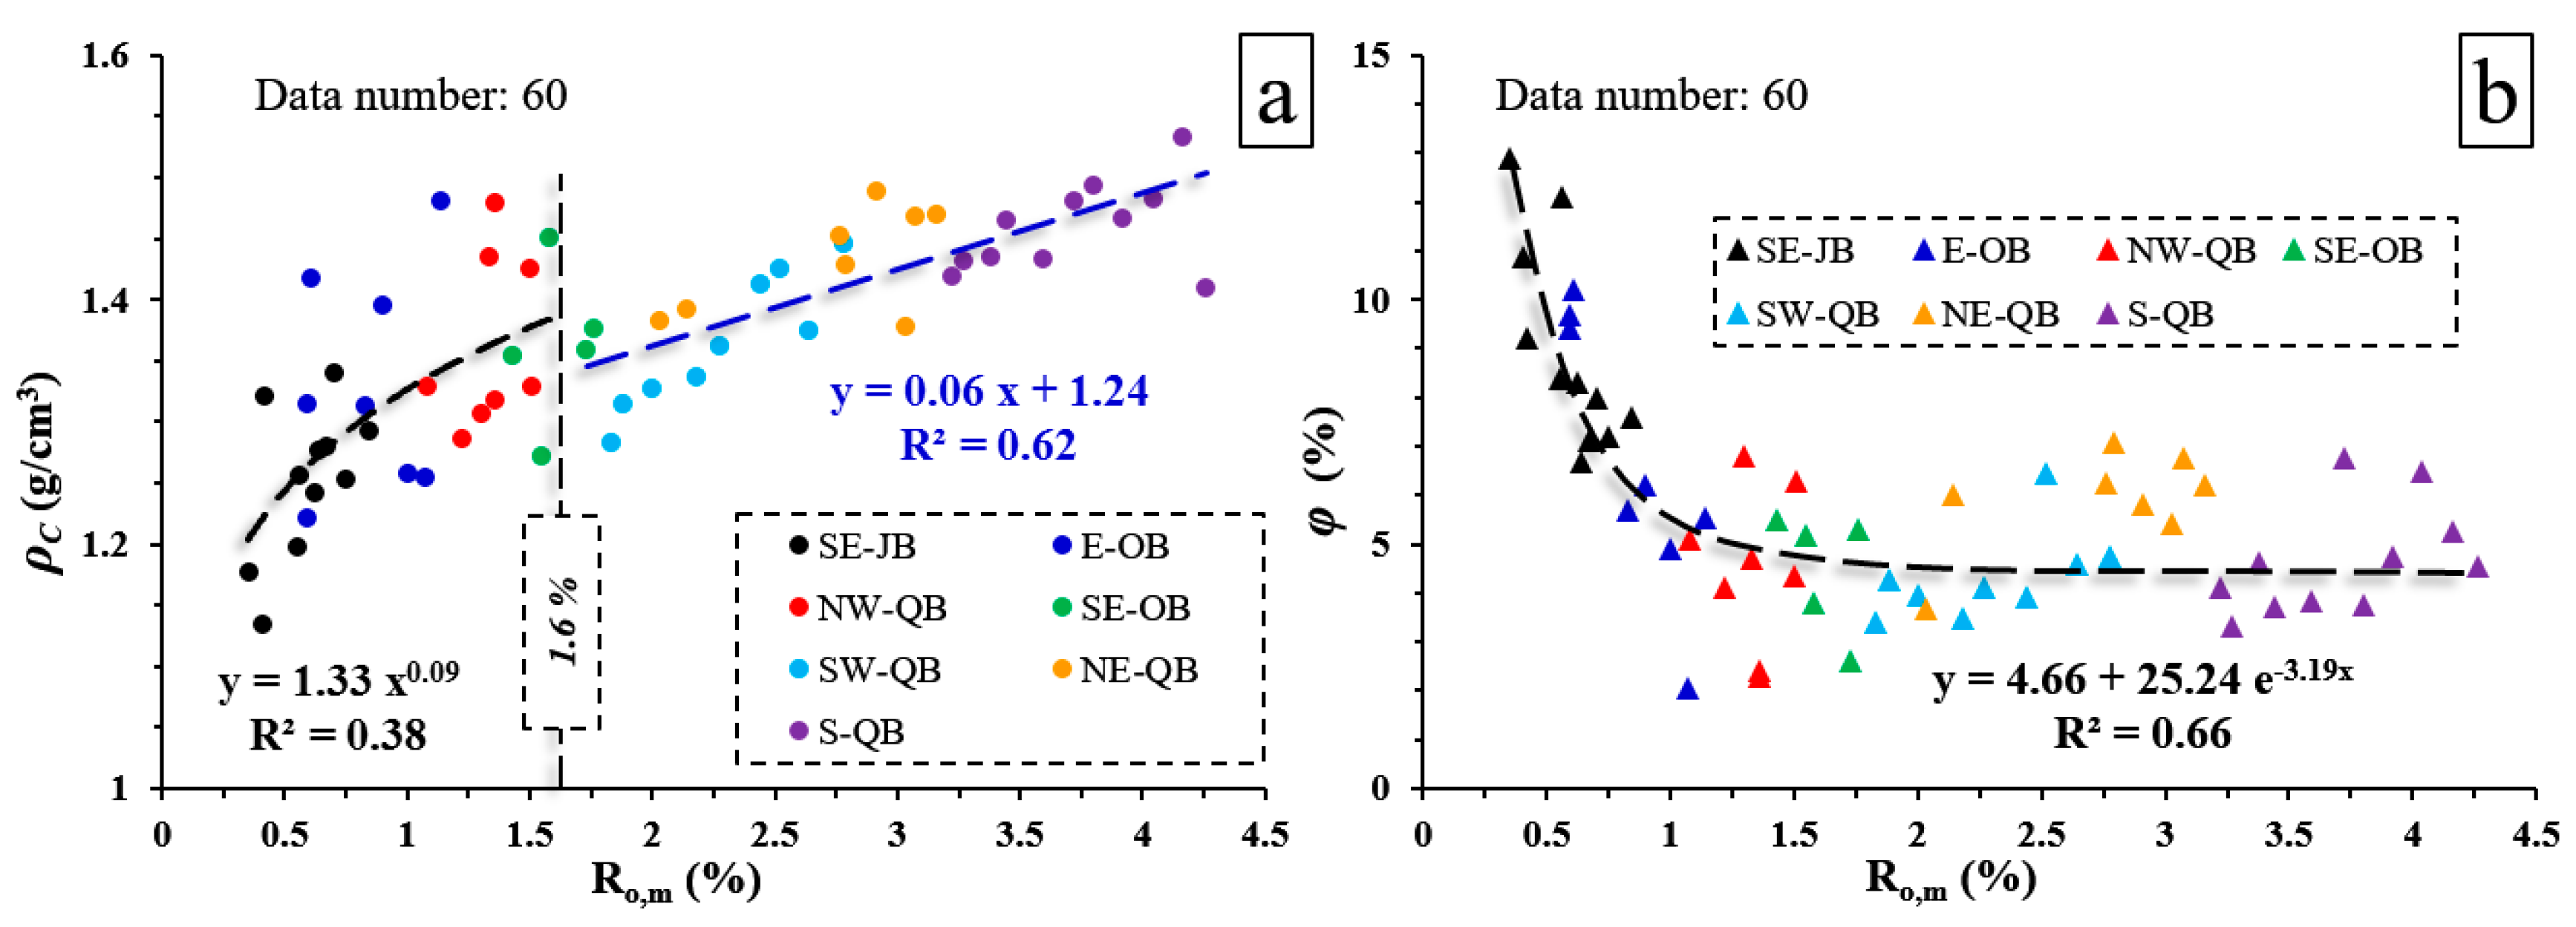
3.2. Coal Physical Properties

Me represents the external moisture that occurs predominantly in the adsorption state, showing a higher value in low rank coals and stabilized with Ro,m beyond 1% as inherent moisture does (Figure 5a). Total moisture (Mt), the sum of Mad and Me, reflects the maximum holding capacity of moisture in coal under a certain relative humidity and temperature. Mad, Me and Mt of lignites reach amounts of up to 8%, 22% and 30%, respectively (Figure 4d and Figure 5). At a low metamorphic stage, a large number of hydrophilic polar groups are generated in the coal’s macromolecular structure [35], causing a high moisture content. In the medium-high metamorphic stage, Mad and Me are low. The specific surface increases during coalification, but condensed aromatic ring structures in middle-high rank coals contain more hydrogen and are hydrophobic, thus the moisture content is obviously low [34,35]. Therefore, under a same geological environment, the moisture holding capacity of coal is dominated by coal metamorphism.
Coal density can be subdivided into true density, apparent density and coal matrix density, and the latter can be calculated by removing the influence of minerals and moisture as shown below:
ρ C = ( 1 M a d A a d ) / ( 1 / ρ T M a d / ρ W V a d / ρ M )
where: ρC, ρT, ρW and ρM represent coal matrix density, true density, moisture density and mineral density respectively, moisture density is 1 g/cm3, mineral density is approximately 3 g/cm3; Moisture content and mineral content can be quantitated by Mad and Vad (volatile content in air dry state) respectively.
Coal matrix density (ρC, g/cm3) fluctuates greatly within low-medium rank samples, showing a weak exponential relationship (R2 = 0.38) with Ro,m. For low-medium rank coals, structural evolution characterization is closely related to the 1st and 2nd coalification jumps, and the combination of aliphatic cyclization, pyrolysis cracking and aromatization complicates the density change trend [35,36]. During late coalification and graphitization, through Raman spectroscopy, Su et al. [36] indicated that graphite microcrystallite in coal goes through the evolution process from small and disordered to big and ordered. Therefore, the density shows a high linear relationship (R2 = 0.62) with coal rank beyond 1.6% Ro,m (Figure 6a). Density is a property of matter and can be influenced by many factors. For examples, the density of vitrain and clarain is lower than that of durain and fusain [37], mylonitized coal becomes denser with pulverized coal filling in fissures during tectonic movements. Both internal and external issues will lead to density changes.
Porosity is strong negatively correlated with coal rank when Ro,m is less than 1% and stabilizes later (Figure 6b), the same trend can be found in moisture content variation. According to the genetic classification, the pores of coal can be divided into primary pores (plant tissue pores and intergranular pores), organic pores (molecular structure pores and gas pores), exogenous pores and mineral pores [38]. Primary pores are produced in the coal-forming period and preserved more in low-rank coal. At early stage of coal metamorphism, coal experiences the bitumination in the first coalification jump, physical compaction increases due to basin subsidence [29]. Therefore, primary pores are deformed, reduced or even disappear, resulting in a rapid decrease of the porosity. When Ro,m is greater than 1.0%, hydrocarbon generation produces a large number of gas pores, while compaction and clay filling lead to a reduction of meso- and macropores. Therefore, in thermal metamorphism, the proportion of pores in each pore diameter fluctuates but tends to be stable as a whole. Exogenous pores and mineral pores are mainly affected by geological structure and have little relation with coal metamorphism, which is the key issue in the research of tectonically deformed coal.

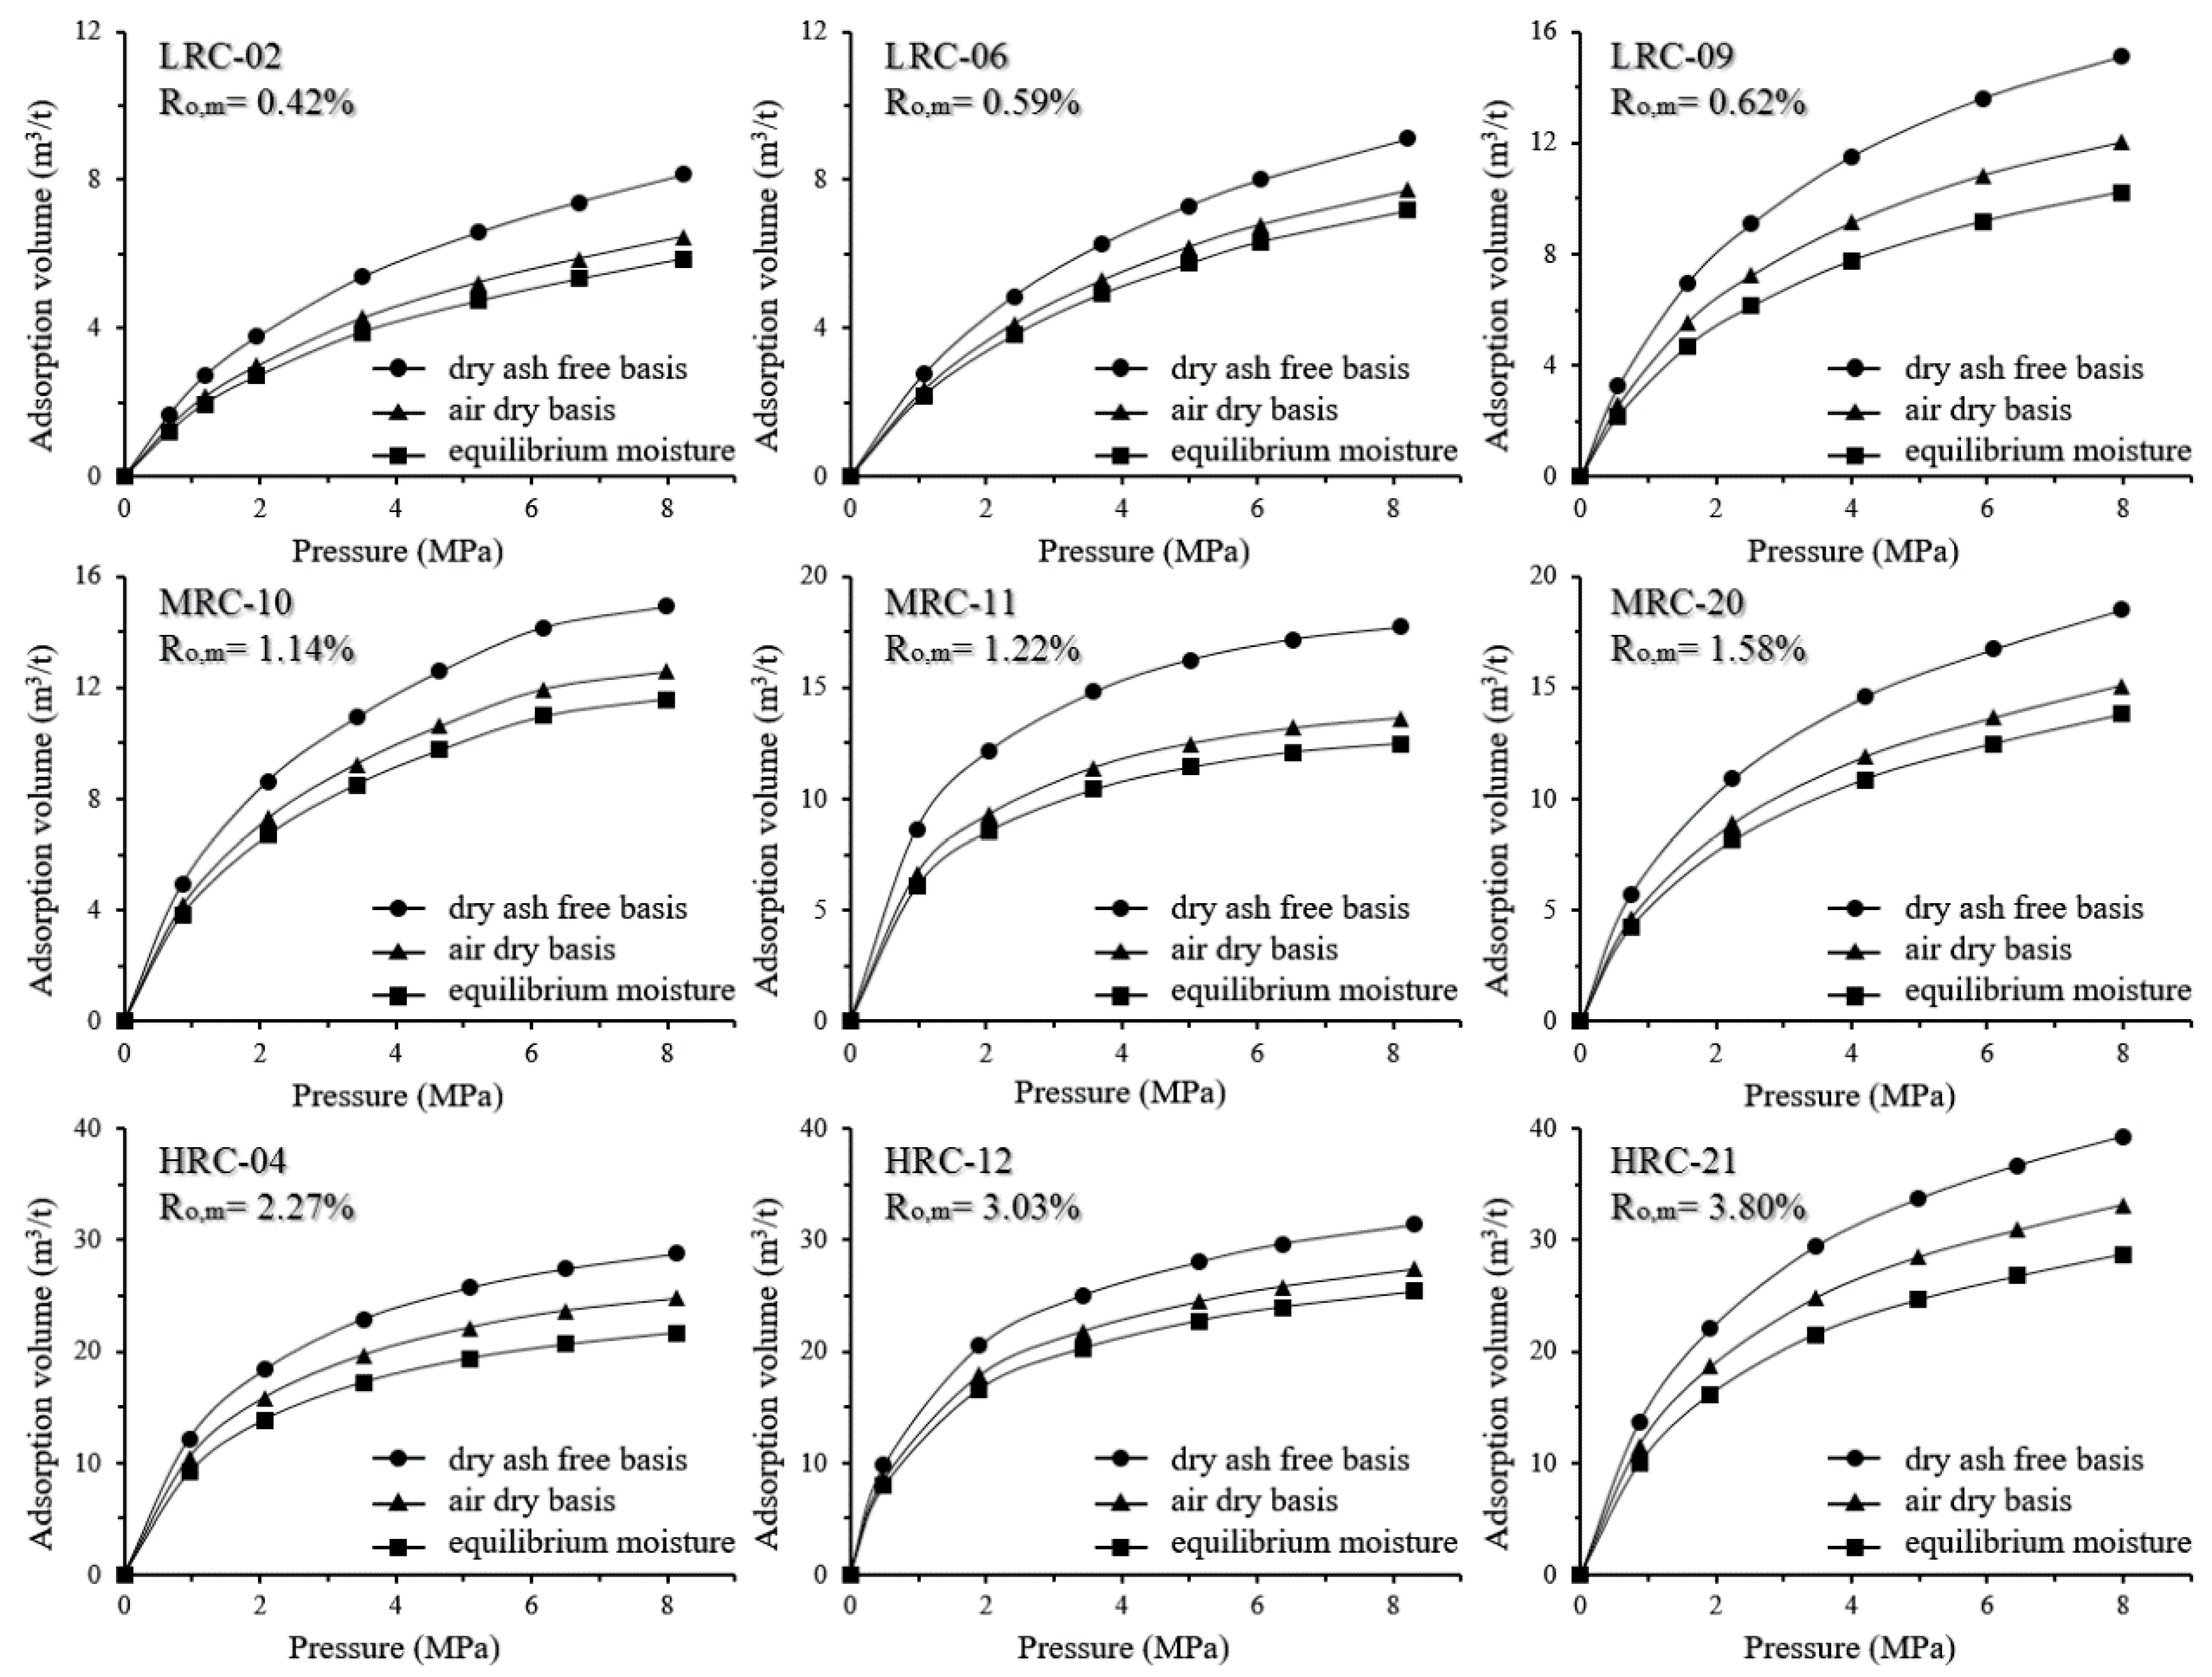
3.3. CH4 Isothermal Adsorption Capacity

The VL is largest for the dry ash basis, followed by the air dry basis and equilibrium moisture condition for each coal sample, demonstrating that both moisture and mineral filling can reduce the methane adsorption capacity (Figure 7). It can be seen from the Langmuir isothermal adsorption line that the greater the radian of curve is, the higher the Langmuir pressure is, and the easier desorption occurs. Meng et al. [39] divides CBM desorption into three sections, quantifying the proportion of CBM desorption in different pressure drop intervals. Figure 7 shows there is no obvious difference in desorption amount of low-rank coal in any pressure drop interval, while the main desorption interval of high-rank coal is the low-pressure interval.

4. Discussion

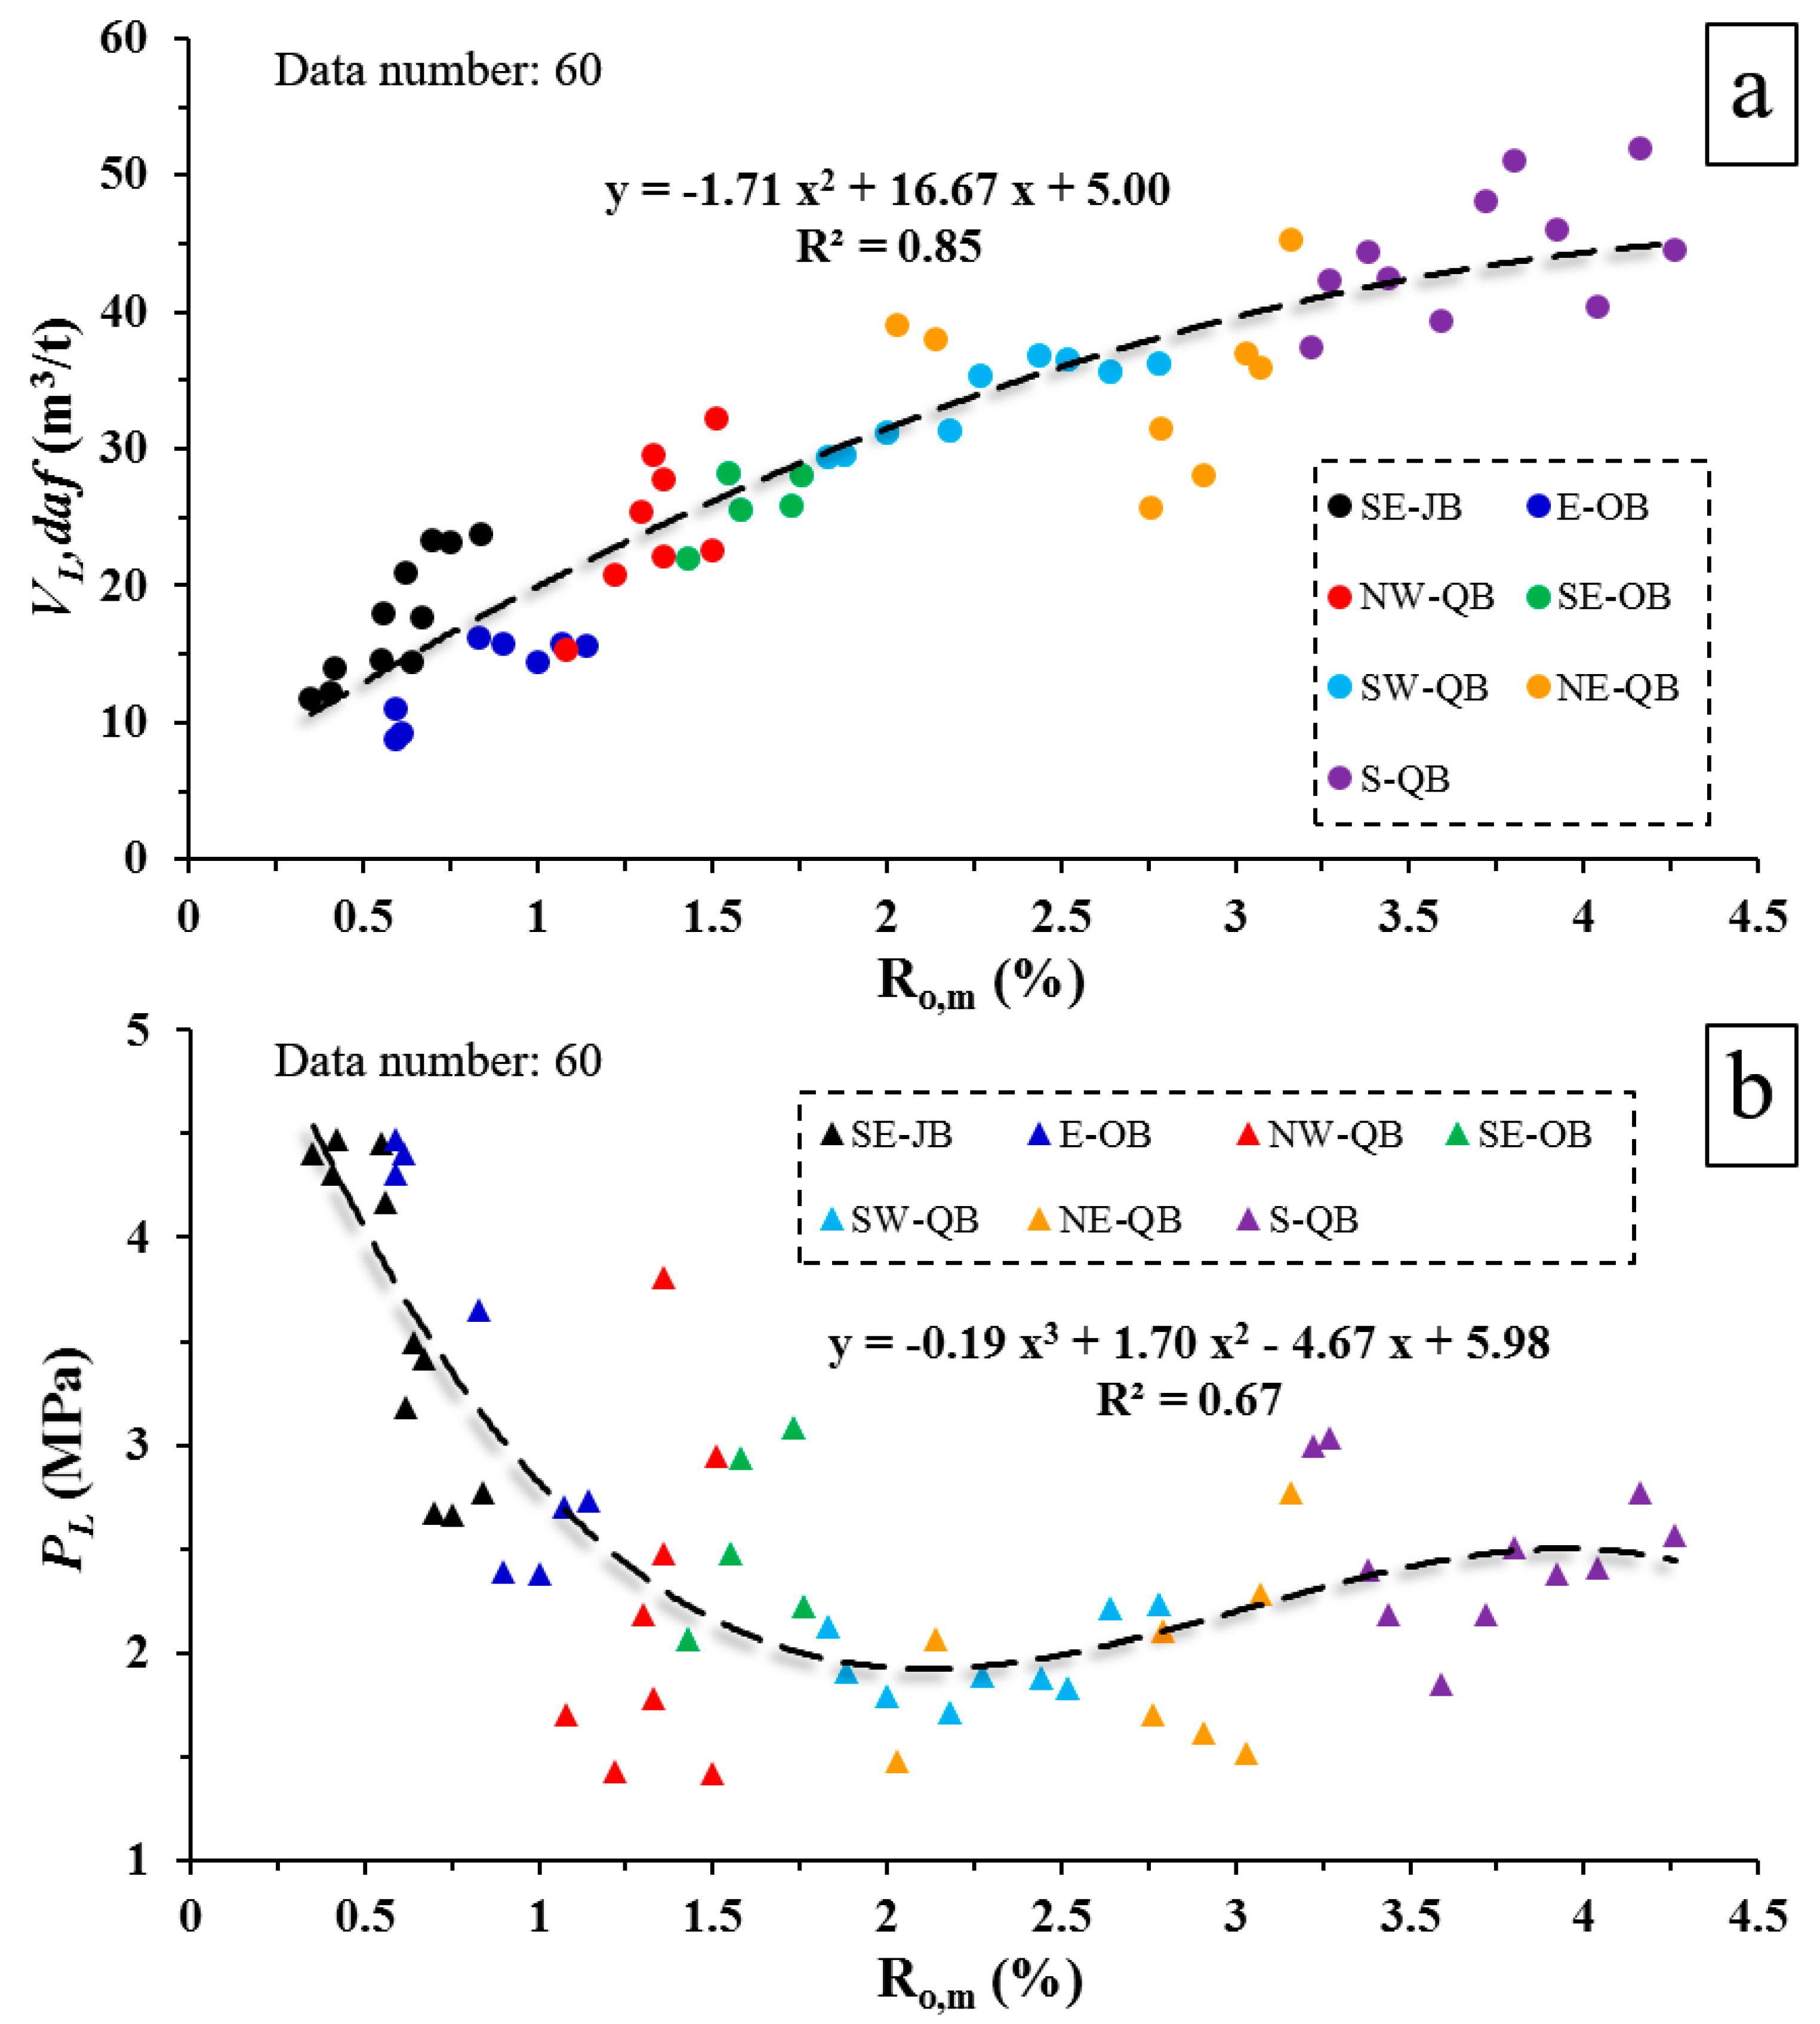
4.1. Correlation between Coal Rank (Ro,m) and Langmuir Constants (VL and PL)

Due to different contents of moisture and ash in coal samples, VL in dry ash-free basis is regarded as the net coal adsorption capacity. In this work, with increasing coal rank, the minimum and maximum appear on LRC-07 (11.7 m3/t, Ro,m = 0.59%) and HRC-24 (52.4 m3/t, Ro,m = 4.16%) respectively. The increase of adsorption capacity gradually slows down (Figure 8a), which has been proven before [19,20]. After coalification, anthracite gradually changes into coal-based graphite or natural coke graphitization, both of which have weak adsorption capacity. Therefore, assuming that the general adsorption capacity of lignite is 5 m3/t, the results can be speculated by quadratic fitting (Figure 8a) with coefficient (R2) reaching 0.86, and peak Langmuir volume (VL) appears at Ro,m of 4.5–5%, which agrees with a previous study [19]. However, there are still some data with large residual error, for example, abnormal low values exist at Ro,m = 1.0% and Ro,m = 2.8% (Figure 8a). Therefore, the factors that can influence the coal adsorption are various, and the change law of coal adsorption capacity during coalification is complex. PL decrease rapidly before Ro,m = 1.5% (Figure 8b), then increase slowly. CBM desorbed rate is the key factor in productivity improvement, which is determined by the absorption capacity and reservoir pressure. The favorable CBM reservoirs should be characterized with high VL, high PL and low reservoir pressure. Therefore, insufficient depressurisation in deep burial reservoirs cannot improve the CBM desorbtion rate, especially for high rank CBM zones with low PL.

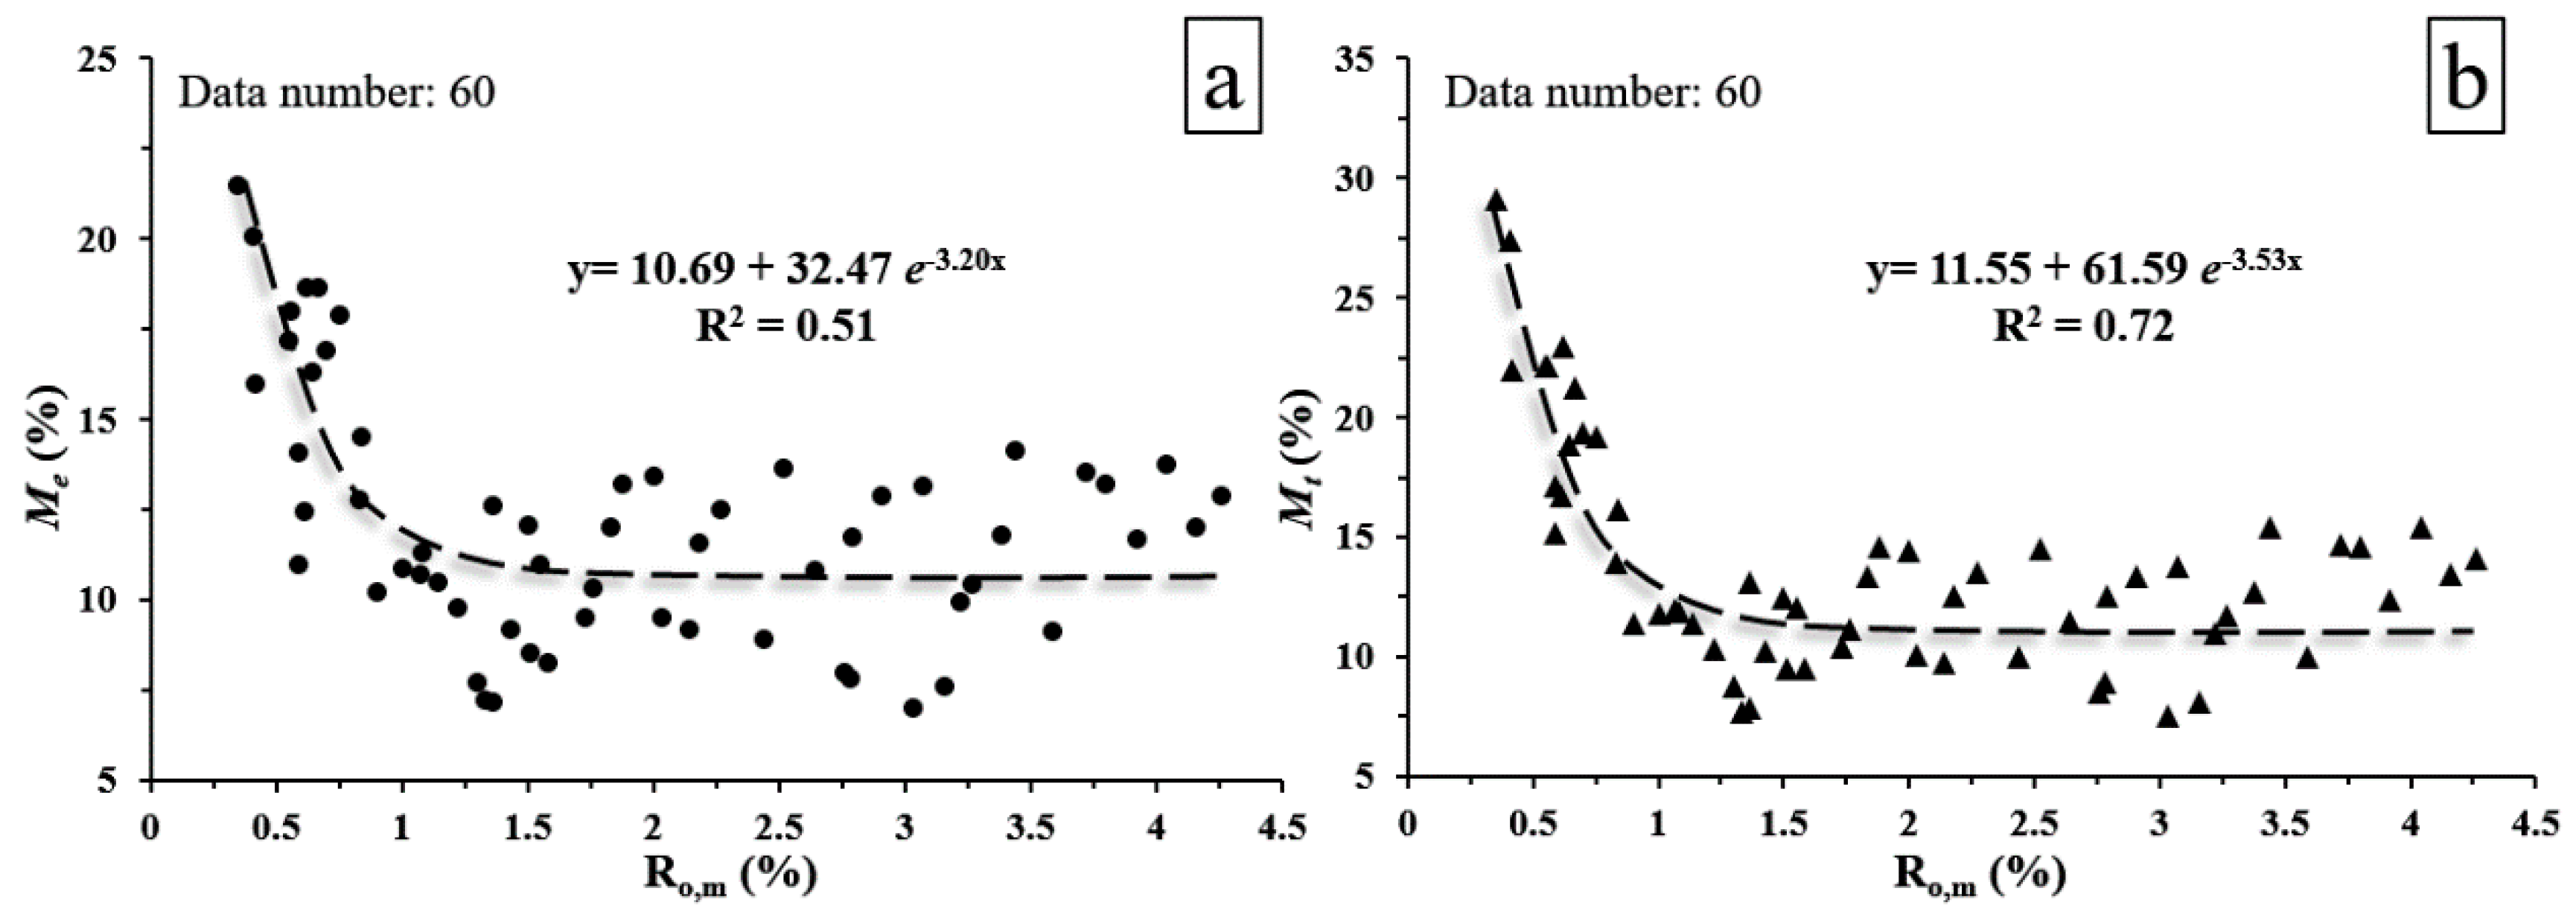
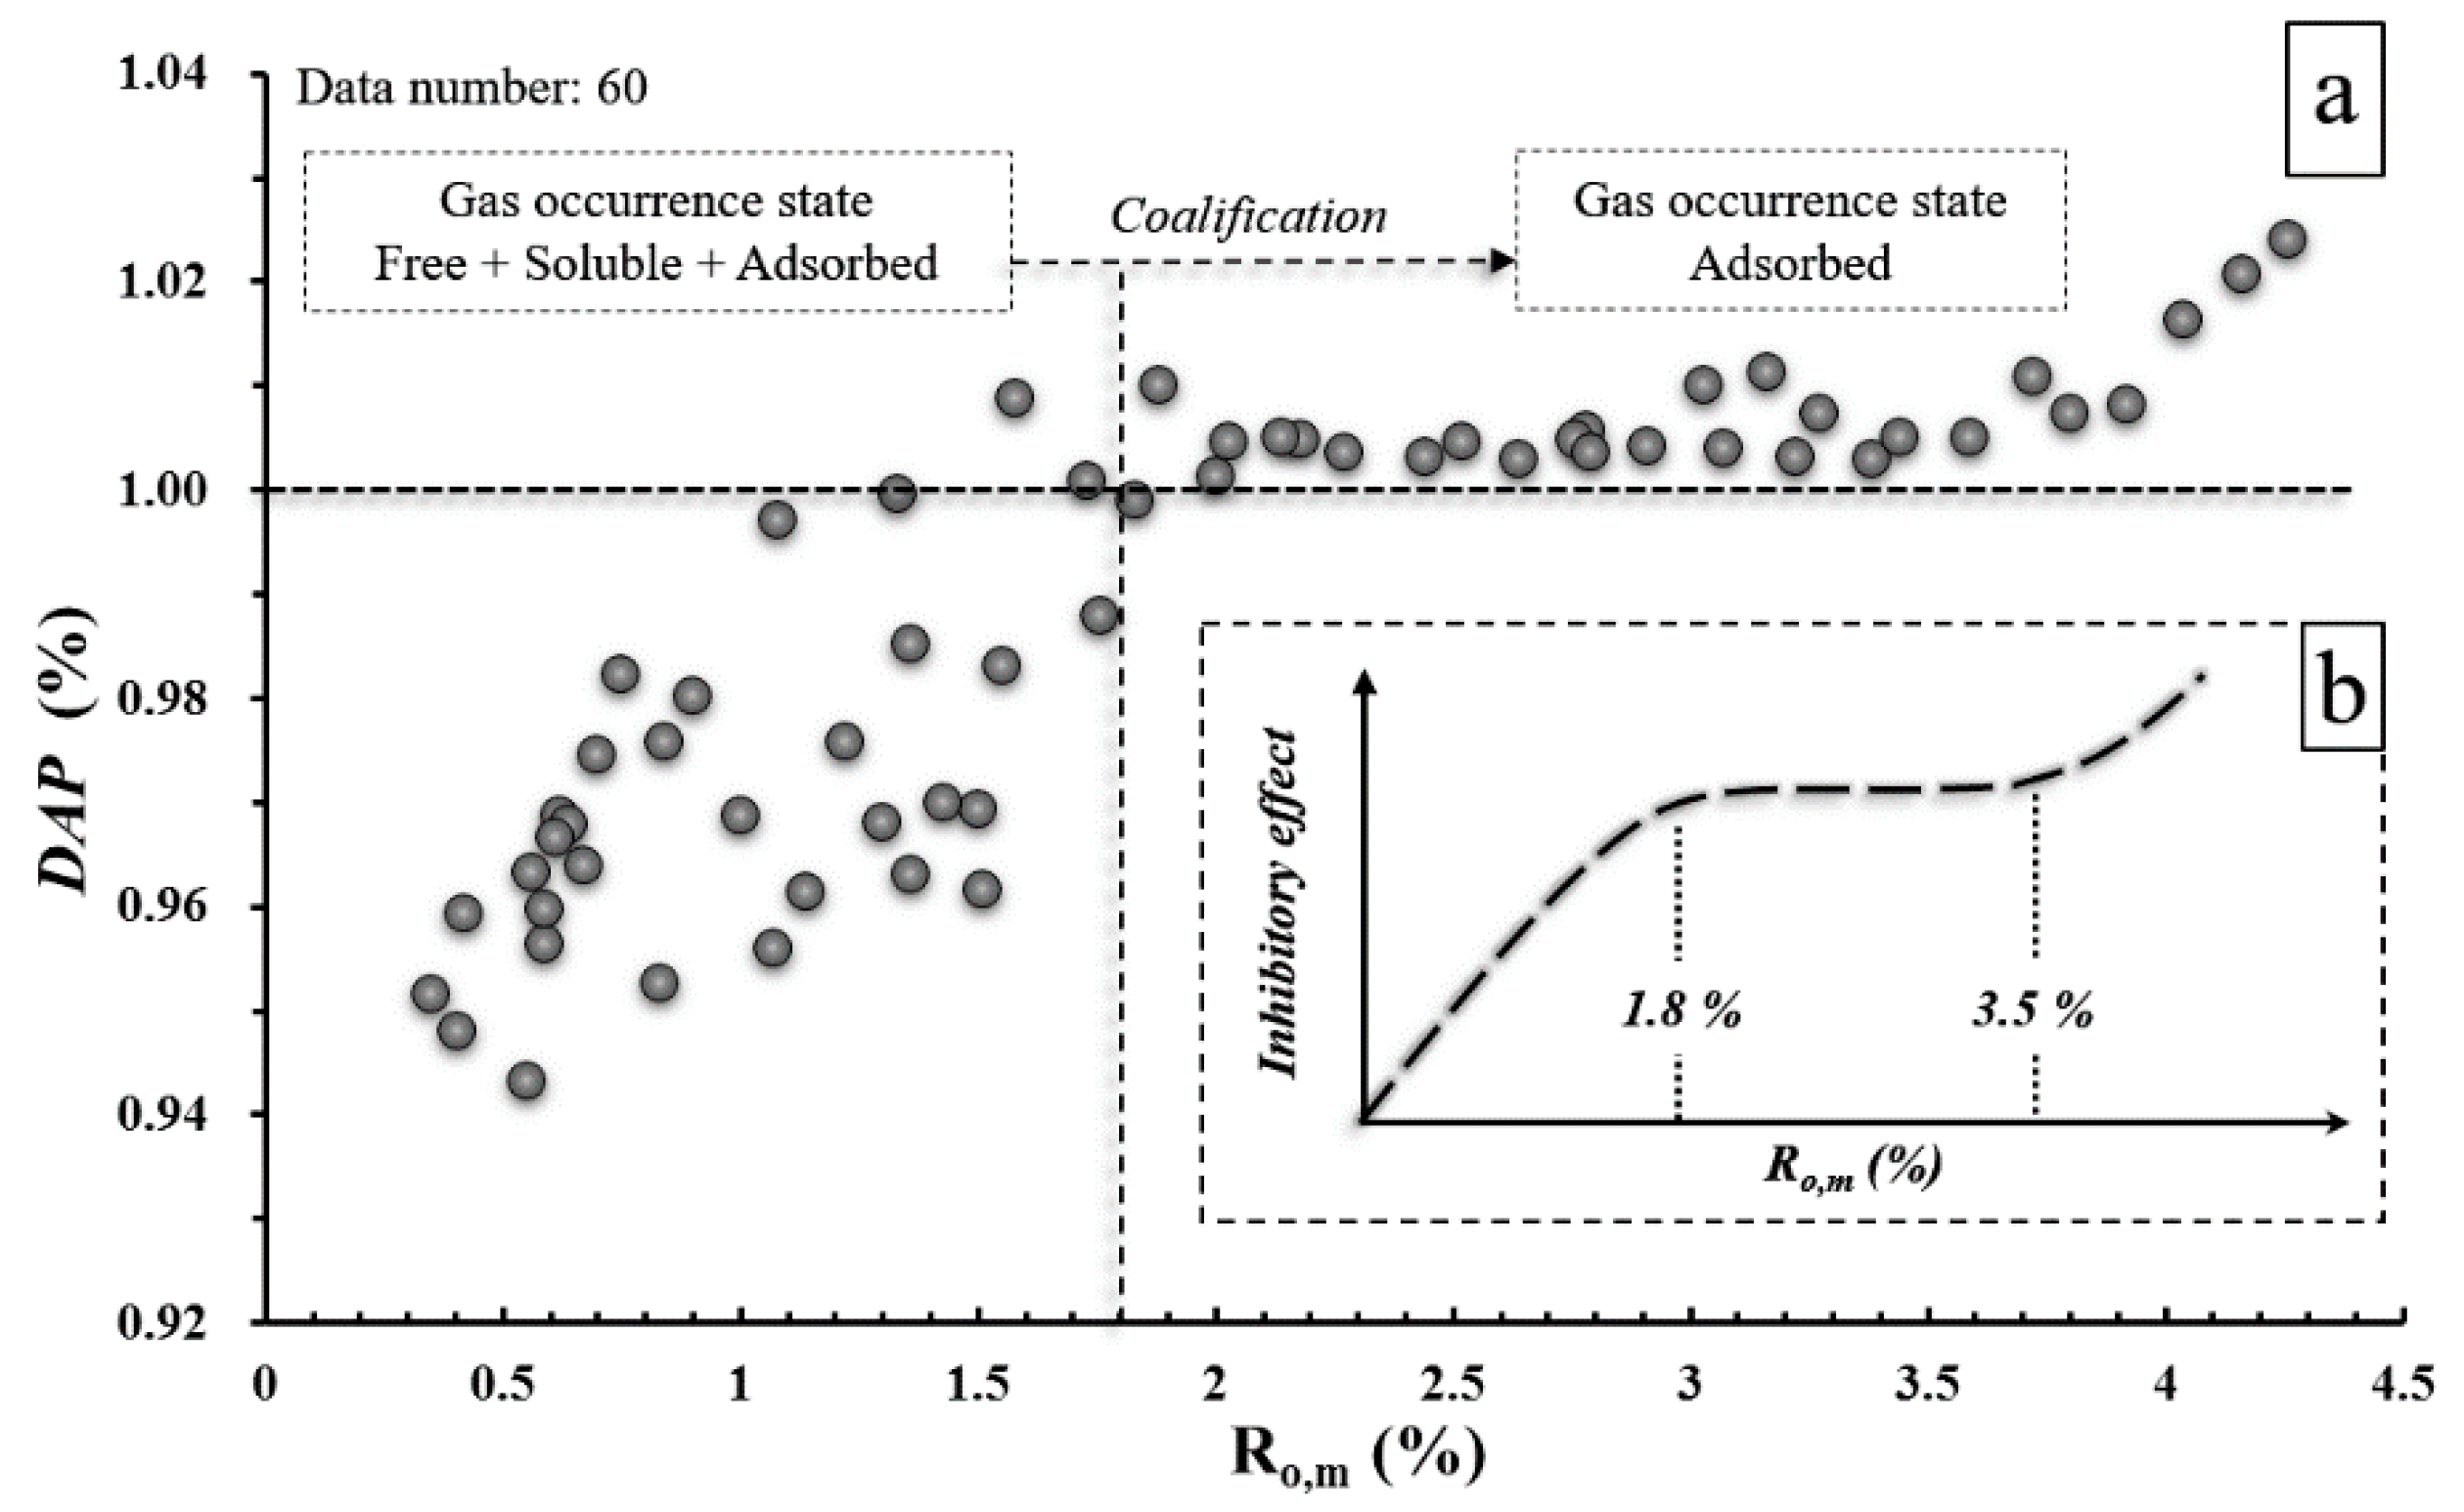
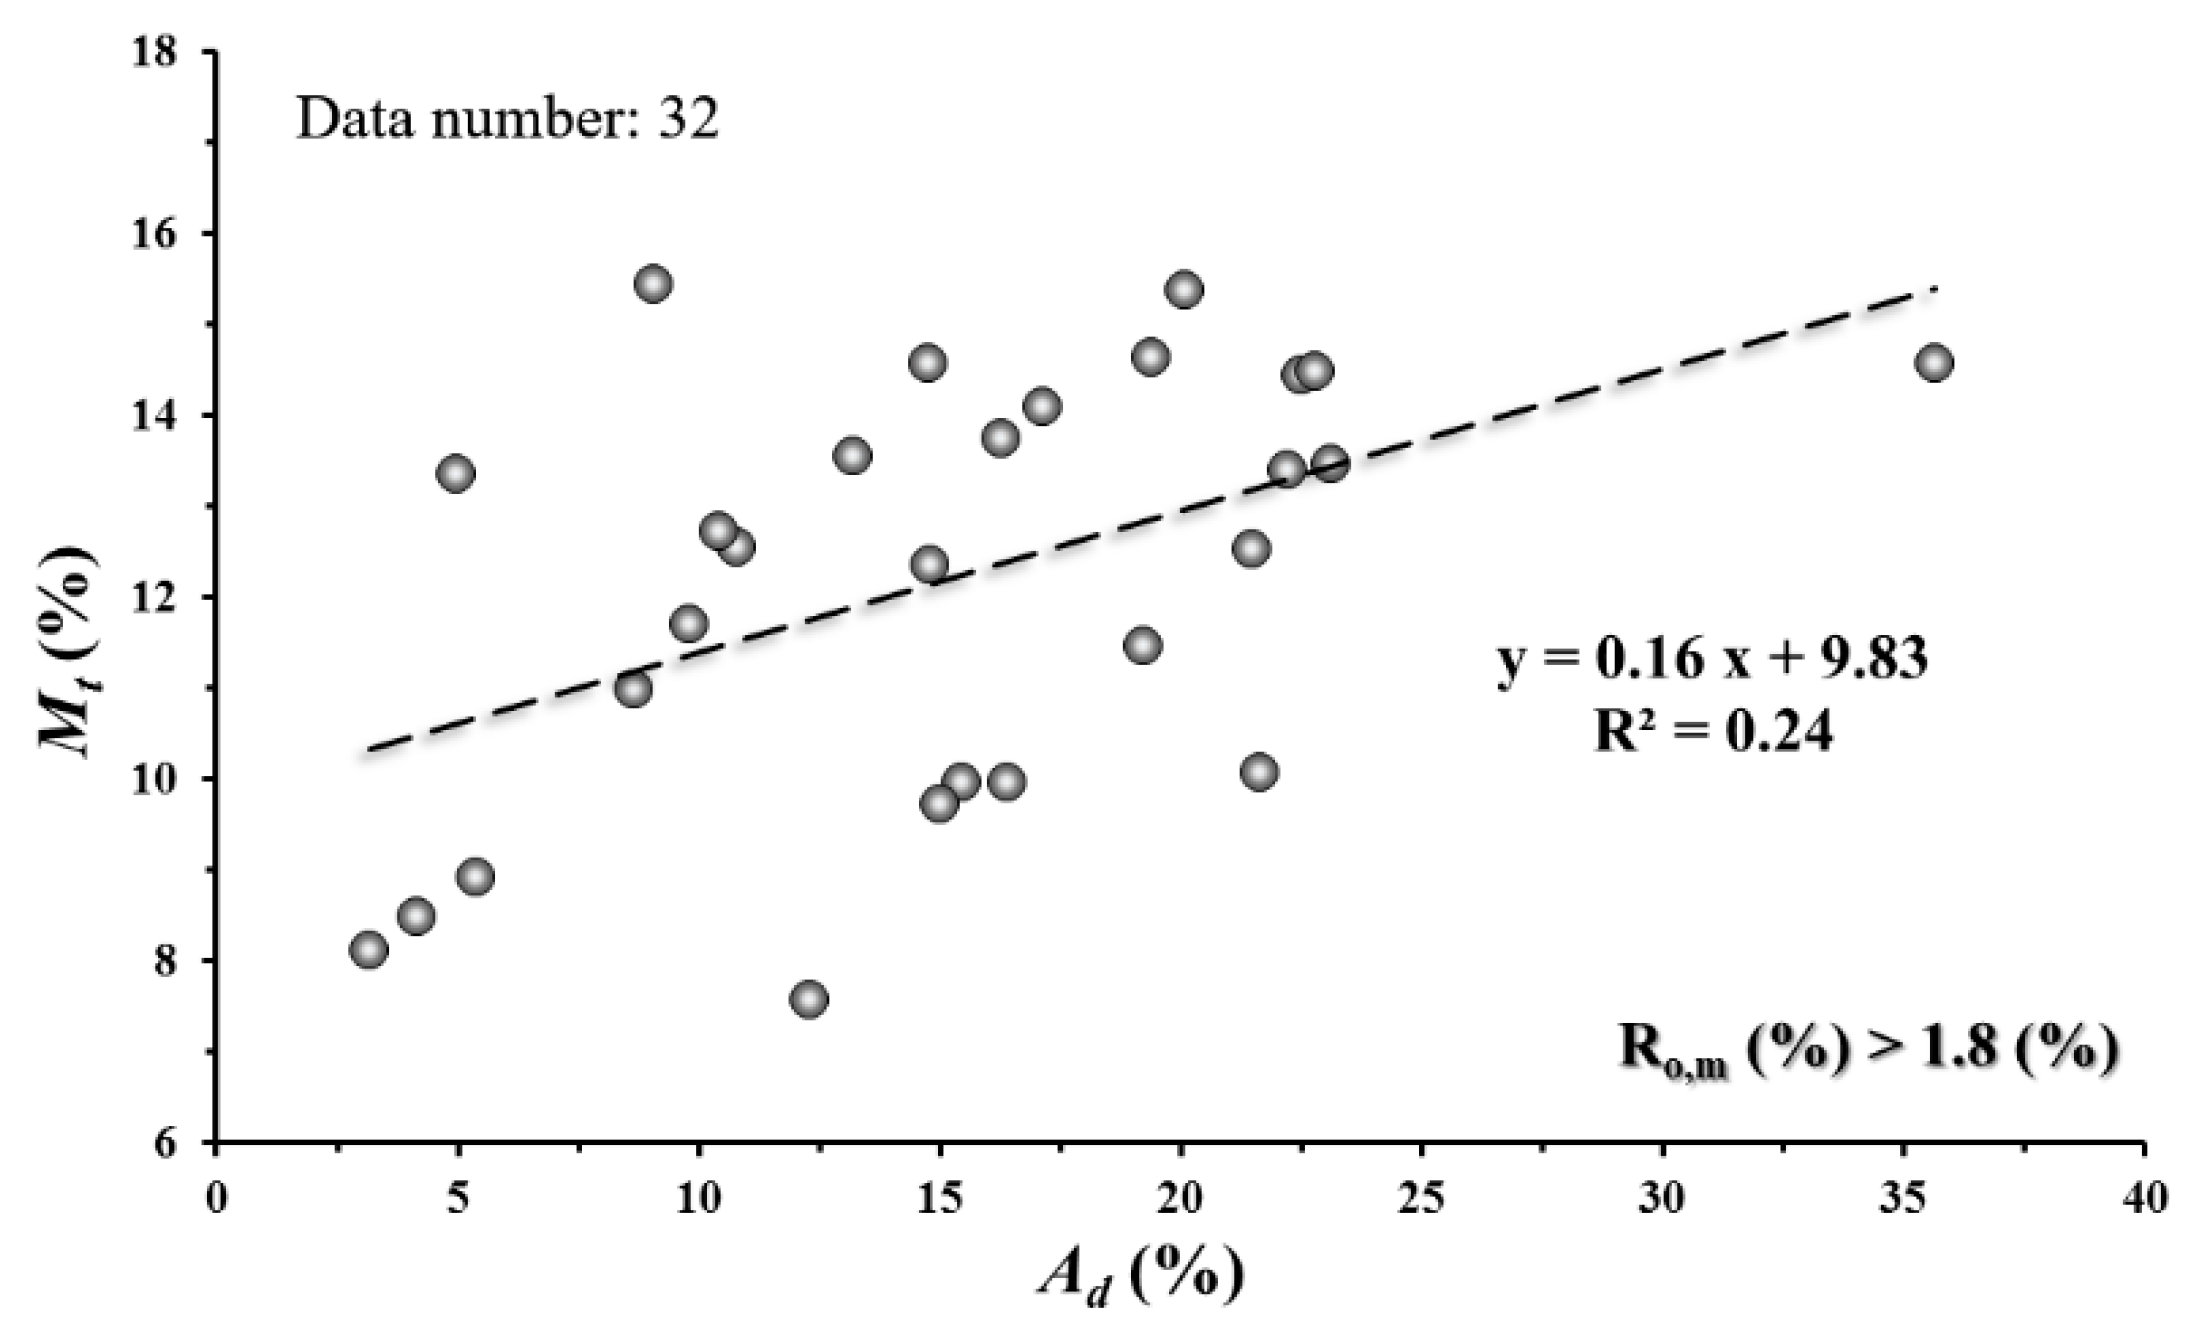
4.2. Quantitative Influence of Moisture on CH4 Adsorption

Copious literature [14,17,31,33] has confirmed that both moisture and mineral have inhibitory effects on the adsorption capacity of coal. Therefore, when calculating VL on a dry ash-free basis, minerals in coal are often regarded as materials without adsorption, and moisture is deemed as adsorbate equal to CH4. However, for coals at different stages of metamorphism, the influence of moisture on the adsorption capacity has not been quantified. The adsorption competition between moisture and methane needs to be clarified. Therefore, the quantitative control effect of moisture on coal adsorption can be obtained by calculating the difference between VL(daf) and VL(me). Therefore, coal adsorption (air dry basis) in the state of equilibrium moisture should be obtained first, which can be calculated by removing the Me portion of VL(ad), and then the decrement of the adsorption percentage of each one percent increase in moisture (DAP) can be calculated by:
D A P = 1 ( V L ( m e ) V L ( a d ) × ( 1 M e ) ) / M e
where VL(me) is the Langmuir volume of equilibrium moisture; VL(ad) is the Langmuir volume of air dry basis; and Me is the equilibrium moisture content.
Figure 9 shows the controlling mechanism of moisture on the adsorption of coal on different metamorphic grade. The value describes that an increase in the moisture content of a coal reduces the CH4 adsorption percentage. Two inflection points can be found at Ro,m = 1.8% and 3.5%. As the Ro,m less than 1.8%, value is less than 1% and increases rapidly. At the range of Ro,m from 1.8% to 3.5%, the value beyond 1 stabilizes at 1% to 1.01%. With the increase of coal rank of Ro,m over 3.5%, the value increases.
Therefore, it can be concluded that the increase of moisture content in coal will lead to the decrease of methane adsorption capacity, and moisture has an inhibitory effect on the coal adsorption capacity. However, the effect varies regularly in different stages. Before coal evolves to semi-anthracite (Ro,m = 1.8%), the increment of moisture is greater than the decrease of methane. First, in this stage, moisture mainly exists in adsorbed and free form, and free moisture does not compete with methane in adsorption. Especially in the low rank coal stage, large porosity and strong hydrophilicity of coal matrix result in that moisture not only exists in adsorption state [17,40], related research has found that free and water-soluble gas resources in low rank CBM reservoirs are considerable [41,42]. Second, in the process of coalification, the side chains of coal macromolecules are divided, macromolecular arrangement regularity increases, and the matrix polarity changes from hydrophobic to hydrophilic [17,34]. At the same time, the increase of formation pressure leads to the decrease of porosity and free moisture [29]. Therefore, with deepening metamorphism, the inhibitory effect of the moisture increment on the adsorption capacity of methane will become stronger. As Ro,m reaches 1.8% (semi-anthracite), methane adsorption decreases more than one percent for every one percent increase in moisture content, but the decrease is small. As can be seen from Figure 5 and Figure 6b, the values of porosity and total moisture decrease to minimum at Ro,m from 1.5% to 2.0% and then increases, indicating that the amount of pore collapse caused by compaction is lower than the thermogenic pore increment in metamorphism. Moisture mainly exists in the adsorbed state, and with the decrease of macromolecular layer spacing, the free moisture content is extremely reduced. At the same time, the coalification will lead to the further increase of the polycyclic aromatic hydrocarbons in coal, thus the presence of moisture will hinder the methane adsorption. When the coal rank is beyond 3.5%, further aromatization leads to the decline of porosity and equilibrium moisture quantity, and free fluid almost does not exist. In this stage, the adsorption capacity is mainly controlled by the molecular polarity and specific surface area. Therefore, with the increase of coal rank, the stronger hydrophobic property of the coal matrix leads to an increasing inhibition of moisture on methane adsorption.
Clay minerals are hydrophilic substances and have features of water swelling and softening. Anthracites are hydrophobic, and coal-based graphite has extremely low adsorption. Therefore, for anthracite samples (MRCs 23–25 are collected from anthracite zones), total moisture is positively correlated to ash content (Figure 10). At the late metamorphic stage (Ro,m > 1.8%), clay minerals are more moisture-absorbent than coal, which not only leads to further hindering the adsorption of gas content, but their the swelling effect can also plug the pore structure and throat.

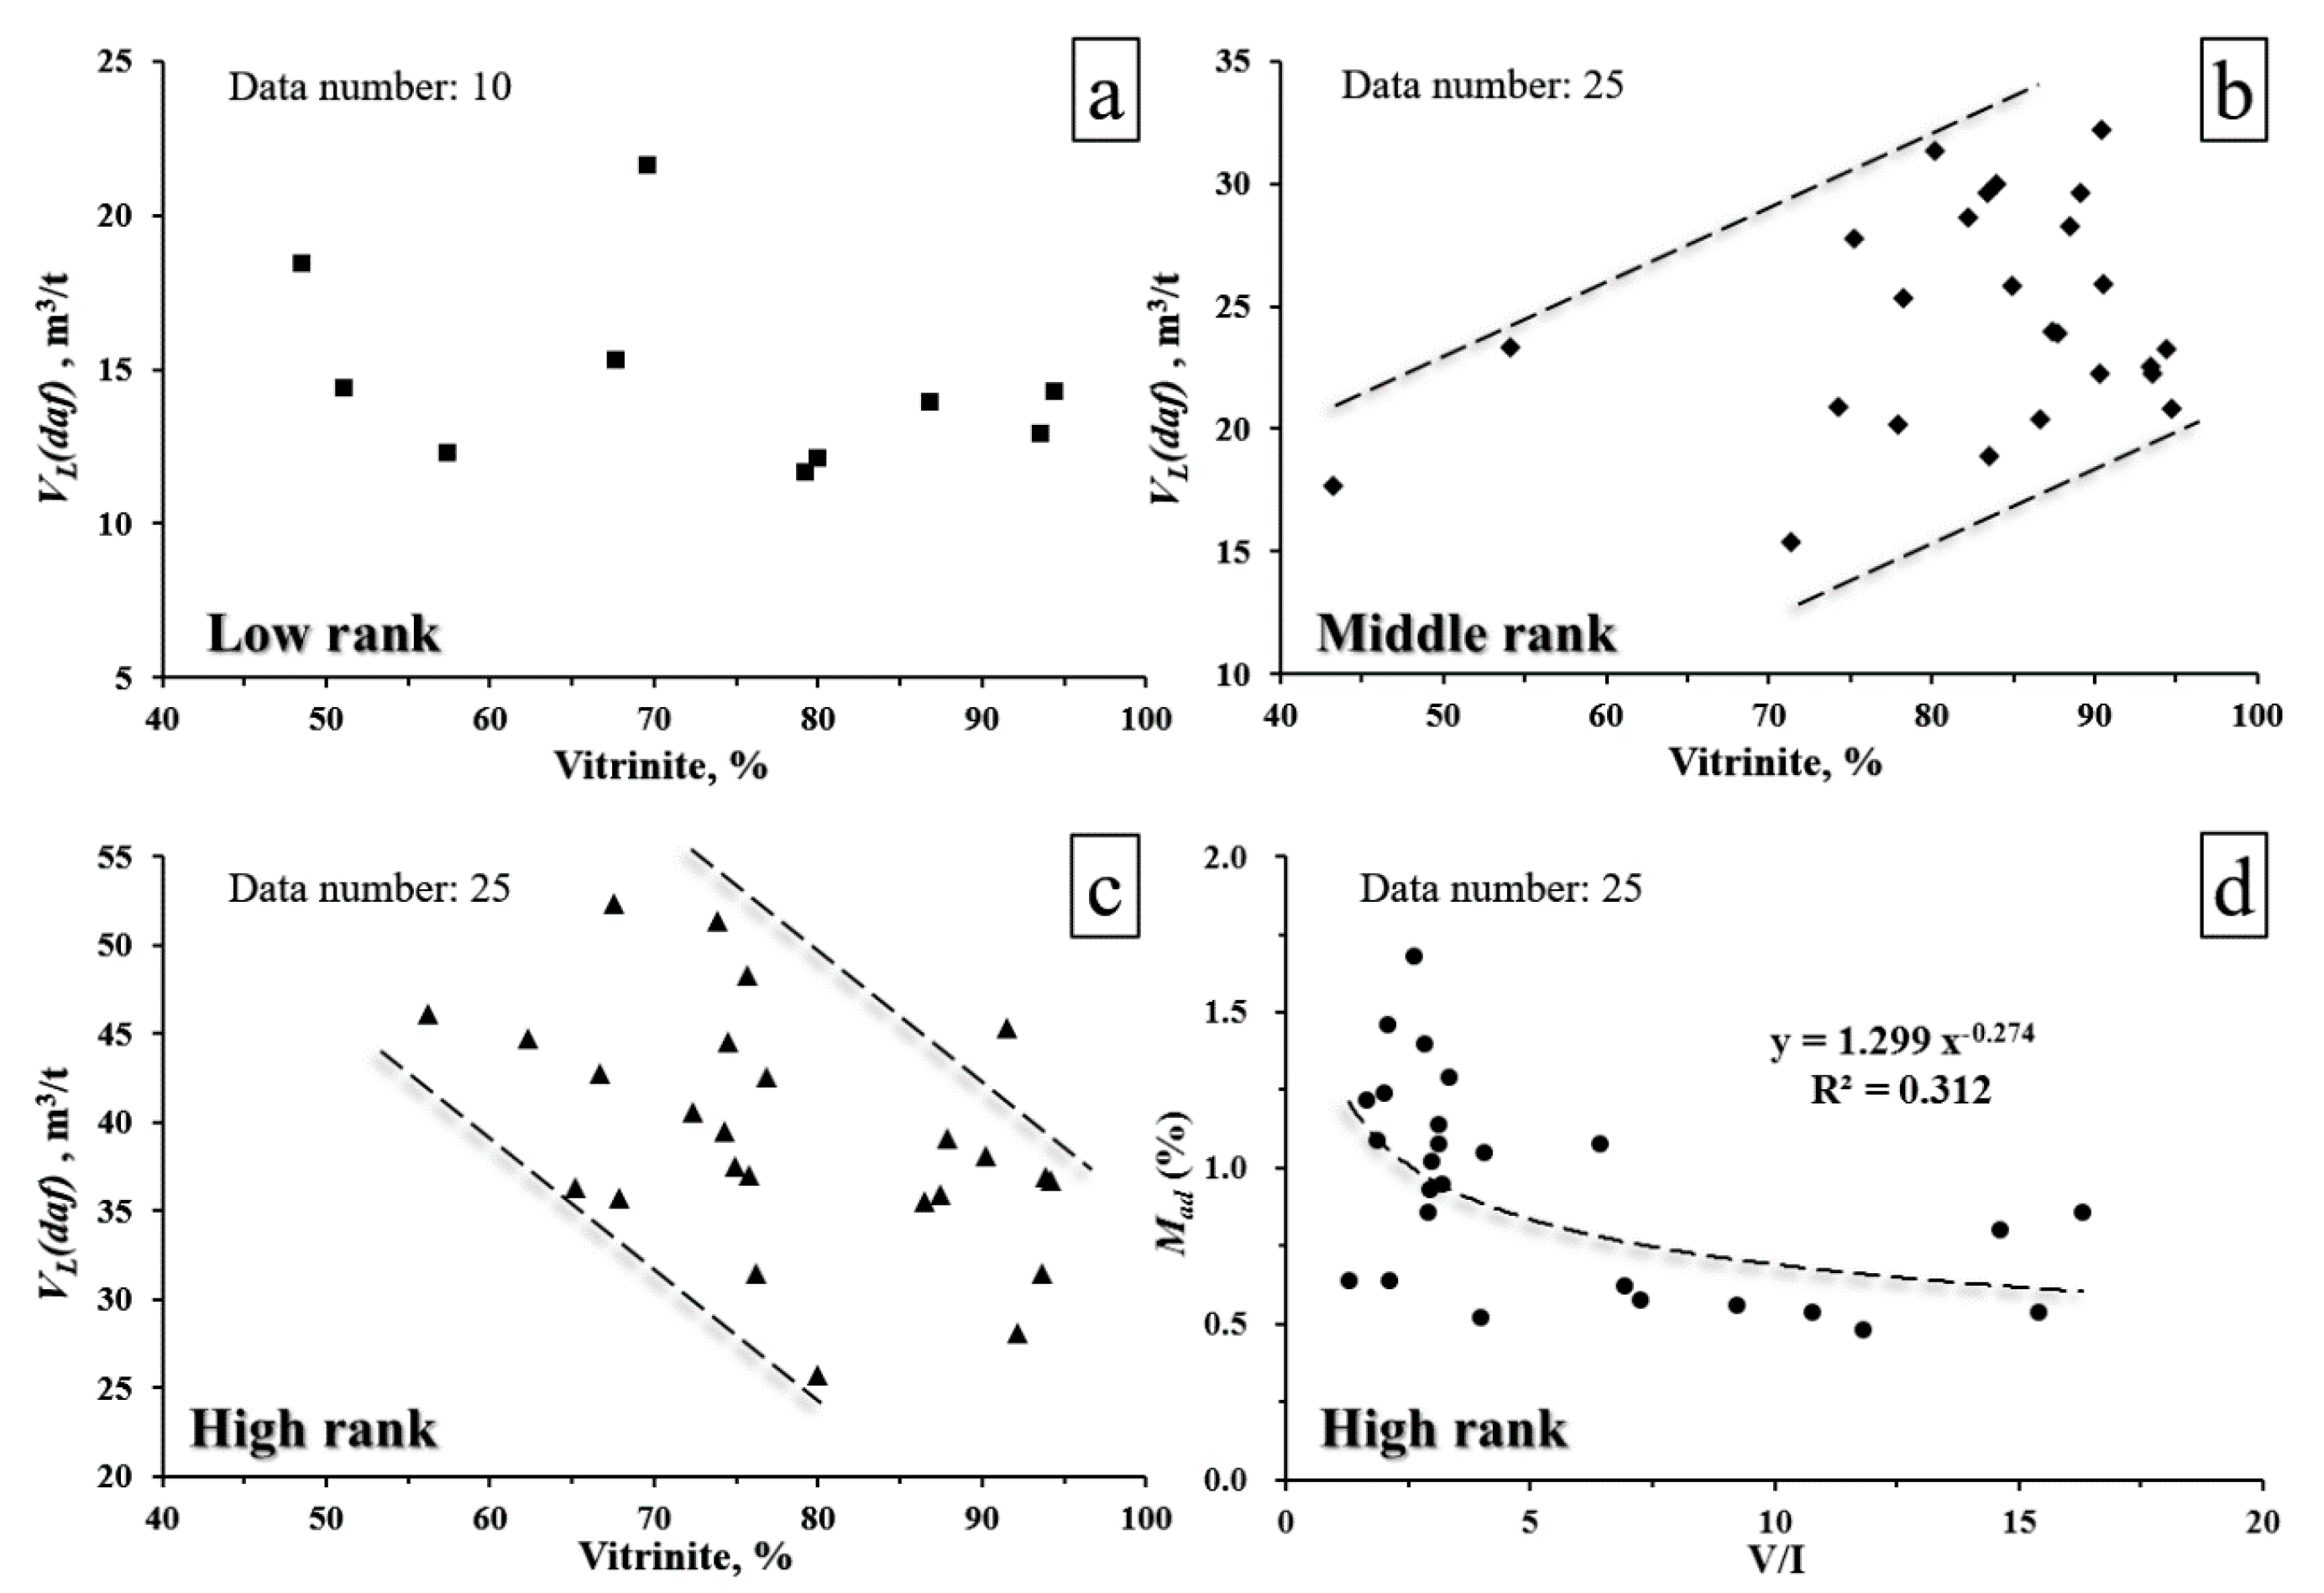
4.3. Relation between Maceral and CH4 Adsorption

During early coalification, fracturing of macromolecular lipid chains, condensation of aromatic carbons and polarity changes of the material surface are the main processes [14,34,40]. Porosity, moisture content, density and volatiles yield all have obvious gradation laws in this stage, so these physical evolutions fundamentally control the adsorption capacity of coal, and the influence of maceral on the adsorption capacity is very small (Figure 11a). In the middle metamorphic stage, methane adsorption capacity is positively correlated with vitrinite content (Figure 11b), while in the high metamorphic stage, the relationship reverses (Figure 11c). This result is similar to some studies, but the authors suggest that the vitrinite content only slightly improves the adsorption capacity of coal. Figure 11d shows that in medium-high rank coal, the lower the ratio of vitrinite to inertinite is, the more the inherent moisture content is, and the adsorption of methane will be hindered more seriously. Maceral composition is determined by deposition [30,31], so the enrichment of a certain component in a certain area does not change the control of coal rank on methane adsorption capacity, but only indirectly.

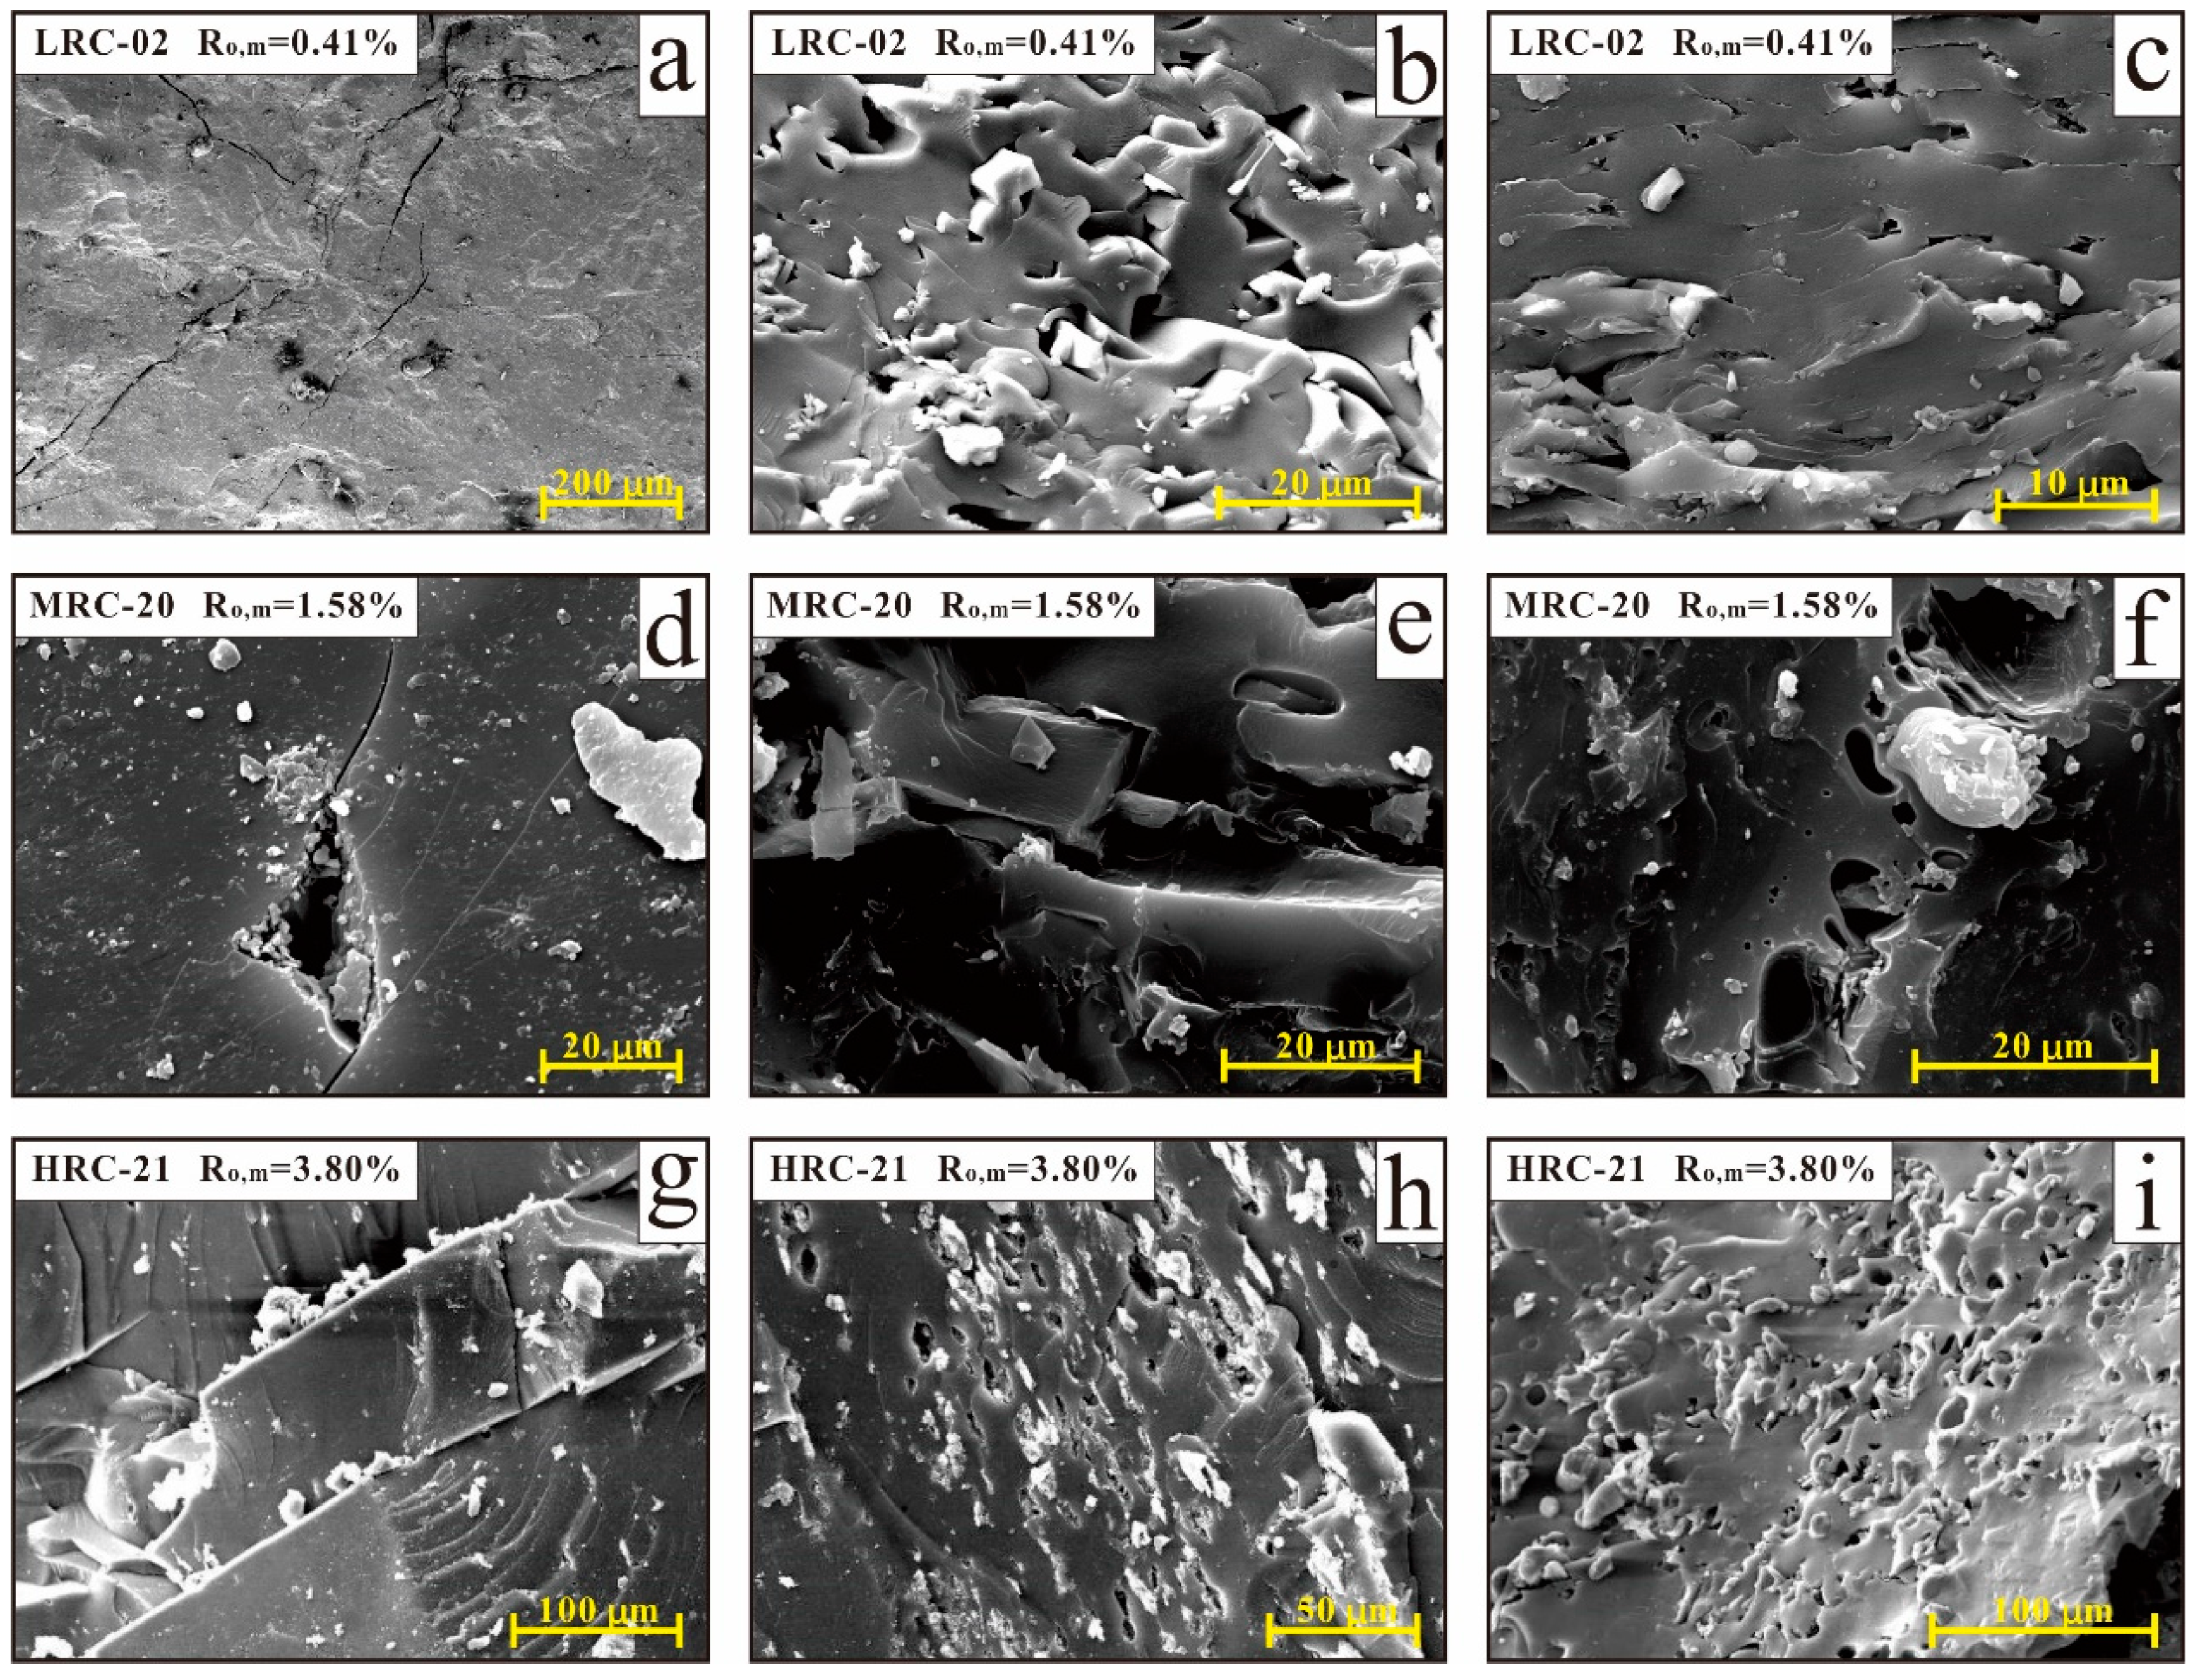
4.4. Relation between Pore Structure and Coal Adsorption Capacity

The pore structure of coal reflects the microstructure features and affects the gas adsorption capacity [43,44]. SEM is used for better analyzing the micromorphology of coal surface and the internal structure of coal internal. The pore-fracture system of lignite (LRC-02, Ro,m = 0.41%) can be explained by irregular pores and fractures. Irregularly distributed micro-fractures (Figure 12a), dissolution pores (Figure 12b) and shrinkage-induced pores (Figure 12c) are merged to form pore clusters. Generally, pores and fractures are not filled with minerals or clays. For bituminous coal (MRC-20, Ro,m = 1.58%), micro-fractures are not developed and show low extensibility (Figure 12d), wedge-shaped intergranular pores (Figure 12e) and deformed residual plant tissue pores can be identified, followed by some macro gas pores (Figure 12f). Partial pores are filled with or attached to secondary minerals. In the high metamorphic stage, parallel cleats can be observed (Figure 12g), slit-shaped corrosion pores (Figure 12h) and spherical gas pores (Figure 12i) are abundant. In anthracite (HRC-21, Ro,m = 3.80%), the pore size distribution tends to be simplified, with dominant micropores, fractures are well oriented and extended, and clay filling is common. Therefore, the pore-fracture system of different rank coals varies a lot, indicating heterogeneity on the coal surface.
In the process of coalification, most of the oxygen-bearing elements in the coal molecules fall off [14], the aromatic ring layers of coal molecules arrange in a fixed orientation, and the high temperature promotes hydrocarbon generation, resulting in the concentration of micropores. Micro- pores are further generated, and the affinity for methane of coal macromolecules increases, both of which lead to an increase of methane adsorption. After the third coalification jump, the aromatization degree, affinity for methane and micropore ratio of the coal gradually became constant, while the spacing of aromatic rings gradually decreases. Therefore, the increase rate of methane adsorption slows down, and even reverses.

5. Conclusions

Sixty coal samples covering a wide range of coal rank (Ro,m) were used to explore the variation of petrophysical parameters and their influences on coal adsorption capacity. Tests included CH4 isothermal adsorption, moisture measurement, proximate analysis, maceral measurement and SEM observation. Maceral composition is controlled by deposition without relation to coal rank, vitrinite is the most abundant maceral, followed by inertinite and liptinite. Mad and Me decreases sharply to minimum at Ro,m of 1.5%, proving that coal metamorphism controls the moisture holding capacity. During coalification, compaction and aromatization can reduce coal porosity, coal matrix density simultaneously increases. Ro,m and VL (daf) show a quadratic correlation with the peak located in Ro,m = 5%. PL decrease rapidly before Ro,m = 1.5%, then increase slowly.
The inhibitory effect of moisture on CH4 adsorption varies regularly during coalification. DAP is proposed to quantify this effect, which represents the decrement of the adsorption percentage of each one percent increase in moisture. DAP first grows linearly as the Ro,m increases to 1.8%, then the value beyond 1 stabilizes at 1% to 1.01% with Ro,m = 1.8–3.5%, finally it increases again when the value of Ro,m is over 3.5%,. This indicates that during the early stage of coal metamorphism, large porosity and strong hydrophilicity of coal matrix result in the fact that moisture not only exists in the adsorption state. As coalification progresses, variations of matrix macromolecules and porosity strengthen the inhibitory effect of moisture on adsorption capacity. Vitrinite content only slightly improves the adsorption capacity in medium-high rank coals. The lower the ratio of vitrinite to inertinite is, the more the inherent moisture content is, and the adsorption of methane will be hindered more seriously. During coalification, the pore size distribution tends to be simplified with micropores dominating, fractures tend to be well oriented and extended, and clay filling becomes more common in high rank coals.
This work explored the variation rule of petrophysical properties and adsorption capacity in different rank coals, and then established some experimental formulas. Whether in CBM production prediction or security risk assessment of mining, these formulas and conclusions have practical significance.

Author Contributions

D.L. and Y.C. conceived and designed the experiments; Y.W. performed the experiments and wrote the paper; Y.W. and X.L. analyzed the data; D.L. and Y.C. revised the paper and provided language support; D.L. provided technical support.

Funding

This research was funded by the National Natural Science Foundation of China (grant Nos. 41830427, 41772160 and 41602170), and the National Major Research Program for Science and Technology of China (grant No. 2016ZX05043-001).

Conflicts of Interest

The authors have no conflict of interest to declare.

Appendix A

Table A1. Tested parameters of samples, including maceral content, proximate analysis, isothermal adsorption and vitrinite reflectance results.
AreaSample No.Ro,m (%)Maceral ContentProximate AnalysisAdsorption CapacityPL MPaMe (%)
V (%)I (%)L (%)Vdaf (%)Mad (%)Aad (%)VL(me) m3/tVL(ad) m3/t
SE-JBLRC-010.3553.6339.855.1954.818.319.229.0110.154.4121.47
SE-JBLRC-020.4178.805.4012.1052.418.0117.368.759.644.3120.07
SE-JBLRC-030.4286.205.103.1050.786.3810.8710.5811.824.4815.99
SE-JBLRC-040.5561.6129.392.7038.965.218.3611.9513.254.4617.18
SE-JBLRC-050.5643.1745.842.2037.584.324.7214.4216.784.1718.00
SE-JBLRC-090.6264.1728.063.8648.834.4918.3214.1516.683.1818.67
SE-JBLRC-100.6449.5047.502.6036.712.674.4411.7213.383.5016.30
SE-JBMRC-010.6742.0055.102.8028.562.681.2814.5017.003.4218.67
SE-JBMRC-020.7052.8044.801.3034.112.548.1317.7420.832.6716.89
SE-JBMRC-030.7588.405.202.6042.011.287.9417.6621.122.6617.89
SE-JBMRC-050.8484.0011.702.0041.131.6211.8818.0120.662.7714.53
E-OBLRC-060.5972.3011.0016.2033.574.3810.8711.0011.824.4810.99
E-OBLRC-070.5969.6017.4012.7028.043.1517.368.859.644.3114.07
E-OBLRC-080.6169.9018.3011.6023.874.418.829.3010.154.4112.47
E-OBMRC-040.8382.804.608.8025.601.2012.8416.2117.893.6512.77
E-OBMRC-060.9077.3015.206.8024.041.237.1215.7217.282.3910.19
E-OBMRC-071.0082.1012.605.0021.870.9121.7814.3715.742.3810.87
E-OBMRC-081.0784.1012.103.0015.311.2927.3215.7617.122.7010.70
E-OBMRC-101.1477.0021.80 19.700.8915.1615.5816.952.7310.47
NW-QBMRC-121.3075.5021.002.4013.791.077.5621.6323.172.187.71
NW-QBMRC-091.0869.8028.00 22.700.5221.9310.6311.951.7011.33
NW-QBMRC-111.2272.0025.00 14.340.5422.7514.7016.031.439.77
NW-QBMRC-131.3380.2015.901.6016.410.5021.3021.4823.151.787.22
NW-QBMRC-141.3689.506.20 27.430.6723.0915.8316.942.487.17
NW-QBMRC-151.3672.5023.903.4010.960.513.2223.8226.733.8112.63
NW-QBMRC-171.5090.006.30 13.390.3815.2517.1019.031.4212.08
NW-QBMRC-181.5188.509.400.9013.921.049.6526.6428.762.958.51
SE-OBMRC-161.4390.109.60 17.451.1110.4318.1419.672.069.18
SE-OBMRC-191.5581.2017.50 14.721.0919.6320.3722.672.4810.97
SE-OBMRC-201.5881.0014.401.1021.311.2918.0919.0320.822.948.25
SE-OBMRC-211.7386.709.101.2021.300.9215.5319.5621.623.089.49
SE-OBMRC-221.7687.8011.40 18.920.8010.2722.6325.102.2210.34
SW-QBMRC-231.8385.6310.47 21.861.3821.9019.9822.702.1212.04
SW-QBMRC-241.8878.1414.96 27.531.3635.1816.3819.031.9113.23
SW-QBMRC-252.0075.1518.55 19.991.0522.2720.8024.041.7913.41
SW-QBHRC-032.1867.8921.21 16.530.9521.3021.5724.461.7111.59
SW-QBHRC-042.2782.0912.81 12.431.0813.0526.6530.501.8912.48
SW-QBHRC-052.4472.0023.00 11.631.0815.3128.1330.911.888.90
SW-QBHRC-062.5286.585.31 15.180.8622.5924.1928.081.8313.63
SW-QBHRC-072.6463.5030.00 13.210.6419.1225.5628.702.2110.83
SW-QBHRC-092.7863.0033.70 7.971.095.3331.2833.992.237.84
NE-QBHRC-012.0384.0311.57 18.550.5821.5427.5430.481.489.50
NE-QBHRC-022.1487.079.43 12.260.5614.9329.1932.192.079.16
NE-QBHRC-082.7676.6919.21 13.220.524.1322.5724.561.707.96
NE-QBHRC-102.7987.145.96 9.950.8010.7324.5327.852.1011.77
NE-QBHRC-112.9187.597.41 10.160.484.9623.0626.531.6112.88
NE-QBHRC-123.0390.805.90 10.300.5412.2629.8932.231.527.03
NE-QBHRC-133.0784.8712.23 11.140.6216.1725.9129.892.2813.13
NE-QBHRC-143.1687.938.17 9.830.543.1740.2243.612.777.58
S-QBHRC-153.2272.5024.30 6.941.028.5930.4733.883.009.97
S-QBHRC-163.2773.0022.00 8.011.299.6833.6237.623.0310.43
S-QBHRC-173.3871.9724.63 9.820.9310.3434.8139.512.4011.81
S-QBHRC-183.4461.7030.80 12.491.2419.8328.9333.782.1814.15
S-QBHRC-193.5971.3324.67 10.230.8616.2629.7332.761.859.11
S-QBHRC-203.7273.2823.52 9.881.1419.1933.1738.522.1813.51
S-QBHRC-213.8070.7224.98 9.121.4014.5837.3843.172.5113.19
S-QBHRC-223.9252.6041.00 8.210.6414.7134.3939.062.3811.71
S-QBHRC-234.0470.6027.00 6.941.688.9331.0336.252.4113.78
S-QBHRC-244.1658.4028.00 11.171.4622.7734.6839.702.7712.02
S-QBHRC-254.2659.9036.30 8.581.2216.9331.6136.642.5612.88
V: vitrinite (%); I: Inertinite (%); L: Liptinite; Me: equilibrium moisture content.

References

  1. Moore, T.A. Coalbed methane: A review. Int. J. Coal Geol. 2012, 101, 36–81. [Google Scholar] [CrossRef]
  2. Karacan, C.Ö.; Ruiz, F.A.; Cotè, M.; Sally, P. Coal mine methane: A review of capture and utilization practices with benefits to mining safety and to greenhouse gas reduction. Int. J. Coal Geol. 2011, 86, 121–156. [Google Scholar] [CrossRef]
  3. Zhou, F.B.; Xia, T.Q.; Wang, X.X.; Zhang, Y.F.; Sun, Y.N.; Liu, J.S. Recent developments in coal mine methane extraction and utilization in China: A review. J. Nat. Gas Sci. Eng. 2016, 31, 437–458. [Google Scholar] [CrossRef]
  4. Flores, R.M. Coalbed methane: From hazard to resource. Int. J. Coal Geol. 1998, 35, 3–26. [Google Scholar] [CrossRef]
  5. Crosdale, P.J.; Beamish, B.B.; Valix, M. Coalbed methane sorption related to coal composition. Int. J. Coal Geol. 1998, 35, 147–158. [Google Scholar] [CrossRef]
  6. Mares, T.E.; Moore, T.A.; Moore, C.R. Uncertainty of gas saturation estimates in a subbituminous coal seam. Int. J. Coal Geol. 2009, 77, 320–327. [Google Scholar] [CrossRef]
  7. Joubert, J.I.; Grein, C.T.; Bienstock, D. Effect of moisture on methane capacity of American coals. Fuel 1974, 53, 186–191. [Google Scholar] [CrossRef]
  8. Hao, S.; Wen, J.; Yu, X.; Chu, W. Effect of the surface oxygen groups on methane adsorption on coals. Appl. Surf. Sci. 2013, 264, 433–442. [Google Scholar] [CrossRef]
  9. Yao, Y.; Liu, D.; Huang, W. Influences of igneous intrusions on coal rank, coal quality and adsorption capacity in Hongyang, Handan and Huaibei coalfields, North China. Int. J. Coal Geol. 2011, 88, 135–146. [Google Scholar] [CrossRef]
  10. Zhou, F.; Liu, S.; Pang, Y.; Li, J.; Xin, H. Effects of Coal Functional Groups on Adsorption Microheat of Coal Bed Methane. Energy Fuels 2015, 29, 1550–1557. [Google Scholar] [CrossRef]
  11. Fu, H.J.; Tang, D.Z.; Xu, T.; Xu, H.; Tao, S.; Li, S.; Yin, Z.Y.; Chen, B.L.; Zhang, C.; Wang, L.L. Characteristics of pore structure and fractal dimension of low-rank coal: A case study of Lower Jurassic Xishanyao coal in the southern Junggar Basin, NW China. Fuel 2017, 193, 254–264. [Google Scholar] [CrossRef]
  12. Levy, J.; Day, S.J.; Killingley, J.S. Methane capacity of Bowen Basin coals related to coal properties. Fuel 1997, 74, 1–7. [Google Scholar] [CrossRef]
  13. Ritter, U.; Arnt, G. Adsorption of petroleum compounds in vitrinite: Implications for petroleum expulsion from coal. Int. J. Coal Geol. 2005, 62, 183–191. [Google Scholar] [CrossRef]
  14. Chen, Z.; Jia, C.; Song, Y.; Wang, H.; Wang, Y. Differences and origin of physical properties of low-rank and high-rank coal-bed methanes. Acta Petrol. Sin. 2008, 2, 179–184, (In Chinese with English abstract). [Google Scholar] [CrossRef]
  15. Yee, D.; Seidle, J.P.; Hanson, W.B. Gas sorption on coal and measurement of gas content. Hydrocarb. Coal AAPG Stud. Geol. 1993, 38, 203–218. [Google Scholar]
  16. Levine, J.R. Coalification: The evolution of coal as a source rock and reservoir rock for oil and gas. In SG 38: Hydrocarbons from Coal; Law, B.E., Rice, D.D., Eds.; AAPG: Tulsa, OK, USA, 1993; Volume 38, pp. 39–77. [Google Scholar]
  17. Laxminarayana, C.; Crosdale, P.J. Controls on methane sorption capacity of Indian coals. AAPG Bull. 2002, 86, 201–212. [Google Scholar]
  18. Keshavarz, A.; Sakurovs, R.; Grigore, M.; Sayyafzadeh, M. Effect of maceral composition and coal rank on gas diffusion in Australian coals. Int. J. Coal Geol. 2017, 173, 65–75. [Google Scholar] [CrossRef]
  19. Su, X. Influence of coal rank on coal adsorption capacity. Nat. Gas Ind. 2005, 25, 19–21, (In Chinese with English abstract). [Google Scholar]
  20. Zhang, K.; Tang, D.; Tao, S.; Liu, Y.; Chen, S. Study on influence factors of adsorption capacity of different metamorphic degree coals. Coal Sci. Technol. 2017, 45, 192–197, (In Chinese with English abstract). [Google Scholar]
  21. Weniger, P.; Francu, J.; Hemza, P.; Krooss, B.M. Investigations on the methane and carbon dioxide sorption capacity of coals from the SW Upper Silesian Coal Basin, Czech Republic. Int. J. Coal Geol. 2010, 84, 23–39. [Google Scholar] [CrossRef]
  22. Li, Z.T.; Yao, Y.B.; Zhou, H.P.; Bai, X.H. Study on Coal and Rock Maceral Composition Affected to Methane Adsorption Capacity. Coal Sci. Technol. 2012, 40, 125–128, (In Chinese with English abstract). [Google Scholar]
  23. Li, J.; Yao, Y.; Cai, Y.; Qiu, Y. Discussion on coal physical properties and formation with different metamorphic degree in North China. Coal Sci. Technol. 2012, 4, 111–115, (In Chinese with English abstract). [Google Scholar]
  24. An, F.; Cheng, Y.; Wu, D.; Wang, L. The effect of small micropores on methane adsorption of coals from Northern China. Adsorption 2013, 19, 83–90. [Google Scholar] [CrossRef]
  25. Fu, H.; Tang, D.; Xu, H.; Tao, S.; Xu, T.; Chen, B.; Yin, Z. Abrupt Changes in Reservoir Properties of Low-Rank Coal and Its Control Factors for Methane Adsorbability. Energy Fuels 2016, 30, 2084–2094. [Google Scholar] [CrossRef]
  26. Li, Y.; Tang, D.; Xu, H.; Elsworth, D.; Meng, Y. Geological and hydrological controls on water co-produced with coalbed methane in Liulin, eastern Ordos Basin, China. AAPG Bull. 2015, 99, 207–229. [Google Scholar] [CrossRef]
  27. Wang, Y.; Liu, D.; Cai, Y.; Yao, Y.; Zhou, Y. Evaluation of structured coal evolution and distribution by geophysical logging methods in the Gujiao Block, northwest Qinshui basin, China. J. Nat. Gas. Sci. Eng. 2018, 51, 210–222. [Google Scholar] [CrossRef]
  28. Zhang, J.; Liu, D.; Cai, Y.; Pan, Z.; Yao, Y.; Wang, Y. Geological and hydrological controls on the accumulation of coalbed methane within the No. 3 coal seam of the southern Qinshui Basin. Int. J. Coal Geol. 2017, 182, 94–111. [Google Scholar] [CrossRef]
  29. Li, Y.; Zhang, C.; Tang, D.; Gan, Q.; Niu, X.; Wang, K. Coal pore size distributions controlled by the coalification process: An experimental study of coals from the Junggar, Ordos and Qinshui basins in China. Fuel 2017, 206, 352–363. [Google Scholar] [CrossRef]
  30. O’Keefe, J.M.K.; Bechtel, A.; Christanis, K.; Dai, S. On the fundamental difference between coal rank and coal type. Int. J. Coal Geol. 2013, 118, 58–87. [Google Scholar] [CrossRef]
  31. Pickel, W.; Kus, J.; Flores, D.; Kalaitzidis, S.; Christanis, K.; Cardott, B.J.; Misz-Kennan, M.; Rodrigues, S.; Hentschel, A.; Hamor-Vido, M.; et al. Classification of liptinite—ICCP System 1994. Int. J. Coal Geol. 2017, 169, 40–61. [Google Scholar] [CrossRef]
  32. Hou, H.; Shao, L.; Li, Y.; Li, Z.; Wang, S.; Zhang, W.; Wang, X. Influence of coal petrology on methane adsorption capacity of the Middle Jurassic coal in the Yuqia coalfield, northern Qaidam Basin, China. J. Petrol. Sci. Eng. 2017, 149, 218–227. [Google Scholar] [CrossRef]
  33. Gagarin, S.G. Relation between the petrographic content of mineral components in coal and its ash content. Coke Chem. 2008, 51, 241–246. [Google Scholar] [CrossRef]
  34. Gao, Z.; Yang, W. Adsorption mechanism of water molecule on different rank coals molecular surface. J. China Coal Soc. 2017, 42, 753–759, (In Chinese with English abstract). [Google Scholar] [CrossRef]
  35. Li, X.; Zeng, F.; Si, J.; Wang, W.; Dong, X.; Cheng, L. High resolution TEM image analysis of coals with different metamorphic degrees. J. Fuel Chem. Technol. 2016, 44. (In Chinese with English abstract). [Google Scholar] [CrossRef]
  36. Su, X.; Si, Q.; Song, J. Characteristics of coal Raman spectrum. J. China Coal Soc. 2016, 42, 1197–1202, (In Chinese with English abstract). [Google Scholar] [CrossRef]
  37. Xu, H.; Tang, D.; Mathews, J.P.; Zhao, J.; Li, B.; Tao, S.; Li, S. Evaluation of coal macrolithotypes distribution by geophysical logging data in the Hancheng Block, eastern margin, Ordos Basin, China. Int. J. Coal Geol. 2016, 165, 265–277. [Google Scholar] [CrossRef]
  38. Cai, Y.; Liu, D.; Pan, Z.; Yao, Y.; Li, J.; Qiu, Y. Pore structure and its impact on CH4 adsorption capacity and flow capability of bituminous and subbituminous coals from Northeast China. Fuel 2013, 103, 258–268. [Google Scholar] [CrossRef]
  39. Meng, Y.; Tang, D.; Xu, H.; Qu, Y.; Li, Y.; Zhang, W. Division of coalbed methane desorption stages and its significance. Petrol. Explor. Dev. 2014, 41, 671–677. [Google Scholar] [CrossRef]
  40. Zhang, L.; Su, X.; Zeng, S. Discussion on the controlling effects of coal properties on coal adsorption capacity. Acta Geol. Sin. 2006, 6, 910–915, (In Chinese with English abstract). [Google Scholar] [CrossRef]
  41. Pan, Z.; Connell, L.D.; Camilleri, M.; Connelly, L. Effects of matrix moisture on gas diffusion and flow in coal. Fuel 2010, 89, 3207–3217. [Google Scholar] [CrossRef]
  42. Liu, A.; Fu, X.; Wang, K.; An, H.; Wang, G. Investigation of coalbed methane potential in low-rank coal reservoirs—Free and soluble gas contents. Fuel 2013, 112, 14–22. [Google Scholar] [CrossRef]
  43. Clarkson, C.R.; Bustin, R.M. The effect of pore structure and gas pressure upon the transport properties of coal: A laboratory and modeling study. 1. Isotherms and pore volume distributions. Fuel 1999, 78, 1333–1344. [Google Scholar] [CrossRef]
  44. Nie, B.; Liu, X.; Yang, L.; Meng, J.; Li, X. Pore structure characterization of different rank coals using gas adsorption and scanning electron microscopy. Fuel 2015, 158, 908–917. [Google Scholar] [CrossRef]
Figure 1. Positions of the Qinshui, Ordos, and Junggar basins in China and the distribution of the sampling locations. SE-JB, southeastern Junggar basin; E-OB, eastern Ordos basin; SE-OB, southeastern Ordos basin; NW-QB, northwest Qinshui basin; NE-QB, northeast Qinshui basin; SW-QB, southwest Qinshui basin; SE-QB, southeast Qinshui basin. (a) Locations of the Qinshui, Ordos and Junggar Basins in the China Map; (b) Specific locations of coal mines and CBM blocks in the southeastern Junggar Basin; (c) Specific locations of coal mines in the eastern margin of the Ordos Basin; (d) Specific locations of coal mines and CBM blocks in the Qinshui Basin.
Energies 12 00986 g001
Figure 2. Stratigraphic columns and sampling seams of coal-bearing strata of Junggar basin (a), Ordos basin (b) and Qinshui basin (c).
Energies 12 00986 g002
Figure 3. Macerals and mineral contents of all samples, showing data distribution in Ro,m scale. Data are shown in Table A1. Colors show different sampling locations (see Figure 1). (a) Vitrinite (%) vs. Ro,m (%); (b) Inertinite (%) vs. Ro,m (%); (c) Liptinite (%) vs. Ro,m (%); (d) Mineral (%) vs. Ro,m (%).
Energies 12 00986 g003
Figure 4. Relationship between the proximate analysis and different rank coals: (a) Volatile content (Vdaf, %) vs. Ro,m (%); (b) Fixed carbon (FCdaf, %) vs. Ro,m (%); (c) Ash yield (Aad, %) vs. Ro,m (%); (d) Moisture content (Mad, %) vs. Ro,m (%).
Energies 12 00986 g004
Figure 5. Relationships between (a) equilibrium water (Me) and (b) total moisture (Mt) and coal rank (Ro,m).
Energies 12 00986 g005
Figure 6. The relationships between coal physical properties and coal rank (Ro,m): (a) Coal matrix density (ρC, g/cm3) vs. Ro,m; (b) Porosity (φ, %) vs. Ro,m. Colors show different sampling locations (see Figure 1).
Energies 12 00986 g006
Figure 7. CH4 isothermal adsorption in selected samples.
Energies 12 00986 g007
Figure 8. The relationships between adsorption constants (VL and PL) and coal rank (Ro,m), VL (daf) and coal rank showing quadratic correlation (a), PL and coal rank showing cubic correlation (b), colors showing different sampling locations (see Figure 1).
Energies 12 00986 g008
Figure 9. DAP distribution in Ro,m scale (a) and the change trend during coalification (b), DAP representing the decrement of the adsorption percentage of each one percent increase in moisture.
Energies 12 00986 g009
Figure 10. The relationships between ash yield (Aad, %) and equilibrium moisture content (Me, %) in the range of Ro,m > 1.8%.
Energies 12 00986 g010
Figure 11. The relationships between vitrinite content and VL(daf) in Low rank coals (a), medium rank coals (b) and high rank coals (c), respectively; (d) The relationship between Mad (%) and the ratio of Vitrinite to inertinite (V/I).
Energies 12 00986 g011
Figure 12. Pore-fracture shapes from SEM result. (a) irregular fractures; (b) dissolution pores; (c) shrinkage-induced pores; (d) micro-fractures; (e) wedge shaped intergranular pores; (f) deformed residual plant tissue pores; (g) cleats filled with clay; (h) slit-shaped corrosion pores; (i) spherical gas pore cluster.
Energies 12 00986 g012

