1. Introduction
The building sector accounts for about 40% [
1,
2] of total energy consumption. A building uses energy at various life-cycle stages from its construction to demolition [
3,
4]. Especially in many existing buildings, the envelope has deteriorated and the mechanical and electrical systems are degraded in terms of efficiency, which means that such buildings require higher levels of energy consumption to maintain comfortable indoor environmental quality [
5]. Recently, the demand for reducing energy cost in existing buildings has increased, and this has led to greater interest in energy performance improvements for buildings [
6,
7]. Consequently, many countries have developed and introduced energy performance assessment methods to support retrofit decision-making for enhancing building energy efficiency [
8,
9,
10,
11,
12,
13,
14].
Existing buildings are likely to consume more energy and emit more greenhouse gases than new buildings because of inevitable deteriorations in their physical performance. An accurate diagnosis of a building’s physical performance should precede any improvement work concerning building operations and system maintenance. Energy efficient operation may not be sufficient to reduce the energy demands of a building, and hence, this strategy may not represent a fundamental solution, i.e., such an approach is often limited in being able to achieve an energy saving target. Thus, first of all, apart from occupant behavior, building operations, and system maintenance, the performances of the envelope, lighting, hot water supply, and heating, ventilation, and air conditioning (HVAC) systems need to be objectively assessed to effectively reduce the energy consumption of an existing building [
15,
16,
17]. Many studies have been conducted on energy retrofitting strategies and economic assessments for various types of existing buildings such as residential and non-residential buildings [
18,
19,
20,
21].
Many countries, including European countries, where existing buildings represent a large proportion of the building stock, support the continuous management of energy performance in existing buildings at the national level by running a mandatory building energy performance certification system [
6,
16]. The energy performance of buildings can be assessed either by calculating their physical performance based on drawings or by benchmarking an energy consumption level [
6,
22]. In most countries, an Asset Rating (AR), which assesses the physical performance of a building, is used for improving the energy performance of a deteriorated building. The AR itself demands numerous input data in order to provide reliable information. An accurate diagnosis of an existing building can be a solution for a near-zero energy building (NZEB). Based on expert discussions and technical analyses, it is possible to manage an existing building to balance out its energy demand with energy from renewable technologies [
23]. However, as data on existing buildings are difficult to collect, the energy performance assessment of those buildings is typically conducted with simplified input data or by acquiring such input data as default and reference table values from outside sources [
24,
25,
26]. In addition, one recent approach describes modelling energy consumption in order to complement insufficient input data [
6,
27].
In South Korea, the scope of the energy efficiency rating certification system [
28] has been expanded from new buildings to include existing buildings to promote the energy efficiency of all buildings. However, no assessment method for existing buildings has been prepared yet, and thus, an assessment method of new buildings that requires extensive input data is being applied to existing buildings. The purpose of this study is to present methodologies of energy performance assessment for existing buildings. We analyzed various assessment methodologies, which classified into three prototypes according to data acquisition level. A demonstration assessment for real buildings was then conducted to examine the applicability and usability of the proposed methodologies.
2. Classification of Assessment Methods by the Data Acquisition Level
2.1. Review of Energy Performance Assessment Methodologies—Data Acquisition Methods
Since existing buildings have differences and limited data acquisition levels [
29], the assessment methodology has been developed depending on the situation in each country. The U.K. government has developed and utilized the Reduced Data Standard Assessment Procedure (RdSAP), which needs simplified input data to assess existing dwellings [
30,
31]. RdSAP applies the same methodology as SAP for assessing new dwellings, but it simplifies the numbers and values of input data required in consideration of data availability for existing buildings. In addition, when data are difficult to measure in some situations, an “expanded data set” is used to supplement the data which consists of default values, reference tables, or equations [
30,
31,
32,
33].
In France, the energy performance of existing buildings can be assessed by one of three calculation methods (3CL-DPE, DEL6-DPE, Comfie-DPE). 3CL-DPE is a simplified method, and the others are detailed methods [
34,
35,
36,
37]. Every assessment includes an on-site audit and airtightness test. Insufficient data collection of existing buildings can be complemented for by obtaining additional data about building envelop and other mechanical systems either by measurements or interviews. In addition, by considering the data acquisition level of existing buildings, heating, air conditioning, and hot water demands of the buildings, which were built before 1948 can be calculated, based on the measured energy data. While those built after 1948 are subject to different assessment regulations according to building size and renovation type (major or minor). If the floor area exceeds 1000 m
2, total consumption of the components (envelope and technical systems) is assessed in accordance with the Global Thermal Regulation based on RT2005, the first thermal regulation for new buildings which has been implemented since 2006. If the floor area is below 1000 m
2, the Thermal Regulation per Building Component is used for the assessment. Since, there are differences in data availability and energy consumption level depending on the building size, the state of renovation, and construction year, different assessment methods are applied on existing buildings.
The Energieausweis of Germany [
6,
38] conducts “Simplified Date Recording” to reduce energy report costs by restricting the amount of work required during the assessment of an existing building. Therefore, an expert simplifies the data by approximating the geometrical shape of a building and by utilizing the default values (historical U-values, etc.). The standard heat transfer coefficients of building components, the efficiency values of building equipment, and the maximum heat transfer coefficients of external wall components are presented by year in tables so that default values can be applied. Simple measurement methods for the window width, direction, and gradient are also presented.
In the U.S., energy performance assessment tools have been developed and utilized to support decision making on the energy efficiency of buildings such as Commercial Building Energy Asset Score [
39] and Commercial Building Energy Saver (CBES) [
40,
41]. The Asset Score has been developed as a national standardized assessment tool for assessing the energy efficiency of commercial and multifamily residential buildings. This tool can assess a total of 18 building types, and users can select the level of assessment methods (preview or full) according to the user’s input data availability. The preview version assesses energy performance of building with default or inferred values in standard assessment manual. In contrast, the full version calculates specific building data which is provided by the user. In this tool, the performance of a current building is assessed under standard climate conditions, operation and occupancy schedules to provide objective performance data. The potential improvements are assessed by considering actual operation and occupancy conditions.
The CBES toolkit was developed to support retrofit decision making of building owners and energy managers. This tool is classified the assessment method into three levels (level 1 to level 3) according to the input data availability. In level 1, a load shape analysis is conducted based on measured electricity energy data and outdoor air temperature to identify potential building operation problems. An analysis result also can be used to estimate the thermal performance of the building envelope or amount of outdoor air used for ventilation or cooling. Level 2 aims for a quick assessment at the initial retrofit stage, so minimal data including building information and investment criteria are used for the analysis. As pre-simulated results are utilized, it is possible to suggest an energy conservation measure (ECM) that satisfies the investment criteria within a short time. Level 3 is intended to support building owners’ and managers’ decision making for retrofit, so this stage should improve the accuracy of assessment result. In order to do this, level 3 involves pattern-based calibration procedure to provide the accurate information for users’.
2.2. Classification of Assesmeent Methods
As mentioned above, in many countries, various assessment methods for existing buildings can be selectively utilized, and insufficient data can be compensated for by using simplified input data or data estimation methods.
Table 1 presents the data utilized by countries for assessing of existing buildings. Assessment results for existing buildings will vary depending on how much the assessment reflects the features and conditions of the building. Accordingly, in order to assess the performance of a building accurately, it is essential to collect real information about the building, which is used for energy modelling.
The state-of-the-art review shows the data is being collected in various ways in each country. The data collection methods can be summarized as shown in
Table 2.
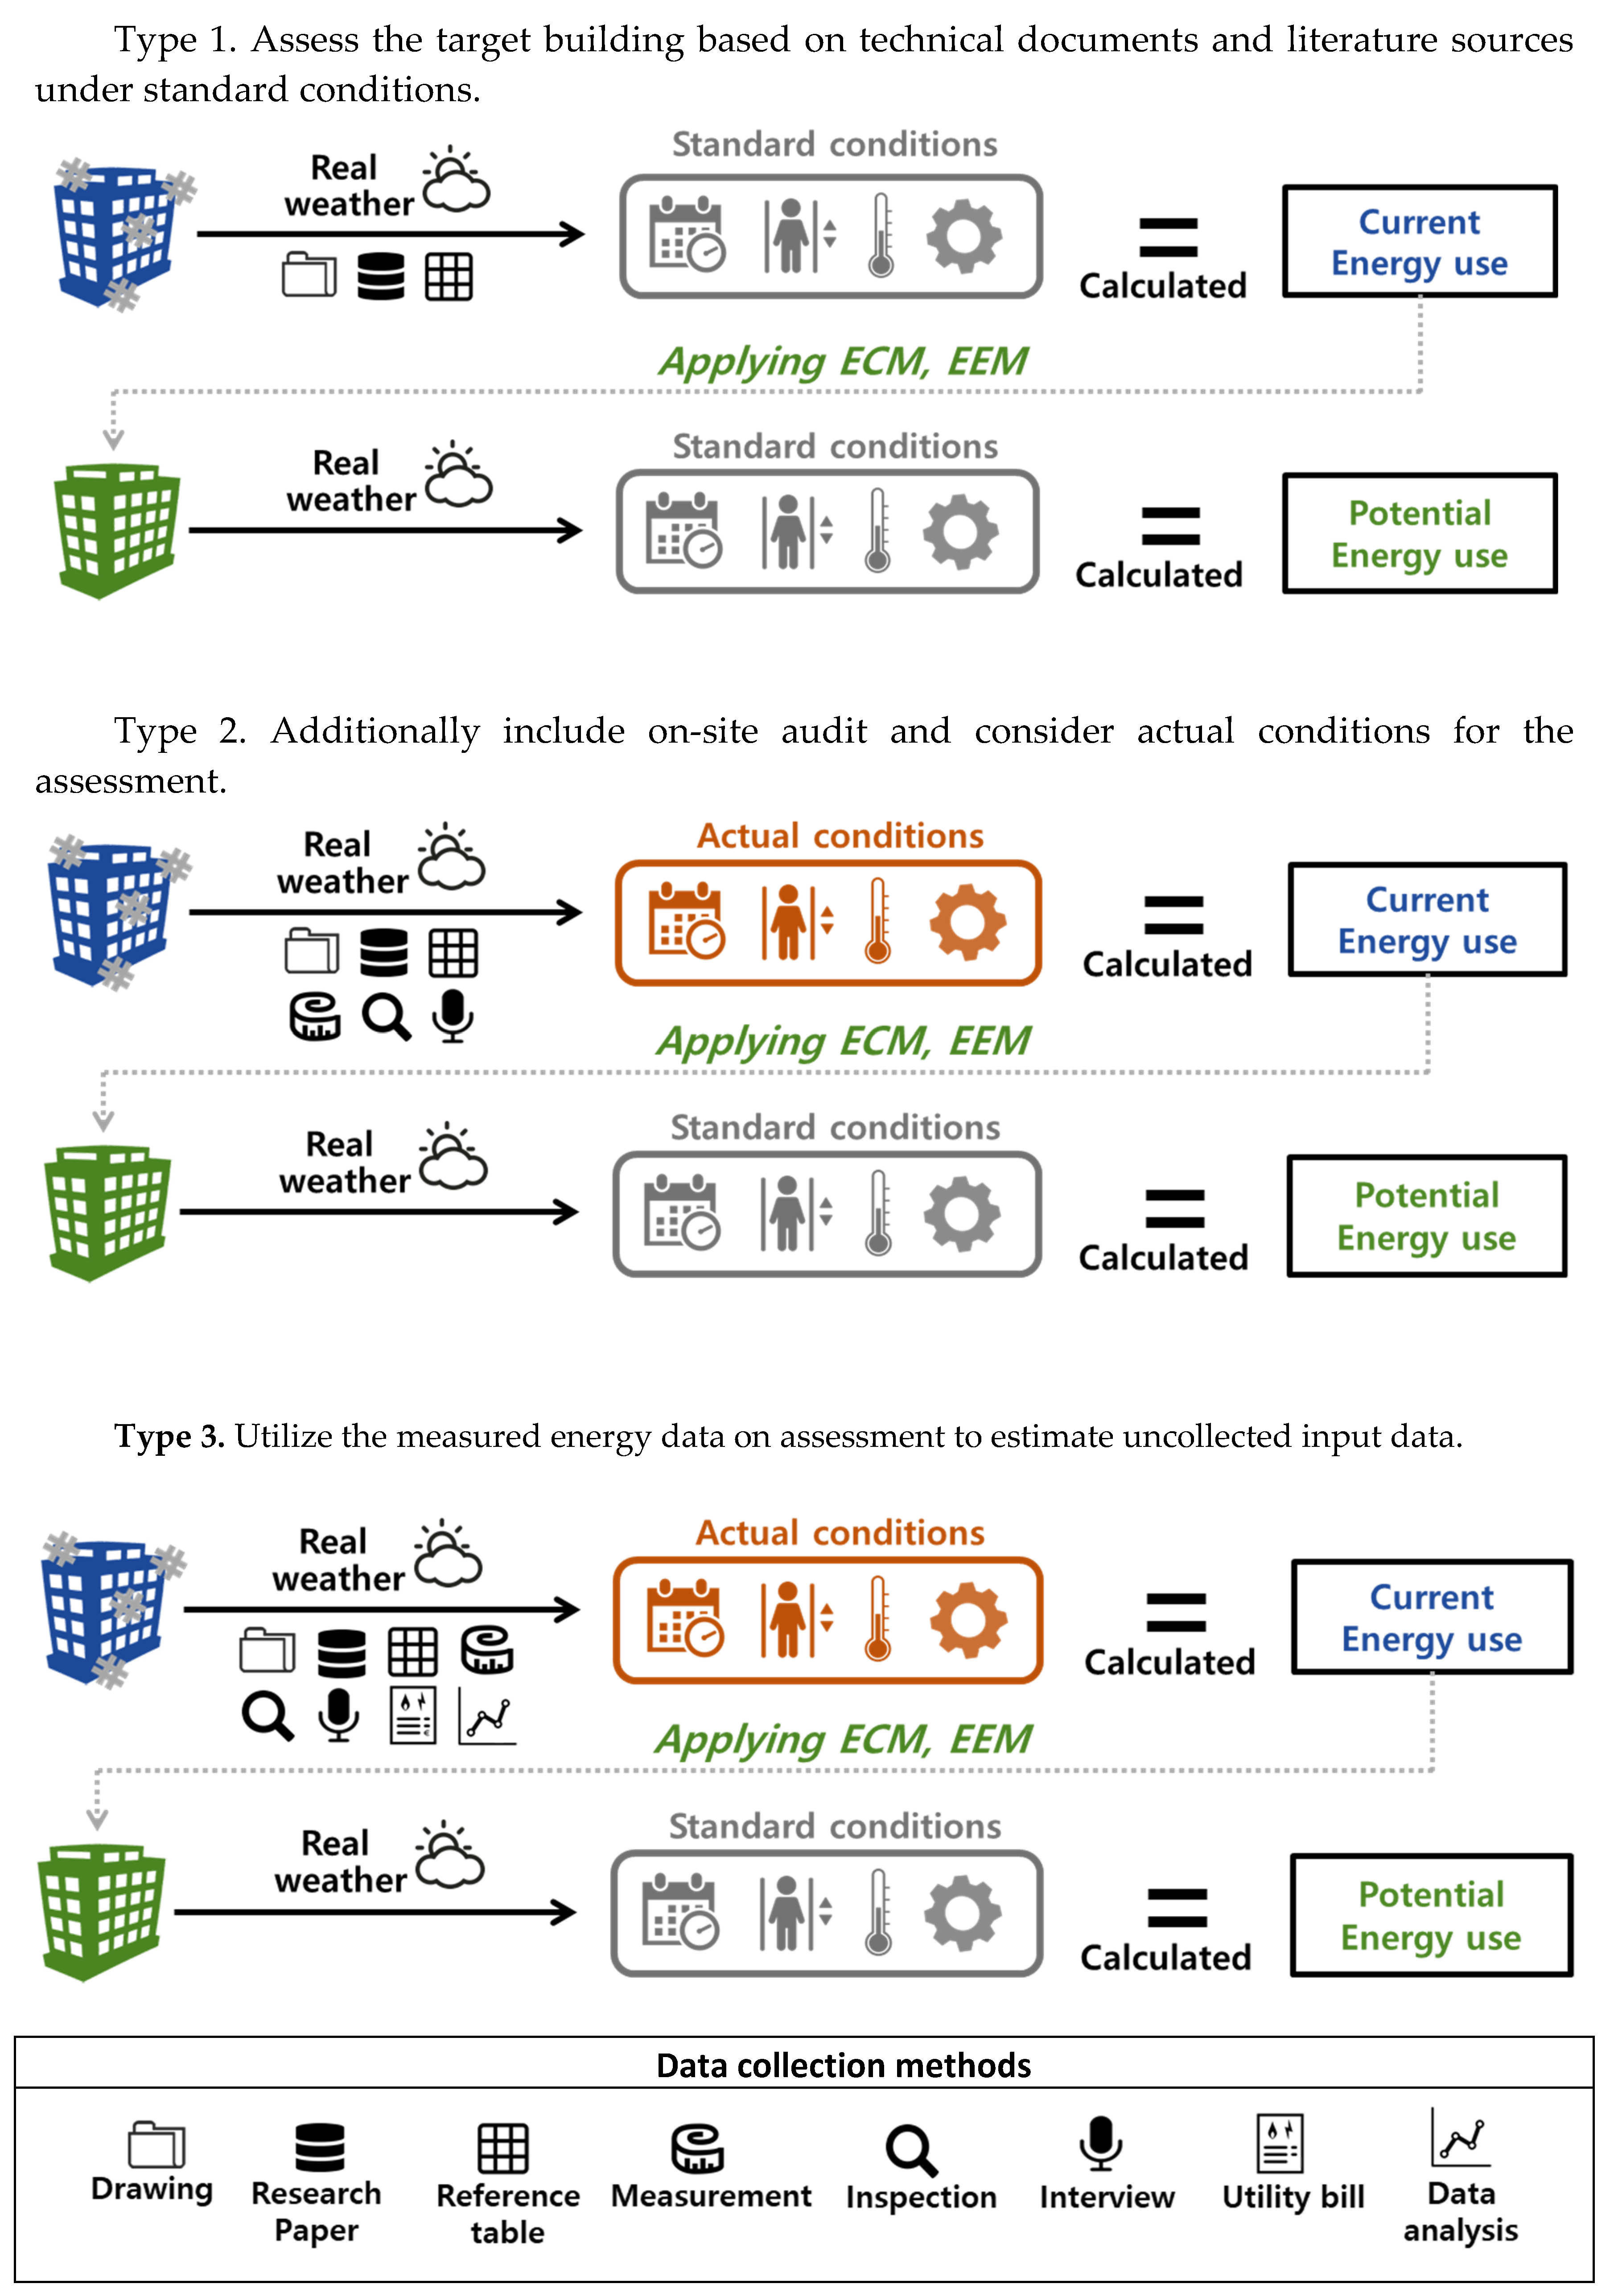
Based on the assessment methodologies reviewed above, we proposed three different assessment methods according to the data acquisition levels as shown in
Table 3 and
Figure 1. Type 1 assesses the degraded performance of existing buildings under standard operating and occupancy conditions by using technical documents (drawings, specification etc.) and literature sources, but without on-site audit. The existing buildings undergo changes of their physical properties as a result of deterioration. For this reason, even if the performance is provided in drawings and specifications, the collected data may not agree with the actual performance. Thus, Type 1 collects information about the degraded performance by referring to literature sources like standard assessment manual or research paper [
42].
Type 2 collects input data for the assessment based on additional on-site audits. To evaluate the target building by considering actual operating and occupancy conditions, we conduct measurement, inspection and interview, thus, type 2 can provide a more accurate potential energy saving measure. Type 3 estimates the input data uncollected in type 1, 2 for the assessment. To estimate performance of the target building, in the type 3, we additionally conduct analysis of energy consumption data. For example, degraded envelope performance can be estimated by comparing monthly measured energy data and outdoor temperature, and, infiltration rate can be estimated by comparing simulated and measured energy results. Thus, the accuracy of energy performance model can be improved.
3. Demonstration Assessment
3.1. Description of Buildings and Data Collection
The classified assessment methods were applied to three real buildings to demonstrate their applicability and usability. The three case study buildings are located in Seoul; a public office building with community center (OB), a university building for lectures and faculty offices (UB1), and a university building for graduate students’ laboratories (UB2).
Table 4 and
Table 5 present an overview and the HVAC systems of the case study buildings.
OB1 was recently constructed and earned the high grade of Building Energy Efficiency Rating Certification (BEERC) in 2013. It consists of offices and community facilities for residents. Electric heat pumps (EHP) and gas heat pumps (GHP) are used for indoor heating and cooling. It turned out that the drawings and the actual building are in good agreement, and hence, the main purpose of the audit was only to collect building data related to the actual operating and occupancy conditions after the building was completed. Both UB1 and UB2 are university buildings that use EHP system for heating and cooling. UB1 was constructed in 1979, but recently retrofitted. The insulation of external wall and windows was reinforced and the lights were replaced by LEDs. UB2 has continued to be used since its completion in 1979, without a retrofit for over 40 years. Only architectural drawing was obtained at UB1 and UB2 and no other records could be obtained. Thus, we obtained most building data from the on-site audit (measurement, visual inspection, interviews), estimations made through data analysis of energy measurements, and default values. Collected data by case buildings are shown in
Table 6.
3.2. Method
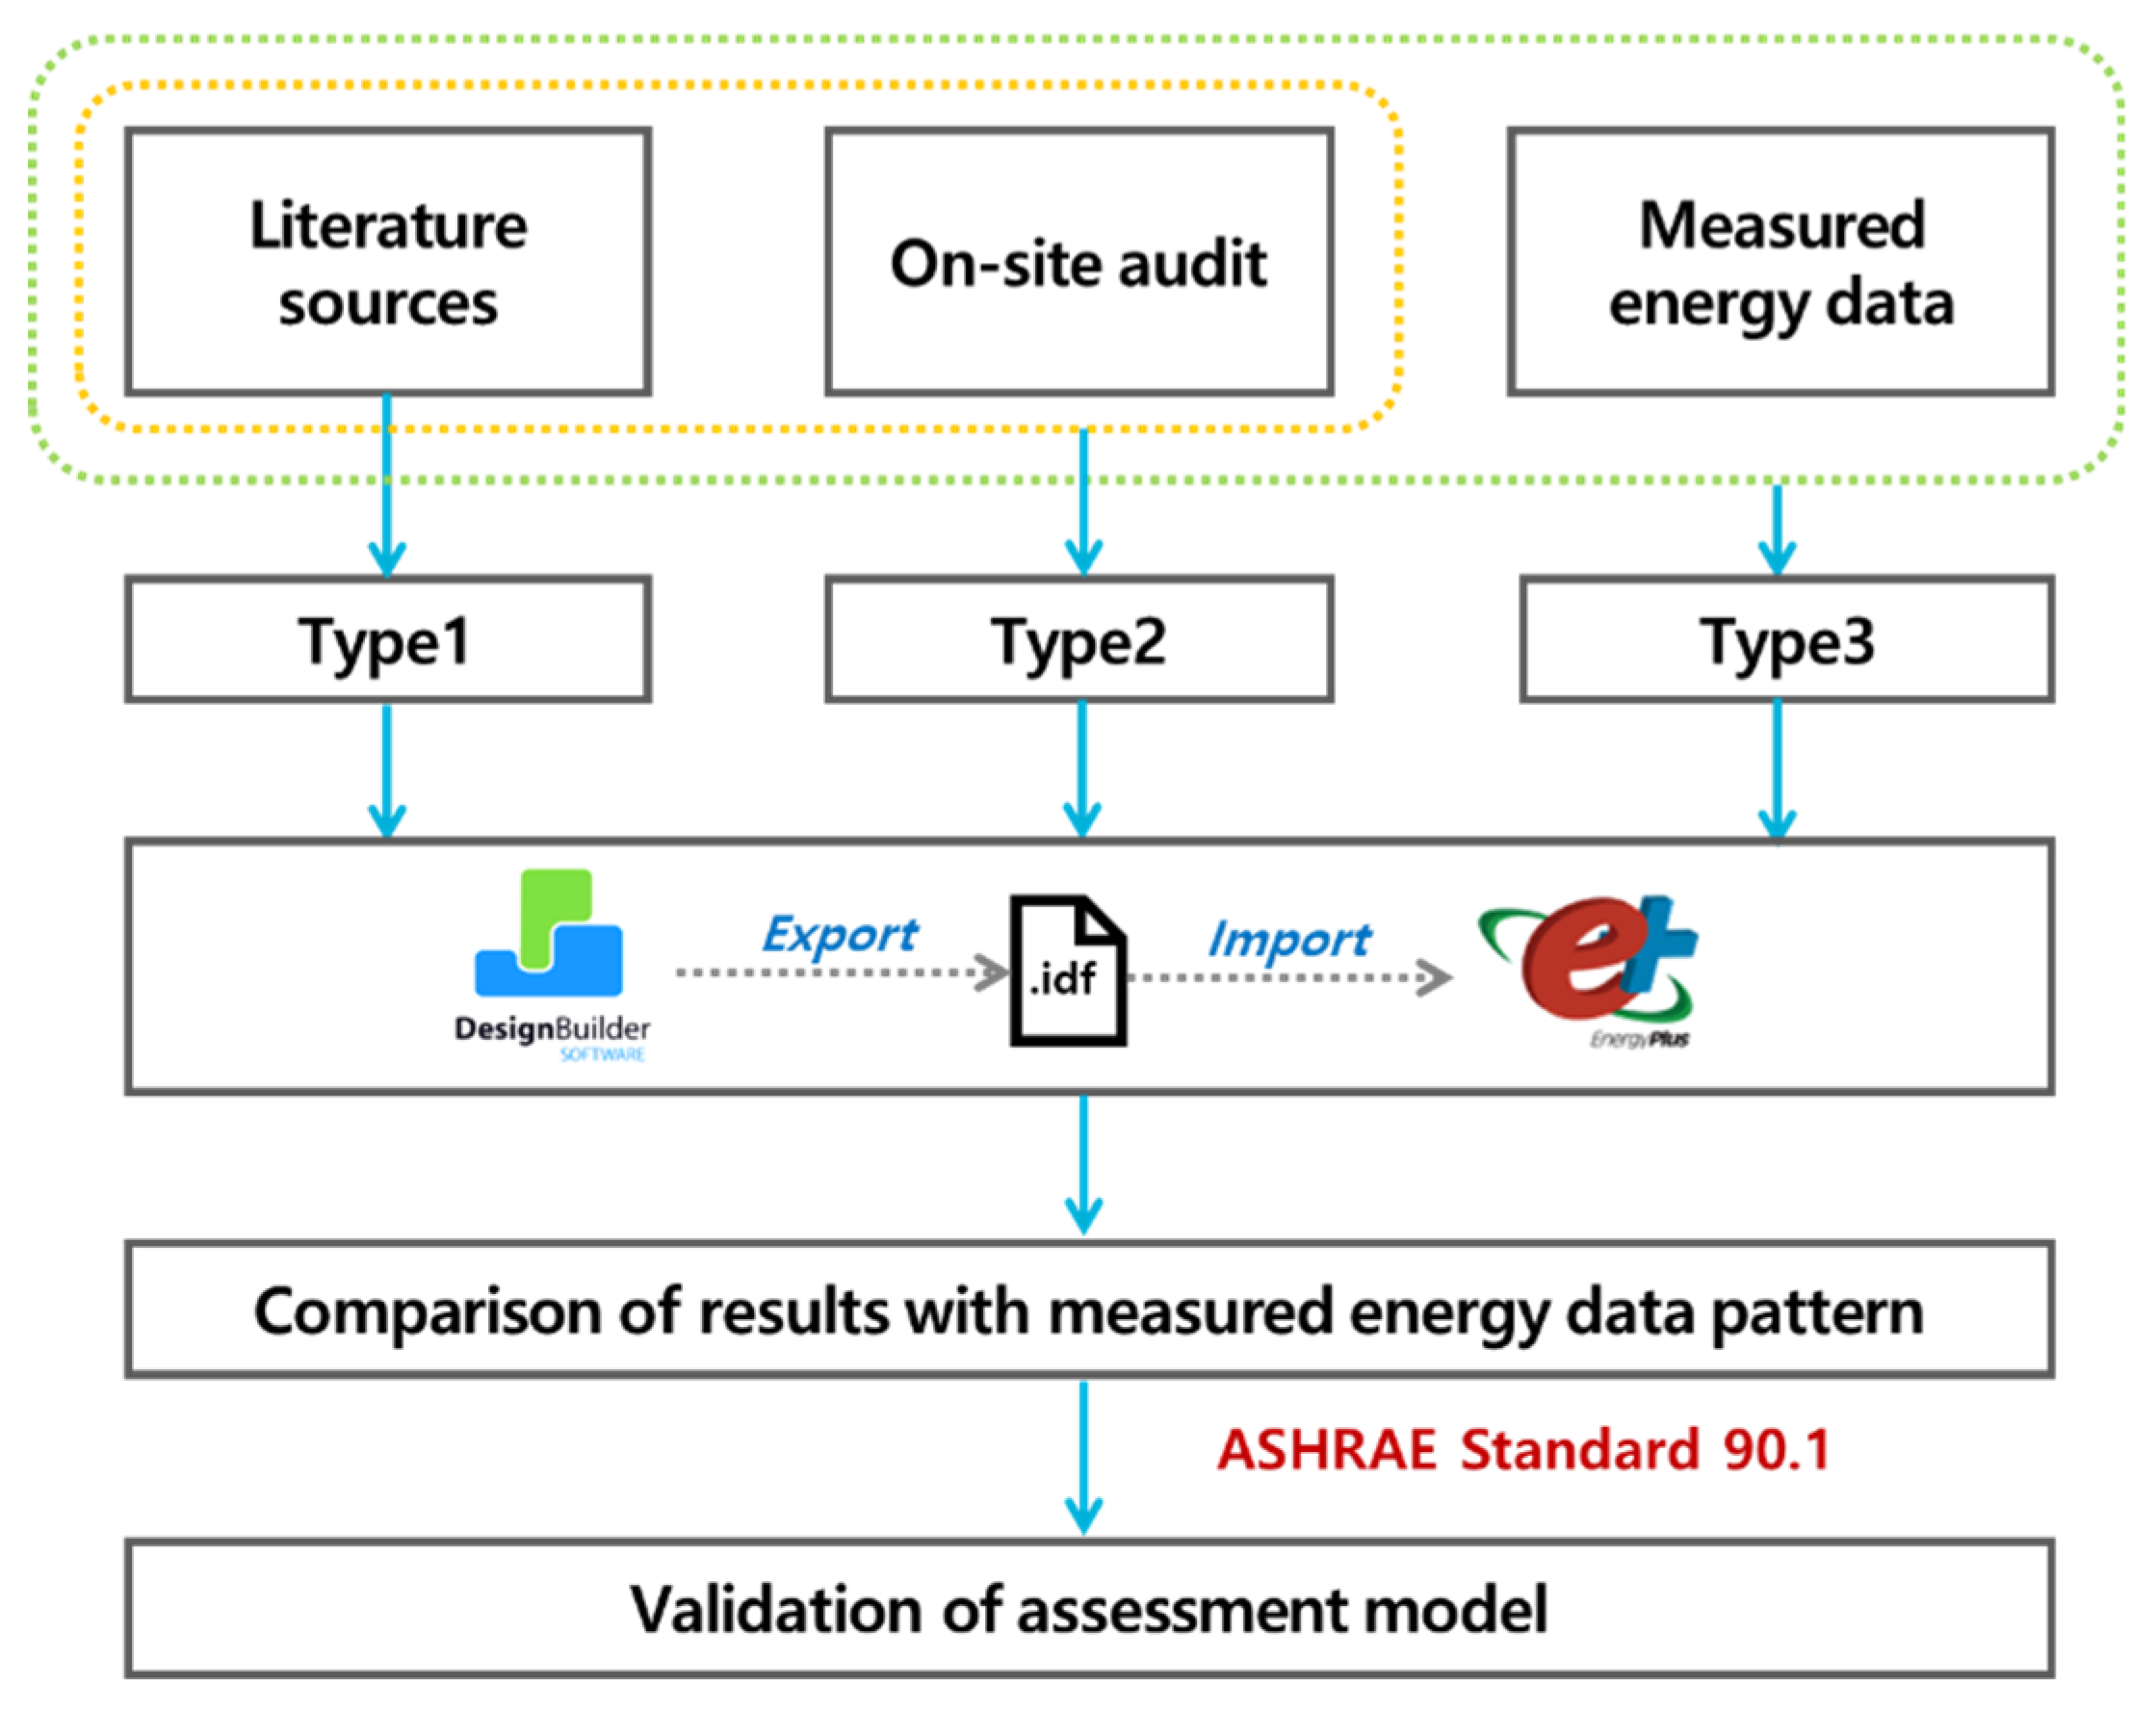
The demonstration assessment consists of the following four stages as shown in
Figure 2; review the literature sources, conduct the on-site audit, analyze measured energy data, and assess the case buildings and conduct validation.
First, based on currently available building data, we figure out the data to be collected through an on-site audit. Then, we conduct the on-site audit to acquire the actual physical deterioration and operation data of the case buildings. Next, we analyze the measured energy data to estimate the actual features (physical characteristics and operation) of case buildings. Each type of assessment method can be summarized as follows: for Type 1, based on technical documents (as-built drawings and specifications), we assessed case buildings by referring to literature sources under standard operating and occupancy conditions. For Type 2, we additionally acquired actual building data (operation schedule, indoor temperature set-points, and lighting density, etc.,) through on-site audits. Wall U-values of case buildings were measured by using TESTO 435 instrumentation (thermal transmittance) and the energy performance of windows was identified by using GC3000 (a low-e coating detector). Based on additionally collected data, we assessed case buildings by considering actual building conditions. For Type 3, we estimate the envelope performance of case building based on analysis of monthly measured energy data compared by outdoor temperature, as well as, we figure out the influential parameters of the case buildings depending on the simulated and measured energy use patterns. The selection of the parameters was dependent upon the specific characteristics of the energy use pattern.
The type of available data in most of the existing buildings is not the hourly energy consumption data from a sub-metering system but rather the total energy consumption data, which was provided on a monthly basis through utility bills. Therefore, we utilized the Change Point Model of the ASHRAE [
26,
43] to divide the monthly measured energy data into heating load, cooling load, and base load. And then, we estimated the envelope performance of case buildings according to the outdoor temperature. In this study, the actual weather data were converted to fit the simulation file by using the Meteonorm program. DesignBuilder (version 4.7) and EnergyPlus (version 8.3) were used as simulation tools.
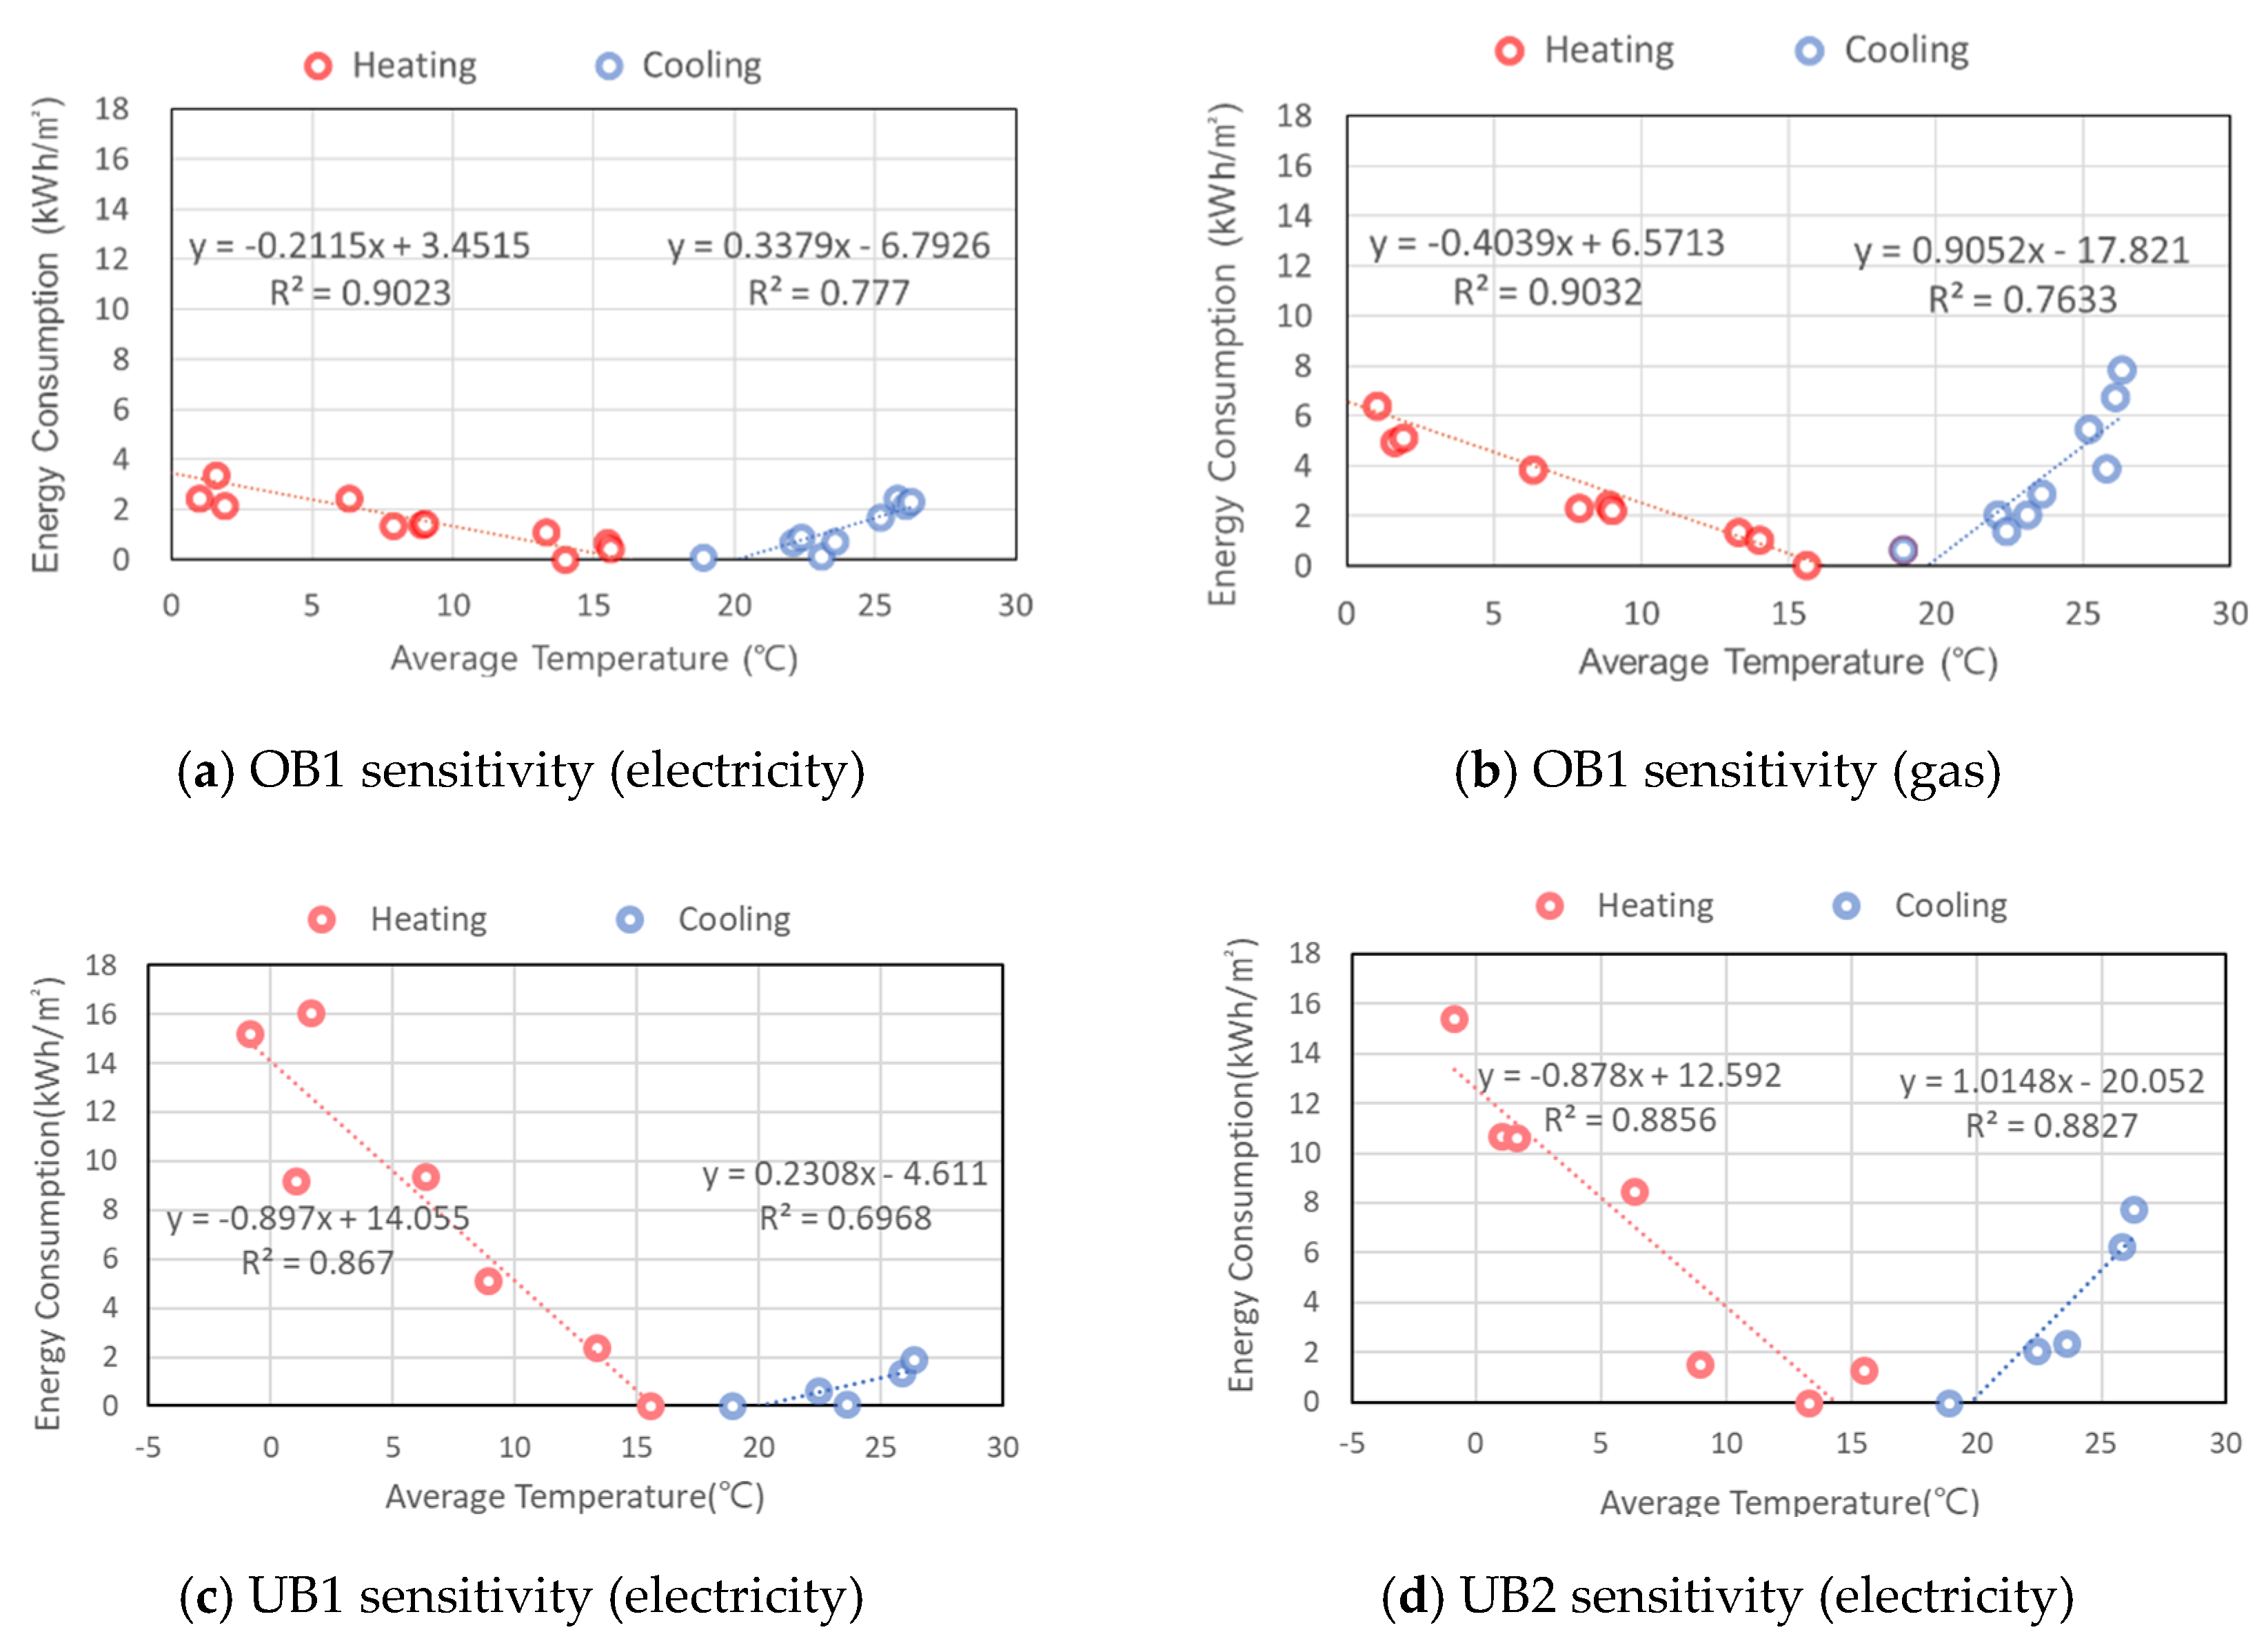
3.3. Overall Analysis of Measured Energy Data
Figure 3 shows the heating and cooling sensitivity of each building calculated by the Change Point Model. In OB1, the measured electricity data had a –0.2 of heating sensitivity and 0.3 of cooling sensitivity, while the gas energy consumption had a –0.4 heating sensitivity and 0.9 cooling sensitivity. Although OB1 had the same thermal performance across the entire envelope, there was a difference in heating and cooling sensitivity depending on the HVAC system operating in each room. It was found that the room cooled by gas energy presented different operating conditions from that operated by electricity. In order to identify the cause, we decided to conduct an interview with the facility manager in a site audit.
UB1 had a –0.89 of heating sensitivity and 0.23 of cooling sensitivity. Although the thermal performance of exterior walls on UB1 was supplemented in 2012, the building still consumed high heating energy in winter and low cooling energy in summer. This may be because the relatively less airtightness of the building caused infiltration. We considered that for UB1 we should be verify the thermal performance of the actual building from an on-site audit the envelope and check the heating operation schedule.
UB2 had a –0.88 of heating sensitivity and 1.0 of cooling sensitivity. UB2 was mainly used as a laboratory and experimental facility where the equipment generated large heat loads, and thus, it was estimated that the HVAC system was being continually operated to maintain a proper indoor environment. Besides, as this building had been used since 1979 without retrofitting, except for a change in the heating and cooling system, the performance of the envelope has been degraded considerably as a result of deterioration. Accordingly, we estimated that the physical performance of UB2 is very low, and determined that envelope performance of UB2 should be confirmed during an on-site audit.
3.4. Application of the Methodologies
For Type 1 assessment, the OB1 was assessed based on the as-built technical documents (drawings and specifications). The HVAC system type was identified from mechanical drawings and the indoor temperature set-point was checked based on the public office’s operation manual. For Type 2 assessment, an on-site audit was conducted including visual inspection and interview with a facility manager. Indoor temperature set-point, lighting and occupancy density of each room were checked by visual inspection. Through an interview with a facility manager, it was found that the users of the community center, such as the fitness center and library, can change the indoor temperature set-point for their comfort. Based on collected data from on-site audit, we modified the indoor temperature set-point value of OB1 by the type of HVAC system, building operating schedule, lighting and people density, etc. For Type 3 assessment, simulated and measured energy patterns were analyzed to collect additional influential input parameters of OB1. In principle, the operating schedule of the HVAC system should be collected by on-site audits of Type 2 assessment, but there were no heating and cooling operating schedule records, therefore, the HVAC operating schedules were modified based on an analysis of the energy use patterns.
For Type1 assessment, the thermal transmittance of the envelope of UB1 and UB2 were determined from [
42]. For Type 2 assessment, we identified the lighting density, occupancy schedule, and indoor temperature set-point of each room. Thermal transmittance was measured using a TESTO 435 instrument in order to include the actual thermal performance of the envelope in the assessment. The lighting density was investigated at each room, and information on the indoor temperature set-point and occupant schedule was obtained from interviews with a facility manager and occupants. For Type 3 assessment, we estimated airtightness based on the analysis results of measured energy data and calibrated infiltration rates. In principle, the airtightness of building can be verified by a blower test, but in order to minimize interference with the work of students and faculty, in this study, we estimated infiltration through analysis of energy consumption patterns.
Table 7,
Table 8 and
Table 9 present the input data that were utilized to consider the changes of energy performance in each type of actual building.
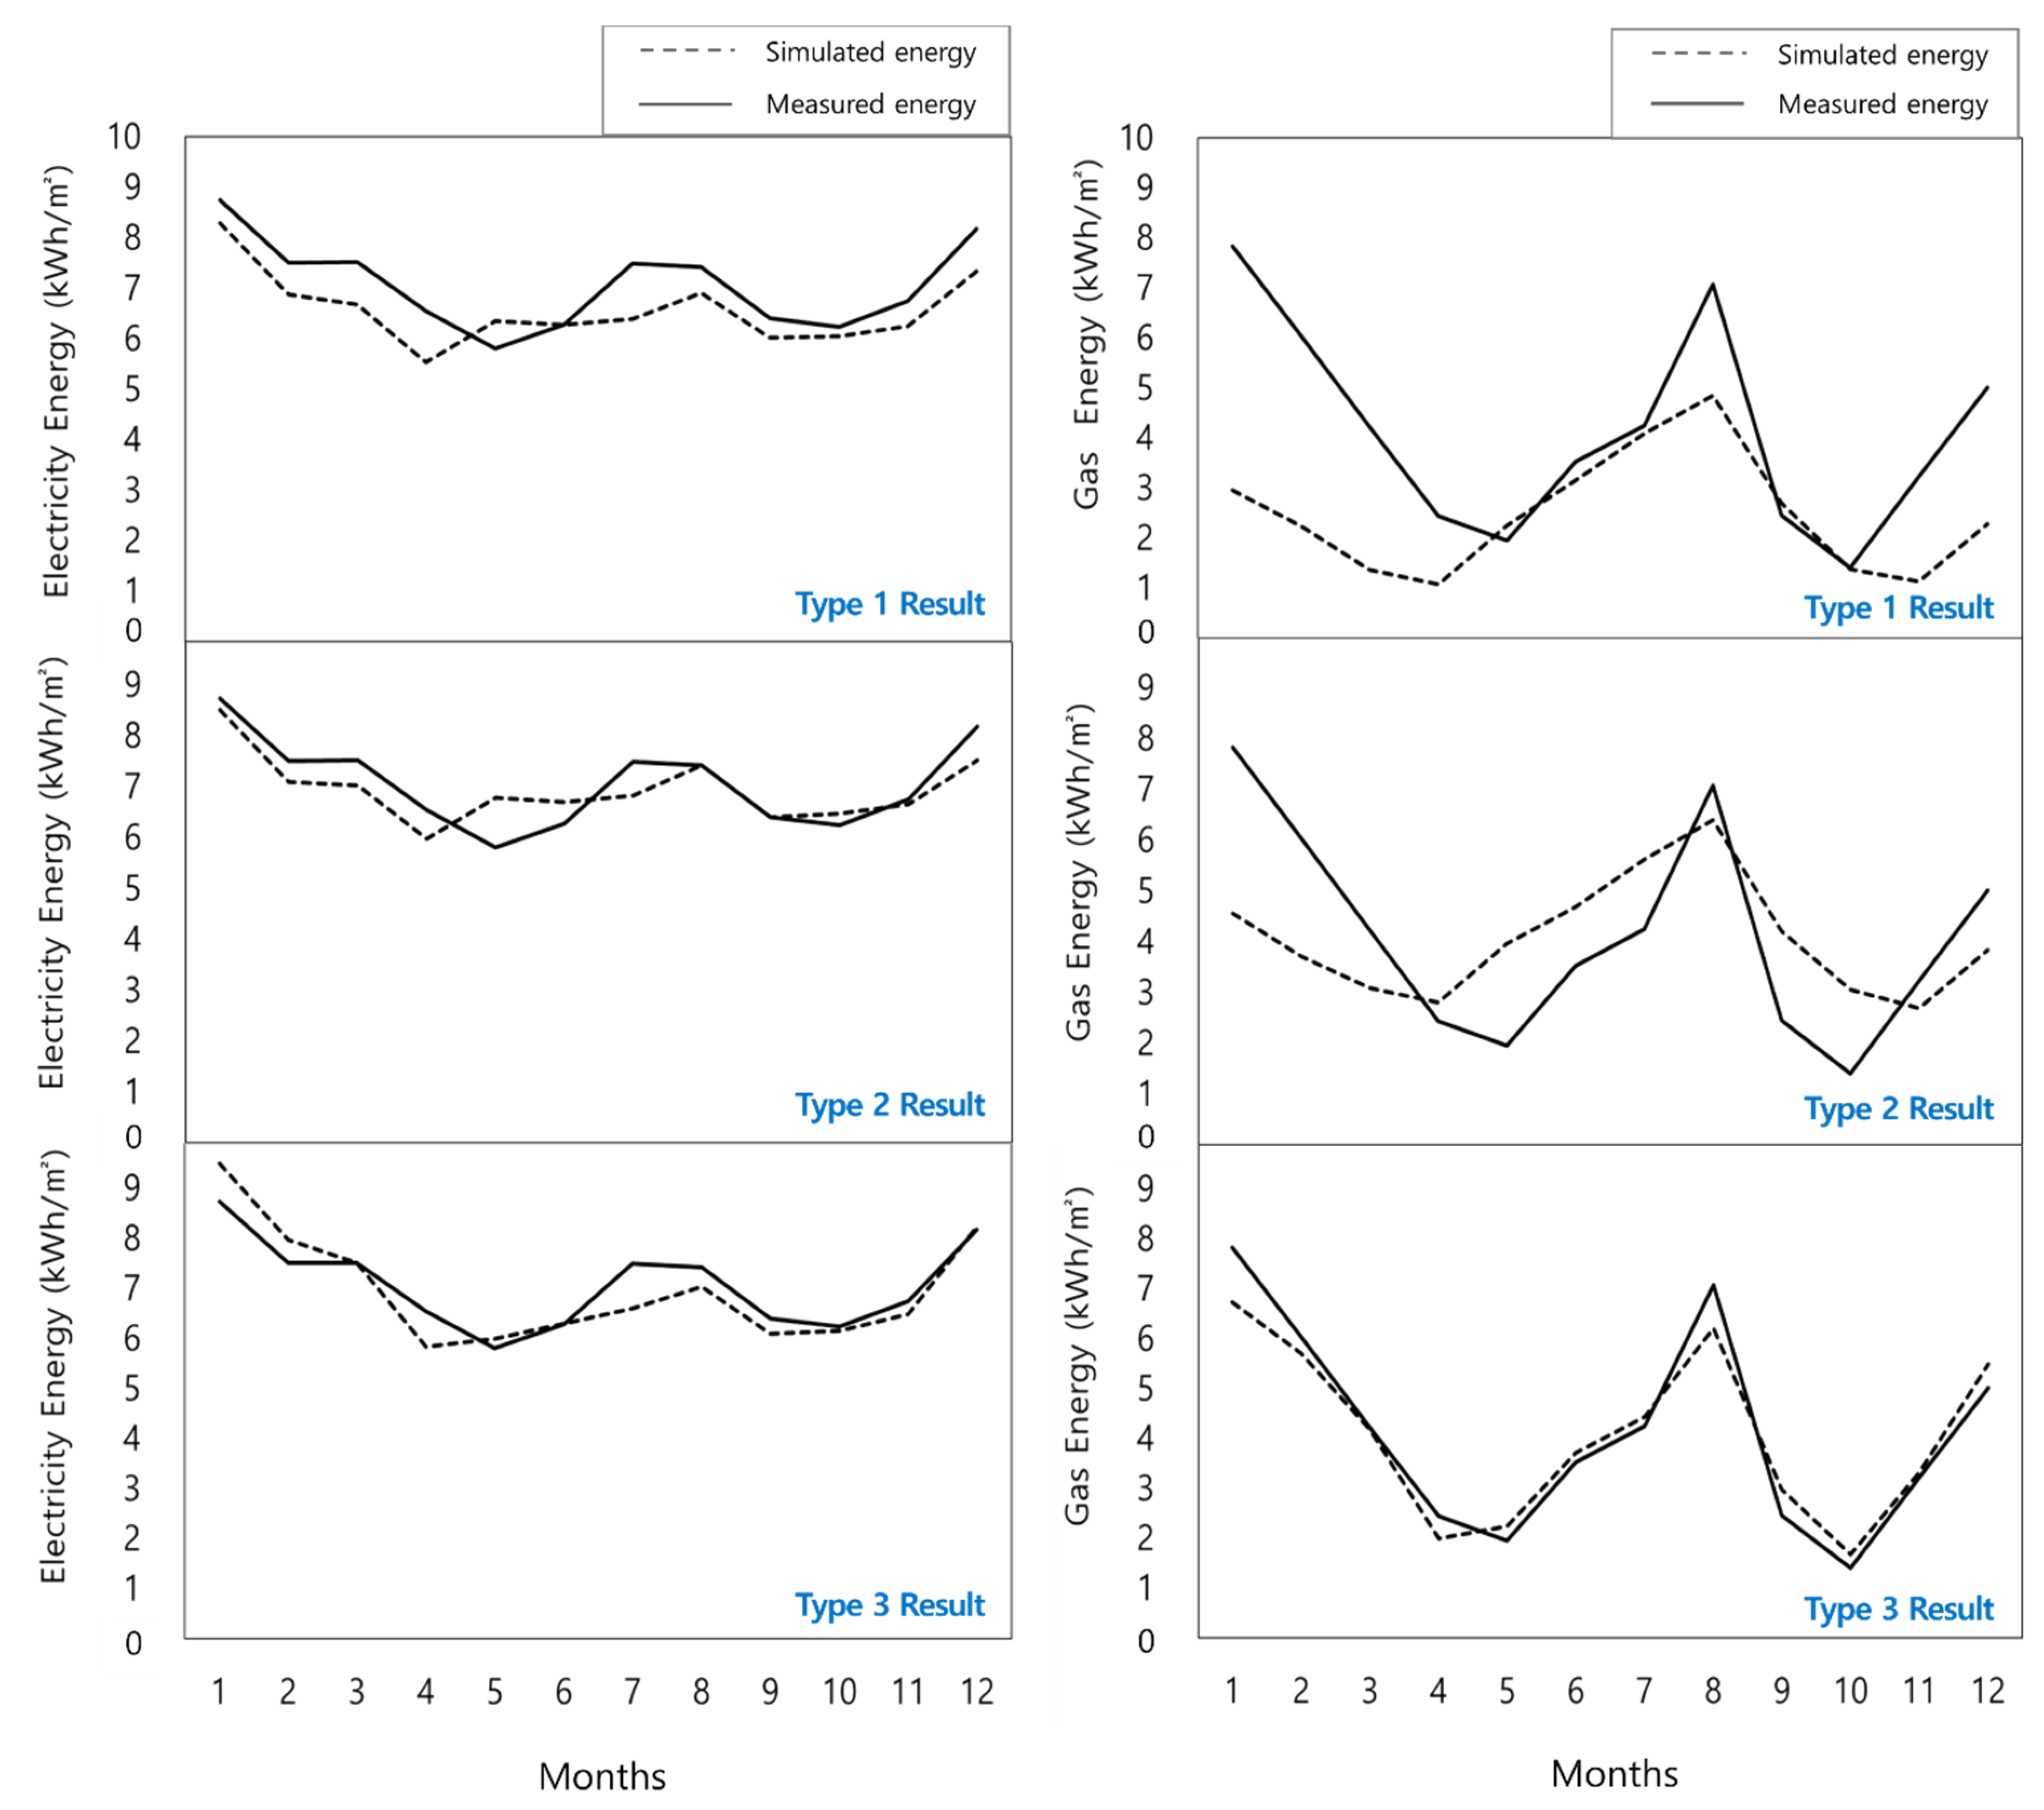
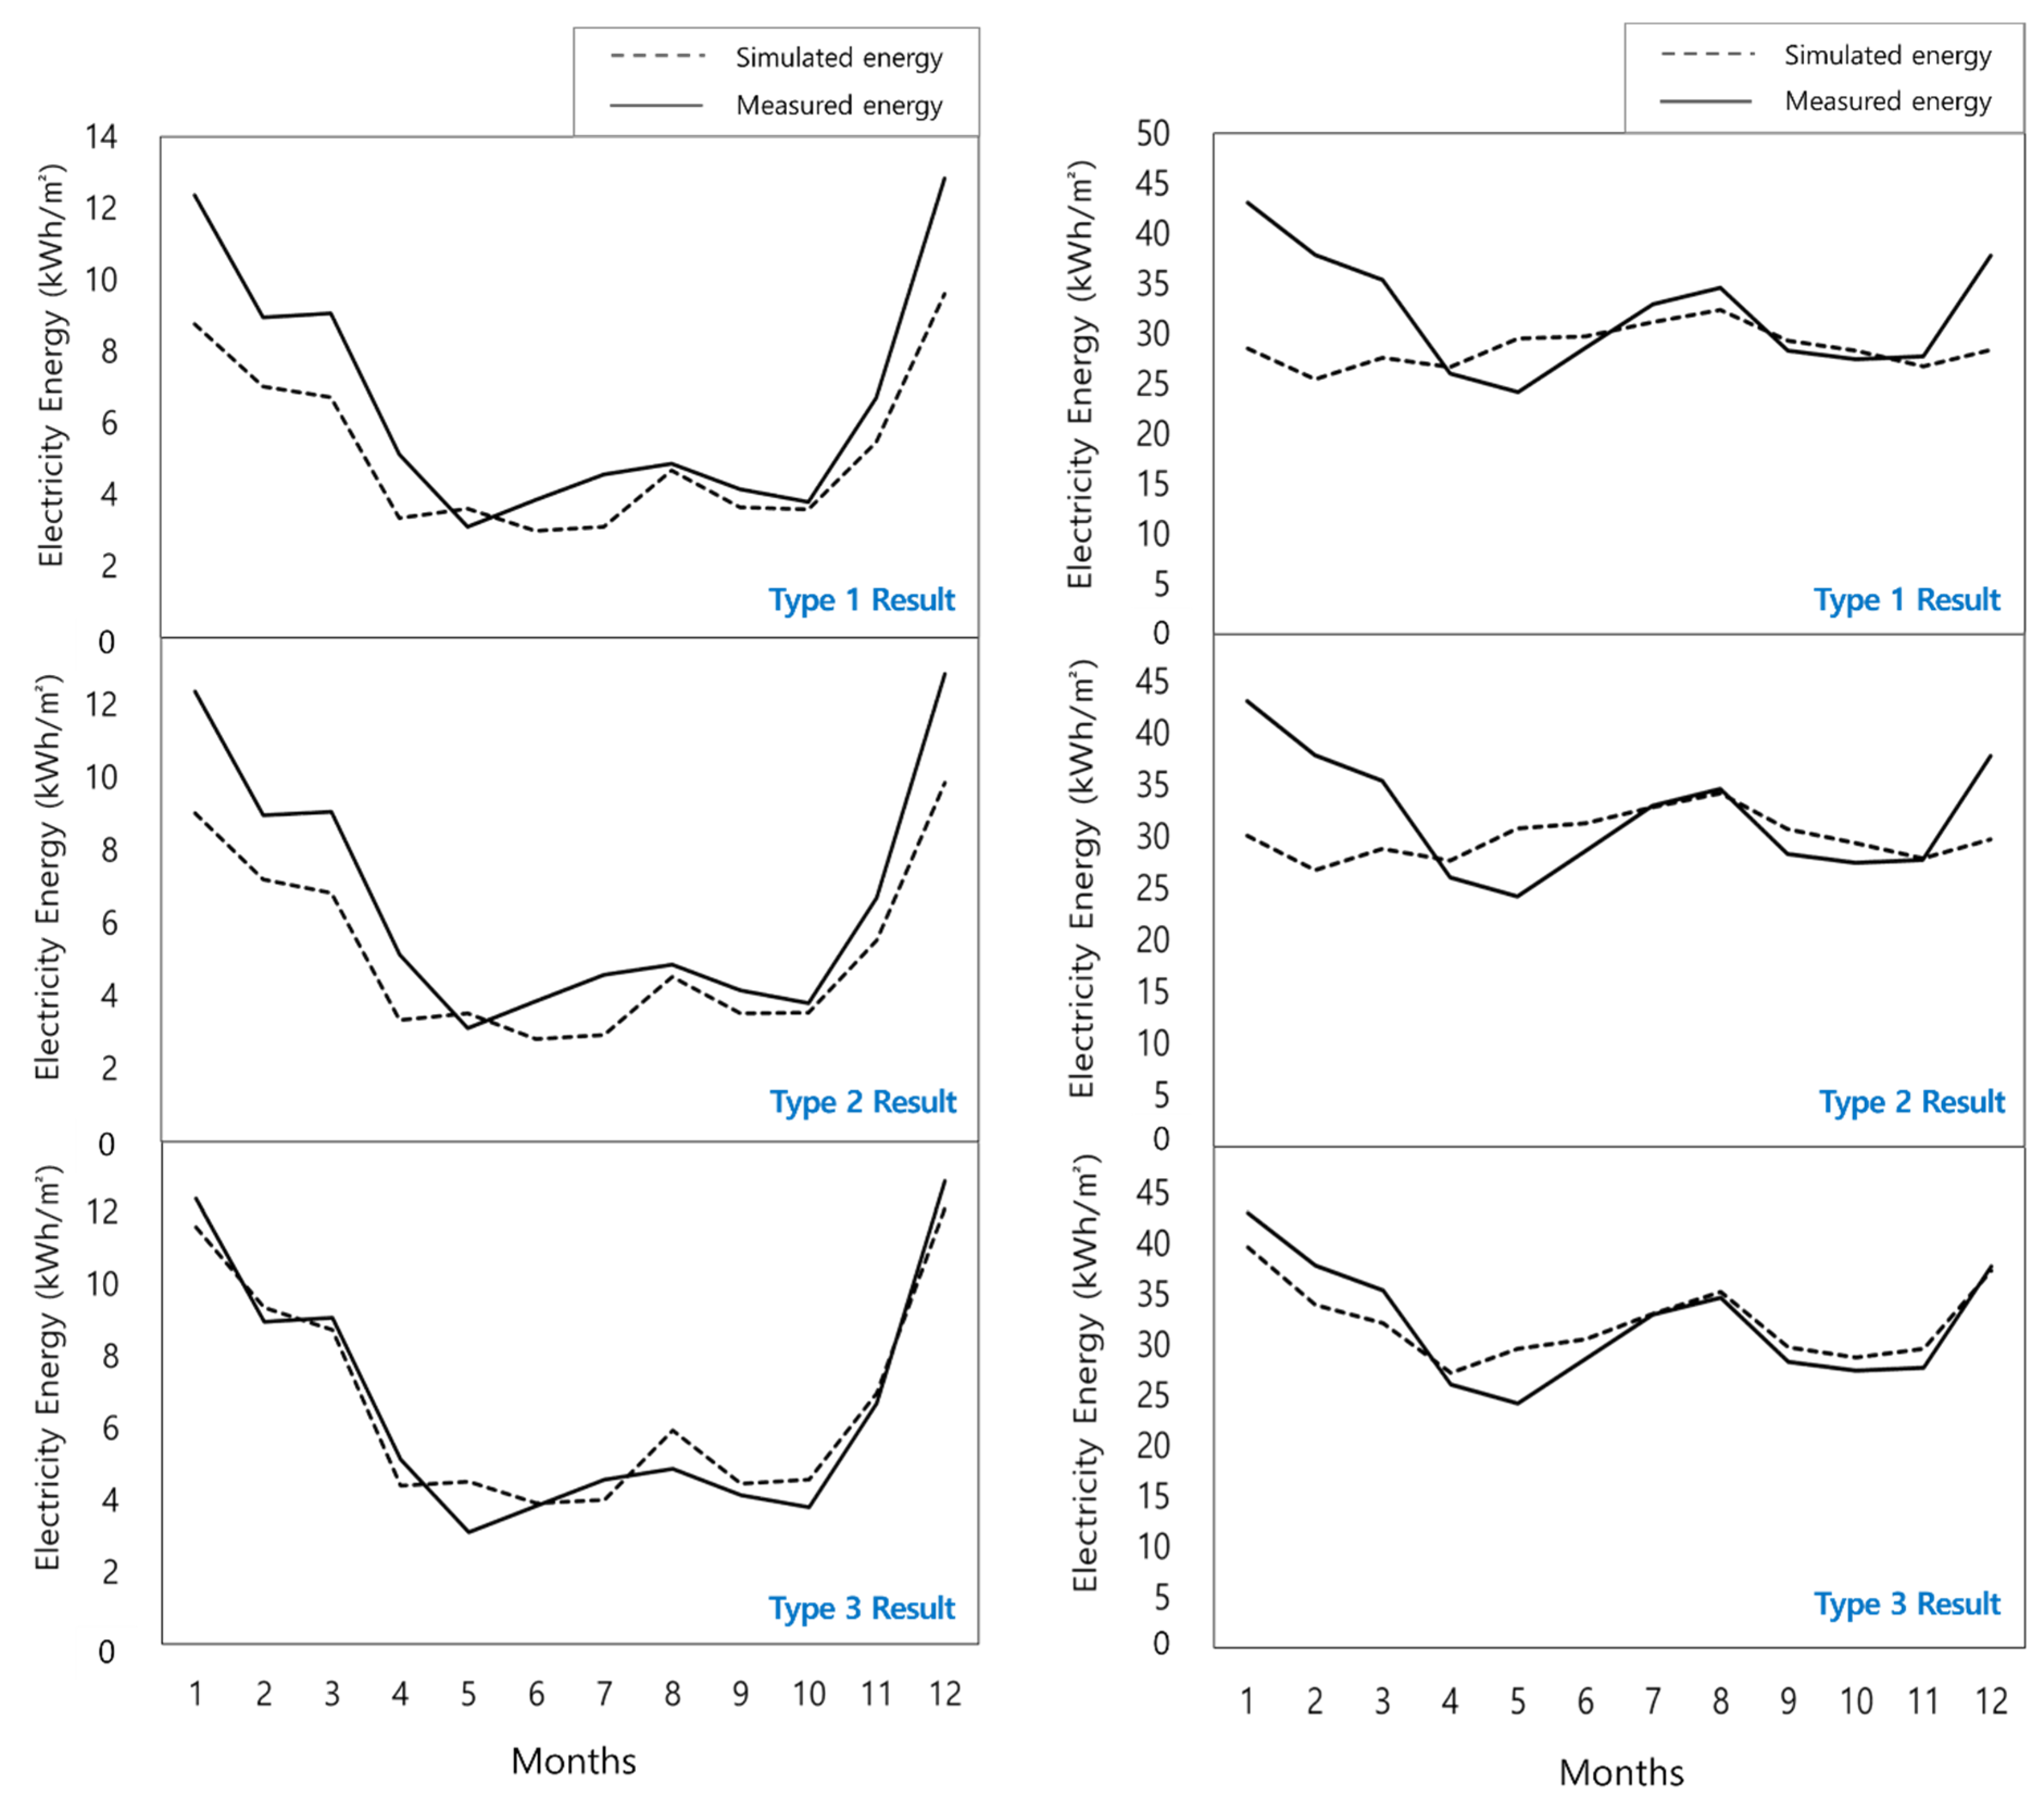
A comparative analysis was then conducted with the simulated results of each type and the measured results. In this demonstration assessment, the result of model Type 3 shows the most similar result with the measured energy patterns, since this model was best considered the degraded physical performance of actual buildings and various use characteristics. Therefore, it seems that accuracy of simulated result depends on how many influential parameters of the case building were included in simulation model input.
Figure 4 and
Figure 5 show the comparison of the simulated and measured energy consumption.
The results were verified by using as acceptance criteria the normalized mean bias error (NMBE) and coefficient of variation of the root mean square error (CVRMSE) from ASHRAE guideline 14 [
43]. If the NMBE is less than 5% and the CVRMSE is less than 15% for the simulation results, the model calibration is finished and the model is considered calibrated.
Table 10 shows the resulting NMBE and CVRMSE for the electricity and gas profiles after each tuning step.
4. Discussion
In Type 1 assessment of OB1, the indoor temperature set-point was modified based on the public office’s operation manual. In Type 2, the indoor temperature set-point, operating schedule, lighting density, people density, and hot water were tuned from the on-site audit but the CVRMSE value for gas energy exceeded the criteria. In Type 3, the infiltration rate in the main entrance was modified to consider the frequent entry and exit of occupants for customer service, also, the HVAC operation schedule during cooling and heating periods was modified based on an analysis of energy patterns. Since schedules have a large impact on energy consumption but are difficult to adjust, the pattern-based calibration method was used. As a result, the error rate at CVRMSE met the criteria. OB1, which was constructed in 2013, showed good physical performance, but the actual operation hours and the change of indoor temperature setting caused the measured energy to exceed the predicted energy calculated at the design stage. We identified the actual building room temperature and operating hours through an interview with the facility manager. In addition, lighting density was calculated by visual inspection. In addition, the actual amount of hot water was calculated by acquiring water usage information. Accordingly, the operation and maintenance of this building needs to be monitored to reduce the energy consumption of the building.
For Type 1, 2, and 3 assessments of UB1 and UB2, the error rate between the simulated and measured energy result was calculated. Even though the exterior wall U-value, the indoor temperature set-points, and lighting density were modified, the Type 2 model did not meet the NMBE and CVRMSE criteria. Accordingly, the infiltration rate was modified to reduce the differences at peak load based on analysis of energy pattern. As a result, Type 3 model of UB1 and UB2 met the validation criteria. Since UB1 is used intermittently during university vacation periods, it had much less energy consumption than the office building. However, the analysis of energy consumption patterns according to the outdoor temperature showed that more energy was consumed during the winter season. Although, UB1 recently improved the thermal performance of the exterior wall from additional insulation work, we identified that heating sensitivity is still high in an analysis of measured energy data, so we considered that the exterior wall has low airtightness due to the fact the airtightness was not complemented. Therefore, we found out that airtightness work might be necessary to decrease the heating load in UB1. UB2 is an old building that was built more than 30 years ago, and its physical performance is very low. The building is mainly used as an experimental facility, and equipment loads represent most of the energy consumption. Also, UB2 has been used with no performed maintenance or repair work. Accordingly, in UB2, the operation system of this building needs to be examined by considering the issues related to physical performance and use characteristics.
5. Conclusions
Improvements in physical performance represent a fundamental strategy for increasing the energy efficiency of existing buildings. In order to enhance physical performance, the current performance needs to be assessed and potential measures for energy reduction need to be investigated. However, existing buildings often lack sufficient data for such analysis because of problems related to degraded performance, data loss, and so forth. In this study, we investigated an alternative assessment method for existing buildings on the basis of a literature review. Then, we classified assessment procedures according to data acquisition level. The first type is a simple assessment method that requires minimal resources in terms of costs and time, and it is implemented by assessing buildings based on only technical documents and literature sources. The second type includes on-site audits in addition to the above steps, and it makes an assessment based on information about the operation and occupancy conditions of a real building. The third type additionally utilizes energy consumption data to estimate building performance. This method can be very useful when insufficient data are collected from literature sources and auditing work.
The proposed comprehensive method in this research is based upon data acquisition level instead of the uniform methods that have been previously used. We then conducted a demonstration assessment of an office building (OB1) and university buildings (UB1, UB2) in order to examine the applicability of the proposed method. OB1 is a recently built building that includes a local community center, so the characteristics of this building reflected not only the office facility but also the user mode of occupants. Accordingly, despite its good performance, the operation hours for the heating and cooling system and the indoor temperature setting of each room increased the actual energy consumption, which was computed on a monthly basis. UB1 is a lecture and research facility. It has a high occupancy density during the school semesters, whereas the use rate of the building is relatively low during vacation periods. Thus, the energy consumption was not as high as the office facility. In addition, UB1 had extension and remodeling work performed in 2012, where additional insulation work was conducted and LED lights were installed, which increased the energy performance to a good level. UB2 is an old building that was built more than 30 years ago. It is mainly used as a laboratory and experimental facility. In some experimental situations, the building was operated for 24 h, and lack of maintenance caused the energy consumption to be significantly higher than that of the other types of buildings. Moreover, along with the long operation times, the degradation of physical performance due to deterioration seemed to be a primary contributing factor for the increased energy consumption.
In general, this work demonstrated that energy performance assessments of existing buildings could benefit from the consideration of data acquisition level. The proposed methodologies, which has been developed to promote energy performance assessments of existing buildings, can be summarized as follows:
Simplified assessment (for buildings with a similar use pattern): Type 1
Assessment for proposing a realistic alternative reflecting user characteristics: Type 2
Detailed assessment for retrofit or remodeling: Type 3
This research classified assessment methods according to data acquisition levels, and then, we conducted a demonstration assessment by applying the methods to real buildings. Only an office facility and university buildings were assessed in this research. In future research, the proposed methodology will be applied to buildings used for different purposes so that the assessment results can be evaluated in regard to their applicability to diverse building types. Since buildings are used for a long time, it is also necessary to make an appropriate maintenance plan considering the effect of life cycle on assessment of existing buildings. Energy efficiency measures will also be analyzed to decide the most cost-efficient solutions in terms of life cycle cost and energy consumptions at different life cycle stages.
Author Contributions
S.S.K. contributed to the conceptualization of this research, formal analysis, methodology, funding acquisition, supervision, investigation and writing-review and editing. K.H.C. contributed to the investigation, simulation, data curation, and writing-original draft preparation.
Funding
This research was supported by the Architecture & Urban Development Research Program funded by the Ministry of Land, Infrastructure and Transport (MOLIT) of Korea government and the Korea Agency for Infrastructure Technology Advancement (KAIA), grant number 19AUDP-B079104-06.
Acknowledgments
The authors would like to thank Myoung Souk Yeo, professor of Department of Architecture, Seoul National University for introducing and arranging the field assessment.
Conflicts of Interest
The authors declare no conflict of interest. The funders had no role in the design of the study; in the collection, analyses, or interpretation of data; in the writing of the manuscript, or in the decision to publish the results.
References
- U.S. Department of Energy. 2015 Renewable Energy Data Book; U.S. Department of Energy: Washington, DC, USA, 2015.
- European Parliament, Council of the European Union. Directive 2010/31/EU of 19 May 2010 on the Energy Performance of Buildings (Recast). Off. J. Eur. Union 2010, 18, 13–35. [Google Scholar]
- Xu, X. Model-Based Building Performance Evaluation and Diagnosis. Ph.D. Thesis, Department of Building Services Engineering, The Hong Kong Polytechnic University, Hong Kong, China, 2005. [Google Scholar]
- Claridge, D.E.; Culp, C.H.; Liu, M.; Song, D.; Turner, W.D.; Haberl, J.S. Campus-wide continuous commissioning of university buildings. In Proceedings of the ACEEE Summer Study on Energy Efficiency in Buildings, Pacific Grove, CA, USA, 20–25 August 2000; pp. 3.101–3.112. [Google Scholar]
- Mazzarella, L. Energy retrofit of historic and existing buildings. The legislative and regulatory point of view. Energy Build. 2015, 95, 23–31. [Google Scholar] [CrossRef]
- Wang, S.; Yan, C.; Xiao, F. Quantitative energy performance assessment methods for existing buildings. Energy Build. 2012, 55, 873–888. [Google Scholar] [CrossRef]
- McKinsey, Co. Unlocking Energy Efficiency in the U.S. Economy; McKinsey & Co.: New York, NY, USA, 2009. [Google Scholar]
- Chidiac, S.E.; Catania, E.J.C.; Morofsky, E.; Foo, S. Effectiveness of single and multiple energy retrofit measures on the energy consumption of office buildings. Energy 2011, 36, 5037–5052. [Google Scholar] [CrossRef]
- Koomey, J.G.; Martin, N.C.; Brown, M.; Price, L.K.; Levine, M.D. Costs of reducing carbon emissions: US building sector scenarios. Energy Policy 1998, 26, 433–440. [Google Scholar] [CrossRef]
- Ma, Z.; Cooper, P.; Daly, D.; Ledo, L. Existing building retrofits: Methodology and state-of-the-art. Energy Build. 2012, 55, 889–902. [Google Scholar] [CrossRef]
- Reddy, T.A. Literature review on calibration of building energy simulation programs: Uses, problems, procedures, uncertainty and tools. ASHRAE Trans. 2006, 112, 226–240. [Google Scholar]
- Bertagnolio, S. Evidence-Based Model Calibration for Efficient Building Energy Services. Ph.D. Thesis, University of Liège, Liège, Belgium, 2012. [Google Scholar]
- Fabrizio, E.; Monetti, B. Methodologies and Advancements in the Calibration of Building. Energies 2015, 8, 2548–2574. [Google Scholar] [CrossRef]
- Touloupaki, E.; Theodosiou, T. Performance Simulation Integrated in Parametric 3D Modeling as a Method for Early Stage Design Optimization-A Review. Energies 2017, 10, 637. [Google Scholar] [CrossRef]
- Kontokosta, C.E. Modeling the energy retrofit decision in commercial office buildings. Energy Build. 2016, 131, 1–20. [Google Scholar] [CrossRef]
- Ardente, F.; Beccali, M.; Cellura, M.; Mistretta, M. Energy and environmental benefits in public buildings as a result of retrofit actions. Renew. Sustain. Energy Rev. 2011, 15, 460–470. [Google Scholar] [CrossRef]
- Vásquez-Hernández, A.; Álvarez, M. Evaluation of buildings in real conditions of use: Current situation. J. Build. Eng. 2017, 12, 26–36. [Google Scholar] [CrossRef]
- Meiss, A.; Padilla-Marcos, M.A.; Feijó-Muñoz, J. Methodology applied to the evaluation of natural ventilation in residential building retrofits: A case study. Energies 2017, 10, 456. [Google Scholar] [CrossRef]
- Biserni, C.; Valdiserri, P.; D’Orazion, D.; Garai, M. Energy retrofitting strategies and economic assessments: The case study of a residential complex using utility bills. Energies 2018, 11, 2055. [Google Scholar] [CrossRef]
- Coccagna, M.; Cesari, S.; VAldiserri, P.; Romio, P. Impact of morphological and functional features on hospitals’ energy consumption: A comparative analysis of six case studies. WSEAS Trans. Environ. Dev. 2018, 14, 212–225. [Google Scholar]
- Ballarini, I.; De Luca, G.; Paragamyan, A.; Pellegrino, A.; Corrado, V. Transformation of an office building into a nearly zero energy building (nZEB): Implications for thermal and visual comfort and energy performance. Energies 2019, 12, 895. [Google Scholar] [CrossRef]
- Brady, L.; Abdellatif, M. Assessment of energy consumption in existing buildings. Energy Build. 2017, 149, 142–150. [Google Scholar] [CrossRef]
- Kaewunruen, S.; Rungskunroch, P.; Welsh, J. A digital-twin evaluation of net zero energy building for existing buildings. Sustainability 2019, 11, 159. [Google Scholar] [CrossRef]
- Moghimi, S.; Azizpour, F.; Mat, S.; Lim, C.H.; Salleh, E.; Sopian, K. Building energy index and end-use energy analysis in large-scale hospitals-case study in Malaysia. Energy Effic. 2014, 7, 243–256. [Google Scholar] [CrossRef]
- Borgstein, E.H.; Lamberts, R.; Hensen, J.L.M. Evaluation energy performance in non-domestic buildings: A review. Energy Build. 2016, 128, 734–755. [Google Scholar] [CrossRef]
- Marta, M.; Belinda, L. Simplified model to determine the energy demand of existing buildings. Case study of social housing in Zaragoza, Spain. Energy Build. 2017, 149, 483–493. [Google Scholar] [CrossRef]
- Sun, K.; Hong, T.; Taylor-Lange, S.C.; Piette, M.A. A pattern-based automated approach to building energy model calibration. Appl. Energy 2016, 165, 214–224. [Google Scholar] [CrossRef]
- Park, D.; Yu, K.; Yoon, Y.; Kim, K.; Kim, S. Analysis of a building energy efficiency certification system in Korea. Sustainability 2015, 7, 16086–16107. [Google Scholar] [CrossRef]
- Dascalaki, E.G.; Droutsa, K.; Gaglia, A.G.; Kontoyiannidis, S.; Balaras, C.A. Data collection and analysis of the building stock and its energy performance—An example for Hellenic buildings. Energy Build. 2010, 42, 1231–1237. [Google Scholar] [CrossRef]
- Building Research Establishment. The Government’s Standard Assessment Procedure for Energy Rating of Dwellings 2009 edition; Building Research Establishment: Wardford, UK, 2011. [Google Scholar]
- Building Research Establishment. RdSAP Conventions for RdSAP 9.92; Building Research Establishment: Wardford, UK, 2015. [Google Scholar]
- Jenkins, D.; Simpson, S.; Peacock, A. Investigating the consistency and quality of EPC ratings and Assessments. Energy 2017, 138, 480–489. [Google Scholar] [CrossRef]
- Kelly, S.; Crawford-Brown, D.; Pollitt, M.G. Building performance evaluation and certification in the UK: Is SAP fit for purpose? Renew. Sustain. Energy Rev. 2012, 16, 6861–6878. [Google Scholar] [CrossRef]
- Mata, E.; Kalagasidis, A.S.; Johnsson, F. Building-stock aggregation through archetype buildings: France, Germany, Spain and the UK. Build. Environ. 2014, 81, 270–282. [Google Scholar] [CrossRef]
- Buessler, S.; Badariotti, D.; Weber, C. Evaluating the complex governance arrangements surrounding energy retrofitting programs: The case of collective ownership buildings in France. Energy Res. Soc. Sci. 2017, 32, 131–148. [Google Scholar] [CrossRef]
- Ministère de l’emploi, de la cohésion sociale et du logement. Annexe 1. Méthode 3CL-DPE. In Arrêté du 9 novembre 2006 portant approbation de diverses méthodes de calcul pour le diagnostic de performance énergétique en France métropolitaine; Ministère de l’emploi, de la cohésion sociale et du logement: Paris, France, 2006. [Google Scholar]
- Bordier, R.; Rezaï, N.; Gachon, C. Concerted Action Energy Performance of Buildings—Implementation of the EPBD in France. 2016. Available online: https://www.epbd-ca.eu/ca-outcomes/outcomes-2015-2018/book-2018/countries/france (accessed on 18 March 2019).
- Schettler-Köhler, H.; Ahlke, I. Concerted Action Energy Performance of Buildings—Implementation of the EPBD in Germany. 2016. Available online: https://www.epbd-ca.eu/ca-outcomes/outcomes-2015-2018/book-2018/countries/germany (accessed on 18 March 2019).
- Pacific Northwest National Laboratory. Building Energy Asset Score Program Overview and Technical Protocol, version 1.2; Pacific Northwest National Laboratory: Richland, WA, USA, 2015.
- Hong, T.; Piette, M.A.; Chen, Y.; Lee, S.; Taylor-Lange, S.C.; Zhang, R.; Sun, K.; Price, P. Commercial building energy saver: An energy retrofit analysis toolkit. Appl. Energy 2015, 159, 298–309. [Google Scholar] [CrossRef]
- Lee, S.; Hong, T.; Piette, M.A.; Taylor-Lange, S.C. Energy retrofit analysis toolkits for commercial buildings: A review. Energy 2015, 89, 1087–1100. [Google Scholar] [CrossRef]
- Ryu, S.; Ryu, J.; Hong, W. A study on timing estimation for the thermal insulation remodeling by analyzing annual variation of exterior walls thermal insulation performance in public buildings. J. Archit. Inst. Korea 2015, 31, 163–171. [Google Scholar]
- American Society of Heating, Refrigeration, and Air Conditioning Engineers Inc. ASHRAE Guideline 14, Measurement of Energy and Demand Savings; ASHRAE: Atlanta, GA, USA, 2002. [Google Scholar]
© 2019 by the authors. Licensee MDPI, Basel, Switzerland. This article is an open access article distributed under the terms and conditions of the Creative Commons Attribution (CC BY) license (http://creativecommons.org/licenses/by/4.0/).


