Article

Implementation of Optimal Two-Stage Scheduling of Energy Storage System Based on Big-Data-Driven Forecasting—An Actual Case Study in a Campus Microgrid

Department of Electrical Engineering, Pohang University of Science and Technology (POSTECH), Pohang, Gyungbuk 37673, Korea
*
Author to whom correspondence should be addressed.
Energies 2019, 12(6), 1124; https://doi.org/10.3390/en12061124
Submission received: 15 February 2019 / Revised: 14 March 2019 / Accepted: 19 March 2019 / Published: 22 March 2019
(This article belongs to the Section A1: Smart Grids and Microgrids)

Abstract

:
Optimal operation scheduling of energy storage systems (ESSs) has been considered as an effective way to cope with uncertainties arising in modern grid operation such as the inherent intermittency of the renewable energy sources (RESs) and load variations. This paper proposes a scheduling algorithm where ESS power inputs are optimally determined to minimize the microgrid (MG) operation cost. The proposed algorithm consists of two stages. In the first stage, hourly schedules during a day are optimized one day in advance with the objective of minimizing the operating cost. In the second stage, the optimal schedule obtained from the first stage is repeatedly updated every 5 min during the day of operation to compensate for the uncertainties in load demand and RES output power. The ESS model is developed considering operating efficiencies and then incorporated in mixed integer linear programming (MILP). Penalty functions are also considered to acquire feasible optimal solutions even under large forecasting errors in RES generation and load variation. The proposed algorithm is verified in a campus MG, implemented using ESSs and photovoltaic (PV) arrays. The field test results are obtained using open-source software and then compared with those acquired using commercial software.

1. Introduction

The concept of microgrids (MGs) and corresponding applications have drawn considerable attention from researchers over the last decades, given that it is now possible to reliably and efficiently integrate distributed energy resources (DERs) into today’s power systems [1,2]. They can integrate distributed renewable energy generation and storage capacity to meet the electrical needs of customers. They greatly enhance local power supply reliability [3]. However, many challenging issues are associated with MGs operation, the most common of which is the reliable integration of renewable energy sources (RESs), such as photovoltaic (PV) and wind turbine (WT), given their inherent variability and uncertainty in terms of power generation [4,5,6,7]. Sharp fluctuations in load demands on a MG constitute additional unpredictable variables [8,9]. However, the impact of these uncertainties can be compensated with the aid of the energy storage system (ESS) [10,11]. Optimal energy scheduling using an ESS is crucial to cope with the uncertainties of RESs and loads, and to ensure the reliable and economical operation of the MG. The MG can operate in the grid-connected and islanded modes [12,13]. MG energy management system (MEMS) successfully provides the reference signals in real time and scheduling time horizons, so that the MG operates in both modes reliably.
Single-stage approaches have been popular because they are easy to implement [14,15,16,17,18,19,20,21]. In reference [14], online optimal control strategies for ESSs was developed. The optimization problem was formulated as a robust mixed integer linear programming (MILP) problem to handle uncertainty in the forecast load demands and RESs power generation. In reference [15], a two-layer optimal dispatch model with ESSs and supercapacitors was formulated. An upper layer minimized the total operational costs, and a lower layer then mitigated load fluctuations and RES forecast errors. It demonstrated that two types of energy storage could be utilized in a hierarchical dispatch model. An execution monitoring and replanning approach for optimal 24-h dispatch considering the uncertainties in weather conditions and load profiles were developed in [16]. A multi-objective function was devised to minimize energy losses, fuel costs, and carbon dioxide emissions. However, the single-stage approaches in [14,15,16] were modeled only using numerical software.
Some studies have focused on actual-to-laboratory-scale MGs [17,18,19,20,21]. An energy management system (EMS) was proposed to minimize the overall operations costs in [17]. It considered a complete non-linear optimal power flow problem, which determined the active and reactive power injections at all network buses. It compared the solution that derived using a linearized optimal power flow problem. Optimal operation of an isolated system using a virtual power producer was proposed to minimize the generation costs and optimize battery charging/discharging in [18]. Reference [19] proposed the use of offline scheduling to minimize operating costs by using day-ahead forecast data. It focused on modeling a MG and design of an EMS. An EMS maximizing total MG profit considering the total capacities of the RESs and storage systems in terms of future expansion was developed in [20]. Reference [21] proposed the use of an EMS based on unit commitment with a rolling horizon to reduce the uncertainties of forecasting. The goal of their proposed optimization was to minimize the operational costs of the MG.
However, the day-ahead single-stage approach is vulnerable to forecasting errors and unpredictable variations in renewable power generation and load demands. Thus, the optimal operating schedule obtained using a single-stage approach may not guarantee optimal operation of an actual MG. Such issues focus attention on two-stage scheduling approaches, which are robust under forecasting errors and unpredicted changes in operation conditions [22]. Most literature on the two-stage scheduling approach has focused on simulation-level demonstrations [23,24,25,26,27,28,29]. Reference [23] addressed energy resources scheduling for the day-ahead and in real time to minimize the total operation cost of a grid-connected MG. It considered the case where all types of loads were imposed in a demand response program. In references [24,25], day-ahead scheduling determined the hourly generation schedules to minimize MG operation costs. Real-time scheduling at a time scale of 5 min allowed the MG to follow the day-ahead scheduled power exchange with the main grid. Two different time scales were applied; 1 h for cooling energy and 5 min for electrical energy. In reference [26], each stage of the two-stage scheduling was two-level. The lower level of the day-ahead scheduling module was to maximize the expected profit, and the upper level was to minimize the total cost of MG operation during the day. The second stage featured hour-ahead scheduling at 15-min intervals. The aim of the lower level of the second stage was to maximize the use of RESs when following the day-ahead schedule. The upper level of the second stage was the same as the upper level of the first stage. A two-stage robust optimization method to plan ESS charging/discharging, and direct load control (DLC) was developed to maximize the total profit of the MG in [27]. In the first stage, ESS charging/discharging power was scheduled to decrease energy purchases from the main grid, and DLC scheduling was then set 15 min earlier to complement ESS operation. In reference [28], hourly scheduling of the day-ahead optimal economic dispatch was performed to minimize the daily MG operational costs, followed by intra-hour adjustment using two layers to smooth fluctuations and follow day-ahead scheduling. In the second stage, two different dispatch time intervals were set, one for virtual energy storage system and the other for the vehicle-to-building system. In reference [29], a two-stage scheduling framework optimization problem was formulated to optimize the real-time operation of a battery and an ultracapacitor. Hour-ahead scheduling was first performed to minimize the operation cost of the MG, followed by real-time scheduling to eliminate power imbalances caused by the uncertainties in the RESs and loads.
Only a few studies have validated the two-stage optimization problem using real MGs [30,31]. A heuristic optimal operation was proposed to minimize the MG operating cost in [30]. The proposed strategy featured both day-ahead and real time scheduling and performance of three different heuristic algorithms was compared. Reference [31] assessed peak load shifting, onsite PV performance and grid support by formulating an MILP optimal dispatch problem, featuring both month-ahead and day-ahead scheduling. The first stage determines DERs scheduling to minimize total operating costs (on a monthly basis), and the second stage then considers the same optimization problem but over a day-long time horizon. Table 1 presents a summary of previous studies on the optimal scheduling optimization problem types, and the validation methods used.
This paper proposes a two-stage scheduling, which consists of the day-ahead scheduling and the hour-ahead scheduling with consideration of the ESS. It is implanted in a MEMS in a campus MG and then validated both in actual case and in simulation to show the effectiveness of the proposed method. The main contributions of this paper are as follows:
  • This paper proposes two-stage scheduling—day-ahead and hour-ahead scheduling—to mitigate uncertainty and forecasting errors. The first stage is performed one day in advance to minimize the operation cost, while the second stage is performed every 5 min to minimize the difference between the input power from the main grid before the day and that during the day.
  • Unlike previous papers [23,24,25,26,27,28,29], we engage in practical implementation of the proposed two-stage scheduling system. An Internet-of-Things (IoT)-based campus MG, composed of PV and ESS, is used as a case study to evaluate the proposed method. The method is developed using not only the forecast data on load demand and required PV generation but also actual data on electricity prices and device parameters.
  • The proposed scheduling optimization problem is modelled in PuLP (i.e., a modeling environment in Python) using an open-source solver coin-or branch and cut (CBC). The optimization module in the implemented MEMS is completely open-source based.
  • Additional case studies are performed to deal with limitations of the implementation in the campus MG. We verify that completely open-source software can be used to develop the small-scale MG and that the algorithm is applicable at various PV and battery capacities.
The remaining manuscript of this paper outlines as follows: Section 2 describes an overview of the implemented campus MG; Section 3 formulates our proposed two-stage scheduling; Section 4 describes the results of not only implementation but also simulation case studies; and Section 5 concludes the paper. Note that this paper focuses especially on optimization.

2. Overview of the Implemented IoT-Based Campus MG

2.1. Description of the Implemented Campus MG

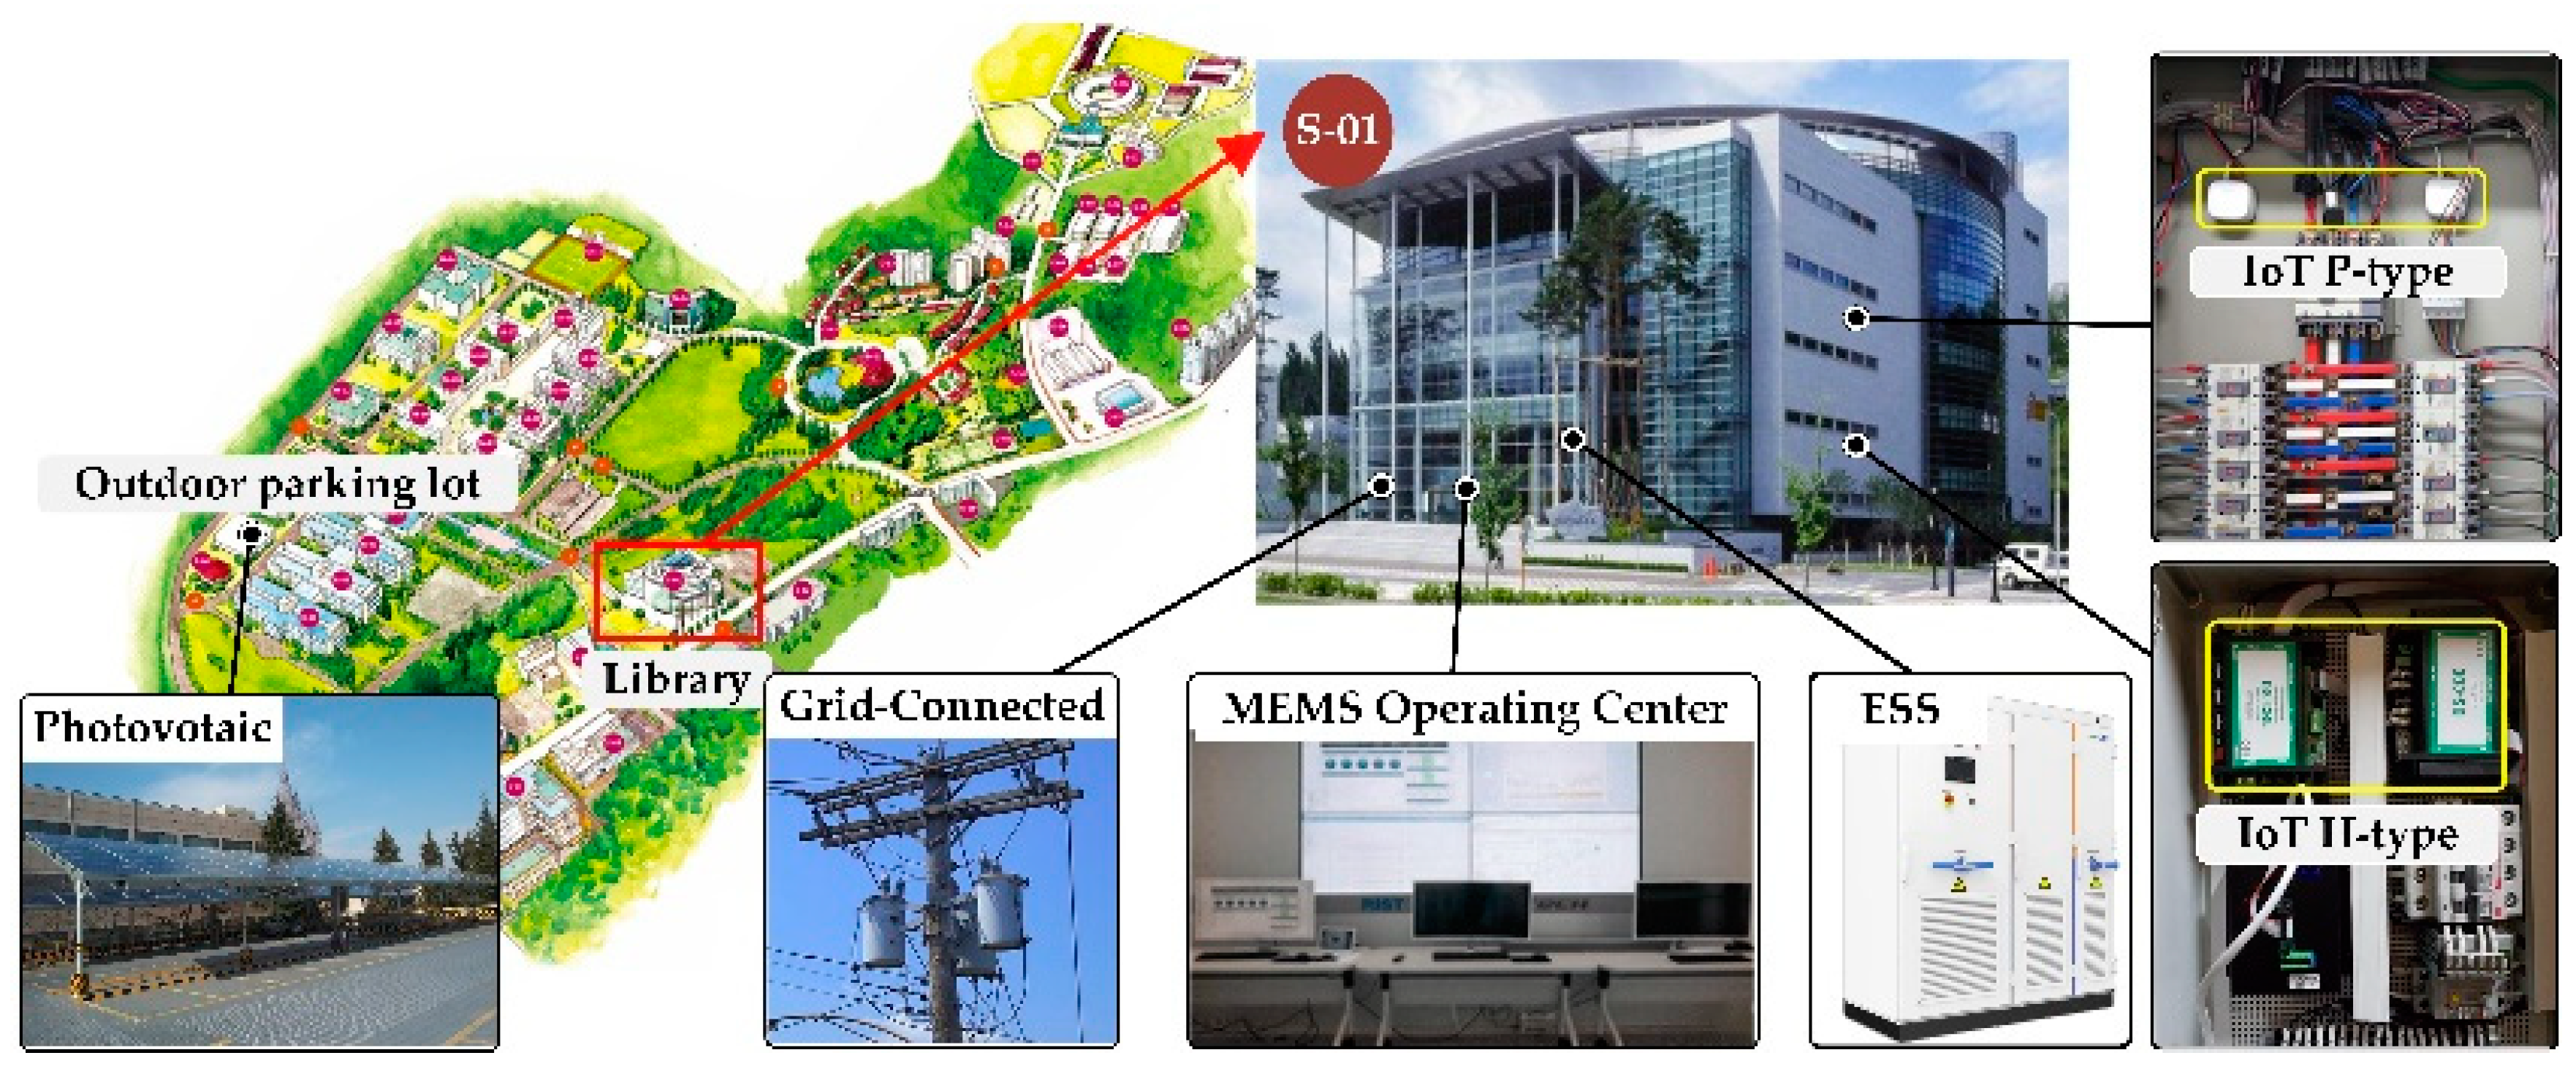
Figure 1 presents the architecture of the campus MG. The MG ensures uninterrupted operation of critical loads in the library (S-01). As shown in the figure, the MG is grid-connected and includes PV and ESS. The rated PV power of the panels (300 modules) is 100 kW and the panels are installed on the roof of the outdoor parking lot. A total of 250 kWh of lithium-ion batteries (four racks) and a MEMS operating center are situated on the first floor of the library.
Moreover, two types of IoT sensors are installed throughout the library. One is a power sensor (P-type) and the other is a high-speed sensor (H-type). Table 2 lists the features of the two types of sensor. The reliability of sensors is important since inaccurate sensing and data measurement can cause various malfunctions in the EMS and consequently unstable operation of the MG [32]. Note that the average and maximum error rates of two sensors were measured in the field demonstration experiments. 54 P-type sensors have been installed in the electric distribution panels where lighting and plug-in loads are connected. In addition, 23 H-type sensors have been installed in the distribution panels for heating, ventilation, and air conditioning (HVAC) systems (e.g., air cleaners, thermos-hydrostats, package air conditioners, and pumps). The H-type sensors will be more extensively exploited particularly for the analysis of dynamic operation and control of the campus MG, which is considered a next research topic.

2.2. Configuration of an Implemented MG

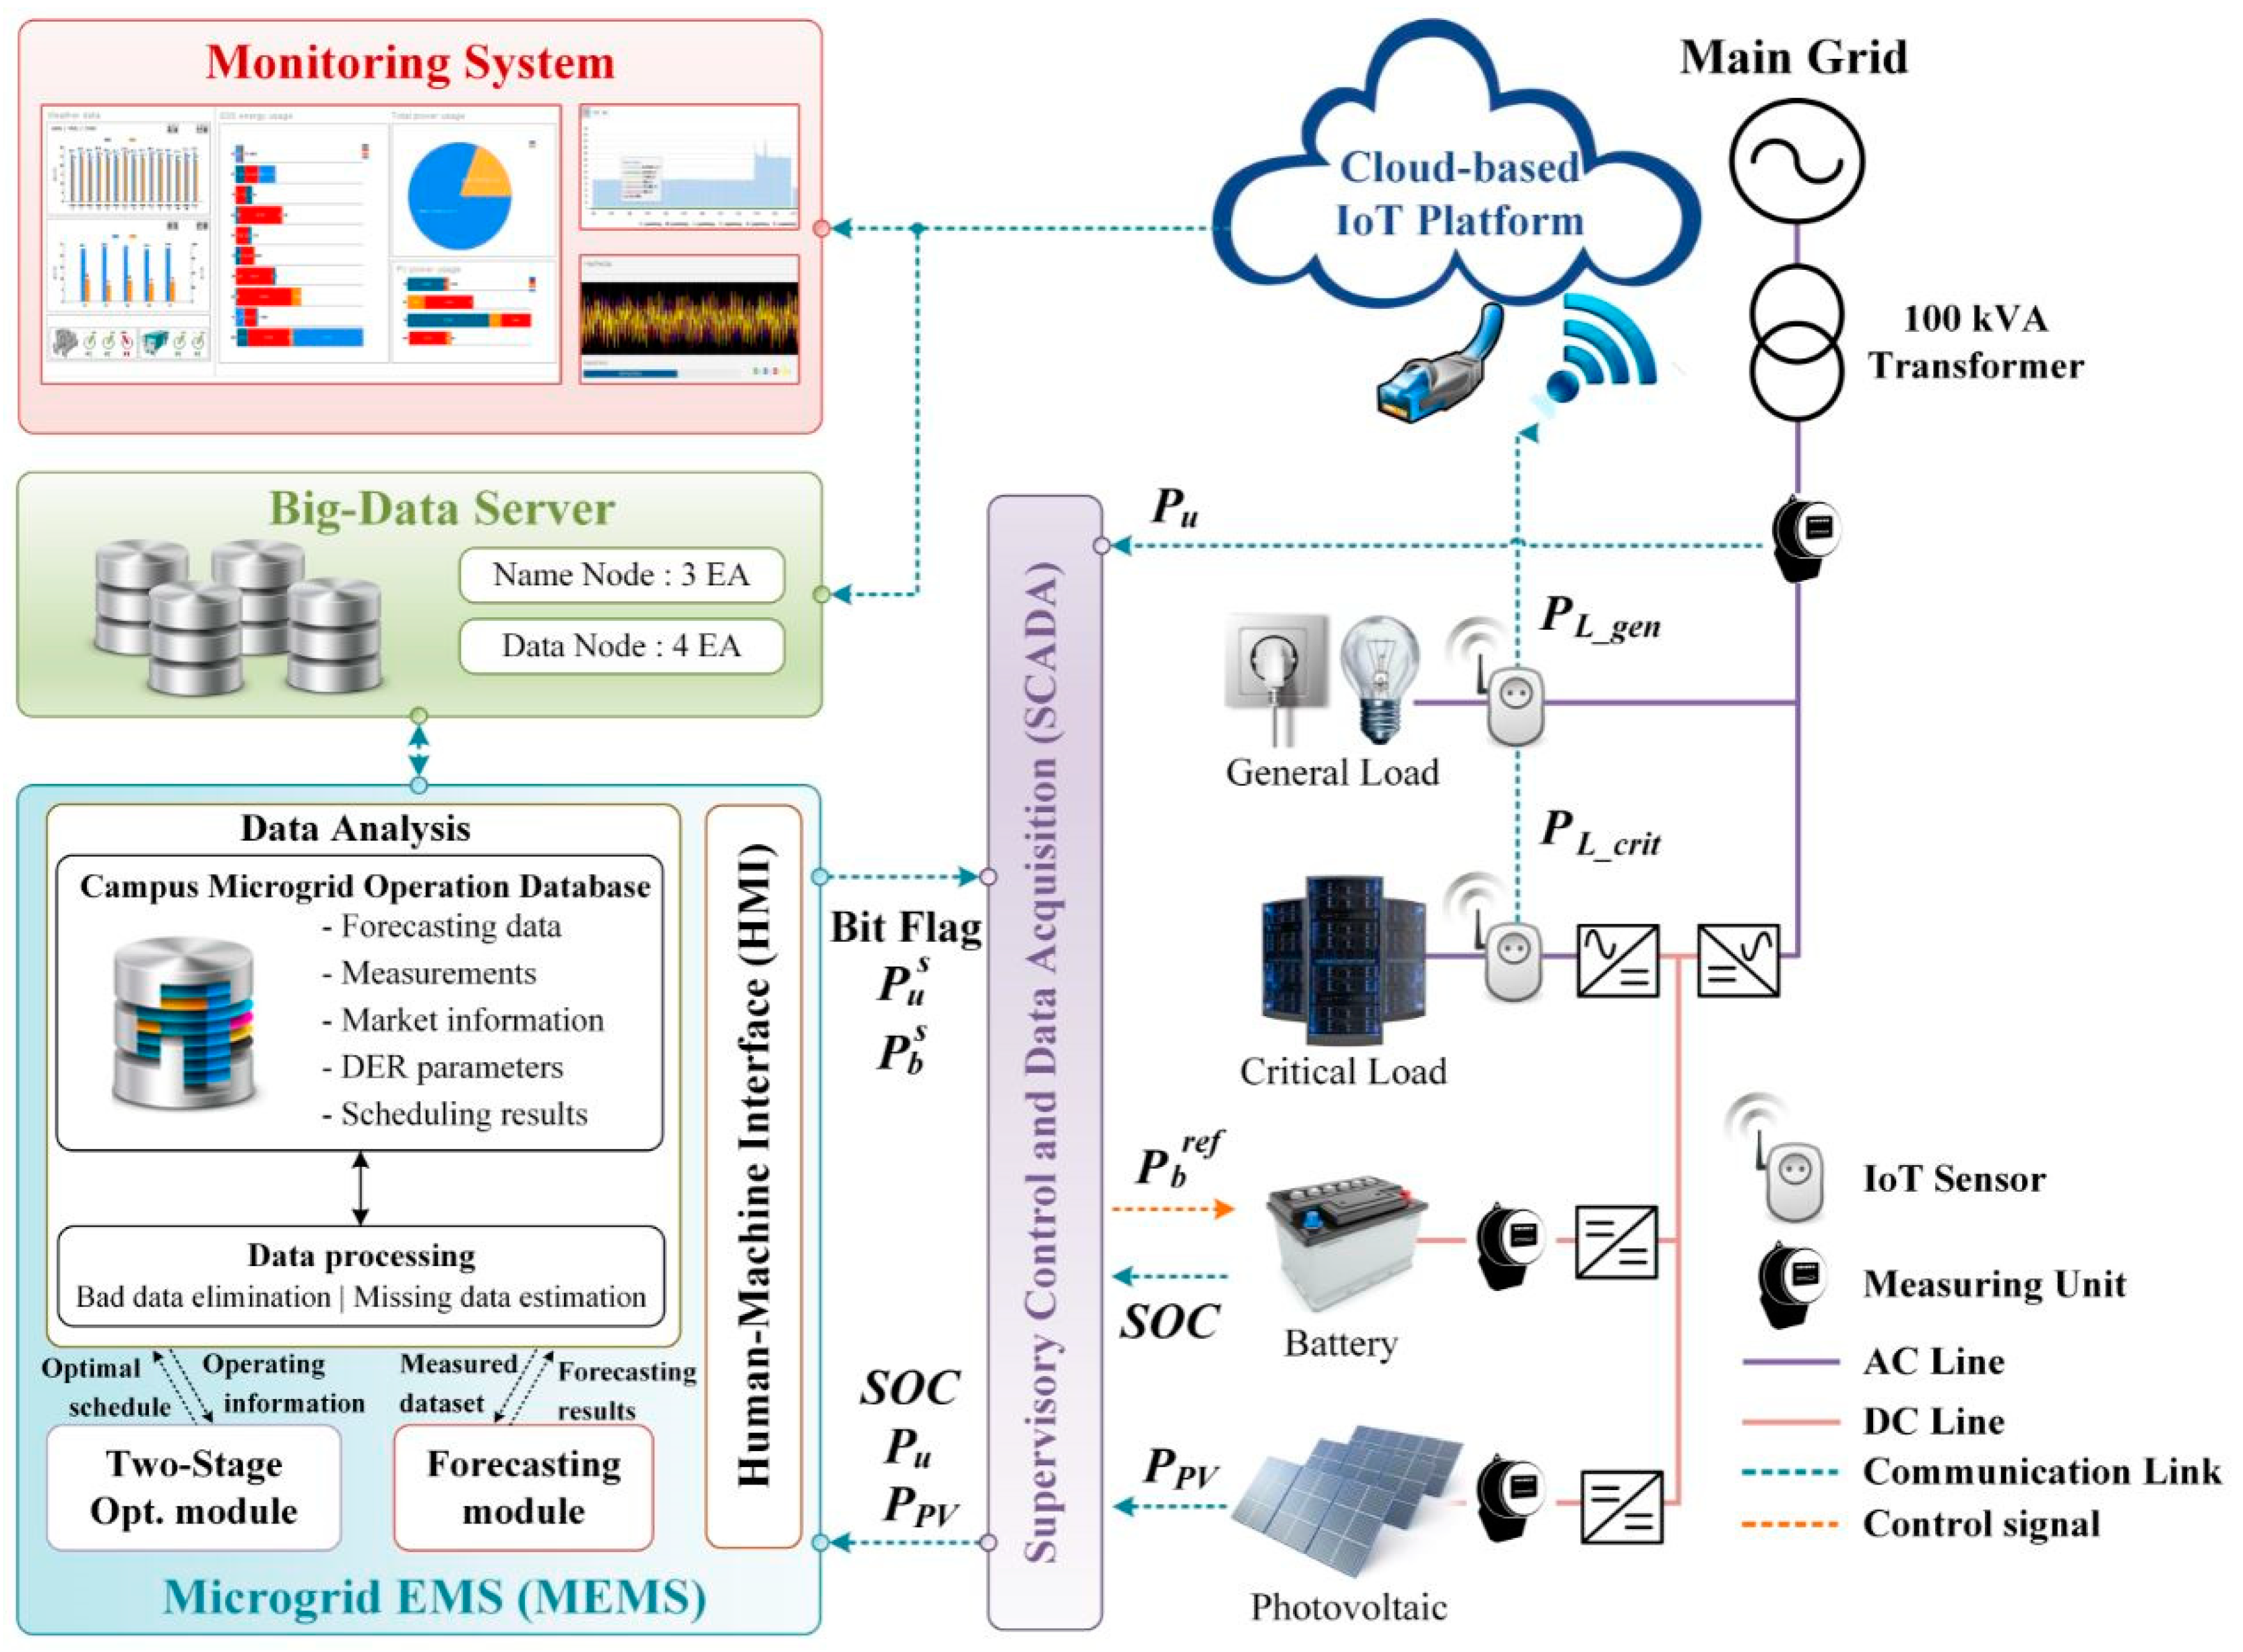
Figure 2 illustrates the configuration of the campus MG. Existing loads are classified into two types: general loads (e.g., lighting, air conditioners, and heaters) and critical loads (e.g., central computer, super computer, and big-data server). Both types of loads are supplied with power when the MG is in the grid-connected mode. However, in case of failure of the main grid, the general loads may not receive enough power because the critical loads have priority over the general loads.
IoT sensors are installed on the sides of the general and critical loads and generate huge amounts of data. All information (e.g., general load power PL_gen and critical load power PL_crit parameters) received by the IoT sensors is transmitted to a cloud-based IoT platform over a communication link [33]. An efficient data communication system is required for continuous, fast, reliable, and accurate transfer of information among sensors. Thus, no disturbance and disconnection is acceptable when sharing information [34]. The P-type sensors use the Ethernet for information transfer, and the H-type sensors communicate via Wi-Fi. The information in the cloud-based IoT platform is sent to a big-data server designed to store and analyze huge amounts of data and to provide a monitoring system. The database (DB) in the MEMS retrieves the required information (e.g., PL_gen and PL_crit) from the big-data server over the communication link. The MG bus, the PV and the battery are equipped with measuring units. The utility and PV-side units measure voltage, current, active power (i.e., utility power Pu, PV power PPV). An additional state-of-charge (SOC) is measured at the battery side measuring units. All of these data pass through a supervisory control and data acquisition (SCADA) system and are then forwarded to the MEMS; the DB then acquires the data.
The MEMS consists of four modules: forecasting, optimization, data analysis, and human-machine interface (HMI) [35]. The forecasting module operates at different time scales: day-ahead and 2 hours-ahead. It provides forecasts of PV generation power and load demands and delivers the forecasts to the optimization module. The optimization module makes decisions scheduled utility power Pus and battery power Pbs using data from the forecasting module and DB. Note that the campus MG is implemented using two-stage scheduling, which is described specifically in Section 3. The battery power reference signal Pbref is transferred to the battery controllers through the SCADA, which compensates for any mismatch between the scheduled power and the actual MG power [19]. A bit flag (0/1) is also delivered to the SCADA to decide whether the scheduled results are performed or not in practice. It is zero only when the parameters input by the MEMS operator exceed bounds or when required data (e.g., the forecast load demands and PV generation power, market information, and measurements) are not delivered to the optimization module. The MEMS collects vast amounts of data such as forecasts, measurements, market information, DER parameters, and the result of scheduling. These data must be analyzed properly to provide insights on how to improve the performance of the forecasting and optimization modules [36]. A MEMS should also provide real-time monitoring and control of a MG. This is performed by the HMI, and keeps operators aware of current MG status and delivers accessible information [36]. Turning briefly to communication, no standard form of communication for MEMS operations has yet been defined [37]. However, as the numbers of DERs in MGs increase, a new type of communication system is needed to improve the quality and stability of the system. For example, IEC 61850 deals with real-time supervision and control of electrical systems and is widely used to exchange real-time information [38].

3. The Proposed Two-Stage Scheduling Algorithm

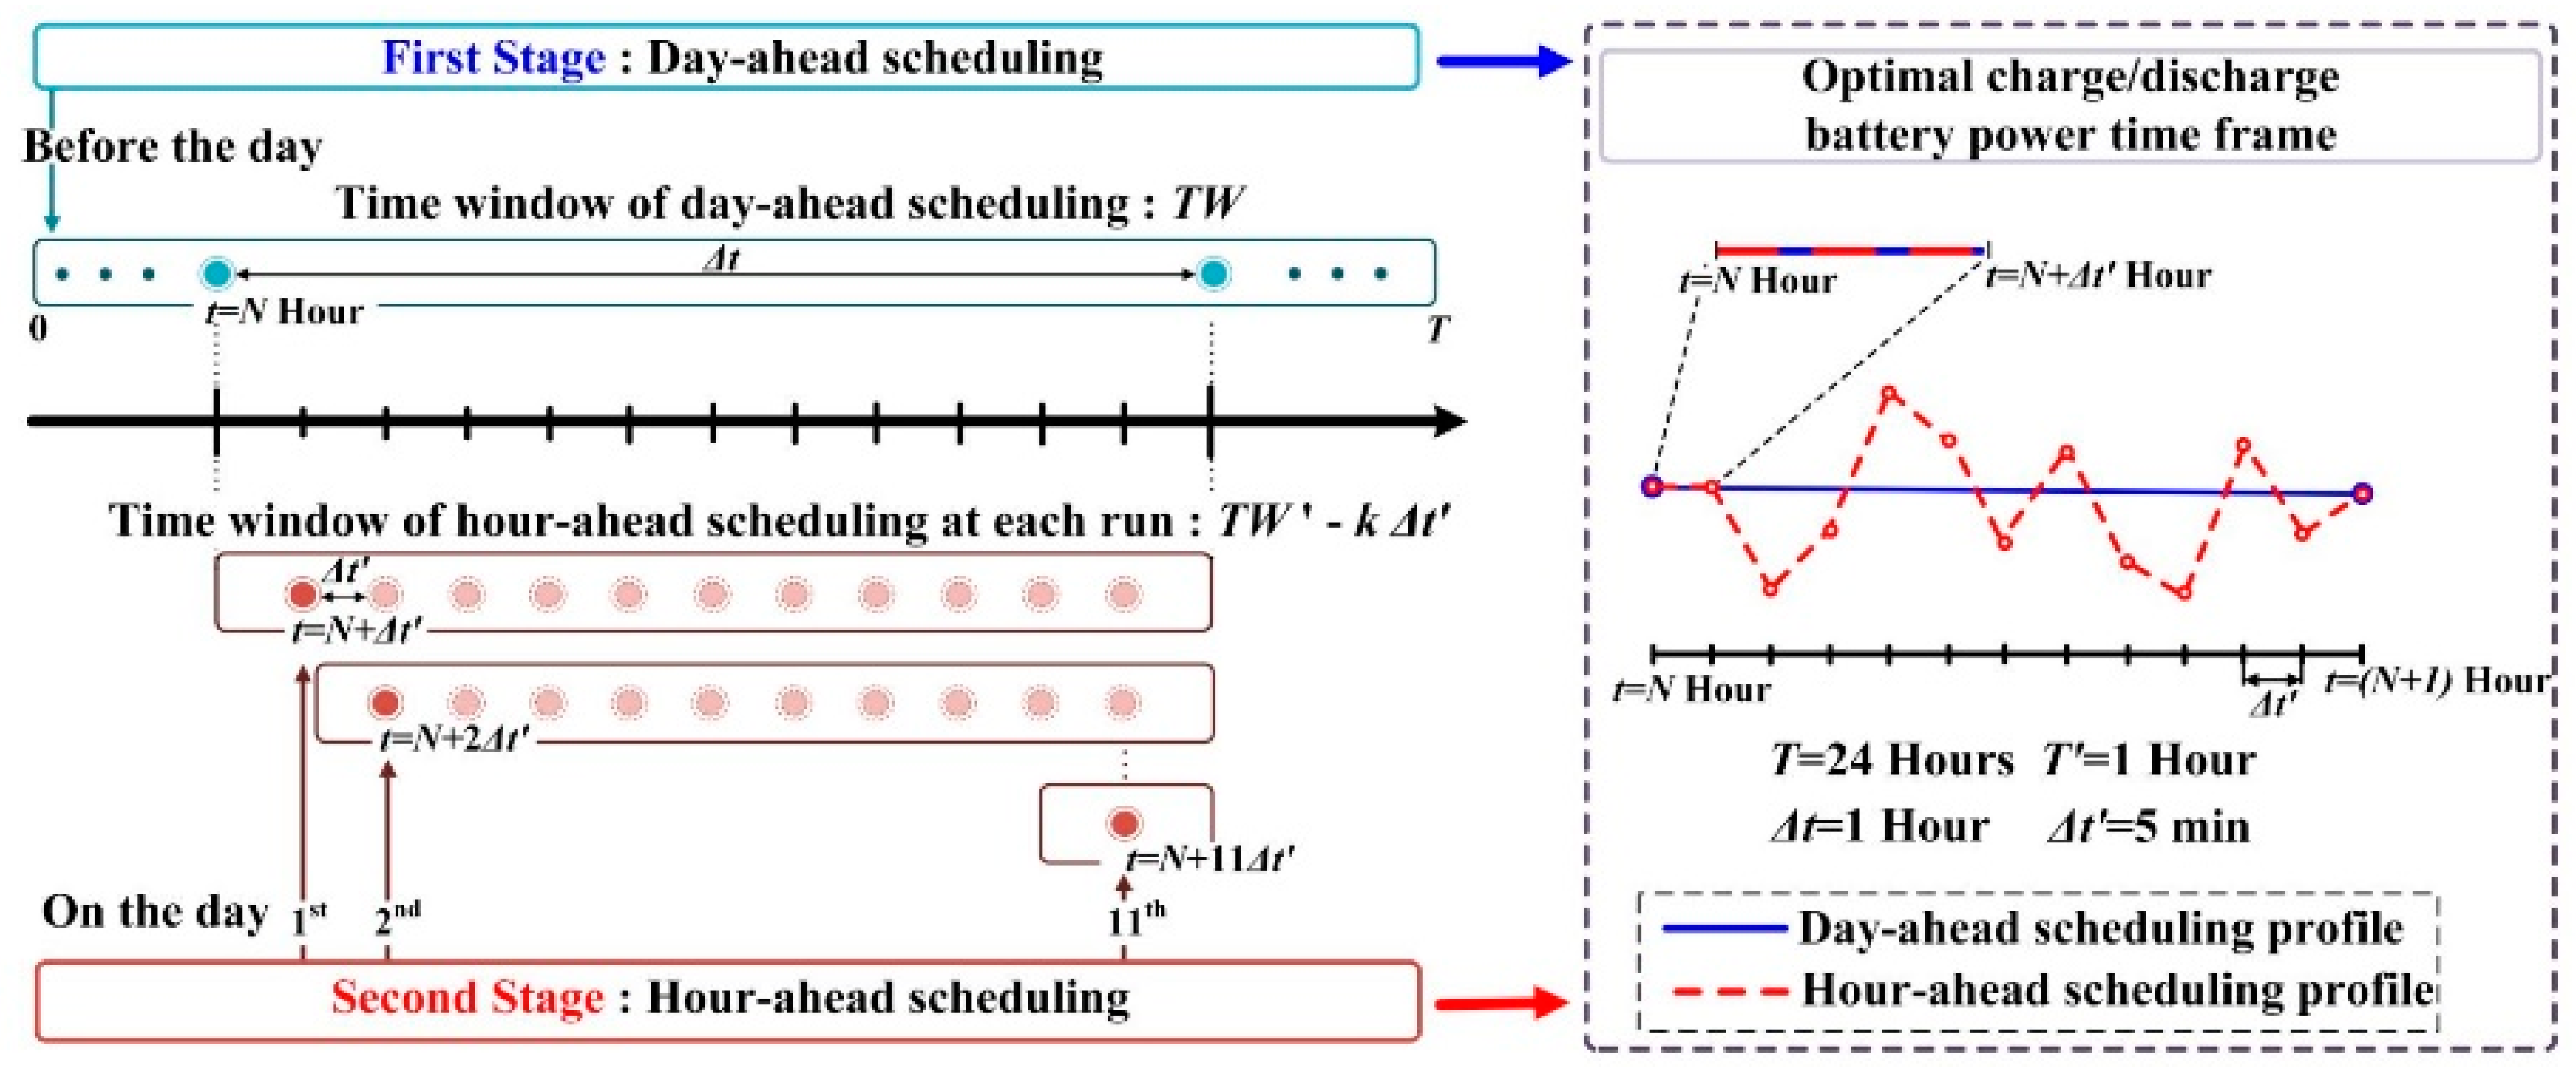
In practice, variations between forecast data and real-time data are inevitable due to variations and uncertainties in load demands and PV generation. However, it is possible to obtain more accurate forecasts as real-time operation becomes more imminent [26,27]. Thus, it is not possible to use only day-ahead scheduling at 1-hour intervals to reflect variability well [29]. Thus, the two-stage scheduling is proposed to mitigate forecast errors and improve the accuracy of scheduling. Figure 3 presents the time framework of our proposed scheduling for the campus MG, which includes day-ahead scheduling and hour-ahead scheduling, especially at a typical time t = N (hour) for Δt where N ∈ {0, 1, ⋯, 23}. Also, both stages are formulated as MILP problems, the objective functions of which include penalty terms.
  • Day-ahead scheduling stage: This stage is performed only once before the day to determine the optimal scheduling for the next day. The time window (TW) is 24 h, and the time interval (Δt) is 1 h. The scheduled profiles do not change with Δt.
  • Hour-ahead scheduling stage: This is performed every 5 min during the day for peak saving. Note that hour-ahead scheduling is not conducted at the beginning of every 5-min interval, but rather follows the day-ahead scheduled profile. In other worlds, the second stage runs not 12 times but rather 11 times per Δt. The time window is TW′ − kΔt′ where k ∈ {1, ⋯, 11}, and the time interval Δt′ is 5 min. Only the first interval of each run set serves as a final decision and the rest of the intervals are for reference only.

3.1. Day-Ahead Scheduling Stage

In the first stage, the objective function contains the two terms, shown in Equations (1) and (2). The first term is to minimize the total daily operation cost of the campus MG, and the second is a penalty function that takes into account the situation when the scheduled utility power exceeds the contracted power. Note that it is taken into consideration the case of the MG exporting the surplus PV output power to the main grid, where the scheduled utility power can become negative.
min { ( c t P u , t s , d ) + θ 1 M 2 , t } t T ,
M 2 , t = max ( 0 , P u , t s , d P c o n t ) t T ,
where ct is the hourly electricity price of the main grid. Moreover, Pu,ts,d is the scheduled utility power imported from the main grid at tth period. Furthermore, Pcont is the contracted power and M2,t is an additional decision variable, which is the larger of the 0 and (Pu,ts,dPcont) at time t. In (1), θ1 is a penalty factor and T is the set of hourly periods (i.e., T = [0, 1, ⋯, 23]).
However, the second term needs to be linearized when formulating a MILP problem. It is based on Appendix A and can be achieved using Equations (3)–(5).
P u , t s , d = M 1 , t + M 2 , t + r 0 t T ,
( r 1 r 0 ) W 1 , t M 1 , t ( r 1 r 0 )
0 M 2 , t ( r 2 r 1 ) W 1 , t
where M1,t is a continuous decision variable at time t. Moreover, r0, r1, and r2 are parameters. Furthermore, W1,t is a binary decision variable at time t. All facilitate the piecewise linearization of the penalty function M2,t.
Moreover, the power balance between total power production and consumption at any time t must be guaranteed. The linearized DistFlow formulation for the power flow equations is adopted. It has been largely used in both distribution grids and MGs [39,40]. In this paper, we use active power, neglecting power losses on the lines, which can be formulated as Equation (6).
P u , t s , d + j : ( i , j ) L P j , i , t s , d = k : ( k , i ) L P i , k , t s , d + ( P c h , t s , d P d c h , t s , d ) + ( P L i , t f , d P P V , t f , d ) i , j , k B , t T ,
where Pj,i,ts,d and Pi,k,ts,d is the day-ahead scheduled active power that flows from jth bus to ith and from ith bus to kth, respectively, at time t. Moreover, PLi,tf,d is the day-ahead forecast load demand power at ith bus at time t, and PPV,tf,d is the forecast PV generation power at time t. In addition, Pch,ts,d and Pdch,ts,d are the day-ahead scheduled battery charge and discharge powers at time t. Furthermore, B is the set of buses and L is the set of lines in the implemented MG. Furthermore, B is the set of buses and L is the set of lines in the implemented MG.
The SOC and power output constraints are important battery issues. Equation (7) shows that the energy stored in the battery at time t is affected by not only its previous value but also the charge and discharge power at the present moment. To prevent the battery from becoming overcharged or overdischarged, the SOC limit must be satisfied, which is described in Equation (8).
S O C t s , d = S O C t 1 s , d + ( ( η c h P c h , t s , d P d c h , t s , d / η d c h ) Δ t ) / E C m a x t T ,
S O C m i n S O C t s , d S O C m a x t T ,
where SOCts,d is the state of charge describing how much energy is stored in the battery at time t. Furthermore, SOCmin and SOCmax are the minimum and maximum amounts of energy that can be stored in the battery, respectively. Moreover, ηch and ηdch are the charge and discharge efficiency of the battery, respectively. In addition, ECmax is the capacity of the battery.
Inequality constraints dealing with the charging and discharging power capacity limits of the battery can be derived from Equations (9) and (10). The battery has three operating states: standby, charging, and discharging. The three cannot be in play at the same time t. This can be achieved by introducing a new variable u t , (i.e., charging/standby (1) and discharging/standby (0)). When the scheduled battery powers Pch,ts,d and Pdch,ts,d are zero, standby is in play.
0 P c h , t s , d u t P c h m a x t Τ ,
0 P d c h , t s , d ( 1 u t ) P d c h m a x t T ,
where Pchmax and Pdchmax are the maximum charge and discharge powers of the battery, respectively. In addition, ut is a binary variable preventing simultaneous battery charging and discharging.
Another limitation should be satisfied during the operation of the proposed scheduling to meet the scheduling requirements of the next dispatch day and safe operation of the battery [41]. Equation (11) means that the energy stored at the last time of scheduling should be set to its initial value.
S O C 23 s , d = S O C i n i t
where SOC23s,d is the scheduled battery SOC at 23:00 p.m.; SOCinit is the initial value of the SOC.

3.2. Hour-Ahead Scheduling Stage

The objective function is to minimize the discrepancies between the day-ahead scheduled utility power profiles and the hour-ahead scheduled utility powers, expressed as the first term of Equation (12). Due to natural discharge of the SOC, the actual SOC value could exceed the upper or lower limit. Thus, the second and third terms are added to prevent this situation.
min { ( | P u , t s , d P u , t s , h | ) θ 2 M 3 , t + θ 3 M 5 , t } t T ,
M 3 , t = m i n ( 0 , S O C t s , h S O C m i n ) t T ,
M 5 , t = m a x ( 0 , S O C t s , h S O C m a x ) t T ,
where Pu,ts,h is the scheduled utility power at time t to be determined in the second stage. Moreover, SOCts,h represents the scheduled SOC at time t; M3,t is an additional decision variable, which is the smaller of the 0 and (SOCts,hSOCmin) at time t. Furthermore, M5,t is another decision variable, which is the larger of the 0 and (SOCts,hSOCmax) at time t. In addition, θ2 and θ3 are penalty factors and T′ is the time set of the second stage (i.e., T′ = [5, 10, ⋯, 1435] for the unit time interval of 5 min).
Because the three terms of the objective function are all nonlinear, they must be linearized for the MILP problem. The first term includes an absolute value, which can be changed to a linear form by adding auxiliary variables covering positive and negative deviations. Both the second and third term can be linearized using Equations (15)–(18) in a manner similar to that shown in the first stage, which is also based on Appendix A.
S O C t s , h = M 3 , t + M 4 , t + M 5 , t + r 3 t T ,
( r 4 r 3 ) W 2 , t M 3 , t ( r 4 r 3 ) t T ,
( r 4 r 3 ) W 3 , t M 4 , t ( r 5 r 4 ) W 2 , t t T ,
0 M 5 , t ( r 6 r 5 ) W 3 , t t T ,
where M4,t is a continuous variable at time t. Moreover W2,t and W3,t are binary decision variables at time t. In addition, r3, r4, r5 and r6 are additional parameters. All decision variables are required for piecewise linearization of the penalty functions M3,t and M5,t.
The constraints are similar to those imposed on the day-ahead scheduling, except that the SOC limit constraint is considered in the objective function. Note that Equation (23) is appropriate for continuous operations, as is Equation (11), which means that the energy stores of the last frame (running at the final time step) should be equal to the initial values.
P u , t s , h + j : ( i , j ) L P j , i , t s , h = k : ( k , i ) L P i , k , t s , h + ( P c h , t s , h P d c h , t s , h ) + ( P L i , t f , h P P V , t f , h ) i , j , k B , t T ,
S O C t s , h = S O C t 1 s , h + ( ( η c h P c h , t s , h P d c h , t s , h / η d c h ) Δ t ) / E C m a x t T ,
0 P c h , t s , h u t P c h m a x t T ,
0 P d c h , t s , h ( 1 u t ) P d c h m a x t T ,
S O C 23 _ 55 m i n s , h = S O C i n i t
where Pj,i,ts,h and Pi,k,ts,h is the hour-ahead scheduled active power that flows from jth bus to ith and from ith bus to kth, respectively, at time t. Moreover, PLi,tf,h is the hour-ahead forecast load demand power at ith bus at time t, and PPV,tf,h is the forecast PV generation power at time t. In addition, Pch,ts,h and Pdch,ts,h are the hour-ahead scheduled battery charge and discharge powers at time t. In (23), SOC23_55mins,h is the scheduled battery SOC at 23:55 p.m.
A surcharging system is considered for the case where the maximum demand power of the 15-min average exceeds the contracted power to stabilize the supply. A constraint in Equation (24) represents this.
( P u , t 1 s , h + P u , t s , h + P u , t + 1 s , h ) / 3 P c o n t t T ,

3.3. Flowchart of the Proposed Two-Stage Scheduling

Figure 4 summarizes the proposed two-stage scheduling for 1 day. This section presents a detailed flowchart.
Step (1)
Initialize the time windows TW and TW′ as 24 h and 1 h, respectively, and the time intervals Δt and Δt′ as 1 h and 5 min, respectively. Then, set the current time t = N + k = 0.
Step (2)
Obtain input information on the PLi,tf,d, PPV,tf,d (time window: TW, time interval: Δt) from the forecast module of MEMS for the first stage, measured SOC data from SCADA, time-of-use (TOU) and ESS parameters from the DB in MEMS.
Step (3)
Formulate and solve a MILP optimization problem for the first stage (Section 3.1).
Step (4)
Determine Pu,ts,d, Pb,ts,d (time window: TW, time interval: Δt)
Step (5)
When time t attains N+kΔt′, update the input data, which are PLi,tf,h, PPV,tf,h (time window: 2TW′, time interval: Δt′) from the forecasting module in MEMS for the second stage, measured SOC and utility power from the SCADA, and Pu,ts,d from the first-stage.
Step (6)
Formulate and solve a MILP optimization problem for the second stage (Section 3.2).
Step (7)
Make final decisions on Pu,ts,h, Pb,ts,h (time window: TW′ − (k + 1)Δt′, time interval: Δt′) Note that the time windows of the forecast data and the scheduled profiles differ.
Step (8)
If k ≠ 12 and N ≠ 24, jump to step 5 after N = N + 1, otherwise jump to step 5 after k = k + 1.
Step (9)
If N = 24, obtain the final optimal battery charge/discharge power to minimize MG operation costs.

4. Case Study and Results

Section 4.1 discusses the implementation results and the effect of hour-ahead scheduling. Section 4.2 discusses other case studies to compare the simulation results obtained not only using different solvers (Section 4.2.1), but also different battery and PV capacities (Section 4.2.2). In the battery scheduling profiles, a negative value indicates the charged state and a positive value means the discharged state. Note that safe battery operation is more important than economical operation in real life, but not during simulation. The run time mentioned Section 4 is the total time that it takes to acquire the input data from the DB, obtain the optimal operating schedules of the ESS, and print out the optimal results to the monitoring system.

4.1. Implementation Results

To evaluate the performance of our proposed two-stage scheduling, we applied it to the campus MG shown in Figure 2 where MEMS ran over the top of Linux. The proposed two-stage scheduling uses an open-source MILP solver, CBC [42]; an open-source modeling tool PuLP ver. 1.4.6 [43] in the Python environment. Additionally, scheduling was performed using actual data from the forecasting module and the DB in the appropriate time frame.
Table 3 lists the technical parameters of the ESS used. The minimum and maximum SOC values are divided into two types: hard limits SOCh_lim and soft limits SOCs_lim. The values of SOCs_lim are applied to define the SOC limits of the first stage and the SOC penalty functions of the second stage, considering additional reserve in the battery energy capacity. Moreover, the values SOCh_lim are the upper and lower bounds of the second-stage SOC values. The safe, reliable operation of the campus MG is of utmost importance, which could be successfully achieved with the reserve margins of the ESS. SOC have a significant influence on the reserve power of the ESSs [44]. Thus, an additional 5% reserve margin was taken into account in the first stage scheduling, considering that the maximum and minimum SOC levels were set to be 20% and 80%, respectively. In other words, the SOC level could vary between 25% and 75%. The charge and discharge efficiencies of the battery were set to 80%. Table 4 lists the TOU rates for three periods: off-peak (23:00 p.m. ~ 09:00 a.m.), mid-peak (09:00 a.m. ~ 10:00 a.m., 12:00 p.m. ~ 13:00 p.m., 17:00 p.m. ~ 23:00 p.m.), and on-peak (10:00 a.m. ~ 12:00 p.m., 13:00 p.m. ~ 17:00 p.m.). The contracted power was assumed to be 2000 kW. It is also assumed that the selling price for the exported power is assumed to be equal to the buying price for the imported power.
Figure 5 presents HMI screens showing the forecasted and actual loads and the PV generation profiles on the day before and during a typical winter day. The black line represents the day-ahead data for the first stage, the blue line the 2-h-ago data for second stage scheduling, the red line the actual values, and the green histogram the difference between the 2-h-ahead forecast and the actual values. All profiles of Section 4.1 are shown in the HMI at 15-min intervals (kWh). Note that the zero values of the red line at about 17.50 and the blue line at about 19.25 do not indicate faults, rather simply that no data are yet available.

4.1.1. Day-Ahead Scheduling

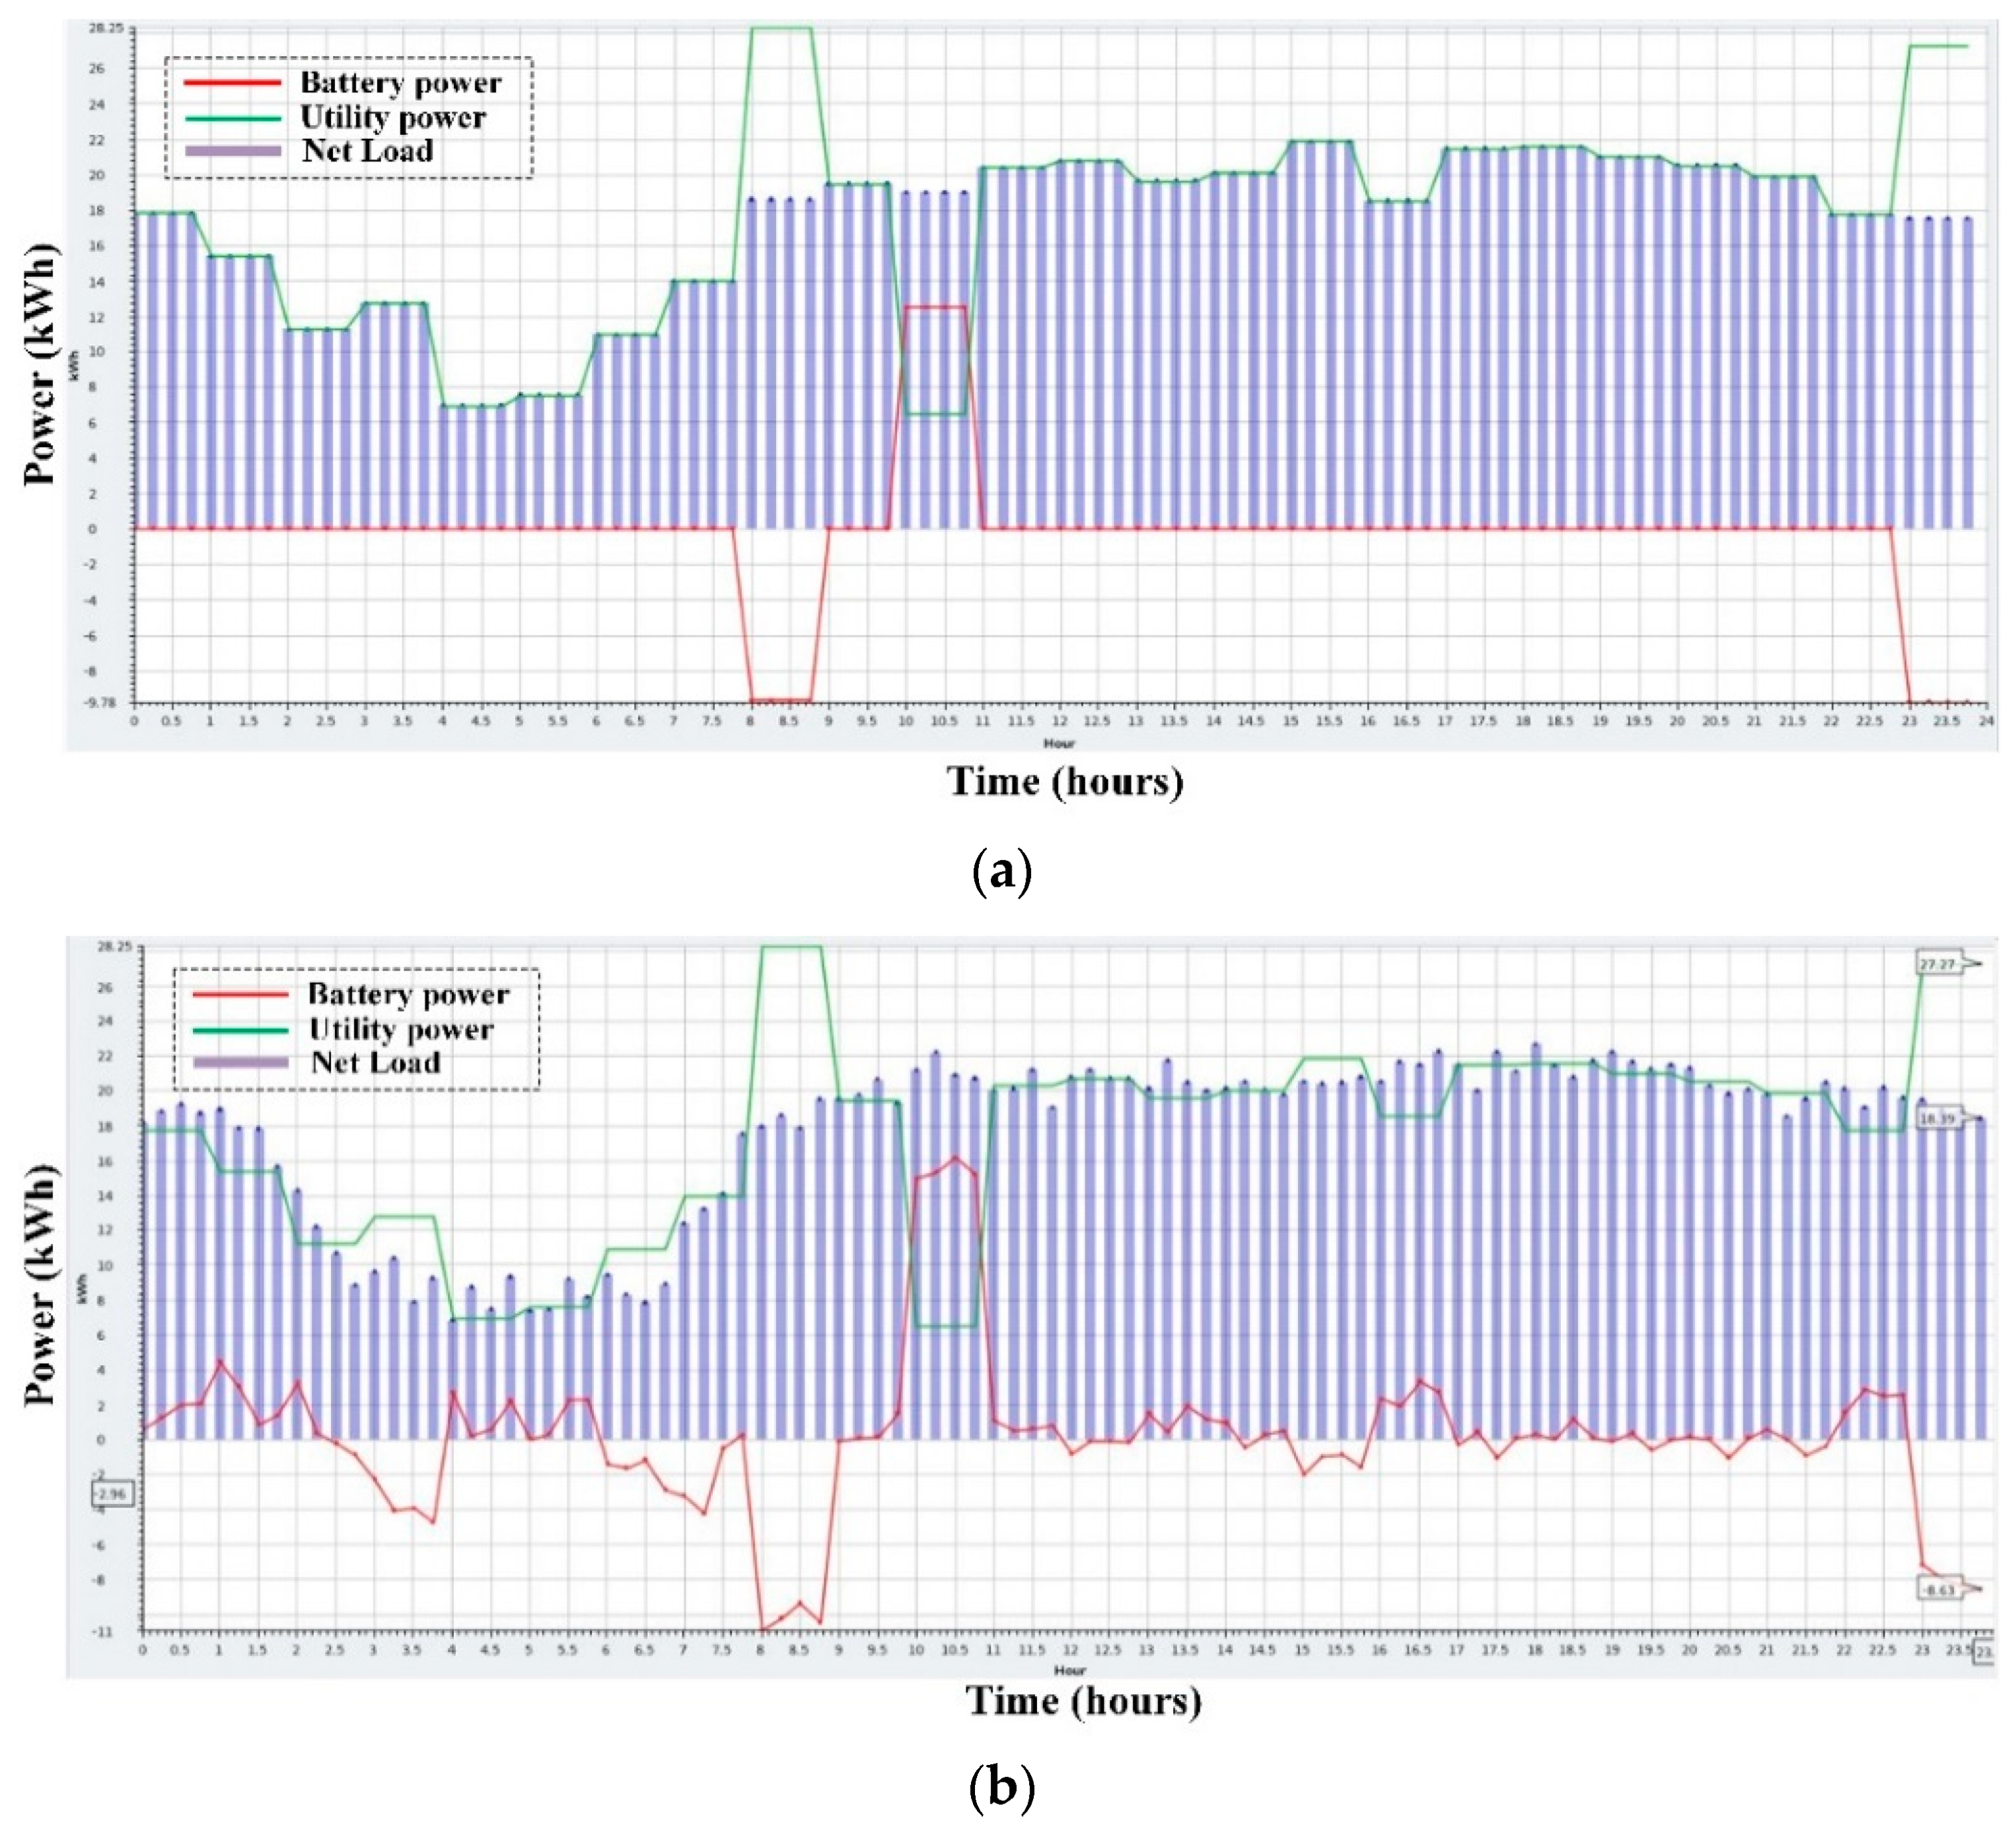
Day-ahead scheduling is performed before the day. The scheduling results in terms of utility power from the main grid and battery charge/discharge powers are shown in Figure 6a, in which the red line indicates the scheduled battery power, the green line the utility power, and the purple line the net load (the difference between the load demand and the PV generation power). The scheduling results of each time step are maintained for 1 h. More utility power is imported when the TOU is low and less when the TOU is high. Also, the ESS is charged when utility power is inexpensive and discharged when it is expensive, to minimize operation costs. The maximum utility power is imported from 08:00 to 09:00 (28.25 kWh per 15 min). The utility power remains within the contracted power because the objective function imposes a large deviation penalty for exceeding the contracted power. However, battery charge/discharge was minimal because the efficiency was assumed to be 80% and a 5% SOC safety margin was applied. The computation time required for a solution was 27.97 s, and the electricity cost was $97.59 during the day.

4.1.2. Hour-Ahead Scheduling

Hour-ahead scheduling makes decision the utility and battery powers every 5 min to minimize deviations between the day-ahead and hour-ahead scheduled utility powers. The results are shown in Figure 6b, in which the colors have the same meanings as in Figure 6a. The total objective value of hour-ahead scheduling is zero, which means that the scheduled utility power of hour-ahead scheduling and that of day-ahead scheduling overlap perfectly. Compared to the day-ahead ESS scheduling, where the ESS is on standby most of the time, the battery is not on standby in the second scheduling stage. The ESS is used to compensate for forecast errors caused by uncertainty and variations in load demand and PV generation. The battery power changes frequently to ensure that the utility power is equal to that of the day before. The first time interval of hour-ahead scheduling is 6.69 s on average.

4.2. Performance Analysis

In this section, we analyze the performances of open-source solvers and DER capacities at the simulation level. The battery charge and discharge efficiency were both set to 85 %. The other values were unchanged. All simulations were performed using an AMD Ryzen 7 model 1700 eight-core 3-GHz processor with 32.0 GB of memory.

4.2.1. Open-Source Solver Performance

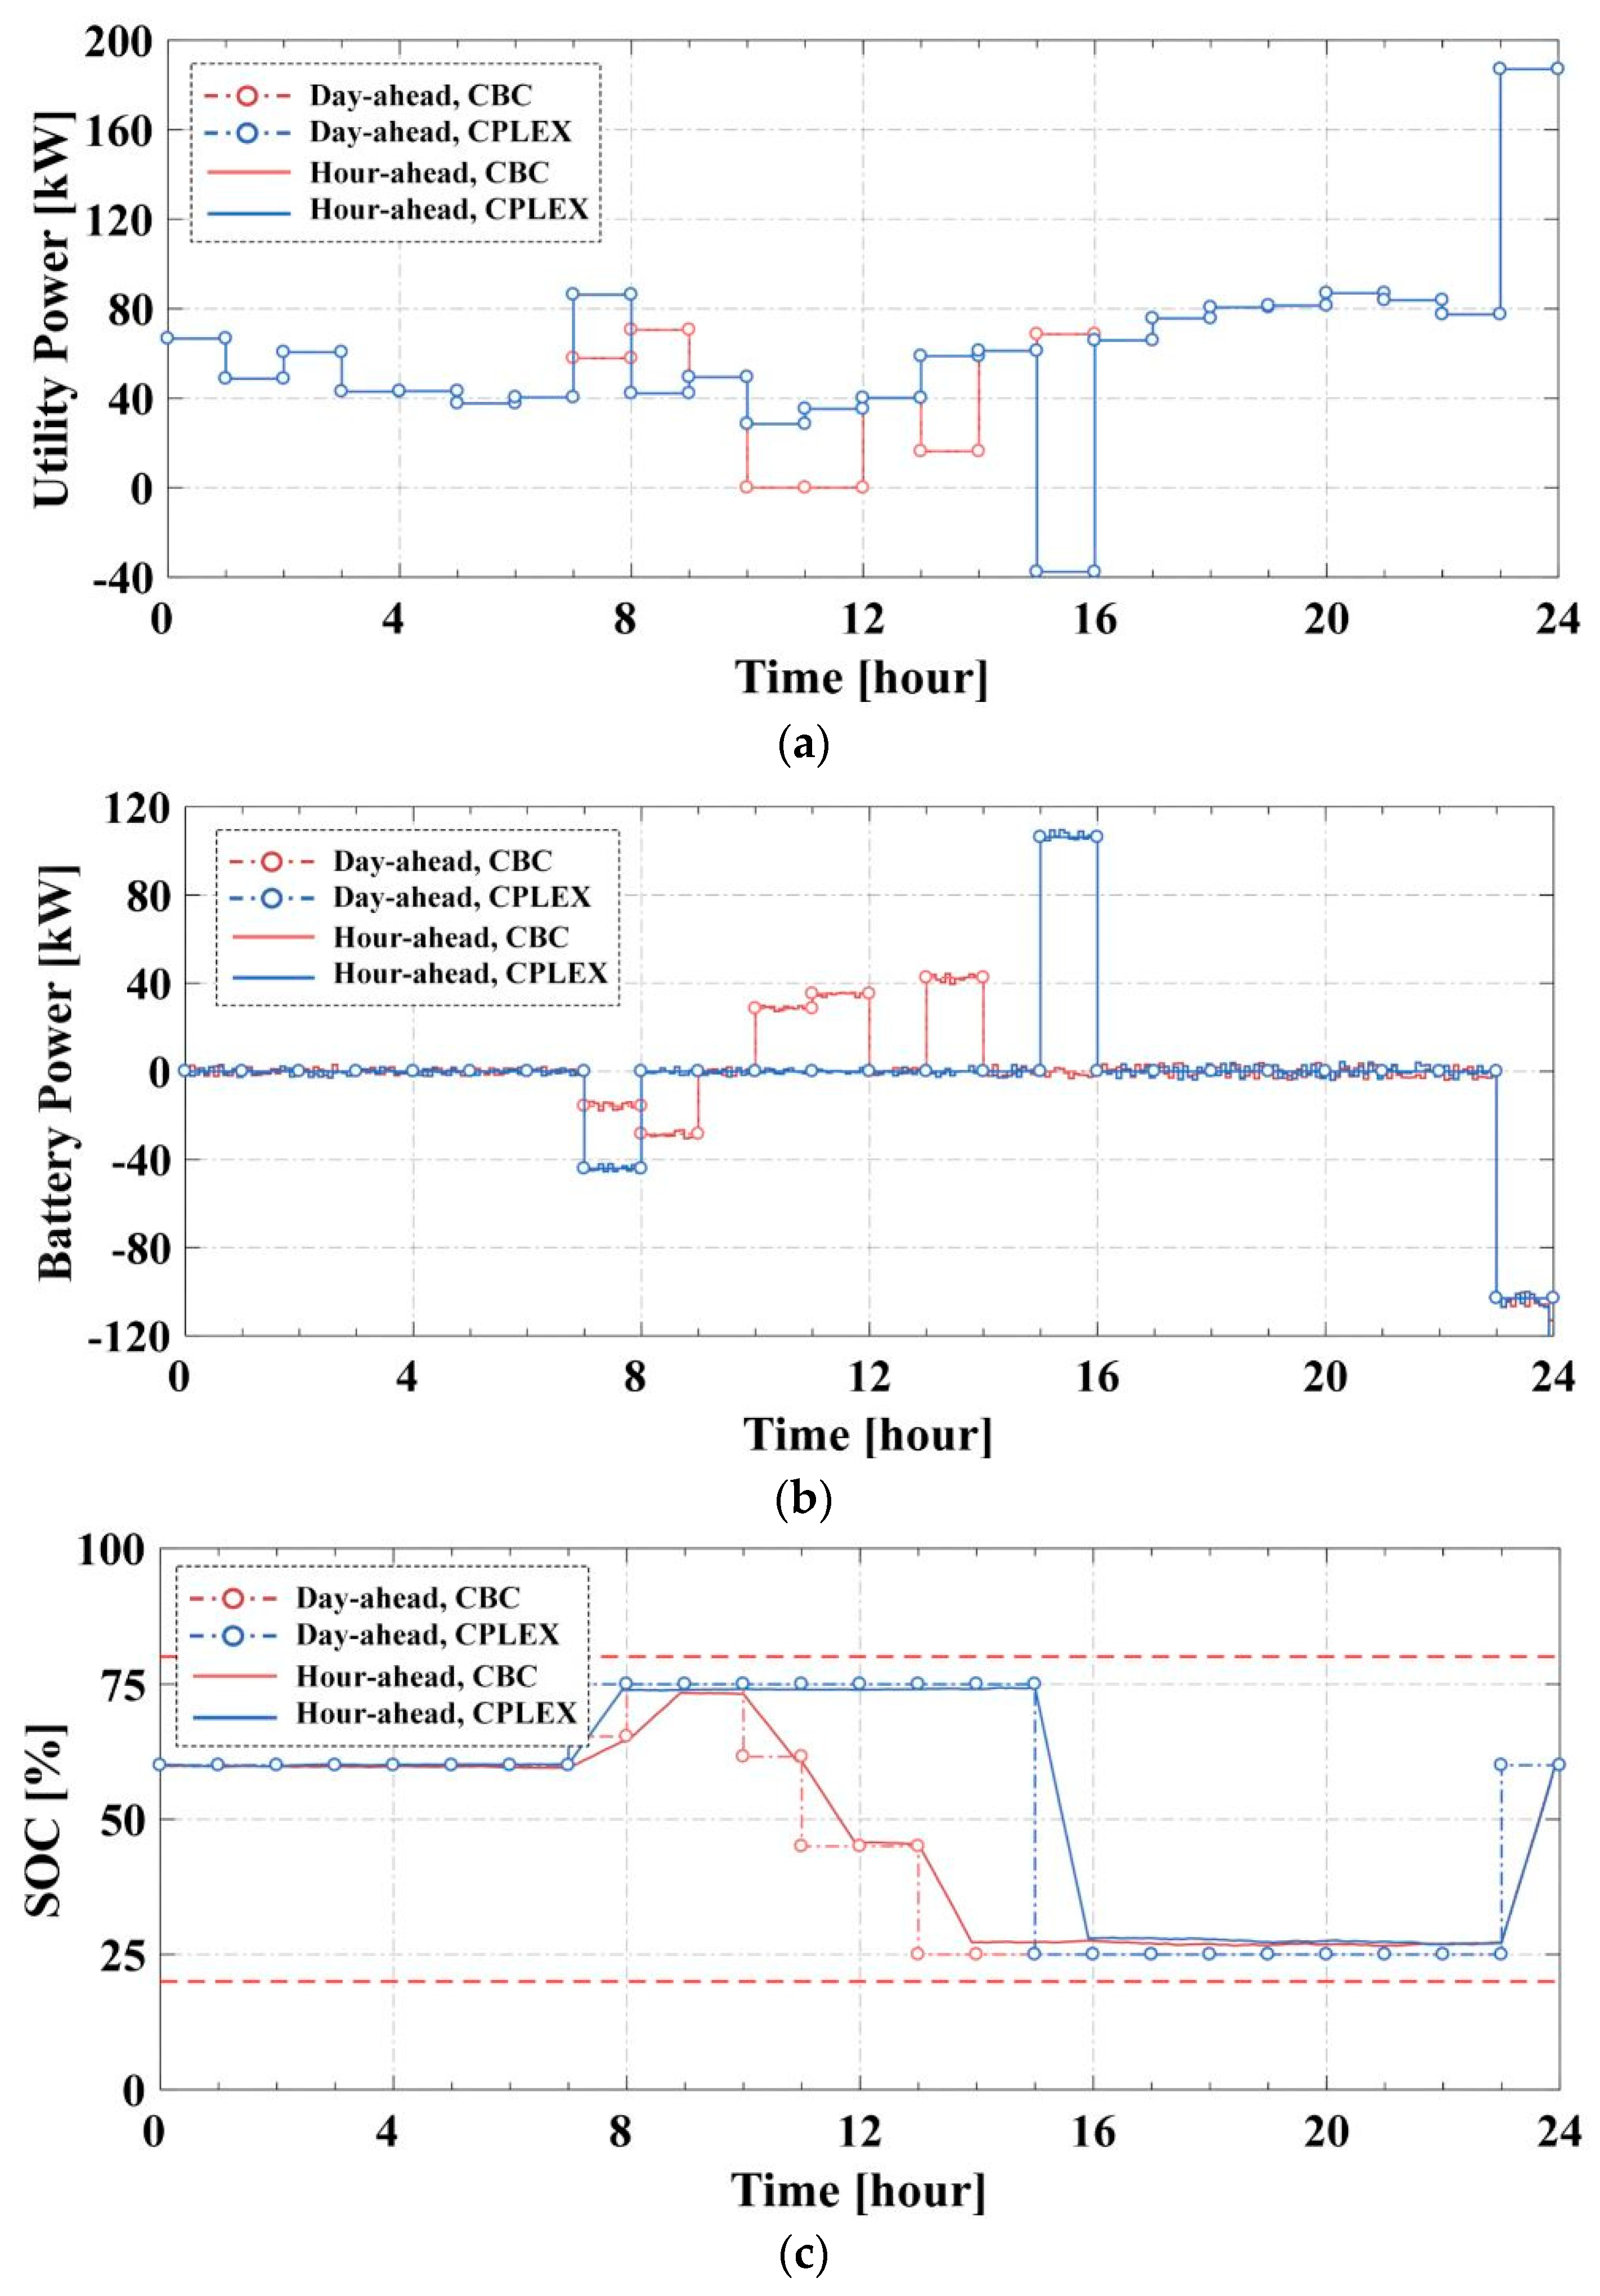
CPLEX is widely used to solve MILP problems. However, the optimization module of our campus MG module is completely open-source. To analyze the performance of the open-source solver, we compared CPLEX and CBC. Both are established in Python. We assumed that the forecast error range between day-ahead and 2-h-ahead would be ±5%, thus relatively small.
Table 5 compares the optimal values and required computation times of two-stage scheduling. The computation times required by the two solvers for day-ahead scheduling were 11.06 s and 0.29 s, respectively. We also compared the average computation times required for the first-time interval of hour-ahead scheduling, because it takes the longest time in the second stage. The times were 3.25s and 0.16 s, respectively. In other words, CBC requires far more computation time than CPLEX for both stages. Figure 7 presents the scheduling imported utility power, battery power, and SOC profiles calculated by the two MILP solvers. This shows that the campus MG worked safely with the reserve margin. The optimal value derived by CBC is exactly that derived by CPLEX for both day-ahead and hour-ahead scheduling. The simulation results thus show that CBC is acceptable for practical implementation in small-scale MGs even though CPLEX affords better performance in terms of computation time.

4.2.2. DER Capacity Performance

In Section 4.2.2, we compared the operation costs of the first stage as the PV and battery capacities changed. Battery capacity was changed over the range of 100–400 kWh. The PV capacity varied from 0–300 W. Figure 8 presents the MG operating costs within this range. It is assumed that the extent of PV generation at each time is proportional to the PV capacity. The operation costs decreased from about $117.80 to about $49.82 as the PV and battery capacities increased. In other words, the operation costs of the MG are inversely proportional to the PV and battery capacities. However, the PV system affects operating costs more than the battery does. Our findings also demonstrate that our proposed two-stage scheduling algorithm can handle various PV and battery capacities.

5. Conclusions

In this paper, we proposed optimal two-stage scheduling of a MG, considering forecasting errors. It consists of two stages: day-ahead and hour-ahead scheduling. The first stage is performed before the day to minimize operation costs. The second minimizes deviations from the utility powers scheduled by the first stage. The proposed optimal operation system was formulated as an MILP problem and solved by CBC. The application of the proposed method to a real case (a campus MG) proved that our system effectively compensated for forecasting errors and was applicable in practice. Simulations revealed that our proposed scheduling method is also valid during implementations in which the battery is inactivated because of safety concerns. The simulation case studies show that an open-source solver can be used to control small-scale MGs even though the performance is lower than that of a commercial solver; our proposed algorithm is applicable over a wide range of PV and battery capacities.
Further work is required to increase the efficiency of our proposed two-stage scheduling for the campus MG. The error rate of the forecasting module should be decreased, because the economic savings imparted by scheduling improve as the accuracy of forecast data improves. Additionally, our proposed two-stage scheduling algorithm should be implemented using various open- source solvers (e.g., GNU linear programming kit (GLPK), Solving constraint integer programs (SCIP)) or other open-source modeling environments such as Pyomo of Python or JuMP of Julia. We will also measure the required computation times and derive optimal values for larger scale operations in case the campus MG is extended in future.

Author Contributions

Conceptualization, J.-B.I., D.-H.S., and B.-C.J.; methodology, D.-H.S., and B.-C.J.; software, B.-C.J. and D.-H.S.; validation, B.-C.J., D.-H.S., and Y.-J.K.; formal analysis, D.-H.S., and B.-C.J.; investigation, B.-C.J., D.-H.S., and Y.-J.K.; resources, J.-B.I. and B.-C.J.; data curation, D.-H.S., and B.-C.J.; writing—original draft preparation, B.-C.J.; writing—review and editing, B.-C.J., J.-Y.P., D.-H.S., and Y.-J.K.; visualization, B.-C.J. and J.-Y.P.; supervision, Y.-J.K.

Funding

This research was funded by POSCO, grant number 20188018.

Acknowledgments

This work was partly supported by the Korea Institute of Energy Technology Evaluation and Planning (KETEP) grant funded by the Korea government (MOTIE) (No. 70300037). This work was also partly supported by Korea Electric Power Corporation (Grant number: R18XA01).

Conflicts of Interest

The authors declare no conflicts of interest.

Nomenclature

Acronyms
CBCCoin-or branch and cut
DBDatabase
DERDistributed energy resource
DLCDirect load control
EMSEnergy management system
ESSEnergy storage system
HMIHuman-machine interface
HVACHeating ventilation, and air conditioning
GLPKGNU linear programming kit
SCIPSolving constraint integer programs
MEMSMicrogrid energy management system
MGMicrogrid
MILPMixed integer linear programming
IoTInternet-of-things
PVPhotovoltaic
RESRenewable energy sources
SCADASupervisory control and data acquisition
SOCState-of-charge
TOUTime-of-use
WTWind turbine
Sets and Indices
TSet of hourly periods in the first stage
TSet of 5 min periods in the second stage
BSet of buses in the MG
LSet of lines in the MG
i, j, kNode of electrical network i, j, kB and (i,j), (k,i) ∈ L
tTime periods, tT and tT′ for the first and second stages, respectively
dDay-ahead stage values
hHour-ahead stage values
sScheduled values
fForecasted values
max, min, refMaximum/minimum/reference values
s_lim, h_limSoft/hard limit values
Parameters and Constants
TWTime window for the first stage
TWTime window for the second stage
PcontContracted power
θPenalty factor
ΔtTime interval of the first stage
ΔtTime interval of the second stage
rParameter for objective function linearization
SOCmin, SOCmaxMinimum/maximum of the SOC
ηch, ηdchBattery charge/discharge efficiencies
ECmaxBattery capacity
Pchmax, PdchmaxMaximum charge/discharge power
SOCinitInitial SOC
Variables
ctHourly TOU price at time t
Pu,tImported power from the utility at time t
MtContinuous variable for objective function linearization at time t
WtBinary variable for objective function linearization at time t
P i , j , t Power flow from i to j at time t
P L i , t Load demands at node i at time t
P P V , t PV generation power at time t
P c h , t ,   P d c h , t Battery charge/discharge power at time t
S O C t SOC at time t
u t Binary variable for determining battery charging/discharging at time t

Appendix A

Appendix A.1. Piecewise Linear Approximation of max(0, kt) Function

Figure A1a shows the piecewise linear approximation of max(0,kt) function.

Appendix A.1.1. The Objective Function

The objective function is to minimize max(0,kt), which is described in Equation (A1).
min . m a x ( 0 , k t )
where kt equals to (xtr1).

Appendix A.1.2. Constraints

Equations (A2)–(A5) are required as constraints.
M 2 , t = m a x ( 0 , k t ) t ,
x t = r 0 + M 1 , t + M 2 , t t ,
( r 1 r 0 ) W 1 , t M 1 , t ( r 1 r 0 ) t ,
0 M 2 , t ( r 1 r 0 ) W 1 , t t ,
where M1,t, M2,t and xt are continuous decision variables at time t. In the day-ahead scheduling stage, xt is Pu,ts,d. Moreover, r0, r1, and r2 are parameters. Furthermore, W1,t is a binary decision variable at time t. All facilitate the piecewise linearization of the penalty function max(0, kt). The values of r0–2 listed in Table A1. The value of r0 is determined based on the PV generation power whose rated power is set to 100 kW. Moreover, r1 is a reference point to determine whether penalty is imposed or not. Furthermore, r2 represents the limit of the scheduled utility power, which is assumed to be smaller than two times of the contracted power Pcont.

Appendix A.2. Piecewise Linear Approximation of {−min(0, st) + max(0, lt)} Function

Figure A1b shows the piecewise linear approximation of {−min(0, st) + max(0, lt)} function.

Appendix A.2.1. The Objective Function

min . { m i n ( 0 , s t ) + m a x ( 0 , l t ) } t ,
where st and lt equal to (xtr4) and (xtr5), respectively. Note that st is negative.

Appendix A.2.2. Constraints

Equations (A7)–(A12) are required as constraints.
M 3 , t = m i n ( 0 , s t ) t ,
M 5 , t = m a x ( 0 , l t ) t ,
x t = r 3 + M 3 , t + M 4 , t + M 5 , t t ,
( r 4 r 3 ) W 2 , t M 3 , t ( r 4 r 3 ) t ,
( r 4 r 3 ) W 3 , t M 4 , t ( r 5 r 4 ) W 2 , t t ,
0 M 5 , t ( r 6 r 5 ) W 3 , t t T ,
where M3,t, M4,t, M5,t, xt are continuous variables at time t. In the hour-ahead scheduling stage, xt is SOCts,h. Moreover W2,t and W3,t are binary decision variables at time t. In addition, r3, r4, r5 and r6 are additional parameters. All decision variables and parameters are required for piecewise linearization of the penalty function {−min (0, st) +max (0, lt)}. The values of r3–6 listed in Table A1. For the proposed hour-ahead scheduling, r3 and r6 are set to the minimum and maximum hard limits on SOC levels, respectively. Moreover, r4 and r5 are the minimum and maximum soft limits on SOC values.
Figure A1. Piecewise linear approximation of penalty functions. (a) max(0, kt) function; (b) {−min(0, st) + max(0, lt)}.
Energies 12 01124 g0a1
Table A1. Parameter values for the piecewise linearization of the penalty functions.
Day-Ahead Scheduling StageHour-Ahead Scheduling Stage
ParametersValuesParametersValues
r 0 0.5 P c o n t r 3 0.1
r 1 P c o n t r 4 0.2
r 2 2 P c o n t r 5 0.8
r 6 0.9

References

  1. Hatziargyriou, N.; Asano, H.; Iravani, R.; Marnay, C. Microgrids. IEEE Power Energy Mag. 2007, 5, 78–94. [Google Scholar] [CrossRef]
  2. Ton, D.T.; Smith, M.A. The U.S. Department of Energy’s Microgrid Initiative. Electr. J. 2012, 25, 84–94. [Google Scholar] [CrossRef]
  3. Katiraei, F.; Iravani, R.; Hatziargyriou, N.; Dimeas, A. Microgrids management. IEEE Power Energy Mag. 2008, 6, 54–65. [Google Scholar] [CrossRef]
  4. Chen, C.; Duan, S.; Cai, T.; Liu, B.; Hu, G. Smart energy management system for optimal Microgrid economic operation. IET Renew. Power Gener. 2011, 5, 258–267. [Google Scholar] [CrossRef]
  5. Cong, P.; Tang, W.; Zhang, L.; Zhang, B.; Cai, Y. Day-Ahead Active Power Scheduling in Active Distribution Network Considering Renewable Energy Generation Forecast Errors. Energies 2017, 10, 1291. [Google Scholar] [CrossRef]
  6. Bakirtzis, E.A.; Biskas, P.N. Multiple Time Resolution Stochastic Scheduling for Systems with High Renewable Penetration. IEEE Trans. Power Syst. 2017, 32, 1030–1040. [Google Scholar] [CrossRef]
  7. Zhang, Z.-S.; Sun, Y.-Z.; Gao, D.W.; Lin, J.; Cheng, L. A Versatile Probability Distribution Model for Wind Power Forecast Errors and Its Application in Economic Dispatch. IEEE Trans. Power Syst. 2013, 28, 3114–3125. [Google Scholar] [CrossRef]
  8. Wang, X.; Chen, S.; Zhou, Y.; Wang, J.; Cui, Y. Optimal Dispatch of Microgrid with Combined Heat and Power System Considering Environmental Cost. Energies 2018, 11, 2493. [Google Scholar] [CrossRef]
  9. Jang, Y.-S.; Kim, M.-K. A Dynamic Economic Dispatch Model for Uncertain Power Demands in an Interconnected Microgrid. Energies 2017, 10, 300. [Google Scholar] [CrossRef]
  10. Bayod-Rújula, A.A. Future development of the electricity systems with distributed generation. Energy 2009, 34, 377–383. [Google Scholar] [CrossRef]
  11. Damiano, A.; Gatto, G.; Marongiu, I.; Porru, M.; Serpi, A. Real-Time Control Strategy of Energy Storage Systems for Renewable Energy Sources Exploitation. IEEE Trans. Sustain. Energy 2014, 5, 567–576. [Google Scholar] [CrossRef]
  12. Cagnano, A.; De Tuglie, E.; Cicognani, L. Prince—Electrical Energy Systems Lab. Electr. Power Syst. Res. 2017, 148, 10–17. [Google Scholar] [CrossRef]
  13. Moon, H.-J.; Kim, Y.J.; Chang, J.W.; Moon, S.-I. Decentralised Active Power Control Strategy for Real-Time Power Balance in an Isolated Microgrid with an Energy Storage System and Diesel Generators. Energies 2019, 12, 511. [Google Scholar] [CrossRef]
  14. Malysz, P.; Sirouspour, S.; Emadi, A. An Optimal Energy Storage Control Strategy for Grid-connected Microgrids. IEEE Trans. Smart Grid 2014, 5, 1785–1796. [Google Scholar] [CrossRef]
  15. Ju, C.; Wang, P.; Goel, L.; Xu, Y. A Two-Layer Energy Management System for Microgrids With Hybrid Energy Storage Considering Degradation Costs. IEEE Trans. Smart Grid 2018, 9, 6047–6057. [Google Scholar] [CrossRef]
  16. Sanseverino, E.R.; Di Silvestre, M.L.; Ippolito, M.G.; De Paola, A.; Lo Re, G. An execution, monitoring and replanning approach for optimal energy management in Microgrids. Energy 2011, 36, 3429–3436. [Google Scholar] [CrossRef]
  17. Bracco, S.; Brignone, M.; Delfino, F.; Procopio, R. An Energy Management System for the Savona Campus Smart Polygeneration Microgrid. IEEE Syst. J. 2017, 11, 1799–1809. [Google Scholar] [CrossRef]
  18. Morais, H.; Kádár, P.; Faria, P.; Vale, Z.A.; Khodr, H.M. Optimal scheduling of a renewable micro-grid in an isolated load area using mixed-integer linear programming. Renew. Energy 2010, 35, 151–156. [Google Scholar] [CrossRef] [Green Version]
  19. Luna, A.C.; Diaz, N.L.; Graells, M.; Vasquez, J.C.; Guerrero, J.M. Mixed-Integer-Linear-Programming-Based Energy Management System for Hybrid PV-Wind-Battery Microgrids: Modeling, Design, and Experimental Verification. IEEE Trans. Power Electron. 2017, 32, 2769–2783. [Google Scholar] [CrossRef]
  20. Chen, Y.-H.; Lu, S.-Y.; Chang, Y.-R.; Lee, T.-T.; Hu, M.-C. Economic analysis and optimal energy management models for Microgrid systems: A case study in Taiwan. Appl. Energy 2013, 103, 145–154. [Google Scholar] [CrossRef]
  21. Palma-Behnke, R.; Benavides, C.; Lanas, F.; Severino, B.; Reyes, L.; Llanos, J.; Saez, D. A Microgrid Energy Management System Based on the Rolling Horizon Strategy. IEEE Trans. Smart Grid 2013, 4, 996–1006. [Google Scholar] [CrossRef]
  22. Liu, Y.; Nair, N.-K.C. A Two-Stage Stochastic Dynamic Economic Dispatch Model Considering Wind Uncertainty. IEEE Trans. Sustain. Energy 2016, 7, 819–829. [Google Scholar] [CrossRef]
  23. Zakariazadeh, A.; Jadid, S. Smart Microgrid operational planning considering multiple demand response programs. J. Renew. Sustain. Energy 2014, 6, 013134. [Google Scholar] [CrossRef]
  24. Bao, Z.; Zhou, Q.; Yang, Z.; Yang, Q.; Xu, L.; Wu, T. A Multi Time-Scale and Multi Energy-Type Coordinated Microgrid Scheduling Solution—Part I: Model and Methodology. IEEE Trans. Power Syst. 2015, 30, 2257–2266. [Google Scholar] [CrossRef]
  25. Bao, Z.; Zhou, Q.; Yang, Z.; Yang, Q.; Xu, L.; Wu, T. A Multi Time-Scale and Multi Energy-Type Coordinated Microgrid Scheduling Solution—Part II: Optimization Algorithm and Case Studies. IEEE Trans. Power Syst. 2015, 30, 2267–2277. [Google Scholar] [CrossRef]
  26. Wu, X.; Wang, X.; Qu, C. A Hierarchical Framework for Generation Scheduling of Microgrids. IEEE Trans. Power Deliv. 2014, 29, 2448–2457. [Google Scholar] [CrossRef]
  27. Zhang, C.; Xu, Y.; Dong, Z.Y.; Ma, J. Robust Operation of Microgrids via Two-Stage Coordinated Energy Storage and Direct Load Control. IEEE Trans. Power Syst. 2017, 32, 2858–2868. [Google Scholar] [CrossRef]
  28. Jin, X.; Wu, J.; Mu, Y.; Wang, M.; Xu, X.; Jia, H. Hierarchical Microgrid energy management in an office building. Appl. Energy 2017, 208, 480–494. [Google Scholar] [CrossRef]
  29. Xu, G.; Shang, C.; Fan, S.; Hu, X.; Cheng, H. A Hierarchical Energy Scheduling Framework of Microgrids with Hybrid Energy Storage Systems. IEEE Access 2018, 6, 2472–2483. [Google Scholar] [CrossRef]
  30. Marzband, M.; Yousefnejad, E.; Sumper, A.; Domínguez-García, J.L. Real time experimental implementation of optimum energy management system in standalone Microgrid by using multi-layer ant colony optimization. Int. J. Electr. Power Energy Syst. 2016, 75, 265–274. [Google Scholar] [CrossRef] [Green Version]
  31. Sreedharan, P.; Farbes, J.; Cutter, E.; Woo, C.K.; Wang, J. Microgrid and renewable generation integration: University of California, San Diego. Appl. Energy 2016, 169, 709–720. [Google Scholar] [CrossRef]
  32. Kabalci, Y. A survey on smart metering and smart grid communication. Renew. Sustain. Energy Rev. 2016, 57, 302–318. [Google Scholar] [CrossRef]
  33. Manur, A.; Venkataramanan, G.; Sehloff, D. Simple electric utility platform: A hardware/software solution for operating emergent Microgrids. Appl. Energy 2018, 210, 748–763. [Google Scholar] [CrossRef]
  34. Zia, M.F.; Elbouchikhi, E.; Benbouzid, M. Microgrids energy management systems: A critical review on methods, solutions, and prospects. Appl. Energy 2018, 222, 1033–1055. [Google Scholar] [CrossRef]
  35. Su, W.; Wang, J. Energy Management Systems in Microgrid Operations. Electr. J. 2012, 25, 45–60. [Google Scholar] [CrossRef]
  36. Lee, E.-K.; Shi, W.; Gadh, R.; Kim, W. Design and Implementation of a Microgrid Energy Management System. Sustainability 2016, 8, 1143. [Google Scholar] [CrossRef]
  37. Kim, Y.-J.; Wang, J.; Lu, X. A Framework for Load Service Restoration Using Dynamic Change in Boundaries of Advanced Microgrids With Synchronous-Machine DGs. IEEE Trans. Smart Grid 2018, 9, 3676–3690. [Google Scholar] [CrossRef]
  38. Pinceti, P.; Vanti, M. An Algorithm for the Automatic Detection of Islanded Areas Inside an Active Network. IEEE Trans. Smart Grid 2015, 6, 3020–3028. [Google Scholar] [CrossRef]
  39. Chen, C.; Wang, J.; Qiu, F.; Zhao, D. Resilient Distribution System by Microgrids Formation After Natural Disasters. IEEE Trans. Smart Grid 2016, 7, 958–966. [Google Scholar] [CrossRef]
  40. Wang, Z.; Wang, J. Service Restoration Based on AMI and Networked Microgrids Under Extreme Weather Events. IET Gener. Transm. Distrib. 2017, 11, 401–408. [Google Scholar] [CrossRef]
  41. Nemati, M.; Braun, M.; Tenbohlen, S. Optimization of unit commitment and economic dispatch in Microgrids based on genetic algorithm and mixed integer linear programming. Appl. Energy 2018, 210, 944–963. [Google Scholar] [CrossRef]
  42. CBC Solver. Available online: https://projects.coin-or.org/Cbc (accessed on 21 March 2019).
  43. PuLP. Available online: https://www.coin-or.org/PuLP/ (accessed on 21 March 2019).
  44. Cagnano, A.; Caldarulo Bugliari, A.; De Tuglie, E. A cooperative control for the reserve management of isolated Microgrids. Appl. Energy 2018, 218, 256–265. [Google Scholar] [CrossRef]
Figure 1. Architecture of the implemented IoT-based campus MG.
Energies 12 01124 g001
Figure 2. Configuration of the implemented campus MG.
Energies 12 01124 g002
Figure 3. Time framework for the proposed two-stage scheduling.
Energies 12 01124 g003
Figure 4. Flowchart of the proposed two-stage scheduling for one day.
Energies 12 01124 g004
Figure 5. HMI screens of the forecasted and actual profiles before and during a typical winter day (a) load; (b) PV generation.
Energies 12 01124 g005
Figure 6. HMI screens showing the scheduled battery power, utility power, and net load of (a) day-ahead scheduling; (b) hour-ahead scheduling.
Energies 12 01124 g006
Figure 7. The two-stage scheduling profiles created by the CPLEX and CBC MILP solvers. (a) Imported utility power; (b) battery power; (c) SOC.
Energies 12 01124 g007
Figure 8. MG operating costs by changes in PV and battery capacities.
Energies 12 01124 g008
Table 1. Summary of previous studies on the optimal scheduling using ESS in MG.
Ref.Problem Types 1Validation Methods 2
SSTSSITest-Bed
[14] Grid-connected MG
[15] Grid-connected MG
[16] Centro Elettrotecnico Sperimentale Italiano, Italy
[17] University of Genoa Smart Polygeneration Microgrid, Italy
[18] Budapest Tech Renewable Equipment, Hungary
[19] MG Research Laboratory in Aalborg University, Denmark
[20] Institue of Nuclear Energy Research MG, Taiwan
[21] Huatacondo village, Chile
[23] Grid-connected MG in distribution network
[24,25] Cooling and electricity coordinate MG
[26] 14 bus radial system
[27] IEEE 33 bus radial system
[28] MG in an office building
[29] 7 bus MG
[30] Islanded Catalonia Institute for Energy Research MG
[31] University of California San Diego, USA
1SS: Single-Stage, TS: Two-Stage. 2S: Simulation level, I: Implementation level.
Table 2. Features of P-type and H-type IoT sensors.
Types (Number)Sampling Frequency (Hz)Average/Maximum Error Rates (%)Load TypesInformation
P (54)10.43/4.94Lightning and plug-in loadsvoltage, current, power factor, active/reactive/apparent power
H (23) 8 × 10 3 0.50/4.32HVAC systemsvoltage, current, power factor, active/reactive/apparent power frequency, total harmonic distortion/crest factor
Table 3. ESS parameters.
ParametersValuesUnits
Pchmax125(kW)
Pdchmax250(kW)
ECmax250(kWh)
SOCh_limmax90(%)
SOCs_limmax80(%)
SOCh_limmin10(%)
SOCs_limmin20(%)
ηch80(%)
ηdch80(%)
Table 4. Considered TOU price.
ClassificationsTime PeriodsPrices ($/kWh)
Off-peak23:00 ~ 09:000.0487
Mid-peak09:00 ~ 10:00
12:00 ~ 13:000.0687
17:00 ~ 23:00
On-peak10:00 ~ 12:000.0948
13:00 ~ 17:00
Table 5. Comparison results of CBC and CPLEX.
MILP SolversOptimal Values ($)Computation Time (s)
Day-AheadHour-AheadDay-AheadHour-Ahead 1
CBC84.21011.063.25
CPLEX84.2100.290.16
1 First time interval of the hour-ahead scheduling.