Article

Torque Optimal Allocation Strategy of All-Wheel Drive Electric Vehicle Based on Difference of Efficiency Characteristics between Axis Motors

1
School of Electrical and Electronic Engineering, Harbin University of Science and Technology, Harbin 150080, Heilongjiang, China
2
State Key Laboratory of Automotive Safety and Energy, Tsinghua University, Beijing 100084, China
*
Author to whom correspondence should be addressed.
Energies 2019, 12(6), 1122; https://doi.org/10.3390/en12061122
Submission received: 25 February 2019 / Revised: 14 March 2019 / Accepted: 19 March 2019 / Published: 22 March 2019
(This article belongs to the Special Issue Progresses in Advanced Research on Intelligent Electric Vehicles)

Abstract

:
All-wheel drive is an important technical direction for the future development of pure electric vehicles. The difference in the efficiency distribution of the shaft motor caused by the optimal load matching and motor manufacturing process, the traditional torque average distribution strategy is not applicable to the torque distribution of the all-wheel drive power system. Aiming at the above problems, this paper takes the energy efficiency of power system as the optimization goal, proposes a dynamic allocation method to realize the torque distribution of electric vehicle all-wheel drive power system, and analyzes and verifies the adaptability of this optimization algorithm in different urban passenger vehicle working cycles. The simulation results show that, compared with the torque average distribution method, the proposed method can effectively solve the problem that the difference of the efficiency distribution of the two shaft motors in the power system affects the energy consumption of the power system. The energy consumption rate of the proposed method is reduced by 5.96% and 5.69%, respectively, compared with the average distribution method under the China urban passenger driving cycle and the Harbin urban passenger driving cycle.

1. Introduction

As a new type of powertrain structure, all-wheel-drive electric vehicles can be equipped with drive motors on the front and rear two-wheel drive shafts of electric vehicles, or by installing power wheels such as hubs or wheel-side motors at the wheels to drive the vehicles. As a unique power system, the structure can realize flexible distribution of torque and improve the power, economy. and stability of electric vehicles [1,2].
In the research of powertrain control of all-wheel-drive electric vehicles, the literature [3] developed a kind of anti-interference and model for the four-wheel-drive hybrid vehicle equipped with dry dual-clutch transmission, taking full advantage of the dual clutch participation mode conversion process. Robust control algorithm for parametric mode-switching to coordinate torque between different power sources and clutches to minimize vehicle longitudinal jitter. The literature [4] proposed a hierarchical control system for electric vehicles driven by four-wheel independent motors, which implemented nonlinear model predictive control at the upper level to solve the problem of nonlinear multi-input and multi-output over-drive, and realized driving and regenerative braking control of independent motors at the lower level through PID algorithm. The literature [5,6] proposed a method for estimating the longitudinal force and side slip angle of four-wheel independent driving electric vehicles based on observer iteration and information fusion.
The electric drive wheel model is introduced into the vehicle modeling process and used for longitudinal force estimation. The longitudinal force reconstruction equation is obtained by model decoupling. The Luenberger observer and the high-order sliding mode observer are combined to design the longitudinal force observer. The Kalman filter is used to suppress the effects of noise.
By estimating the longitudinal force, the estimation strategy is proposed based on observer iteration and information fusion. Literature [7] discusses the influence of motor output power limit, road friction coefficient and wheel torque response on stability control, and the influence of motor idling loss on torque distribution method. Based on this, a vehicle dynamics control method based on vehicle steady state is proposed. Under normal driving cycles, the energy efficiency of the power system is improved by the torque distribution between the front and rear wheels. Literature [8] proposes a hierarchical control algorithm for the all-wheel drive system. The upper layer is composed of the supervision-expected motion tracking controller and the lower layer is composed of the optimized controller. In the upper controller, the desired vehicle motion is calculated by considering the transient cornering characteristics. In the desired motion tracking controller, in order to track the desired vehicle motion, the virtual control input is determined in a sliding mode-controlled manner. In the lower control allocation, the cost function is minimized as the optimization target, and the tire dissipating energy under driving cycles is effectively reduced.
Literature [9] proposes a new electric powertrain structure with hub motor at the front wheel and clutch at the back of the transmission to provide maximum traction to control hub motor to cycle near optimum slip point. Based on the front wheel’s cycle mode, the desired wheel speed of the rear wheel is defined. The rear wheel is controlled by controlling clutch torque to track the defined speed. Based on this, a sliding mode controller using the nonlinear characteristics of the tire is proposed, which can realize its function without relying on feedback error. Literature [10] solves the optimization problem based on nonlinear four-wheel vehicle model to create reference sideslip Angle and yaw rate to minimize energy consumption due to wheel skid. A subsequent linear quadratic controller calculates the yaw moment around the vertical axis of the vehicle to follow the desired reference value. A torque distribution algorithm that considers the energy efficiency characteristics of the motor is proposed to provide the required propulsive force and yaw torque with minimal loss of power. In [11], a control strategy with switched drive mode is proposed. The control strategy is based on two vehicle speed estimation algorithms. The vehicle speed estimation algorithm based on the unscented Kalman filter is designed as a four-wheel drive mode condition, and is based on the wheel speed. The vehicle speed estimation algorithm is designed as two-wheel drive, and the vehicle speed smoothing algorithm is applied in the two vehicle speed estimation switching processes.
Literature [12] proposed a layered control strategy for four-wheel drive hybrid vehicles. In the high-level controller, the signal phase and timing information and the optimal cruising speed are combined to produce the target speed of the HEV. A model predictive controller is proposed that focuses on tracking target speed and associated expected control variables for each individual vehicle for predicting the optimal speed. In the lower controller, a dynamic planning strategy is developed to optimize the global energy management using the predicted speed. Literature [13] developed a three-layer hierarchical control system. In the upper layer, the integrated two-degree-of-freedom (DOF) linear model is used to calculate the equivalent yaw moment for vehicle stability. Due to actuator limitations, the intermediate layer solves the linear quadratic regulator (LQR) problem by Weighted Least Squares (WLS) method to optimally distribute wheel torque. At the lowest level, the Slip Ratio Controller (SRC) is applied to redistribute the actual torque based on the sliding mode method. The literature [14] also proposes a two-layer controller for the four-wheel-drive electric vehicle. The upper controller consists of a speed tracking controller, a yaw moment controller and four-wheel slip controllers, which are used to calculate the expected value of the traction force. The expected value of the pendulum torque and the corresponding net torque input for the four wheels. In the lower controller, a torque distribution strategy based on the dynamic load of the tire and an optimal torque distribution strategy based on the minimum objective function are designed to control the motor drive torque or the regenerative brake torque.
In summary, in the research of powertrain control of all-wheel-drive electric vehicles, the focus is on establishing the motor loss model and the wheel adhesion optimization model, designing the multi-layer controller structure, the upper layer decision target torque, and the lower layer through the control motor. In the target torque distribution decision process, most of them rely on the torque distribution method of the motor based on the dynamic load change of the tire. In the process of torque distribution decision, the local optimization algorithm is used to control the strategy.
Although the local optimal solution can be obtained, the local optimization requires specific qualification conditions, and it is impossible to obtain the optimal energy efficiency of the electric vehicle electric drive system under the whole driving cycle, resulting in a lack of globality under known driving cycles. In the actual all-wheel drive system, the characteristic parameters of multiple motors often have certain differences due to manufacturing processes and the like, and it provides an intractable problem for torque distribution optimization.
In this paper, a two-axis motor all-wheel drive system for electric vehicles is considered. Under the premise of the difference of efficiency distribution of front and rear axle motors, the power system efficiency is taken as the optimization goal, and a torque allocation strategy based on dynamic programming (DP) algorithm is proposed. The strategy realizes the optimal torque distribution of the two-axle motor all-wheel drive system under different passenger vehicle driving cycles.

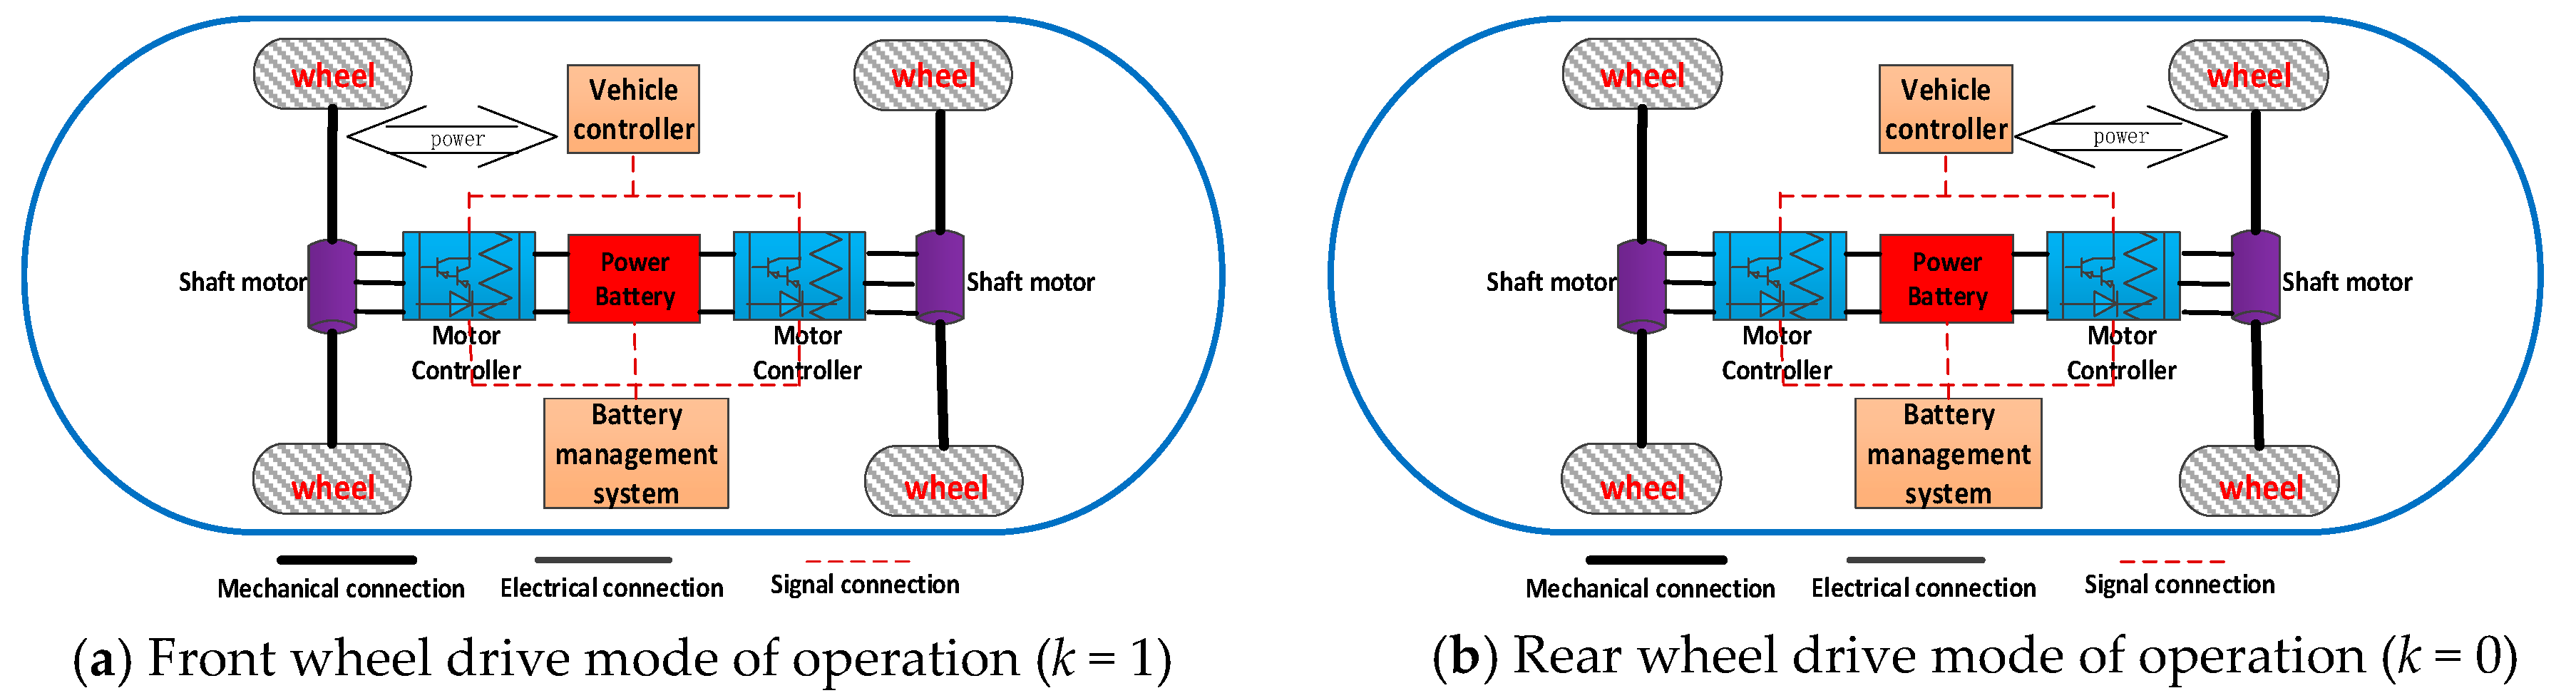
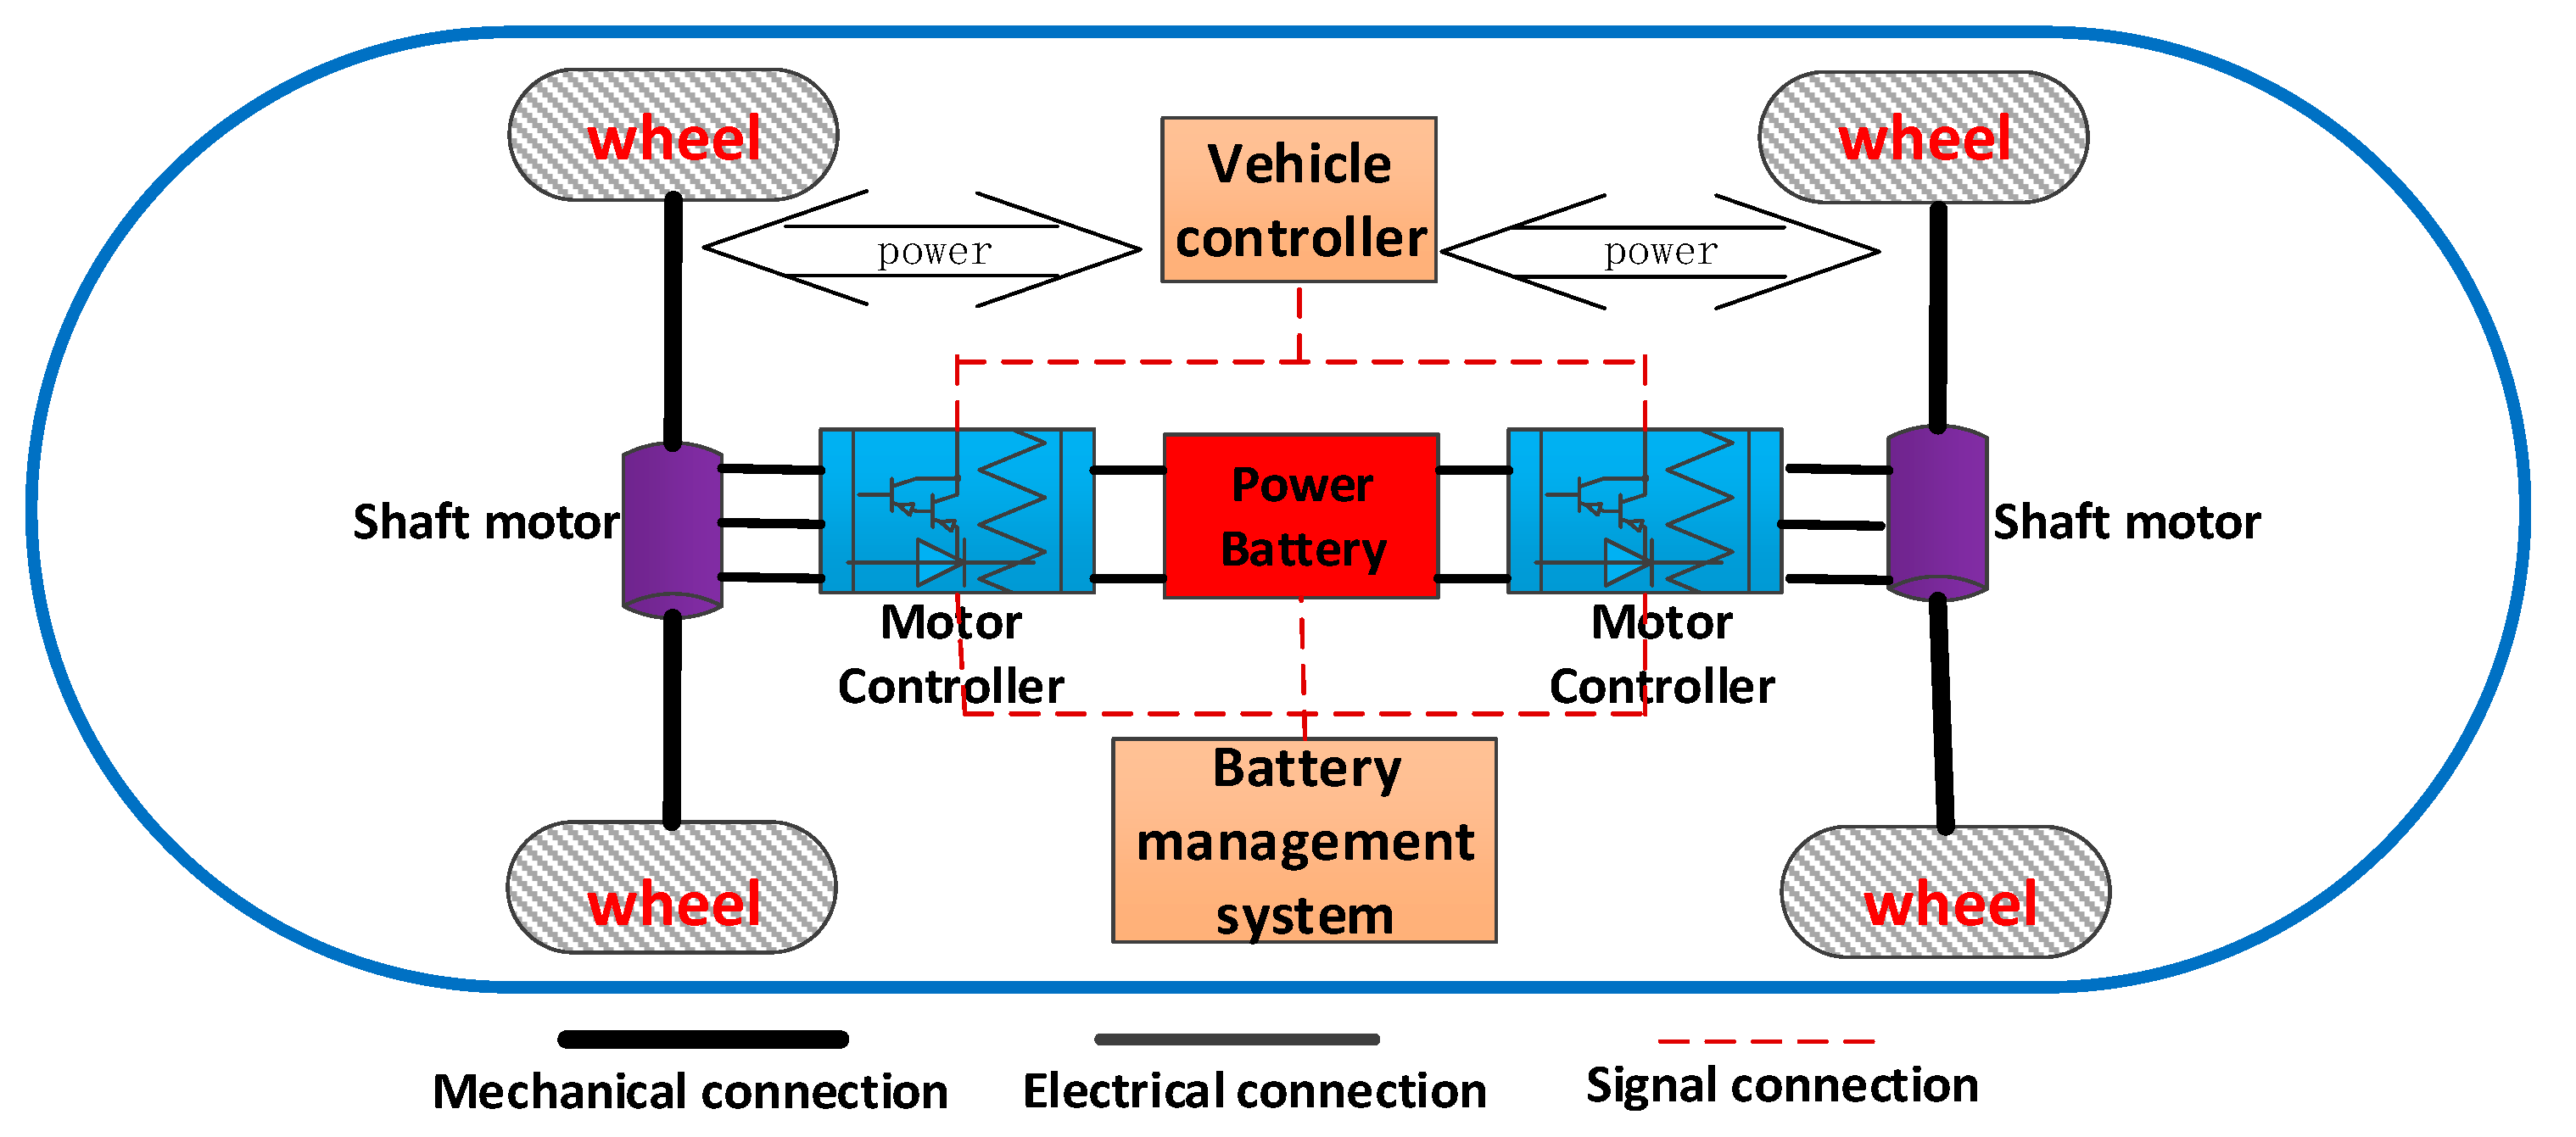
2. All-Wheel Drive Power System Structure and Working Mode

2.1. Vehicle Dynamic Model

The structure of the all-wheel-drive electric vehicle power system studied in this paper is shown in Figure 1. The main structure includes two front and rear shaft motors, a motor controller, a power battery and a vehicle controller. The power battery provides energy for driving the shaft motor, and the shaft motor directly drives the vehicle. Each axis motor is equipped with a motor controller that independently controls its operating state. At the start, the output torque of the shaft motor is calculated by the vehicle controller and the information is transmitted to the power battery management system and the motor controller. The drive state of the all-wheel drive electric vehicle of the shaft motor is mainly the front wheel (rear wheel) independent drive, the four-wheel simultaneous drive and the two-wheel/four-wheel switch drive control mode. In the full-time two-wheel drive mode, the vehicle controller sends a control signal to drive the front or rear axle motor to run, and the power battery provides energy to drive the electric vehicle. In the full-time four-wheel drive mode, the vehicle controller sends a control signal to drive the front/rear axle motors to run together, and the power battery provides energy to drive the electric vehicle. The time-sharing two-wheel four-wheel switching mode is when the power demand of the electric vehicle is less than a certain threshold, the control signal is sent by the vehicle controller, and the two-wheel drive is used to provide driving energy to the front or rear wheel motor by the power battery. When the demand power of the electric vehicle is greater than a predetermined threshold, the four-wheel drive is used to provide energy to the two shaft motors by the power battery, which not only satisfies the power demand but also improves the working efficiency of the motor. Therefore, the main control method of the all-wheel-drive electric vehicle can be summarized as follows: In order to improve the working efficiency of the drive motor, according to the change of the required power, it is decided to adopt the two-wheel drive or the four-wheel drive mode switching control drive mode [15,16].

2.2. Working Mode

The all-wheel-drive electric vehicle power system can work independently on the front/rear wheels and drive all the two modes simultaneously. Figure 1 shows the power flow of an all-wheel-drive vehicle operating in front/rear wheel independent drive mode. It can be seen from Figure 1 that the all-wheel-drive electric vehicle can work in two-wheel independent driving mode when the required power can be satisfied under the condition of one shaft motor. Figure 1a represents the front wheel drive mode, where the rear wheel is in the follow-up state, and we define k as the torque distribution characteristic, k = 1. Figure 1b represents the rear wheel drive mode, where the front wheel is in the follow-up state, and we define k = 0. At this time, the vehicle controller calculates the required power and the required torque according to the vehicle speed. The motor controller controls the speed and torque of the shaft motor according to the motor demand speed and torque command sent by the vehicle controller, so that the output meets the demand. Power requirements. When the vehicle brakes, the shaft motor is in the power generating state, and the braking power can be transmitted to the power battery through the motor controller for recovery.
Figure 2 shows the power flow of an all-wheel-drive automotive powertrain in all-wheel simultaneous drive mode. In this time, the torque distribution characteristic k = 0.5. It can be seen from Figure 2 that when the required power is not satisfied by one axis motor, the required power is shared by the two shaft motors. At this time, the controller calculates the required power and the required torque according to the vehicle speed and allocates two before and after. The output torque of each of the shaft motors and the two motor controllers send the required speed and torque command according to the vehicle controller, and control the speed and torque of the two front and rear shaft motors to make the output meet the demand power requirements. When the vehicle brakes, the shaft motor is in the power generating state, and the braking power can be transmitted to the power battery through the motor controller for recovery.

3. Power System Modeling

In order to study the torque distribution strategy of all-wheel drive power system, this paper carries out the power system modeling of all-wheel drive electric vehicle in Matlab/Simulink environment, and carries out simulation analysis of energy efficiency on this basis.

3.1. Vehicle Dynamic Model

When the electric vehicle is driving on the road, the traction motor needs to overcome the running resistance (Ft), including rolling resistance (Ff), air resistance (Fw), slope resistance (Fi) and acceleration resistance (Fj), which satisfy the following formula:
F t = F f + F w + F i + F j
F f = f m g cos α
F i = m g sin α
F w = 1 2 C d A ρ v 2
F j = m a
where f is the rolling resistance coefficient, m is the mass of the electric vehicle, g is the acceleration of gravity, taking 9.8 m/s2, α is the slope of the road. This paper assumes α = 0, Cd is the air resistance coefficient, and A is the windward area of the electric vehicle. The ρ is the air density, and v is the vehicle speed.
The traction motor in Equation (1) overcomes the running resistance (Ft), and the output power Pm of the electric motor is:
P m = F t × v
According to the power balance characteristics of electric vehicles, the relationship is satisfied at time t.
P dem = P m + P loss , m
Among them, Pdem is the power demanded by the power system, and Ploss,m is the power loss of the motor.

3.2. Motor Model

In order to reduce the computational burden of the system, the model of the shaft motor established in this paper ignores the dynamic characteristics of the motor. Because of the loss of efficiency in the process of mutual conversion between electric power and mechanical power, a static map can be used as a model for driving the motor [17]. At the same time, the driving motor must meet the conditions as shown in Equations (8)–(10). Since this paper considers the torque distribution strategy when there is a difference in the efficiency of the shaft motor, the front and rear wheels use motors with the same output power and different efficiency curves.
P m ( t ) = T m ( t ) ω m ( t )
T m ( t ) [ T m , min ( ω m ( t ) ) , T m , max ( ω m ( t ) ) ]
ω m ( t ) [ 0 , ω m , max ( t ) ]
Among them, Tm and ωm are the output torque and speed of the drive motor.

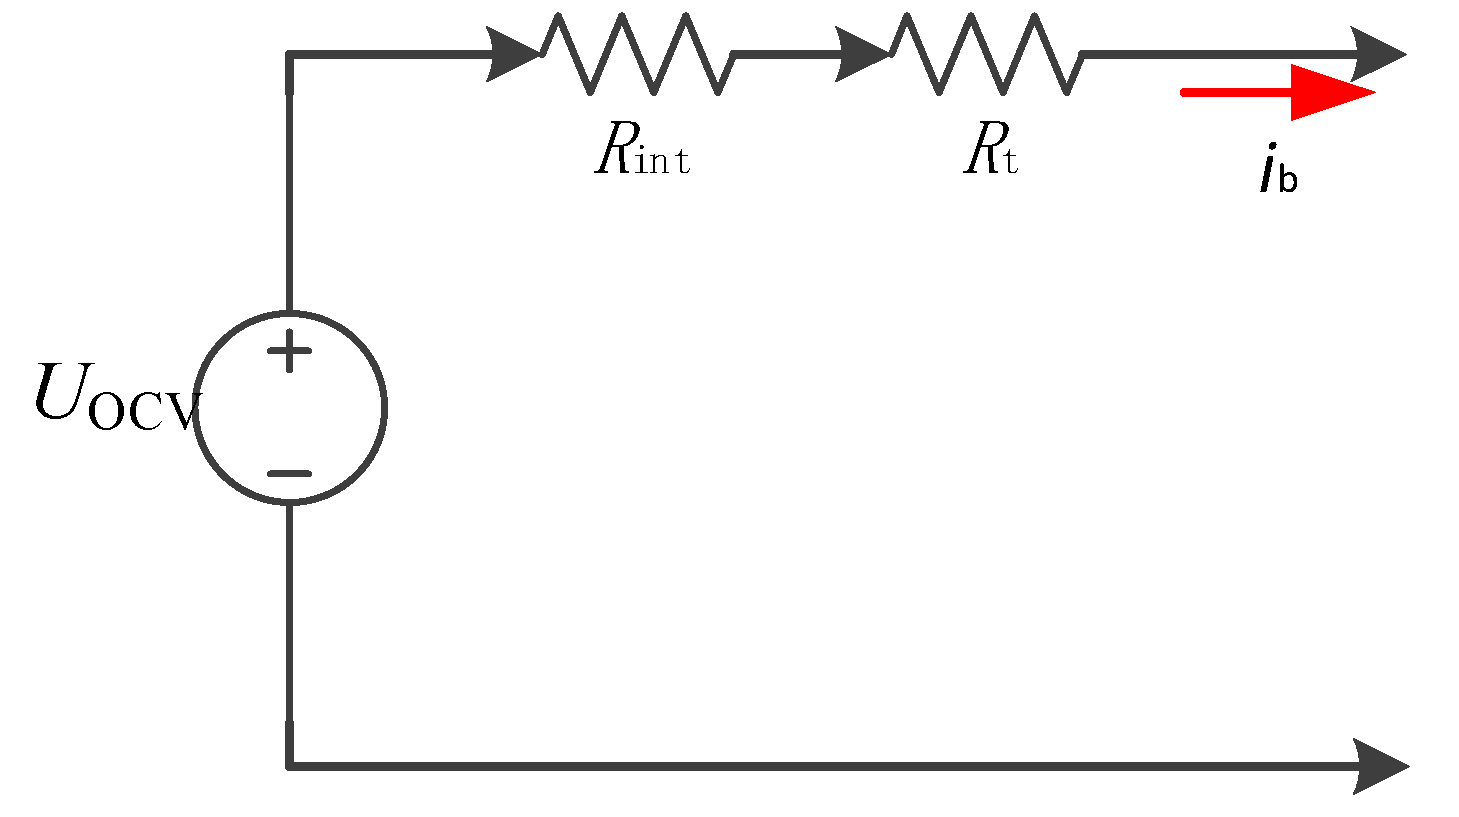
3.3. Power Battery Model

The simplified model of the battery equivalent circuit selected in this paper is shown in Figure 3. The equation of battery SOC (State of Charge) is as shown in Equations (11) and (12) [18,19].
S O C ˙ = I ( k ) Q bat
S O C ˙ = η SOC U OCV ( S O C ) U OCV 2 ( S O C ) 4 ( R int ( S O C ) + R t ) P m ( k ) 2 ( R int ( S O C ) + R t ) Q bat
where I is the battery current, A; Qbat is the battery capacity, Ah; ηSOC is the coulomb efficiency; UOCV is the open circuit voltage of the battery, V; Rint and Rt are the polarization internal resistance and ohmic internal resistance of the battery, Ω; Rint and UOCV are the function of the battery SOC as a variable; Pm is the required power of the drive motor, kW.
According to reference [20], the battery discharge efficiency ηdis in the model is calculated using Equation (13).
η dis = U ocv I R dis U ocv = 1 2 ( 1 + 1 4 R dis P bat U ocv 2 ) , P motor ( k ) 0
Among them, Rdis is the internal resistance of the battery discharge.

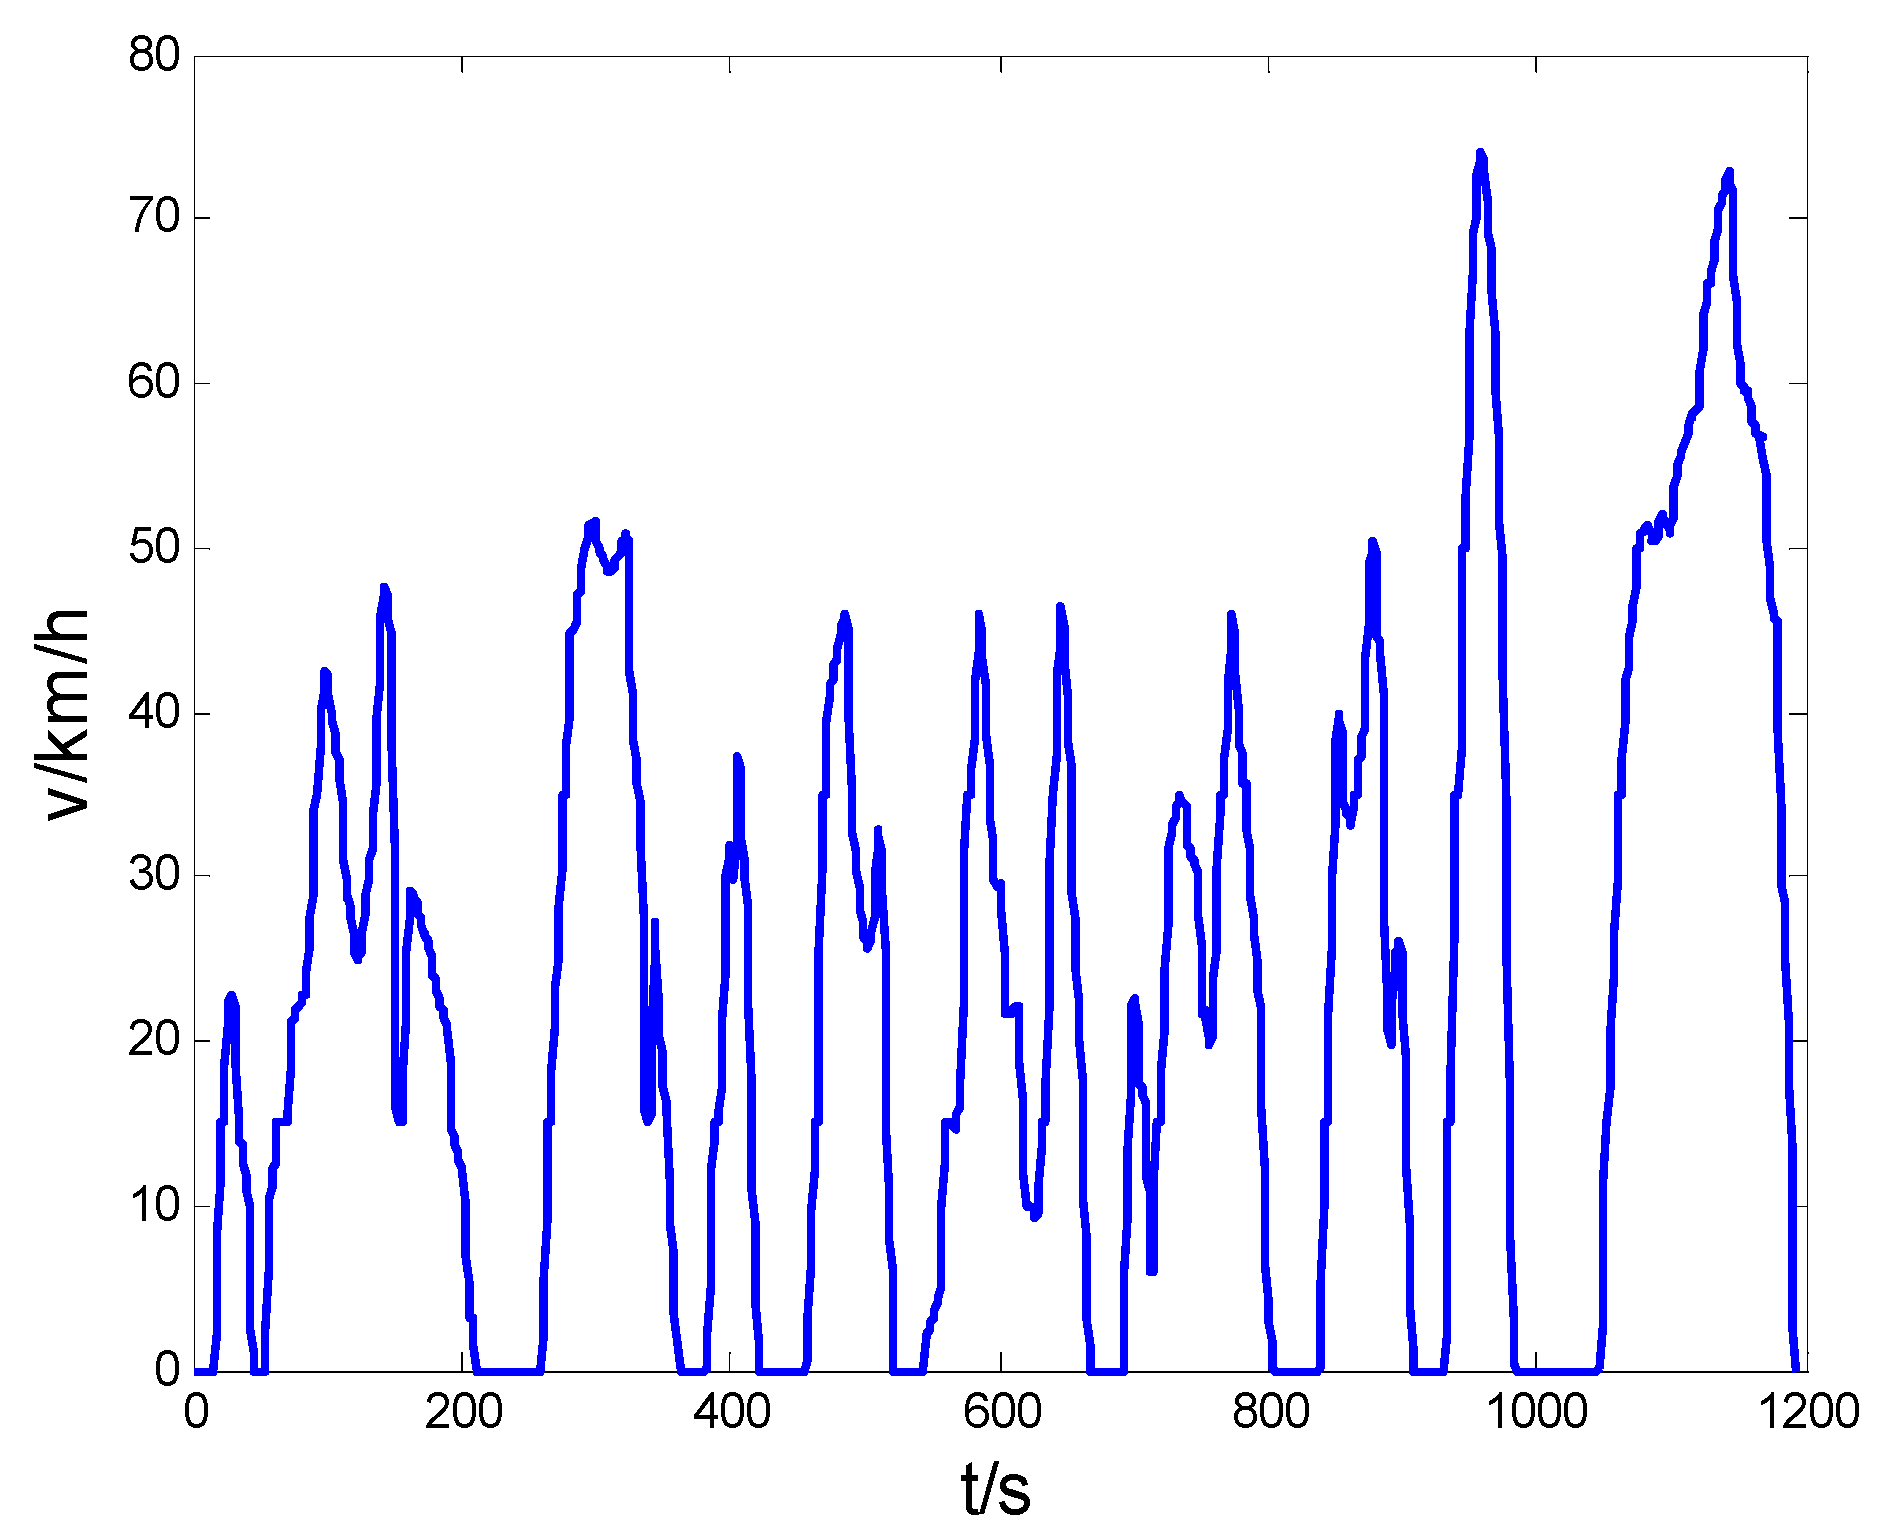
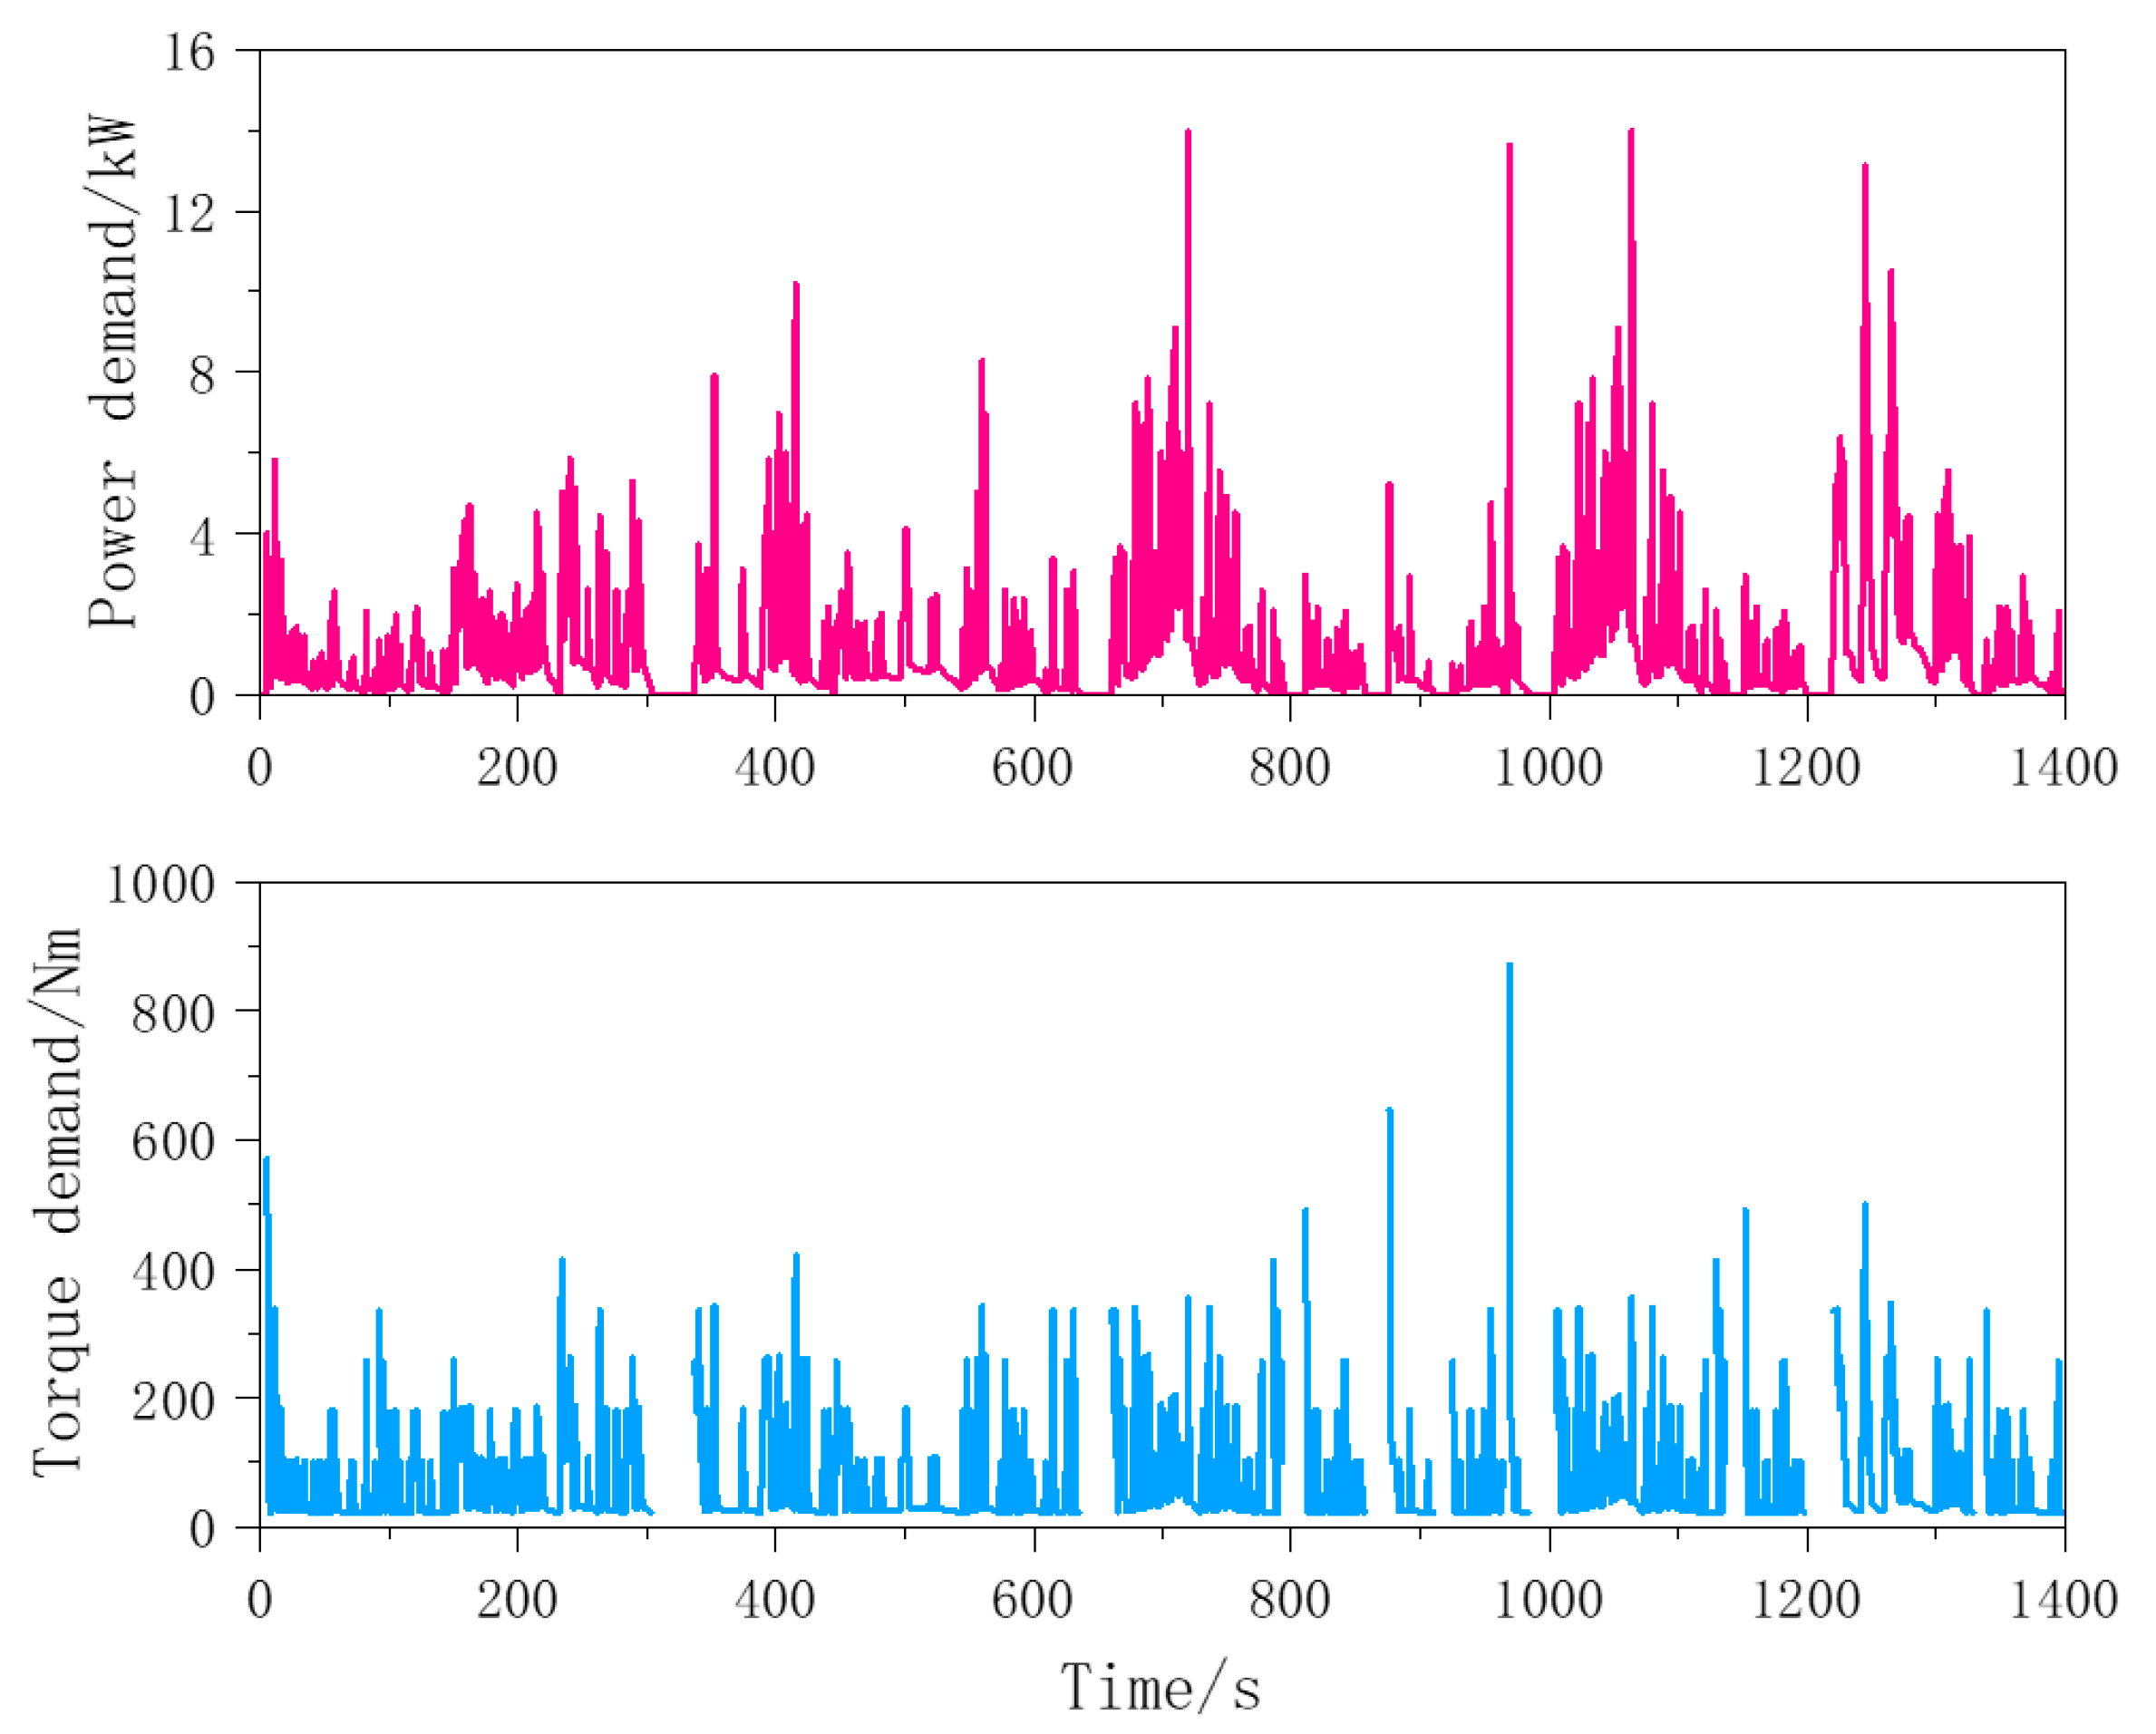
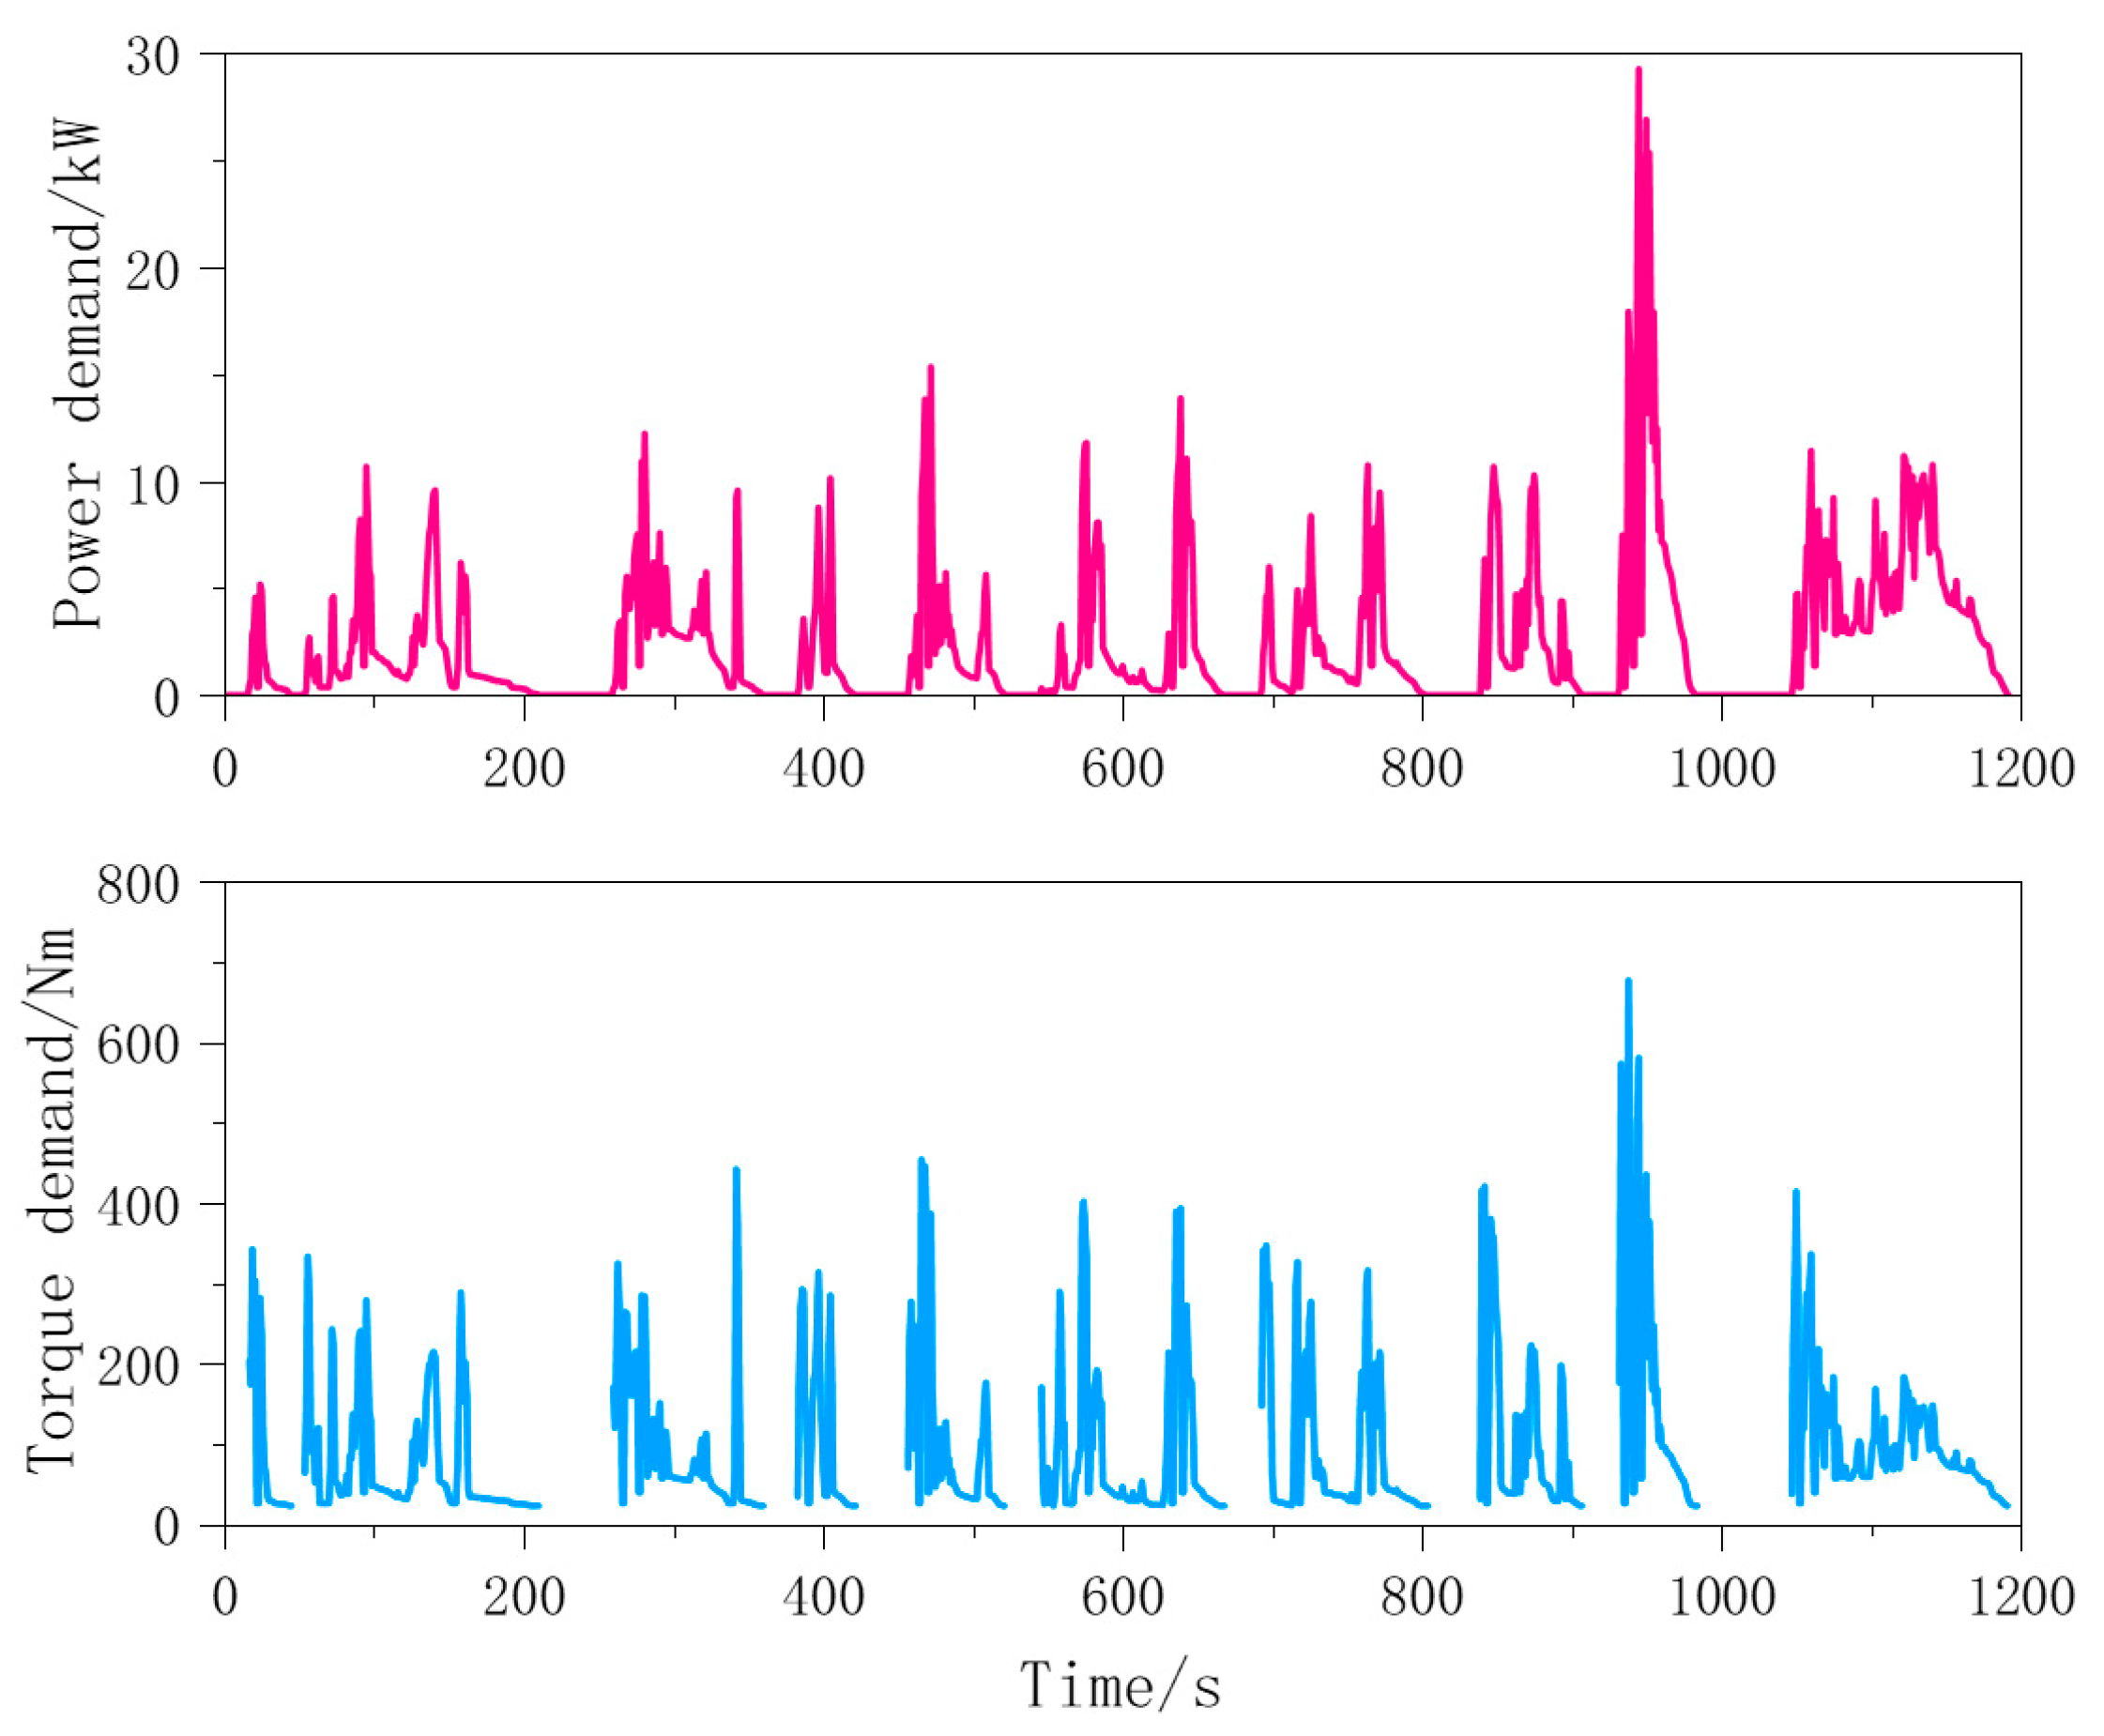
3.4. Operating Conditions

Because this paper wants to verify the effectiveness of the proposed allocation strategy in different passenger car driving cycles, it chooses the passenger vehicle urban driving cycles and the Harbin urban passenger driving cycle (HUPDC). The road conditions of the vehicle are used as the cycle conditions of the simulation model. The selected the China urban passenger driving cycle (CUPDC) is shown in Figure 4. The HUPDC is shown in Figure 5 [21]. Table 1 compares the characteristic values of the two urban passenger cars driving cycle. It can be seen from Table 1 that there are large differences in the main characteristic values of the selected two passenger vehicle driving cycles, which can basically provide different types of passengers for the torque distribution strategy of the proposed all-wheel-drive electric vehicle.

4. Torque Optimization Allocation Method Based on Difference in Efficiency Characteristics between Shafts

4.1. Torque Optimization Problem

In this paper, the optimal operation of the drive motor is improved by the optimal distribution of the drive torque, so that the drive motor operates in the high efficiency zone at a certain speed. Therefore, the torque optimal distribution control can be expressed as a problem of determining the torque distribution coefficient k of the front and rear wheels (axes). The coefficient k is defined as the torque distribution characteristic between the front and rear wheels (axis) after the start of the control, as shown in Equation (14), and the boundary condition is as shown in Equation (15).
k = T f T f + T r
{ T f + T r = T req 0 T f T req 0 T r T req 0 k 1
where Tf is the torque value of the front axle motor, Tr is the torque value of the rear axle motor, and Treq is the demand torque of the vehicle.
When k = 0, it is expressed as a separate rear wheel drive. When k = 1, it is expressed as a separate front wheel drive. When k = 0.5, it is expressed as a four-wheel torque average distribution mode.
The driving energy utilization efficiency under the condition of the shaft motor driving can be expressed as the Equation (16).
max η = [ k η f ( k T dem , n ) + ( 1 k ) η r ( ( 1 k ) T dem , n ) ]
where ηf is the efficiency of the front axle motor, ηr is the efficiency of the rear axle motor. And n is the corresponding of the axle motor speed. The boundary condition satisfies the Equation (17).
{ n < n max 0 < T f < T dem 0 < T r < T dem T dem < T max
Under the interference of other factors, the overall efficiency of the system can be obtained, and the energy consumption of the shaft motor drive system under driving cycles can be simplified as follows:
E = 0 t ( P dem × η ) d t

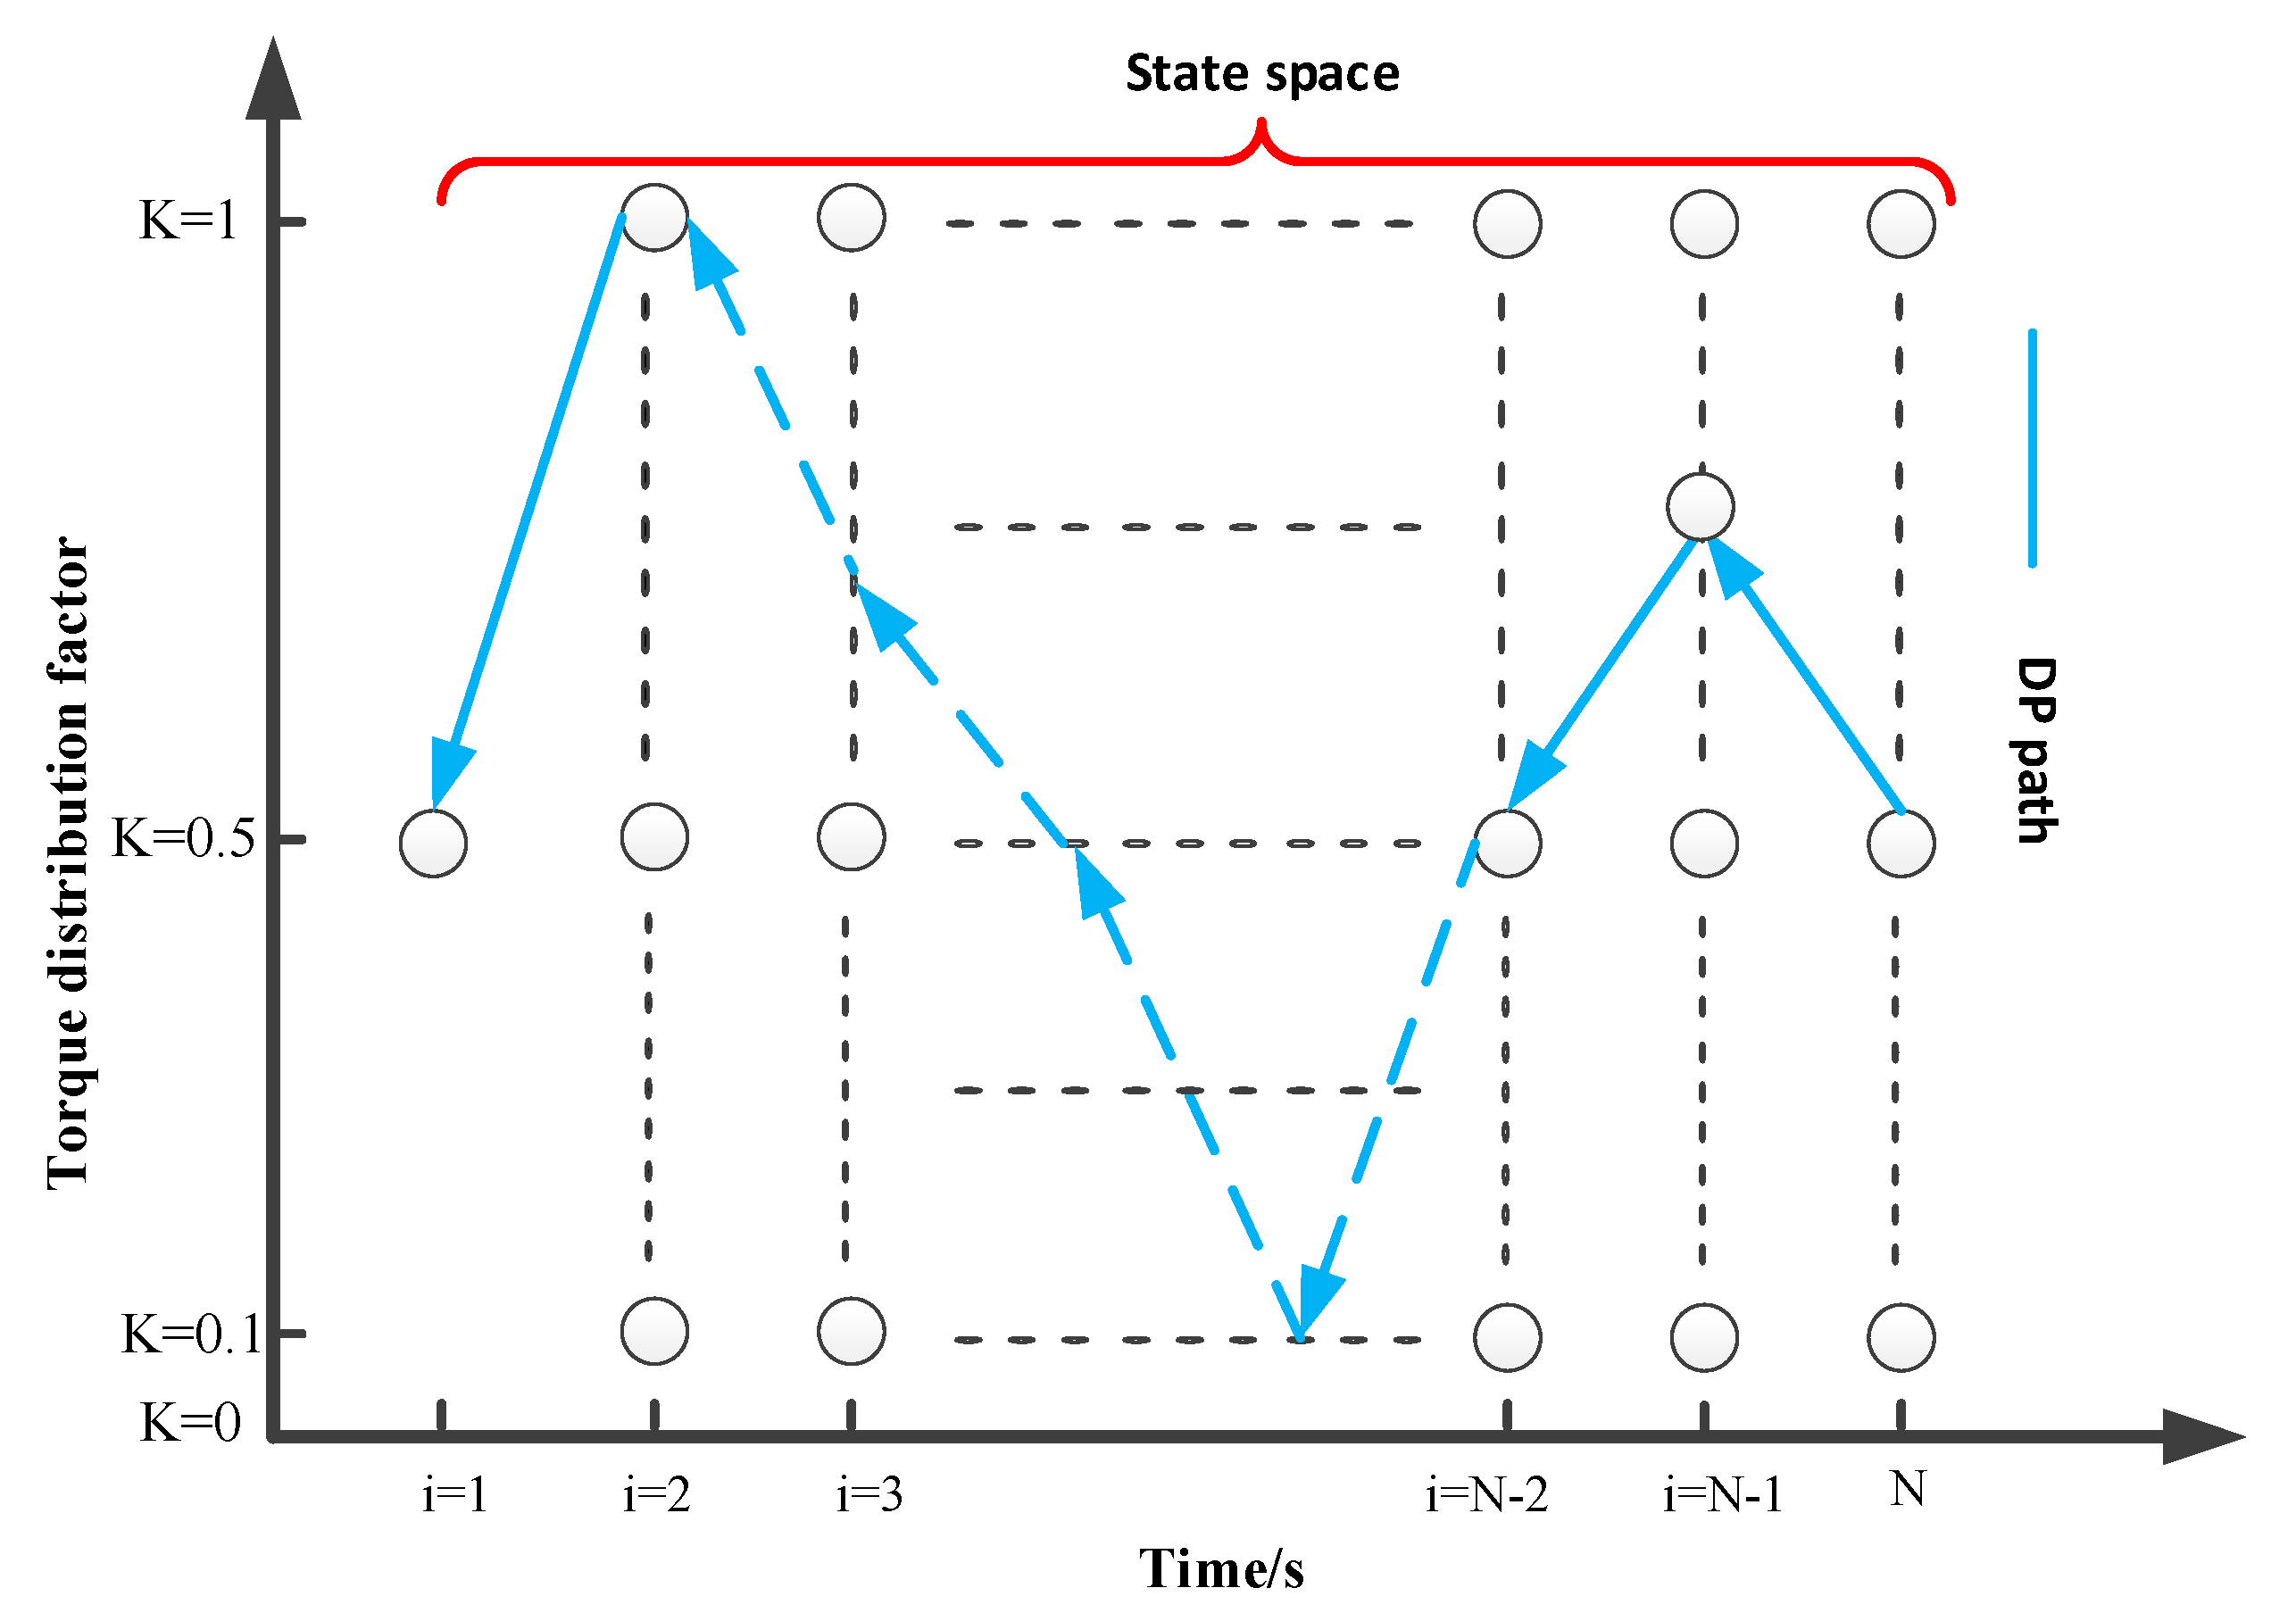
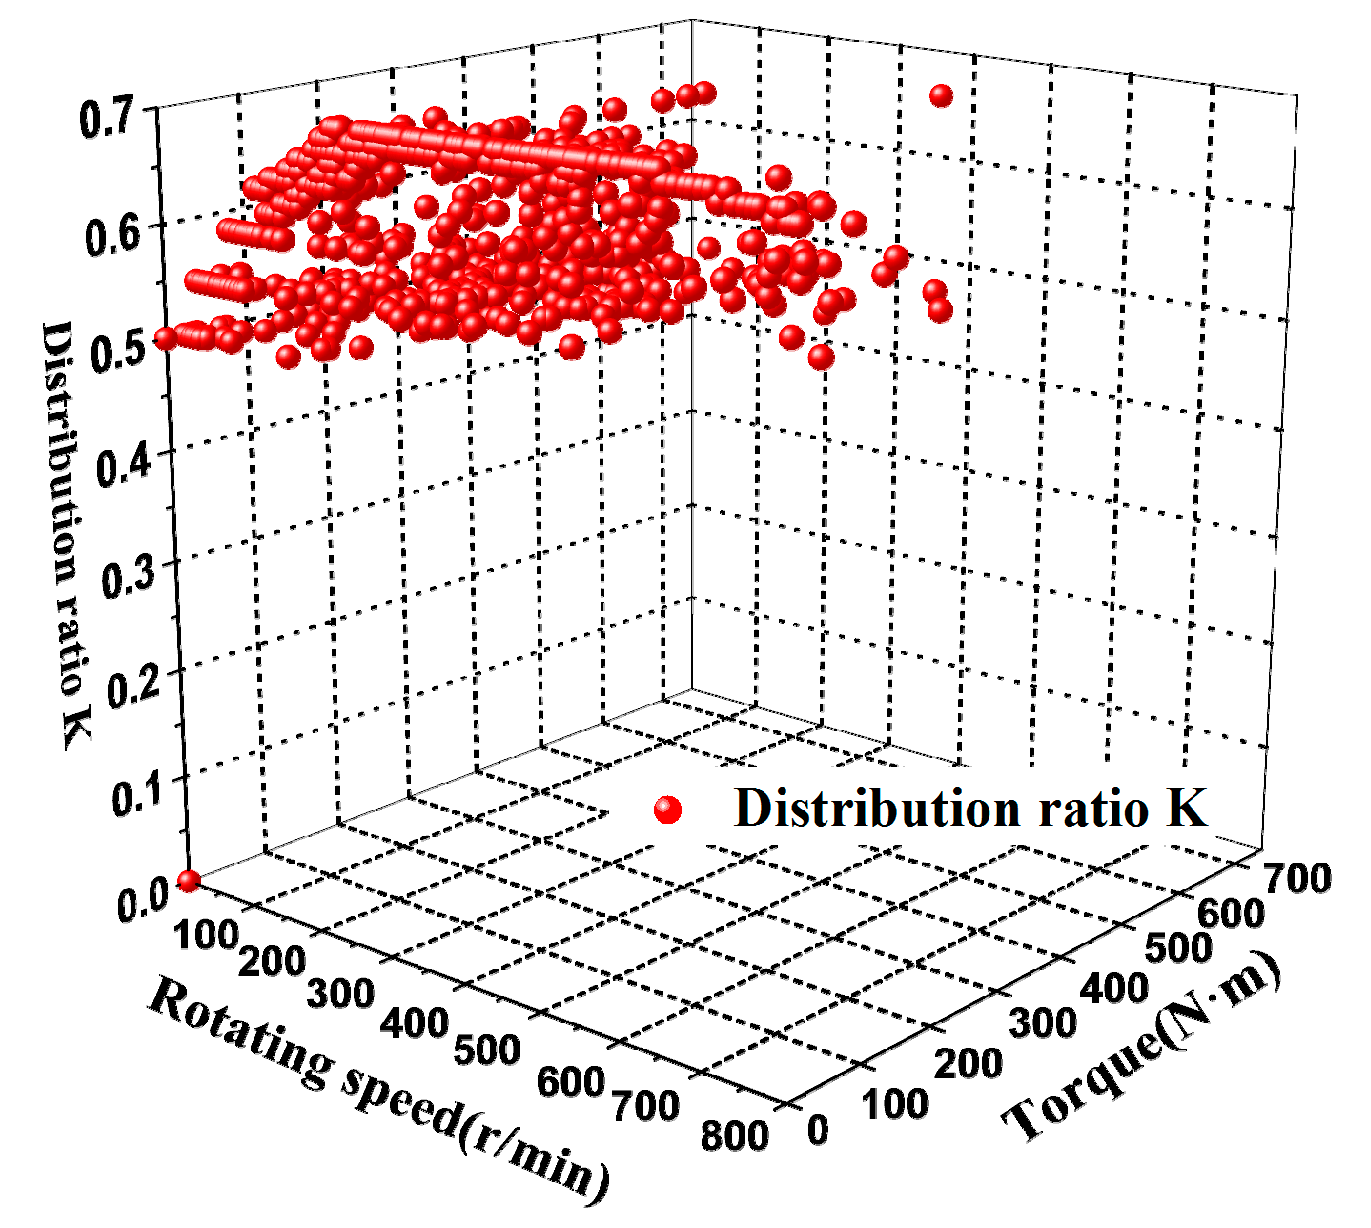
4.2. Application of DP Algorithm

In the range of the actual domain [t0, tf], the state variables in the optimization problem of the all-wheel drive power system are the vehicle speed and the torque Tdem. Since the vehicle speed can be determined according to the operating driving cycles, the state variable is recorded as x(t) = [Tdem(t), n]’, and the vehicle demand power is used as the control variable, which is recorded as u(t) = [Pdem(t)], discrete state. The underlying all-wheel-drive electric vehicle powertrain can be described by the equation of state (19) [22].
d x d t = f ( x ( k ) , u ( k ) )
where f is the equation of the electric vehicle power system, consisting of Equation (1) to Equation (7). The constraints of the state space are shown in expression (20).
0 P dem P dem , max T m , min T dem ( t ) T m , max S O C min S O C ( t ) S O C max n motor , min n ( t ) n motor , max
where Tdem is the shaft motor torque; Tm,min and Tm,max represent the minimum and maximum torque of the shaft motor respectively; nmotor,min and nmotor,max represent the minimum and maximum speed of the shaft motor respectively. Pdem,max is the maximum output power of the shaft motor.
In this paper, the energy efficiency of the electric drive system is taken as the objective function, and the objective function is shown in Equation (21).
J = min i = 0 N [ n T f η f ( T f , n ) + n T r η r ( T r , n ) ] = min i = 0 N [ n k T dem η f ( k T dem , n ) + n ( 1 k ) T dem η r ( ( 1 k ) T dem , n ) ]
where Tf is the output torque value of the front axle motor, Tr is the output torque value of the rear axle motor, ηf(Tf,n) is the efficiency of the front axle motor, ηr(Tr,n) is the efficiency of the rear axle motor.
Since the DP adopts the numerical solution, the time and system state are first discretized, and the calculation grid of the torque distribution ratio state is divided along the time direction of the driving cycle. According to the known driving cycle, the vehicle model is used to calculate the power demand power and speed of the driving cycle along the time direction. According to the constraints of the motor, the system reachable boundary of the whole driving cycle is obtained from the initial state and the termination state of the system respectively. Within the reachable boundary range, the system constraints are met, and the forward function is calculated according to the designed objective function. Obtain the shaft motor torque distribution ratio state matrix for the entire driving cycle. Finally, through the recursive call method, the final state is reversed to the initial state, the traversal optimization process is completed, the optimal torque distribution trajectory of the shaft motor is obtained, and the calculation result is output. The calculation plan of the DP method is shown in Figure 6 [23].
The process of using the DP method to realize the torque distribution of the hub motor is shown in Figure 7.

5. Simulation and Result Analysis

In order to verify the effectiveness of the dynamic planning allocation strategy, this paper simulates the all-wheel-drive electric vehicle under different driving cycles in passenger car cities in China. The simulation prototype parameters are shown in Table 2.

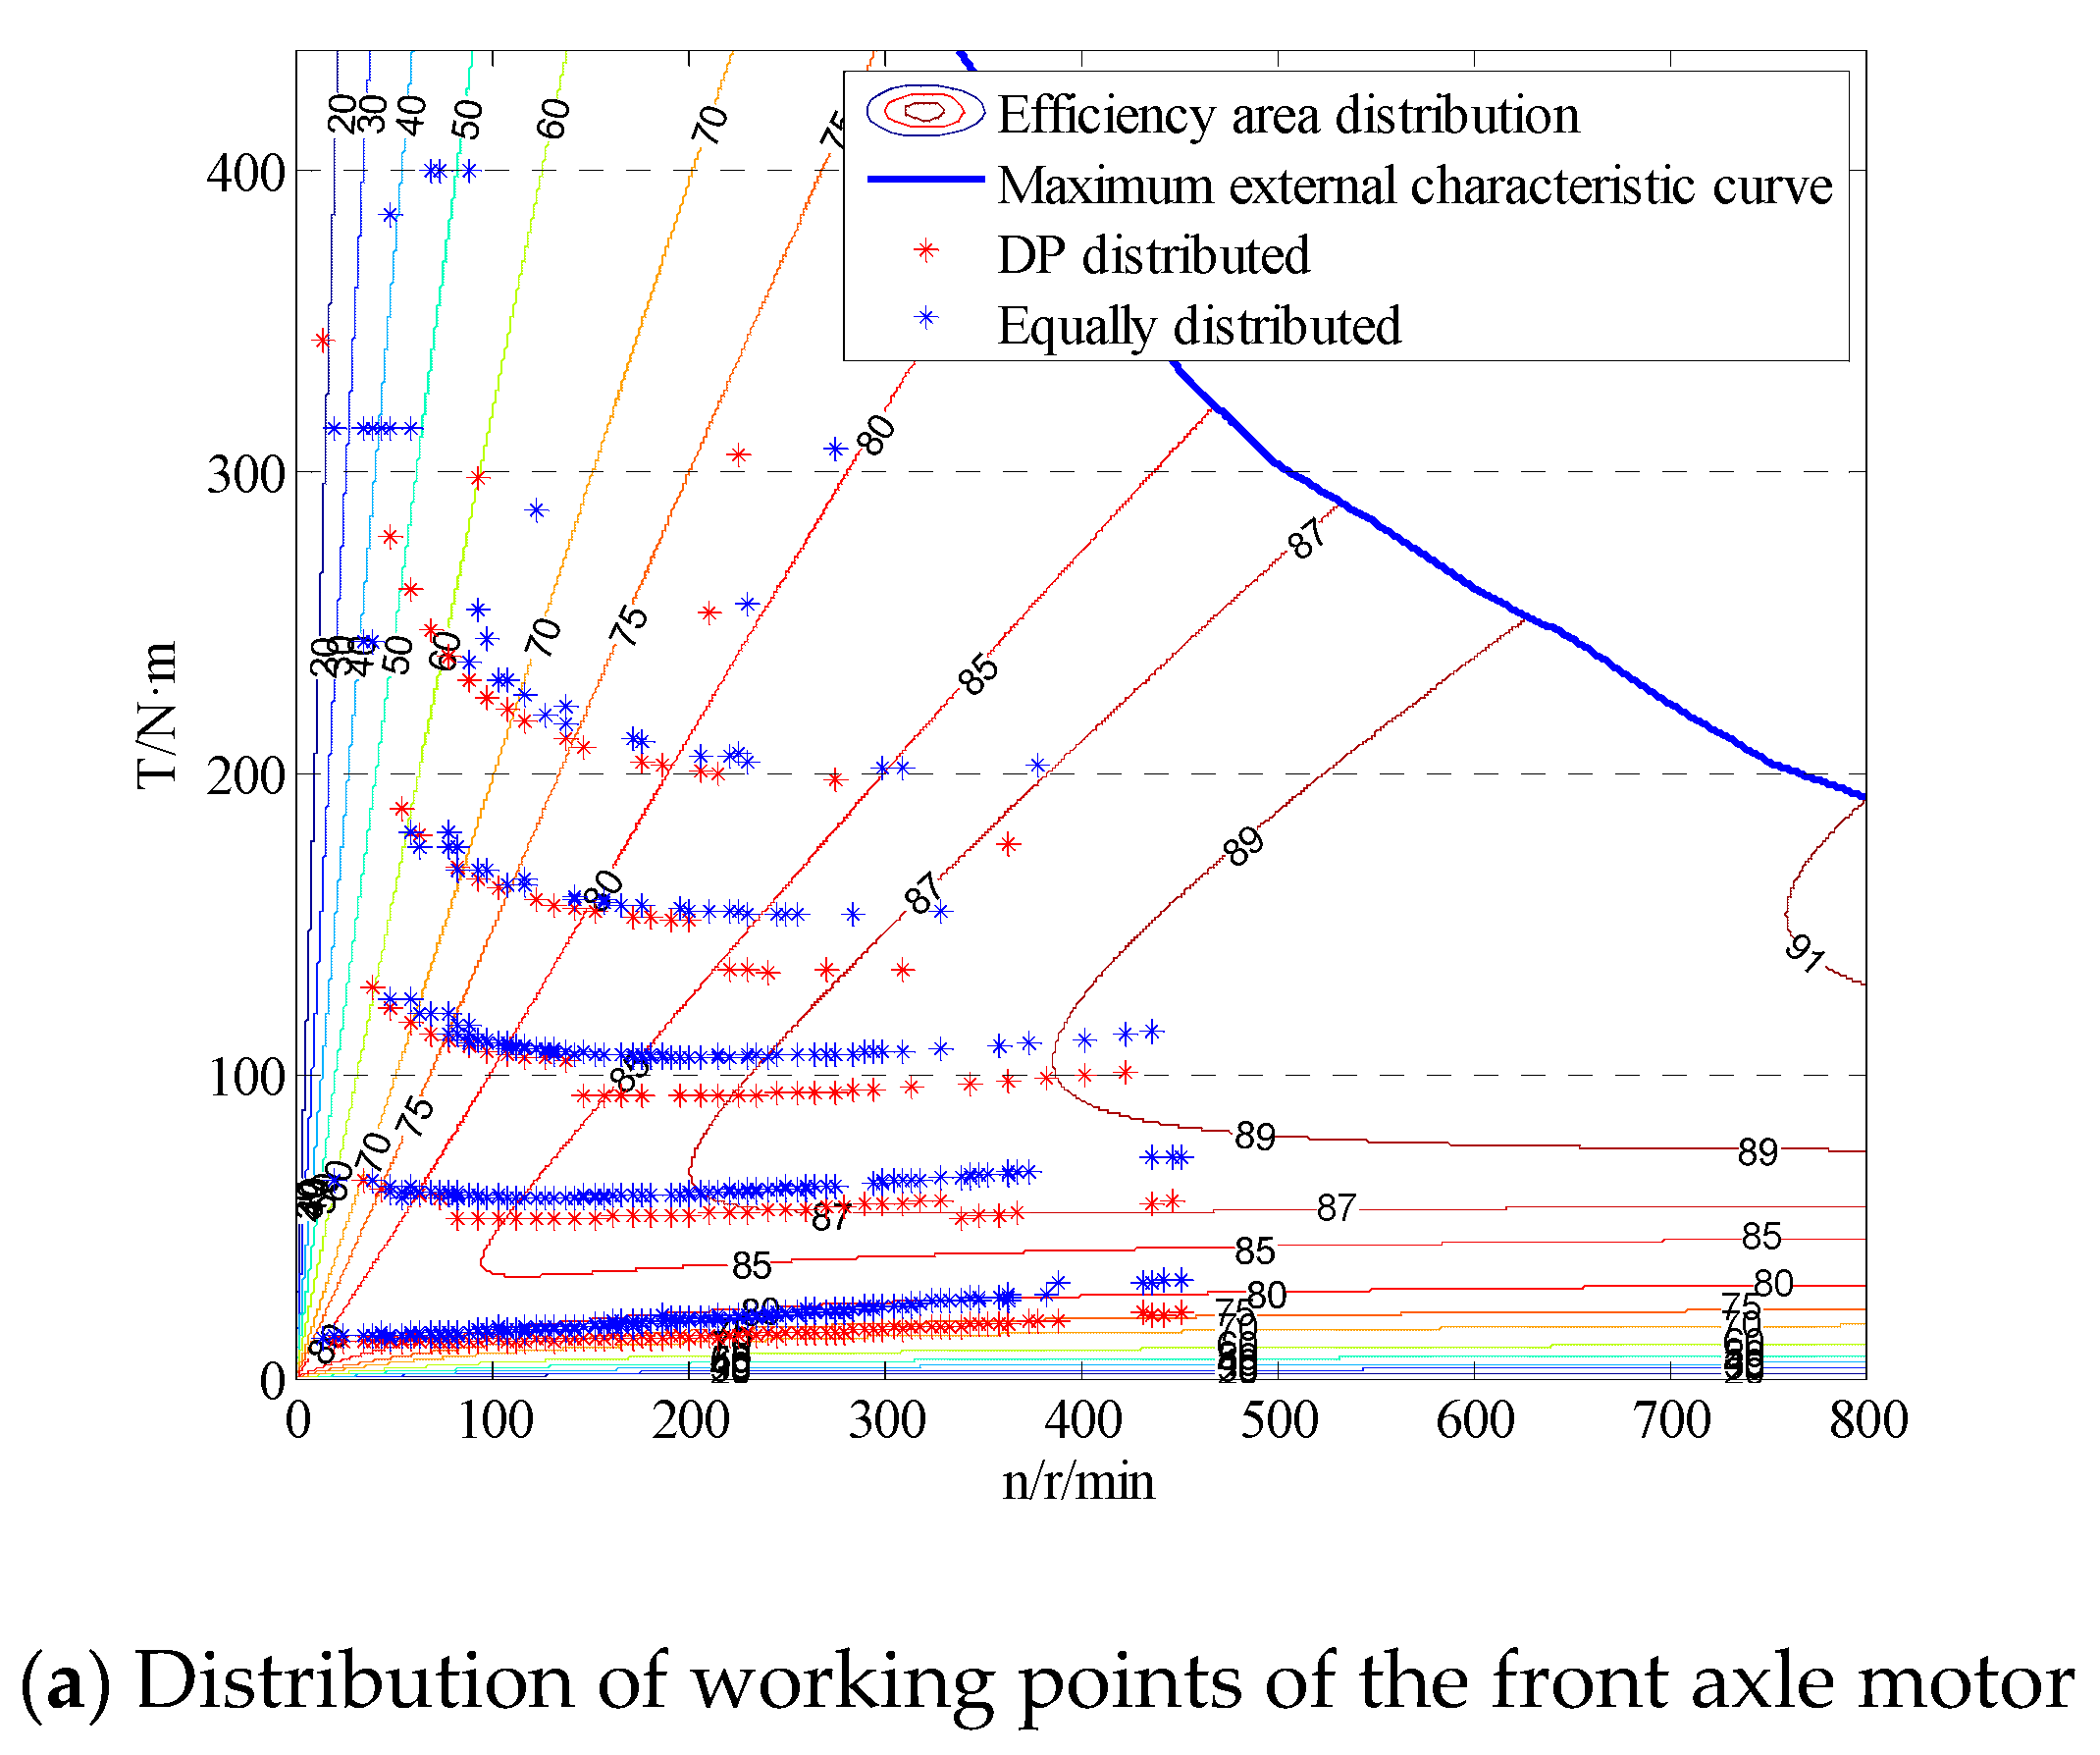
5.1. Comparative Analysis of Torque Distribution Strategies for Chinese Passenger Car under Different Cycles

According to the calculation, the maximum demand torque of the simulation prototype car in the CUPDC is 676.11 N∙m, and the maximum demand power is 29.23 kW. This paper focuses on torque distribution in driving mode and therefore does not take account of the impact of braking conditions. The torque and power requirements during CUPDC are shown in Figure 8.
According to the vehicle speed calculation of CUPDC, the required power of the whole vehicle can be obtained. Combined with the power system structure of the axle motor directly driving the wheel, the torque of the shaft motor and the torque required by the power system can be further decoupled. According to the boundary conditions and optimization objectives formulated by Equations (20) and (21), the ratio K of the output torque of the motor of the two shafts before and after can be calculated according to the DP algorithm, and then the distribution of output torque of the two shafts can be conducted. Figure 9 is the result obtained according to DP global optimization algorithm. As can be seen from Figure 9, torque distribution results calculated based on energy efficiency as the optimization objective in this paper are mostly based on four-wheel simultaneous driving, with torque distribution coefficient between 0.5 and 0.65. Compared with the average torque distribution coefficient of 0.5, torque distribution coefficient can be optimized according to the power demand of driving cycles.
This paper compares different torque distribution strategies of all-wheel-drive electric vehicles under the CUPDC. Figure 10 shows the torque distribution control strategy of the front and rear shafts motor and the operating point distribution of the shafts motor when different torque distribution strategies are adopted for the all-wheel-drive electric vehicle. Figure 11 shows the comparison results of shaft motor efficiency distribution under two different torque distribution strategies. By the comparison of Figure 10 and Figure 11, we can see that the average torque distribution strategy, front axle and the electric motor shaft motor working in high efficient area number and location are consistent, so if by changing the control strategy, and then realize the change of the motor working point, from the point of promoting the comprehensive efficiency of power system, thereby lowering the energy consumption of the electric drive system. Compared with the mean torque distribution strategy, the DP algorithm adopted is a global optimization method, so the working points of the motor that improve the global efficiency interval are the main ones. In the interval of 30% to 90% of the efficiency distribution of the motor working point, the proportion of the working points of the shaft motor of the DP global optimization torque distribution strategy is all increased.

5.2. Comparative Analysis of Torque Distribution Strategies for HUPDC

After calculation, the maximum demand torque of the simulation prototype car in the HUPDC is 763.27 N∙m, and the maximum demand power is 16.72 kW. The torque and power requirements of the simulation prototype running under HUPDC are shown in Figure 12.
The required power of the whole vehicle can be obtained by calculating the speed of the HUPDC. The dynamic system structure of the wheel driven directly by the shaft motor can be further decoupled to calculate the speed of the shaft motor and the torque required by the power system. According to the boundary conditions and optimization objectives formulated by Equations (20) and (21), the ratio K of the output torque of the motor of the two shafts before and after can be calculated according to the DP algorithm, and then the distribution of output torque of the two shafts can be conducted. Figure 13 is the result obtained by DP global optimization algorithm. As can be seen from Figure 13, the torque distribution results calculated in this paper based on energy efficiency as the optimization objective are mostly based on four-wheel simultaneous driving, and the torque distribution coefficient is between 0.3–0.7. Compared with the average torque distribution coefficient of 0.5, the torque distribution coefficient can be optimized according to different motor speed and torque demand.
This paper compares different torque distribution strategies of all-wheel-drive electric vehicles under the Harbin urban passenger driving cycle. Figure 14 shows the different torque distribution strategies adopted for all-wheel-drive electric vehicles, including the strategy of average torque distribution, and the operating point distribution of the shaft motor when the torque distribution control strategy of the front and rear shaft motor is obtained according to DP calculation. Figure 15 shows the comparison results of shaft motor efficiency distribution under two different torque distribution strategies. By the comparison of Figure 14 and Figure 15, we can see that the average torque distribution strategy, front and rear wheel motor working in high efficient area number and location are consistent, so if by changing the control strategy, and then realize the change of the motor working point, from the point of promoting the comprehensive efficiency of power system, thereby lowering the energy consumption of the electric drive system. Compared with the mean torque distribution strategy, the DP optimal torque distribution strategy proposed in this paper improves the operating point of the front and rear shaft motor efficiency distribution in the range of 30–80%.

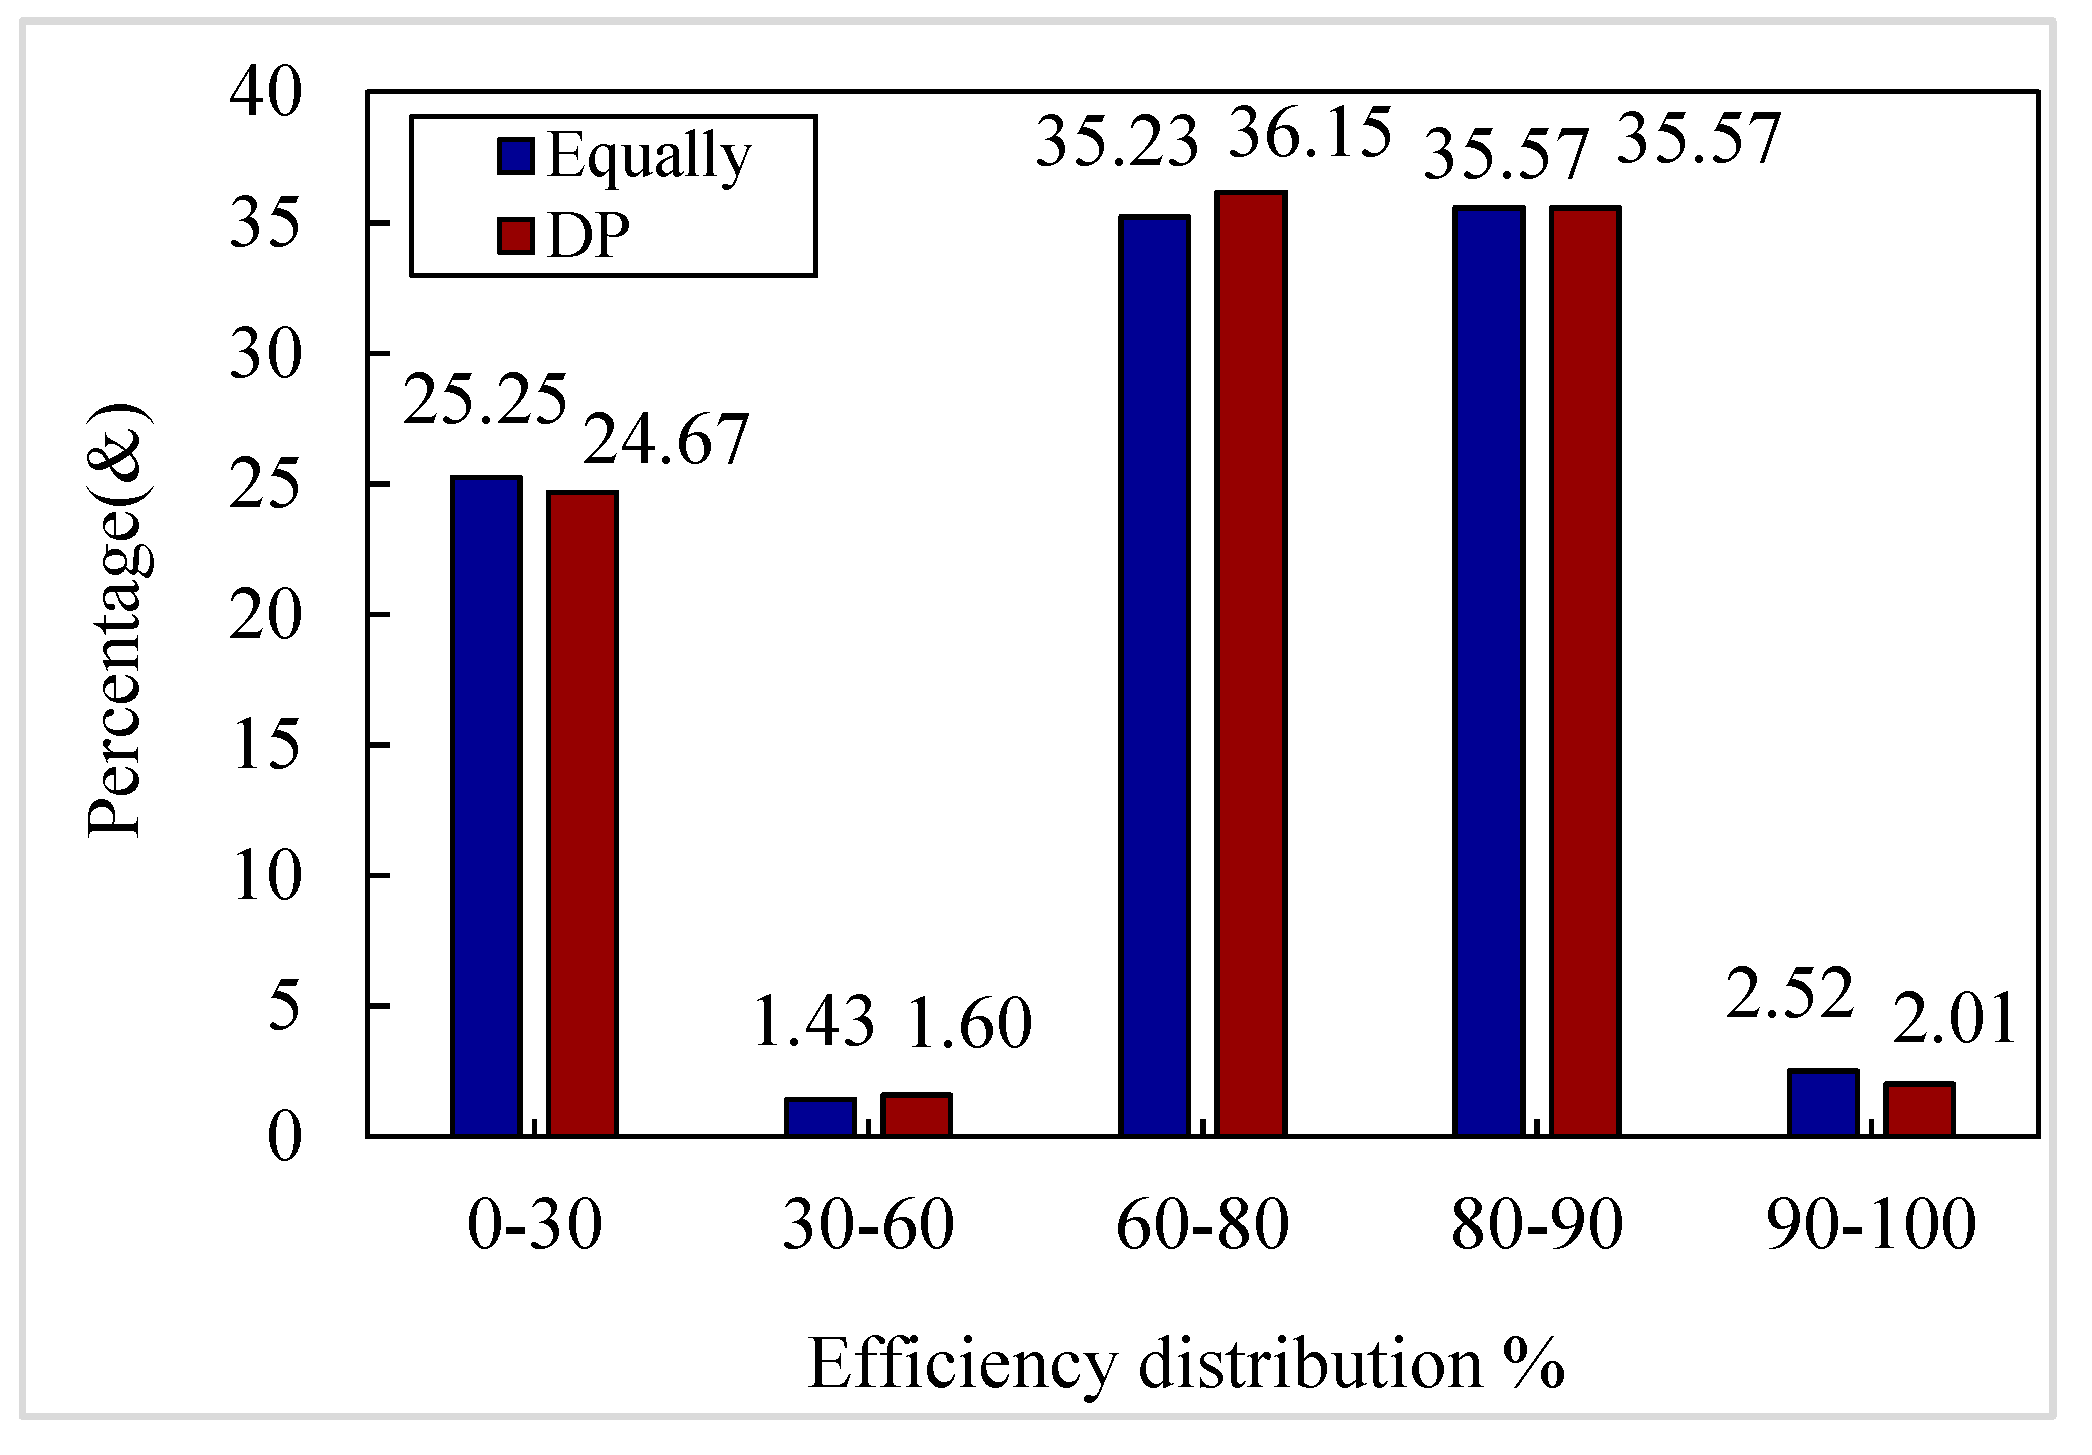
5.3. Energy Consumption Analysis of Electric Drive System

Under two different control strategies, the 100 km power consumption of the all-wheel drive power system is compared as shown in Figure 16. As a result of the optimization of the working point of the shaft motor, when the simulation prototype vehicle adopted the DP global optimization torque distribution strategy under China urban passenger cars driving cycle, the 100-kilometer energy consumption of the electric drive system was 12.585 kWh, which was reduced by 0.75 kWh compared to the average allocation rule. Under the HUPDC, when adopting the DP global optimization torque distribution strategy, the energy consumption of 100 km of electric drive system is 10.338 kWh, which is 0.588 kWh lower than that based on the average allocation rule.

6. Conclusions

In this paper, the optimal torque distribution strategy for electric drive system is studied to solve the torque optimization problem of the efficiency difference of the axial distributed drive motor. A torque distribution method based on global optimized dynamic programming is proposed. Compared with the average distributed torque method, the proposed method effectively reduces the power consumption of the electric drive system by 100 km, among which, 0.75 kWh can be reduced under the China urban passenger cars driving cycle. In the Harbin urban passenger cars driving cycle, 0.60 kWh was reduced, and the increase was over 5%. The results show that the torque distribution ratio of the front and rear shafts can be adjusted dynamically in real time to solve the problem of working point optimization caused by the difference in the efficiency distribution of the shafts. The proposed method can be applied to the optimization of torque distribution control under different driving cycles, which can effectively improve the energy efficiency of the system and extend the driving distance of electric passenger vehicles.

Author Contributions

X.W. and D.Z. conceived and designed the simulations; J.D. analyzed the data; D.Z. and T.W. wrote the paper.

Funding

This research received no external funding.

Acknowledgments

This work was sponsored through the National Natural Science Foundation of China (51877121); University Nursing Program for Young Scholars with Creative Talent in Heilongjiang Province (UNPYSCT-2016164); State Key Laboratory of Automotive Safety and Energy under Project No. KF1826.

Conflicts of Interest

The authors declare no conflict of interest.

References

  1. Zhang, H.; Huang, X.; Wang, J.; Karimi, H.R. Robust energy-to-peak sideslip angle estimation with applications to ground vehicles. Mechatronics 2015, 30, 338–347. [Google Scholar] [CrossRef]
  2. Shuai, Z.; Zhang, H.; Wang, J.; Li, J.; Ouyang, M. Lateral motion control for four-wheel-independent-drive electric vehicles using optimal torque allocation and dynamic message priority scheduling. Control Eng. Pract. 2014, 24, 55–66. [Google Scholar] [CrossRef]
  3. Zhao, Z.; Lei, D.; Chen, J.; Li, H. Optimal control of mode transition for four-wheel-drive hybrid electric vehicle with dry dual-clutch transmission. Mech. Syst. Signal Process. 2018, 105, 68–89. [Google Scholar] [CrossRef]
  4. Zhou, H.; Jia, F.; Jing, H.; Liu, Z.; Güvenç, L. Coordinated longitudinal and lateral motion control for four wheel independent motor-drive electric vehicle. IEEE Trans. Veh. Technol. 2018, 67, 3782–3790. [Google Scholar] [CrossRef]
  5. Chen, T.; Chen, L.; Xu, X.; Cai, Y.; Jiang, H.; Sun, X. Estimation of longitudinal force and sideslip angle for intelligent four-wheel independent drive electric vehicles by observer iteration and information fusion. Sensors 2018, 18, 1268. [Google Scholar] [CrossRef]
  6. Chen, T.; Xu, X.; Chen, L.; Jiang, H.; Cai, Y.; Li, Y. Estimation of longitudinal force, lateral vehicle speed and yaw rate for four-wheel independent driven electric vehicles. Mech. Syst. Signal Process. 2018, 101, 377–388. [Google Scholar] [CrossRef]
  7. Wu, D.; Ding, H.; Du, C. Dynamics characteristics analysis and control of FWID EV. Int. J. Automot. Technol. 2018, 19, 135–146. [Google Scholar] [CrossRef]
  8. Joa, E.; Park, K.; Koh, Y.; Yi, K.; Kim, K. A tyre slip-based integrated chassis control of front/rear traction distribution and four-wheel independent brake from moderate driving to limit handling. Veh. Syst. Dyn. 2018, 56, 579–603. [Google Scholar] [CrossRef]
  9. Han, K.; Choi, M.; Lee, B.; Choi, S.B. Development of a traction control system using a special type of sliding mode controller for hybrid 4wd vehicles. IEEE Trans. Veh. Technol. 2018, 67, 264–274. [Google Scholar] [CrossRef]
  10. Koehler, S.; Viehl, A.; Bringmann, O.; Rosenstiel, W. Energy-efficiency optimization of torque vectoring control for battery electric vehicles. IEEE Intell. Transp. Syst. Mag. 2017, 9, 59–74. [Google Scholar] [CrossRef]
  11. Xin, X.; Zhang, W.; Shen, C.; Zheng, H. Control strategy of four-wheel independent drive electric vehicle based on vehicle velocity estimation and switchover. Trans. Inst. Meas. Control 2017, 37, 965–975. [Google Scholar] [CrossRef]
  12. Qiu, L.; Qian, L.; Zomorodi, H.; Pisu, P. Global optimal energy management control strategies for connected four-wheel-drive hybrid electric vehicles. IET Intell. Transp. Syst. 2017, 11, 264–272. [Google Scholar] [CrossRef]
  13. Zhang, X.; Wei, K.; Yuan, X.; Tang, Y. Optimal torque distribution for the stability improvement of a four-wheel distributed-driven electric vehicle using coordinated control. J. Comput. Nonlinear Dyn. 2016, 11, 051017. [Google Scholar] [CrossRef]
  14. Zhai, L.; Sun, T.; Wang, J. Electronic stability control based on motor driving and braking torque distribution for a four in-wheel motor drive electric vehicle. IEEE Trans. Veh. Technol. 2016, 65, 4725–4739. [Google Scholar] [CrossRef]
  15. Shuai, Z.; Zhang, H.; Wang, J.; Li, J.; Ouyang, M. Combined AFS and DYC control of four-wheel-independent-drive electric over CAN network with time-varying delays. IEEE Trans. Veh. Technol. 2014, 63, 591–602. [Google Scholar] [CrossRef]
  16. Wang, R.; Zhang, H.; Wang, J. Linear parameter-varying controller design for four-wheel independently actuated electric ground vehicles with active steering systems. IEEE Trans. Control Syst. Technol. 2014, 22, 1281–1296. [Google Scholar]
  17. Du, J.; Chen, J.; Song, Z.; Gao, M.; Ouyang, M. Design method of a power management strategy for variable battery capacities range-extended electric vehicles to improve energy efficiency and cost-effectiveness. Energy 2017, 121, 32–42. [Google Scholar] [CrossRef]
  18. Xiong, R.; Zhang, Y.; He, H.; Zhou, X.; Pecht, M.G. A double-scale, particle-filtering, energy state prediction algorithm for lithium-ion batteries. IEEE Trans. Ind. Electron. 2018, 65, 1526–1538. [Google Scholar] [CrossRef]
  19. Xiong, R.; He, H.; Sun, F.; Liu, X.; Liu, Z. Model-based state of charge and peak power capability joint estimation of lithium-ion battery in plug-in hybrid electric vehicles. J. Power Sources 2013, 229, 159–169. [Google Scholar] [CrossRef]
  20. Xu, L.; Ouyang, M.; Li, J.; Yang, F.; Lu, L.; Hua, J. Application of Pontryagin’s Minimal Principle to the energy management strategy of plugin fuel cell electric vehicles. Int. J. Hydrog. Energy 2013, 38, 10104–10115. [Google Scholar] [CrossRef]
  21. Zheng, D.Y.; Wu, X.G.; Chen, H.; Du, J.Y. Construction of driving conditions of Harbin urban passenger cars. J. Highw. Transp. Res. Dev. 2017, 34, 101–107. [Google Scholar] [CrossRef]
  22. Cheng, S.; Xu, L.; Wu, K.; Fang, C.; Hu, J.; Li, J.; Ouyang, M. Optimal warm-up control strategy of the PEMFC system on a city bus aimed at improving efficiency. Int. J. Hydrog. Energy 2017, 42, 11632–11643. [Google Scholar] [CrossRef]
  23. Song, Z.; Hofmann, H.; Li, J.; Han, X.; Ouyang, M. Optimization for a hybrid energy storage system in electric vehicles using dynamic programing approach. Appl. Energy 2015, 139, 151–162. [Google Scholar] [CrossRef]
Figure 1. Front/rear wheel independent drive mode.
Energies 12 01122 g001
Figure 2. All-wheel simultaneous drive mode (k = 0.5).
Energies 12 01122 g002
Figure 3. Battery equivalent circuit simplified model.
Energies 12 01122 g003
Figure 4. The China urban passenger driving cycle.
Energies 12 01122 g004
Figure 5. The Harbin urban passenger driving cycle.
Energies 12 01122 g005
Figure 6. Schematic diagram of dynamic planning control method calculation.
Energies 12 01122 g006
Figure 7. Dynamic planning method to achieve shaft motor torque distribution flow chart.
Energies 12 01122 g007
Figure 8. The demand torque/power in the China urban passenger driving cycle (CUPDC).
Energies 12 01122 g008
Figure 9. Torque distribution ratio map optimized by dynamic planning algorithm for the CUPDC.
Energies 12 01122 g009
Figure 10. Distribution of motor operating points in different torque distribution strategies for CUPDC.
Energies 12 01122 g010
Figure 11. Comparison of motor efficiency distribution of different torque distribution strategies for CUPDC.
Energies 12 01122 g011
Figure 12. The demand torque/power of Harbin urban passenger driving cycle (HUPDC).
Energies 12 01122 g012
Figure 13. Torque distribution ratio map optimized by dynamic planning algorithm for HUPDC.
Energies 12 01122 g013
Figure 14. Distribution of motor operating points for different torque distribution strategies of HUPDC.
Energies 12 01122 g014aEnergies 12 01122 g014b
Figure 15. Motor efficiency distribution in HUPDC.
Energies 12 01122 g015
Figure 16. The energy consumption under different driving cycle and different control strategies.
Energies 12 01122 g016
Table 1. Comparison of main characteristic values under two different driving cycles.
Driving CycleAverage Speed (km/h)Maximum Speed (km/h)Highest Acceleration (m/s2)Maximum Deceleration (m/s2)Average Acceleration (m/s2)
The CUPDC23.138742.294−2.5930.439
The HUPDC16.98461.944−2.770.499
Table 2. Basic parameters of the simulation sample car.
Mass/kgWheelbase/mFrontal Area/m2Wheel Radius/mCentroid Height/mFront Track/mRear Track/m
10002.52.600.270.521.1021.158

