3E-Analysis of a Bio-Solar CCHP System for the Andaman Islands, India—A Case Study


Abstract
1. Introduction
2. Methodology and Data Acquisition
2.1. Methodology
2.2. Data Acquisition
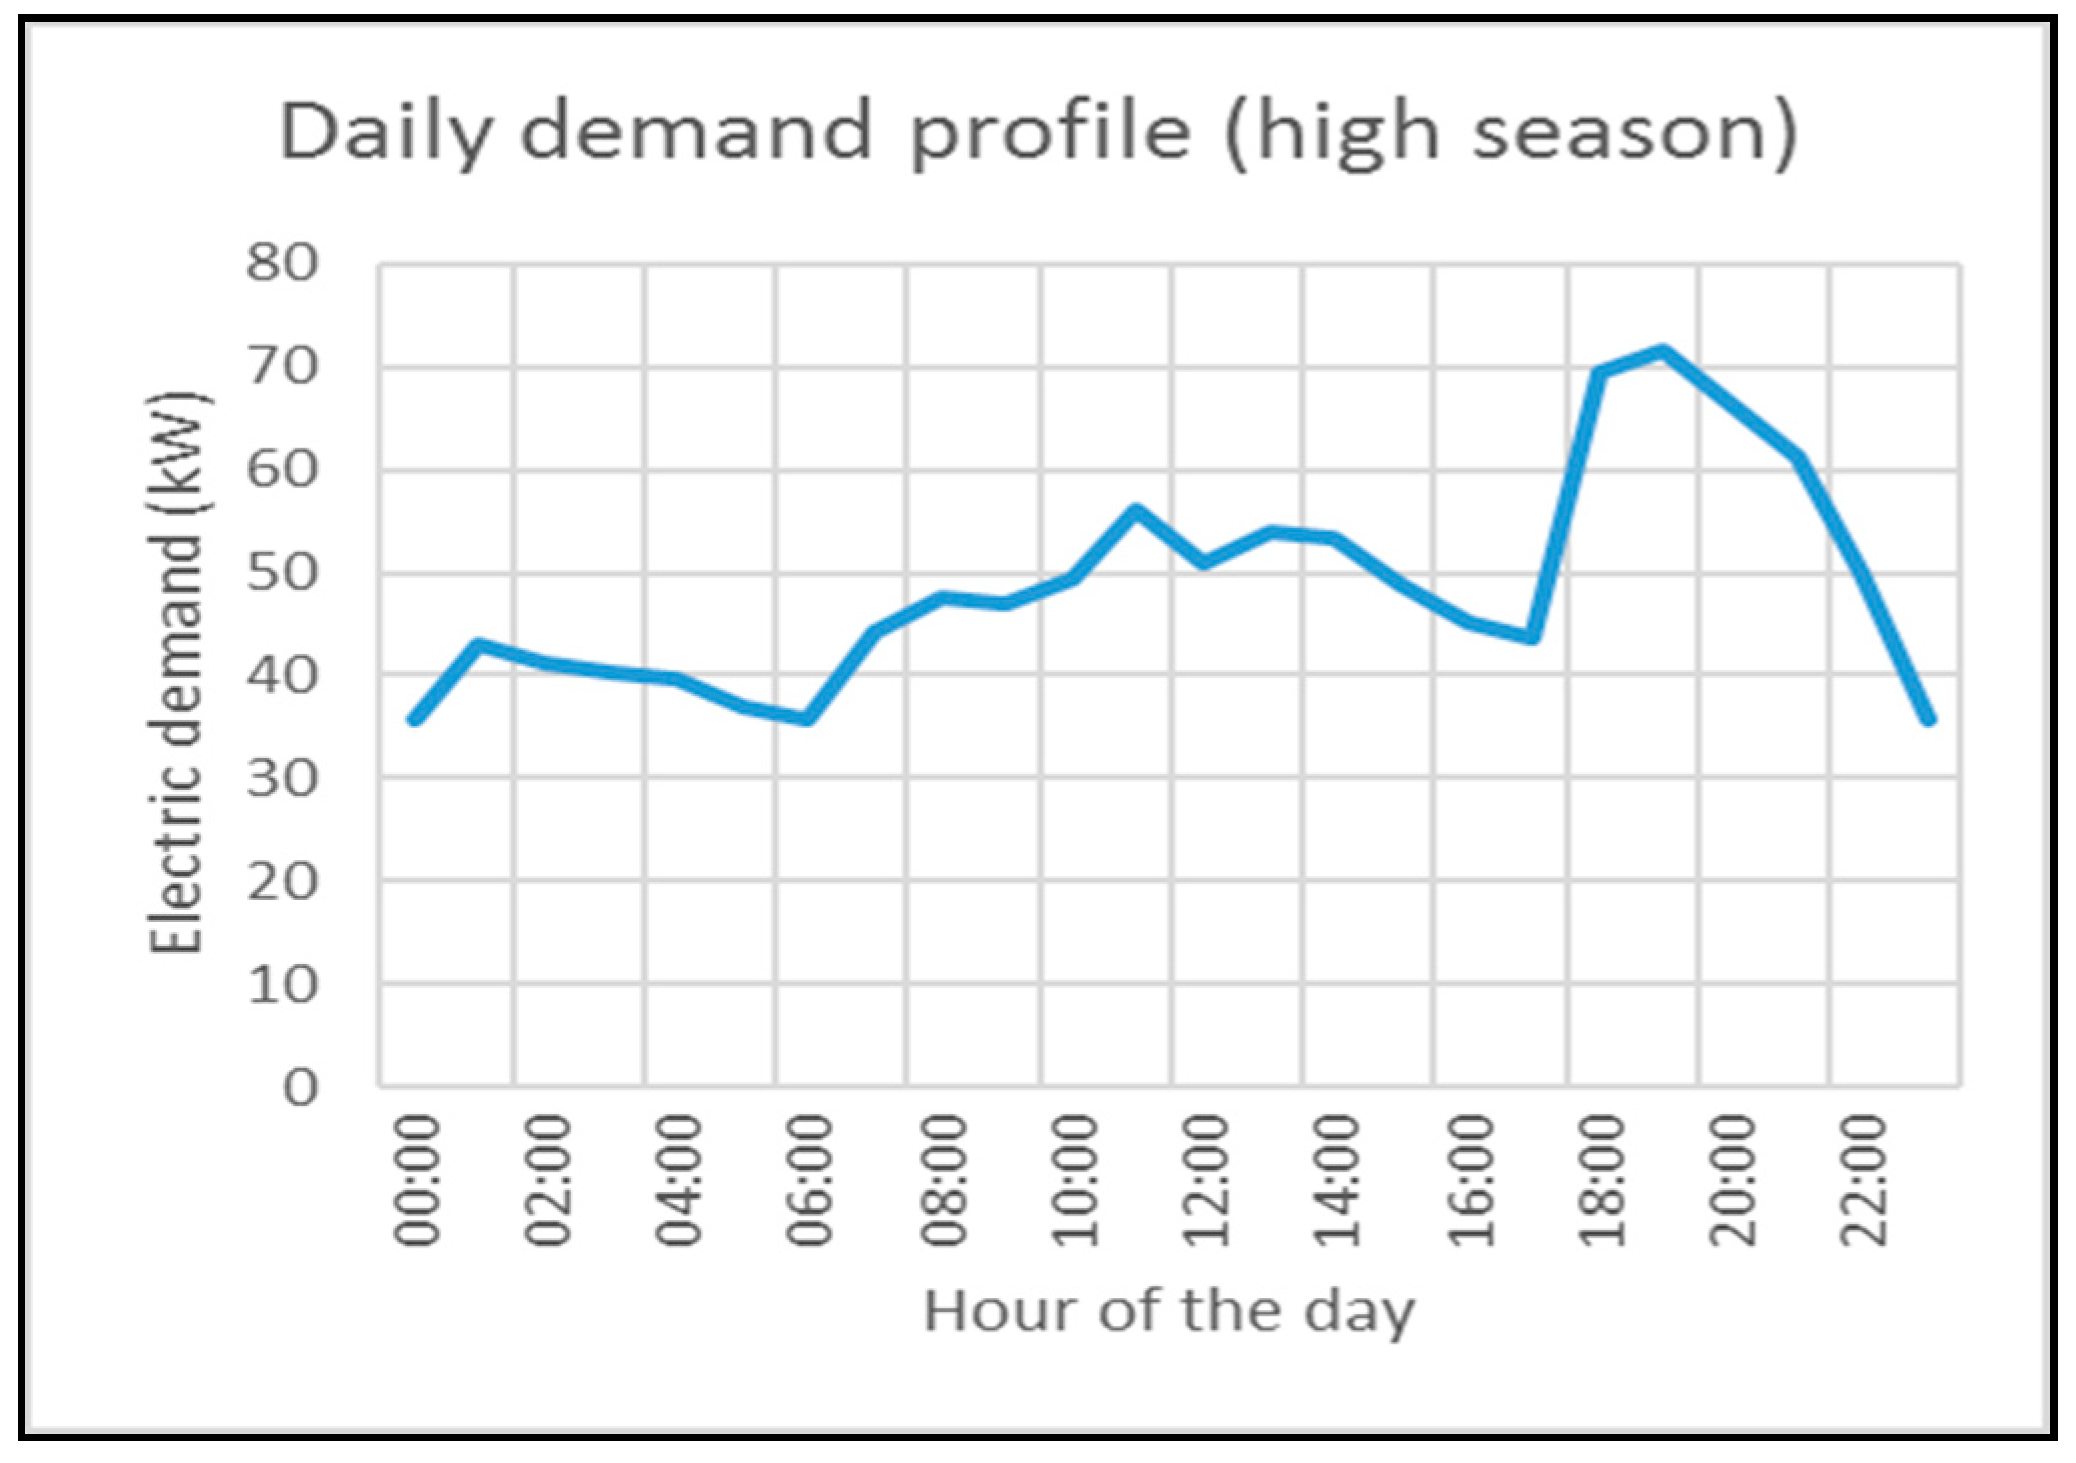
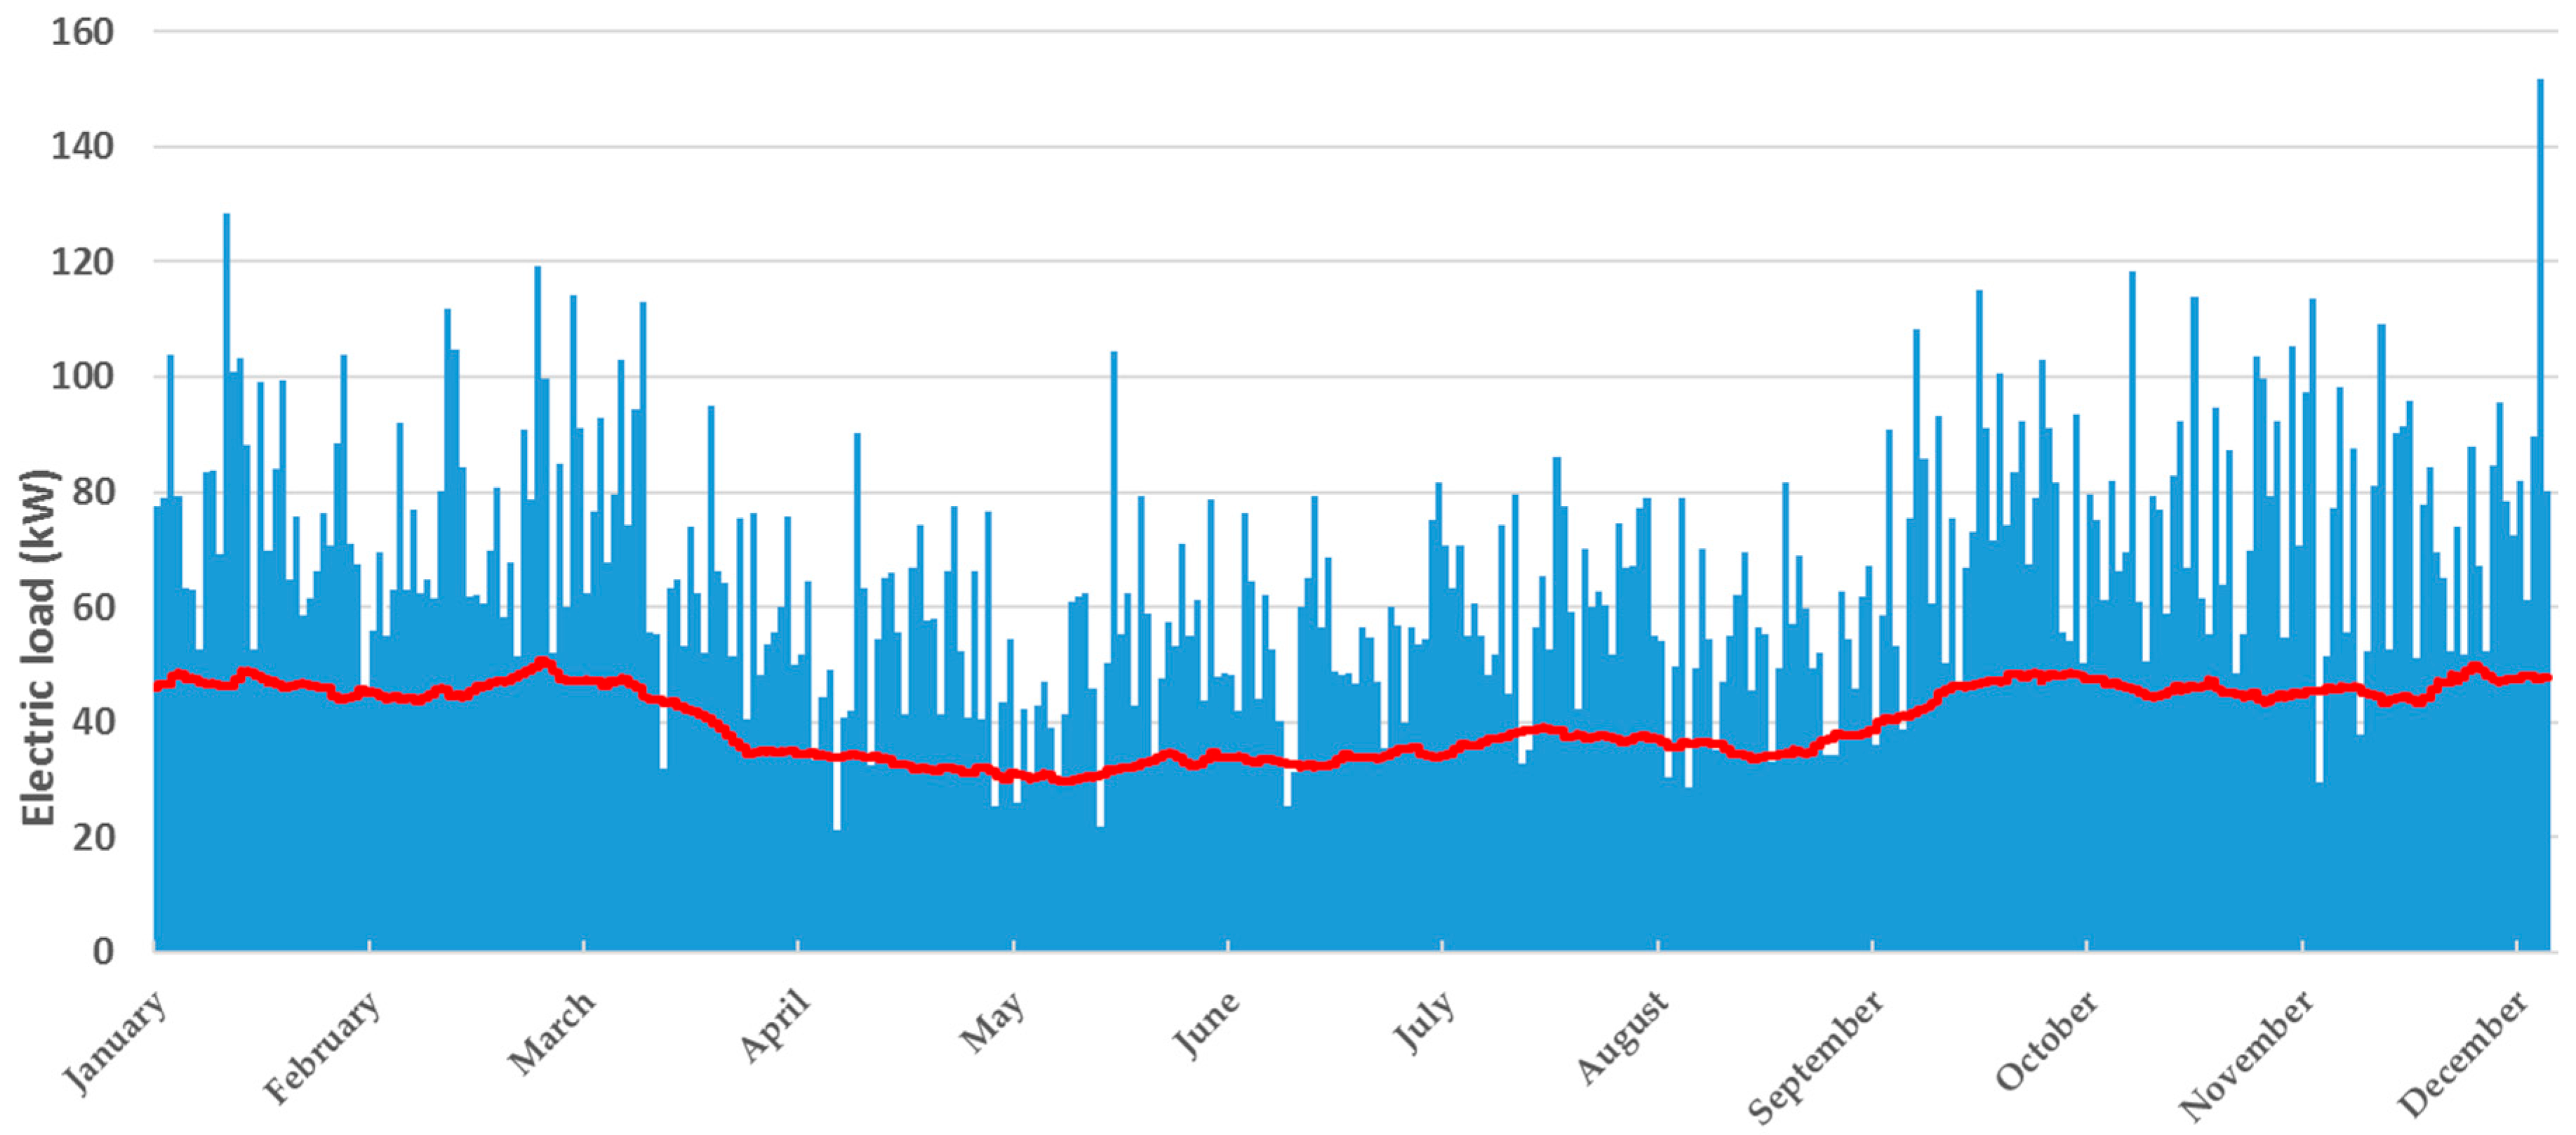
- Load profile: The simulations are based on the electric and thermal demand of a hotel resort on Neil Island, India. Because most hotel clients require electric services between 18:00 h and 24:00 h, the electric demand is highest during this period of the day as depicted in Figure 1. Furthermore, using the occupation rate of the hotel rooms, the energy demand for hot showers and for air conditioning based on the ASHRAE (American Society of Heating, Refrigerating and Air-Conditioning Engineers) standard [22] has been calculated. Based on historical data, the occupation rate has been assumed to be 70% during high season (from November to March) and 40% during low season (from April to October). The effect of the occupation rate on energy demand is reflected in Figure 2. For the whole year, the daily average electricity demand is 977 kWh and the average power demand is 40.7 kW.
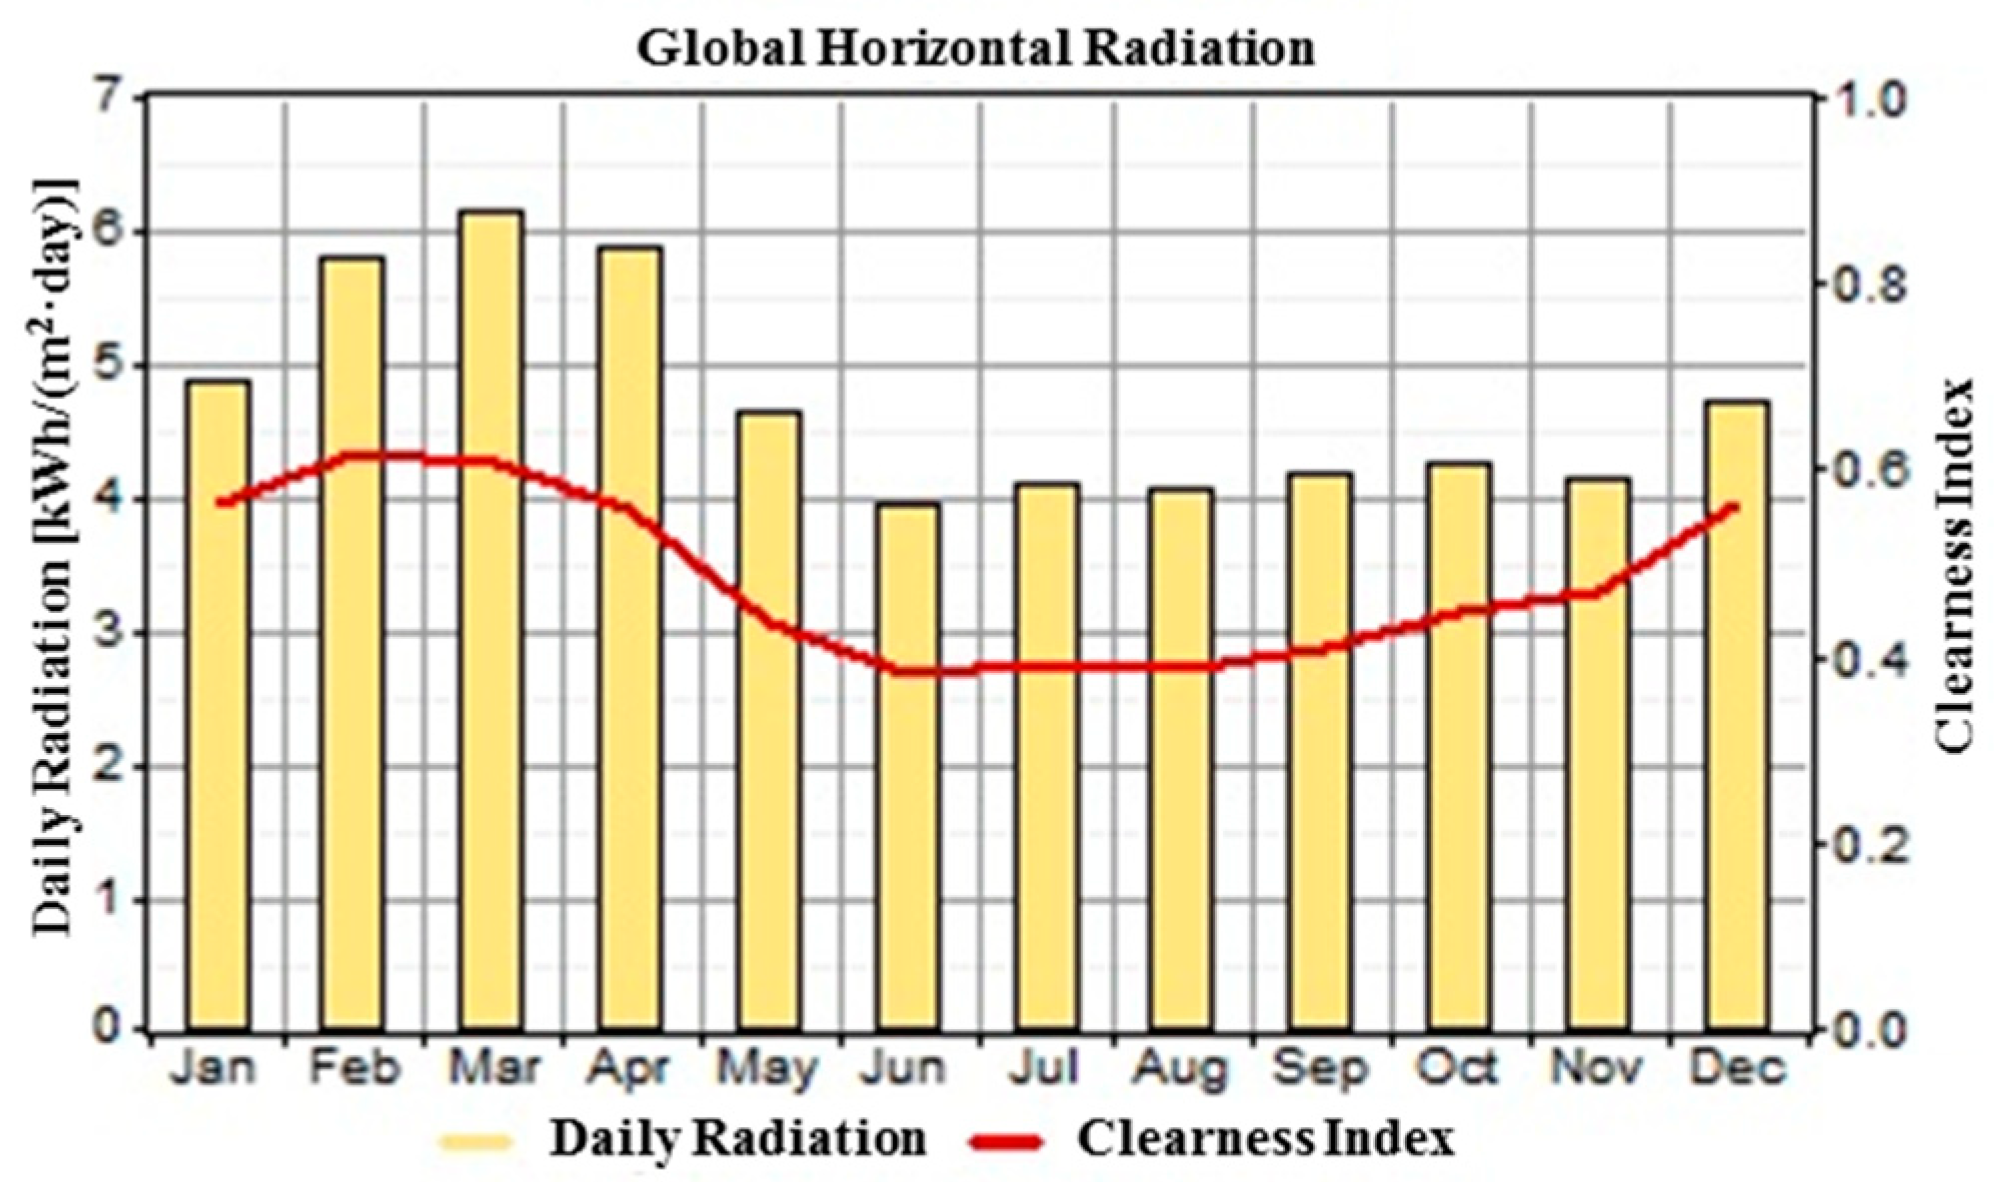
- Meteorological data: To calculate the global horizontal radiation falling on the location area, HOMER accesses the NASA surface meteorology and solar energy database [23] and then synthesizes hourly data from monthly averages. The synthesized solar data for the location with approximate latitude 11°59′ and longitude 92°7′ can be seen in Figure 3. The region offers good conditions for solar energy usage with relatively high average daily radiation of 4.72 kWh/(m2·day) and an average clearness index of K = 0.482 (see Equation (3)).
- Equipment characteristics and Economic data: To choose the parameters for each component, technical and economic data from commercially available products as well as values used in previous investigations are used.
- Technical data: The maximum capacity shortage of the system has been determined to be 1%, which is a reasonably low value compared to the frequent electricity shortages of the reference case.
- Search space: The search space was initially very broad (e.g., 10–500 kWe for the prime mover) and has been narrowed down iteratively to find optimal solutions.
3. Case Description
3.1. Description of the Current Situation of the Island Grid and the Hotel
3.2. Biomass Availability
3.3. Description of the Cases:
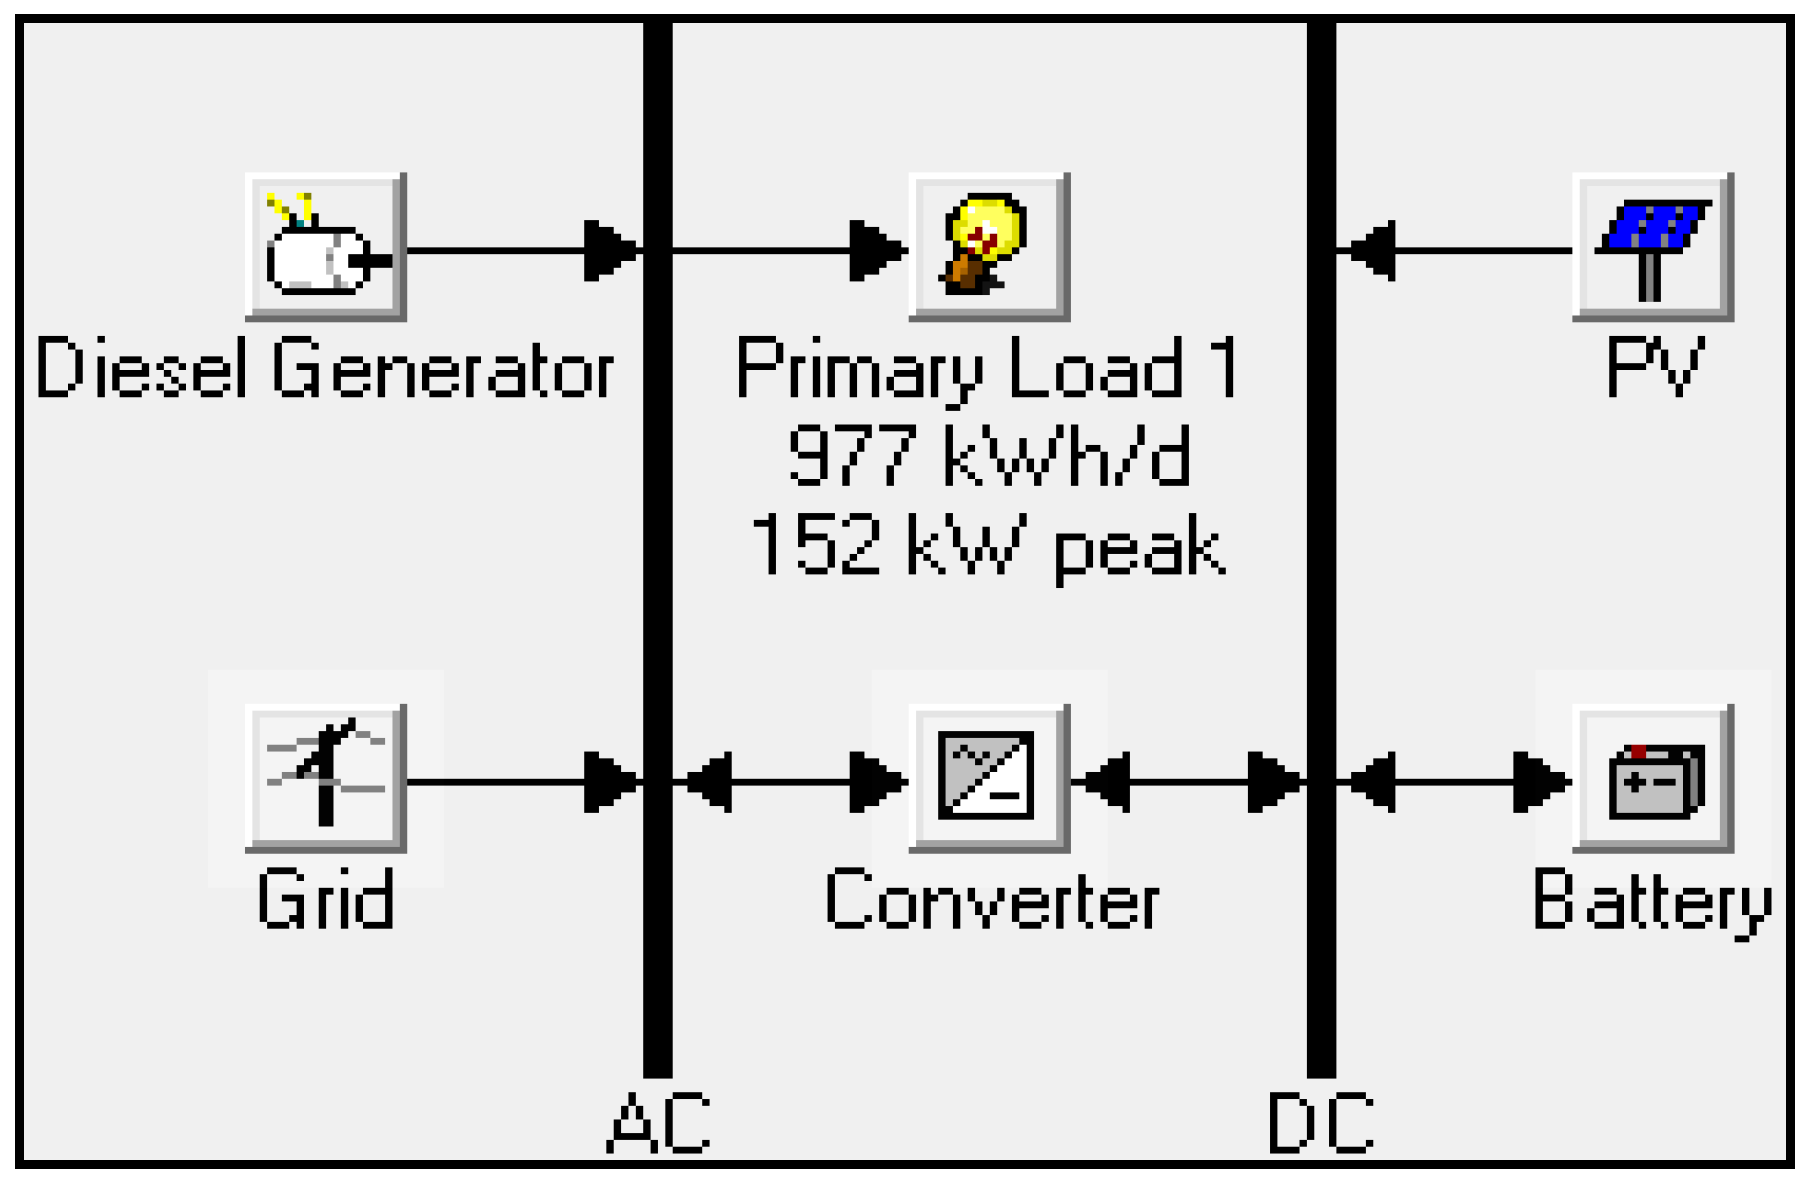
- Base Case: The diesel base case represents the currently used conventional diesel-based system. The owner receives electricity from the island grid and uses a 160 kW diesel generator as a back-up during the frequent electric outages to meet electricity demands of up to 152 kW (see peak value in Figure 2).
- Solar-assistance Case: The diesel generator is supported by PV panels and batteries. For this case, a practical limitation of mounting PV panels only on the roof area has been ignored.
- Bio-solar Case: A gas engine fuelled with syngas from a gasifier substitutes the diesel engine. The gas engine is also supported by PV panels and batteries. The PV panel size does not exceed the available rooftop area. The system works entirely off-grid.
- Bio-Solar CCHP Case: The same system configuration as in Case 3 is applied. However, a thermal load is introduced to ensure continuous operation of an absorption chiller (AC) which relieves the electrically driven vapour compression chiller (VC). In case the gas engine is turned off, a boiler provides the necessary heat energy by burning syngas.
3.4. Description of the Components
3.4.1. Biomass Pre-Treatment and Gasifier
3.4.2. Exhaust Heat Usage and Absorption Chiller
4. Results
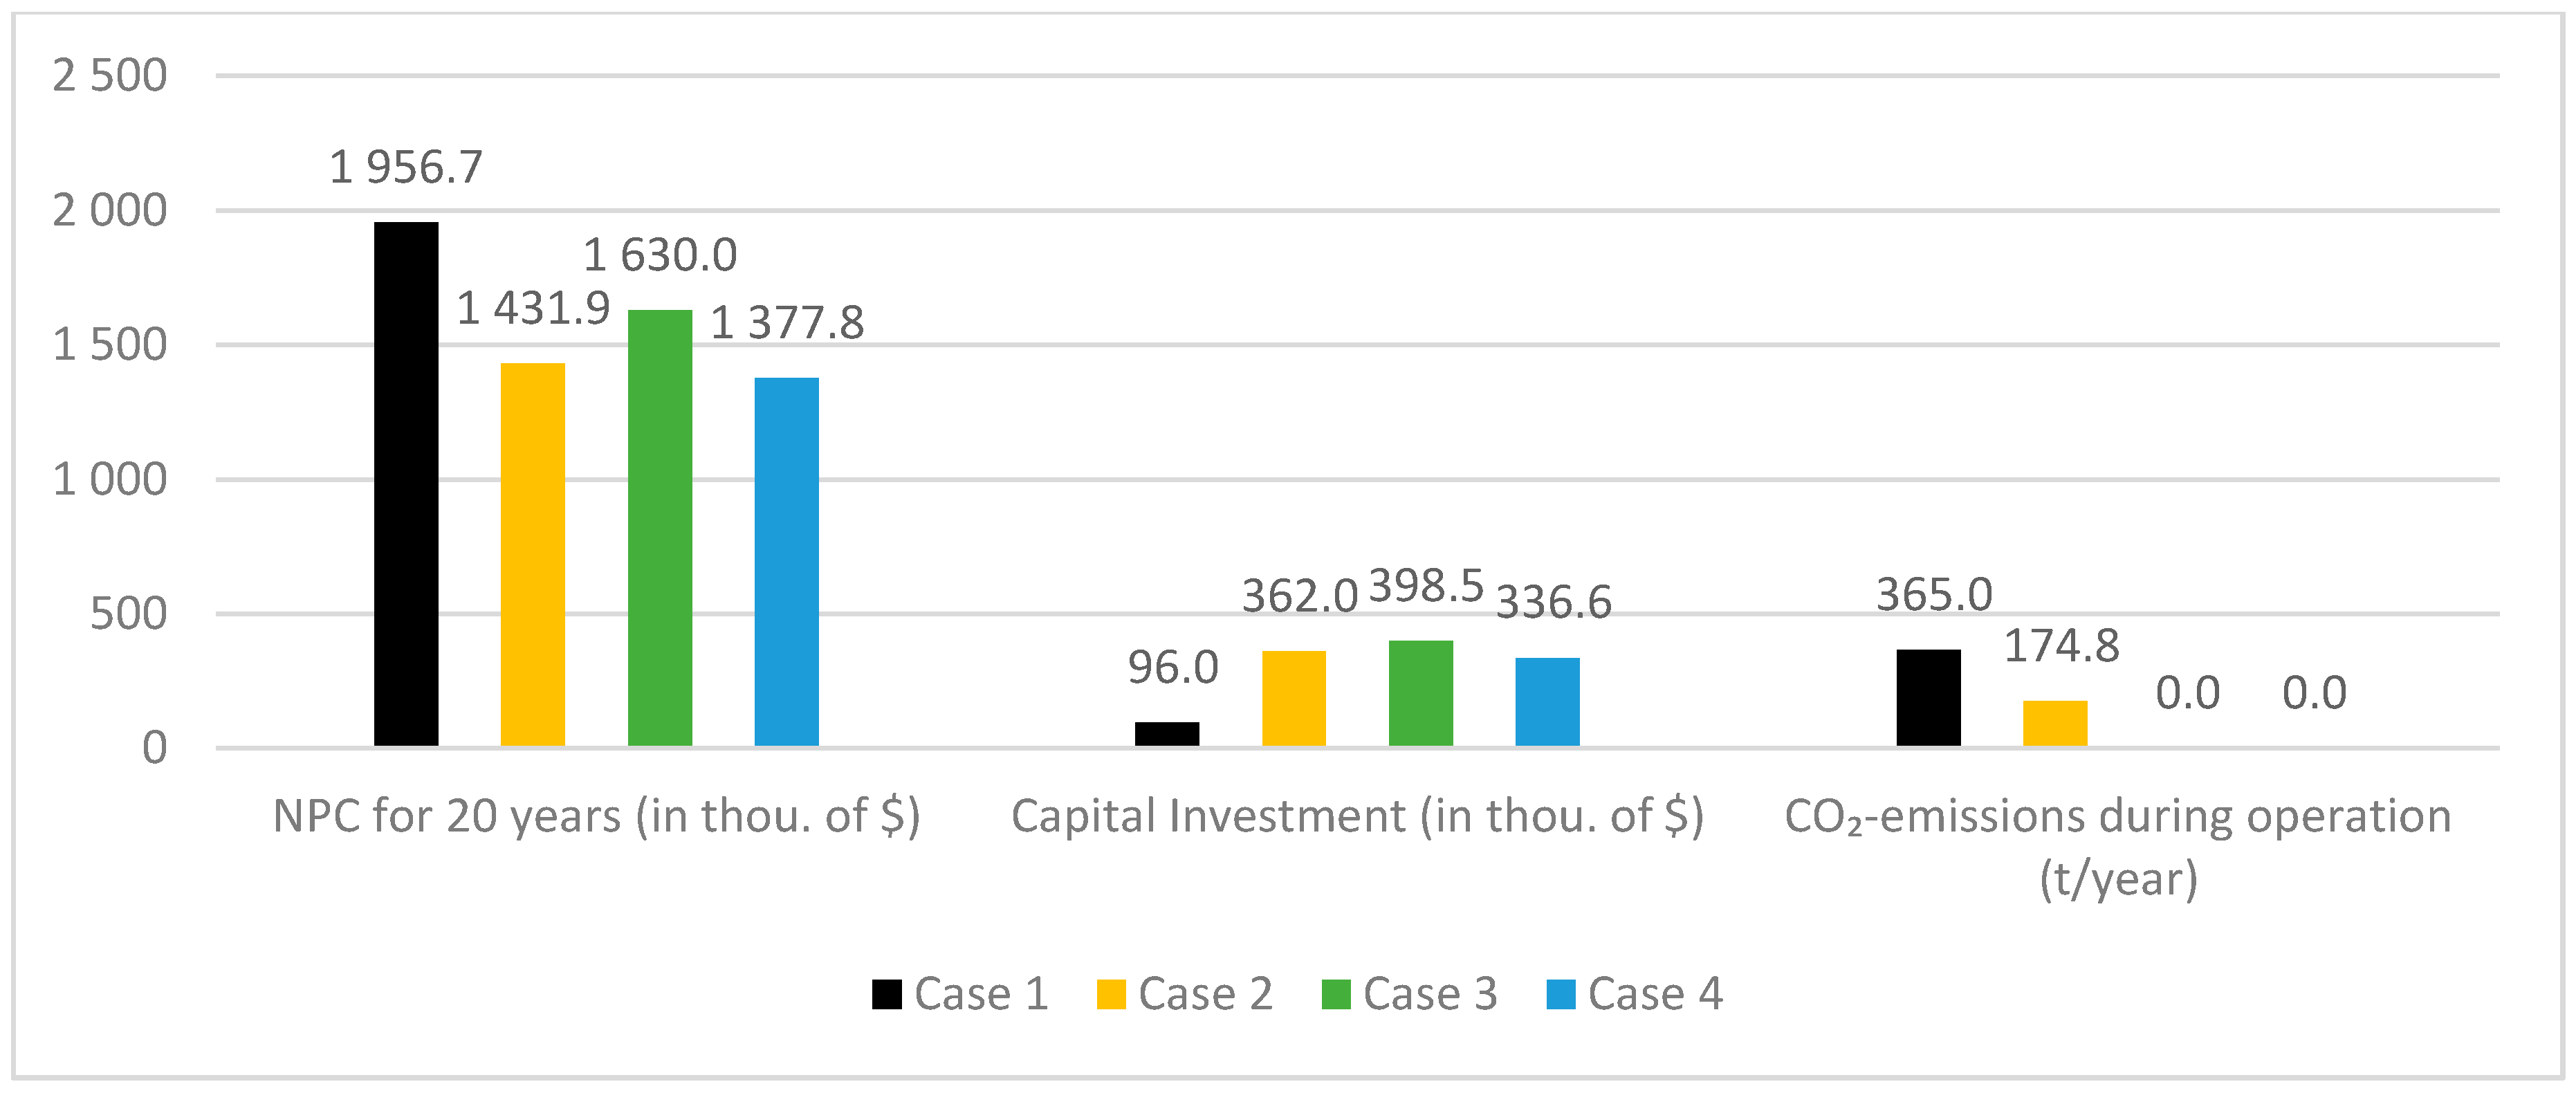
4.1. Economic
4.2. Energetic
4.3. Ecological
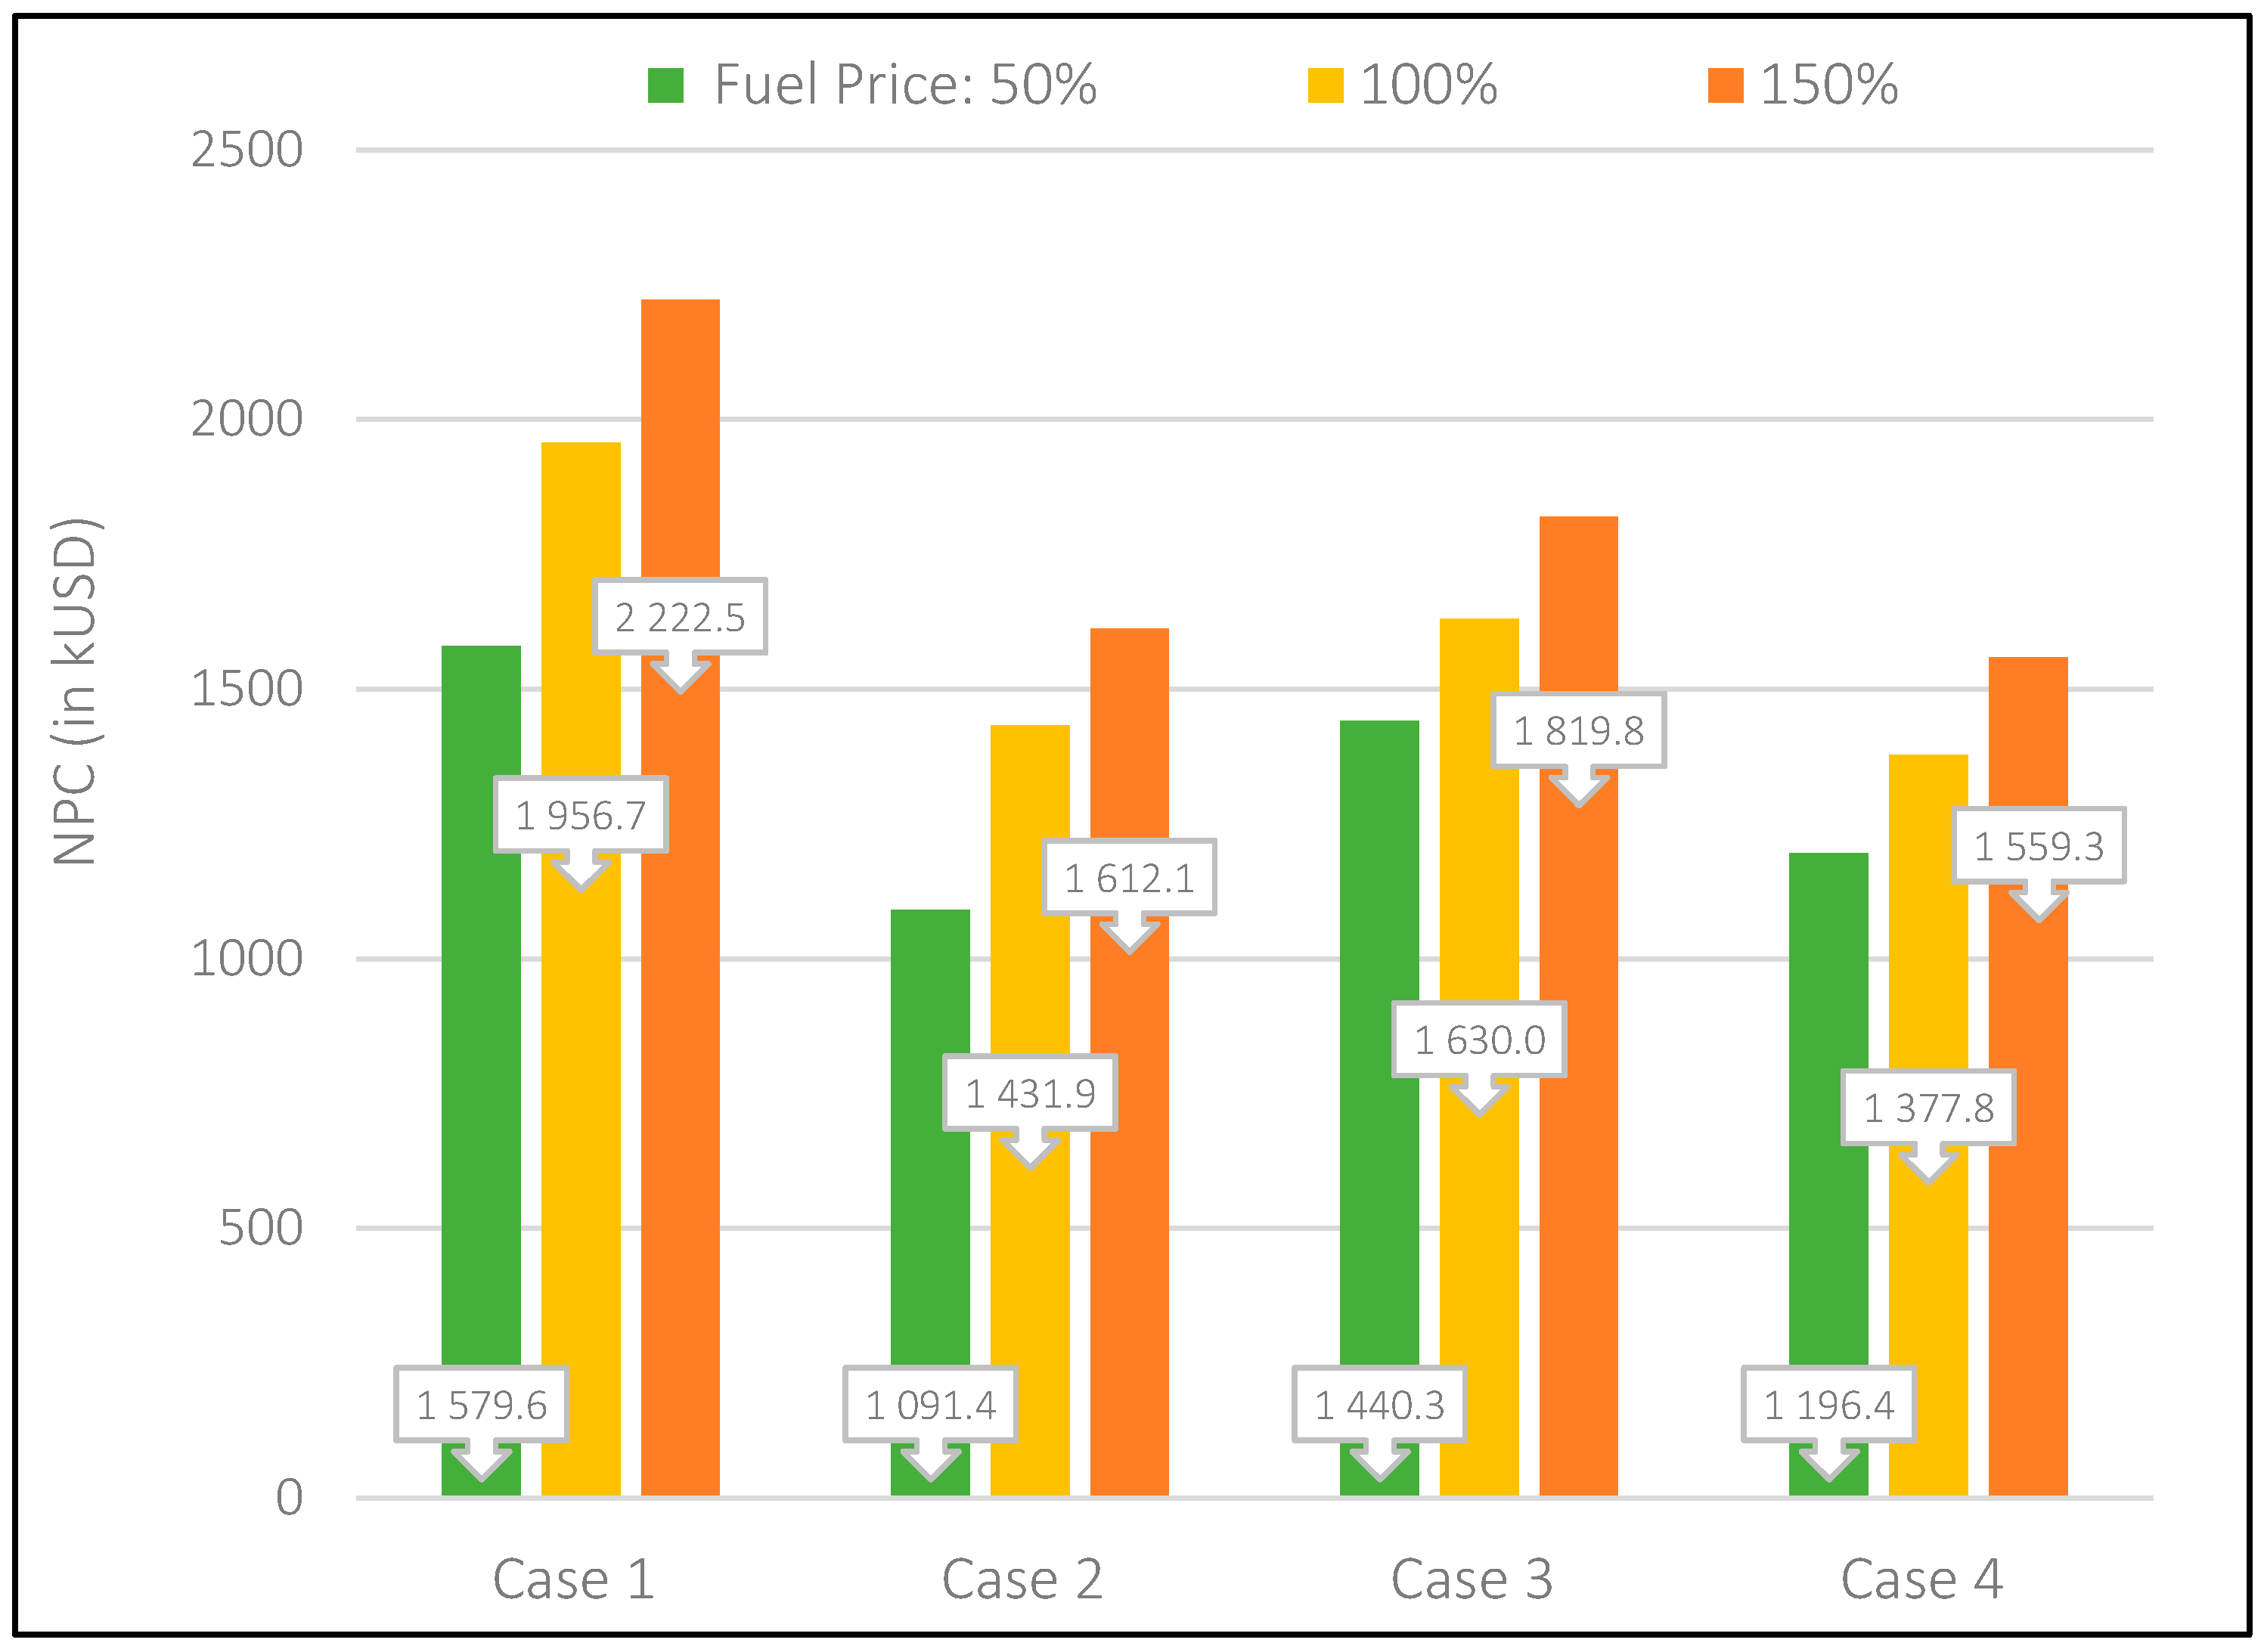
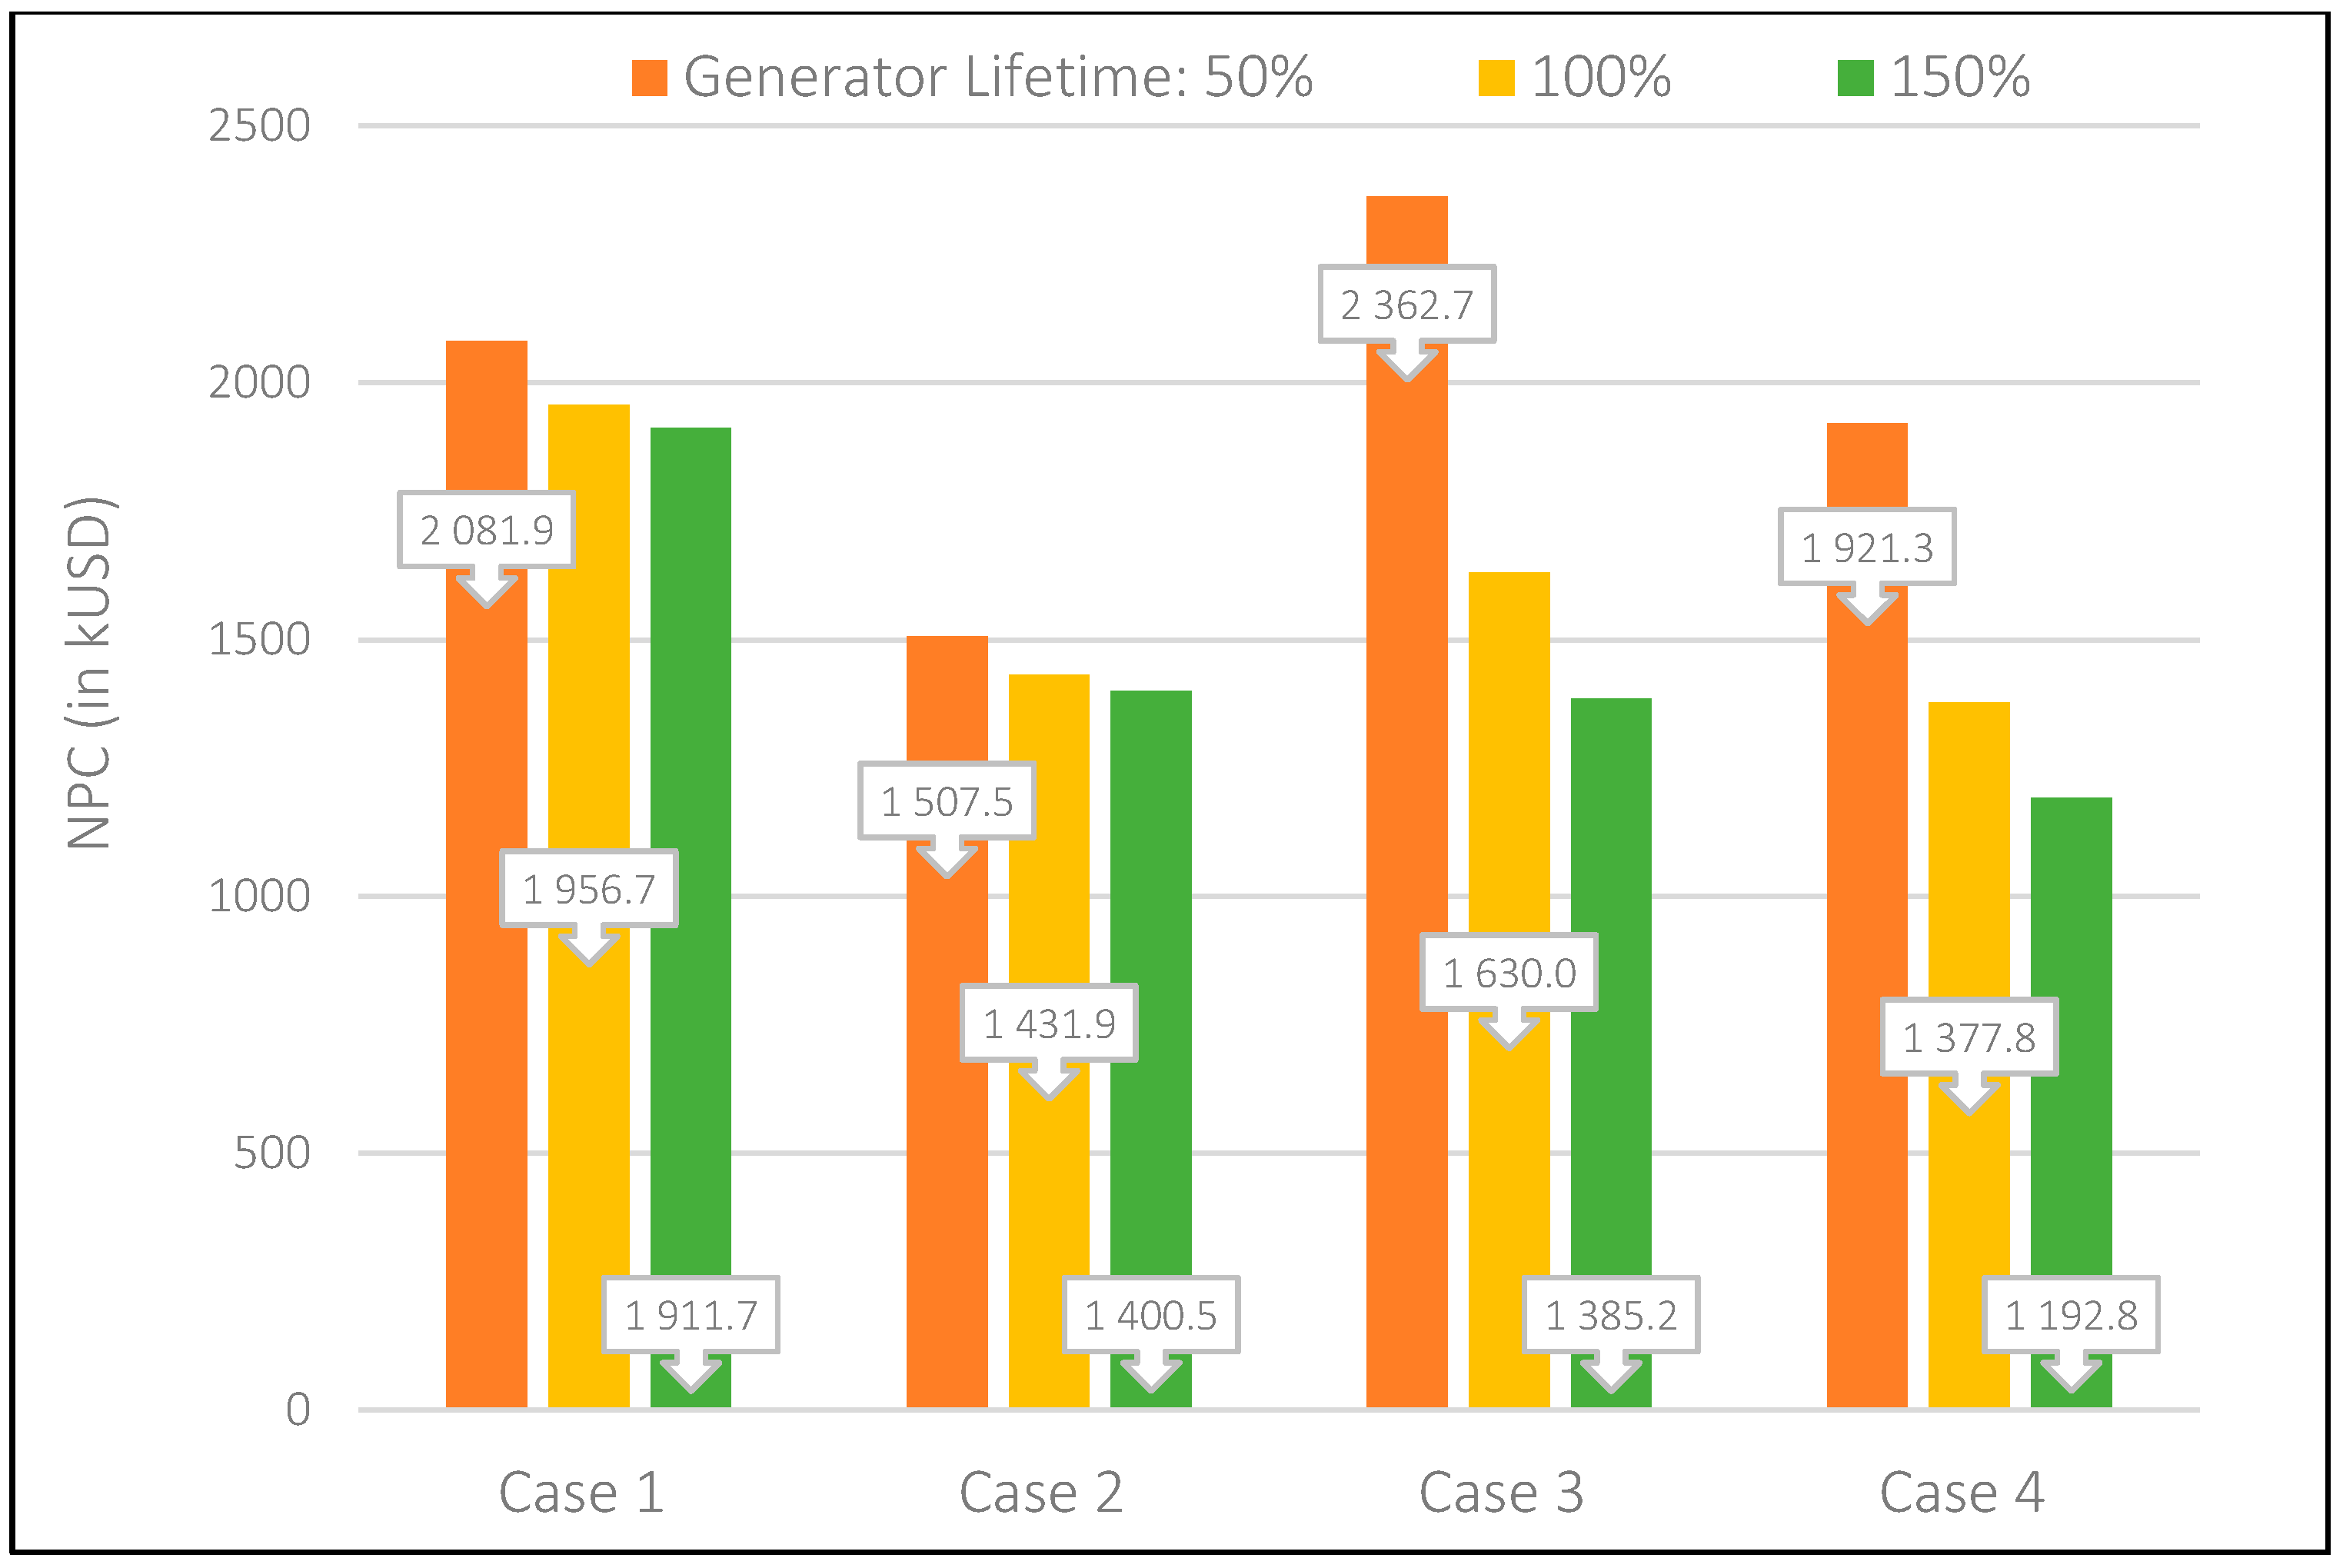
4.4. Sensitivity Analysis
5. Discussion
6. Conclusions
Author Contributions
Funding
Acknowledgments
Conflicts of Interest
Nomenclature
| 3E | Economic, Energetic, and Ecological |
| AC | Absorption chiller |
| CCHP/Trigeneration | Combined Cooling, Heat, and Power |
| CHP | Combined Heat and Power |
| COP | Coefficient of Performance |
| GHG | Green House Gases |
| HOMER | Hybrid Optimization of Multiple Energy Resources |
| ICE | Internal Combustion Engine |
| NOx | Nitrogen Oxides |
| NPC | Net Present Cost |
| O&M | Operation and Management |
| ORC | Organic Rankine Cycle |
| PV | Photovoltaic |
| VC | Vapour compression chiller |
References
- Pachauri, R.K.; Allen, M.R.; Barros, V.R.; Broome, J.; Cramer, W.; Christ, R.; Church, J.A.; Clarke, L.; Dahe, Q.; Dasgupta, P.; et al. IPCC, 2014: Climate Change 2014: Synthesis Report. Contribution of Working Groups I, II and III to the Fifth Assessment Report of the Intergovernmental Panel on Climate Change; IPCC: Geneva, Switzerland, 2014. [Google Scholar]
- Baldacchino, G. Islands, Island Studies. Isl. Stud. J. 2006, 1, 3–18. [Google Scholar]
- Blechinger, P.; Cader, C.; Bertheau, P.; Huyskens, H.; Seguin, R.; Breyer, C. Global analysis of the techno-economic potential of renewable energy hybrid systems on small islands. Energy Policy 2016, 98, 674–687. [Google Scholar] [CrossRef]
- Liu, J.; Mei, C.; Wang, H.; Shao, W.; Xiang, C. Powering an island system by renewable energy—A feasibility analysis in the Maldives. Appl. Energy 2017. [Google Scholar] [CrossRef]
- Chae, W.; Lee, H.; Won, J.; Park, J.; Kim, J. Design and Field Tests of an Inverted Based Remote MicroGrid on a Korean Island. Energies 2015, 8, 8193–8210. [Google Scholar] [CrossRef]
- Ali Ahmed, A.; Elizondo Azuela, G.; Bazilian, M.; Bertheau, P.; Cader, C.; Kempener, R.; Lavagne, O.; Saygin, D.; Skeer, J.; Vinci, S.; et al. Off Grid Renewable Energy Systems: Status and Methodological Issue. Available online: http://www.irena.org/DocumentDownloads/Publications/IRENA_Off-grid_Renewable_Systems_WP_2015.pdf (accessed on 1 March 2019).
- Al Moussawi, H.; Fardoun, F.; Louahlia-Gualous, H. Review of tri-generation technologies: Design evaluation, optimization, decision-making, and selection approach. Energy Convers. Manag. 2016, 120, 157–196. [Google Scholar] [CrossRef]
- Al Moussawi, H.; Fardoun, F.; Louahlia, H. Selection based on differences between cogeneration and trigeneration in various prime mover technologies. Renew. Sustain. Energy Rev. 2017, 74, 491–511. [Google Scholar] [CrossRef]
- Al-Sulaiman, F.A.; Hamdullahpur, F.; Dincer, I. Trigeneration: A comprehensive review based on prime movers. Int. J. Energy Res. 2011, 35, 233–258. [Google Scholar] [CrossRef]
- Sonar, D.; Soni, S.L.; Sharma, D. Micro-trigeneration for energy sustainability: Technologies, tools and trends. Appl. Therm. Eng. 2014, 71, 790–796. [Google Scholar] [CrossRef]
- Sansaniwal, S.K.; Pal, K.; Rosen, M.A.; Tyagi, S.K. Recent advances in the development of biomass gasification technology: A comprehensive review. Renew. Sustain. Energy Rev. 2017, 72, 363–384. [Google Scholar] [CrossRef]
- Kumar, A.; Kumar, N.; Baredar, P.; Shukla, A. A review on biomass energy resources, potential, conversion and policy in India. Renew. Sustain. Energy Rev. 2015, 45, 530–539. [Google Scholar] [CrossRef]
- Calise, F.; Cipollina, A.; d’Accadia, D.M.; Piacentino, A. A novel renewable polygeneration system for a small Mediterranean volcanic island for the combined production of energy and water: Dynamic simulation and economic assessment. Appl. Energy 2014, 135, 675–693. [Google Scholar] [CrossRef]
- Calise, F.; d’Accadia, D.M.; Piacentino, A. Exergetic and exergoeconomic analysis of a renewable polygeneration system and viability study for small isolated communities. Energy 2015, 92, 290–307. [Google Scholar] [CrossRef]
- Karellas, S.; Braimakis, K. Energy-exergy analysis and economic investigation of a cogeneration and trigeneration ORC-VCC hybrid system utilizing biomass fuel and solar power. Energy Convers. Manag. 2016, 107, 103–113. [Google Scholar] [CrossRef]
- Chua, K.J.; Yang, W.M.; Er, S.S.; Ho, C.A. Sustainable energy systems for a remote island community. Appl. Energy 2014, 113, 1752–1763. [Google Scholar] [CrossRef]
- Wegener, M.; Malmquist, A.; Isalgué, A.; Martin, A. Biomass-fired combined cooling, heating and power for small scale applications—A review. Pergamon 2018, 96. [Google Scholar] [CrossRef]
- Kumar, P.; Pukale, R.; Kumabhar, N.; Patil, U. Optimal Design Configuration Using HOMER. Procedia Technol. 2016, 24, 499–504. [Google Scholar] [CrossRef]
- Homer Energy HOMER—Hybrid Renewable and Distributed Generation System Design Software. Available online: https://www.homerenergy.com/support/docs/3.10/glossary.html (accessed on 19 February 2019).
- India Interest Rate | 2019 | Data | Chart | Calendar | Forecast | News. Available online: https://tradingeconomics.com/india/interest-rate (accessed on 19 February 2019).
- Bahramara, S.; Moghaddam, M.P.; Haghifam, M.R. Optimal planning of hybrid renewable energy systems using HOMER: A review. Renew. Sustain. Energy Rev. 2016, 62, 609–620. [Google Scholar] [CrossRef]
- ASHRAE Standard 55-2004 Thermal Environment Conditions for Human Occupancy. Available online: https://osr.ashrae.org/Public (accessed on 19 February 2019).
- Surface Meteorology and Solar Energy. Available online: https://eosweb.larc.nasa.gov/sse/ (accessed on 20 March 2019).
- Government of Uttarakhand 24 x 7 Power for All Uttarakhand. Available online: https://powermin.nic.in/sites/default/files/uploads/joint_initiative_of_govt_of_india_and_andman_nicobar.pdf (accessed on 20 March 2019).
- SPV Power Plant Becomes an Eyesore Rs.1.5 Crore Solar Power Plant project of Neil Island Becomes Laughing Stock; Andaman Sheekha: Port Blair, India, 2014.
- Singal, S.K.; Singh, R.P. Rural electrification of a remote island by renewable energy sources. Renew. Energy 2007, 32, 2491–2501. [Google Scholar] [CrossRef]
- Mamphweli, N.S.; Meyer, E.L. Evaluation of the conversion efficiency of the 180Nm 3/h Johansson Biomass Gasifier. Int. J. Ambient Energy 2010, 1, 2076–2909. [Google Scholar]
- Shiva Kumar, B.; Sudhakar, K. Performance evaluation of 10 MW grid connected solar photovoltaic power plant in India. Energy Rep. 2015, 1, 184–192. [Google Scholar] [CrossRef]
- Ossenbrink, H.; Jäger-Waldau, A.; Huld, T.; Taylor, N. New Opportunities for PV Systems. In Proceedings of the 27th European Photovoltaic Solar Energy Conference and Exhibition, Frankfurt, Germany, 24–28 September 2012; pp. 3727–3730. [Google Scholar] [CrossRef]
- Yoo, K.; Park, E.; Kim, H.; Ohm, J.; Yang, T.; Kim, K.; Chang, H.; del Pobil, A. Optimized Renewable and Sustainable Electricity Generation Systems for Ulleungdo Island in South Korea. Sustainability 2014, 6, 7883–7893. [Google Scholar] [CrossRef]
- Surrette Rolls 4-KS-25PS 1900 Ah, 4 Volt Deep Cycle Battery. Available online: http://webosolar.com/store/en/deep-cycle-batteries/990-surrette-rolls-4-ks-25ps-1900-ah-4-volt-deep-cycle-battery.html (accessed on 12 December 2018).
- Coronado, C.R.; Yoshioka, J.T.; Silveira, J.L. Electricity, hot water and cold water production from biomass. Energetic and economical analysis of the compact system of cogeneration run with woodgas from a small downdraft gasifier. Renew. Energy 2011, 36, 1861–1868. [Google Scholar] [CrossRef]
- Bhattacharjee, S.; Dey, A. Techno-economic performance evaluation of grid integrated PV-biomass hybrid power generation for rice mill. Sustain. Energy Technol. Assess. 2014, 7, 6–16. [Google Scholar] [CrossRef]
- Bates, R.P.; Dölle, K.; Ravi, K. Syngas Use in Internal Combustion Engines—A Review. Adv. Res. 2017, 10, 1–8. [Google Scholar] [CrossRef]
- Mbikan, M.; Al-Shemmeri, T. Computational model of a biomass driven absorption refrigeration system. Energies 2017, 10, 234. [Google Scholar] [CrossRef]
- Sigarchian, S.G.; Paleta, R.; Malmquist, A.; Pina, A. Feasibility study of using a biogas engine as backup in a decentralized hybrid (PV/wind/battery) power generation system—Case study Kenya. Energy 2015, 90, 1830–1841. [Google Scholar] [CrossRef]
- Approximate Diesel Generator Fuel Consumption Chart. Available online: http://www.dieselserviceandsupply.com/Diesel_Fuel_Consumption.aspx (accessed on 20 March 2019).
- APL Power Pallets from ALL Power Labs. Available online: http://www.allpowerlabs.com/news/5000-price-reduction-on-apl-power-pallets.html (accessed on 20 March 2019).
- Bocci, E.; Sisinni, M.; Moneti, M.; Vecchione, L.; Di Carlo, A.; Villarini, M. State of art of small scale biomass gasification power systems: A review of the different typologies. Energy Procedia 2014, 45, 247–256. [Google Scholar] [CrossRef]
- Murugan, S.; Horák, B. Tri and polygeneration systems—A review. Renew. Sustain. Energy Rev. 2016. [Google Scholar] [CrossRef]
- Staffell, I.; Brett, D.; Brandon, N.; Hawkes, A. A review of domestic heat pumps. Energy Environ. Sci. 2012, 5, 9291. [Google Scholar] [CrossRef]
- Brandin, J.; Tunér, M.; Odenbrand, I.; Lund, V. Small Scale Gasification: Gas Engine CHP for Biofuels; Swedish Linnaeus Unviversity: Växjö, Sweden, 2011. [Google Scholar]
- Buchholz, T.; Da Silva, I.; Furtado, J. Electricity from wood-fired gasification in Uganda—A 250 and 10kW case study. In Proceedings of the 2012 Proceedings of the 20th Domestic Use of Energy Conference, Cape Town, South Africa, 3–4 April 2012. [Google Scholar]
- Kohl, T.; Laukkanen, T.; Järvinen, M.; Fogelholm, C.-J. Energetic and environmental performance of three biomass upgrading processes integrated with a CHP plant. Appl. Energy 2013, 107, 124–134. [Google Scholar] [CrossRef]
- World Development Indicators | DataBank. Available online: http://databank.worldbank.org/data/reports.aspx?source=2&series=EN.ATM.CO2E.PC&country=# (accessed on 20 March 2019).
- Fan, J.; Hong, H.; Zhu, L.; Jiang, Q.; Jin, H. Thermodynamic and environmental evaluation of biomass and coal co-fuelled gasification chemical looping combustion with CO2 capture for combined cooling, heating and power production. Appl. Energy 2017, 195, 861–876. [Google Scholar] [CrossRef]
- Kannan, N.; Vakeesan, D. Solar energy for future world: A review. Renew. Sustain. Energy Rev. 2016, 62, 1092–1105. [Google Scholar] [CrossRef]
- IRENA Battery Storage Report 2015. Available online: http://www.irena.org/DocumentDownloads/Publications/IRENA_Battery_Storage_report_2015.pdf (accessed on 20 January 2019).


| No. | Type of Biomass | Biomass Available for Gasification/year (kg) | Biomass Available for Gasification/year (kWh)1 |
|---|---|---|---|
| 1 | Crop residues (rice straw) | 94,550 | 274,284 |
| 2 | Rice husk | 54,690 | 190,604 |
| 3 | Biomass waste (coconut shells, coconut husks etc.) | 144,489 | 588,084 |
| 4 | Biomass waste from bark and lops and tops on forest extraction from forest department | 300,000 | 1,220,333 |
| Σ | Total | 593,729 | 2,273,306 |
| Component | Capital & Replacement Cost | O&M Cost | Further Characteristics |
|---|---|---|---|
| PV panels | 1000 USD/kW and 1000 USD/kW [29] | 25 USD/year/kW [30] | Lifetime: 25 years Derating factor: 80% Slope: 12° Max. Efficiency: 15% |
| Batteries | 1500 USD/kW and 1500 USD/kW [31] | 30USD/year/battery [31] | Model: Surrette 4-KS-25PS (1900Ah, 4 V Deep) Cycle Battery [31] Lead-acid type Minimum battery lifetime: 7 years Lifetime Throughput: 10,973 kWh 6 batteries per String (24 V String) |
| Gasifier + Gas engine | 3000 USD/kW and 3000 USD/kW | 0.03USD/kWh [32] | Lifetime of both: 15,000 h [33] Gasifier efficiency: 75% [27] Engine max. efficiency: 24% [34] |
| CCHP measures | 25,850 USDfor entire equipment | 0.013USD/kWh [32] | 75 kW Heat exchanger 42 kW AC (COP: 0.6) [35] Capital cost include piping, engineering and shipment 20 year lifetime |
| Converter | 750 USD/kW and 750 USD/kW [36] | 10USD/year/kW [30] | Lifetime: 20 years, Inverter efficiency: 90% Rectifier efficiency 90% |
| Diesel engine | 600 USD/kW and 600 USD/kW [36] | 0.02 USD/kWh [36] | Lifetime: 20,000 h Minimum load: 40% [37] Maximum efficiency: 38% [37] Emission data from HOMER Forced on from 18.00–24.00 every day |
| Variable | Variable Value |
|---|---|
| Heat recovery rate of the engine waste heat (based on [40]): | 70% |
| Hourly heat used for heating: | 5 kWh |
| Hourly heat used for cooling: | 70 kWh |
| Average COP of electric air-source heat pumps: (based on [41]) | 2.5 |
| Average COP of AC: (based on [10]) | 0.6 |
| Average COP of VC: (based on [15]) | 3.5 |
| Factor variable for heat losses: . (author’s judgement) | 0.9 |
| Factor variable for maintenance and repair intervals: (based on [42,43]) | 0.81 |
| Thermal efficiency of the boiler before distribution [44]: | 0.9 |
| Variable | Variable Value |
|---|---|
| Price for AC equipment [32] | 50 USD/kW effective cooling power |
| Price for heat exchanger equipment [32] | 50 USD/kW effective heat recovery |
| O&M costs for heat exchanger [32] | 0.005 USD/kWh |
| O&M costs for AC [32] | 0.008 USD/kWh |
| Additional costs for tubing based on architectural calculations | 10,000 USD |
| Additional costs for engineering, shipment etc. | 10,000 USD |
| Component | Case 1 (Diesel-Grid) | Case 2 (Solar-Assisted) | Case 3 (Bio-Solar) | Case 4 (Bio-Solar CCHP) |
|---|---|---|---|---|
| Diesel generator | 160 kW | 90 kW | - | - |
| Gasifier + Gas engine | - | - | 50 kW | 40 kW |
| PV panels | - | 200 kW | 85 kW | 85 kW |
| Batteries (Nom. Capacity) | - | 42 kW in 7 strings (319 kWh) | 84 kW in 14 strings (638 kWh) | 48 kW in 8 strings (365 kWh) |
| Converter | - | 60 kW | 50 kW | 45 kW |
| Boiler | - | - | - | 75 kW |
| Sub-System | Case 1 (Diesel-Grid) | Case 2 (Solar-Assisted) | Case 3 (Bio-Solar) | Case 4 (Bio-Solar CCHP) |
|---|---|---|---|---|
| Diesel consumption | 490,511 kWh/year | 384,817 kWh/year | - | - |
| Biomass consumption | - | - | 1,526,573 kWh/year | 1,142,813 kWh/year |
| PV generation | - | 281,986 kWh/year 58% | 119,832 kWh/year 30% | 119,832 kWh/year 38% |
| Diesel engine generation | 162,281 kWh/year 41% | 134,741 kWh/year 28% | - | - |
| Gas engine generation | - | - | 276,372 kWh/year 70% | 194,756 kWh/year 62% |
| Grid purchases | 233,729 kWh/year 59% | 71,825 kWh/year 15% | - | - |
© 2019 by the authors. Licensee MDPI, Basel, Switzerland. This article is an open access article distributed under the terms and conditions of the Creative Commons Attribution (CC BY) license (http://creativecommons.org/licenses/by/4.0/).
Share and Cite
Wegener, M.; Isalgué, A.; Malmquist, A.; Martin, A. 3E-Analysis of a Bio-Solar CCHP System for the Andaman Islands, India—A Case Study. Energies 2019, 12, 1113. https://doi.org/10.3390/en12061113
Wegener M, Isalgué A, Malmquist A, Martin A. 3E-Analysis of a Bio-Solar CCHP System for the Andaman Islands, India—A Case Study. Energies. 2019; 12(6):1113. https://doi.org/10.3390/en12061113
Chicago/Turabian StyleWegener, Moritz, Antonio Isalgué, Anders Malmquist, and Andrew Martin. 2019. "3E-Analysis of a Bio-Solar CCHP System for the Andaman Islands, India—A Case Study" Energies 12, no. 6: 1113. https://doi.org/10.3390/en12061113
APA StyleWegener, M., Isalgué, A., Malmquist, A., & Martin, A. (2019). 3E-Analysis of a Bio-Solar CCHP System for the Andaman Islands, India—A Case Study. Energies, 12(6), 1113. https://doi.org/10.3390/en12061113