Article

Assessing the Energy Performance of Solar Thermal Energy for Heat Production in Urban Areas: A Case Study

by
Teodora Melania Șoimoșan
1,*,
Ligia Mihaela Moga
1,
Gelu Danku
1,
Aurica Căzilă
2 and
Daniela Lucia Manea
1
1
Faculty of Civil Engineering, Technical University of Cluj-Napoca, Constantin Daicoviciu Street, No. 15, 400020 Cluj-Napoca, Romania
2
Faculty of Mechanics, Technical University of Cluj-Napoca, Cluj-Napoca, Boulevard of Muncii, No. 103-105, 400641 Cluj-Napoca, Romania
*
Author to whom correspondence should be addressed.
Energies 2019, 12(6), 1088; https://doi.org/10.3390/en12061088
Submission received: 18 January 2019 / Revised: 1 March 2019 / Accepted: 19 March 2019 / Published: 21 March 2019
(This article belongs to the Section G: Energy and Buildings)

Abstract

:
One of the major challenges faced in the optimization process of existing heating systems is the harnessing and integration of a higher share of renewable energy. Centralized integration at the thermic source leads to high investment costs at the first investment stage, and low values of conversion, transport, and storage efficiencies, due to high levels of heat loss from large-capacity entropic systems. This research paper presents a case study on the partially decentralized integration of thermal solar fields that are used for heat production in crowded urban areas within the optimization process of the existing heating system in the city of Oradea, Romania. A deterministic method was used as the method for the calculation of heat demand, in both stationary—hourly heat demand and dynamic regimes—annual heat demand, and the simulations within the configuration and the optimization process of the hybrid heating systems were carried out. In the case study, four representative urban areas with different thermal densities were analyzed within two working scenarios, which took into account the energy performances of the buildings inside the studied areas before thermal retrofitting, and after a usual thermal retrofit.

1. Introduction

At present, almost 50% of the total energy that is consumed in Europe is being used for the generation of heat for either domestic or industrial purposes [1]. Around 40% of the total energy consumed is consumed in buildings; thus, buildings are responsible for generating more than 35% of the total carbon emissions in the European countries [2,3]. The vast majority of buildings are placed within urban areas, thus resulting in areas with high energy consumption densities [4]. In the current context, worldwide, there are many ways to face the challenges of sustainable development in the energy field. Efficient usage of energy and energy resources represents a major objective, focusing on the percentage increase of the use of clean and renewable energy sources (RES). Optimizing the energy balance of the urban thermo-energy sector by harnessing renewable energy sources identified within urban areas meets such requirements.
The thermal energy demand that is related to space heating and hot water preparation within residential and services sectors represents an important part of the total thermal energy demand at the district level. Such a demand is currently met, to a large extent, by the existing district heating systems [5,6].
It is a proven fact that the energy efficiency of a centralized heating system is closely linked to the energy density and surface that is covered by consumers in built-up areas, and the uniformity of this coverage. Optimizing the configuration of a district heating system in order to increase energy performance with respect to these indicators has often been approached within the technical literature, in recent times [2,7,8].
Due to the significant energy impacts of district heating systems, modelling, simulation, and analysis of such systems requires a significant degree of effort from engineers and researchers [8,9,10,11,12]. A great variety of methods and methodologies have been elaborated and developed, and are aimed at designing new energetic systems, and optimizing existing ones [2,9,10,11,12]. In order to select the optimal energy system, there are also numerous applications that are based on the analytical network process method [13]. Similar methods were developed that were based on fuzzy or RNA logic process, aimed at predicting and monitoring energy consumption [14,15,16]. Another category of analysis methods are the deterministic methods, enforced under dynamic regimes, that are compliant with the characteristics of demands in the case of new energy systems, or in the case of the existing systems with the energy consumptions and with the variable features of available energy, if renewable energy sources are taken into consideration. Such methods balance with sufficient accuracy the technological processes that are associated with the production, storage, transport, and consumption of the energy [17,18]. In most cases, the mainly used indicators are economic and environmental ones [19,20,21,22,23,24]. When comparing different types of energy equipment, one may consider fuel saving indicators, if the two forms of energy, heat and electricity, are jointly produced, as compared to installations that produce those two types of energy separately. From this perspective, the resulting optimal technology usually seems to be a cogeneration system [25]. The use of cogeneration has led to proper results in reducing fossil fuel consumption, and this has major results in reducing greenhouse gases emissions. However, from the perspective of several studies carried out within this field, it has also led to the increase of some pollutant levels, especially NOx, within inhabited areas [26,27,28]. CO, CO2, SO2, and NOx compounds are considered to be aggressive pollutants, and they are also the result of burning fossil fuels in order to generate heat, and therefore their reduction is also a critical objective of current worldwide energy policies.
In the future, one can expect that energy systems will include higher shares of renewable energy. Due to the fact that the connection between the efficiency of a system, both energetically and environmentally, and the use of the renewable energy sources is already proven, one of the main objectives in the district heating systems domain is currently to increase the share of renewable energy. Because the harnessing technologies for such energy require high investment costs, and they are rather limited from a technological point of view, the following objectives in the field are highlighted: optimizing the renewable energy use technologies, and the storage of the resulting thermal energy STES (seasonal thermal energy storage), and optimizing the integration of RES technologies into existing heating systems, thus resulting in hybrid heating systems.
In Romania, the current demand of thermal energy is mainly met from conventional technologies. Consequently, there is a significant potential for increasing the share of energy that results resulted from renewable heating sources, especially biomass, solar energy, and geothermal, which can all be used within alternative heating sources. The European Renewable Energy Council (EREC) has estimated that renewable energy will represent 30% of the total energy consumption at the level of the European Union until 2020, and over 50% until 2050, as compared to 2010, when the conventional heating technologies based on fossil fuels generated almost 72% of the energy consumed for heating spaces (SETIS Report).
Theoretically, the RES exploitation systems require large areas for harnessing energy, and high-capacity installations of conversion and storage. This leads to high land-use footprints. In the case of district heating systems that include technologies that are based on RES, the issue is closely connected with the systems’ optimal capacity configuration, so that the RES installations will present a minimal footprint, and they will not impact each other [7], which are both aspects that represent challenges within crowded urban areas. In the case of using geothermal resources, the optimal solution seems to be achieved when consumers from high-energy density areas are connected to the centralized district heating system, and those from low-energy density areas are provided with individual heating systems based on the exploitation of renewable resources [7].
The obtained conclusions may represent input data in the case of using other types of renewable and clean energy sources. On the other hand, regarding solar systems, the existing district heating systems through the district networks may represent a sustainable alternative to managing the resulting excess energy, which is due to the variable nature of the solar resource, thus allowing for an increase in the share of renewable energy, insofar as the technological footprint does not exceed the available surfaces for mounting the collectors.
With regard to thermo-solar resources in particular, at a European level, this represents an important component in the configuration of future district heating systems. Thermo-solar systems of medium and large capacity (>100 m2 collecting surface), efficiently integrated into the current or future district systems, already represent one of the cleanest and most innovative methods for energy optimization and the reduction of fossil fuel consumption, and implicitly, the reduction of associated CO2 emissions. In Europe, there are several applications that are in the course of implementation, or at different monitoring stages, on this matter [29,30,31,32,33,34,35,36]. Monitoring such applications allows for significant amounts of information to be secured regarding the influence of operating conditions, and strategies on the efficiency of hybrid systems. In some applications, the annual operating efficiency of thermo-solar systems, storage systems, or hybrid heating systems is below the values of the estimated efficiency during the designing stages [29,30,31,32,33,34,35]. This is due to different causes, the most common being the inadequate parameter regimes and operating strategies of the hybrid heating systems. Contrary to all of these obstacles, harnessing clean renewable energies within urban areas for the production of heat remains a necessary objective that needs to be met, as it is desirable from many points of view, among which the most important are:
  • The reduction of greenhouse emissions that are associated with the production of thermal energy.
  • The reduction of noxious gases that impact a population’s health, which are associated with the production of thermal energy within urban areas.
  • Framing the building that is connected or equipped with hybrid heating systems in superior classes of energy performance.
  • Offering to the final consumers who are connected to the district heating system, the possibility of being directly involved, through coparticipation, in the production and management of thermal energy (based on the feed-in principle).

2. Methodology

2.1. Problem Formulation

One of the most important indicators in the case of using renewable and alternative energy sources is the footprint of the land use. The land-use footprint [37] represents the effective share of the land that is used to capture, convert, and store the renewable energy, without the possibility of using these surfaces in other anthropic activities (i.e., farming, constructions, etc.). In the case of renewable energy resources, the real land-use footprint is not always equal to the value of the indicator, and it presents particular features that are dependent on the type of source. If, in the case of geothermal heating systems, the real footprint and its usage impact effects on other activities are rather low, due to the fact that most of their components are placed underground [37], in the case of harnessing, converting, and storing solar energy, this indicator becomes rather decisive for configuring the heating system, together with the global technical-economic efficiency of the hybrid system. In this context, the issue related to the optimization of the energy balance, by increasing the share of using solar thermal resource (RES-S), may be reduced to a function of two interdepending variables—harnessing the share of RES-S, and the efficiency of the optimized hybrid system, a function for which the land-use footprint of RES-S represents a major restriction.

2.2. The Purpose and Contribution of the Paper

The general purpose of this paper is to contribute to highlighting the possibilities of using solar energy in heat production within crowded urban areas, and to quantify the performances of the hybrid systems, in order to optimize, from a thermo-energy point of view, the existing heating systems. The specific purpose of this paper is the configuration of a case study, where some representative parameters are determined and analyzed.
In particular, the contributions of this paper are: determining the thermo-energy footprints of the analyzed reference urban areas, and the assessment of the efficiency and environmental impact of thermo-solar fields that are integrated in a decentralized manner at the level of the zonal thermal stations, within the configured case study. A major contribution of this paper is the possibility of extrapolating the secured results within a case study, by obtaining several specific performance indicators that are representative and exhaustive, but that are also closely connected to the particularities of different urban areas—thermal density, the number of consumers, the available surfaces, etc.

3. Methodology

3.1. Method Description

The method that is used is based on identifying the specific performance indicators that will accurately quantify the energy footprint of the solar resource that is harnessed within the urban areas, and this will allow for their extrapolation, in order to be reused to conduct exhaustive studies.
In order to configure the case study, the city of Oradea, situated within western Romania, has been selected. It was selected due to the fact that the urban heating is based largely on a district heating cogeneration system, and the current urban strategy representing elevated trends of modernization and optimization of the thermal energy production and transport system, as well as of the integration of identified renewable energy sources.
The configuration of the case study is presented in detail within the following subsection, and it presents the assessment of solar energy as a resource within the respective area, the configuration of the reference thermal consumers—the areas and the configuration of the hybrid heating system. Following centralization of the input data, it was decided that the four representative urban areas would be kept, and herein they are marked as A1 to A4, which are different from one another by the number of inhabitants and the thermal density. In order to quantify the energetic performance of the hybrid heating systems, and due to the fact that the trend is to thermally envelope buildings, two work scenarios were considered: Scenario 1 (S1)—before the thermal rehabilitation and modernization of existing buildings, respectively, and Scenario 2 (S2)—after the thermal rehabilitation and modernization of the existing buildings, respectively, for a common level of thermal enveloping of buildings [38,39].
The data secured in the case of the buildings located within the urban areas that were analyzed in Scenario 1, and the demands for heating and domestic hot water preparation respectively, were compared to the current rates of consumption.
The demands for heating and domestic hot water preparation have been processed mathematically, securing the thermo-energy footprint and ranked curve of the thermal energy demand, based on how the thermo-solar fields were configured, with respect to the available mounting surfaces—the land-use footprint.
Upon configuring the thermo-solar fields, the following criteria were considered:
  • The efficiency of the thermal energy harness is higher than the integration of the solar fields, and it is closer to the consumption points, with the possibility of managing excess energy by delivering it to the district heating networks [40], based on the feed-in principle. In this sense, the partially decentralized integration of the solar fields at the level of the thermal points of the area have been considered.
  • The available surfaces for the placement of solar collectors (i.e., on-roof terraces, roofs of parking lots, etc.).
The hydraulic and technological optimization of thermo-solar systems was conducted by using the Polysun software platform (version 2016, Vela Solaris AG, Winterthur, Switzerland), with the aim being to secure the highest annual solar fractions (as close as possible to 60%) under the high global thermo-energy efficiency of the hybrid heating system, and the high yields of the thermo-collector fields, respectively.

3.2. Description of the Case Study: A Hybrid Energy System

The description of the proposed case study presents three main aspects: modelling the solar resource for the reference location, configuration of the urban areas, determining their representative characteristics, and configuration of the hybrid system of heating, respectively.

3.2.1. Solar Energy Resources

The annual average of global solar irradiation in the case of the reference location within the proposed case study is 1249.27 kWh/m2 on a horizontal surface [41]. The average monthly values of solar irradiation and wind for the proposed location are modelled within Figure 1.

3.2.2. The Urban Area

The area of the reference locality, the city of Oradea, located in Western Romania, has been proposed for the development of the case study [42]. The typologies of the thermal energy consumers from the reference locality are illustrated in Figure 2.
The locality is placed within an eastern European geographical area, having a moderate to cold climate, and the following climate characteristics, as per current Romanian regulations in force, are shown in Table 1.
The beginning (and duration) of the heating period is not the same for all of the buildings in the area. In the case of the centralized heating systems in Romania, the threshold values of the temperature for the beginning and the end of the heating period have been established at +12 °C, recorded for three consecutive days, and +10 °C, respectively, depending on the building’s destination, as in Table 1 [44].
In order to configure the heating system, the partial thermo-energy zoning of the locality has been introduced, with the identification of zonal thermal consumers, as per Figure 2.
The proposed areas A1–A4 present constructive characteristics in accordance with Table 2. Area 5 represents a main industrial area, as analyzed within the general study, and it will be the object of a future paper.
The design of the district heating system is based on the assessment of the hourly heat demand, and the annual demand of thermo-energy (energyt), respectively. The hourly heat demand represents the maximum hourly heat demand within the heating period, determined by the calculation of the outdoor temperature in a stationary regime (according to Table 1), related to the space being heated, the ventilation, and the domestic hot water system of the buildings. The hourly heat demand was determined for each of the investigated buildings, in two working scenarios, before and after the buildings’ envelopes underwent thermal retrofitting [47]. The annual energyt demand included the energyt demand for space heating, ventilation, and domestic hot water preparation, during the entire year. The retrofits for the buildings were done for an average level of envelope retrofitting (according to [38,39]), in order for the buildings to be framed in a superior performance class. According to [48], the thermo-energy scale or thermo-energy classification grid for buildings in Romania sets the specific demand (i.e., consumption) values for heating, as described in Table 3.
The annual demand of energyt was determined within a dynamic regime, using the thermo-energy computation platform [49] for each of the investigated buildings. The resulting data are presented in Table 4 and Table 5, which summarize the representative working scenarios that are used in the case study.
The heat demands were assessed with the assistance of calculations and simulation software [47,49], or independently, according to the calculation methodologies described. In order to estimate the demands of domestic hot water within the reference buildings, a value of 90 L/individual/day was used in the case of dwelling buildings, and 4 L/individual/shift in the case of administrative buildings, at a delivery temperature of 50 °C. The hourly thermal energy demand was calculated for each area.
The calculation method for the annual heating demands [49] was based on heat exchange under a nonstationary regime, through opaque and transparent construction elements, and it considered the impact of heat intake due to human activity and solar radiation on the resulting interior temperature, as required under thermal comfort norms. The calculation method established the probable annual heating demands that must be provided by the heating system, in order to obtain a comfortable microclimate. The specific annual heating demand was calculated for each area. This method was selected, as it was superior to conventional methods that are used to estimate heating demands for urban consumers (for instance, the statistical method of heating characteristics, the methods of heating equivalent surfaces, etc.), so as to highlight and quantify the energy performances of urban consumers before and after thermal rehabilitation and modernization.
The annual energyt demand for space heating related to areas A1–A4 was reduced by ~32.3% in scenario S2 vs. scenario S1, once the building envelopes were thermally rehabilitated (i.e., modernized), respectively (see Table 6).
Within the case study, the thermal energy consumers represented the urban areas, as defined by: the thermal energy demand, both hourly and annually; the surface thermal density; the integrated thermo-energy class.
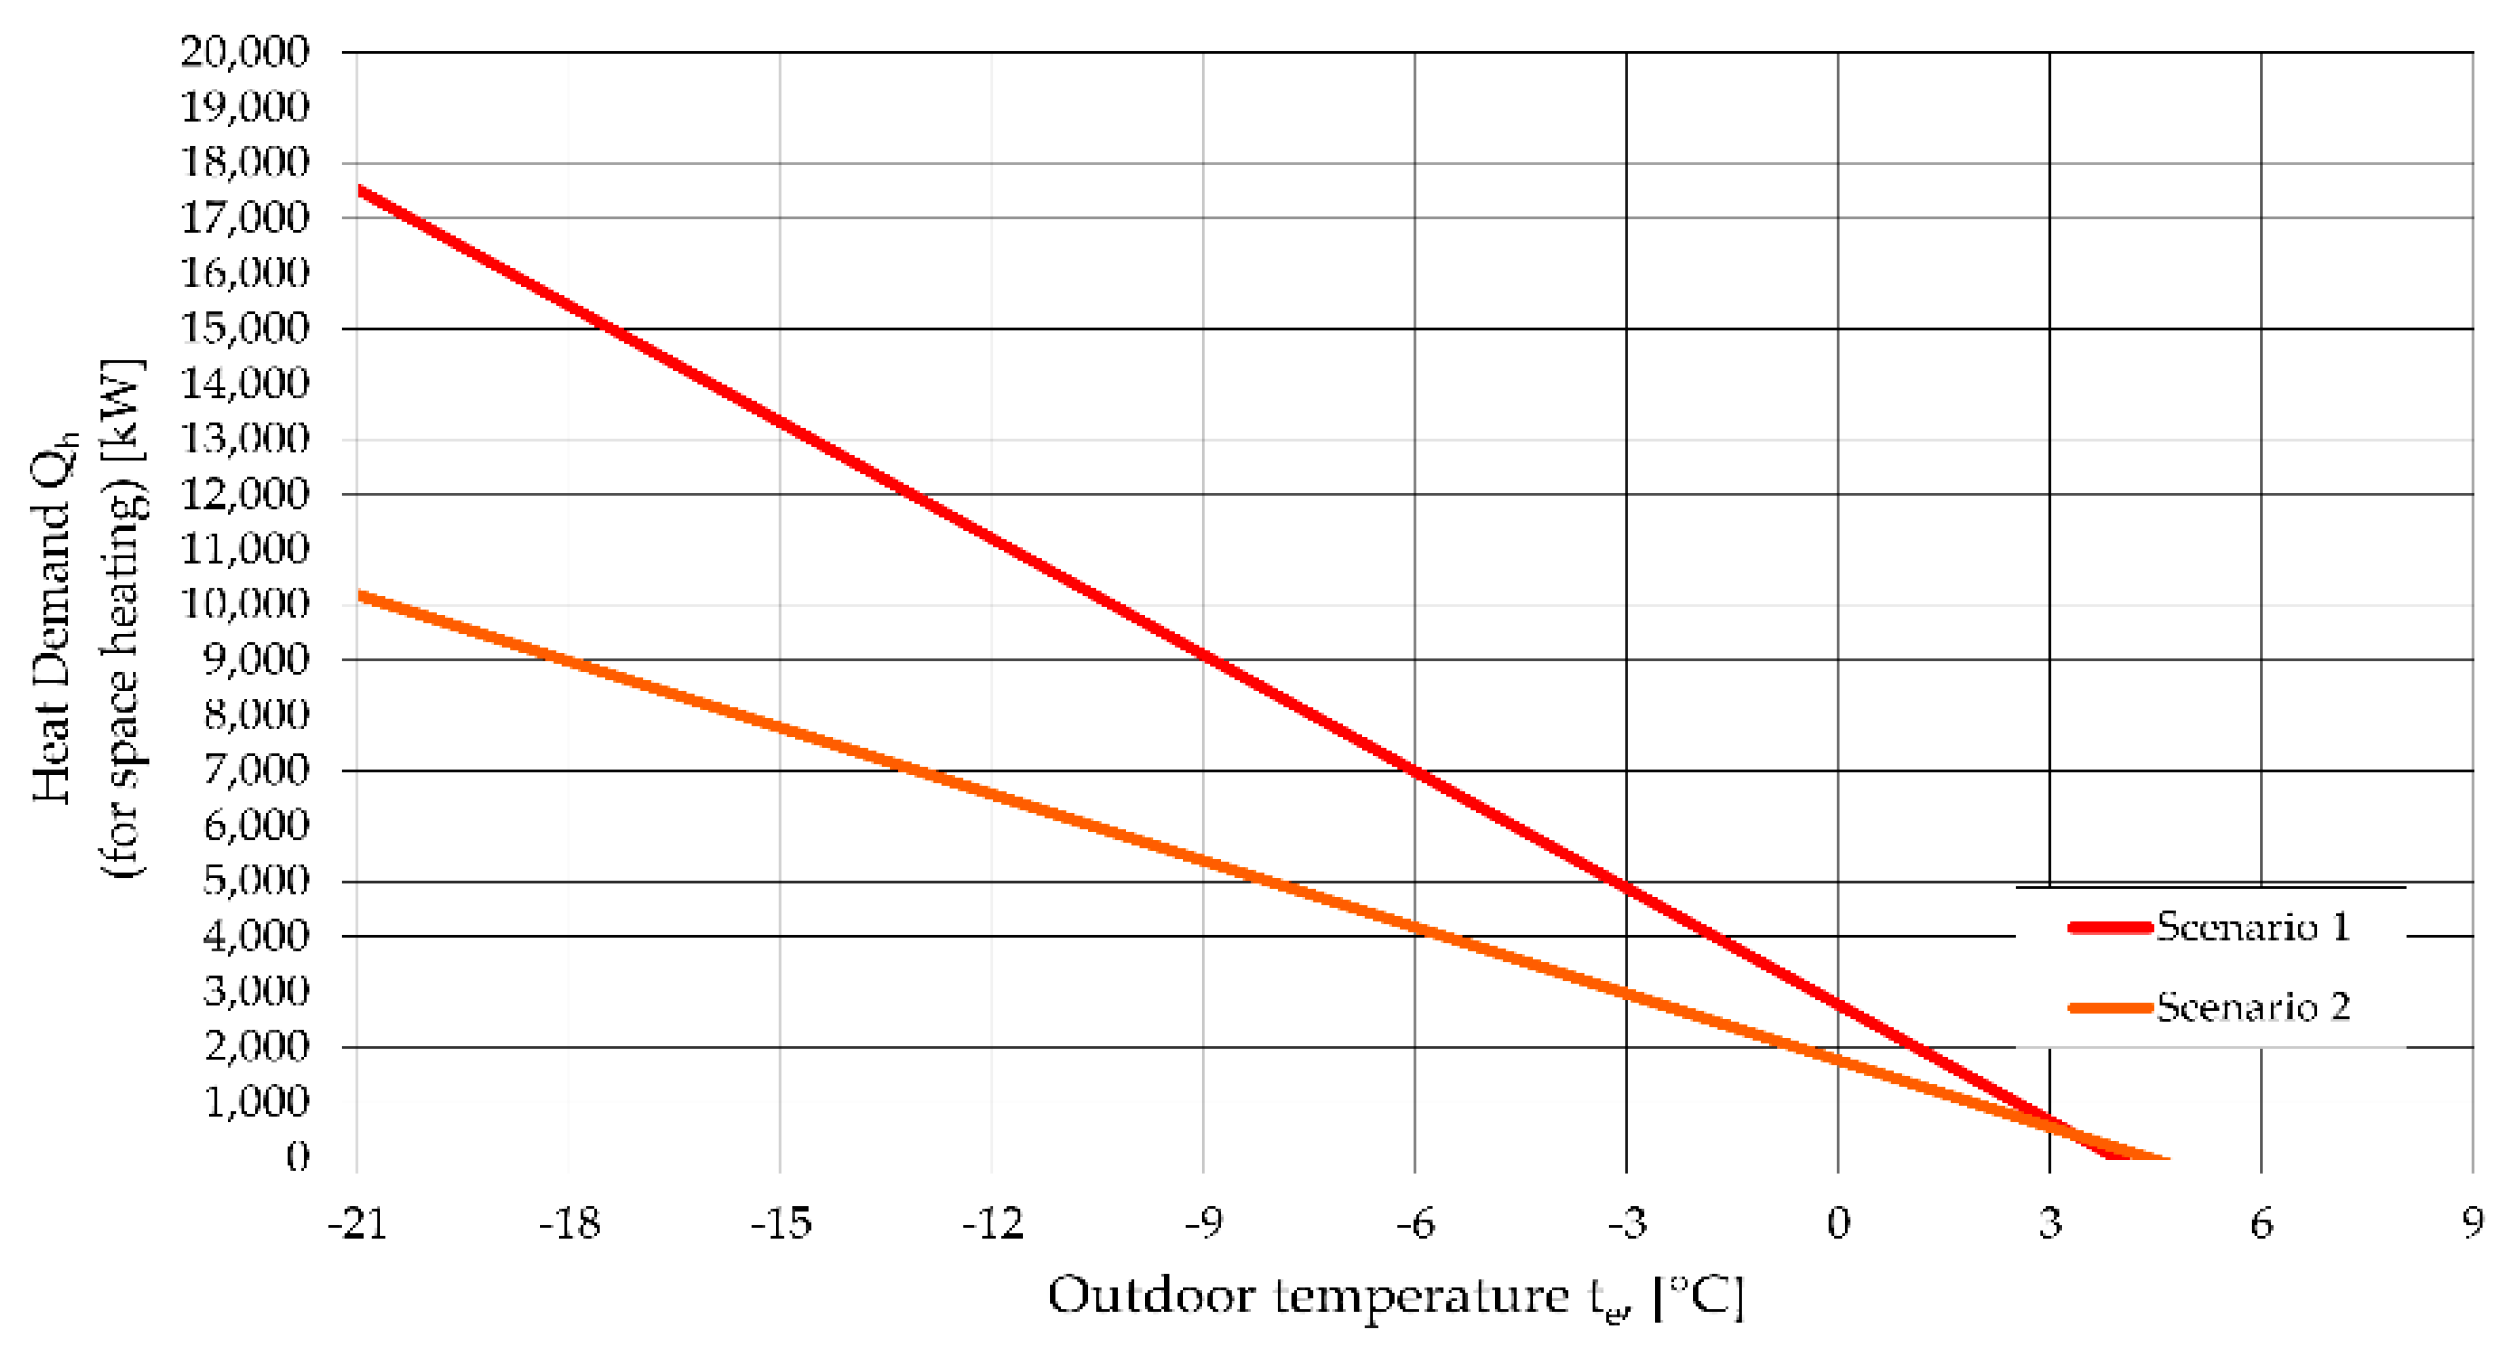
The thermo-energy footprint is illustrated in Figure 3 for the study areas A1–A4, in the case of the two work assumptions, Scenario 1 and Scenario 2—before and after thermal rehabilitation and modernization of buildings, respectively.
Under a stationary regime, the expression of the heat demand Qh represents a linear function of the outside temperature (te) (see Figure 3), as follows:
Qh = −a · te + b
where the following notes have been made:
a = G · Vc, respectively b = G · Vctint − (QS + Qint), where the G-factor is defined as a “weighted” coefficient of the thermal insulation of all buildings within the study areas [42].
where:
Vc represents the built-volume, in m3; tint = the indoor temperature of the designed house; QS = the solar input, in kW; Qint = the internal input, in kW.
For the case study analyzed, the weighted coefficient of thermal insulation G has the following values:
  • for Scenario 1 (S1): G = 1.6 × 10⁻³ W/(m3K);
  • for Scenario 2 (S2): G = 0.9 × 10⁻³ W/(m3K).
The ranked curve represents the decrease of the hourly energy demands on the entire period of a year. It is obtained by classifying all daily load curves. By overlapping all load curves, the ‘mountain’ load of the system was obtained. By intersecting it with a perpendicular plane, the power levels and the associated time periods were identified, resulting in the shapes from Figure 4. In Figure 4, the ranked curves of the thermal energy demand for heating and domestic hot water preparation (DHW) are graphically represented, in the case of the two working scenarios, scenario S1 and scenario S2, respectively.
The significant impacts of the thermal rehabilitation and modernization of building envelopes on the energy footprints of their areas are presented in Figure 3 and Figure 4.
The thermal energy consumption would decrease in Romania, following the completion of thermo-energy rehabilitation and modernization works on existing buildings, and at the same time, the reduction of the polluting emissions associated with the improvement of hygiene conditions and the interior thermal comfort, respectively, could be achieved. In the context of the case study for buildings located within areas A1–A4, the hourly heat demand for space heating was decreased by 41.5% compared to its initial value. Also, the value of the annual demand of energyt for space heating decreased by 32.3%, compared to the initial value (see Table 4 and Table 5), considering the fact that the existing buildings were thermally retrofitted (i.e., thermally insulated) at an average level (according to [38,39]).

3.2.3. The Solar-Assisted Heating System Configuration

The hybrid heating system assumes the use of solar energy in order to produce heat, by integrating solar-based systems in a decentralized way in the existing heating system, in a complementary mode to the conventional sources.
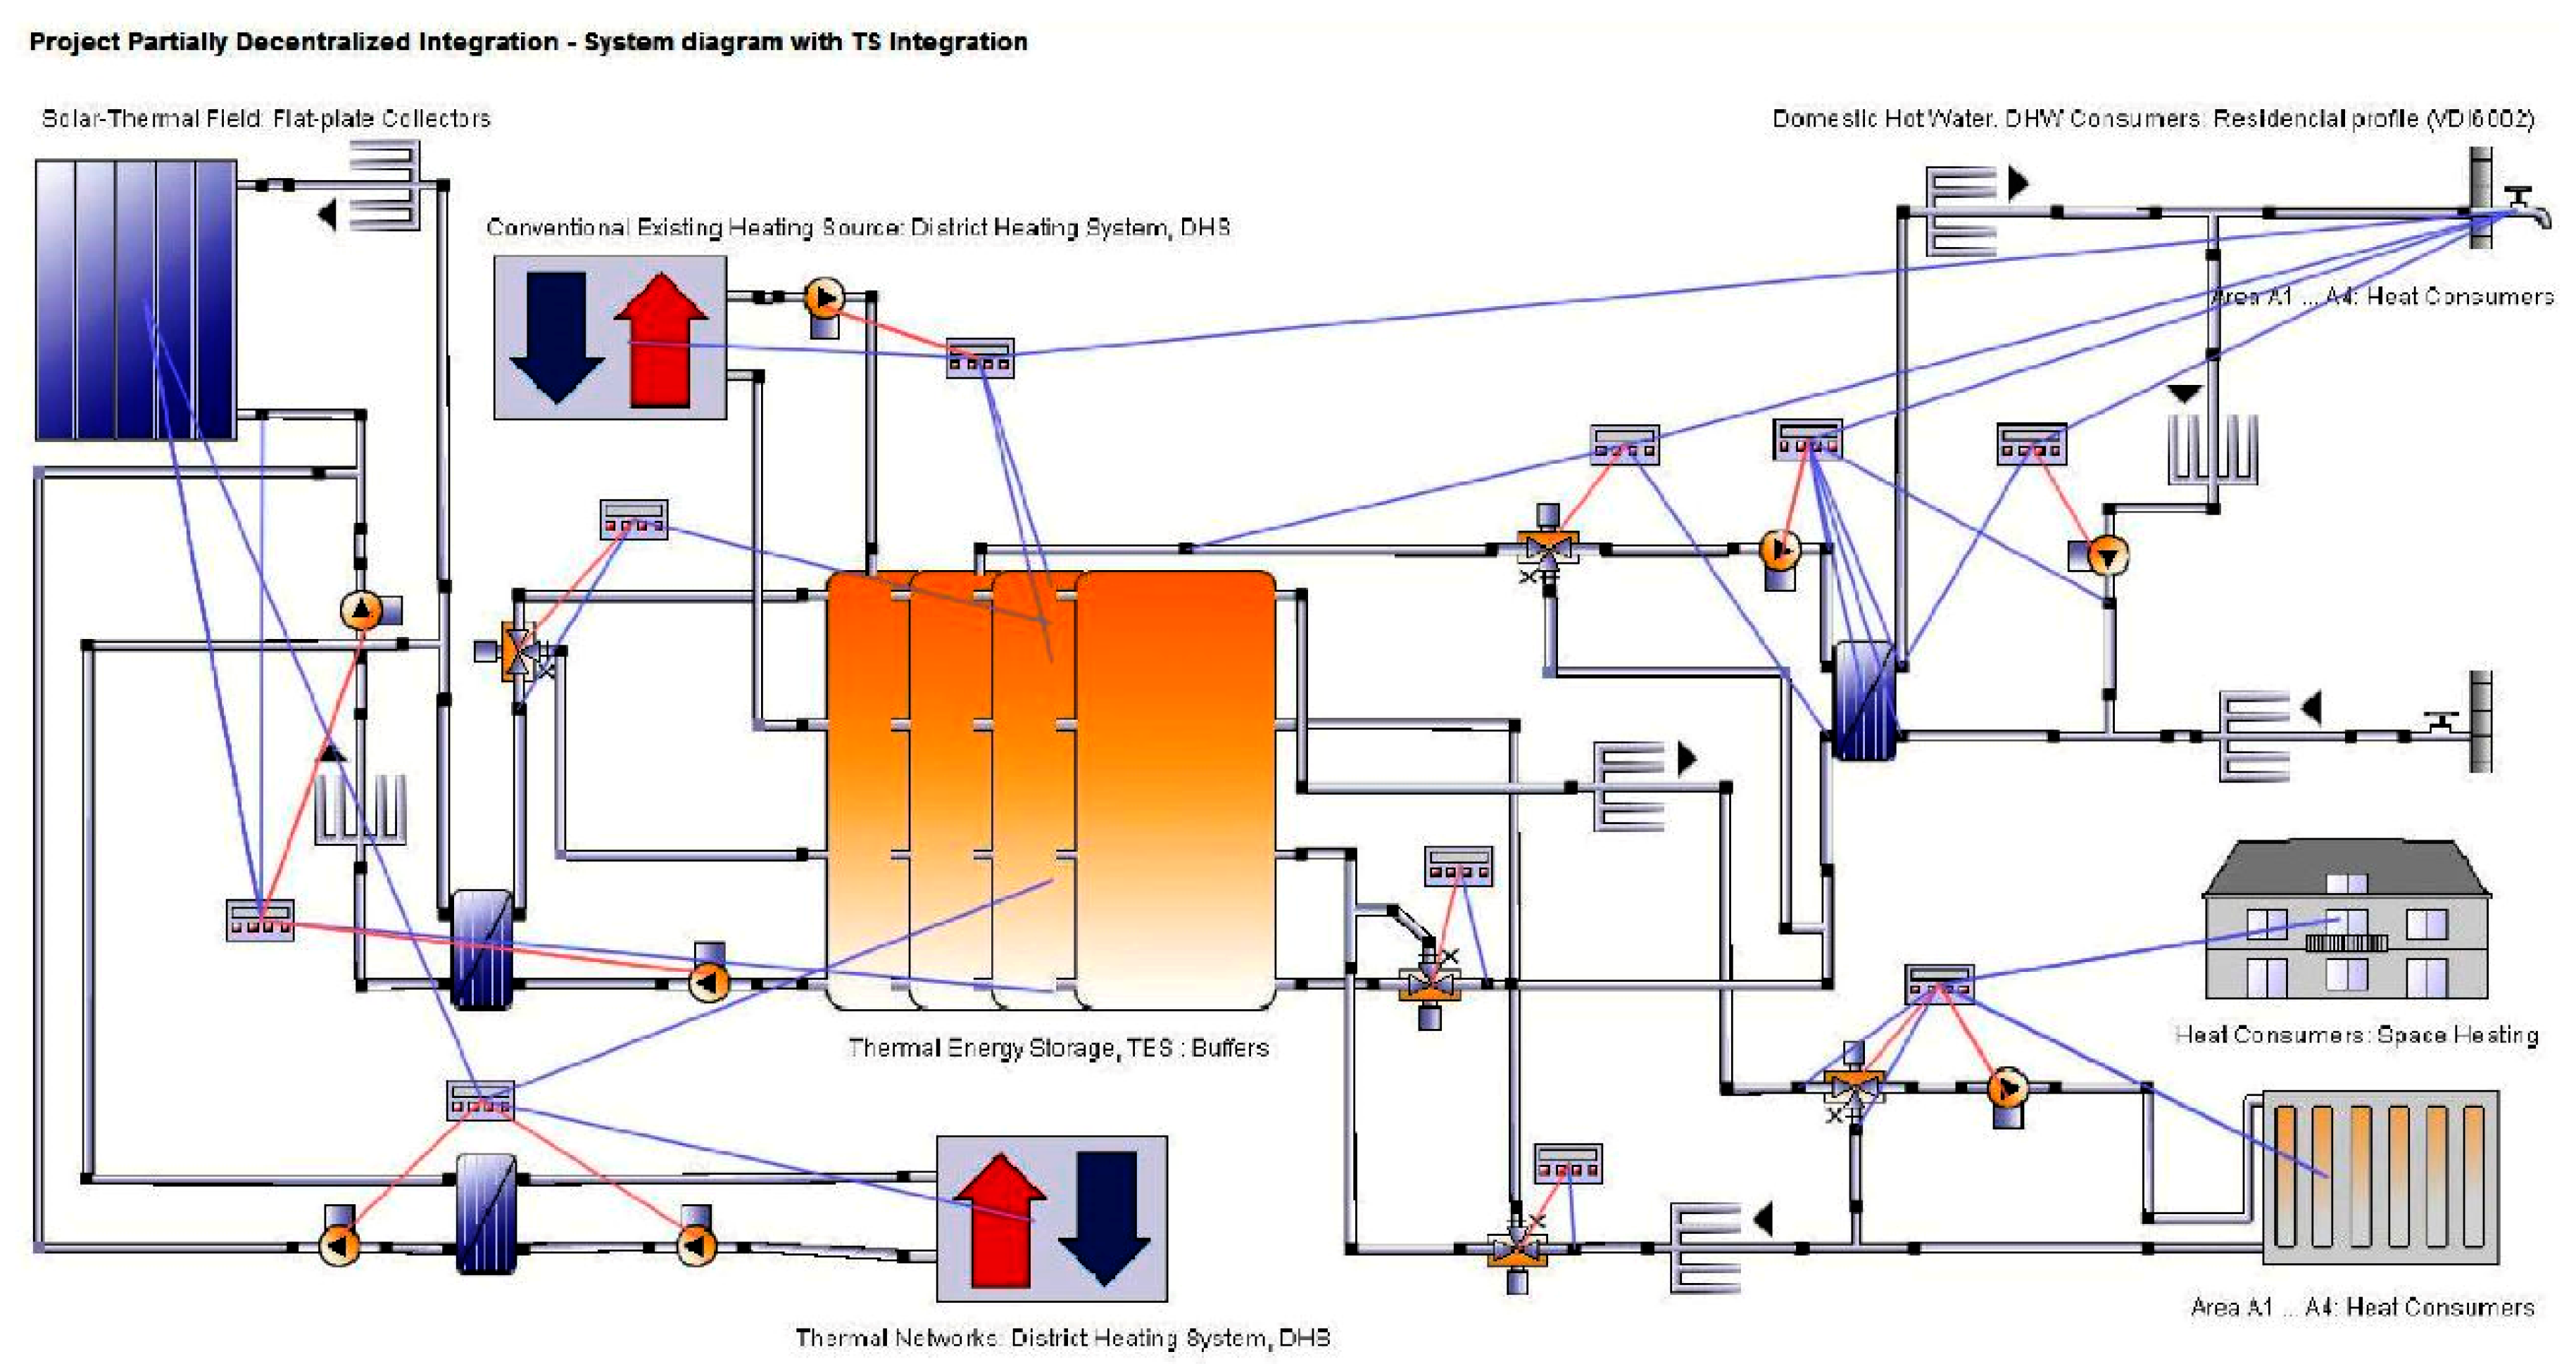
The hydraulic integration of the thermo-solar systems was conducted at the level of the thermal stations (TS) existing within the area. The case study aims at the A1–A4 reference areas, with the initial and final thermo-energetic characteristics, as per Table 4 and Table 5, which are characteristics that have led to the work scenarios S1 and S2. The temperature values of the thermal agent of the heating network are set forth below: in the case of Scenario S1, 90/60 °C, and 70/40 °C in the case of Scenario S2. The integration mode of the thermo-solar fields at the level of the thermal stations TS of the areas is presented in Figure 5.
In order to compare the secured indicators between areas with different characteristics, the following assumption was considered: the reference system for the configuration of the hybrid heating system was a thermo-solar system consisting of 5000 thermal collectors, having a gross surface of 10,000 m2, and a thermal energy storage system with a nominal volume of 4000 m3. Solar collectors with a gross surface area of 2 m2 were chosen, in order to simplify their assembly work within crowded urban areas, on roofs of buildings, over car parks, etc. The system had a solar fraction output of 60% for the area with the lowest thermal density (A4 area) within the initial scenario of energy efficiency (S1). The land-use footprint in relation to the annual solar fraction achieved (%αa—the equivalent surface [50]) was verified in situ within the study case, and an evaluation of existing surfaces without any other usefulness, and therefore available for mounting solar thermal fields, mainly on buildings’ roofs and over car parks, was made.
The operating regime in the heating system contained variable flow. The volumetric flow within the solar collector field was automatically set, including the function of the temperature in the storage tank, and the temperature in the collector’s field, respectively.
In order to achieve the virtual frame for the simulations for the hydraulic system configured in Figure 5, an automation and control system was attached, according to Table 7.
The thermal storage layers index used for the control algorithm (Table 7) were designed according to the 12-layer model of thermal stratification in the storage tank.
The solar collectors used were flat-plane collectors, with the following coefficients: η0 = 75–80% (corresponding to the laminar and turbulent flow conditions), k1 = 3.5–4.0 W/(m2K) (in the absence and in the presence of wind, respectively), and k2 = 0.02 W/(m2K2). The solar collectors had a mounting angle of 45°, and the values of solar irradiation were adjusted accordingly within the virtual simulation framework. The efficiency curves that were secured based on the Hottel–Whillier–Bliss equation, for the collectors used in the case study, are shown in Figure 6. Solar collectors with a gross area of 2 m2 were chosen, in order to simplify the assembly work within crowded urban areas, on buildings’ roofs, over car parks, etc.

4. Results and Discussion

The most representative values obtained for areas A1–A4 within the case study for heat demand in the hybrid heating system are presented as follows.

4.1. Processing the Preliminary Data Related to the Urban Area Heat Demand

The thermo-energetic balance indicators secured for areas A1–A4 within the established hypotheses are centralized in Table 8.
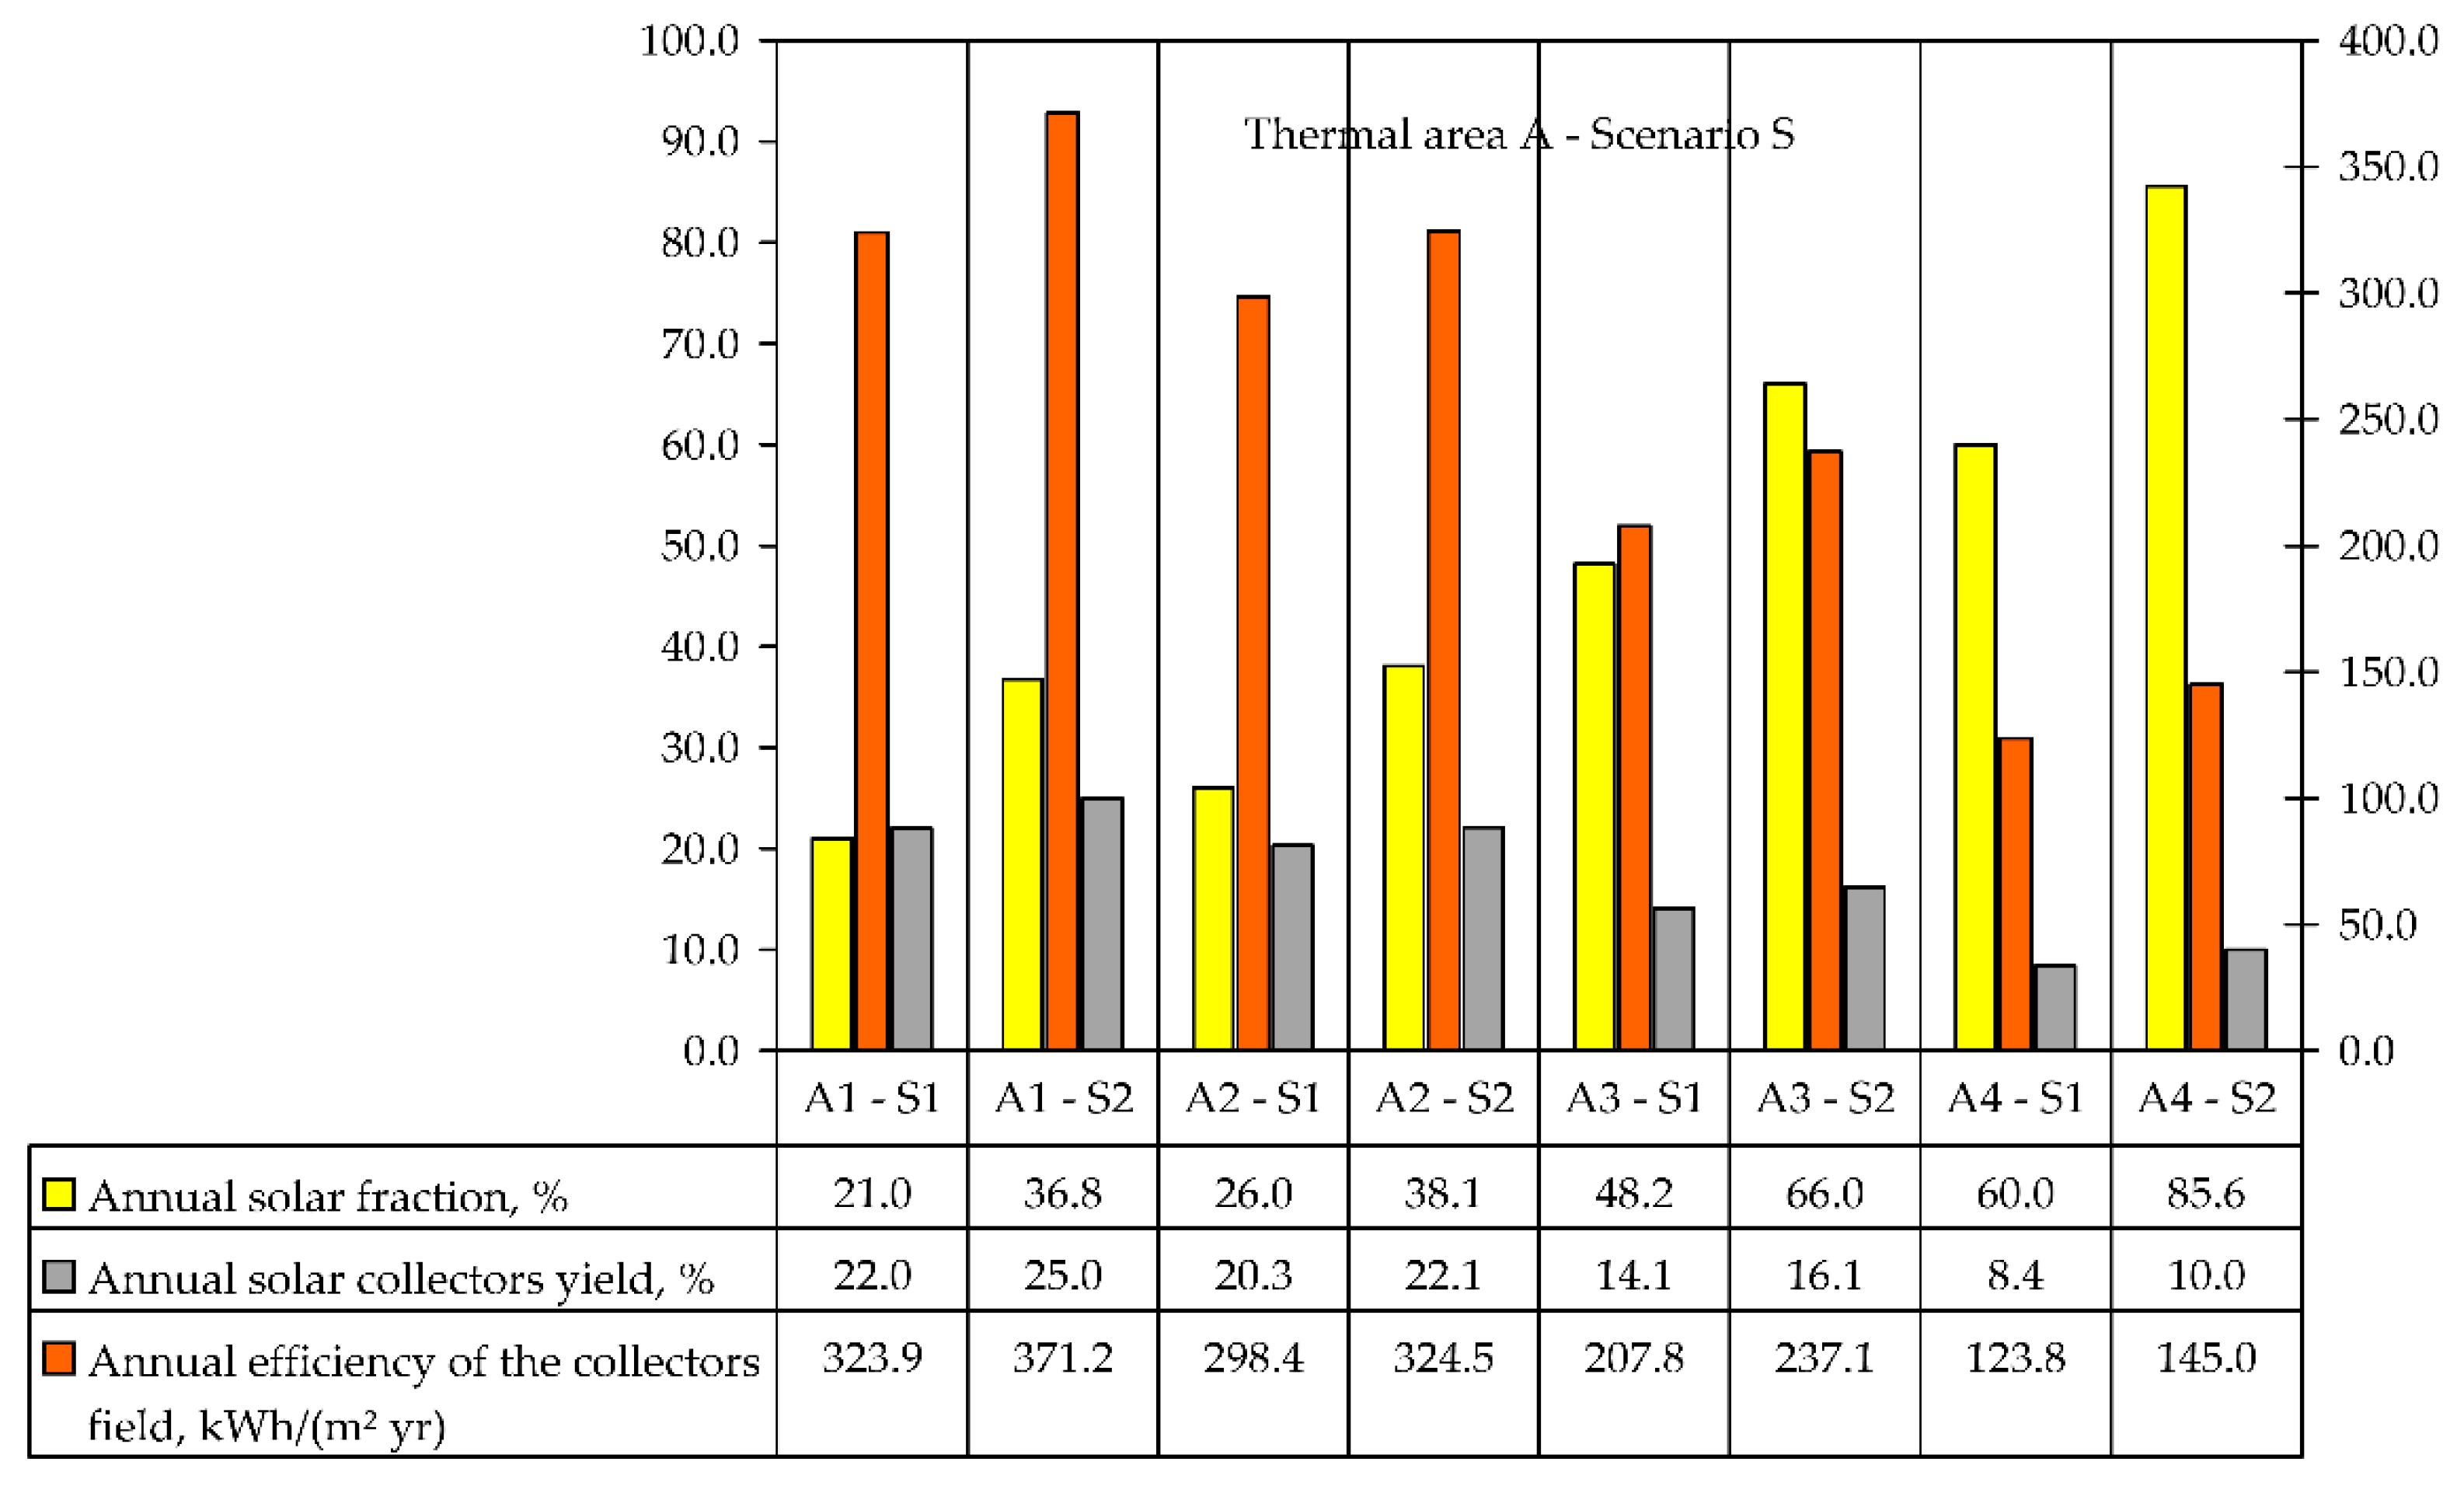
The diagram presented in Figure 7 illustrates, in a comparative manner, the performance indicators that are achieved for the hybrid heating systems from areas A1–A4 within the two work scenarios, S1 and S2.
The annual efficiency of the thermo-solar collectors’ field is defined as the ratio between the annual amount of useful heat that is supplied to the served thermic system, and the aperture area of the collectors’ field. Delivering thermal energy in the district heating network, based on the feed-in principle, is limited to the level of excess energy management, which is due to the differences between the variable features of the solar resource and the consumption profile. Since the collector’s field surface is similar in both cases, one can see in Figure 7 that the solar fractions achieved in area A4 were much higher, but also that the stagnation periods of the thermo-solar system and the resulting excess energy were also higher. On the other hand, this resulted in high operating temperature values, and a decrease of operational efficiency for the solar collectors. The assumption of the same area of the solar collectors’ field being integrated into urban areas with different thermal energy densities was introduced, in order to compare similar investments in urban areas with different energy densities, within a gradual energy retrofit process for urban localities.

4.2. Impact Indicators of the Solar-Assisted Heating System and Preliminary Data Related to the Urban Area Heat Demand

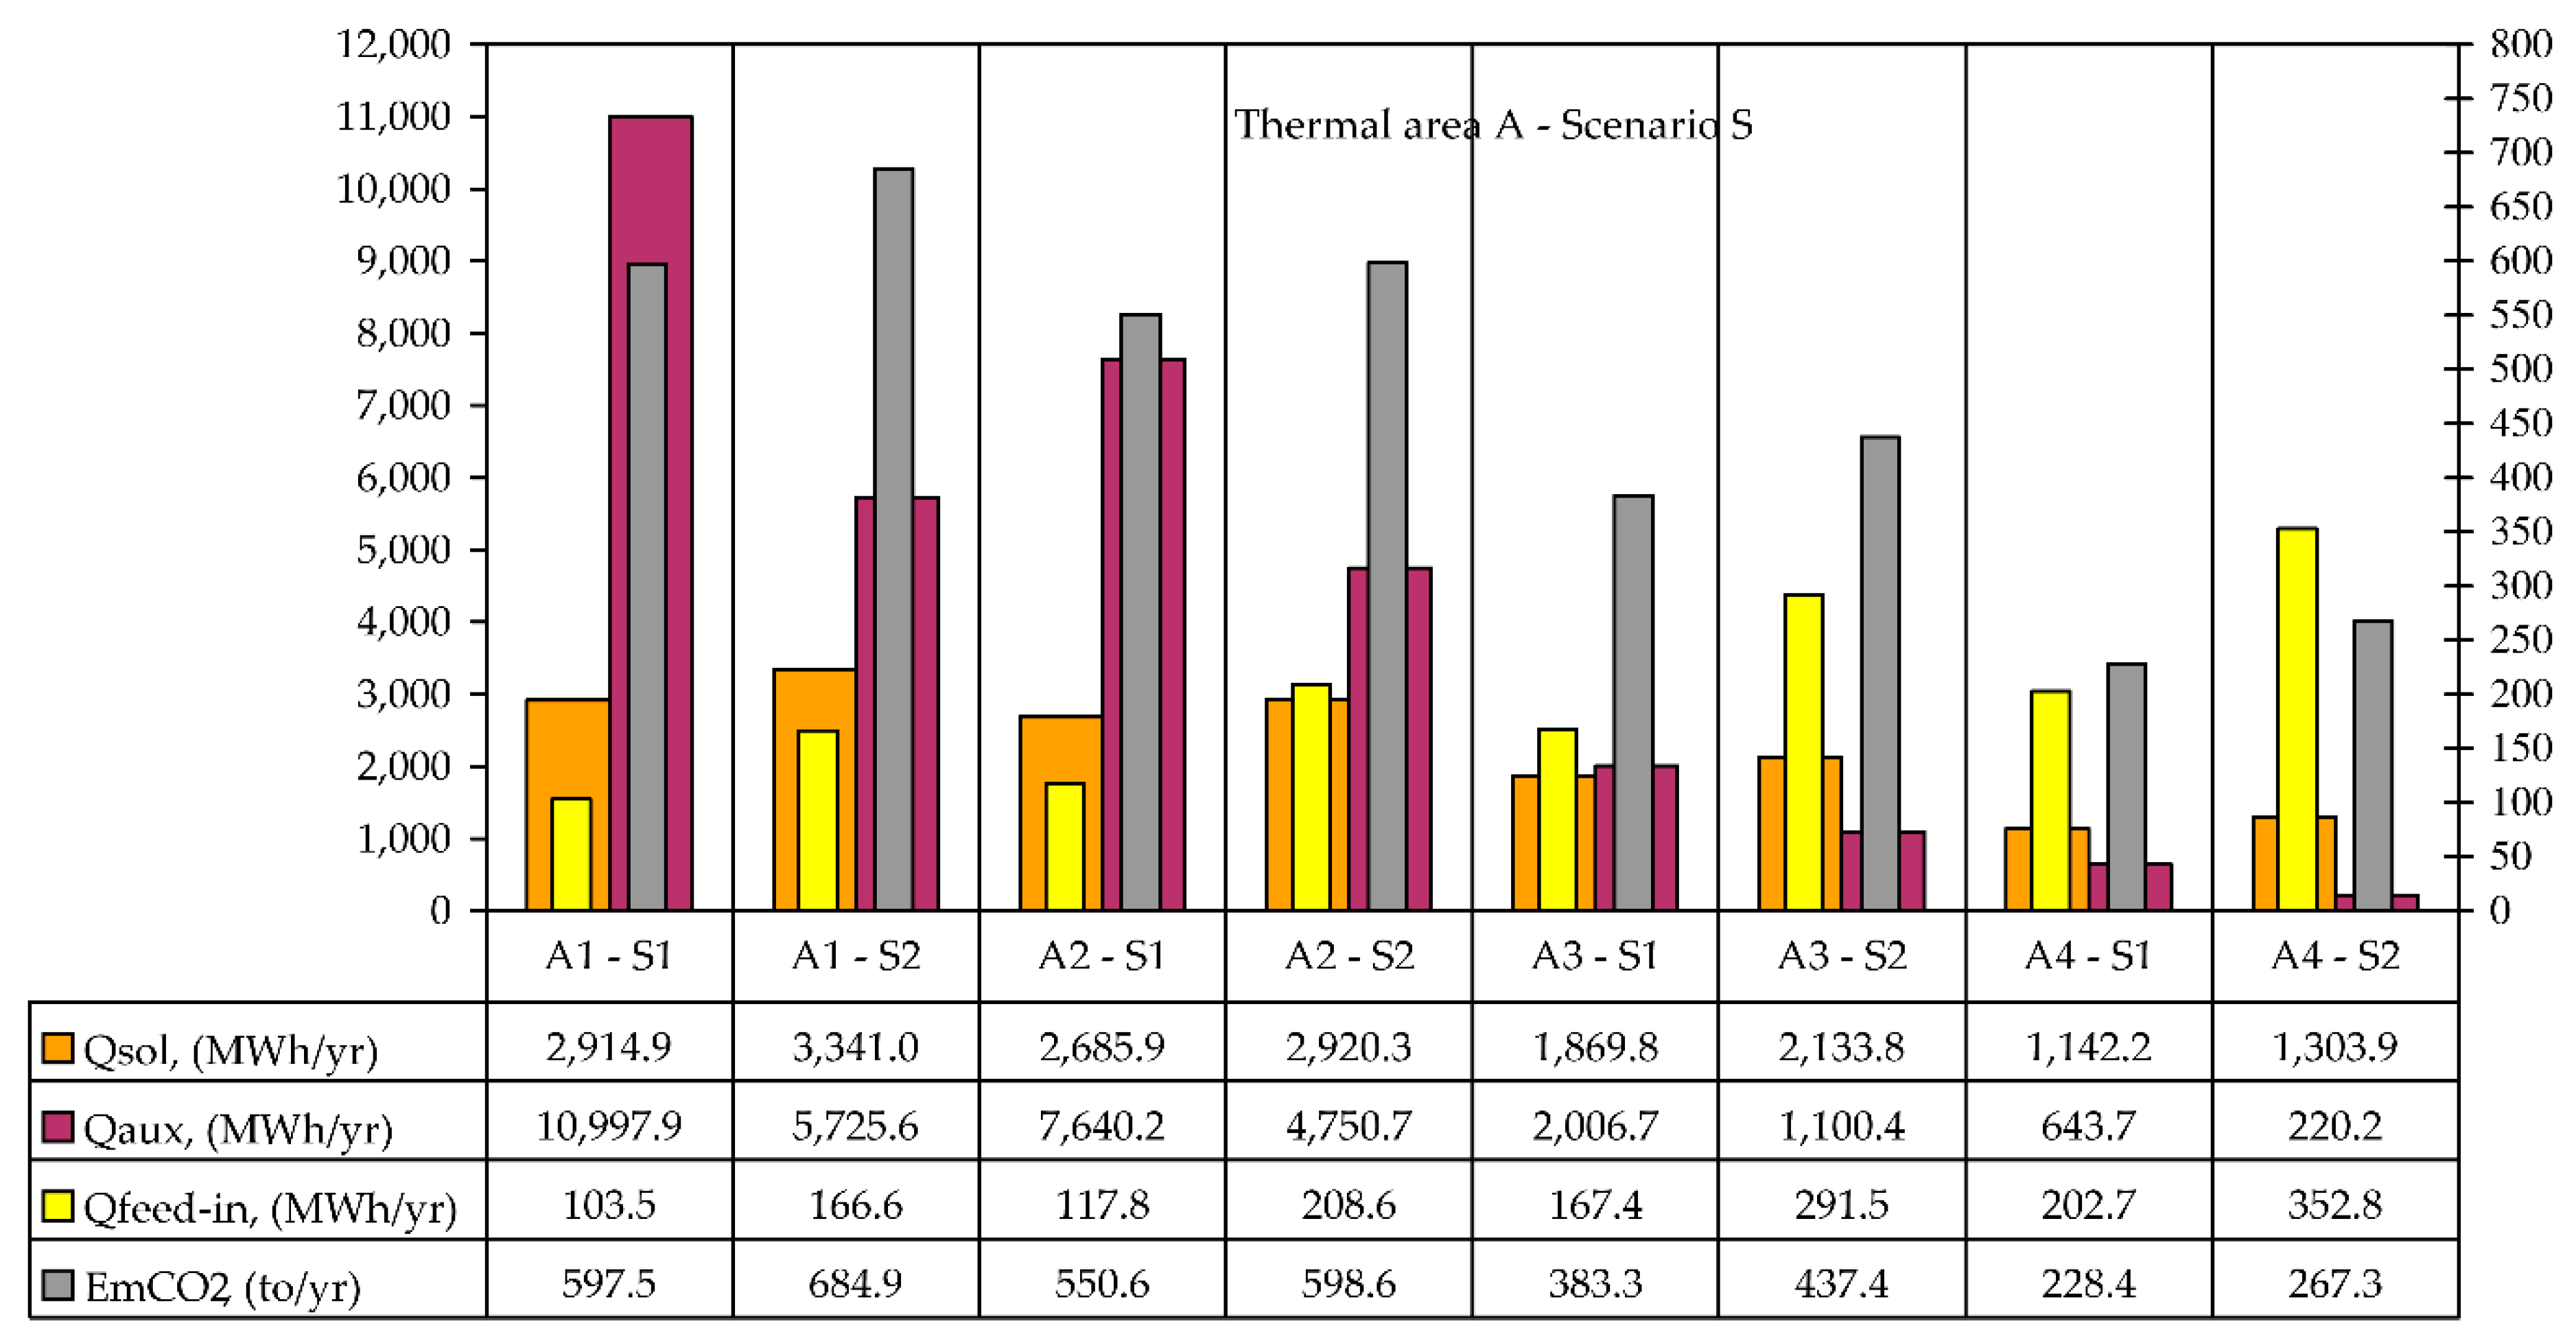
The results of the comparative analyses conducted after developing the case study for the proposed areas A1–A4 (initial energy performances of the thermal consumers versus the final energy performances of the thermal consumers), in accordance with the established hypotheses, are centralized in Table 9 and Table 10, and graphically illustrated within the comparative diagrams presented in Figure 8 and Figure 9.
Eres-TS and Eres-C (kWh/m2year) are indicators of primary energy from renewable energy sources, determined in the first case, at the level of the thermal stations (TS), and in the second case, at the level of the consumers (C). Their values (according to Table 10 and Figure 9, respectively) are closely related to the annually harnessed solar energy, relative to the heated surfaces. Thus, the low values of the Eres-TS and Eres-C indicators within the first two cases (areas with high-energy densities) represent a consequence of the introduced hypothesis: the assumption of the same area of solar collection integrated in urban areas with different thermal energy densities. One of the conclusions is that the same thermal solar collector surface, implemented in urban areas with different densities, records the values of these efficiency indicators as being lower and the energy density of the area as being is higher, and thus the annual solar fractions achieved are higher.
The performance indicators achieved after developing the case study, as presented in Table 11 for the proposed areas A1–A4, have been divided into the number of consumers involved (persons). The specific performance indicators have been secured in relation to the number of consumers and implicitly to the energetic density of the proposed areas. In this regard, the resulting data can be used as input data for future technical–economic studies as required, for the implementation of thermo-solar systems within the proposed configurations for similar urban areas.

5. Conclusions

This paper presents a case study within a research project, referring to the partial integration of thermal solar fields for heat production in urban areas as a part of the optimization process of the existing heating system in the city of Oradea, Romania. A deterministic method was used as the method of determination of heat demand under both stationary (hourly heat demand) and dynamic regimes (annual heat demand), and simulations within the configuration and optimization process of the hybrid heating systems were carried out using the Polysun Solarthermal Software (version 2016, Vela Solaris AG, Winterthur, Switzerland).
In the case study, representative areas with different thermal densities are analyzed within two working scenarios that take into account the energy performances of the buildings. Based on the proposed and achieved performance indicators, it is recommended that thermal–solar energy, under a hybrid system, even within crowded areas, is used for optimizing the existing heating systems with partial integration of the solar systems at the level of the thermal stations, with short- or medium-term storage, and with the management of excess energy based on the feed-in principle, in the case of Oradea, Romania. By determining the specific performance indicators, in relation to the number of consumers, the resulting data can be used as the input data for future technical–economic studies for similar urban areas. Moreover, by integrating systems that harness renewable energies within crowded urban areas, pollutant emission levels should drop significantly, resulting in the depollution of urban areas.
Due to various economic and social issues, renewable and alternative energy sources are poorly harnessed in crowded urban areas. In the future, the study of both integration modes is also recommended: partially decentralized, with integration at the thermal stations, versus decentralized, with integration at the consumer site, both from economic and social perspectives.

Author Contributions

Conceptualization, T.M.Ș.; Data curation, T.M.Ș., L.M.M. and G.D.; Formal analysis, L.M.M., G.D., A.C. and D.L.M.; Investigation, T.M.Ș.; Methodology, T.M.Ș.; Resources, T.M.Ș.; Supervision, A.C. and D.L.M.; Validation, A.C. and D.L.M.; Writing—original draft, T.M.Ș.

Funding

This research received no external funding.

Conflicts of Interest

The authors declare no conflict of interest.

References

  1. European Technology Platform on Renewable Heating and Cooling. 2020–2030–2050 Common Vision for the Renewable Heating & Cooling Sector in Europe; Publications Office of the European Union: Luxembourg, 2011; ISBN 978-92-79-19056-8. [Google Scholar]
  2. Bagheri, A.; Feldheim, V.; Ioakimidis, C.S. Review on the Evolution and Application of the Thermal Network Method for Energy Assessments in Buildings. Energies 2018, 11, 1–20. [Google Scholar] [CrossRef]
  3. European Commision CE. EU Energy in Figures, Statistical Pocketbook 2016; Publications Office of the European Union: Brussels, Belgium, 2016; ISBN 978-9-27-958248-6. [Google Scholar]
  4. Cohen, B. Urbanization in developing countries: Current trends, future projections, and key challenges for sustainability. Elsevier J. Technol. Soc. 2006, 28, 63–80. [Google Scholar] [CrossRef]
  5. DHC+ Technology Platform, Euroheat & Power. Available online: http://www.euroheat.org/DHC (accessed on 4 November 2018).
  6. American Society of Heating Refrigerating and Air Conditioning Engineers Inc. (ASHRAE). District/Central Solar Hot Water Systems Design Guide; ASHRAE: Atlanta, GA, USA, 2013; ISBN 978-1-936504-52-7. [Google Scholar]
  7. Verda, V.; Guelpa, E.; Cona, A.; Lo Russo, S. Reduction of primary energy needs in urban areas trough optimal planning of district heating and heat pump installations. Energy 2012, 48, 40–46. [Google Scholar] [CrossRef]
  8. Yamaguchi, Y.; Shimoda, Y. District-scale simulation for multi-purpose evaluation of urban energy systems. J. Build. Perform. Simul. 2010, 3, 289–305. [Google Scholar] [CrossRef]
  9. Olsthoorn, D.; Haghighat, F.; Mirzaei, P.A. Integration of storage and renewable energy into district heating systems: A review of modelling and optimization. Sol. Energy 2016, 136, 49–64. [Google Scholar] [CrossRef]
  10. Swan, L.G.; Ugursal, V.I. Modeling of end-use energy consumption in the residential sector: A review of modelling techniques. Renew. Sustain. Energy Rev. 2009, 13, 1819–1835. [Google Scholar] [CrossRef]
  11. Evins, R. A review of computational optimisation methods applied to sustainable building design. Renew. Sustain. Energy Rev. 2013, 22, 230–245. [Google Scholar] [CrossRef]
  12. Allegrini, J.; Orehounig, K.; Mavromatidis, G.; Ruesch, F.; Dorer, V.; Evins, R. A review of modelling approaches and tools for the simulation of district-scale energy systems. Renew. Sustain. Energy Rev. 2015, 52, 1391–1404. [Google Scholar] [CrossRef]
  13. Așchilean, I.; Giurca, I. Choosing a Water Distribution Pipe Rehabilitation Solution using the Analytical Network Process Method. Water 2018, 10, 484. [Google Scholar] [CrossRef]
  14. Kecebaş, A.; Yabanova, I. Thermal monitoring and optimization of a geothermal district heating systems using artificial neural network. Study Case. J. Energy Build. 2012, 50, 339–346. [Google Scholar] [CrossRef]
  15. Yabanova, I.; Kecebaş, A. Development of ANN model for geothermal district heating system and novel PID-based control strategy. J. Appl. Therm. Eng. 2013, 51, 908–916. [Google Scholar] [CrossRef]
  16. Wojdyga, K. Predicting Heat Demand for a District Heating Systems. Int. J. Energy Power Eng. 2014, 3, 237–244. [Google Scholar] [CrossRef]
  17. De Rosa, M.; Bianco, V.; Scarpa, F.; Tagliafico, L.A. Heating and Cooling building energy demand evaluation; A simplified model and a modified degree days approach. Appl. Energy 2014, 128, 217–229. [Google Scholar] [CrossRef]
  18. Morille, B.; Musy, M.; Malys, L. Preliminary study of the impact of urban greenery types on energy consumption of building at a district scale: Academic study on a canyon street in Nantes (France) weather conditions. Energy Build. 2016, 114, 275–282. [Google Scholar] [CrossRef]
  19. Agrell, P.J.; Bogetoft, P. Economic and environmental efficiency of district heating plants. Energy Policy 2005, 33, 1351–1362. [Google Scholar] [CrossRef] [Green Version]
  20. Chen, X.; Wang, L.; Tong, L.; Sun, S.; Yue, X.; Yin, S.; Zheng, L. Energy saving and emission reduction of china urban district heating. Energy Policy 2013, 55, 677–682. [Google Scholar] [CrossRef]
  21. Lake, A.; Rezaie, B.; Beyerlein, S. Review of district heating and cooling systems for a sustainable future. Renew. Sustain. Energy. Rev. 2017, 67, 417–425. [Google Scholar] [CrossRef]
  22. Parra, D.; Norman, S.A.; Walker, G.S.; Gillott, M. Optimum community energy storage for renewable energy and demand load management. AP Energy 2017, 200, 358–369. [Google Scholar] [CrossRef] [Green Version]
  23. Tung Ha, T.; Zhang, Y.; Hao, J.; Thang, V.V.; Li, C.; Cai, Z. Energy Hub’s Structural and Operational Optimization for Minimal Energy Usage Costs in Energy Systems. Energies 2018, 11, 707. [Google Scholar] [CrossRef]
  24. Moraitis, P.; Kausika, B.B.; Nortier, N.; van Sark, W. Urban Environment and Solar PV Performance: The Case of the Netherlands. Energies 2018, 11, 1333. [Google Scholar] [CrossRef]
  25. Dalla Rosa, A.; Li, H.; Svendsen, S.; Werner, S.; Persson, U.; Rühling, K.; Felsmann, C.; Crane, M.; Burzynski, R.; Bevilacqua, C. Annex X Final Report: Toward 4th Generation District Heating; Technical Report IEA DHC/CHP; DTU Library: Kongens Lyngby, Denmark, 2014. [Google Scholar]
  26. Genon, G.; Torchio, M.F.; Poggio, A.; Poggio, M. Energy and environmetal assessment of small district heating systems: Global and local effects in two case-studies. Energy Conv. Manag. 2009, 50, 522–529. [Google Scholar] [CrossRef]
  27. Torchio, M.; Genon, G.; Poggio, A.; Poggio, M. Merging of energy and environmental analyses for district heating systems. Energy 2009, 34, 220–227. [Google Scholar] [CrossRef]
  28. Cannistraro, G.; Cannistraro, M.; Cannistraro, A.; Galvagno, A. Analysis of Air Pollution in the Urban Center Cities Sicilian. Int. J. Heat Technol. 2016, 34, 219–225. [Google Scholar] [CrossRef]
  29. Schmidt, T.; Mangold, D.; Muller-Steinhagen, H. Seasonal thermal energy storage in Germany. In Proceedings of the Solites, ISES Solar World Congress 2003, Goteborg, Schweden, 14–19 June 2003. [Google Scholar]
  30. Schmidt, T.; Mangold, D. The multi-functional heat storage in Hamburg-Bramfeld—Innovative extension of the oldest German solar energy housing estate. In Proceedings of the Solites, IRES 2010, Berlin, Germany, 22–24 November 2010. [Google Scholar]
  31. SDH Solar District Heating. Available online: http://www.solar-district-heating.eu (accessed on 4 November 2018).
  32. Heymann, M.; Kretzschmar, T.; Rosemann, T.; Ruhling, K. Integration of Solar Thermal Systems intoDistrict Heating. In Proceedings of the 2nd International Solar District Heating Conference, Hamburg, Germany, 3–4 June 2014. [Google Scholar]
  33. Heymann, M.; Ruhling, K. Integration of Solar Thermal Systems into District Heating—Results of a Case Study Done in the R&D Project ‘‘DECENTRAL’’. In Proceedings of the 3nd International Solar District Heating Conference, Toulouse, France, 17–18 June 2015. [Google Scholar]
  34. Schafer, K.; Mangold, D. Integration of Solar Thermal Systems into District Heating—Results of a Case Study Done in the R&D Project ‘‘DECENTRAL’’. In Proceedings of the 3nd International Solar District Heating Conference. Solites, Toulouse, France, 17–18 June 2015. [Google Scholar]
  35. Renewable Energy in District Heating and Cooling. Available online: www.irena.org/publications (accessed on 4 November 2018).
  36. Heymann, M.; Ruhling, K.; Felsmann, C. Integration of Solar Thermal Systems into District Heating—DH System Simulation. Energy Procedia 2017, 116, 394–402. [Google Scholar] [CrossRef]
  37. Coskun, C.; Oktay, Z.; Dincer, I. New energy and exergy parameters for geothermal district heating systems. Appl. Therm. Eng. 2009, 29, 2235–2242. [Google Scholar] [CrossRef]
  38. INCERC Bucharest. Romanian Normative NP 048-2000, Normative for the Thermal and Energy Expertise of Existing Buildings and Their Heating and Domestic Hot Water Installations; Constructions Bulletin: Bucharest, Romania, 2001. [Google Scholar]
  39. Institute of Design, Research and Computing in Construction IPCT-SA. Framework Solutions for the Thermo-Hygro-Energy Rehabilitation of the Envelope of the Existing Buildings SC 007-02; FAST PRINT: Bucharest, Romania, 2005. [Google Scholar]
  40. Șoimoșan, T.M.; Felseghi, R.A. Comparative thermo-energetic analysis of the district heating systems that harness renewable energy sources. Sci. Procedia Eng. 2017, 181, 754–761. [Google Scholar] [CrossRef]
  41. Surface Meteorology and Solar Energy. Available online: https://eosweb.larc.nasa.gov (accessed on 6 August 2015).
  42. Şoimoșan, T.-M. Contributions Regarding the Optimization of the Heating Systems in Urban Localities. Ph.D. Thesis, Technical University of Cluj-Napoca, Cluj-Napoca, Romania, 2015. [Google Scholar]
  43. Romanian Standard. SR 1907-1/2014, Heating Installations. Heating Demand Calculation; Romanian Institute of Standardization; ASRO: Bucharest, Romania, 2014. [Google Scholar]
  44. Romanian Standard. SR 4839-1997, Heating Installations. Annual Number of Days-Degrees; Romanian Institute of Standardization; ASRO: Bucharest, Romania, 2014. [Google Scholar]
  45. Romanian Normative. C 107-2005, Regarding Thermo-Technical Calculation of the Building Elements; FAST PRINT: Bucharest, Romania, 2006. [Google Scholar]
  46. Pop, L.; TERMOFICARE ORADEA SA, Oradea, Romania. Personal communication, 2014.
  47. Winwatt-Ro XXL, version 2005, Termotechnical Software for Buildings; PROMAX ENGINEERING SRL: Miercurea Ciuc, Romania, 2017.
  48. University of Civil Engineering Bucharest; INCERC Bucharest & al. Mc 001/1-2006, Methodology for 6calculating the Energy Performance of Buildings, Part I; ASRO: Bucharest, Romania, 2006. [Google Scholar]
  49. Algorithm+ SRL & IPCT Installations, version 7.2, Termotechnical Software for Buildings; ALGORITHM+ SRL: Galati, Romania, 2017.
  50. Șoimoșan, T.M.; Felseghi, R.A. Efficient Solar Technique for Buildings Connected to the District Heating System. Indicators of Performance. In Book 4 Energy and Clean Technology, Vol. III Recycling. Air Pollution & Climate Change. Modern Energy and Power Sources; Elsevier Ltd.: Amsterdam, The Netherlands, 2016. [Google Scholar]
  51. Polysun Designer, version 2016; Vela Solaris AG: Winterthur, Switzerland, 2016.
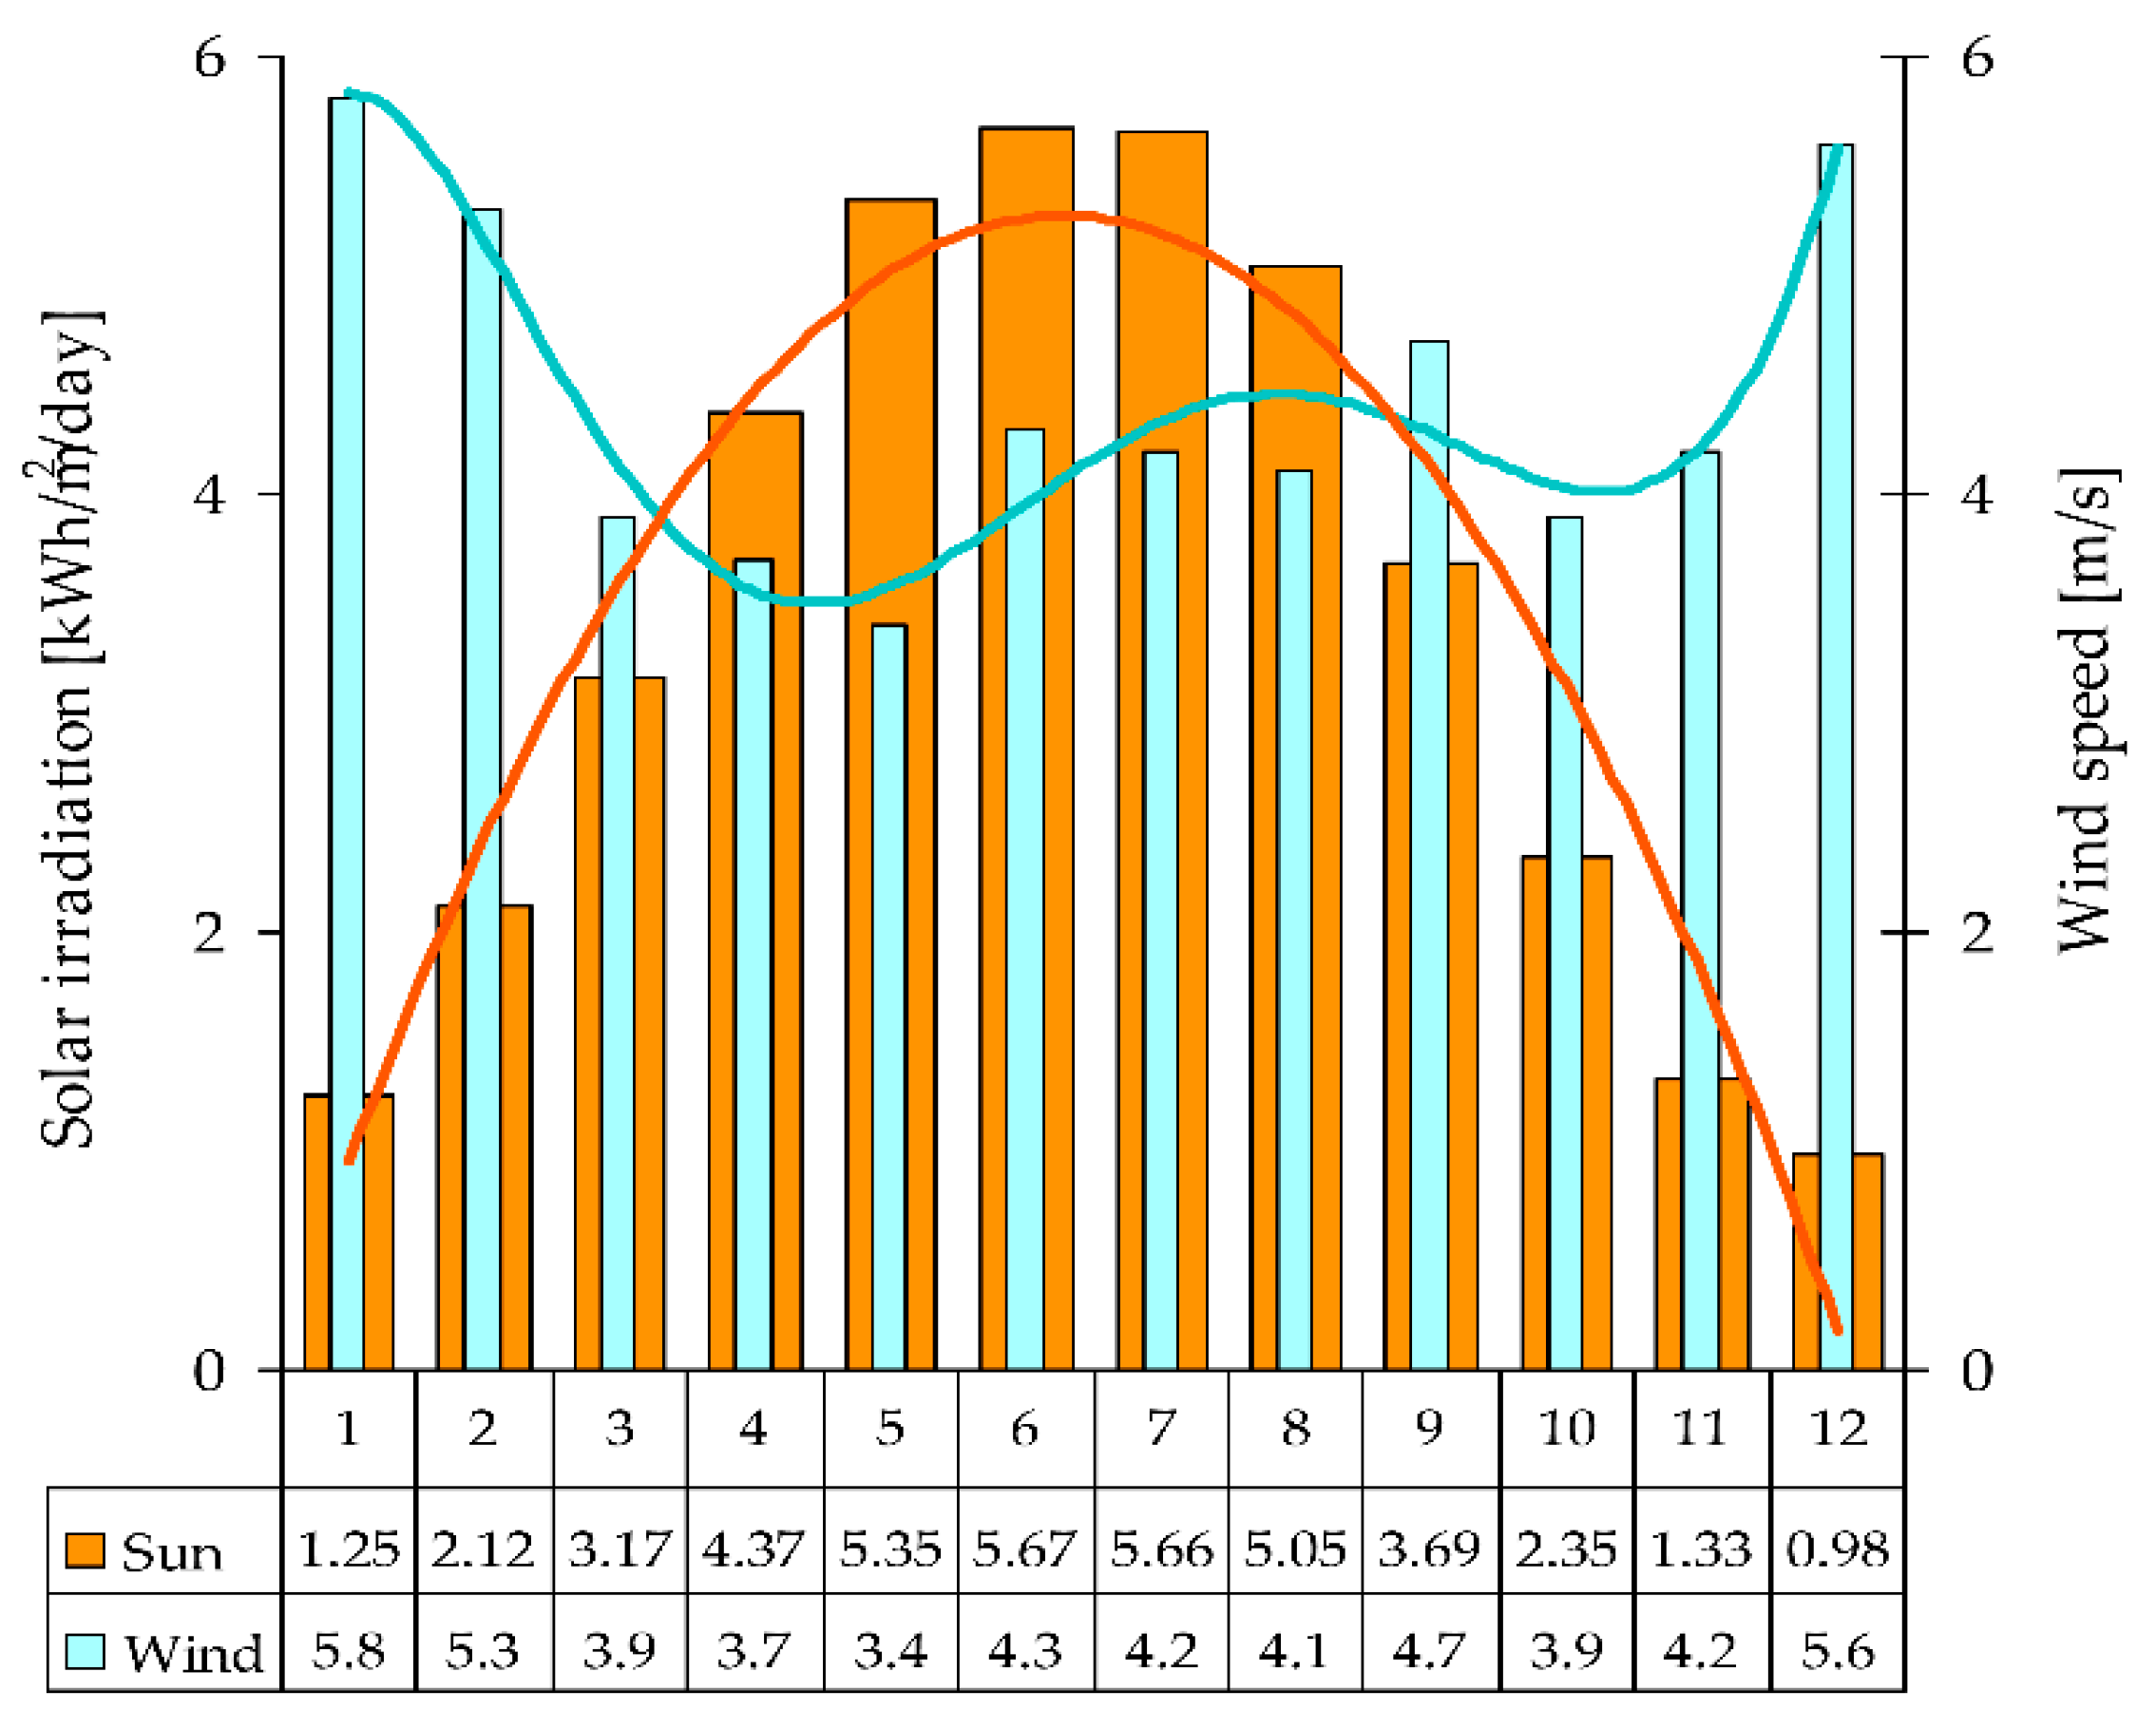
Figure 1. Renewable energy sources-solar (RES-S)—Global insolation profile. Monthly average values.
Energies 12 01088 g001
Figure 2. (a) Typology of thermal consumers—buildings, in the reference locality [42]; (b) Simplified scheme of the district heating system within Case Study [42].
Energies 12 01088 g002
Figure 3. Thermo-energy footprints of the reference urban areas for the study scenarios under a stationary regime.
Energies 12 01088 g003
Figure 4. Ranked curves of the annual energyt demands of the urban areas for the study scenarios under a transitory regime [42].
Energies 12 01088 g004
Figure 5. Optimized hybrid heating system with the integration of area thermal stations (TS). Hydraulic scheme of the principle [51].
Energies 12 01088 g005
Figure 6. Yield curves of the flat-plane collector, depending on the operation temperature regime within the case study.
Energies 12 01088 g006
Figure 7. Performance indicators of the solar system. Comparative graphs for A1–A4.
Energies 12 01088 g007
Figure 8. Areas A1–A4. Balance components.
Energies 12 01088 g008
Figure 9. Energy performance indicators. Areas A1–A4.
Energies 12 01088 g009
Table 1. Characteristics of the Oradea site.
Climate CharacteristicsValueUnit
Climate Area (of winter) [43,44,45]II
Outdoor temperature calculation on a stationary regime−15°C
Ground temperature calculation +10°C
Calculation of degrees-days at an outdoor temperature of +12 °C3150degrees-days
Calculation of degrees-days at an outdoor temperature of +10 °C2990degrees-days
Conventional duration of the heating period at an outdoor temperature of +12 °C195days
Conventional duration of the heating period at an outdoor temperature of +10 °C175days
Wind Area [43]IV
Calculation of outdoor velocity4m/s
Sun Exposure Area
According to the National Institute of Meteorology and Hydrology (INMH)
II
Annual average of solar radiation1150–1250kWh/m2
Annual sunshine period2000–2100h/year
Table 2. Areas A1–A4 and their characteristics [46].
AreaThermal DensityTerritorial Surface of ReferenceBuilt VolumeNo. of Consumers of DHW
--m2m3pers.
A1very high32,000185,3902755
A2refhigh32,000176,9502600
A3medium32,00052,5211048
A4low32,00023,530277
Table 3. The thermo-energy classification for buildings [48].
Thermo-Energy Performance ClassABCDEFG
-kWh/(m2year)
Heating≤70≤117≤173≤245≤343≤500˃500
Domestic hot water (DHW)15355990132200200
Table 4. Work Scenario no. 1, S1.
Initial Thermo-Energy Performance
(before Thermal Retrofit of Building)
AreaHourly Heat DemandThermal Density of the AreaAnnual Demand of EnergytSpecific Annual Demand of Energyt *Thermo-Energy Classification
for Space Heatingfor DHWTotalHeatingIntegrated
-MWMWMWW/m2MWh/yearkWh/(m2year)-
A16.7110.8687.579236.8415,441.60304.28CD
A2ref4.7870.7035.490171.5612,602.17241.76BD
A31.2500.1501.40043.753575.38297.95DD
A40.5600.1100.67020.941363.00214.31CC
A1–A413.3081.83115.139118.2732,982.15273.46CD
* reported as the built surface area.
Table 5. Work Scenario no. 2, S2.
Final Thermo-Energy Performance
(after Thermal Retrofit of Building)
AreaHourly Heat DemandThermal Density of the AreaAnnual Demand of EnergytSpecific Annual Demand of Energyt *Thermo-Energy Classification
for Space Heatingfor DHWTotalHeatingIntegrated
-MWMWMWW/m2MWh/yearkWh/(m2 year)-
A13.5780.8684.446138.949686.00191.80AC
A2ref3.0380.7033.741116.918781.98168.47AC
A30.8000.1500.95029.692819.75235.98BD
A40.3600.1100.47012.811027.78161.60BC
A1–A47.7761.8319.60775.0522,315.51186.06BC
* reported as the built surface area.
Table 6. Heat demands for areas A1–A4.
AreaAnnual Demand of Energyt
(for Space Heating)
Optimized Annual Demand of Energyt
(for Space Heating)
Scenario S1Scenario S2
-MWh/yearMWh/year
A115,441.609686.00
A212,602.178781.98
A33575.382819.75
A41363.001027.78
Total A1—A432,982.1522,315.51
Table 7. The control algorithm attached to the hybrid heating system.
AutomationAutomation Input (Sensors)Automation Output (Actuators)
-ValueUnit-ValueUnit
Solar loop pumpVariable flowCollector temperatureTemperature output °COn/Off pumpSolar loop pump: On/Off%
Thermal storage tank temperatureInferior level°COn/Off pumpSolar loop pump: On/Off%
Temperature collector input Temperature input°CPumping capacitySolar loop pump: Volumetric flowL/h
Collectors efficiencyCollectorskWhPumping capacitySolar loop pump: Volumetric flowL/h
Auxiliary heating systemTemperature sensor switches on Thermal energy storage (TES): Layer 11°COn/Off auxiliary heatingAuxiliary heating: On/Off%
Temperature sensor switches offTES: Layer 9°COn/Off pumpAuxiliary heating pump: On/Off%
Volumetric flow Designed volumetric flowL/hVolumetric flow controlAuxiliary heating pump: Volumetric flowL/h
Thermal storage tankTemperature sensorSolar loop: TES temperature input °COn/Off switch 3-way electrovalve solar loop: deviation circuit-
Temperature sensorTES: Layer 10°C
District heating networkTemperature sensorTES: Layer 3°COn/Off switchPump: On/Off%
Temperature sensorTemperature collector output°COn/Off switchDischarge pump: On/Off%
Temperature sensorDischarge: Return temperature setting°C---
Table 8. Indicators of the thermo-energy balance A1–A4.
Indicators of Thermo-Energy Balance A1UnitValue
--Scenario 1Scenario 2
Annual demand of energyt (in buildings)MWh/year15,441.609686.00
Annual solar fraction αy%21.036.8
Solar collector fieldTotal areaSm210.000
Aperture areaAm29.000
Annual global yield of the solar collector ηc%22.025.3
Annual efficiency of the solar collector field Ef a c kWh/(m2 year)323.9371.2
Exergetic components of the thermo-energy balanceQsolMWh/year2914.93341.0
Qfeed-inMWh/year103.5166.6
QauxMWh/year10,997.95725.6
Indicators of thermo-energy balance A2UnitValue
--Scenario 1Scenario 2
Annual demand of energyt (in buildings)MWh/year 12,602.178781.98
Annual solar fraction αy%26.038.1
Solar collector fieldTotal areaSm210,000
Aperture areaAm29000
Annual global yield of the solar collector ηc%20.322.1
Annual efficiency of the solar collector field Ef a c kWh/(m2 year)298.4324.5
Exergetic components of the thermo-energy balance QsolMWh/year2685.92920.3
Qfeed-inMWh/year117.8208.6
QauxMWh/year7640.24750.7
Indicators of the thermo-energy balance A3UnitValue
--Scenario 1Scenario 2
Annual demand of energyt (in buildings)MWh/year3575.382819.75
Annual solar fraction αa%48.266.0
Solar collector fieldTotal areaSm210,000
Aperture areaAm29000
Annual global yield of the solar collector ηc%14.116.1
Annual efficiency of the solar collector field Ef a c kWh/(m2 year)207.8237.1
Exergetic components of the thermo-energy balanceQsolMWh/year1869.82133.8
Qfeed-inMWh/year167.4291.5
QauxMWh/year2006.71100.4
Indicators of thermo-energy balance A4UnitValue
--Scenario 1Scenario 2
Annual demand of energyt (in buildings)MWh/year1363.001027.78
Annual solar fraction αa%Reference ~60.085.6
Solar collector fieldTotal areaSm210,000
Aperture areaAm29000
Annual global yield of the solar collector ηc%8.410.0
Annual efficiency of the solar collector field Ef a c kWh/(m2 year)123.8145.0
Exergetic components of the thermo-energy balanceQsolMWh/year1114.21303.9
Qfeed-inMWh/year202.7352.8
QauxMWh/year643.7220.2
The background colours correspond to the graphic representations in Figure 7.
Table 9. Areas A1–A4. Components of the thermo-energy balance.
AreaScen.Solar Thermal Energy, Annually Delivered into the SystemThermal Energy Annually Delivered into the System by an Auxiliary Conventional Heating SourceSolar Thermal Energy Annually Delivered into the District Heating NetworkMaximum Quantity of CO2 Emissions Annually Avoided
(ref. Natural Gases)
 
--QsolQauxQfeed-inEmCO2
--MWh/year MWh/year MWh/year kg CO2/year
A1S12914.910,997.9103.5597,554.5
S23341.05725.6166.6684,905.0
A2S12685.97640.2117.8550,609.5
S22920.34750.7208.6598,661.5
A3S11869.82006.7167.4383,309.0
S22133.81100.4291.5437,429.0
A4S11114.2643.7202.7228,411.0
S21303.9220.2352.8267,299.5
The background colours correspond to the graphic representations in Figure 8.
Table 10. Areas A1–A4. Indicators of thermo-energy performance.
Indicators of Thermo-Energy PerformanceUnitArea
A1A2A3A4
Scenario
S1S2S1S2S1S2S1S2
Specific annual heat demand, QsakWh/(m2 year)304.3190.9241.8168.5317.8250.6214.3161.6
Conventional primary energy indicator EconvkWh/(m2 year)216.7112.8146.691.1178.497.8101.234.6
Emissions equivalent indicator * EmCO2kgCO2/(m2 year)11.813.510.611.534.138.935.942.0
Indicator of primary energy from renewable energy sources (at the thermal station TS) Eres-TSkWh/(m2 year)57.465.851.556.0166.2189.7175.2205.0
Indicator of primary energy from renewable energy sources (at the consumers) Eres-CkWh/(m2 year)55.462.649.352.0151.3163.8143.3149.5
* natural gases as a reference. The background colours correspond to the graphic representations in Figure 9.
Table 11. Areas A1–A4. Specific indicators.
AreaNo. of ConsumersSpecific Indicators Achieved
--Scenario 1Scenario 2
qauxqsolqfeed-inqauxqsolqfeed-in
-pers.kWh/(year·pers.)kWh/(year·pers.)
A127553992.01058.037.62078.31212.760.5
A226002938.51033.045.31827.21123.280.2
A310481914.81784.2159.71050.02036.1278.1
A42772323.84022.4202.7794.94707.21273.6
AreaNo. of ConsumersMaximum specific quantities of CO2 emissions *,annually avoided
-pers.kg/(year·pers.)
A12755216.9248.6
A22600211.8230.3
A31048365.8417.4
A4277824.6965.0
* as a reference at natural gases.