Abstract
Achieving comfort in hot summer and cold winter (HSCW) climate zones can be challenging, since the climate is characterized by high temperatures in the summer and relatively colder temperatures in the winter. Courtyards, along with other semi-open spaces such as verandas and overhangs, play an important role in mitigating outdoor climate fluctuations. In this research, the effects of courtyards on the thermal performance of vernacular houses in HSCW climate zones were studied via field measurements and computational fluid dynamics (CFD) models. The selected courtyard house was a representative vernacular timber dwelling situated in the southeast of Chongqing, China. The indoor and outdoor air temperature measurements revealed that the courtyard did play an active role as a climatic buffer and significantly reduced the temperature’s peak value in the summer, while during the winter, the courtyard prevented the surrounding rooms from receiving direct solar radiation, and thus to some extent acted as a heat barrier. The contributions of thermal mass are quite limited in this area, due to insufficient solar radiation in winter and general building operations. The natural ventilation mechanism of courtyard houses in HSCW zones was further studied through CFD simulations. The selected opened courtyard was compared to an enclosed structure with similar building configurations. The airflow patterns driven by wind and buoyancy effects were first simulated separately, and then together, to illustrate the ventilation mechanisms. The simulation results show that the courtyard’s natural ventilation behavior benefited from the proper openings on ground level.
1. Introduction
For centuries, courtyards have functioned as an effective passive design strategy for various climate conditions, especially in hot-arid [1,2,3] and hot-humid climates [4,5,6]. Vernacular buildings have withstood the test of time by being subtly crafted over generations to incorporate passive systems for dealing with the local climate and human comfort needs [7]. Courtyards, along with other semi-open spaces such as verandas and overhangs, play an important role in mitigating outdoor climate fluctuations [8]. With the proper geometry and other design configurations, courtyards can filter solar radiation, facilitate natural ventilation, decrease energy consumption, and improve the building microclimates [9]. Yet design parameters and applicable strategies can vary widely in response to different climate conditions [9,10,11]. Thus, many measurement- and simulation-based studies have been conducted regarding courtyard houses and their thermal performances in different climates.
Research in hot-arid climates has mainly focused on heat mitigation. Consequently, optimizing the shading level of courtyard houses through design factors such as orientation, geometry, materials, and vegetation arrangements have been priority considerations. Relevant studies have indicated that deep and narrow courtyards provide higher shading levels, and hence yield optimal thermal comfort [12,13]. However, the acceleration of cross-ventilation via the outdoor area may lead to overheating in hot-arid climates. Higher openings can cause greater discomfort than their lower counterparts. In this regard, then, enclosed courtyards are preferable in hot-arid climates [14,15].
The design considerations for enhancing natural ventilation are of equal importance with shading in hot-humid climates. As a cooling strategy, courtyards in this type of climate improve ventilation at night and reduce cross-ventilation with hot ambient air during the day [16]. Ghaffarianhosein et al. [4] used numerical simulations (via ENVI-met) to propose effective design options for the integration of courtyards in hot-humid climates, including by adjusting their orientation, height, and the albedo of the wall enclosure, and employing vegetation. Similar results were found by Almhafdy et al. [5], who determined that the effect of buoyancy-driven ventilation could be enhanced with the proper aspect ratio and shading. Kubota et al. [6] investigated 16 shophouses in Malacca, demonstrating that the sky view factor (SVF) was highly correlated with daily maximum air temperatures and mean values, while the ratio of the courtyard’s area to the area of the entire building was one of the key variables affecting the absolute humidity level. A thermo-dynamic physical model that includes stratification, convection, and pressure differences driven by ambient air movements was adopted to interpret the airflow patterns and, consequently, the temperature distribution in the courtyard. The width-to-height ratio and arrangement of openings are other influential factors in courtyard ventilation behavior [17,18]. Ground floor openings are key to courtyard cross-ventilation. Rojas et al. [17] focused on that the flow pattern of a deep courtyard house with ground floor openings to the street was comparable to that of an enclosed courtyard. Their results showed that the inner courtyard streamlines passed from the corridor to the street.
The main objective of other studies was to reveal the natural ventilation mechanisms of courtyards. Rojas et al. [17] developed a CFD numerical model that takes predominant wind and buoyancy effects into account. The model was then used to predict and understand the thermodynamic behaviors of several ideal courtyards. The results demonstrated that flow streamlines and, consequently, temperature distributions depend on the courtyard’s depth ratio (i.e., height to width). Zakaria et al. [19] used smoke tests to reveal the airflow patterns of Malaysian multi-courtyard dwellings. It was observed that cross-ventilation was generated by the prevailing winds during the day, while the dense cooled air above the roofs fell into the courtyard as a downward wind at night [18]. Additionally, the effects of courtyards constructed of high thermal mass materials on indoor thermal comfort were discussed by Zakaria et al. [19]. The results suggested that the high thermal mass material caused an increase in temperature at night. Although the courtyard reduced the ambient peak temperature by 0.3 °C to 1.7 °C during the day, the indoor air temperature was 0.8 °C to 1.9 °C above the outdoor air temperature at night.
Even though studies on the thermal performance and design strategies of courtyard houses are becoming more common, the most relevant research has investigated hot-arid or hot-humid climate regions, focusing solely on summer conditions. Few studies have been conducted in hot summer and cold winter (HSCW) climate zones. Achieving thermal comfort in HSCW zones is challenging, as the climate is characterized by both high temperatures in the summer and relatively cold temperatures in the winter. Consequently, the study of such regions should not only take summer heat mitigation into account, but also heat gain in winter. Du et al. [20] used a vernacular courtyard house in a HSCW zone as a case study. The field measurements and simulation results showed that in the summer, the semi-outdoor and outdoor spaces in the selected courtyard created comfortable thermal environments for the occupants, providing them with more thermal adaptation opportunities through variations in the indoor, semi-outdoor, and outdoor thermal environments. During summer days, a remarkable temperature difference developed between those spaces, with the maximum temperature varying from 31 °C to 35 °C. Thus, the thermal comfort environment would not only change by time, but also by space. However, only summer conditions were discussed in that research.
Duan et al. [21] investigated eight vernacular courtyard houses in southeastern China, evaluating the summer thermal comfort via measurements and questionnaires. An adaptive thermal comfort model was used to evaluate the thermal comfort levels indoors and within the courtyard. Local habitants appeared to be more tolerant of high humidity levels when there was natural ventilation, even though a considerably number of respondents showed dissatisfaction with the thermal environment in summer. Another case study by Xu et al. [22] optimized the courtyard geometry layout of a museum located in an HSCW zone in China, reducing cooling loads in summer by approximately 19.6% and heating loads in winter by approximately 22.3%. Compared to the quantity and quality of relevant studies in hot-arid and hot-humid climates, future research is needed on the courtyard’s climatic-responsive mechanism in HSCW climate zones. Such work should include winter conditions, due to the complexity of the outdoor climate in this type of area.
In this research, the effects of courtyards on the thermal performance of a vernacular house in HSCW climate zone was studied via field measurements and CFD simulations. The outdoor temperatures in this region can reach as high as 40 °C in summer, and may often fall to below 0 °C in winter; generally, there is high humidity (i.e., 70%–90%RH) year-round. The selected courtyard house was a representative vernacular timber structure dwelling (named “Si-he-tou” or “Si-he-shui”), situated in the southeast of Chongqing, China (see Figure 1). This kind of timber house layout and construction was locally popular before the 1980s. Typically, an inner courtyard opens to the street through a wide entrance hall (see Figure 2). Field measurements were conducted from the years 2011 to 2014, with the purpose of interpreting the thermal environment behaviors in summer, winter and transitional seasons. The outdoor and indoor air temperatures, RH values, and air velocities were all measured. Thermographs were also taken to obtain a better understanding of the surface temperature as influenced by solar radiation. The natural ventilation mechanisms of courtyard houses were further studied via CFD simulations. The selected opened courtyard structure was compared to a structure with a similar building configuration but enclosed courtyard. The airflow patterns driven by the wind and buoyancy effects were simulated both separately and together to fully illustrate the ventilation mechanisms. Design recommendations were then made, based on the results.
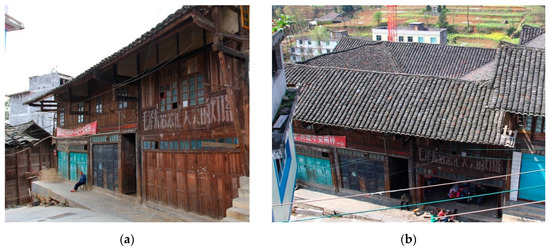
Figure 1.
The selected vernacular courtyard house: (a) southwest façade, and (b) bird’s-eye view.
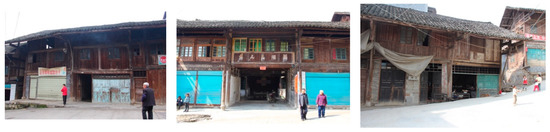
Figure 2.
Typical vernacular courtyard houses in the same region as the selected structure.
2. Experiment Setup
2.1. Building Description
A traditional residential building was selected for this study. It is located in Tongzi, in the southeastern part of the Chongqing province. It was built in the 1930s and has a rectangular courtyard in the center surrounded by a double-story structure. Locally, it is known as “Si-he-tou” or “Si-he-shui.” The house is a timber construction with wood plank walls and timber floors. The roof tiles are placed directly onto the rafters, without cement mortar (see Figure 3). Due to the limitations of the materials and structure, as well as poor maintenance, air leakage is common from the wood plank walls and near junctions in the building envelope. Therefore, the house can be considered an open system instead of a well-sealed, airtight building. There is no vegetation nor waterbody in the courtyard. The pavement in the courtyard is made of local sandstone. A more specific description of the building materials and other construction details can be found in Figure 3a,b, and Table 1. The height-to-width ratio of the courtyard is approximately 1.75:1. The surrounding rooms open towards the courtyard, either by doors or windows. A wide and open entrance hall connects the inner courtyard to the street. Two other narrower corridors are situated on the other side of the courtyard. To study the influence of building materials on the indoor thermal environment, two rooms from other houses with stone and hollow brick external walls (see Figure 3c,d, Figure 4, and Table 1) were selected for comparison. Both rooms have the same orientation and are similar in terms of geometric size. Room H of the selected courtyard house is shown in Figure 5. The comparison rooms were selected from simple building-block layouts with no courtyards.
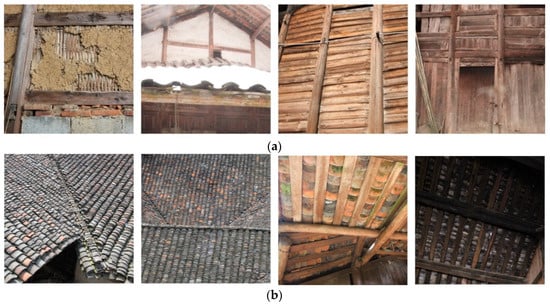
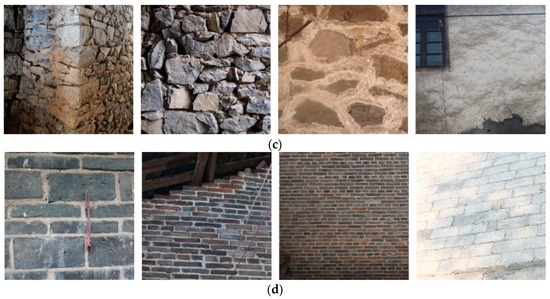
Figure 3.
Construction details: (a) wood plank walls (from the selected courtyard house), (b) tiled roofs (from the selected courtyard house), (c) stone walls (from the stone house used for comparison), and (d) concrete hollow brick walls (from the brick house used for comparison).

Table 1.
Materials and Construction Techniques.
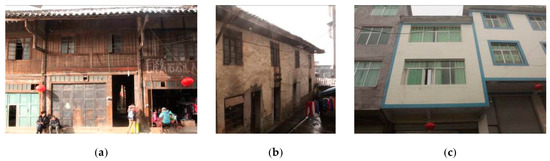
Figure 4.
Images of: (a) wood plank, (b) stone, and (c) hollow brick walls.
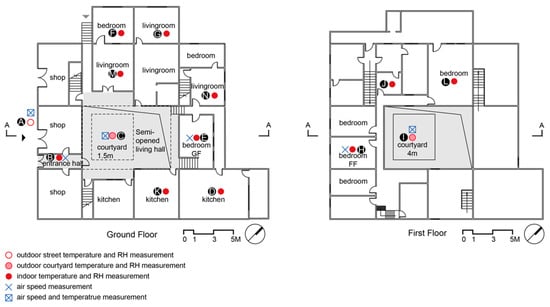
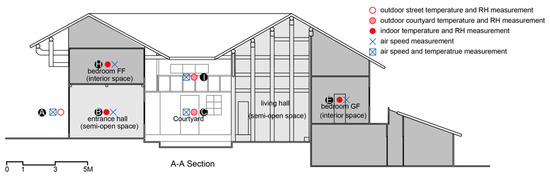
Figure 5.
Measuring points in the selected vernacular house.
2.2. Field Measurements
The research group carried out a series of field measurements of the physical environment of the selected vernacular dwelling from 22–28 August 2011 (summer); 12–20 April 2012 (transition season); 23 January to 18 February 2013 (long-term winter period); and 15–21 February 2014 (extreme weather in winter). The parameters—including air temperature, relative humidity, and air movement of the outdoor street, outdoor courtyard, and indoor spaces—were recorded by data loggers (see Figure 5). For air temperature and relative humidity, the instruments were placed in the middle of the room and values were obtained at 20-min intervals; air velocity was logged every 15 min in winter and 1.5 h in summer, due to instrument limitations. A thermographic camera was used to record the surface temperature of the building envelope, in order to support a more accurate boundary condition setup for the CFD simulation. The parameters of the test instruments are listed in Table 2.
Table 2.
Parameters of the Test Instruments.
2.3. CFD Simulation
Computational fluid dynamics (CFD) is a simulation method that has frequently been applied to investigate ventilation mechanisms on the building scale and, sometimes, on the urban scale [5,24,25]. Quite a few commercial software packages allow for an approximation of the solution to the Navier-Stokes equations that describe the physical behavior of air at low speeds [26], including ANSYS Fluent [27,28,29], CONTAMW [30], OpenFOAM [31], Autodesk CFD, and others. Among them, Autodesk CFD has been adopted and validated in several building- and urban-scale natural ventilation studies [27,32,33,34,35]. Javanroodi et al. [27] performed a validation study that applied Autodesk CFD software in two steps. First, the pressure coefficient of a single 3D cube (6 × 6 × 6 m3) was calculated using both Autodesk CFD and ANSYS Fluent (which is more generally used and well-validated in both the building and urban contexts), using the standard k-ɛ turbulence model [36]. The results were then compared to previous onsite measurements and wind tunnel results of the same form. The results from both CFD tools were in good agreement with the published results of the site measurements and wind tunnel tests [37,38]. Moreover, by comparing the simulation results between Autodesk CFD and ANSYS Fluent for an urban morphology case study, the accuracy of the Autodesk CFD simulations was further confirmed.
Due to limitations in the field measurements in this study, different scenarios were set in Autodesk CFD software to study wind- and buoyancy-driven natural ventilation within the selected courtyard, with an open entrance hall and two additional narrow corridors on the ground level (hereinafter referred as the open courtyard). Additionally, an enclosed courtyard house with similar building geometry and material parameters was modeled to serve as a comparative case study (hereinafter referred as the enclosed courtyard, see Figure 6).
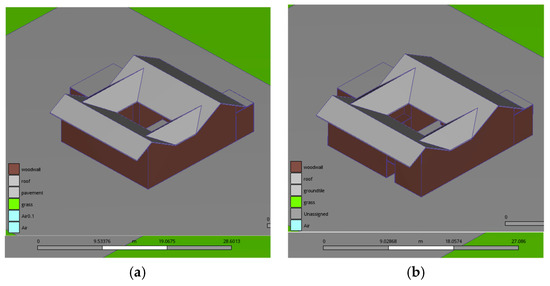
Figure 6.
Models for the CFD simulation: (a) enclosed courtyard model, and (b) open courtyard model.
Airflow and thermal conditions in the courtyards were both obtained from the simulation. Surrounding buildings were also established in the CAD model for both courtyards, in order to obtain a better understanding of the wind behavior in a settlement context (see Figure 7a). The wind and buoyancy effects were first simulated separately to provide clearer observations of the courtyard ventilation mechanisms. Later, these two natural ventilation-driven effects were combined. To simulate the buoyancy effect, the sky and ground temperatures were applied to the exterior surface of the domain (representing the sky dome). The simulation outcomes were compared in terms of air velocity and temperature from the in situ measurement periods.
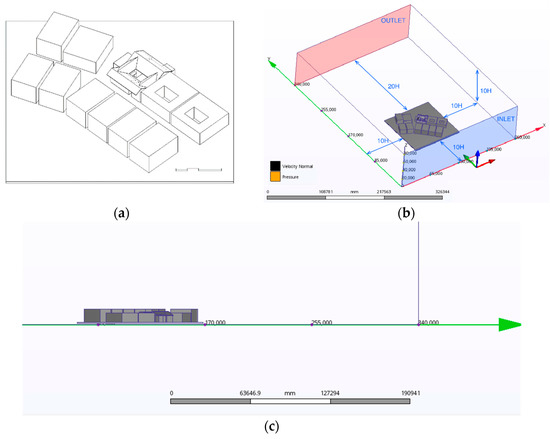
Figure 7.
(a) Computational domain used for CFD simulation (H = 8 m), (b) geometry of the building and surrounding buildings, and (c) section of the computational domain.
The computational domain size was 10H upstream, laterally, 20H downstream, and 10H to the top, where H is the height of the target building [39]. The configuration of the computational domain in the CFD simulation is illustrated in Figure 7.
Wind velocity magnitude and dominant wind direction at a height of 10m above the ground’s surface on both summer and winter design days were obtained from the Chinese Standard Weather Data (CSWD—Youyang, Chongqing, China) [40], as shown in Table 3. These were used to calculate logarithmic wind profiles, using Equation (1):
where ν1 is the reference wind speed measured at height h1 (10m in this study), ν2 is the wind speed at height h2, and z0 is the roughness length (set to 0.4 in this study). The calculation results were used as the inlet boundary conditions for the CFD simulation (see Figure 8). The wind profiles were verified with the results of the field measurements (see Figure 9). The magnitudes of the outdoor wind speed ranged from 0.4 to 1.3 m/s in summer and 0 to 0.89 m/s in winter. These were obtained from field measurements, and support the calculated logarithmic wind profiles.
Table 3.
Wind Profile Calculation Parameters.
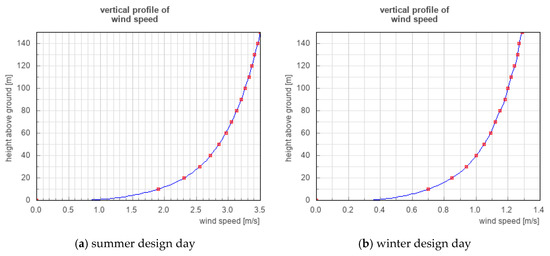
Figure 8.
Logarithmic wind profile settings for the CFD simulations of a: (a) summer design day, and (b) winter design day.
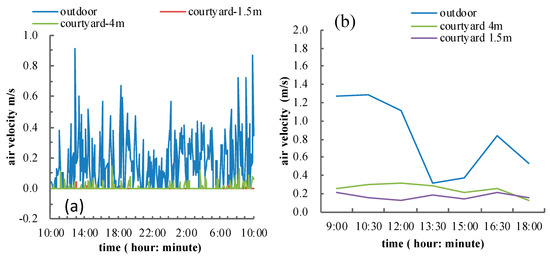
Figure 9.
Wind speed in the courtyard and other spaces in: (a) summer and (b) winter.
A non-uniform tetrahedral mesh was applied to the CFD model. The mesh size was generated and refined such that the mesh elements were not sufficiently concentrated to generate a stable and accurate result. Four meshes with different volume growth rates (between 1.01 and 2.0; used to control how quickly the volume elements grew) were generated to determine the proper mesh resolution (see Table 4). The winter scenario CFD simulations were then performed with these meshes. The results were more mesh-sensitive when there was a relatively lower wind velocity. The plan contours and wind velocity magnitudes (obtained from 21 nodes along the depth of the courtyard, at a height of 1 m) were compared. Mesh 3 was adopted for the other CFD simulations in this research (see Figure 10 and Figure 11).
Table 4.
Mesh Settings.
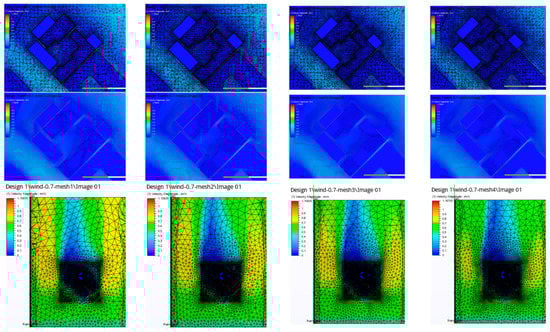
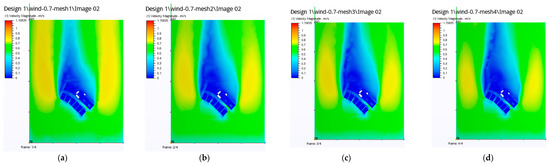
Figure 10.
Mesh configurations and wind velocity magnitude plan contours: (a) Mesh 1, (b) Mesh 2, (c) Mesh 3, and (d) Mesh 4.
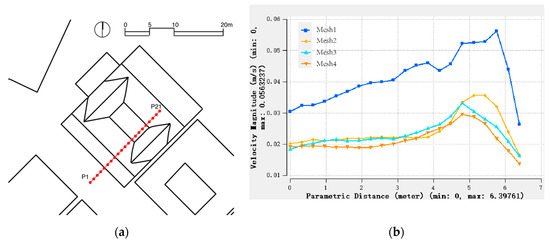
Figure 11.
Verification of the mesh configuration for velocity magnitudes at 21 nodes: (a) 21 nodes along the depth of the courtyard, at a height of 1 m; and (b) air velocity magnitudes.
Several scenarios at specific times on summer and winter design days (as assigned in CSWD, in Table 3) were set up to simulate extreme cases of the hottest and coldest days (i.e., daytime at 12:00, the highest solar altitude of the day, and nighttime at 20:00, when the surface is cooling from diurnal heat gain). The detailed simulation boundary settings are shown in Table 5.
Table 5.
CFD Simulation Settings.
3. Results and Discussion
3.1. Variations in Air Temperature
Vernacular courtyard houses are known for their intelligent use of climate resources and passive methods of establishing a comfortable micro-environment. To some extent, this effective passive control is achieved mainly by the presence of the internal courtyard [8,24]. The courtyard itself not only plays the role of climate buffer by protecting the walls from being overloaded by solar radiation, it also provides the occupants with a flexible outdoor living space for use during the day. The inner courtyard, along with the veranda and open entrance hall, serve as multi-purpose activity spaces where housework, farm work, napping, eating, and socializing can all take place throughout the day (see Figure 12). However, the courtyard house also has its limitations in terms of climate modification, particularly in HSCW climate zones. In this section, the air temperature and humidity measurements obtained for this research are discussed.
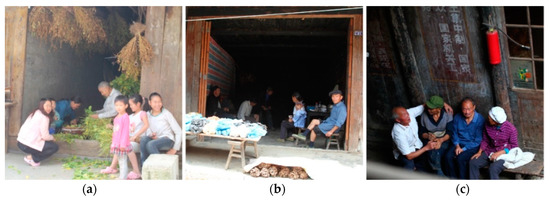
Figure 12.
Daily activities taking place in the semi-open spaces of a courtyard house: (a) farm work, (b) open-market retailing, and (c) socializing.
Figure 13 and Figure 14 shows the statistical data for the interior and exterior air temperature and humidity during the measurement periods (refer to Figure 5 for the positioning of each measuring point). Point A was selected to represent the outdoor street temperature, which fluctuated between 16.8 °C and 32.4 °C in summer, 9.1 °C and 21.2 °C in spring, and −2.3 °C to 19.6 °C in winter. The outdoor air temperature shows that although the diurnal outdoor temperatures were relatively high in summer, the summer nights were fairly cool. In the winter and transitional seasons, the air temperatures were rather low at night. The quite high average relative year-round humidity, 61.0% to 83.9%, may have exacerbated any discomfort associated with overheating or overcooling. The air temperatures in the courtyard ranged from 16.8 °C to 27.2 °C in summer, 9.0 °C to 18.4 °C in spring, and −1.8 °C to 17.2 °C in winter. The amplitude of the air temperature fluctuation decreased in the courtyard. The peak value of the air temperature significantly decreased, especially in summer. The indoor temperature ranged from 17.2 °C to 27.6 °C in summer, 9.2 °C to 18.3 °C in spring, and −1.9 °C to 13.2 °C in winter, without the use of any space/individual heating devices. The indoor air temperature could rise to approximately 17 °C with the use of a charcoal brazier or firepit, which but this was still below the thermal comfort need in winter.
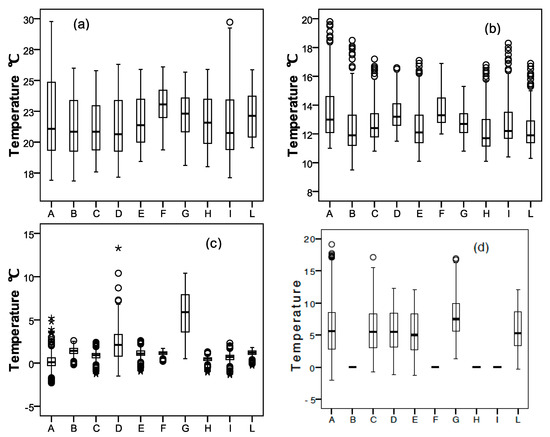
Figure 13.
Quartile graphs of interior and exterior air temperatures: (a) 22–28 August 2011 (summer); (b) 12–20 April 2012 (transition season); (c) 15–21 February 2014 (extreme weather in winter); and (d) 23 January to 18 February 2013 (long-term winter period).
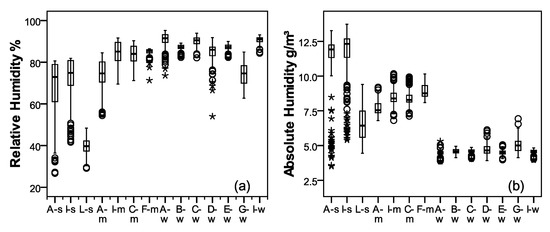
Figure 14.
Quartile graphs of interior and exterior air humidity: (a) relative humidity, and (b) absolute humidity, where -s is the summer period (22–28 August 2011), -m is the transition season period (12–20 April 2012), and -w is the winter period (15–21 February 2014).
The indoor air humidity was closely related to that of the outdoors (4.4 to 14.5 g/m3 in summer and 3.9 to 6.9 g/m3 in winter. The indoor average relative humidity ranged from 70% to 90% during the test period. The indoor relative humidity was higher in summer. Thus, the levels of thermal comfort in the courtyard and interior spaces in summer were roughly acceptable. However, during early spring and winter days, the indoor thermal environment was far below the comfort level, even with the use of heating devices.
For each season, we selected three representative days in order to identify any correlation between the indoor and outdoor air temperatures (see Figure 15). Two bedrooms on each floor that were aligned with the courtyard (measuring points E and H) and one bedroom without direct openings to the courtyard (measuring point G) were selected as representative spaces. Measuring points at the heights of 1.5 m and 4 m in the courtyard, entrance hall, and outdoor street were also selected for use in the comparative study. The figure shows that the indoor air temperature variations were highly influenced by the outdoor climate conditions during all seasons. Time lags for both interior and courtyard open spaces were insignificant. Nevertheless, the peak values of the indoor and semi-open spaces were significantly lower than those of the outdoors, not only in summer but also in the transitional seasons and winter. The peak value difference between the outdoors and indoors could be as much as 6 °C to 8 °C. The difference was greater on sunny days. After sunset, the indoor air temperature dropped in accordance with that of the outdoors. The nocturnal indoor air temperatures were 1 °C to 2 °C above that of the outdoors in summer, and 1 °C–2 °C below the outdoor temperatures in early spring and winter. On most occasions, the average and nocturnal temperatures of Room G, which was located in the northwest corner of the courtyard, were higher than those of the bedrooms aligned with the inner courtyard. The most likely reason for this may be the solar radiation exposure. Room G was heated by direct solar radiation before sunset and retained a relatively high air temperature throughout the night.
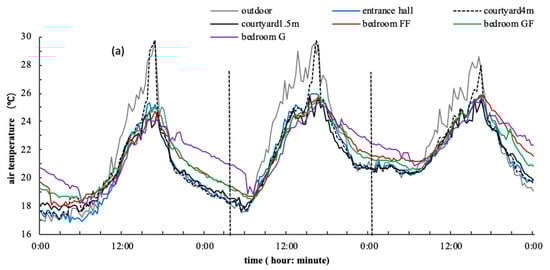
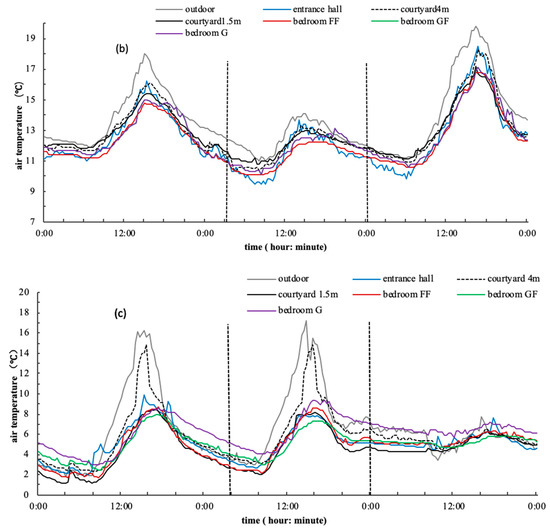
Figure 15.
Air temperature distributions from: (a) 22–28 August 2011 (summer); (b) 12–20 April 2012 (transition season); and (c) 26–28 January 2013 (winter). Bedroom FF represents measuring point H and bedroom GF represents measuring point E.
In order to further study the influence of building materials on the indoor thermal environment, two rooms from other houses with stone and hollow brick external walls were selected for a comparative study (see Figure 16 and Figure 17). Inconsistent with the U-values of these three kinds of walls, the amplitudes of the indoor temperature fluctuation in the room with wood plank walls were higher than those of the stone or hollow brick walls: 6.3 °C to 12.4 °C, 2.7 °C to 10.8 °C, and 1.9 °C to 7.7 °C, respectively. In the summer, the daily average temperatures in the room with wood plank walls were the lowest, mainly due to efficient shading by the courtyard and nocturnal cooling. Although there was a rapid indoor air temperature rise in the late afternoon due to direct solar radiation in the courtyard, the room began cooling down soon after sunset because the heat capacity of the thin, wood plank walls was relatively low. However, the indoor thermal comfort did not benefit from these characteristics in winter. Due to the higher rate of cloud cover and lower solar altitude, solar radiation had a relatively minimal impact on heat gain, even with thermal mass. Heating method was another key factor affecting the indoor thermal environment in winter.
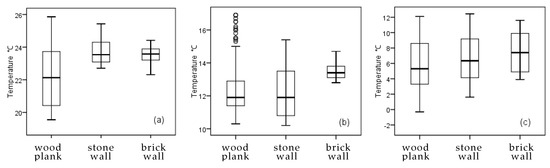
Figure 16.
Quartile graphs of indoor air temperature from: (a) 22–28 August 2011 (summer); (b) 12–20 April 2012 (transition season); and (c) 23 January to 18 February 2013 (long-term winter period).
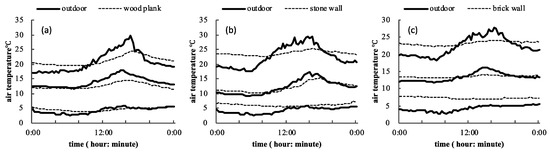
Figure 17.
Air temperature distributions from: (a) 22–28 August 2011 (summer); (b) 12–20 April 2012 (transition season); and (c) 23 January to 18 February 2013 (long-term winter period).
Open fire pits and braziers are commonly used as heating devices in this area. Instead of space heating, these devices provide thermal comfort to human bodies directly through radiation. However, burning biomass also directly discharges toxic gas indoors. This is one of the primary reasons occupants leave windows and doors open, even in winter, making the contribution of thermal mass quite limited in this area.
3.2. Surface Temperature of the Building Envelope
A study of the surface temperatures of the building envelope was essential to understanding the shielding effect of the courtyard and creating more accurate boundary condition settings for the CFD simulation. Figure 18 shows infrared thermal images taken on a summer afternoon. The average surface temperature of the shaded area was 22.6 °C, with a maximum temperature of 29.5 °C; the average surface temperature of the area under direct solar radiation was 25.8 °C, with a maximum temperature of 37.9 °C. Roof and wall surface temperatures in response to different weather processes were also obtained via thermographic technology. Sunrise in the summer and transition seasons occurred at about 6:20, and sunset was at approximately 19:20. Sunrise during the winter test was at about 7:25, and sunset was at around 18:35. What we learned from the field measurements is that the lowest temperature was reached before dawn, between 5:00 and 8:00 (see Figure 15). This could be delayed to as late as 9:00 on cloudy days. The outdoor air temperature was influenced by direct solar radiation and nearby building surface temperatures. The air temperature usually reached its peak value between 16:00 and 17:30, after which the temperature would drop.
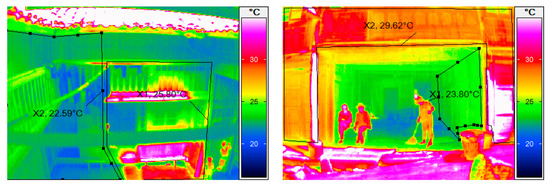
Figure 18.
Thermographs of the courtyard in summer.
Figure 19 shows a series of thermographs illustrating the thermodynamic processes of the wood- plank façade of the selected courtyard house in winter. During the measurement period, the outdoor air temperatures ranged from −2.3 °C to 2.0 °C on cloudy days and −2.1 °C to 5.2 °C on sunny days. The average outdoor air temperatures on cloudy and sunny days were 0.02 °C and 1.17 °C, respectively. It is important to note that only opaque surfaces were considered when calculating average temperatures, because the influence of reflection makes it is difficult to obtain accurate temperatures of glazing units. The amplitude of the façade’s temperature was 3.63 °C on cloudy days and 10.14 °C on sunny days. On cloudy days, the highest exterior surface temperature was reached at around 14:00, while it peaked at around 16:00 on sunny days. The accumulation of solar radiation was one reason for this difference. Another significant factor was that the northwest orientation subjected the envelope to western exposure before sunset.
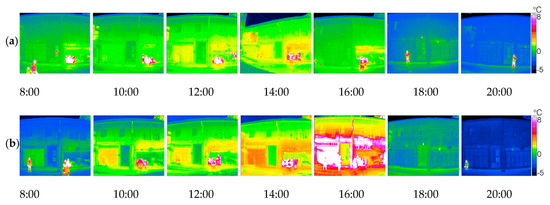
Figure 19.
Thermographs of the timber façade taken in 2014 on: (a) February 16th (a cloudy day) and (b) 20th (a sunny day).
The seasonal variation was distinctive, as shown in Figure 20 and Table 6. In February, the average exterior surface temperature of the wooden façade could be as low as −0.23 °C. In April, the average exterior surface temperature of the wooden façade was 13.96 °C. In August, the average temperature reached 24.17 °C, with the highest temperature being 30.94 °C at 10:00. The temperature spans were wider in summer than during the other two seasons. The surface temperatures of the clay-tiled roof were also studied, as shown in Figure 21. The absorption factor of solar radiation was relatively high, due to the roughness and dark color of the clay tile. During the day, the average exterior temperatures could be as high as 40 °C to 50 °C in summer, and 21.1 °C and 10.28 °C in spring and winter, respectively.
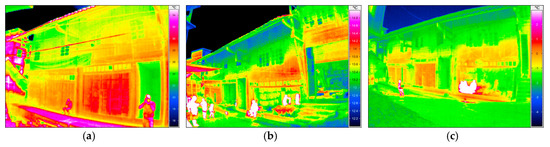
Figure 20.
Temperatures in the selected courtyard house: (a) summer at 10:00, (b) spring at 10:00, and (c) winter at 10:00.
Table 6.
Thermographic Records of Different Seasons (10:00).
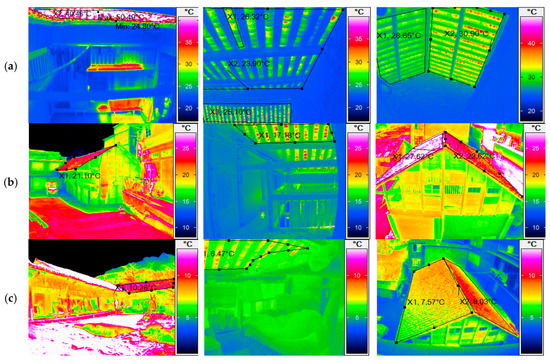
Figure 21.
Thermographs of tiled roofs taken during: (a) summer at 11:00, (b) spring at 16:00, and (c) winter at 11:00.
3.3. Influence of the Courtyard on Natural Ventilation
Accelerating natural ventilation is another effective passive design strategy made possible by a courtyard. There are two key functions of natural ventilation in the summer. One is to increase air velocity around the human body and improve thermal comfort, and the other is to exhaust high-temperature air. Additionally, in winter, natural ventilation can guarantee indoor air quality, especially where traditional heating and cooking devices are employed. Based on the fundamental parameters obtained from the field measurements, including details regarding the building’s construction and materials (see Section 2.1), outdoor and indoor air temperature distributions (see Section 3.1) and surface temperatures of the building envelope (see Section 3.2), natural ventilation characteristics of the selected and comparative courtyards were all studied via CFD simulations.
Airflow results from natural convention currents are caused by temperature differences (buoyancy-driven natural ventilation) and changes in pressure (wind-driven natural ventilation) [25]. Different scenarios were set in Autodesk CFD software to study the wind- and buoyancy-driven natural ventilation levels of the two courtyard layouts. One had an open entrance hall and two narrow corridors on the ground level. The other had similar building geometry and material parameters, but without any openings on the ground level (see Figure 6). To illustrate the courtyard ventilation mechanisms, the wind and buoyancy effect was first simulated separately (see Figure 22, Figure 23 and Figure 24), and then later combined (see Figure 25 and Figure 26).
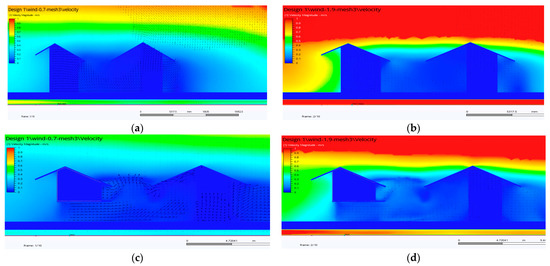
Figure 22.
Airflow pattern and wind velocity by wind effect only: (a) enclosed courtyard in winter, (b) enclosed courtyard in summer, (c) open courtyard in winter, and (d) open courtyard in summer.
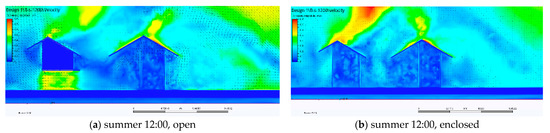
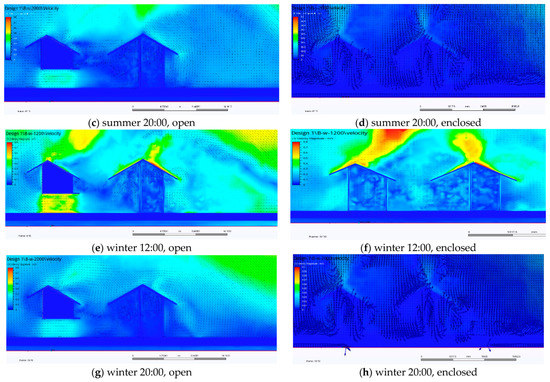
Figure 23.
Airflow pattern and wind velocity distribution by buoyancy effect only: (a–d) summer scenarios, and (e–h) winter scenarios.
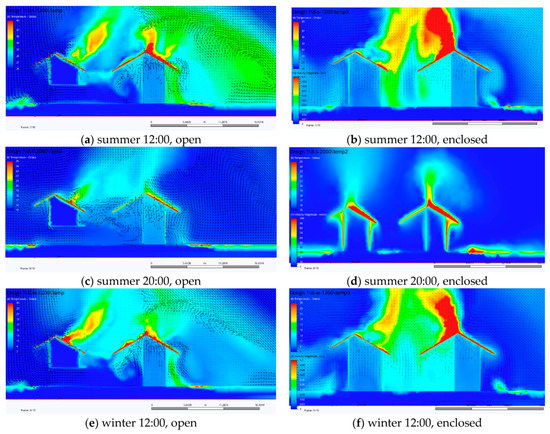
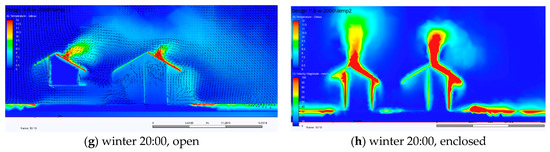
Figure 24.
Air temperature distribution by buoyancy effect only: (a–d) summer scenarios, and (e–h) winter scenarios.
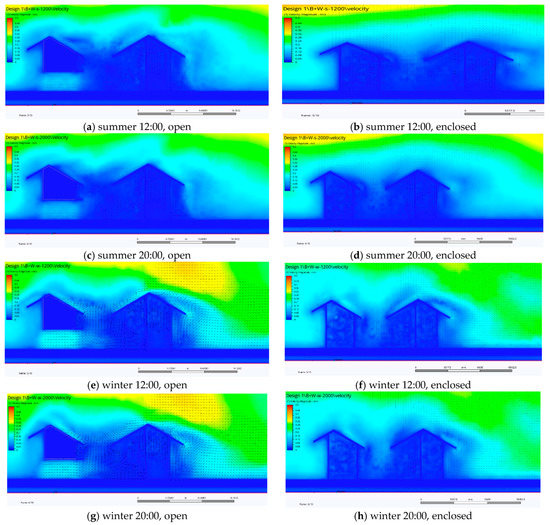
Figure 25.
Airflow patterns and wind velocity distributions by both wind and buoyancy effects: (a–d) summer scenarios, and (e–h) winter scenarios.
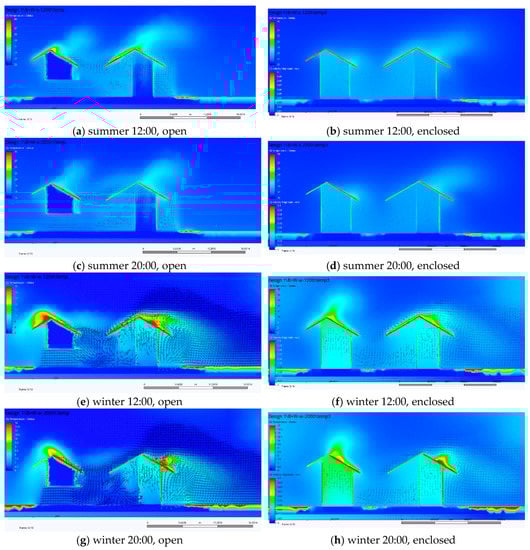
Figure 26.
Air temperature distribution by both wind and buoyancy effects: (a–d) summer scenarios, and (e–h) winter scenarios.
The simulations showed significantly different airflow patterns and velocities for the two courtyard layouts. The air velocity in the open courtyard was higher than in the enclosed one. However, due to the high density and relatively low wind velocity of the ambient environment, the wind velocities in the courtyards were both fairly low, ranging from 0.05 to 0.15 m/s for the winter scenario and 0.1 to 0.3 m/s for the summer scenario. The dominant streamline was upward in the open courtyard. A vertical vortex was formed within the semi-open living hall adjacent to the courtyard. The air movement caused by buoyancy-driven ventilation was more significant than wind-driven only; the more turbulent flows were driven by buoyancy rather than wind. The behavior of the buoyancy-driven ventilation was in accordance with both the time and weather. Scenarios were set to simulate the worst cases in summer and winter, including daytime at 12:00 (i.e., the highest solar altitude of the day) and nighttime at 20:00 (i.e., when the surface is cooling down from diurnal heat gain). The results reveal that the buoyancy effect was most significant in summer at midday, because the temperature difference between the roof and courtyard pavement surface was large. At midday, the high solar altitude and radiation intensity heated the roof and part of the courtyard pavement. The air heated up near the rooftop and the cooler bottom air drafted into the open courtyard through the entrance hall. Without the inlet of fresh, cool air from the outdoors, the surface temperature of the envelope remained high and heated air accumulated in the enclosed courtyard (see Figure 23 and Figure 24). The airflow was relatively weak in winter during both the day and night.
Most natural ventilation is driven by both wind and buoyancy effects. Thus, these two driving factors were considered together to provide a more comprehensive study (see Figure 25 and Figure 26). The magnitudes of the wind velocities in the courtyards were extremely low in both summer and winter, which was in accordance with the in situ measurements results (see Figure 9). Although the main direction of airflow was similar, the air speed was lower because there was much more in the way of turbulence and generated vortexes. To some extent, this resulted in the wind vectors weakening in response to one another. As for the temperature distribution, in all scenarios, higher temperatures were observed in the enclosed courtyard rather than the open one. The temperature difference between simulations and in situ measurements at certain measuring points in the courtyard was lower than 2 °C. Accordingly, we can conclude that with openings on the ground level, the wind- and buoyancy-driven natural ventilation can be accelerated in the courtyard, both in summer and winter, especially at the pedestrian level. However, the benefits are limited due to the relatively high-density surrounding buildings and low ambient wind speed. An enclosed courtyard configuration would help to maintain a higher air temperature in the courtyard. The air change rate was also lower in the enclosed courtyard, due to poorer natural ventilation that impeded air pollutant reduction.
4. Conclusions
It is generally believed that courtyards can serve as effective passive design strategies in response to various climate conditions. Courtyards, along with other semi-open spaces such as verandas and overhangs, play an important role in mitigating outdoor climate fluctuations. Nevertheless, previous relevant studies have shown that the design parameters and applicable strategies can be remarkably different in different climate zones. Compared to the quantity and quality of relevant studies in hot-arid and hot-humid climates, future research is needed on the courtyard climate-response mechanism in HSCW climate zones. In the present research, the seasonal variations in thermal performance, as well as the natural ventilation mechanisms of a representative courtyard house situated in Chongqing Province, were studied via field measurements and CFD simulations. Key findings include:
- (1)
- The outdoor air temperature of the studied area reached as high as 40 °C in summer, and often fell below 0 °C in winter, with high humidity levels of 70% to 90%RH year-round. Due to the contradictions and complexities of the outdoor climate in HSCW climate zones, the study of this region should be more comprehensive than those conducted in hot-arid and hot-humid climates; both summer and winter outdoor environments should be taken into consideration. The in situ indoor and outdoor air temperature measurements revealed that the summer thermal comfort levels in the courtyard and interior spaces were roughly acceptable. However, during the early spring and winter days, the indoor thermal environment was far below the comfort level, even with the use of heating devices.
- (2)
- For summer conditions, we can conclude that the courtyard did play an active role as a climatic buffer and significantly reduced the temperature’s peak value. Self-shading and natural ventilation strategies are both significant to achieving thermal comfort in summer in HSCW zones. A comparative study of two rooms with and without shading from a courtyard showed the significant impact of direct solar radiation on indoor air temperatures. The thermographs further illustrate this point and demonstrate that the inner facades of the courtyard could be efficiently shaded during the daytime, mitigating the peak values of indoor and outdoor courtyard temperatures. Rooms enveloped by thermal mass materials such as stone and brick lead to higher indoor temperatures in summer, especially during summer nights.
- (3)
- There are multiple reasons why the winter conditions were far from the required indoor thermal comfort. Due to the higher rate of cloud cover and lower solar altitude, the solar radiation had a relatively smaller impact on heat gain during the winter, even with thermal mass. The courtyard prevented the surrounding rooms from receiving direct solar radiation, to some extent acting as a heat barrier. Heating method is also a key factor that affects the indoor thermal environment in winter. Open fire pits and braziers are commonly used as heating devices in this area, directly discharging toxic gases indoors. This is one of the primary reasons occupants leave windows and doors open, even in winter, which contributes to making thermal mass quite limited in this area. Therefore, to improve thermal comfort in winter, low-pollution heating devices should be adopted, as well as a flexible building layout adapted to both summer and winter conditions. Detailed design strategies and a low-tech heat-recovery system were proposed in an earlier study published by the authors [41].
- (4)
- The mechanisms of natural ventilation in courtyard houses in HSCW zones were further studied via CFD simulations. The airflow patterns driven by wind and buoyancy effects were simulated separately to illustrate the ventilation mechanisms, and then evaluated together. Considering the relatively low outdoor air velocity, it was clear that the buoyancy effect also played an important role in accelerating the natural ventilation. Buoyancy-driven ventilation operates in coordination with the weather process, coupling with the indoor and outdoor thermal environments. Whether or not the airflow driven by these two mechanisms enhances each depends on the specific circumstances. The results showed that although the main directions of airflow were similar, the air speed was lower because of the greater turbulence and generated vortexes. To some extent, the wind vectors then weakened one another.
- (5)
- The selected open courtyard was compared to an enclosed courtyard with similar building configurations. The simulation results showed that the courtyard’s natural ventilation behavior benefited from the proper openings on the ground level. Both the wind and buoyancy effects were enhanced by the wide-open entrance hall on the street side and two narrow corridors on the other sides. But the benefits are limited due to the relatively high-density surrounding buildings and low ambient wind speed. An enclosed courtyard configuration would help to maintain a higher air temperature in the courtyard than an open design. The air change rate would also be lowered, due to the poorer natural ventilation in enclosed courtyards, which impedes air pollutant reduction.
This study was limited to the in situ measurements of a single vernacular courtyard house, and only certain instantaneous wind environment scenarios were simulated. Further studies of courtyard performance and design strategy should be undertaken in HSCW climate zones, with sufficient consideration being taken of design factors such as orientation, architectural configuration, materials, vegetation, water elements, etc. Extensive field measurements of the indoor and outdoor thermal environments, as well as smoke tests, should be employed to verify and modify the simulation outcomes.
Author Contributions
Conceptualization, S.H. and Y.S.; Data curation, S.H.; Formal analysis, S.H.; Funding acquisition, Y.X.; Investigation, S.H. and C.Y.; Methodology, S.H.; Project administration, Y.S.; Resources, S.H. and Y.S.; Supervision, Y.S.; Validation, S.H., C.Y. and Y.X.; Visualization, Y.X.; Writing—original draft, S.H.; Writing—review & editing, S.H. and C.Y.
Funding
This research was funded by the State Key Laboratory of Subtropical Building Science (2019ZB09) and Beijing Advanced Innovation Center for Future Urban Design, Beijing University of Civil Engineering and Architecture (Project no. UDC2018010411).
Acknowledgments
The authors are grateful for efforts contributed by Zhenghao Lin, Gui Zhang, Huaxi Zhang and other research team members in the field surveys. The assistances of local government of Tongzi County, Wulong province are also highly appreciated.
Conflicts of Interest
The authors declare no conflict of interest.
References
- Hasehzadeh Haseh, R.; Khakzand, M.; Ojaghlou, M. Optimal Thermal Characteristics of the Courtyard in the Hot and Arid Climate of Isfahan. Buildings 2018, 8, 166. [Google Scholar] [CrossRef]
- Khalili, M.; Amindeldar, S. Traditional solutions in low energy buildings of hot-arid regions of Iran. Sustain. Cities Soc. 2014, 13, 171–181. [Google Scholar] [CrossRef]
- Soflaei, F.; Shokouhian, M.; Abraveshdar, H.; Alipour, A. The impact of courtyard design variants on shading performance in hot- arid climates of Iran. Energy Build. 2017, 143, 71–83. [Google Scholar] [CrossRef]
- Ghaffarian Hoseini, A.; Berardi, U.; GhaffarianHoseini, A. Thermal performance characteristics of unshaded courtyards in hot and humid climates. Build. Environ. 2015, 87, 154–168. [Google Scholar] [CrossRef]
- Almhafdy, A.; Ibrahim, N.; Ahmad, S.S.; Yahya, J. Thermal Performance Analysis of Courtyards in a Hot Humid Climate Using Computational Fluid Dynamics CFD Method. Procedia Soc. Behav. Sci. 2015, 170, 474–483. [Google Scholar] [CrossRef]
- Kubota, T.; Zakaria, M.A.; Abe, S.; Toe, D.H.C. Thermal functions of internal courtyards in traditional Chinese shophouses in the hot-humid climate of Malaysia. Build. Environ. 2017, 112, 115–131. [Google Scholar] [CrossRef]
- Oliver, P. Built to Meet Needs: Cultural Issues in Vernacular Architecture; Architectural Press: Oxford, UK, 2006. [Google Scholar]
- Coch, H. Chapter 4—Bioclimatism in vernacular architecture. Renew. Sustain. Energy Rev. 1998, 2, 67–87. [Google Scholar] [CrossRef]
- Zamani, Z.; Heidari, S.; Hanachi, P. Reviewing the thermal and microclimatic function of courtyards. Renew. Sustain. Energy Rev. 2018, 93, 580–595. [Google Scholar] [CrossRef]
- Knapp, R.G. China’s Old Dwellings; University of Hawaii Press: Honolulu, HI, USA, 2000. [Google Scholar]
- Meir, I.A.; Pearlmutter, D.; Etzion, Y. On the microclimatic behavior of two semi-enclosed attached courtyards in a hot dry region. Build. Environ. 1995, 30, 563–572. [Google Scholar] [CrossRef]
- Guedouh, M.S.; Zemmouri, N. Courtyard Building’s Morphology Impact on Thermal and Luminous Environments in Hot and Arid Region. Energy Procedia 2017, 119, 153–162. [Google Scholar] [CrossRef]
- Al-Hafith, O.; Satish, B.K.; Bradbury, S.; de Wilde, P. The Impact of Courtyard Parameters on Its Shading Level an Experimental Study in Baghdad, Iraq. Energy Procedia 2017, 134, 99–109. [Google Scholar] [CrossRef]
- Chatzidimitriou, A.; Yannas, S. Microclimate design for open spaces: Ranking urban design effects on pedestrian thermal comfort in summer. Sustain. Cities Soc. 2016, 26, 27–47. [Google Scholar] [CrossRef]
- Berkovic, S.; Yezioro, A.; Bitan, A. Study of thermal comfort in courtyards in a hot arid climate. Sol. Energy 2012, 86, 1173–1186. [Google Scholar] [CrossRef]
- Toe, D.H.C.; Kubota, T. Comparative assessment of vernacular passive cooling techniques for improving indoor thermal comfort of modern terraced houses in hot–humid climate of Malaysia. Sol. Energy 2015, 114, 229–258. [Google Scholar] [CrossRef]
- Rojas, J.M.; Galán-Marín, C.; Fernández-Nieto, E.D. Parametric Study of Thermodynamics in the Mediterranean Courtyard as a Tool for the Design of Eco-Efficient Buildings. Energies 2012, 5, 2381–2403. [Google Scholar] [CrossRef]
- Sadafi, N.; Salleh, E.; Haw, L.C.; Jaafar, Z. Evaluating thermal effects of internal courtyard in a tropical terrace house by computational simulation. Energy Build. 2011, 43, 887–893. [Google Scholar] [CrossRef]
- Zakaria, M.A.; Kubota, T.; Toe, D.H.C. The Effects of Courtyards on Indoor Thermal Conditions of Chinese Shophouse in Malacca. Procedia Eng. 2015, 121, 468–476. [Google Scholar] [CrossRef]
- Du, X.; Bokel, R.; van den Dobbelsteen, A. Building microclimate and summer thermal comfort in free-running buildings with diverse spaces: A Chinese vernacular house case. Build. Environ. 2014, 82, 215–227. [Google Scholar] [CrossRef]
- Duan, Z.; Ford, B.; Lau, B. The thermal comfort of vernacular skywell dwellings in south-eastern China. In Centro de Investigacion de la Arquitectura y la Ciudad; Pontificia Universidad Catolica del Peru (PUCP): Lima, France, 2012. [Google Scholar]
- Xu, X.; Luo, F.; Wang, W.; Hong, T.; Fu, X. Performance-Based Evaluation of Courtyard Design in China’s Cold-Winter Hot-Summer Climate Regions. Sustainability 2018, 10, 3950. [Google Scholar] [CrossRef]
- Ren, X.J. The Study on Saving Energy Envelope in Improving Hot and Humid Environment of Village Residences in Chongqing; Chongqing University: Chongqing, China, 2010. [Google Scholar]
- Etheridge, D. A perspective on fifty years of natural ventilation research. Build. Environ. 2015, 91, 51–60. [Google Scholar] [CrossRef]
- D’Agostino, D.; Congedo, P.M. CFD modeling and moisture dynamics implications of ventilation scenarios in historical buildings. Build. Environ. 2014, 79, 181–193. [Google Scholar] [CrossRef]
- Chen, Q.Y. Using computational tools to factor wind into architectural environment design. Energy Build. 2004, 36, 1197–1209. [Google Scholar] [CrossRef]
- Javanroodi, K.; Mahdavinejad, M.; Nik, V.M. Impacts of urban morphology on reducing cooling load and increasing ventilation potential in hot-arid climate. Appl. Energy 2018, 231, 714–746. [Google Scholar] [CrossRef]
- Mohamadabadi, H.D.; Dehghan, A.A.; Ghanbaran, A.H.; Movahedi, A.; Mohamadabadi, A.D. Numerical and experimental performance analysis of a four-sided wind tower adjoining parlor and courtyard at different wind incident angles. Energy Build. 2018, 172, 525–536. [Google Scholar] [CrossRef]
- Moonen, P.; Dorer, V.; Carmeliet, J. Evaluation of the ventilation potential of courtyards and urban street canyons using RANS and LES. J. Wind Eng. Ind. Aerodyn. 2011, 99, 414–423. [Google Scholar] [CrossRef]
- Persily, A.; Musser, A.; Emmerich, S.J. Modeled infiltration rate distributions for U.S. housing. Indoor Air 2010, 20, 473–485. [Google Scholar] [CrossRef] [PubMed]
- Pawlowski, S.; Nayak, N.; Meireles, M.; Portugal, C.A.M.; Velizarov, S.; Crespo, J.G. CFD modelling of flow patterns, tortuosity and residence time distribution in monolithic porous columns reconstructed from X-ray tomography data. Chem. Eng. J. 2018, 350, 757–766. [Google Scholar] [CrossRef]
- Mousa, W.A.Y.; Lang, W.; Auer, T.; Yousef, W.A. A pattern recognition approach for modeling the air change rates in naturally ventilated buildings from limited steady-state CFD simulations. Energy Build. 2017, 155, 54–65. [Google Scholar] [CrossRef]
- Bhandari, M.; Shrestha, S.; New, J. Evaluation of weather datasets for building energy simulation. Energy Build. 2012, 49, 109–118. [Google Scholar] [CrossRef]
- Ma, X.; Zhao, J. Numerical Simulation of Turbulent Flow Regulation of Adjacent Buildings Space Based on Characteristics of Particulate Matter Diffusion. Ekoloji 2018, 27, 803–815. [Google Scholar]
- Abdelhafez, M.H. The Degree of Urban Patterns Compactness as a Passive Cooling Strategy in Hot Desert Climate Wadi Karkar Villages–Aswan as a Case Study. J. Eng. Sci. 2018, 5, 617–629. [Google Scholar]
- Yang, A.-S.; Su, Y.-M.; Wen, C.-Y.; Juan, Y.-H.; Wang, W.-S.; Cheng, C.-H. Estimation of wind power generation in dense urban area. Appl. Energy 2016, 171, 213–230. [Google Scholar] [CrossRef]
- Richards, P.J.; Hoxey, R.P.; Short, L.J. Wind pressures on a 6 m cube. J. Wind Eng. Ind. Aerodyn. 2001, 89, 1553–1564. [Google Scholar] [CrossRef]
- Murakami, S.; Mochida, A. 3-D numerical simulation of airflow around a cubic model by means of the k-ɛ model. J. Wind Eng. Ind. Aerodyn. 1988, 31, 283–303. [Google Scholar] [CrossRef]
- Mochida, A.; Tominaga, Y.; Murakami, S.; Yoshie, R.; Ishihara, T.; Ooka, R. Comparison of various k-ε models and DSM applied to flow around a highrise building-report on AU cooperative project for CFD prediction of wind environment. Wind Struct. 2002, 5, 227–244. [Google Scholar] [CrossRef]
- China Meteorological Bureau; Department of Building Science and Technology, Tsinghua University. China Standard Weather Data for Analyzing Building Thermal Conditions; China Building Industry Publishing House: Beijing, China, 2005.
- Hao, S.; Xu, Y.; Yu, C.; Song, Y.; Lin, Z. Experimental Investigation of the Surface Temperature Distribution and Thermal Performance of an Intermittent Combustion Chinese Heated Wall. Adv. Mater. Sci. Eng. 2018, 2018, 13. [Google Scholar] [CrossRef]
© 2019 by the authors. Licensee MDPI, Basel, Switzerland. This article is an open access article distributed under the terms and conditions of the Creative Commons Attribution (CC BY) license (http://creativecommons.org/licenses/by/4.0/).