Abstract
This study aims to provide insight into the cost-effective catalyst on power generation in a microbial fuel cell (MFC) for treatment of municipal sludge. Power production from MFCs with carbon, Fe2O3, and Pt electrodes were compared. The MFC with no coating on carbon generated the least power density (6.72 mW·m−2) while the MFC with Fe2O3-coating on carbon anodes and carbon cathodes generated a 78% higher power output (30.18 mW·m−2). The third MFC with Fe2O3-coated carbon anodes and Pt on carbon as the cathode catalyst generated the highest power density (73.16 mW·m−2) at room temperature. Although the power generated with a conventional Pt catalyst was more than two-fold higher than Fe2O3, this study suggests that Fe2O3 can be investigated further as an efficient, low-cost, and alternative catalyst of Pt, which can be optimized for improving performance of MFCs. Electrochemical impedance spectroscopy (EIS) and cyclic voltammetry (CV) results demonstrated reduced resistance of MFCs and better charge transfer between biofilm and electrodes containing coated anodes compared to non-coated anodes. Scanning electron microscopy (SEM) was used to analyze biofilm morphology and microbial community analysis was performed using 16S rRNA gene sequencing, which revealed the presence of known anaerobic fermenters and methanogens that may play a key role in energy generation in the MFCs.
1. Introduction
Microbial fuel cells (MFC) are an emerging source of renewable energy because of their ability to generate “clean energy” from wastewater, using microorganisms. The process of electricity generation begins with oxidation of organic matter at the anode to generate electrons, protons, and other by-products, like CO2, through microbial metabolic processes. The electrons travel to the cathode through an outer circuit, while protons are selectively transferred to the cathode through a proton exchange membrane (PEM). The terminal electron acceptor (TEA) present at the cathode is reduced and a potential gradient is generated between the two chambers, resulting in power production [,].
MFC technology is a low cost, sustainable, and promising waste management tool that has prompted extensive laboratory scale research on various parameters. Researchers have achieved chemical oxygen demand (COD) removal efficiencies of more than 90% [], but the lower columbic efficiency (CE) and power density (PD) are the reason for its limited efficiency, compared to other conventional fuel cell technologies, and its commercial unavailability. Tremendous efforts have been made to understand and overcome the bottlenecks to achieving high performance MFC. Types of substrates and their microbial degradation characteristics [], cell architecture [,] electrode materials, microbial activity, pH, conductivity, cell resistance, and different membrane materials are some key parameters that have been studied [,,,]. Electron acceptance in both the anode [] and cathode [,] is thought to be crucial in limiting power output in MFCs, due to slow reaction kinetics. Carbon-based materials (cloth, felt, paper) are the most frequently used and cost-effective anode materials in MFCs for making biocompatible electrodes. The hydrophobic nature of these materials often increases the interfacial resistance, due to inefficient adhesion of microbes on the anode surface [,,]. A range of physical and chemical treatments have been previously reported to modify the carbon materials for improving conductivity, surface area, and biocompatibility for microbial growth []. These include the use of quinones [,], Mn4+ [], and neutral red [,] as electroactive mediator species to stimulate faster electron transfer. Conducting polymers [], carbon nanotubes (CNTs) [,], and metal particles [,] for electrode modification are among the other methods adopted. Earlier reported studies have also revealed that coating carbonaceous anode material with metal and metal oxides enriches the electroactive microbial community, resulting in better fuel cell performance. Anode modification with Au [], Pd, manganese dioxide, iron oxides [,], ruthenium oxide [], Ti [], electrodeposition of nickel–iron (NiFe) and nickel–iron–phosphorous (NiFeP) nanostructures [] has shown improved performance, compared to an uncoated anode.
Oxygen reduction reaction (ORR) can be an energy-limiting step due to its high over-potential barrier when performed on bare (unmodified) carbon electrodes, leading to the need for the use of a catalyst like Pt []. Although Pt is a widely used ORR catalyst in MFCs [], its high cost and activity loss due to additional reactions [,,] led to the search for non-Pt catalysts, without significantly compromising MFC performance. Low-cost alternatives like activated carbon fabric [], MnO2 [], Fe2O3 [], cobalt tetramethylphenylporphyrin (CoTMPP) [,], and iron cobalt tetramethylphenylporphyrin (FeCoTMPP) [] have been shown to contribute towards power production in MFCs comparable to Pt. Fe2O3 was chosen as a material for this study for coating electrodes because of its easy availability, high surface area, physical and catalytic properties, stability, non–toxicity, and low cost []. Here, we compared MFC performance of (A) unmodified carbon paper on both the anode and cathode with (B) a conventional Pt catalyst on the cathode and a Fe2O3-coated anode and (C) Fe2O3 as the catalyst on both the anode and the cathode.
2. Materials and Methods
2.1. MFC Construction and Operation
Dual chambered H-type MFCs fabricated with glass were used for this study. The operating volume of the anode and cathode chambers was 100 mL. Electrodes with titanium mesh current collectors were placed in anode and cathode chambers, followed by a proton exchange membrane (PEM; Nafion 117) between the chambers. A thin layer of silicon glue was applied on the flat surface of the glass rim, followed by application of clamps to ensure a stable and leak-proof membrane assembly of the H cell. The inoculation steps were performed inside an anaerobic chamber, consisting of 10% CO2 in N2 gas as the headspace atmosphere. All the openings were sealed with rubber septa. In total, three cells were operated: (i) with an unmodified anode and cathode (cell A), (ii) with a Fe2O3-coated anode (loading rate 3 mg·cm−2) and a Pt/C-coated cathode (loading rate 2 mg·cm−2) (cell B), and (iii) with a Fe2O3-coated anode and cathode (loading rate 3 mg·cm−2) (cell C). Scheme 1 depicts these cells and electrode configurations. The cells were first operated abiotically to establish control parameters, and all the experiments were performed in duplicate. Statistical analysis of duplicate data sets showed the experimental values were well within the reproducible limits.
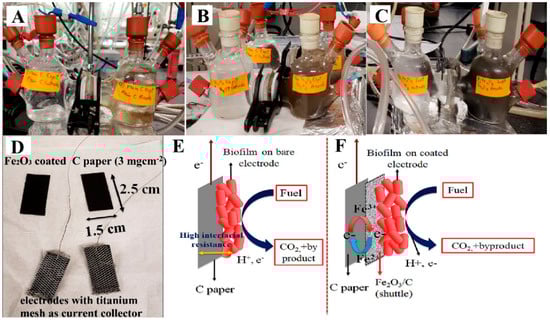
Scheme 1.
(A) MFC with bare carbon electrode in anode and cathode. (B) MFC with Fe2O3 anode and Pt/C cathode. (C) MFC with Fe2O3 anode and Fe2O3 cathode. (D) Coated electrodes used in MFC. (E) Scheme showing biofilm formation on bare electrode. (F) Scheme showing biofilm formation on Fe2O3-coated electrode.
2.2. Preparation of Electrode Materials
The carbon-supported Pt catalyst with a nominal loading of 20 wt % was purchased from Alfa Aesar, Haverhill, MA, USA. Fe2O3 (purity 98%) and Vulcan XC-72R carbon black were purchased from Fisher Scientific (Waltham, MA, USA) and Fuel Cell Store, College Station, TX, USA, respectively. Fe2O3 was mixed with carbon black in 20 wt % ratio. Pt/C and Fe2O3/C catalyst inks were prepared separately by mixing with LIQUION-1000 solution, having 15 wt % Nafion (Ion Power, Inc., New Castle, DE, USA) with a catalyst: A Nafion (dry weight) ratio of 65:35 wt % []. The appropriate amount of water and isopropanol was added to the mixture and was sonicated for 1 h prior to brush painting on 1 wt% wet-proofed Toray 090 carbon paper (Fuel Cell Store, College Station, TX, USA). The surface area of both the anode and cathode electrodes were 3.75 cm2. The final loading obtained was 3 mg·cm−2 for Fe2O3/C and 2 mg·cm−2 for Pt/C. Electrodes were air-dried before use. Titanium screen mesh (Fuel Cell Store, College Station, TX, USA) of 0.007-inch thickness and strand width was used as a current collector, wrapped around the electrodes. The whole electrode assembly was then connected to a potentiostat, using titanium wire (Sigma–Aldrich, St. Louis, MI, USA).
2.3. Electrochemical Measurements and Analyses
The potentiostat from BioLogic (VSP-300, Seyssinet-Pariset, France) was used for all electrochemical measurements and open circuit potential (OCP) monitoring. An external resistor of 3.3 KΩ was used to monitor cell potential in the closed-circuit condition. Power values were derived using the formula P = IV [,], where (I) is the current generated and (V) is the potential measured at a certain resistance (R). For our studies, a galvanostatic scan was performed at a scan rate of 0.02 µA/s and the resulting voltage response was measured until the potential reached zero. Electrochemical measurements were taken every 15 days and in total, three such cycles were monitored, starting on day 0 (cycle 1, immediately after inoculation), day 15 (cycle 2), and until day 30 (cycle 3). Polarization experiments, cyclic voltammetry (CV), and electrochemical impedance spectroscopy (EIS) were analyzed using the same potentiostat for each cycle.
The electrochemical effects of biofilm on the anode was exclusively studied through half-cell mode, where the anode was used as the working electrode, Ag/AgCl/1 M KCl was used as a reference electrode, and a Pt wire (0.5 mm) was used as the counter electrode. The electrodes were placed in the cell while avoiding any contact between them. The scan limit for the CV experiment was kept between −0.6 V and 0.8 V, using a scan rate of 10 mV·s−1.
EIS was performed for all the MFCs using the anode as the working electrode and the cathode as the counter electrode. The frequency range of the applied AC signal was 103 kHz to 10 mHz and the amplitude of the applied signal was 10 mV. EC-lab® software (V10.40, BioLogic, Seyssinet-Pariset, France) was used for analysis of EIS data.
COD removal was measured with a Hach (Loveland, CO, USA) COD digester (DRB 200) and colorimeter (DR 900). Liquid samples from anodes of all the MFCs were collected every 7 days and were added to a pre-measured standard digester solution from the same company, followed by heating at 150 °C in the block digester. The tubes were allowed to cool to room temperature. COD of the solutions was measured spectrophotometrically at 420 nm in triplicate []. The samples were diluted by a factor of 20 before measurements.
2.4. Microbial Inoculum Preparation
The anode inoculum source for these MFCs was activated sludge collected from a wastewater treatment plant in Calgary, Alberta, Canada. Coleville synthetic brine medium (CSBK) was used as a minimal medium for microbial growth []. Sodium acetate (10 mM) was used as the electron donor. Five percent of this enriched sludge sample was used to inoculate the anode. A phosphate buffer (neutral pH) was added as the catholyte. The anode chamber was continuously stirred to maintain homogeneous conditions. Nitrogen was sparged in the anode to maintain anaerobic conditions while O2 gas was bubbled for the cathode reaction.
2.5. Microbial Community Analysis
The anode inoculum was analyzed for microbial community composition at the start and termination of MFC reactor operation to understand the evolution of the microbial community population during MFC operation. Samples were collected both from biofilm deposited on the surface of the anode material (sessile community) and the liquid electrolyte (planktonic community), followed by total genomic DNA extraction using a commercial kit (Fast DNATM Spin Kit for Soil, MP Biomedicals). Fluorometry was used for quantification of DNA and PCR products. A two-step PCR process, as described in previous studies [,], followed, in which the first PCR step targeted the V6–V8 hypervariable region of the 16S rRNA gene, using 926Fi5 and 1392Ri7 primers. The second PCR protocol was done for 8 cycles, using the barcoded primers P5-S50X-OHAF and P7-N7XX-OHAF. The final DNA concentration of the second set of PCR products was normalized to 4 ng/µL, pooled, and sequenced using the Illumina MiSeqTM platform at the Alberta Children’s Hospital Research Institute (Calgary, AB, Canada) [,]. The raw reads obtained from sequencing were processed using MetaAmp, an open-source amplicon analysis pipeline [,]. Following quality control, sequencing data were clustered into operational taxonomic units (OTUs), based on a minimum of 97% sequence identity. OTUs representing 1% or more of the total read relative abundance were used to compare changes in microbial community composition over the course of the experiment.
2.6. Scanning Electron Microscopic (SEM) Analysis
Scanning electron microscopy was performed to compare the change in the morphology of the coated and uncoated electrodes at the beginning and termination of the experiment and to assess the morphology of biofilm formed on the surface of these electrode materials at the end of the experiment. Plain carbon paper and carbon paper coated with Fe2O3 were used as sterile control samples for SEM. Anode electrodes from all three MFCs were taken out after MFC operation for biofilm formation studies. Small portions from each electrode were cut and analyzed further for SEM. Preparatory steps involved immersion in 2.5% glutaraldehyde and 0.1 M phosphate buffer solution, followed by dehydration using increasing ethanol concentrations (30–100%) [,]. This was followed by drying of the samples under a stream of N2 gas and sputter coating with a thin layer (approximately 3 nm) of gold under a vacuum (BAL-TEC SCD 500 sputter coater) to neutralize the charging effects. The electrodes were visualized using a scanning electron microscope (FEI Quanta 250 FEG field emission scanning electron microscope) with an acceleration voltage of 10 kV.
3. Results and Discussion
3.1. Performance of MFCs
MFCs were continuously monitored for open circuit potential and power generation at room temperature (approximately 25 °C). Three experimental setups with different electrode coating materials, as described below, were analyzed and operated for 35 days. PD, CV, and EIS were monitored for three cycles (cycles 1, 2, and 3), as described in Section 2.3. MFCs were first operated under abiotic conditions and no substantial power was observed, due to the absence of microorganisms (biocatalysts). Polarization curves (Figure 1) were obtained immediately after adding the anode inoculum (cycle 1) under stabilized OCP conditions. Power density values for cell A (Figure 1A), cell B (Figure 1B), and cell C (Figure 1C) were recorded as 0.0082 mW·m−2, 14.65 mW·m−2, and 2.07 mW·m−2, respectively. The PD values for subsequent cycles in the same order were recorded as 6.72 mW·m−2, 73.16 mW·m−2, and 30.81 mW·m−2 for cycle 2, and 0.0815 mW·m−2, 14.68 mW·m−2, and 16.24 mW·m−2 for cycle 3. The highest PD values for all the cells were obtained during cycle 2, however, the performance of all of these reactors decreased during cycle 3. This could be the result of efficient colonization and biofilm formation during the operation period between cycles 1 and 2. This phenomenon can be better understood by further analyzing the EIS and CV results.
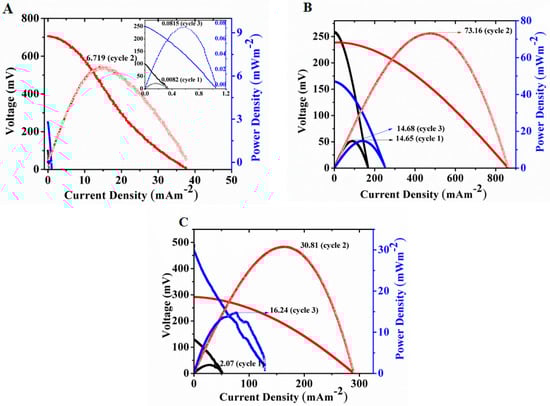
Figure 1.
Polarization curves for cell (A) (C-C), (B) (Fe2O3–Pt) and (C) (Fe2O3–Fe2O3).
CV results suggested improved reduction–oxidation currents and EIS showed decreased cell resistance for cycle 2 than for cycle 1 (Figures 3 and 4). These data lead to the understanding of cell behavior over time. A decreasing pattern of PD values and increased impedance during cycle 3 also suggest an increased interfacial resistance between the biofilm and electrode, which may be due to thicker and aged biofilm, and depletion of available substrates by electroactive biofilm members present in the reactor. Additionally, CV analysis did not demonstrate any notable improvement in the range of currents associated with biofilm in the third cycle, as compared to previous ones in all three reactor combinations. The PD values remained the lowest for all three cycles of the C-C system, which can be attributed to the uncoated anode and cathode material, leading to less efficient power production from the MFC.
The initial hydrophobic nature of the bare electrode makes it difficult for the microbes to attach to and form a biofilm on the surface of the electrode, affecting the cell’s performance. Efficient power production in an MFC can also be limited by the slow reaction kinetics and electron acceptance rate in the cathode []. Therefore, ORR reaction without any catalyst certainly reduces power generation in a fuel cell. The PD values for the highest power generating cycle (cycle 2) were 78% and 90% better, respectively, for cell C (Figure 1C) and cell B (Figure 1B) when compared to cell A (Figure 1A). Although, the PD for MFC B with Fe2O3–Pt coated electrode was 58% higher than MFC C with Fe2O3–Fe2O3 electrode, it still proved to be useful as a catalyst, both for the anode and cathode, as it provided much better results, compared to unmodified electrodes. The electrocatalytic properties, high surface area, and biocompatibility of Fe2O3 [] have made it a useful material for electrode coating. Iron is a well-known electron acceptor in microbial metabolism and can act as an electron shuttle, improving electron transfer kinetics. Municipal sludge inoculum contains a heterogeneous population of microorganisms, as described in later sections, and some of the members of this community may be capable of utilizing Fe (III) as an electron shuttle, improving power generation.
Previous works [] were mostly focused on describing cathode catalysts for ORR reactions, but the study of anode catalysts is an under-explored area of research. Zhisheng et al. [] reported a ruthenium oxide-coated carbon felt electrode as an anode material and compared the effects of applied charge for electrodeposition of RuO2. A high PD of 1.06 W·m−2 was obtained with an applied charge of 30 C cm−2, using a mixed microbial consortium []. Coating of gold (Au) and palladium (Pd) nanoparticles on graphite anode was reported by Fan et al. [], where Au- and Pd-decorated anodes generated maximum CDs of 74.4 µA·cm−2 and 8.8 µA·cm−2, respectively, compared to plain graphite anodes (3.6 µA·cm−2) []. A recent study describing Fe/Fe2O3 electrodeposition on carbon cloth reported a PD of 200 mW·m−2 []. Electrodeposition of NiFeP nanostructures on carbon felt has shown about a five-fold improvement in PD value, measuring 260 ± 8 mW·m−2, with respect to the control in a yeast-based biofuel cell []. Anodes modified with Pd, MnO2, and Fe3O4 nanoparticles have been shown to provide high power density values ranging between 700 and 800 mW·m−2 in MFCs []. The microbial community analysis results of this study showed high abundance of electrogenic Geobacter which produced high power density values []. Gold-sputtered carbon paper as the anode generated a maximum CD of 135 mA·m−2, and sustained the current above 50 mA·m−2 for more than 100 h using well-known exoelectrogen, Shewanella oneidensis []. Use of carbon felt [] and the presence of electrogenic microorganisms [] often resulted in better performance of MFCs, due to increased surface area of the electrode and efficient conversion of the substrate to electrical energy, respectively. The CD values reported in literature vary widely from µA to A, normalized by projected surface area [,,]. The optimum CD in the present study ranged from 15 mA·m−2 (cell A) to 500 mA·m−2 (cell B) and 160 mA·m−2 (cell C), which are comparable to some of the studies reported. The PD values can be further improved by in-depth understanding of the effect of coating material, its concentration, composition, and its corresponding role in microbial stimulation after dose optimization.
3.2. COD Removal Efficiency
COD removal for all three cells was measured for 35 days (Figure 2). The COD for all the cells was the same initially (6000 mg·L−1). A steady removal rate for all the anodes was observed. COD removal for cell A was much less than that for both cells B and C, again indicating the enhancement of diverse microbial populations. The final COD removal efficiency reached about 60% for cell B, 51% for cell C, and 39% for cell A. The lower removal efficiency for the unmodified electrode was obvious, due to less bio-catalytic activity, as well as limited ORR in the cathode. The number of electrons available to the cathode for ORR and the efficiency with which they are being utilized by the cathode influence the efficiency of COD removal []. Performance of cells B and C was not very discrete throughout the operational cycles, as seen in Figure 2. Usage of Fe2O3 as the anode coating material for reactors B and C led to the development of quite similar and efficient electroactive biofilm formation, but the difference in performance also suggests that the electron acceptance and utilization rate during ORR in the cathode was more efficient with the Pt catalyst, compared to Fe2O3.
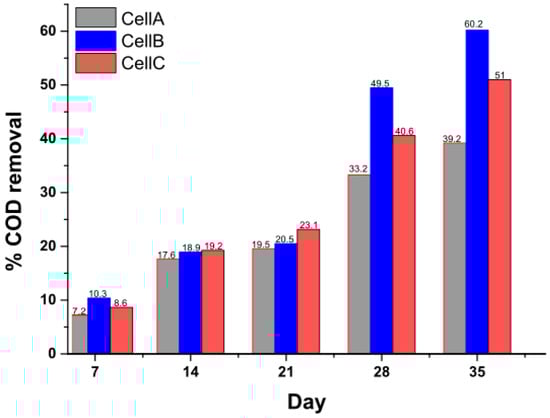
Figure 2.
COD removal efficiency (%) for cell (A) (C-C), (B) (Fe2O3–Pt), and (C) (Fe2O3–Fe2O3) as a function of time.
3.3. Cyclic Voltammetry
Cyclic voltammetry of all three cells was performed in situ (anode) with a three-electrode configuration. The results were compared between cells A, B, and C during the course of the experiment through cycles 1 to 3. The non-coated electrode for cell A showed no substantial reduction–oxidation current in cycle 1, whereas electrodes for cells B and C exhibited similar curve properties, as the anode coating for both cells was the same (Figure 3). CV showed higher electrochemical activity of the biofilms for cells B and C that appeared gradually with bacterial adhesion on the electrode and biofilm development. The peak currents reached (+) 4 mA (1.06 × 10⁴ mA·m−2) and (−) 4 mA (−1.06 × 10⁴ mA·m−2) during cycle 2 for both cells, compared to (+) 2.5 mA (6.6 × 10³ mA·m−2) and (−) 3 mA (−8 × 10³ mA·m−2) during cycle 1. The reduction current for C-C electrodes was increased to −0.7 mA (−1.8 × 10³ mA·m−2) and −0.8 mA (−2.1 × 10³ mA·m−2) during cycles 2 and 3. Therefore, the increase in peak current values and capacitive behavior of Fe2O3 anodes in comparison to the unmodified carbon anode suggest better bio-catalytic activity of the coated electrode towards substrate utilization, as well as corresponding sludge degradation and power generation.
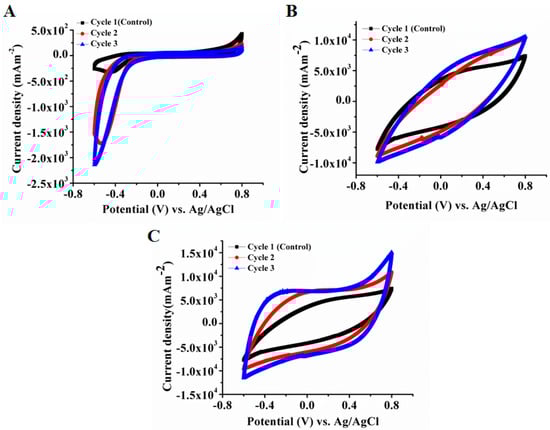
Figure 3.
CV analysis for cells (A) (C-C), (B) (Fe2O3–Pt) and (C) (Fe2O3–Fe2O3). The scan rate for CV analysis was 10 mV·s−1.
3.4. EIS Analysis
The Nyquist plots for all three configurations were analyzed for control and experimental reactors (Figure 4). The high frequency intercept with the x-axis demonstrates the ohmic resistance of the cell, whereas the magnitude of the Nyquist arc corresponds to total resistance []. Quantification of charge transfer, mass transfer, and ohmic limitations for each component of the MFC can be achieved by an EIS method, using the appropriate equivalent circuit model []. The R1 in the equivalent circuit represents ohmic resistance (RΩ), which comprises different factors, such as solution resistance, electrode resistance, and membrane resistance []. The low-frequency intercept on the x-axis is attributed to the total impedance of the cell, which includes anode and cathode resistance, in addition to RΩ. Impedance for the unmodified C-C electrode was very high (151 KΩ), as calculated from the equivalent circuit (Figure 4D). Values of different circuit elements after fitting to the equivalent circuit model (ECM) (Figure 4D) are presented in Table 1. However, after biofilm development, the high frequency resistance reduced significantly during cycle 2 (156 Ω) and increased further during cycle 3 (1279 Ω). The total resistance values of cell A in cycles 2 and 3 were 49 KΩ and 54 KΩ respectively. The pattern of decrease in cell polarization during cycle 2, and again, of increase during cycle 3, compared to cycle 2, was consistent with all the cells, regardless of the fact that the resistance values were much less in cells B and C. Total resistance for cells B and C were about 3000 Ω but reduced to 262 Ω and 203 Ω, respectively during cycle 2. Total resistance for cells B and C during cycle 3 were 336 Ω and 1083 Ω. The actual capacitance value (C) for each fitted arc was calculated from the equation , where R is the resistance, Q is the pseudo-capacitance, and n is an additional parameter, and all these fitting parameters were extracted from the ECM [,,,]. These findings suggest that resistance of the unmodified electrode was much higher than the Fe2O3-coated electrode, even without any biofilm formation, but the biofilm formation on the electrode decreased the resistance quite significantly after a period of 15 days. The charge transfer resistance (Rct) values decreased significantly after 15 days of operation (cycle 2) for all the cells. This indicates that microbial activity can be an important factor affecting the kinetics of electrochemical reactions happening on the electrode surface []. The range of capacitance values (10−7–10−3 Farad) indicates that the change of resistance in high- and low-frequency regions are due to the sample-electrode interface [] and electrode process []. This signifies the effect of catalyst coating on the electrode surface, improving charge transfer rate from biofilm to the electrode surface. The results for Fe2O3-coated electrodes were better, due to more efficient biofilm formation, as suggested by power density, CV, and EIS results. As the ohmic resistance of different cells did not vary much throughout the cell cycles, it is likely that the enhanced resistivity observed over time was due to the thicker and aged biofilm, thereby reducing the efficiency of electron transport to the electrode. Electrode and membrane fouling with time may contribute to this enhanced resistance of the cells, as well as the decreases in power densities.
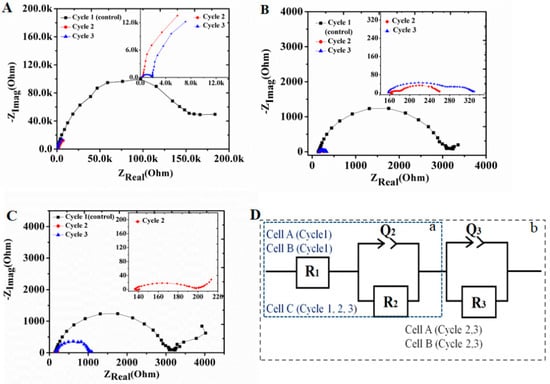
Figure 4.
Electrochemical impedance plots of cells (A) (C-C), (B) (Fe2O3–Pt) and (C) (Fe2O3–Fe2O3). (D): Equivalent circuit model (ECM) used to fit experimental data; a: ECM with single constant phase element, a + b: double constant phase element.

Table 1.
Values of different circuit elements after fitting Nyquist plots to the equivalent circuit model (ECM).
3.5. Microbial Community Analysis
Activated sludge was used as the microbial inoculum for this study. As it is a heterogeneous source of microorganisms, a diverse community belonging to the Firmicutes, Proteobacteria, and Chloroflexi phyla was identified, as shown in Figure 5. In cell A, the community was dominated by members of the bacterial family Peptostreptococcaceae in both the planktonic and biofilm fractions (41.48% and 42.43%, respectively). In cells B and C, the community shifted from that of the non-coated anode (cell A), reducing the population of Firmicutes, while enhancing the growth of Gammaproteobacteria and methanogens. After the end of MFC operation, cell A was dominated by Xanthomonadaceae, Turicibacter, Peptostreptococcaceae, Clostridium, Bacillus, and Pseudomonas while Fe2O3-coated electrodes in cells B and C showed a predominance of Xanthomonadaceae, Methanosaeta, Peptostreptococcaceae, Proxilibacteraceae, Bacteriodetes, and Rhodanobacteraceae. Methanosaeta, Anaerolineaceae, and Methanolinea were present in all fractions, except the planktonic population of cell A. An increase in the population of methanogens and anaerobic fermenters was found to be consistent for all the MFCs, as they were operated under anaerobic conditions. The predominance of methanogens limits power production by conversion of a carbon substrate to methane and can be a limiting factor for lower power generation in the MFCs studied.
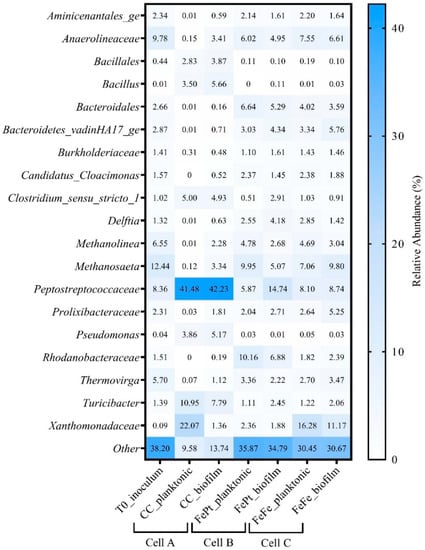
Figure 5.
16S rRNA gene sequencing results to assess changes in microbial community composition over the course of the MFC experiment. Taxa with a relative abundance greater than 1% were described; those taxa less than 1% were grouped in the category “other”. T0 inoculum was composed of an enrichment of activated sludge, sampled from a wastewater treatment plant, of which 5% (by volume) was used to inoculate each of the three reactors. Two fractions were analyzed for microbial community composition from each reactor in duplicate, including a liquid (planktonic) fraction and a solid (sessile or biofilm) fraction.
An increase in the taxa Rhodanobacteraceae, Bacteroidales, Bacteroidetes vadin HA17, and Anaerolineaceae was observed in all coated anodes, compared to the unmodified anode. They were previously reported as prevalent communities in a swine wastewater-fed MFC []. The microbial community associated with the Fe2O3 anodes did not contain an abundance of known iron-reducers, although not all organisms capable of iron reduction are completely characterized (e.g., Bacteroidetes vadin HA17). Delftia is related to the genus Pseudomonas (some strains of which can reduce iron and important biofilm former) and was present at a relative abundance of 1.4–4%, but has not been reported as an iron reducer. Prolixibacteraceae, reported to be involved in iron (Fe0)-related redox metabolisms [], was also found in the community of Fe2O3-coated electrodes with a relative abundance of 2–5.25%. The relative abundances of these taxa signify that these environmental bacterial communities may play some role in utilizing iron during electron mediation, but this warrants future investigations.
3.6. Morphological Analysis (SEM)
SEM images of the bare carbon electrode, the Fe2O3-coated carbon electrode, and the three electrodes with intact biofilms were analyzed (Figure 6). The developed biofilms showed different morphological characteristics, confirming the heterogeneous nature of the microbial population in the sludge. The biofilm on the unmodified carbon electrode was more diverse morphologically than the biofilm on the coated electrode. This suggests that the biofilm developed on coated electrodes may be of a specific type, enriched to utilize Fe (III) as electron mediator. Fe (III) can be utilized as an electron shuttle by the diverse groups of bacteria in complex organics, such as activated sludge. Involvement of the described communities in metal compound utilization is not very well studied so far and needs to be elucidated further.
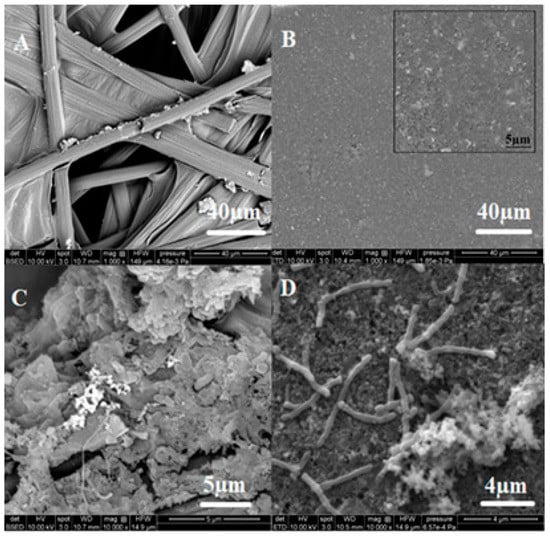
Figure 6.
SEM analysis of (A) bare carbon electrode. (B) Carbon electrode coated with Fe2O3, inset showing magnified view of the coated electrode. (C) Biofilm on uncoated carbon electrode. (D) Biofilm on Fe2O3-coated carbon electrode.
4. Conclusions
Improving anode function is one of the key parameters for improved MFC performance. This study reports Fe2O3 as a coating material of electrodes (both anode and cathode) and its performance was compared to a bare electrode (with only a carbon anode and cathode) and a conventional platinum catalyst cathode (Fe2O3 anode and Pt cathode). The maximum power density obtained with Fe2O3 was 30.81 mW·m−2, which was 78% more than the bare carbon electrode. The PD values with Fe2O3 in anode and Pt in the cathode were better (73.16 mW·m−2), but the results with Fe2O3-coating are promising. Detailed research on the activity of cathode catalysts needs to be carried out to explore further optimization processes for Fe2O3 as a non-platinum-based low-cost catalyst. The microbial community analysis revealed the abundance of methanogens, which may have limited the power output in the MFCs. Morphological and electrochemical analysis like SEM, EIS, and CV demonstrated efficient bacterial adhesion, lower resistance, and capacitive behavior of the Fe2O3-coated electrode. These are the significant factors that likely contributed towards an efficient electron transfer process between the electrodes and biofilm, improving power output, compared to the non-coated electrode.
Author Contributions
The work was conceptualized by A.N. and M.S. All the experimental investigations and formal Analysis were done collaboratively by A.N.; M.S.; N.T.; and S.V.V. A.N. was responsible for all data curation while N.T. did the microbial community analysis. A.N. and M.S. analyzed the acquired data. Original Draft was prepared by A.N. while thorough review and editing was done by M.S.; N.T.; S.V.V.; L.G.; and V.T., L.G. and V.T. were responsible for project supervision and administration as well as funding acquisition.
Funding
This research was funded by Canada First Research Excellence Fund [CFREF], as part of Global Research Initiative in Sustainable Low Carbon Unconventional Resources (GRI) at University of Calgary and Natural Sciences and Engineering Research Council of Canada (NSERC) through discovery grants to V.T. (Award number: RGPIN-2016-03853). M.S. and L.G. acknowledge MITACS in partnership with Shell for the MITACS Elevate fellowship award 2018–2020 (grant number IT11525) and Genome Canada.
Conflicts of Interest
The authors declare no conflict of interest.
References
- Logan, B.E.; Hamelers, B.; Rozendal, R.; Schroder, U.; Keller, J.; Freguia, S.; Aelterman, P.; Verstraete, W.; Rabaey, K. Microbial fuel cells: Methodology and technology. Environ. Sci. Technol. 2006, 40, 5181–5192. [Google Scholar] [CrossRef] [PubMed]
- Bajracharya, S.; Sharma, M.; Mohanakrishna, G.; Benneton, X.D.; Strik, D.P.; Sarma, P.M.; Pant, D. An overview on emerging bioelectrochemical systems (BESs): Technology for sustainable electricity, waste remediation, resource recovery, chemical production and beyond. Renew Energy 2016, 98, 153–170. [Google Scholar] [CrossRef]
- Waller, M.G.; Trabold, T.A. Review of Microbial Fuel cells for wastewater treatment: Large-Scale Applications, future Needs and current Research gaps. In Proceedings of the ASME 2013 7th International Conference on Energy Sustainability & 11th Fuel Cell Science, Minneapolis, MN, USA, 14–19 July 2013. [Google Scholar]
- Nandy, A.; Kumar, V.; Mondal, S.; Dutta, K.; Salah, M.; Kundu, P.P. Performance evaluation of microbial fuel cells: Effect of varying electrode configuration and presence of a membrane electrode assembly. New Biotechnol. 2015, 32, 272–281. [Google Scholar] [CrossRef] [PubMed]
- Nandy, A.; Kundu, P.P. Configurations of Microbial Fuel Cells. In Progress and Recent Trends in Microbial Fuel Cells, 1st ed.; Dutta, K., Kundu, P.P., Eds.; Elsevier: Amsterdam, The Netherlands, 2018; p. 464. ISBN 9780444640185. [Google Scholar]
- Li, X.; Hu, B.; Suib, S.; Lei, Y.; Li, B. Manganese dioxide as a new cathode catalyst in microbial fuel cells. J. Power Source 2010, 195, 2586–2591. [Google Scholar] [CrossRef]
- Zuo, Y.; Cheng, S.; Logan, B.E. Ion exchange membrane cathodes for scalable microbial fuel cells. Environ. Sci. Technol. 2008, 42, 6967–6972. [Google Scholar] [CrossRef]
- Aelterman, P.; Versichele, M.; Marzorati, M.; Boon, N.; Verstraete, W. Loading rate and external resistance control the electricity generation of microbial fuel cells with different three-dimensional anodes. Bioresour. Technol. 2008, 99, 8895–8902. [Google Scholar] [CrossRef]
- Sharma, M.; Sarma, P.M. Microbially Mediated Electrosynthesis Processes. In Microbial Fuel Cell, 1st ed.; Das, D., Ed.; Springer: Berlin, Germany, 2018; pp. 421–442. ISBN 978-3-319-66793-5. [Google Scholar]
- Schröder, U. Anodic electron transfer mechanisms in microbial fuel cells and their energy efficiency. Phys. Chem. Chem. Phys. 2007, 9, 2619–2629. [Google Scholar] [CrossRef]
- Jang, J.K.; Pham, T.H.; Chang, I.S.; Kang, K.H.; Moon, H.; Kim, B.H. Construction and operation of a novel mediator- and membrane-less microbial fuel cell. Process Biochem. 2004, 39, 1007–1012. [Google Scholar] [CrossRef]
- Pham, T.H.; Jang, J.K.; Chang, I.S.; Kim, B.H. Improvement of cathode reaction of a mediatorless microbial fuel cell. Microbiol. Biotechnol. 2004, 14, 324–334. [Google Scholar]
- Mohamed, H.O.; Obaid, M.; Poo, K.M.; Abdelkareem, M.A.; Talas, S.A.; Fadali, O.A.; Kim, H.Y.; Chae, K.J. Fe/Fe2O3 nanoparticles as anode catalyst for exclusive power generation and degradation of organic compounds using microbial fuel cell. Chem. Eng. J. 2018, 349, 800–807. [Google Scholar] [CrossRef]
- Xu, H.; Quan, X.; Xiao, Z.; Chen, L. Effect of anodes decoration with metal and metal oxides nanoparticles on pharmaceutically active compounds removal and power generation in microbial fuel cells. Chem. Eng. J. 2018, 335, 539–547. [Google Scholar] [CrossRef]
- Wei, J.; Liang, P.; Huang, X. Recent progress in electrodes for microbial fuel cells. Bioresour. Technol. 2011, 102, 9335–9344. [Google Scholar] [CrossRef]
- Zhisheng, L.; Daohai, X.; Xianjun, Y.; Chunhua, F.; Chaohai, W. Ruthenium oxide-coated carbon felt electrode: A highly active anode for microbial fuel cell applications. J. Power Source 2012, 210, 26–31. [Google Scholar] [CrossRef]
- Feng, C.; Ma, L.; Li, F.; Mai, H.; Lang, X.; Fan, S. A polypyrrole/anthraquinone-2, 6-disulphonic disodium salt (PPy/AQDS)-modified anode to improve performance of microbial fuel cells. Biosens. Bioelectron. 2010, 25, 1516–1520. [Google Scholar] [CrossRef]
- Adachi, M.; Shmomura, T.; Komatsu, M.; Yakuwa, H.; Miya, A. A novel mediator–polymer-modified anode for microbial fuel cells. Chem. Commun. 2008, 7, 2055–2057. [Google Scholar] [CrossRef]
- Park, D.H.; Zeikus, J.G. Impact of electrode composition on electricity generation in a single-compartment fuel cell using Shewanella putrefaciens. Appl. Microbiol. Biotechnol. 2002, 59, 58–61. [Google Scholar] [CrossRef]
- Wang, K.; Liu, Y.; Chen, S. Improved microbial electrocatalysis with neutral red immobilized electrode. J. Power Source 2011, 196, 164–168. [Google Scholar] [CrossRef]
- Peng, L.; You, S.; Wang, J. Carbon nanotubes as electrode modifier promoting direct electron transfer from Shewanella oneidensis. Biosens. Bioelectron. 2010, 25, 1248–1251. [Google Scholar] [CrossRef]
- Xie, X.; Hu, L.; Pasta, M.; Wells, G.F.; Kong, D.; Criddle, C.S.; Cui, Y. Three-dimensional carbon nanotube-textile anode for high-performance microbial fuel cells. Nano Lett. 2011, 11, 291–296. [Google Scholar] [CrossRef]
- Lu, Z.; Chang, D.; Ma, J.; Huang, G.; Cai, L.; Zhang, L. Behavior of metal ions in bioelectrochemical systems: A review. J. Power Sources 2015, 275, 243–260. [Google Scholar] [CrossRef]
- Sun, M.; Zhang, F.; Tong, Z.H.; Sheng, G.P.; Chen, Y.Z.; Zhao, Y.; Chen, Y.P.; Zhou, S.Y.; Liu, G.; Tian, Y.C. A gold-sputtered carbon paper as an anode for improved electricity generation from a microbial fuel cell inoculated with Shewanella oneidensis MR-1. Biosens. Bioelectron. 2010, 26, 338–343. [Google Scholar] [CrossRef] [PubMed]
- Michaelidou, U.; Heijne, A.T.; Euverink, G.J.W.; Hamelers, H.V.M.; Alfons, J.M.; Stams, A.J.M.; Geelhoed, J.S. Microbial communities and electrochemical performance of titanium-based anodic electrodes in a microbial fuel cell. Appl. Environ. Microbiol. 2011, 77, 1069–1075. [Google Scholar] [CrossRef]
- Hubenova, Y.; Rashkov, R.; Buchvarov, V.; Babanova, S.; Mitov, M. Nanomodified NiFe- and NiFeP-carbon felt as anode electrocatalysts in yeast-biofuel cell. J. Mater. Sci. 2011, 46, 7074–7081. [Google Scholar] [CrossRef]
- Liu, H.; Logan, B.E. Electricity generation using an air-cathode single chamber microbial fuel cell in the presence and absence of a proton exchange membrane. Environ. Sci. Technol. 2004, 38, 4040–4046. [Google Scholar] [CrossRef] [PubMed]
- Martin, E.; Tartakovsky, B.; Savadogo, O. Cathode materials evaluation in microbial fuel cells: A comparison of carbon, Mn2O3, Fe2O3 and platinum materials. Electrochim. Acta 2011, 58, 58–66. [Google Scholar] [CrossRef]
- Clauwaert, P.; Aelterman, P.; Pham, T.H.; Schamphelaire, L.D.; Carballa, M.; Rabaey, K. Minimizing losses in bio-electrochemical systems: The road to applications. Appl. Microbiol. Biotechnol. 2008, 79, 901–913. [Google Scholar] [CrossRef]
- Tran, H.T.; Ryu, J.H.; Jia, Y.H.; Oh, S.J.; Choi, J.Y.; Park, D.H. Continuous bioelectricity production and sustainable wastewater treatment in a microbial fuel cell constructed with non-catalyzed granular graphite electrodes and permeable membrane. Water Sci. Technol. 2010, 61, 1819–1827. [Google Scholar] [CrossRef] [PubMed]
- Sharma, M.; Jain, P.; Varanasi, J.L.; Lal, B.; Rodríguez, J.; Lema, J.M.; Sarma, P.M. Enhanced performance of sulfate reducing bacteria based biocathode using stainless steel mesh on activated carbon fabric electrode. Bioresour. Technol. 2013, 150, 172–180. [Google Scholar] [CrossRef] [PubMed]
- Zhao, F.; Harnisch, F.; Schröder, U.; Scholz, F.; Bogdanoff, P.; Herrmann, I. Application of pyrolysed iron(II) phthalocyanine and CoTMPP based oxygen reduction catalysts as cathode materials in microbial fuel cells. Electrochem. Commun. 2005, 7, 1405–1410. [Google Scholar] [CrossRef]
- Yu, E.H.; Cheng, S.; Scott, K.; Logan, B.E. Microbial fuel cell performance with non-Pt cathode catalysts. J. Power Source 2007, 171, 275–281. [Google Scholar] [CrossRef]
- Surowieca, Z.; Gac, W.; Wiertela, M. The synthesis and properties of high surface area Fe2O3 materials. Acta Phys. Pol. A 2011, 119, 18–20. [Google Scholar] [CrossRef]
- Choi, J.D.R.; Chang, H.N.; Han, J.I. Performance of microbial fuel cell with volatile fatty acids from food wastes. Biotechnol. Lett. 2011, 33, 705–714. [Google Scholar] [CrossRef] [PubMed]
- Callbeck, C.M.; Agrawal, A.; Voordouw, G. Acetate production from oil under sulfate-reducing conditions in bioreactors injected with sulfate and nitrate. Appl. Environ. Microbiol. 2013, 9, 5059–5068. [Google Scholar] [CrossRef] [PubMed]
- Sharma, M.; An, D.; Liu, T.; Pinnock, T.; Cheng, F.; Voordouw, G. Biocide-mediated corrosion of coiled tubing. PLoS ONE 2017, 12, e0181934. [Google Scholar] [CrossRef] [PubMed]
- Sharma, M.; Menon, P.; Voordouw, J.; Shen, Y.; Voordouw, G. Effect of long term application of tetrakis(hydroxymethyl)phosphonium sulfate (THPS) in a light oil-producing oilfield. Biofouling 2018, 34, 605–617. [Google Scholar] [CrossRef] [PubMed]
- Dong, X.; Kleiner, M.; Sharp, C.E.; Thorson, E.; Li, C.; Liu, D.; Strous, M. Fast and simple analysis of MiSeq amplicon sequencing data with MetaAmp. Front. Microbiol. 2017, 8, 1–8. [Google Scholar] [CrossRef]
- Zhang, J.; Kobert, K.; Flouri, T.; Stamatakis, A. PEAR: A fast and accurate Illumina Paired-End reAd mergeR. Bioinformatics 2014, 30, 614–620. [Google Scholar] [CrossRef]
- Xu, S.; Liu, H. New exoelectrogen Citrobacter sp. SX-1 isolated from a microbial fuel cell. J. Appl. Microbiol. 2011, 111, 1108–1115. [Google Scholar] [CrossRef]
- Sharma, M.; Sarma, P.M.; Pant, D.; Dominguez-Benetton, X. Optimization of electrochemical parameters for sulfate-reducing bacteria (SRB) based biocathode. RSC Adv. 2015, 5, 39601–39611. [Google Scholar] [CrossRef]
- Fan, Y.; Xu, S.; Schaller, R.; Jiao, J.; Chaplen, F.; Liu, H. Nanoparticle decorated anodes for enhanced current generation in microbial electrochemical cells. Biosens. Bioelectron. 2011, 26, 1908–1912. [Google Scholar] [CrossRef]
- Borole, A.P.; Aaron, D.; Hamilton, C.Y.; Tsouris, C. Understanding long-term changes in microbial fuel cell performance using electrochemical impedance spectroscopy. Env. Sci. Technol. 2010, 44, 2740–2745. [Google Scholar] [CrossRef]
- He, Z.; Mansfeld, F. Exploring the use of electrochemical impedance spectroscopy (EIS) in microbial fuel cell studies. Energy Environ. Sci. 2009, 2, 215–219. [Google Scholar] [CrossRef]
- Li, Q.; Thangadurai, V. Synthesis, structure and electrical properties of Mo-doped CeO2–materials for SOFCs. Fuel Cells 2009, 5, 684–698. [Google Scholar] [CrossRef]
- Li, Q.; Xia, T.; Liu, X.D.; Ma, X.F.; Meng, J.; Cao, X.Q. Fast densification and electrical conductivity of yttria-stabilized zirconia nanoceramics. Mater. Sci. Eng. B 2007, 138, 78–83. [Google Scholar] [CrossRef]
- Marrero-López, D.; Ruiz-Morales, J.C.; Núñez, P.; Abrantes, J.C.C.; Frade, J.R. Synthesis and characterization of La2Mo2O9 obtained from freeze-dried precursors. J. Solid State Chem. 2004, 177, 2378–2386. [Google Scholar] [CrossRef]
- Chinarro, E.; Jurado, J.R.; Figueiredo, F.M.; Frad, J.R. Bulk and grain boundary conductivity of Ca0.97Ti1−xFexO3−δ materials. Solid State Ion. 2003, 160, 161–168. [Google Scholar] [CrossRef]
- Sinclair, D.C. Characterization of electro-materials using AC impedance spectroscopy. Bol. Soc. Esp. Cerám. Vidr. 1995, 34, 55–65. [Google Scholar]
- Khilyas, I.V.; Sorokin, A.A.; Kiseleva, L.; Simpson, D.J.W.; Fedorovich, V.; Sharipova, M.R.; Kainuma, M.; Cohen, M.F.; Goryanin, I. Comparative metagenomic analysis of electrogenic microbial communities in differentially inoculated swine wastewater-fed microbial fuel cells. Scientifica 2017, 2017, 7616359. [Google Scholar] [CrossRef]
- Lino, T.; Sakamoto, M.; Ohkuma, M. Prolixibacter denitrificans sp. nov., an iron-corroding, facultatively aerobic, nitrate-reducing bacterium isolated from crude oil, and emended descriptions of the genus Prolixibacter and Prolixibacter bellariivorans. Int. J. Syst. Evol. Microbiol. 2015, 65, 2865–2869. [Google Scholar] [CrossRef]
© 2019 by the authors. Licensee MDPI, Basel, Switzerland. This article is an open access article distributed under the terms and conditions of the Creative Commons Attribution (CC BY) license (http://creativecommons.org/licenses/by/4.0/).