1. Introduction
China’s unprecedented socio-economic development and fast urbanization (see
Figure 1) has driven great expansion of residential buildings. As indicated in
Figure 1, the urbanization rate has been increasing steadily and rapidly from 36.22% in 2000 to 58.52% in 2017. The total Gross Domestic Production increased by approximately 7 times from 10.02 trillion Yuan in 2000 to 82.71 trillion Yuan in 2017. In accordance with the fast development of Gross Domestic Production (GDP) and urbanization rate, the area of residential buildings also increased dramatically. According to the data from the Nation Bureau of Statistics of China [
1], the area of new residential buildings under construction per year has been increasing by 17% per year on average, compared to the year 2000 level, and reached 12.50 billion square meters in 2014 (see
Figure 2). The area of new residential buildings under construction and constructed, after 2014, are leveling out around 12.5 billion square meters and 4.2 square meters, respectively. Along with the gradual improvement of living quality, fast increase of building area, and rapid urbanization, the energy consumption of residential buildings has also been increasing dramatically [
2,
3]. According to the data from Tsinghua University Building Energy Research Center, as indicated in
Figure 3, building energy consumption has increased by more than two times and reached 814 million tons of standard coal in 2014 whilst it was only 300 million tons of standard coal in 2000. During the same period, energy consumed by residential building rose to 301 million tons of standard coal in 2014 from 131 million tons of standard coal in 2000 [
4]. In 2015, energy consumed by residential buildings accounted for 19.10% of total energy consumption (see
Figure 4) [
5]. Excluding urban centralized heating in Northern China, the energy consumption in residential buildings increased to 199 million tons of standard coal in 2015, which is approximately three times the amount in 2001. Currently, the energy consumption of residential buildings is still growing rapidly. The World Bank predicts that the Chinese urbanization rate will be 70% by 2030 [
6]. Experience from developed countries shows that the building industry will account for 30% of annual global CO
2 emissions and 40% of total energy consumption in 2030 [
7].
The fast increase of energy consumption has not gone unnoticed and translates into the serious risk of China locking itself in with a large and energy-inefficient housing stock [
8]. According to the “13th-Five Year Plan of Building Energy Conservation and Green Building Development” (PLAN) published by China’s central government in 2016, all new residential buildings should be built to a standard of 72% energy efficiency (EE) level, compared with the 1980s level, and some advanced provinces have increased this requirement to 75%. Additional policy measures to ensure the realization of the targets have also been proposed by central and local governments, by eliminating the known barriers in the current policy system, stimulating market-based innovations, improving the capacity of stakeholders developing, and constructing high-performance projects (also known as “Capacity Building” in the China case), as well as accelerating the technology evolvement and its penetration into market. Notably, the EE promotion of new residential buildings is a complex socio-technical system [
9]. In addition to the homebuyers, the system involves a large variety of stakeholders concerned with policymaking, marketing, and technology, and it could be influenced by factors that include real estate, construction, buildings, and industry [
10,
11,
12]. The complexity of the system leads to a difficult question to answer—“
perceived by frontline stakeholders, what on earth has significant influence on the development of the EE promotion of new residential buildings?”, or in other words, whether these policy packages (or factors included in the policy packages) could affect the industry as expected or if the stakeholders within the industry would respond as assumed.
As for identifying the influencing factors, the existing literature have provided deep insights from both technology and management (policy, market, etc.,) perspectives [
11,
12,
13,
14]. The results in existing literature has provided abundant data for factor identification for the study, but they are discussed independently in different domains. A panoramic view and a systematic analysis of the new residential building energy efficiency promotion should take all the factors in all the domains into consideration. According to a review by De Boeck, research has tended to focus on the following domains: (1) Area of application and design variables, (2) objective and performance measures, (3) type of analysis [
15,
16,
17], (4) solution methodology, (5) software tools, (6) case study location, and (7) type of building [
18]. Regarding factors influencing the EE promotion of new residential buildings, domain 1 provides a classification of technology factors based on which EE promotion measure is applied and in which part the dwelling it is implemented. Five major groups of technology measures application and corresponding design variables are identified, namely the whole building, the construction parts of the envelope (roof, wall, ceiling, and floor), windows and shading, HVAC systems, and finally, appliance and lightning. Domain 2 and 4 stress the popularity of life cycle studies and indicate the importance of factor identification from life-cycle perspective. Chau et al. summarized the similarities and differences of three streams of life-cycle studies and briefly identified major influencing factors in the construction phase, operational phase, and dismantle/renovation phase [
19]. More detailed research regarding factor identification in these phases could be classified into two categories: Practice-based and evaluation system-based. The former focuses on factors of significant impacts in reality [
20,
21], while the latter pays attention to the factors included in various green building evaluation system, such as LEED (Leadership in Energy and Environmental Design), BREEAM (Building Research Establishment Environmental Assessment Method), or DGNB (German Sustainable Building Concil) [
22,
23,
24]. In addition, economic factors are often discussed with technology factors [
25]. For example, Shi et al. [
26] proposed a detailed influencing factors list concerning cost optimization, such as technology R&D cost, marketization cost, and labor cost, according to different stages of construction [
17].
From the management perspective, in addition to policy review [
27] and status quo [
28], research tends to focus on policy instrument evaluation and selection [
29], barriers analysis [
30,
31], and theoretical interacting mechanisms among stakeholders from the perspectives of governments and market. The policy instruments, barriers, and interaction mechanism between policy and markets all could be considered as influencing factors which should be collected in this paper, because they would affect the development of the EE promotion. Representatively, Shen et al. [
32] identified major policy instrument for building EE promotion and evaluated their influence based on the comparison of practice in seven countries and regions. Li et al. [
28] further analyzed the strengths and weaknesses of current policy instruments. As of barriers, Zhang et al. [
33] summarized those major ones and argued that deficiency existed in both policy system and market mechanism field. In addition to mandatory policies, economic incentives are also of great influence yet it is still lacking in current policy system [
34]. Market failures, mainly caused by information asymmetries and externalities of the industry, are identified as the major barriers causing the market to systematically underproduce green buildings [
35]. Compared with the relatively independent researches, Zou [
36] employed the system dynamics methodology to identify and analyze the risks that could affect building EE promotion market. Risks in six subsystems are involved, namely the laws and regulations, standards and specifications, economy, technology, policy, and education.
As for evaluating the significances of the identified factors, six techniques are of great popularity, namely the economic analysis, the sensitivity analysis, the scenario analysis, single objective optimization analysis, multi-objective optimization analysis, and statistical analysis [
18]. The economic analysis is always widely used for the evaluation of a certain technology [
15], and for analyzing the propagation of high-performance building technologies [
16]. The sensitivity analysis or the scenario analysis is always combined with other types of analysis [
37]. The selection between single-objective analysis and multi-objective analysis is normally based on the number of the factors to be discussed. The multi-objective optimization analysis helps identify those factors of significant influence in a complicated system and deals with the optimized choices for multiple objectives [
38], which is in line with the focus of this paper. Among the approaches to multi-objective optimization, the analytical hierarchy process (AHP) is widely used in the research regarding building EE promotion [
12,
39]. For example, Roberti et al. utilized the AHP process to determine the portfolio of optimal retrofits of historic building, by quantifying the intrinsically qualitative conservation compatibility of energy retrofits so that it could be analyzed along with the quantitively expressed energy savings and thermal comfort. This is also what the AHP is good at and the reason why it is adopted in this paper—the AHP provides a comprehensive and rational framework for structuring a decision problem, representing and quantifying its elements, relating those elements to overall goals, and evaluating alternative solutions [
40]. The specialty of AHP is its flexibility to be integrated with different techniques like linear programming, quality function deployment, fuzzy logic, and so forth. This enables the user to extract benefits from all the combined methods, and hence, achieve the desired goal in a better way [
41]. The AHP approach also has the flexibility to combine quantitative and qualitative factors, to handle different groups of actors, to combine the opinions expressed by many experts, and can help in stakeholder analysis [
42].
Notably, most current literature draw conclusions based on international experience [
43,
44], theoretical analysis [
36], or the development history [
33]. Despite the great contributions of existing literature, the actual perceptions by stakeholders to the influence of these factors remain insufficiently investigated and analyzed. The identification and the understanding of stakeholders’ requirements, expectations, and attitudes towards the influence of these factors are fundamental to the successful implementation of strategies to achieve a higher EE level [
45,
46]. Making decisions without considering stakeholders’ voices may lead to confrontation, dispute, disruption, boycott, distrust, and public dissatisfaction [
47]. The neglect, or insufficient consideration of stakeholders’ perceptions can lead to the cognitive bias of researchers and decisionmakers [
48], and further result in an unsatisfied policy implementation outcome [
49]. Defined by Von Winterfeldt and Edwards [
50], the cognitive bias is a systematic discrepancy between the “correct” answer in a judgmental task, given by a forma normative rule, and the decisionmaker’s or expert’s actual answer to such a task. When the biased information/perceptions are used for analysis or decision-making, the quality of modeling and resulting analysis will be seriously reduced. Accordingly, the perceived influences of various factors by frontline stakeholders contribute explanations to the gaps between the expected outcome of policy settings (“the ‘correct’ answer”) and the actual responses from stakeholders (“the ‘actual’ answer”), by presenting the responsive sensitivity of various stakeholders within the industry confronted with different settings of policy systems.
Contributing to the knowledge gap of the disaccord of perceptions of influencing factor between frontline stakeholders and researchers’ recognitions and the lack of stakeholders’ perceptions to the influence of factors, this paper aims to identify the factors of significant influence to the nationwide EE promotion of new residential buildings based on the lived experience perceived by relevant frontline stakeholders. Factors are collected through experts’ brainstorming and a literature review and are organized into three hierarchic levels according to the PLAN and the “Nested Policy Design Framework” proposed by Howlett [
51]. The short-term (until 2020) and long-term (from 2020 to 2030) significances of each factor are evaluated separately because 2020 is the final year of the 13th five-year plan and most international agreements that China has signed are effective till 2030. The corresponding evaluation process is accomplished by institutional questionnaires distributed nationwide to 32 institutes representing different interests. The final quantitative value of significance of each factor is determined by the results of the analytical hierarchy process (AHP). The corresponding results in each hierarchic level give a stereo and panoramic view of factors, perceived by frontline stakeholders, influencing the EE promotion of new residential buildings in China from the perspective of governance arrangement, policy regime logic, and policy instrument selection for a better policy design and the corresponding implementation outcome.
Specifically, this paper contributes to the literature by answering the following three questions:
(1)
What do stakeholders think in general? This was asked to elicit detailed descriptions of nationwide investigated stakeholders’ opinions regarding the identified factors (described in
Section 4.1);
(2)
What significantly affects the progress of the EE promotion of new residential buildings? This was asked to provide a thorough identification and to prioritize the influencing factors of the EE promotion of new residential buildings in China on the governance arrangement level, policy regime logic level, and policy instrument selection level on the basis of the AHP method (described in
Section 4.2 and
Section 4.3); compared with the existing literature regarding barriers, this question aims to explore factors both of positive and negative effects.
(3)
What will significantly affect the transformation of the EE promotion of new residential buildings in the future? This was asked to determine the factors of significant influence in both the short term and long term (described in
Section 4.4).
The complete structure and corresponding logic flow of this article is illustrated in
Figure 5. The remainder of this paper is organized as follows.
Section 2 introduces the novelty of this paper and the theoretical foundation for hierarchy construction, which are based on the nested policy design framework and the policy environment theory.
Section 3 presents the detailed process of factor collection, classification, and evaluation.
Section 4 summarizes the results of the data processing; discusses the weights and ranking of each criteria, sub-criteria, and factors to provide additional details on how the progress of the EE promotion in new residential buildings is affected; discusses the expectations regarding the situation in the long term; and discusses the achievements and limitations of this study.
Section 5 presents the conclusions and corresponding policy implications. By investigating frontline stakeholders, this paper depicts a panoramic and authentic picture of how the nationwide EE promotion of new residential buildings is affected and stimulated. The result helps eliminate the perception disaccord between researchers, policymakers, and frontline stakeholders, and further help them better understand the current situation and the transformation of the EE promotion of new residential buildings from stakeholders’ perspectives.
2. The Nested Policy Design Framework and the Policy Environment
The nested policy design framework, proposed by Howlett [
51], is a level-based policymaking approach concerning governance arrangement, policy regime, and policy instrument selection (see
Figure 6). Governance comprises actors from all segments of society working together to pursue collective goals [
52]. The general category of governance arrangements is legal-based, corporatist-based, market-based, or network-based. Governance arrangement can also be understood from the political (actor constellations), polity (policy regime logic/institutional property), and policy (policy instruments) [
53] dimensions. Types of governance arrangements result in different preferences of policy regime logic and policy instrument selection (see
Appendix Table A2).
In the case of China, Zhang, Zhou et al. [
52] conducted a detailed governance analysis based on the policy cycle theory raised by Howlett and Ramesh [
54] and argued that the legal-based governance continues to dominate in China, although there are elements of market-based governance. This conclusion was also supported by the research conducted by He, Zhang et al. [
55], who summarized, classified, and evaluated all the policy instruments used to promote energy efficiency of buildings from 1986 to 2015. The application and impact differences among the administrative, information-based policy instrument and the voluntary agreement were also analyzed in this research. A more detailed analysis was conducted by Shen, He et al., based on a comparison of policy data from seven typical countries [
32]. By taking policy resources into consideration in the selection process of a policy instrument, the research further explored the feasibility of each instrument based on international experience and common application strategy of the seven countries.
The policy environment theory is used to identify and classify those factors beyond the full control of the government. In addition to the policy settings, four key fields of factors are proposed: technology progress, optimized economics, market perfection, and capacity building. Technology is the foundation of the EE improvement in housings. The evolvement of technology decides the pace of EE improvement of buildings. Factors of optimized economics affect the massive adoption of energy efficient technologies. The level of capabilities of relevant stakeholders decides the feasibility regarding the implementation of techniques and policies. Factors of market perfection focus on the relationship of various stakeholders. The target of market perfection is to help energy-efficient technologies, products, and applications win in market competition. Above all, drivers in these fields focus on improving the EE level of technologies, industries, housing, and the massive application of energy efficient technology from technical and social perspective.
3. Methodology
The whole methodology comprises three major parts: (1) Factor collection and hierarchy construction, (2) investigation and data collection, and (3) evaluation based on the AHP. The boundaries for factor collection are set at first. Factors were collected according to the literature from the technology and policy perspectives. The classification of the factors was based on the policy environment theory. The structure of the hierarchy was built based on the nested policy design framework. Nationwide institutes’ questionnaires were conducted to collect judgements on the influence of these factors. The target group comprised institutes from different climate zones and of different interests. Collected data was processed using the AHP approach. Corresponding conclusions and policy implications were provided based on the calculated weights and rankings. The structure of the methodology and its implementation process are detailed in
Figure 7.
The AHP method is fundamentally based on pairwise comparisons to generate conclusions. Two elements being compared at a given time un-repeatedly reduces the conceptual complexity of an analysis greatly. This simplification involves reasonable assumptions proposed by Satty [
56] and the others [
57,
58]. Given a pairwise comparison, the analysis involves three tasks: (1) Developing a comparison matrix at each level of the hierarchy starting from the second level and working down, (2) computing the relative weights for each element of the hierarchy, and (3) estimating the consistency ratio to check the consistency of the judgment [
59].
The AHP method is selected for the following reasons. (1) The AHP converts these evaluations to numerical values that can be processed and compared over the entire range of the problem. A numerical weight or priority is derived for each element of the hierarchy, allowing diverse and often incommensurable elements to be compared in a rational and consistent manner. This specialty helps evaluate those factors quantitively and makes inter-category comparison possible among the factors. (2) Pairwise comparisons and judgements are made by experts. Through a proper selection of experts, this method enables various stakeholders to participate in the evaluation of factors, revealing their effectiveness from an empirical perspective. (3) The AHP method requires a hierarchy and classification of all the factors. If designed properly, the priority ranking of criteria, sub-criteria, and factors (i.e., local and global) can reveal the truth regarding respondents’ opinions.
3.1. Factor Collection and Hierarchy Construction
As a complex socio-technical industry, the EE promotion of new residential buildings can be affected by a large quantity of factors from multiple aspects, from the macro economy to technology (
Section 2). Therefore, the following principles were applied to limit the range of factors before the identification of specific factors: (1) Factors should influence, or be influenced by, the policies issued by the Ministry of Housing and Urban-Rural Development (MOHURD) in China because it oversees promoting the EE of buildings in urban areas, policymaking, implementation, supervision, and conducting major projects concerning the EE promotion of new residential buildings; (2) factors directly relevant to building EE promotion in single and district scales and extended construction value chains are considered; and (3) factors could influence the interactions between the policy system and market mechanism to eliminate market failure. The first principle defines the boundary from a policymaking perspective, the second principle is from a policy-environment perspective, and the third principle stresses the interaction between policy factors and factors from the policy environment. Based on the literature review, 111 factors were identified and are listed in the
Appendix, Table A1.
With the help of the nested policy design framework, a hierarchy of three levels were designed as follows: Level 1—criteria level-preference of governance arrangement. These criteria concentrate on only the fields and sectors (e.g., market and technology)—that is, “what type of governance arrangement does, or will China have, and what type of policy instruments should be preferred?” is analyzed or answered on this level. Level 2—sub-criteria level-preference of policy regime logic. These sub-criteria concentrate on the subsectors of the EE promotion of new residential buildings— that is, they are trying to build up the foundation for answering the question “which type of instruments should be selected or preferred?” on this level. Level 3: factor-preference of operational plans (technical policy instrument selection). These factors provide the empirical statistics and evidence of parameter configuration of policy instruments for implementation and collaboration among instruments.
Figure 8 gives a detailed graphical presentation of the structure of the constructed hierarchy and its components. The correspondence between the different hierarchic levels and the nested policy design framework is also illustrated.
Regarding the design of criteria and sub-criteria, the policy settings (C5), as a major contributor to the improvement of EE level, was first identified. All the policies can be categorized into three types in China: macro policy (C51), operable policy, and technical policy (C54). Plans, decisions, and other supporting industry policies are classified into the macro level because they are not operable; however, they are sometimes directly associated with the building EE promotion industry. Operable policies can be divided into two sub-categories, namely, monetary policies (C52) and administrative policies (institutions) (C53), because of the different types of policy resources they require.
In addition to policy settings (C5), the policy environment theory was introduced for criteria and sub-criteria identification. Influencing factors from a policy environment were classified into four categories according to the literature—technology progress (C4), optimized economics (C3), market perfection (C2), and capacity building (C1). The technology progress (C4) focuses on technical factors, which can be classified into six sub-criteria based on the fundamental theory of heating, ventilation, and air-conditioning from life-cycle perspective (C41 to C46). In addition, factors associated with promoting EE level and efficient use of resources, such as water recycling, distributed energy, and micro-grids were considered because building EE promotion from the district level is a future development trend (C47). The criteria of optimized economics (C3) focuses on costs (C31) and benefits (C32) from technology innovation, the massive application perspective, and the perspective of operation of enterprises in the industry. The criteria of market perfection (C2) attempts to solve the market failure in the EE promotion of new residential buildings industry [
40]. The needs (C22) (from all the market stakeholders and governments), as one of the drivers of market development, was a primary consideration. Additionally, according to the requirements of boundary, other factors influencing the interaction between market and policy systems were considered, such as market vitality (C21) (same as market activity) [
41], market expectations (C24), and market mechanisms (C23). The capacity building (C1), defined by Robert B. Hawkins from the perspective of political management, is “a concept that encompasses a broad range of activities that are aimed at increase the abilities of citizens and their governments to produce more responsive and efficient public goods. At its core capacity building is concerned with the selection and development of institutional arrangements; both political and administrative” [
60]. Seven capacities were identified based on different actors as follows: guidance (C11) and cooperation (C12), referring to central and local government; implementation (C13), referring to planning, designing, and construction enterprises in the industry value chain; supervision (C14), referring to government and third-party institutes; assessment (C15), referring to third-party institutes; operation (C16), referring to institutions involved in the operation stage of buildings like ESCOs(Energy Service Companies) and facility management enterprises; and innovation (C17), referring to all stakeholders in the industry.
3.2. Questionnaire Design and Data Collection Method
In accordance with the principles of questionnaire design [
61], the design of the institutional questionnaire are simple, specific, and easy to understand. However, if strictly following the requirements of the AHP methods, the evaluation of 111 factors in three hierarchic levels will lead to 322 times of pairwise comparisons, which is almost impossible for an expert to finish patiently and effectively. Therefore, the Likert 5-Scale was introduced to evaluate the perceived influence of the criteria, sub-criteria, and factors by the investigated institutes independently—1 is for the least importance and 5 is for the greatest importance. To provide additional details on the future situation, the experts in the target group were required to provide their judgements on the short-term and long-term influence of all the factors.
Nationwide institutional questionnaires were used to collect opinions from various frontline stakeholders. Thirty-two institutions from different types of stakeholders, climate zones, and development levels from the national perspective were asked to fill out the questionnaire. The systematic sampling method was used to select these institutes. Additionally, to further improve the stability and amplify the representation of questionnaires, additional requirements were added depending on the property of the institutes when conducting the institutional questionnaires. These requirements are as follows. For government departments, advice from same-level departments, for example, financial departments, industrialization departments, and quality supervision departments, should also be collected when accomplishing the questionnaire. For other institutions, opinions reflected in the questionnaire should be a combination of opinions from high-level decision-makers, frontline workers, and other individuals involved in the industry. The result of institution selection is in
Figure 9.
New residential buildings constructed in different climate zones achieve the same level of EE at different rates. Climate differences also lead to different technical strategies and solutions for achieving the same EE level. As indicated in
Figure 9, the selected institutes cover all the three major climate zones in China, namely the cold and severe-cold climate zone, the summer-hot&winter-cold climate zone and the summer-hot&winter-warm climate zone. In addition, three national level institutes were also selected to generate more comprehensive opinions.
From the development-level perspective, cities in eastern China started their career of EE promotion in buildings also in the 1980s and until now, policy systems and relevant technologies have been well-developed, meaning that they have more successful experience than the other two districts. As for western China, affected by “the grand western development program”, its industry of building EE promotion develops at an unprecedented pace. Cities/provinces like Chongqing, Yunnan have already formed their own effective policy systems and technological systems which can also provide useful experience. And in middle China, owing to a lack of supporting policy package on the overall level and diversity of climate within the province, much effort was spent on exploring how to coordinate different policies to promote the EE of buildings in one province as a whole.
Additionally, the consideration of institutes’ properties was mainly based on the role which various institutes play in the industry. For example, the externality of new residential EE promotion makes it hard for developers to profit from developing new residential buildings of high energy performance. However, it is strongly favored by provincial and municipal authorities due to policy influence and potential benefit, such as increasing job opportunities.
3.3. Data Processing
Before applying the AHP method to the collected data, efforts were taken to transform the independent evaluation based on the Likert 5-Scale into a pairwise 9-scale comparison. The process is as follows:
Step 1: Calculate the mean value (
mvik) of each element in each level. Let
represent the element
k’s value in the level
i from No.
j institutions, in which
Step 2: Calculate the maximum and minimum value of elements in each level of the hierarchy. Let
Step 3: Normalize each element into 9-scale pairwise comparisons. For the random two elements
in the criteria, assuming that
, then
With the aforementioned adjustment, the judgement matrix A is formed, filled by the elements calculated in Step 3. The following data processing follows the requirement of the AHP method as follows:
Step 4: Determining of the weight vector. The weight factor is the row factor through ensemble average calculation and normalization of the judgement matrix. Assume that the largest eigenvalue of the judgement matrix is
and the corresponding eigenvector is
, the following equation will be achieved:
The complete process to calculate the weight factor is as follows:
Sub-Step 1: Calculation of the product of all elements (
Pi) in each row
Sub-Step 2: Calculation of
n times squaring root of
P achieved in Sub-Step 1
Sub-Step 3: Calculation of weight factor by normalization of the vector
WSub-Step 4: Calculation of largest eigenvalue
Until this point in this study, the value of represents the weight of each factor and the sum of the weights is 1.
Step 5: Consistency check. The purpose of the consistency check is to verify the reliability of the weight ranking. The larger the difference between the greatest eigenvalue and the number of the elements, the larger the inconsistency. The larger inconsistency can also cause large judgement bias. Thus, the consistency index (CI) is introduced to quantitively measure the inconsistency as follows:
when the CI approaches 0, the judgement matrix has an increasing consistency, and vice versa. To measure the CI quantitively, the random consistency index (RI) is introduced. Based on the research result from Saaty, the distribution of RI is as follows in
Table 1:
The corresponding consistency ratio (CR) is defined as follows:
The judgement matrix is believed to have a satisfying consistency when CR < 0.1. The corresponding normalized eigenvector can be used as the weight vector. Otherwise the judgement matrix shall be re-built and adjustments to the element shall be made.
Because the Likert 5-Scale was introduced to collect the opinions of stakeholders, whereas the AHP method was used for data processing, the results and discussions are correspondingly two-fold. The results based on the Likert 5-Scale reveals the influence of each factor quantitively. The change of average value between the short term and long term indicates the perceived judgements on each factor independently. However, the other results based on the AHP methods provides more information on the weight and ranking of one factor’s influence on the rest—locally and globally—according to the methodology. Therefore, both results are considered when analyzing the collected data.
On the one hand, results based on the Likert 5-Scale are analyzed based on the differences in the interests of the stakeholders. The average scoring of each type of stakeholders and variance (the percentage of maximum difference of average value among stakeholders to the overall average value) between actors are calculated. If the variance is less than 20%, the average value could be considered an agreement among various stakeholders. If the variance is equal to or greater than 20%, it is considered that disagreements among stakeholders are sufficiently significant and require extra consideration.
On the other hand, the results based on the AHP are analyzed based on the calculated weight and ranking of each factor in the three levels. The local priority ranking of all the criteria and sub-criteria indicates the stakeholders’ judgements regarding the government arrangement and policy regime logic, respectively. The higher ranking of a certain system is equal to the greater effect of the corresponding factors. The weight and ranking changes on the criteria level indicate the changes that will occur to the governance arrangement in China and suggest what type of policy instruments are preferred under the context of governance arrangement transformation. The weight and ranking of each factor indicate its significance to the sub-criteria level from a stakeholder’s perspective. The results also provide suggestions regarding the details of how the preferred policy instrument should be configured. The factor with a higher weight is considered more effective in realizing the expected outcome of a policy instrument. Those factors of higher ranking should be given priority and considered.
4. Results and Discussions
4.1. Brief Results of Investigation
The average opinions of judgements from different stakeholders are summarized in
Table 2. All the experts agree on the judgements of the influence of policy settings (C5), market optimization (C2), capacity building (C1), and technology progress (C4) in both terms. The overall opinions (M values in
Table 2) indicate that policy settings (C5) have the greatest influence in the short term and the second least influence in the long term. The influence of technology progress (C4) and market optimization (C2) will slightly increase, and market optimization (C2) will result in the greatest impacts in the long term. The changes of C2 and C5 between terms indicate strategic change of the development of EE promotion of new residential buildings in China—that is, a more “marketized” policy environment should be formed. The M increase of C4 stresses the necessity of technology—no matter what type of development pattern should occur; technological progress remains the influence of the same level.
In addition to the agreements achieved among various stakeholders, there are still attitude preferences caused by the information asymmetry existing in the EE promotion industry. Different stakeholders hold different opinions about the influence of in each criterial and sub-criterial level. Generally, governments tended to be the most conservative stakeholders about the influence of the identified criteria and sub-criteria. Exceptions are marked as italic in
Table 2. Research institutes, overall, gave higher evaluation scorings than the responses from enterprises. The corresponding exceptions are marked as underlined.
As to stakeholders’ attitudes towards the influence of each criteria,
Figure 10 depicts the corresponding results. In the short term, enterprises believe that the influence of economic factors (C3) is greatest and is in line with the influence of policy settings (C5), whereas governments believe that economic factors (C3) is of the least influence. Research institutes believe that factors regarding market (C2) are of the great influence. In the long term, all the stakeholders believe that the factors regarding market (C2) are of the most significant influence. In addition, research institutes also believe that the capacity building (C1) is of the same influence as the factors in market system (C2). Enterprises hold the opinions that factors regarding economy (C3) are as influential as the factors regarding policy settings (C5). Research institutes believe the economy factors (C3) are of greater influence than policy settings (C5), while governments hold the opposite judgements.
However, according to the methodology in
Section 3.3, agreements on the importance of these criteria are still considered to be reached because the variance of stakeholders’ judgements are smaller than 20%. Under this circumstance, it is considered by the author that whichever stakeholders’ opinions differ, they are not significant enough to change the agreements among all the stakeholders.
Notably, significant disagreements are still observed among stakeholders on the criteria and sub-criteria levels, in addition to the attitude’s preference. These disagreements are marked as bold in
Table 2. Experts representing enterprises and research institutes believe economic factors in C2 have substantial impacts, whereas experts from governments do not. The author asserts that this disagreement is the symbol of information asymmetry in the EE promotion of new residential building industry and the proof of the externalities as described by Reference [
35]. The judgements provided by enterprises reveal their eagerness for profits due to externalities, whereas governments believe that economic factors could not influence the EE promotion as effectively as policies (see C5) and the perfection of market mechanisms (see C2). In the long term, this disagreement is further enlarged. Governments’ judgements on economic factors’ influence have further decreased, and the remaining stakeholders keep the same.
Regarding the sub-criteria level, disagreements are also observed and are mostly in the capacity field (see C11–C17). Enterprises and research institutes believe the capacity of guidance (C11), cooperation (C12), assessment (C15), and operation (C16) will significantly influence the improvement in capacity in both terms, whereas governments do not. These disagreements further support the information asymmetry between governments and markets as mentioned in a previous section. In addition, these disagreements stressed the need for more capable and effective governments from the market’s perspective because the sub-criteria C11, C12, and C15 mainly refer to governments. This judgement is further proven by the judgements from research institutes.
As for the disagreement identified in the economy system (see C31–C32), the debate concentrates on whether costs should have great significance or super significance. Consensus could therefore be considered achieved. The disagreements in technology aspects (see C41–C47) focus on the efficiency of building materials (C41) and building operation (C44), which are in consensus in the short term. This result is partly because, currently, China is realizing the EE target of a building by increasing the thickness of insulation, which causes many safety problems regarding structural strength of the envelop and inflammability. A small step in improving the efficiency of building materials could lead to a giant leap in the overall energy efficiency promotion. As for operation, technology measures cannot significantly reduce the energy consumption of residential buildings due to the complexities, such as property rights, residential patterns, and various lifestyles.
4.2. Weights and Rankings of Criteria and Sub-Criteria
The weights and rankings of criteria and sub-criteria are summarized in
Table 3. The weights and rankings of all the criteria indicate what governance arrangement dominates at the current stage and should occur in the long term, while those of all the sub-criteria prove the governance arrangement transformation and further indicate how should the transformation be realized.
4.2.1. Weights and Rankings of Criteria
At the criteria level, policy settings (C5) and market optimization (C2) are of the greatest importance in the short term. The summation of the weights of these two criteria accounts for over 80% of the total weight of the five criteria. This result is in accordance with the fact that the combination of “legal-based governance” and “corporatist-based governance” dominates in the field of the EE promotion of new residential buildings at the current stage, as reviewed in
Section 2 and discussed in
Section 4.1. The ranking of C2 in second place in the short term also indicates that the market for EE promotion of new residential buildings is still not mature. In addition to market failure, many problems must be solved by policy settings based on a mandatory method such as administrative licensing [
62,
63,
64]. In the long term, the influence of policy settings (C5) will be significantly reduced by almost 90% and will rank fourth in the long term, and the ranking of market optimization (C2) rises to first. The ranking shift implies that the current developing mode will be substituted by the new mode “guided by government, predominated by market entities” in the long term, and the governance arrangement will shift toward “market governance” and “network governance.”
The criteria of capacity building (C1), optimized economics (C3), and technology evolvement (C4) have an identical ranking in the short term, which reveals their equal importance to the EE promotion under current governance arrangement. In the long term, the ranking of C4 rises to second while that of C3 decreases to fifth. The ranking change of C4 between terms shows the importance of technology factors. Under the background of stable and effective market mechanisms and policy settings, the continuous development and popularization of technology will become a strong support for the industry. As for C3, the author asserts that, the identical rankings in both terms are determined by market stakeholders’ continuous eagerness of benefits. This argument is also proved in
Table 2—that C3, evaluated by enterprises, is of the same importance in both terms. In addition, the weight increase implies that economy will play a more important role in the long term.
4.2.2. Weights and Rankings of Sub-criteria
The forecasted governance arrangement transformation does not lead to substantial ranking changes of most sub-criteria (except C23 and C51) in C2 and C5, as indicated in
Figure 11. It is asserted by the author that the consistency of these criteria between terms are determined by the role that each sub-criterion plays in the EE promotion process. As for the sub-criteria in policy setting (C5), the monetary policy (C52) and policy mechanism design (C53) rank stably front due to their effectiveness in satisfying market stakeholders’ eagerness for profit (C31, C32). Technology policy (C54) ranks last since it has no incentives for stakeholders. Regarding market perfection (C2), market needs (C22), as the source power of market development, stably rank first in both terms. Market expectations (C24), depicting stakeholders’ willingness participating in the building EE promotion market, ranks second in both terms. Market vitality (C21), as the sub-criterion describing the real activeness of the market, ranks third in both terms with a decreased weight.
However, the weight change of each sub-criterion still reveals how the policy setting will change and how the market should be perfected. For example, the weight decrease in policy mechanism design (C53), along with the weight increase in market mechanisms (C23), stress the long-term market perfection through improved policy settings (C52) in the short term. The weight and ranking increases in macro policy (C51) also indicate the importance of market expectations (C24).
The substantial ranking changes in capacity building (C1) criteria depict the importance of various kinds of capacities regarding difference stakeholders. In the forecasted market-based/network-based governance arrangement, governments play a role in eliminating market failures. The opinions and perceptions of market stakeholders are expected to dominate, and guidance from governments is not a necessity. Therefore, the government’s capacity of guiding (C11) will not be as important as they are now. The capacity for supervision (C14), as a policy instrument adjusting market activities, remains of great importance in both terms. The corresponding weight increase indicates its increasing importance in eliminating market failures with the change to the new governance arrangement. The capacity of assessment (C15), defined as the capability to evaluate the quality and the amount of building EE promotion, will be of great influence and a prioritized ranking because it is the foundation for the development of “energy efficiency-oriented market mechanisms.” The capacity of innovation (C17) ranks second and further rises to first place in the long term. The author asserts that this ranking is caused by the specialty of China situation—the specialty of overall governance arrangement and the residence pattern lead stakeholders to little advanced experience that can be referred to. The encountered barriers and problems need to be solved innovatively according to specific situation.
The ranking changes of technology evolvement (C4) also indicate the technology strategy change for a higher efficiency in the new residential building sector. In the short term, the EE level in the design phase (also known as energy efficient design) accounts for the biggest weight. This ranking shows the importance of energy efficient design and reveals that, in the current stage, the throttle of EE promotion before construction is the building materials. The ranking of appliances and operation implies that space remains for the reduction of energy consumption by renovations at a low cost or the behavior of residents. In the long term, this priority ranking becomes EE promotion in the design phase > construction phase > operation phase = dismantle/renovation phase > building materials = building services and appliance. The new ranking stresses the importance of construction and shows that the influence of the EE performance of building materials and appliances will significantly decrease.
4.3. Independent Analysis of Factors
The calculation results of all the factors are listed in
Appendix Table A3. The weight and ranking of each factor indicate their importance and relative priority in a sub-criterion perceived by experts. Instead of simply describing the meanings of weight and ranking of each factor, this section concentrates on the factors with significant influence, the corresponding empirical proofs, and the relations between these factors. Those factors with a higher weight than the average, in either term, in a cluster are identified as significant. The results are summarized in
Figure 12,
Figure 13,
Figure 14,
Figure 15 and
Figure 16.
The following discussions will start from the significant factors in the policy system (C5) as it ranks first in the short term on criteria level, followed by market system (C2) as it ranks second in the short term and has the greatest weight in the long term. The factors in economic criteria (C3), as a connection between market and technology, will be discussed afterward. Factors in technology criteria (C4) will be analyzed relatively independently to find the routine for future development. Finally, the factors in capacity building criteria (C1) will be discussed in association with the aforementioned criteria as it involves all the stakeholders in the construction value chain.
Policy Settings (see
Figure 12): National mid-/long-term development plan (F511) is of significant importance in both terms since it plays an important role in establishing market expectations (see F241). The significance of industry-supporting policy (F514) is determined by the complexity of the EE promotion industry as a crossover industry among production, construction, and operation. The industry-supporting policies focus the whole construction value chain instead of one key link. Correspondingly, the factor “floor-area ratio reward” (F525) is evaluated as the most effective policy instrument by experts because it is normally awarded to the developers. By increasing the profit of the developers who are in the font stage of the value chain, the value will be further conducted to the downstream industry [
65,
66]. Additionally, the high housing price makes it easier for developers and downstream stakeholders to attain more profit than other current monetary policies in China.
The factor “local government assessment system” (F532) is evaluated as significant in both terms due to its effectiveness in stimulating local governments’ willingness to participate in the EE promotion of new residential buildings. The assessment result will directly influence the human source allocation of local governments and the total amount of subsidy from central governments.
For technology policy (see C54), the revision of codes and standards (F541) is significant because codes and standards draw the EE baseline of design and construction of high-performance buildings, and their renovation speeds determine the pace of technology evolvement of the whole industry. The diversity of methods realizing the requirements of the standards determines that the renovation of atlas is not such a profound influence as the renovation of codes. Additionally, because of the property of compulsion, the renovation of codes, standards, and atlas have greater influence than the recommended list.
Market Perfection (see
Figure 13): Regarding the specific factors in the “needs” field, the needs of governments and homebuyers (see F221, F222 in
Figure 13) dominate. In the short term, the building EE promotion market is driven by the need of governments to simply fulfill their responsibility, while in the long term, homebuyers will play the most significant role in the process. The ranking change of these two factors is also the proof of the governance arrangement transformation.
The weights and rankings of factors in the other three sub-criteria depict the details regarding how they interact with each other. The stability and continuity of policies (F241) will significantly increase the market expectations of various stakeholders [
67]. After the ignition of market entities’ willingness, a good policy environment (see F212) can be a powerful support for stakeholders to develop continuously in this field. Governments shall also take actions to establish effective business modes (F233) and financing channels (F232) for the enterprises in the short term. In accordance with the governance arrangement transformation discussed in
Section 4.1, the influence of factors introducing market investment (an identical ranking change of F213 and F233) will also increase in the long term. The availability of financing products, services, and channels (F213) will become of great significance and affect the stakeholders’ active participation in the market. Additionally, the buildup of an effective market mechanism should start with taking advantage of energy efficiency trading (F234) because successful pilot projects have already been observed in Shenzhen.
Optimized Economics (see
Figure 14): In the cost field, the cost of technology R&D (F311) plays the most important role in the short term. In accordance with the conclusions and speculations on the analysis of the market system and capacity system (F173), this ranking indicates that the promotion of technology shall be conducted, and an upgrade of the technology system is a necessity. In the long term, the level of marketization of technology and products (F314) becomes primary in the cost sub-criteria, which is logically in line with the theory of the technology life-cycle [
68]. The payback period (F322) in the benefit part remains significant in both terms. On the one hand, the significance of F322 is in accordance with the ranking of the cost because technology R&D and marketization are tightly associated with the calculation of the payback period; on the other hand, in China’s residential building sector, despite the amount of EE promotion, a relatively low energy price [
69] leads to a longer payback period for enterprises, concerning facility management or energy management.
Technology Evolvement (see
Figure 15): The design phase, as an early stage of the building’s life-cycle, plays a critical role in determining the EE level of the architecture in both terms. Factors regarding thermal performance of windows (F413, F432, F433) rank front, followed by the direction the building faces (F437) and natural ventilation (F436) in both terms. In accordance with the factors’ evaluation in the building material field (F411), the strategy of energy efficient design can be described as follows. “For the non-transparent part, the EE improvement should focus on the thermal performance of insulation, instead of simply increasing the thickness. For the transparent part of a building (see F412), its design should comprehensively take the layout of the buildings, certain room and the thermal performance of materials into consideration.”
For the other technology aspects of newly constructed buildings, the concept of “clean and renewable energy/resources utilization” (F444, F449, F473, F475, F447) dominates in the short term, and the concept of “energy/resources recycling” (F445, F440, F462) dominates in the long term. This ranking of factors in the construction (see C45), operation (see C44), and renovation (see C46) fields means that, despite the energy and resource shortage in China, sufficient no-fossil energy/high-grade energy remains for the consumption of residential buildings in the short term. The comprehensive use of various types of energy and resources will increase the EE level because the evaluation is normally fossil-energy/non-renewable resources-based. However, the exacerbation of energy and resources will finally affect the energy consumption of housing in the long term. The strategy will then shift to “recycling” rather than “comprehensive utilization.”
Capacity Building (see
Figure 16): Governments always play an important role in both terms. In the short term, the governments’ ability to establish the implementation standards (F113) ranks first. The implementation standard, under this context, refers to instructing market entities regarding how to realize the EE target by setting up a conditional incentive system and technological specifications. The more detailed the implementation standard, the more extensively the government dominates. In the long term, a government’s ability to guide the energy-saving consciousness (F111) ranks first. Along with the decrease in the influence of the cooperation ability between governments (F122), the ability to guide cooperation market entities (F121) is of more significance in the long term. The shift of this ranking also shows that “market governance” and “network governance” will gradually form. In addition to the enforcement of the energy-saving consciousness of stakeholders (see F111), the building up of a stable cooperation relationship among market entities (see F112, F121, F122) is also important.
Regarding the stakeholders in the construction value chain, the ability of the design construction (F131, F132) of the same importance are observed in both terms. The weight of the factor “capacity of facility management” (F161) ranks first in the management field and increases to approximately 15%. Due to the application of various energy-saving technologies, the operation quality of these pieces of equipment directly affect the energy consumption of a certain building.
With respect to the relevant third-party institutes,
Figure 16 presents the details of the capacity building of supervision and assessment. The construction quality (F141), as a basic and mandatory requirement of a building, remains of significant importance in both terms. The capacity of credit supervision (F142) is also evaluated as significant since market stakeholders will dominate the EE promotion process in the long term. The capacity of assessing energy saving (F152) is evaluated as significant in both terms since the quantified evaluation of energy saving is the foundation for the design of incentives. Additionally, that the innovation ability (C17) ranks second indicates its importance in promoting the EE level of buildings. In accordance with the ranking change of a technology system on a criteria level, the ability of technology innovation (F173) ranks first. Technology, as the foundation of the EE improvement, directly determined the highest level of the promotion.
4.4. Comprehensive Analysis of All the Factors
Other sections have discussed the weights, rankings, and corresponding implications of each factor in a separate sub-criteria system. However, chances remain that one factor in a certain system of minor influence may have a great global influence. Additionally, the continuity of one factor having a significant impact in both terms will help the policymakers improve their understanding of the building EE promotion process in China. Thus, all the factors are analyzed in this section. Weight and the corresponding global ranking of each factor is calculated, neglecting its belonging field.
Figure 17 is a plot of all the factors based on their rankings in both terms.
As shown in
Figure 17, factors in the “market perfection system” (C2) and “policy settings system” (C5) tend to cluster (as indicated in the blue and gray circles), whereas the distribution of the factors in the remainder of the systems is decentralized. Factors in the policy settings criteria (C5) have a higher ranking in the short term, and the factors regarding market perfection (C2) have a higher ranking in the long term. Factors in the optimized economics system (C3) and capacity building system (C1) are generally located within a range of 40–100 in the short term and 20–100 in the long term, as indicated by the color orange in
Figure 17. Most of the factors in the technology system (C4) have even lower rankings between 60 and 120 in the short term or between 80 and 120 in the long term (blue area in
Figure 17).
As shown in
Figure 18, few factors are of great weight, and most factors have weights less than 0.020. To focus on the factors of relatively great influence and to cover at least 80% of the weight of the total, the accumulative weight based on the top-down ranking was calculated. Correspondingly, the value at which the accumulative weight exceeds 0.8 for the first time was taken as the baseline for factor selection. Now, 53 factors (i.e., 16 from short term specifically, 25 from long term specifically, and 12 overlaps in both terms) remain on the list. The calculation results of effective factors are listed in
Figure 19.
Most factors specific in the short term belong to the policy setting system (C1). The corresponding range covers all the fields of the policy settings. The only exception in this category, the factor of setting up an implementation standard (F113), is also “government relevant.” The distribution of these factors indicates the importance of government and policies in the short term.
As to factors in the long term, the span covers the systems of capacity building, optimized economics, market preference, and technology. The diversification of these factors implies that more stakeholders will take part in the promotion process under the framework of market governance or network-based governance. Instead of the diminished influence of factors regarding policy settings, factors concerning market optimization (C2) are of great importance in the long term. Additionally, other long-term factors, except those regarding the technology field (C4), are also market-relevant.
Moreover, a total of 12 factors overlap in both terms, covering the fields of policy setting (C1), optimized economic system (C3), and market system (C2). As a bridge between the current stage and the future, these factors, significant in both terms, will play a continuous role in the next 15 years in the process of building EE promotion. The high significances of these factors also provide a solid foundation and continuity for the transformation and the development of the Chinese market. Furthermore, most of the market factors belong to the “needs” sector. As one of the drivers of building EE promotion, this need for EE promotion of new residential buildings will continue to be in an increasing and transforming process, and the EE level in the residential sector must be promoted for, at least, the next 15 years. The increase in the number of factors that remain on the list in market and economics and the decrease in policy systems prove that China is shifting its development pattern into a “market-dominated” mode. The increase in the number of factors of capacity building systems proves that this pattern shift, and future building EE promotion development, should be led and cultivated by the government, which is quoted in
Section 5 as “guided by governments.”
4.5. Future Study and Practical Implications of the Study
4.5.1. Limitations and Future Study
By investigating frontline stakeholders involved in the industry of EE promotion of new residential buildings, this paper collected and reported stakeholders’ perceptions of the factors influencing the EE promotion of new residential buildings in the case of China. By adopting the “nested policy design framework” and the “policy environment” theory, this paper constructed a structure for classifying and organizing the collected influencing factors. The perceived influence of each factor was evaluated by frontline institutes via Likert 5-Scale, and the corresponding weight and ranking was further determined through the AHP process. The investigation and data processing results were validated based on the history of the development, and the corresponding policy implications are further derived.
However, due to the complexity of the industry, the data collected from 32 institutes are still not sufficient for a detailed analysis from each stakeholders’ perspective. This paper listed eight categories of stakeholders in
Figure 9 but classified them into three categories—government departments, enterprises, and research institutes in the following analysis. The corresponding implication also limit its range within the interactions policy settings and the response from the frontlines. It is considered by the author that too few institutes’ voices cannot represent the overall attitudes of the same kind of stakeholders. More and carefully selected institutions involved in the study will provide more useful and authentic information about the perceived influence of factors by different stakeholders. Correspondingly, the question “what stakeholder thinks in detail rather than in general?” can be answered, by taking relevant theories, such as the gaming theory, into consideration. The results can thus help researchers and decisionmakers better understand the difference of response from different stakeholders confronted with the same policy system.
Despite the aforementioned limitations, the current results can still be considered as effective due to current governance arrangement in the investigated institutes in China. Once the questionnaire is delivered to a certain institute, managers (college deputies and heads of other government departments and public institutions) will break it down and send them to different departments. Experts in each department will first fill in the questionnaire based on their perceived experiences and their majors. A follow-up workshop, where all the responses from experts and corresponding reasons are stated and discussed, will be conducted to find the most agreed-upon EE level. When approved by the manager of the institute, the most agreed-upon EE level will be the formal response. Therefore, a formal response could be seen as the result of negotiations among experts of different research domains and professional ranks.
4.5.2. Practical Policy Implications
In the following 15 years, the current governance regarding new residential building EE promotion in China will shift to “market-based” and “network-based” from a “legal-based” governance. The industry will correspondingly be guided by governments and dominated by market stakeholders. This transformation also indicates that the building EE promotion process will be more sensitive to diversified factors regarding marketization, namely, market perfection, technology, economy, and capacity building.
With respect to the preference of policy instrument selection, marketization is one of the future trends under the changed framework of governance arrangement. Despite the decreasing influence of a policy system, the monetary policy and policy mechanism remain of great influence because they are effective policy instruments for the ignition of market development and building up market expectation, as perceived by stakeholders within the industry. “Needs”, as a basic driver for market development, are the most significant influence on the promotion. Factors of market expectation decide the willingness to participate in the promotion process. Due to the increasing awareness of the externality, market entities are less sensitive to benefit, but remain sensitive to the cost of various types. Regarding the ability to fulfill the corresponding duties of respective stakeholders, the capacity of governments is of great importance in the short term, and the innovation ability of stakeholders becomes more important because it is one of the core competences of enterprises in the market.
The weight of each factor further indicates the importance of various types of policy instrument selection and specifications. In the short term, governments play a critical role in guiding and cultivating the development of the EE promotion of new residential buildings. With abundant policy resources [
70] such as legislation and tax-collecting rights, the government can compensate market failure and adjust industry development along an approach toward higher efficiency under the situation that policy instruments can be selected and designed into a policy package correctly. In addition, evaluation results of factors in the market system indicate that policies should first encourage more enterprises to participate in the EE promotion process by igniting the home buyers’ need and satisfying enterprises needs for profits on overall level. When there are more entities participating in the market, it is important to build up a perfect mechanism to further promote the development of the market. In the economy part, factors’ weights concerning cost became larger than that of benefits. Current policy should solve the question of the long payback period for incremental cost caused by EE promotion. Regarding the technology system, the strategy of construction can be described as follows: “For the non-transparent part, the EE improvement should focus on the thermal performance of insulation, instead of simply increasing the thickness.; for the transparent part of a building, its design should comprehensively take the layout of the buildings and certain room and the thermal performance of materials into consideration.” Additionally, the results of technology evolvement factors imply that the concept of life cycle is becoming mainstream and all the components of building EE promotion tend toward the same importance. Correspondingly, greater attention should be paid to a regulated design, construction, operation, and life-cycle energy saving of buildings (single and district). With respect to capability building system, factors of innovation capacity and supervision capacity concerning regulating and exciting the market show great significance in the long term, implying that building EE promotion should be market-based and market-dominated.
5. Conclusions
Contributing to the gap of the disaccord between stakeholders’ perceptions and research assumptions, this paper identified the factors of significant influence to the nationwide EE promotion of new residential buildings before 2020 and 2030 based on the lived experiences of the first-front workers and institutes. Factors were collected through literature review. Questionnaires distributed to over 30 institutes were used to evaluate the influences of all the factors quantitatively and the result was generated from the AHP process. The nested policy design framework and policy environment theory was used to structure the hierarchy and generate policy implications. The corresponding conclusions summarized by answering the following three questions. The stakeholder’s attitudes towards various factors regarding EE promotion of new residential buildings presented in this paper helps policymakers, decisionmakers, and researchers better understand the current situation and the future development in China. More internationally, the correspondence between governance arrangement, policy regime logic, and preference of policy instrument selection analyzed in this article helps researchers to understand how the importance of factors will change under different context. The questions are as follows:
● What do stakeholders think in general?
Due to the information asymmetry and the different interests that various stakeholders stand for, the perception difference lies not only the general level, but also specifically on the judgements to criteria, sub-criteria, and factors.
Generally, government departments tend to be conservative in evaluating factor importance. The only exception found, on the criteria level, is the importance of technology evolvement in the long term. This stresses governments’ attention on the technology evolvement. According to their perceptions, technology evolvement is the foundation of, and decides the pace of, the EE promotion of new residential buildings. In addition, there was no consistent relationship be found between the judgements from enterprises and those from research institutes. On the criteria level, enterprises believe the factors regarding policy settings (C5) and the economy (C3) are of more significant importance, in both the short term and long term, than the research institutes expect. Regarding the judgements on the market criterion (C2), research institutes hold more ambitious opinions about the short-term importance of C2 while enterprises are more ambitious in the long term. Regarding factors on the sub-criteria level, the responses from enterprises are overall more conservative than those from research institutes, although there are six and four exceptions in the short and long term, respectively.
In addition to the attitude preference, significant disagreements can also be observed. These disagreements are further enlarged in evaluating the importance of all the criteria and sub-criteria in the long term. It is considered by the author that these disagreements are caused, not only by the information asymmetry and the externality of the industry, but also by the interests that various stakeholders stand for and the corresponding expectations. The major two significant disagreements are relative to the influence of economic factors and governments’ capacity. Enterprises are calling for more profits and they believe governments can effectively affect the development of EE promotion by issuing policies. However, governments believe that the economic factors should have the least influence. Besides, both research institutes and enterprises expect that current governments should increase their ability to regulate the market, thus realizing a better market environment. However, government departments do not believe their capacity are not of such significant influence, as expected.
Despite the attitude preference and the significant disagreements, the agreement on the importance of most criteria, sub-criteria, and factors are still reached. The results of consensus are as follows:
● What significantly affects the progress of the EE promotion of new residential buildings?
Indicated by the weights and rankings of policy settings (C2) and market optimization (C5) in the short term, the “legal-based governance” and the “corporatist-based governance” dominate in the field of EE promotion of new residential buildings. Correspondingly, factors regarding policy settings (C5) have the greatest influence in the short term. The monetary policy (C52) ranks front due to its effectiveness in satisfying market stakeholders’ eagerness for profit (C31, C32). The policy mechanism design (C53) has the second greatest importance in regulating market activities and setting up mechanisms for sustainable developments. Technology policy (C54) ranks last since it has no incentives for stakeholders. As for specific factors, those of significant short-term influence are listed in
Figure 19 (factors with blue and green cover). The floor-area ratio reward (F525) is of the greatest significant as it stimulates the developers—the stakeholder locating front of the value chain.
It is argued by the author that governments play the most important role in promoting the EE of new residential buildings. With abundant policy resources, they can effectively affect the development of the industry by issuing mandatory policies, setting up implementation standards, and stimulating the activeness of market stakeholders through incentives such as financial subsidies. In addition, it shall be noted that, for local governments, they are stimulated by the requirements from central governments.
● What will significantly affect the transformation of the EE promotions of new residential buildings in the future?
Indicated by the weight and ranking changes of all the five criteria, the current “legal-based” and “corporatist-based” governance arrangements in China in the EE promotion field of new residential buildings will transform into “market-based” and “network-based” governance arrangements. However, this transformation cannot be accomplished suddenly at a specific time. How the transformation should be accomplished or affected, perceived by frontline stakeholder, are illustrated in
Figure 19 (factors with green cover).
Generally, the transformation process is affected both by monetary factors and market-related factors. At the beginning, monetary policies (C52) are still of great importance in stimulating the market, as they can directly reduce the incremental cost and increase the benefits of enterprises. However, stakeholders involved in the market activities are calling for a more “stable” market environment. This is also the reason that governments’ needs of conducting work (F222), homebuyers’ need (F221), and the stability and continuity of policies (F241) are of extreme significant importance in the long term.
Along with the transformation of governance arrangements, factors in more criteria can have significant influence on the future development of EE promotion. Market mechanisms (C23), referring to well-organized competition among stakeholders, are of the greatest importance. The level of marketization of energy efficient building materials and products (F313) determines stakeholder’s access to the technology solutions with limited incremental cost. The capacity building of governments (F111, F114, F116) decides how effectively the governments can regulate the market and eliminate market failures. The technology evolvements (F431, F432, F433, F436, F437, F451, F453, F462) indicates how the EE level of technology should be further promoted.
By introducing the nested policy design framework and the policy environment theory, this paper shed further light on the correspondence between governance arrangement, policy regime logic, and the preference of policy instrument selection. The “legal-based” and “corporatist-based” governance arrangement is in accordance with the “government-dominated” development of EE promotion of new residential buildings. Correspondingly, policies issued by governments are of significant importance in stimulating the market. Taking enterprises’ eagerness for benefit into consideration, the preferred policy instruments are those monetary ones such as financial subsidy or the floor-area ratio reward. On the contrary, the “market-based” and “network-based” governance involves more stakeholders as the “decisionmakers” in promoting EE of new residential buildings. The development is correspondingly “market-oriented stakeholders-dominated” and governments play a role as a pioneer, a supervisor, and a regulator of the market. Under this circumstance, the EE promotion of new residential buildings can be affected by factors from more aspects than the development mode under “legal-based “and “corporatist-based” governance.


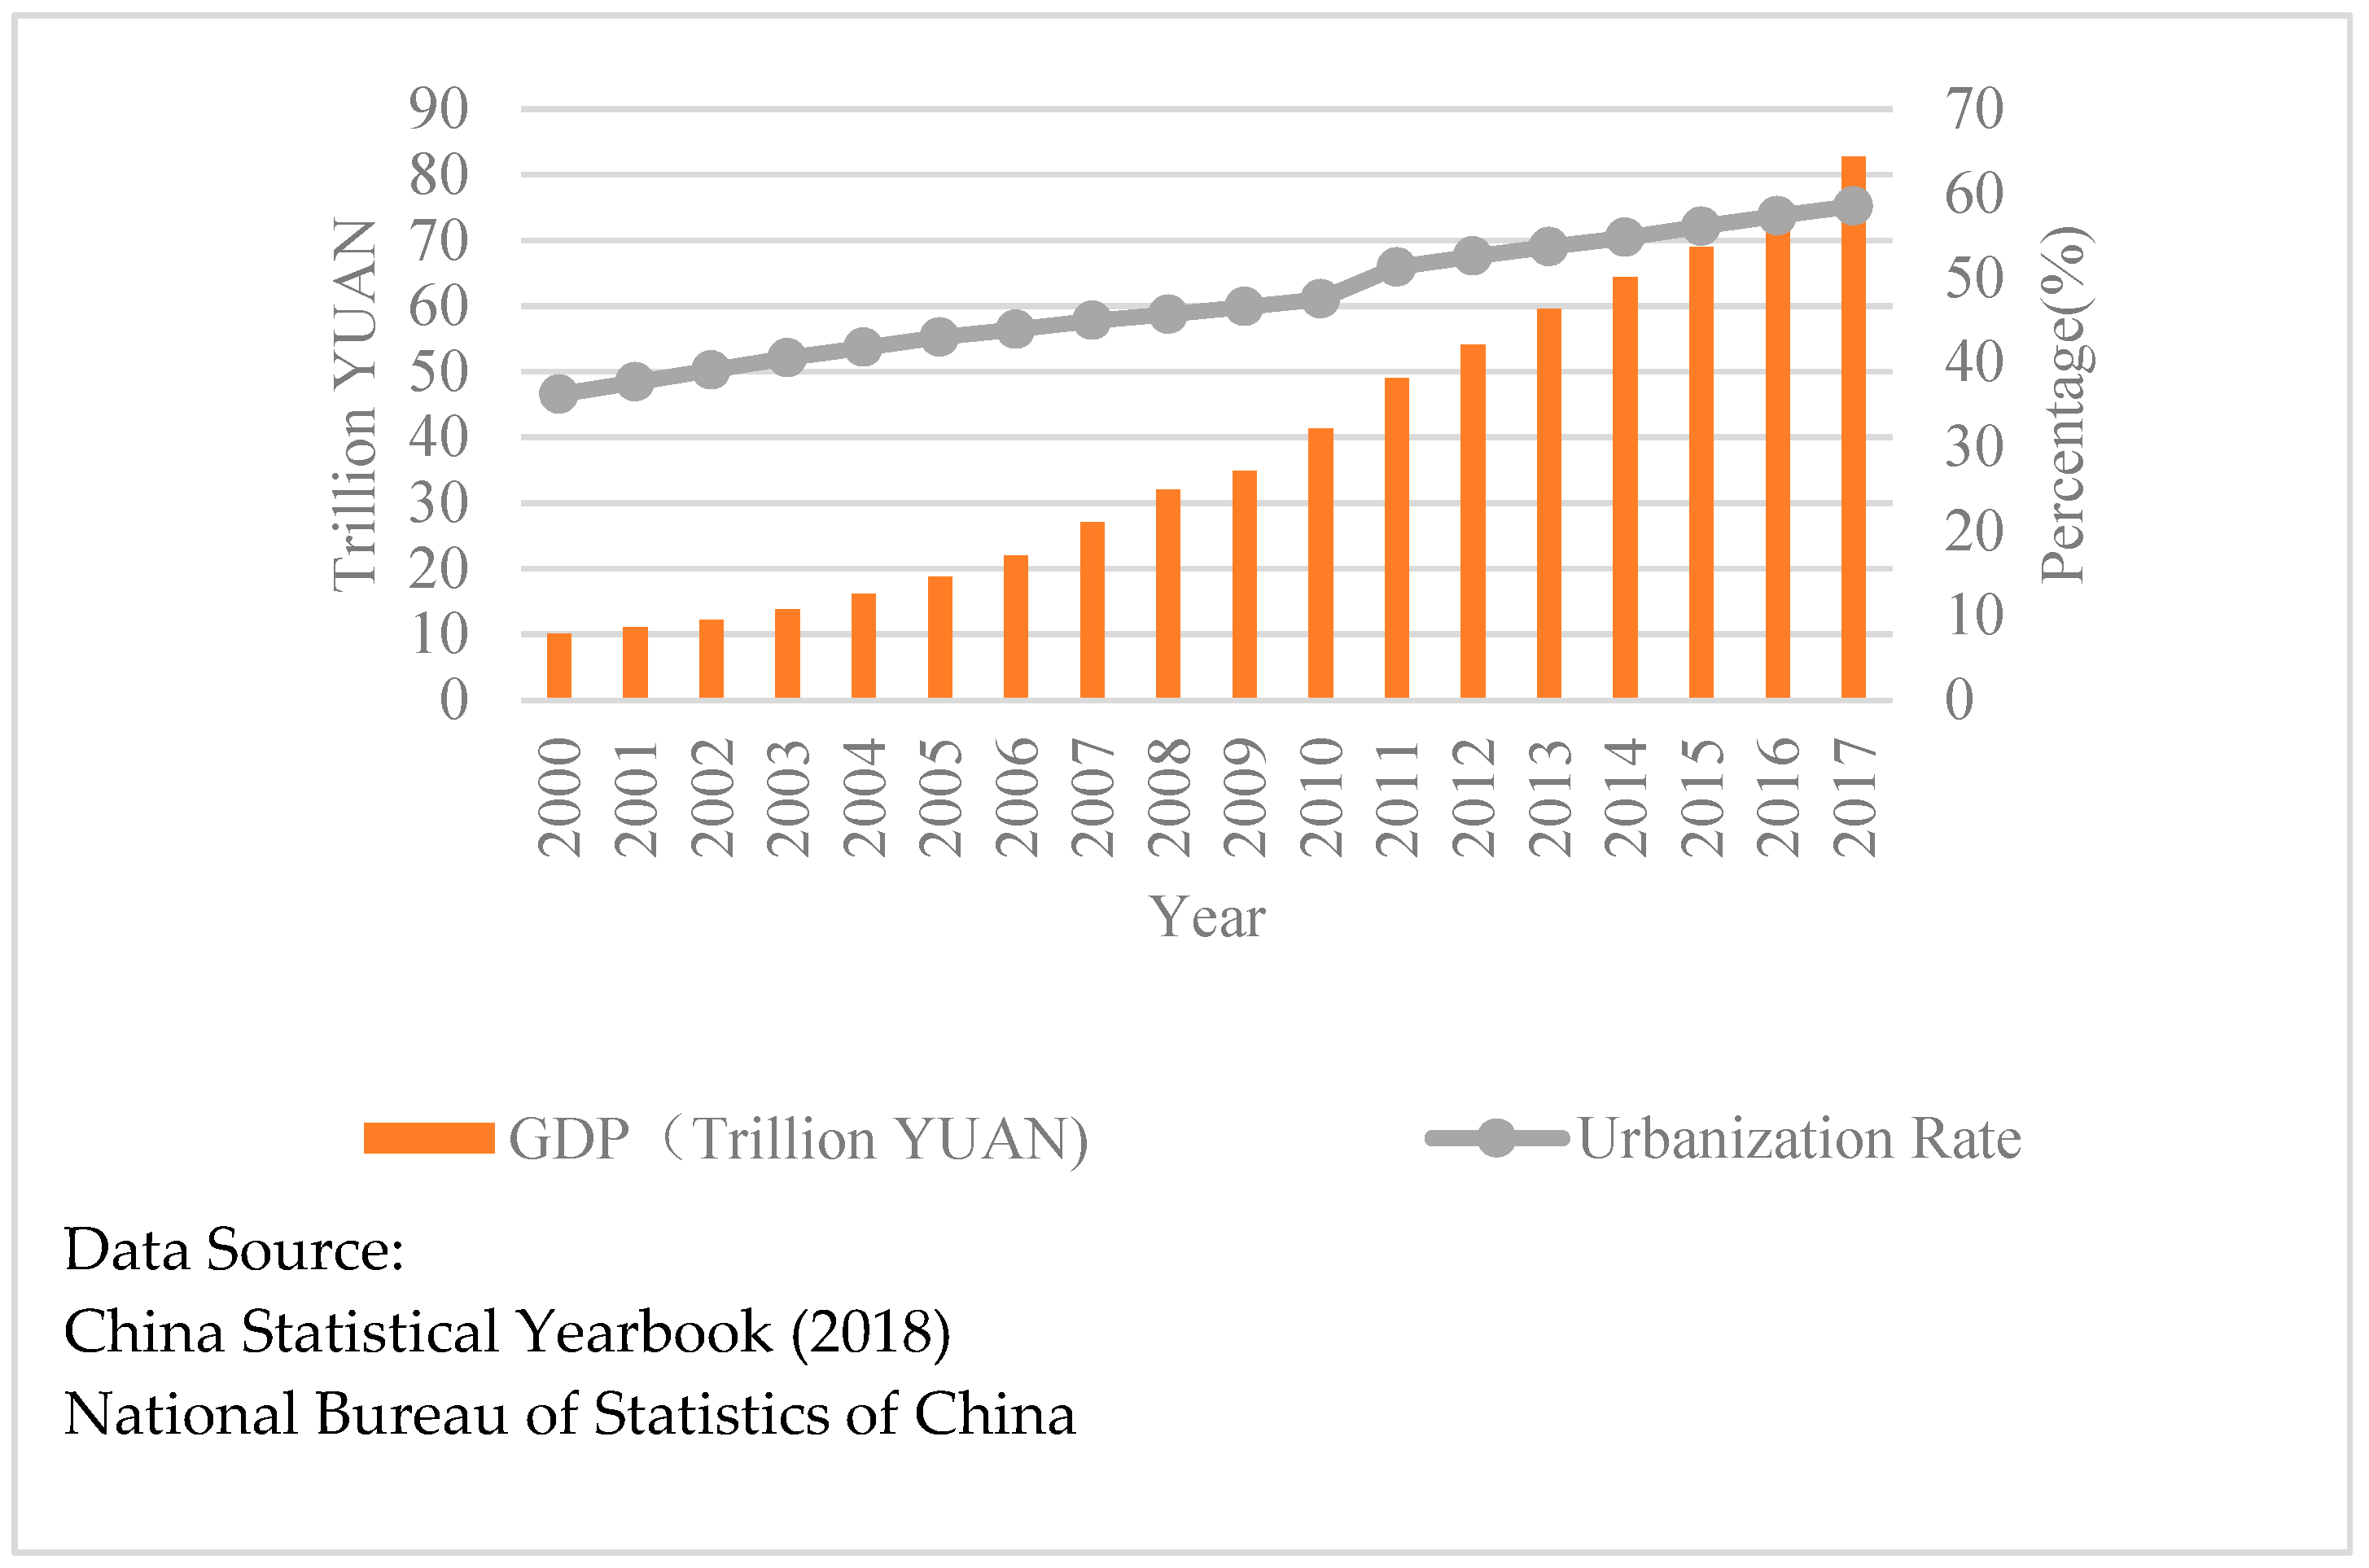
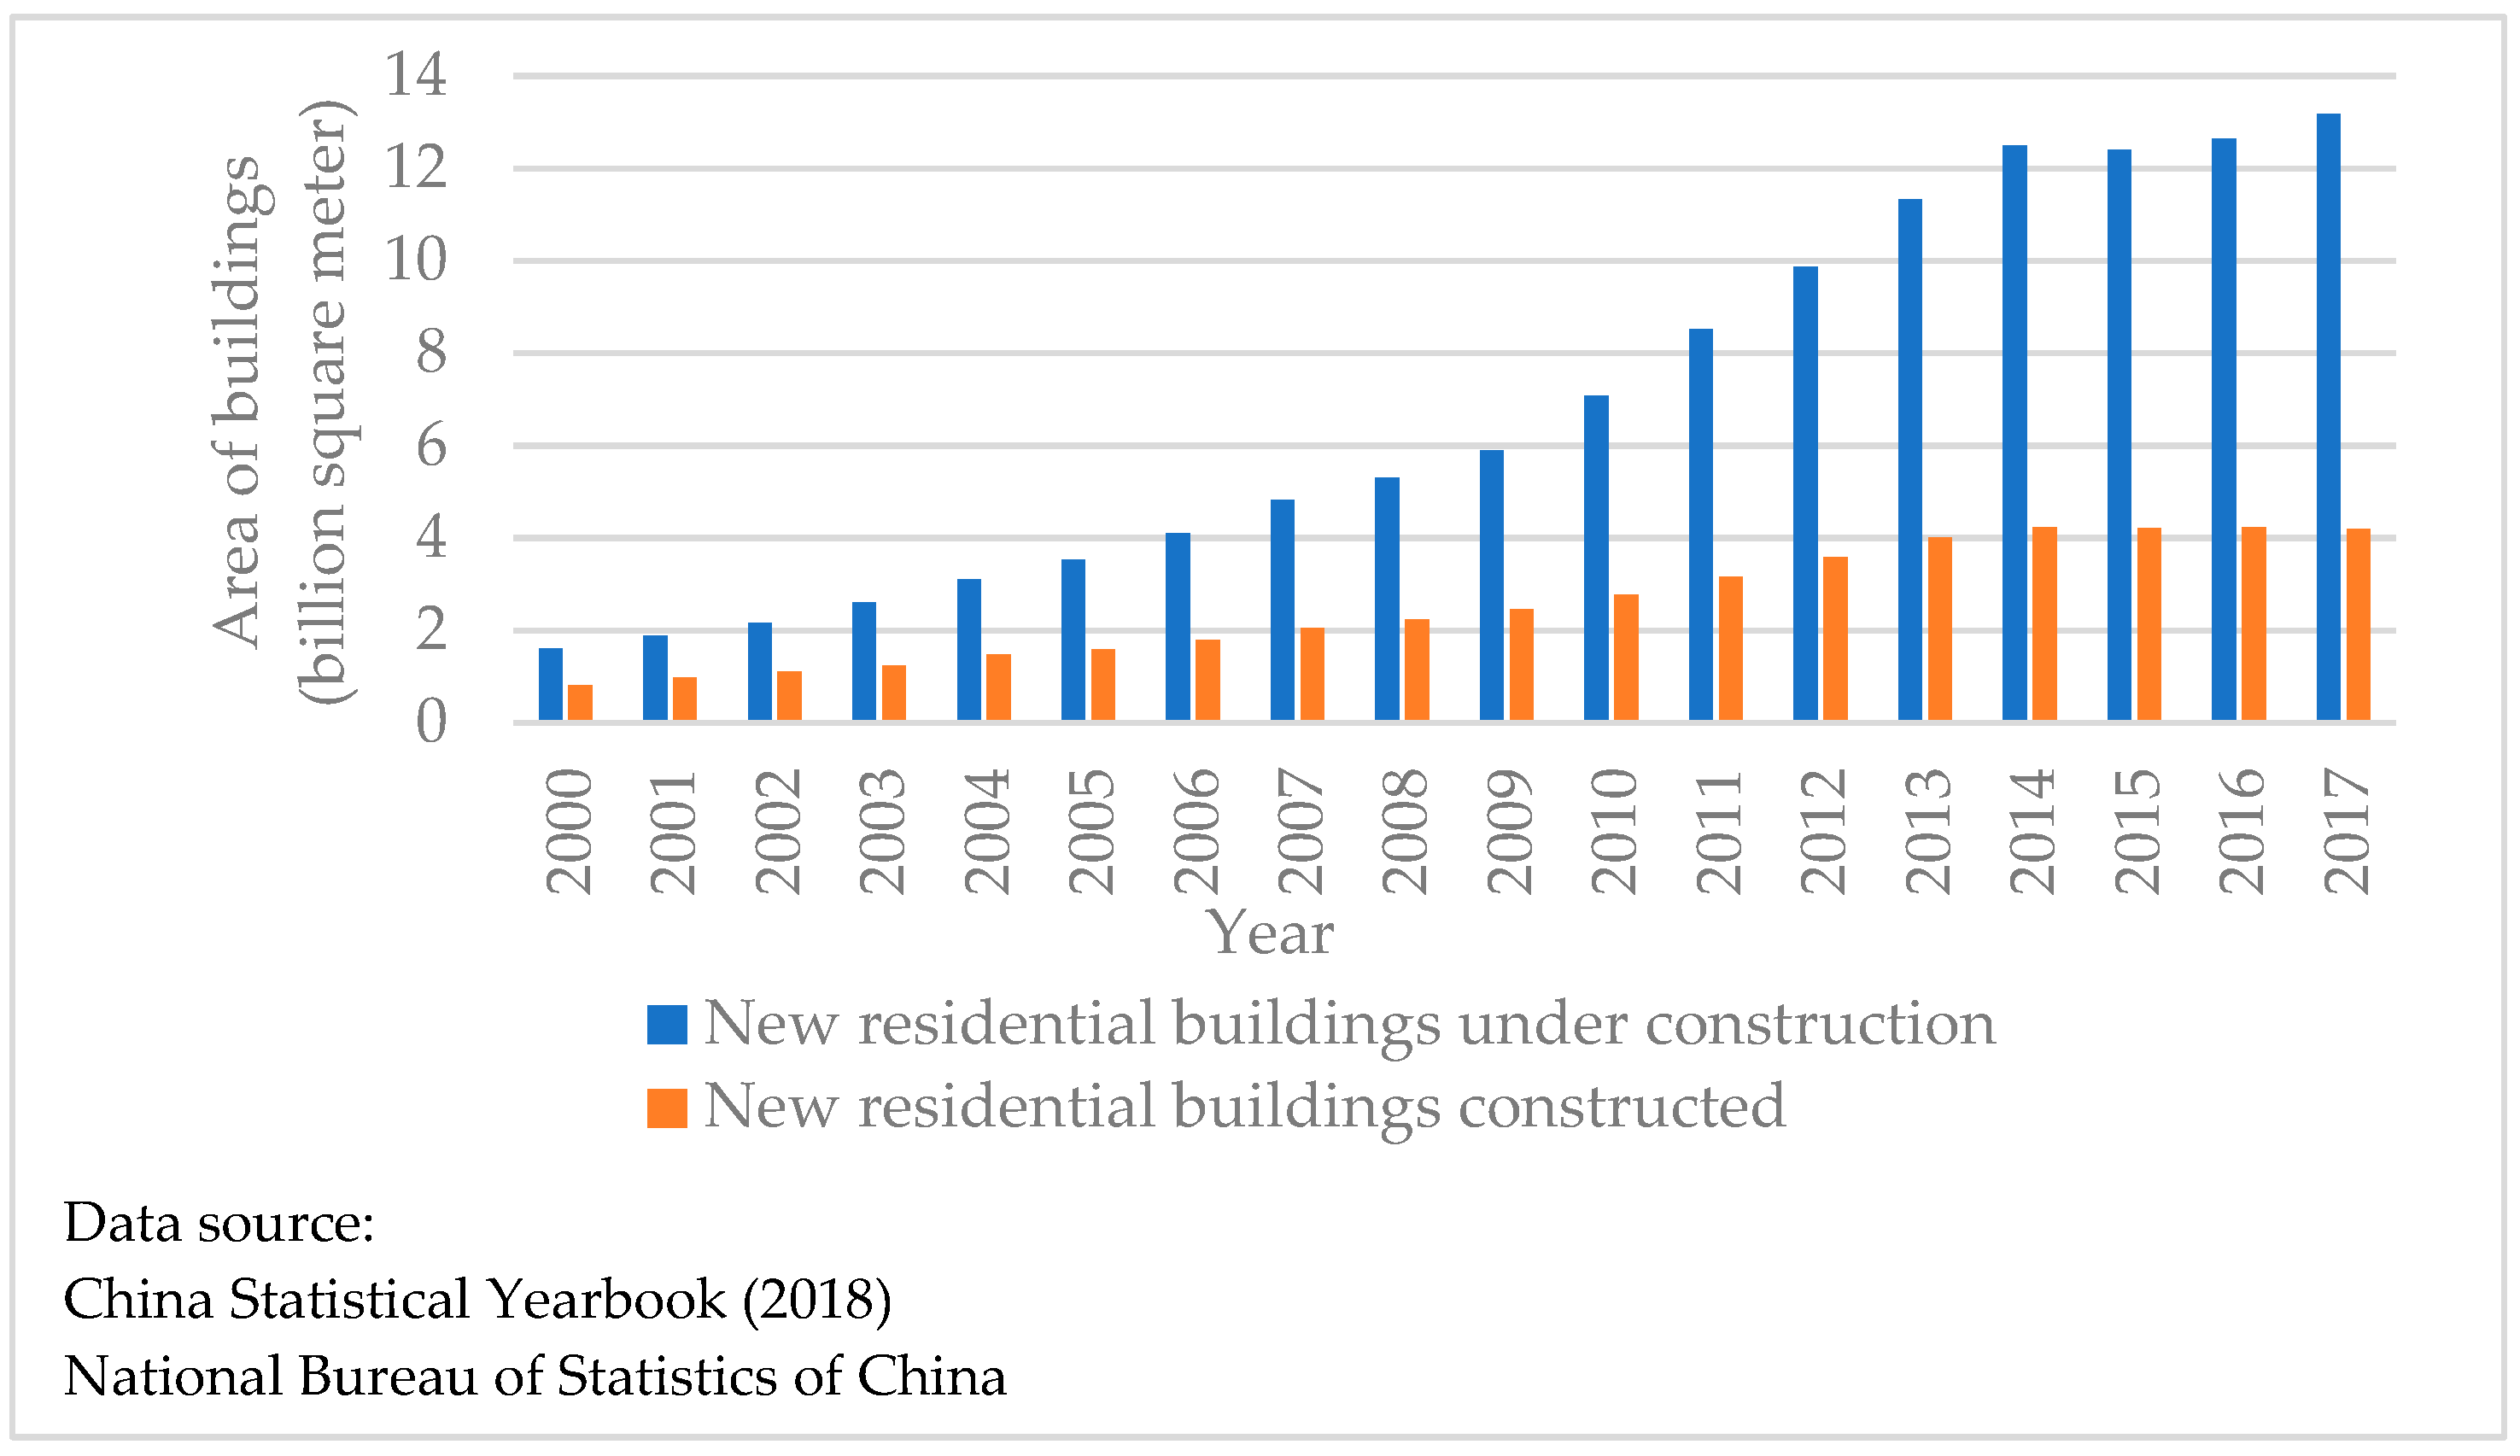
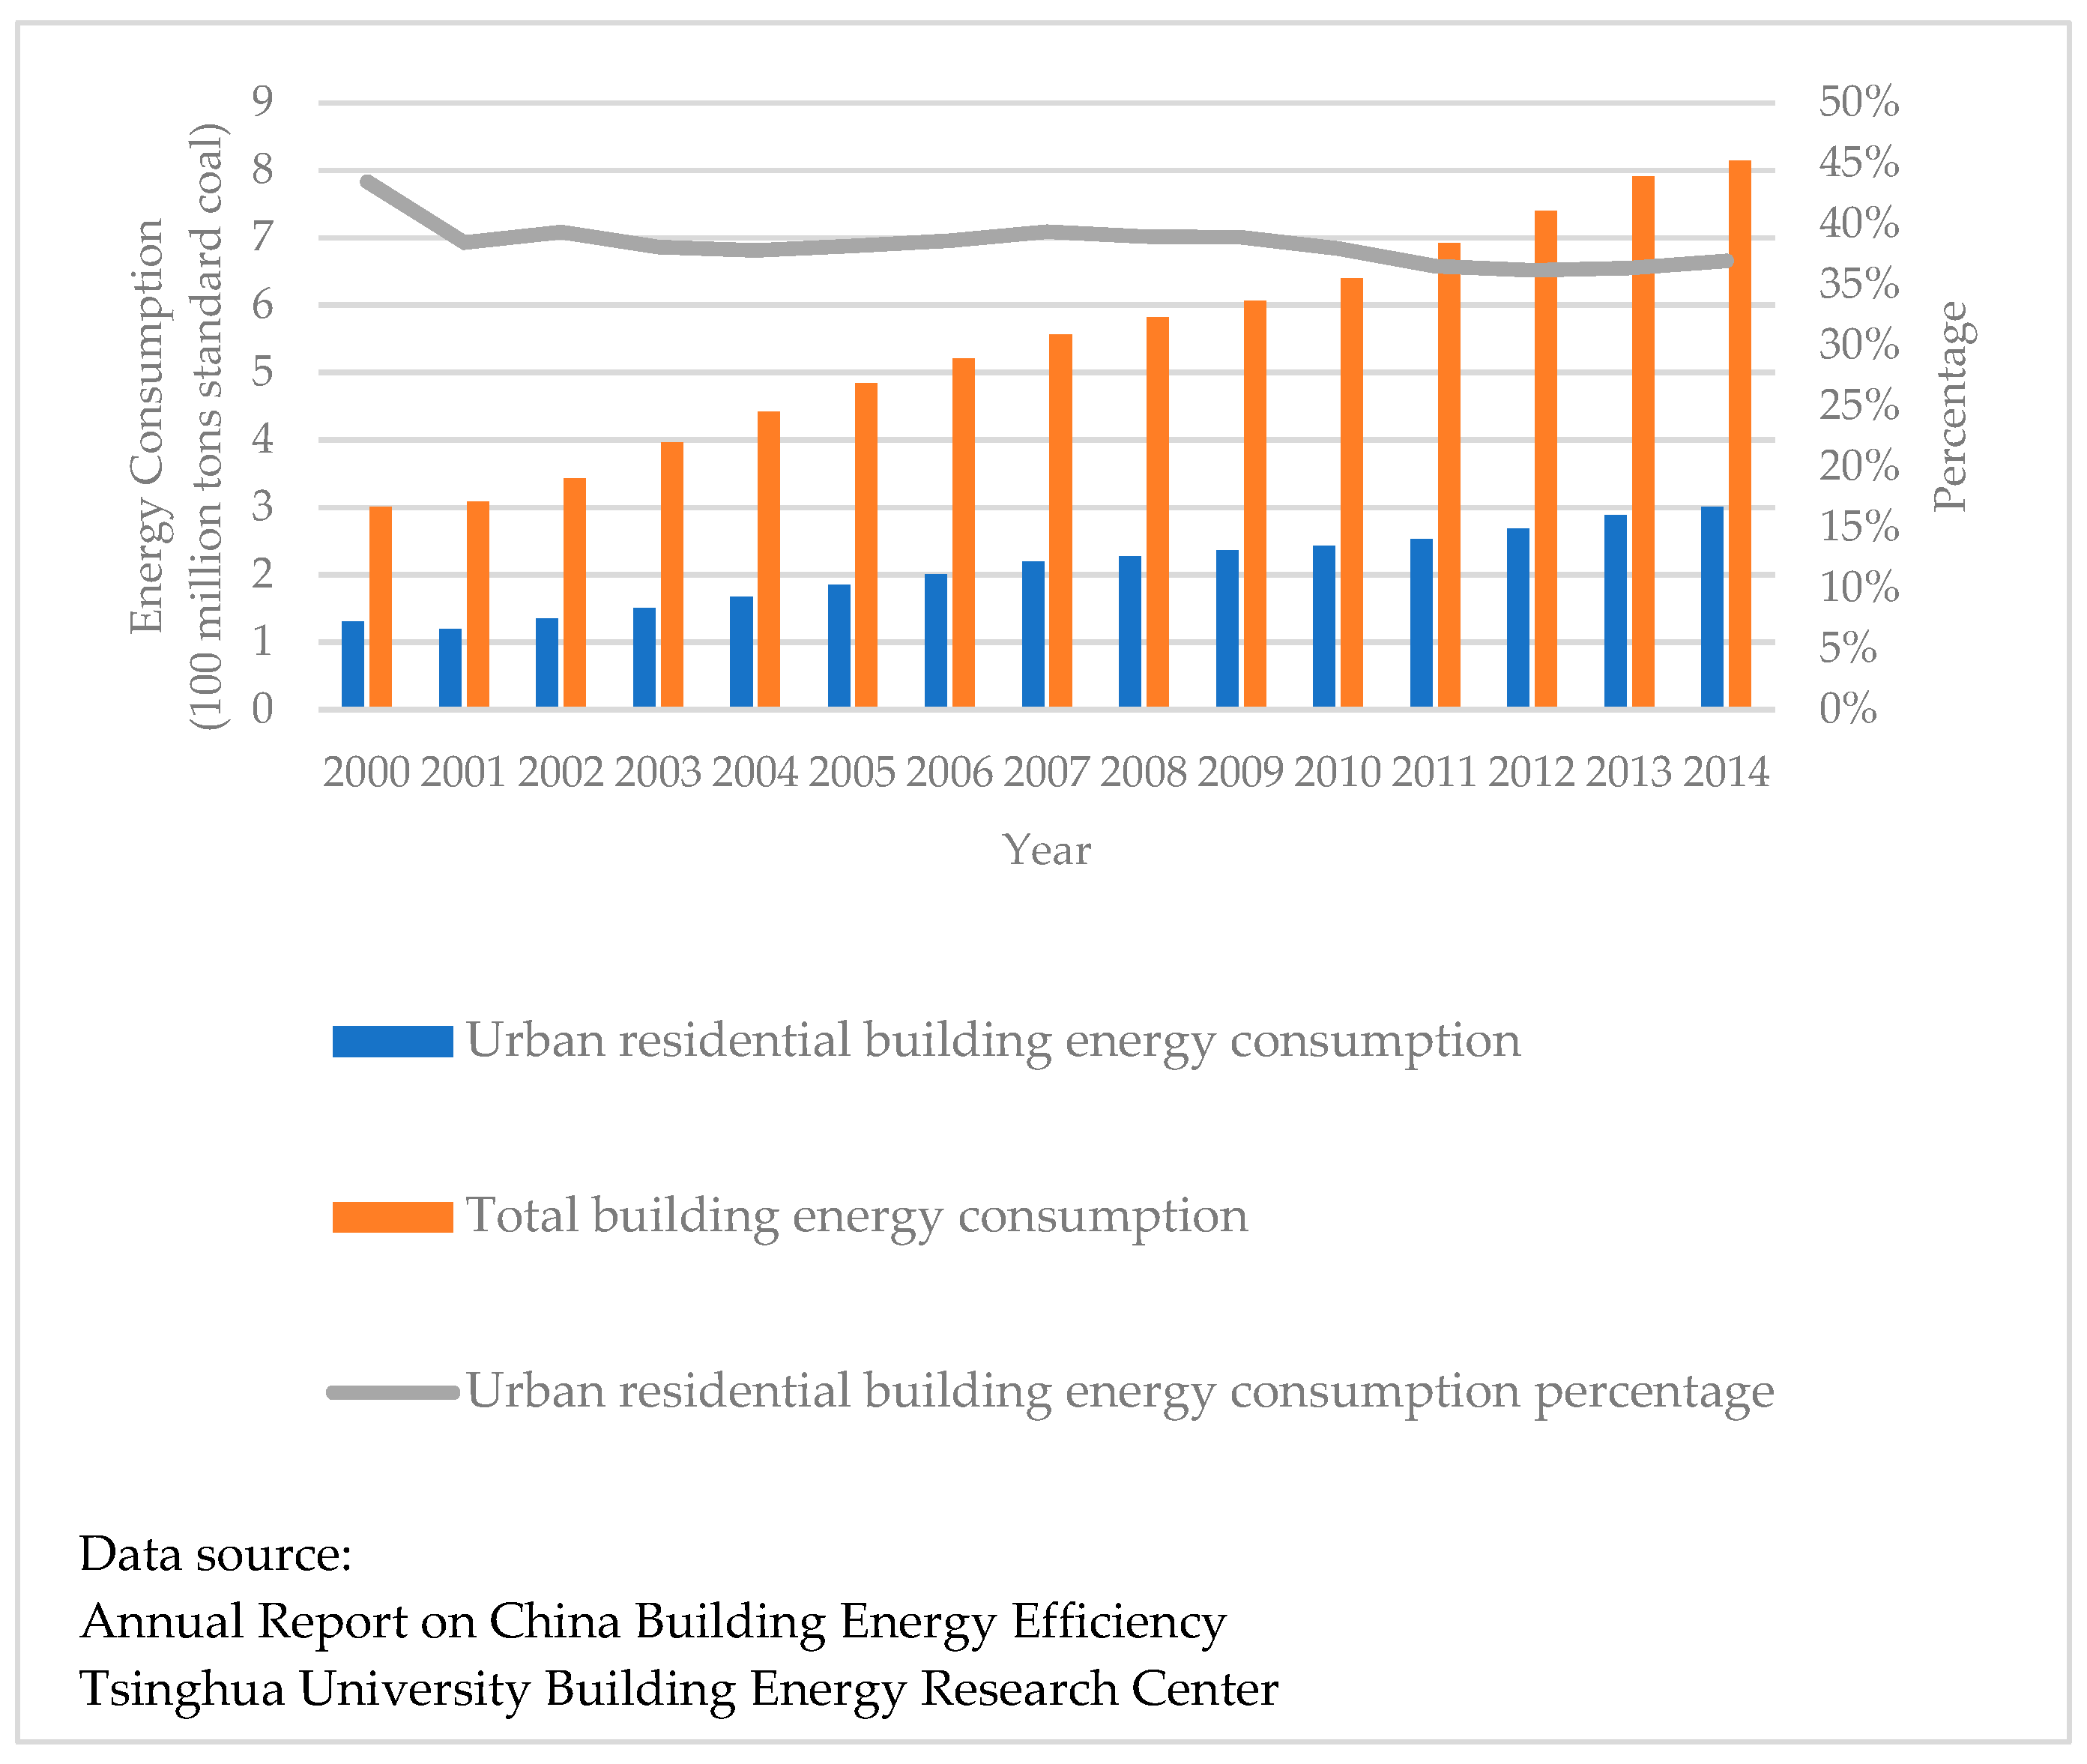
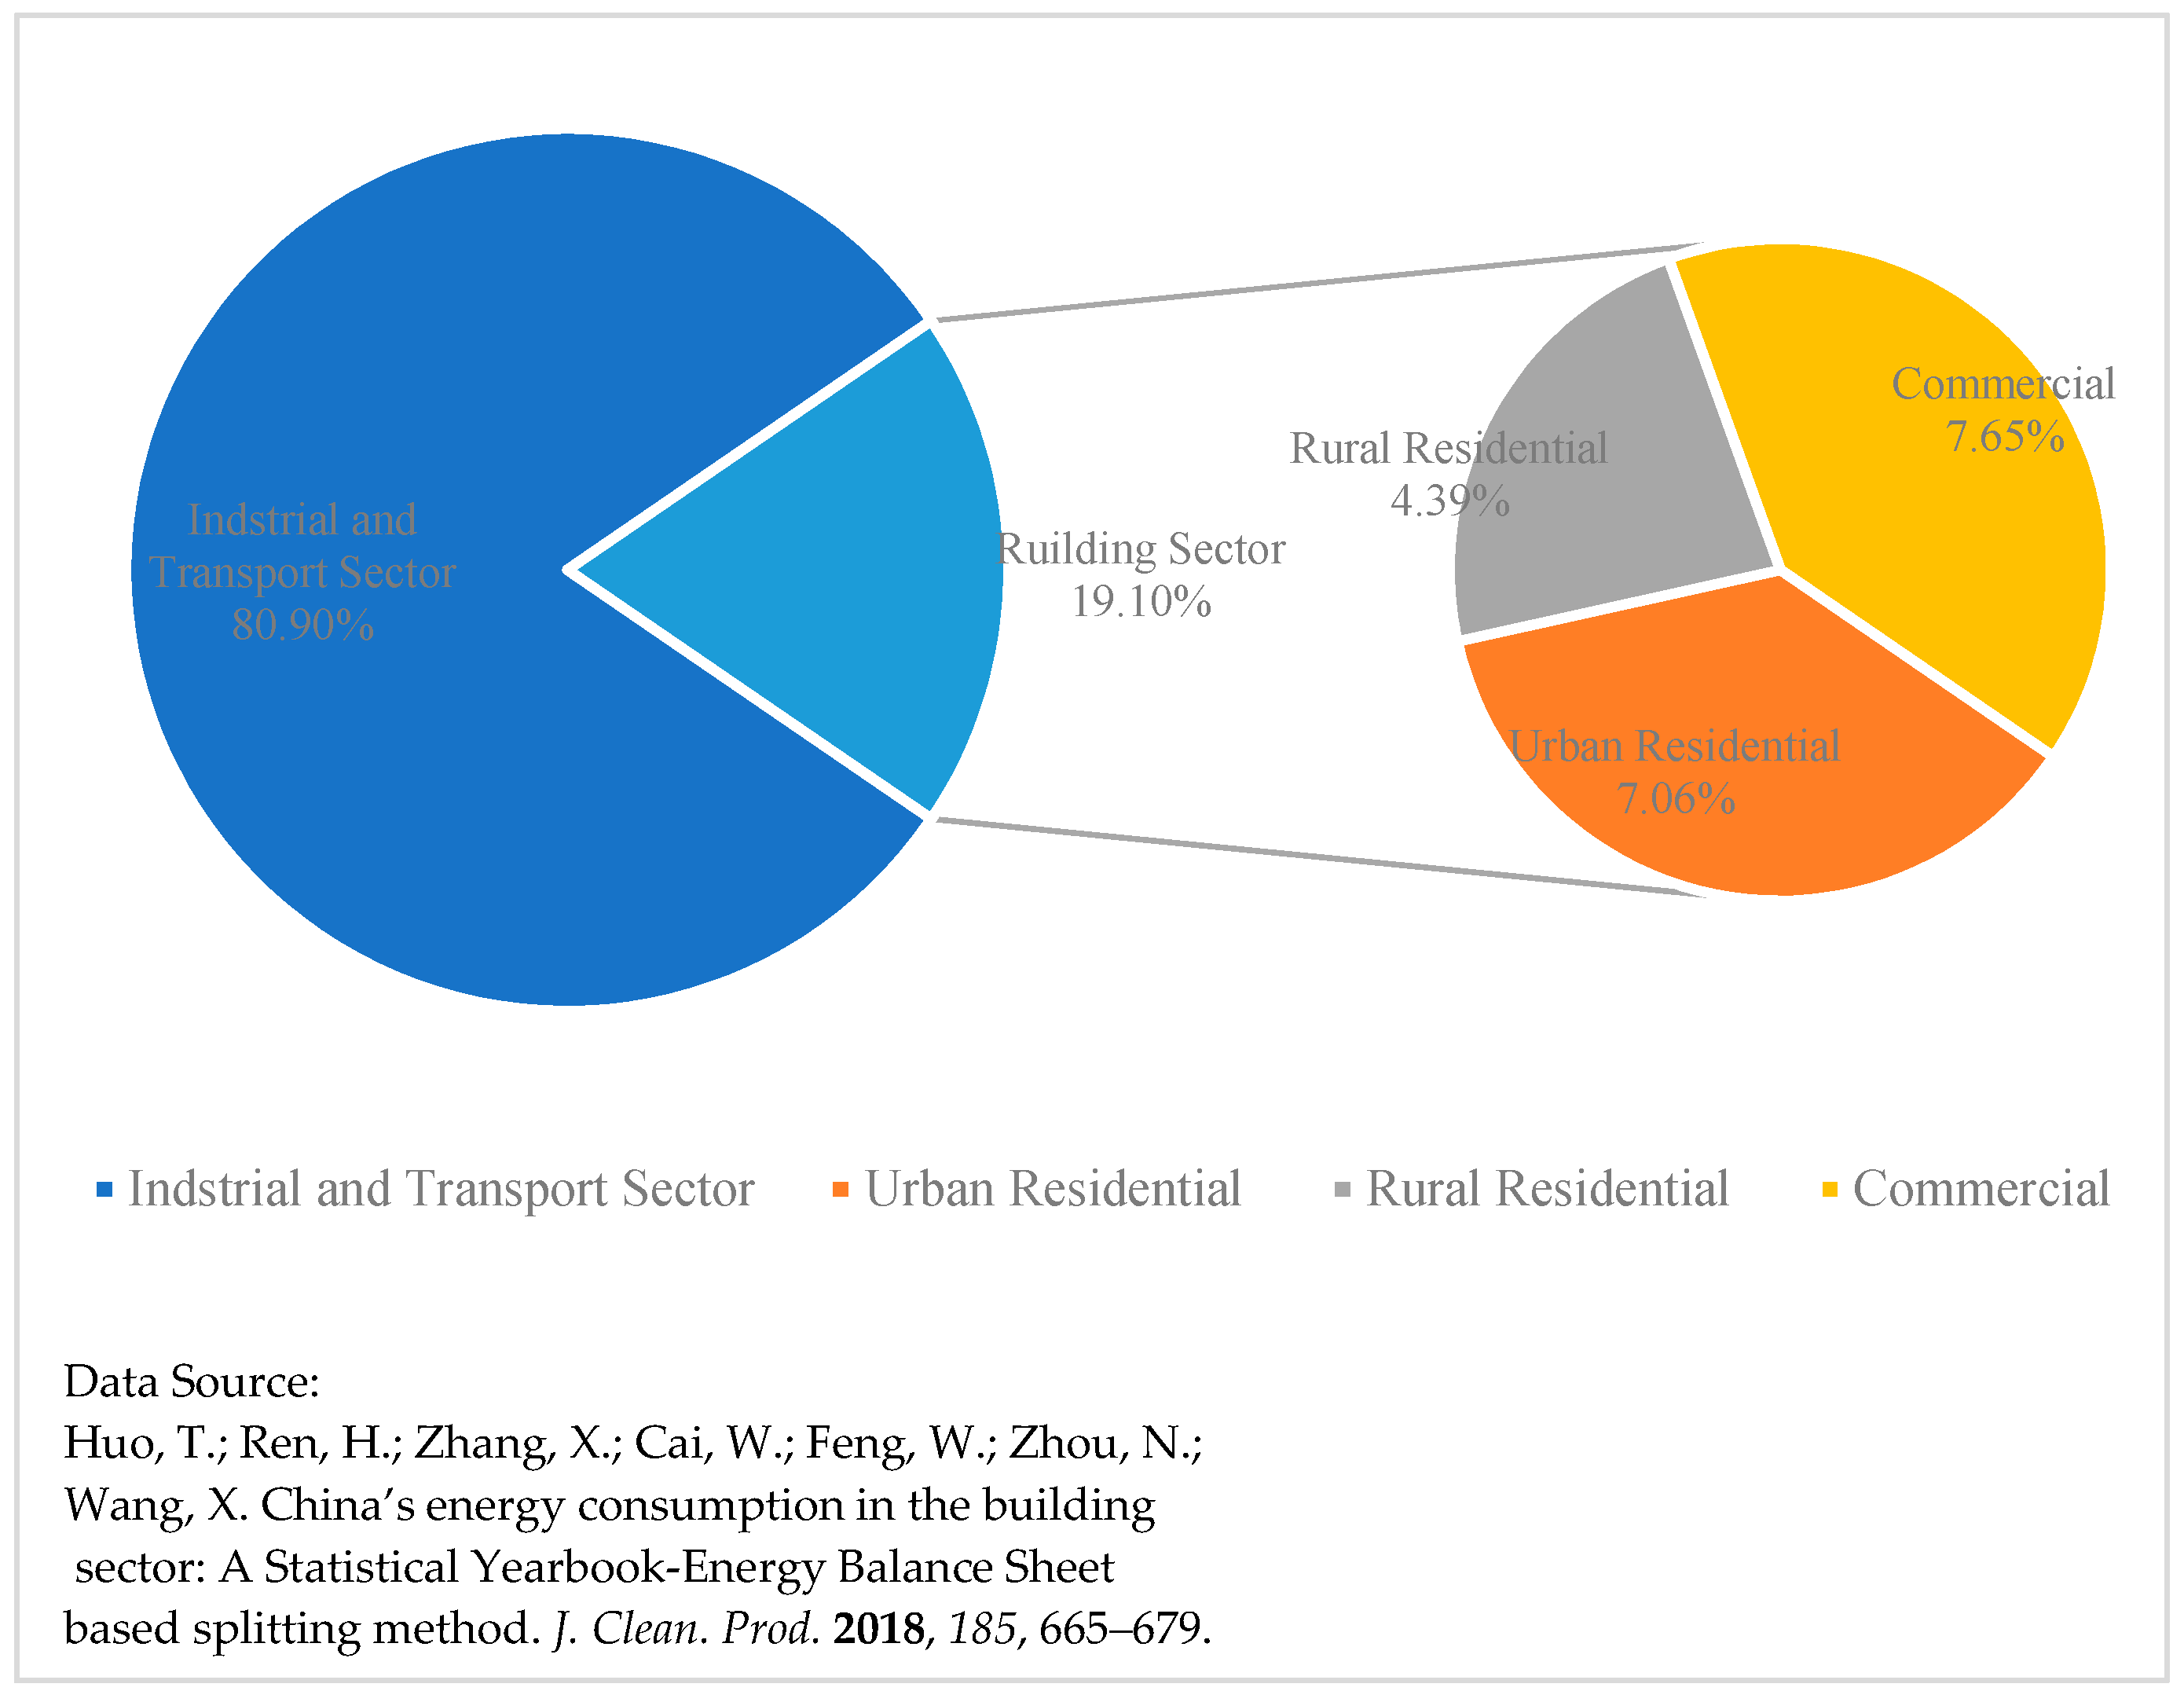
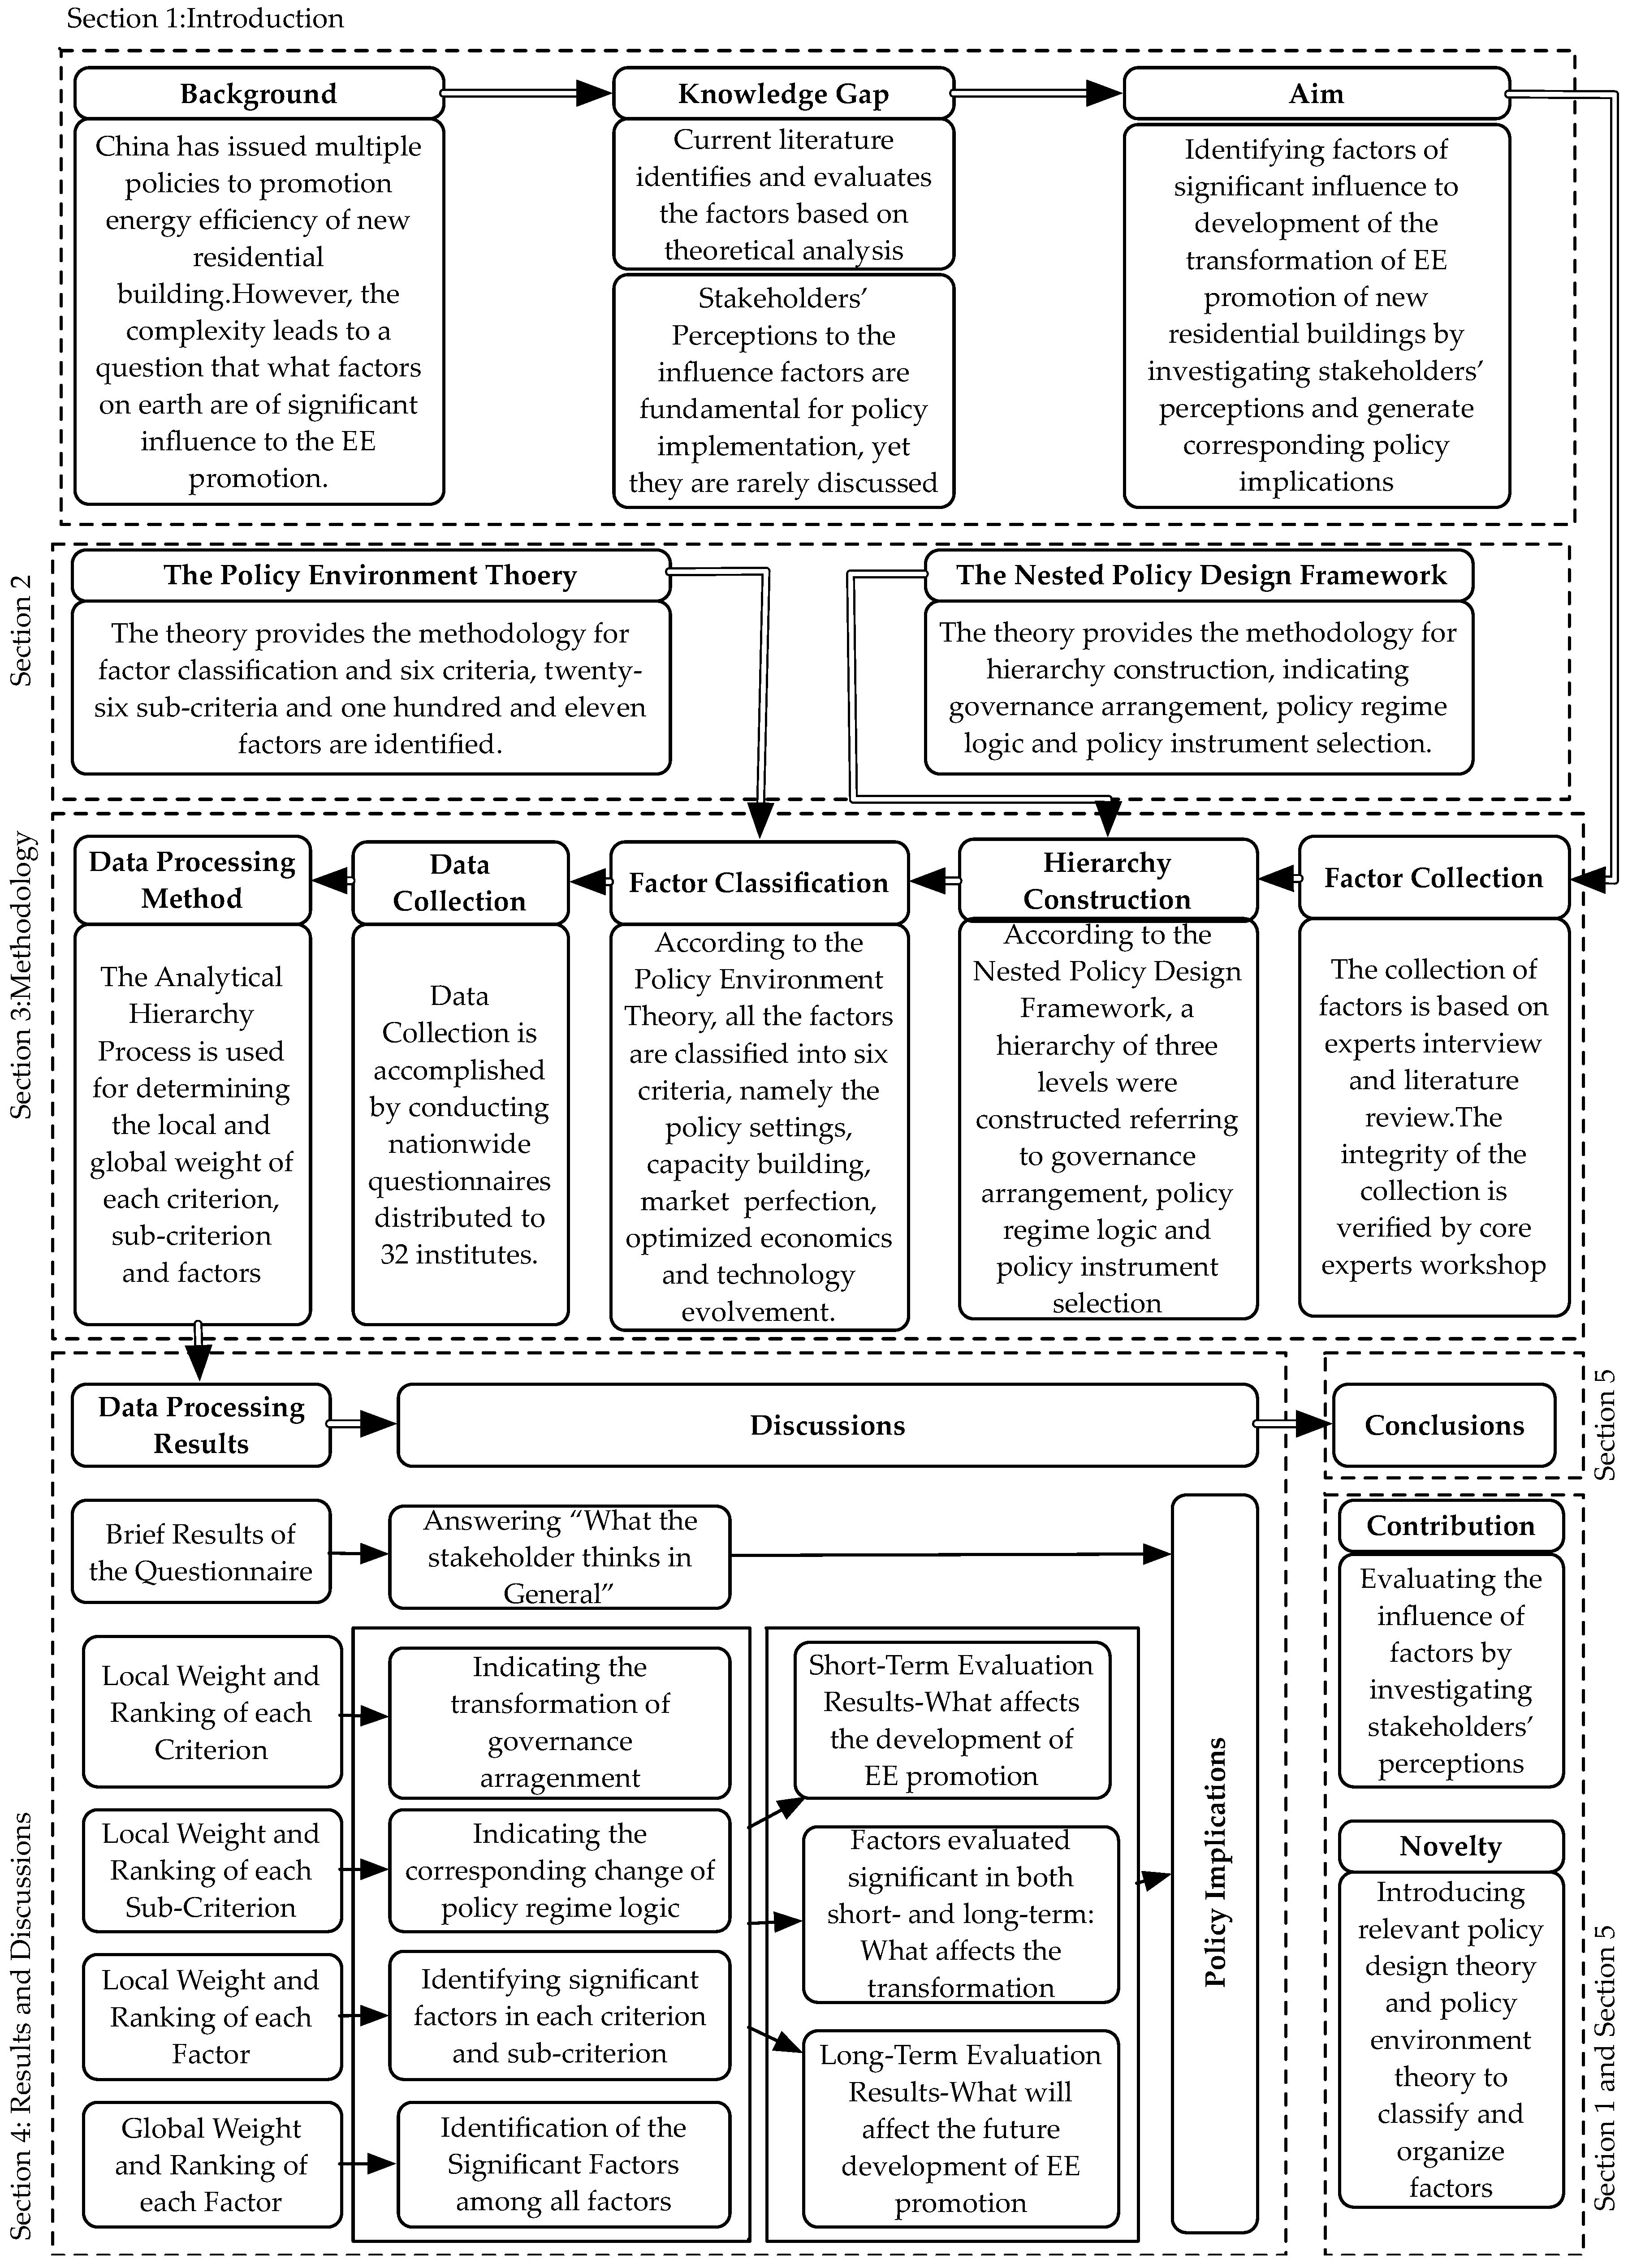
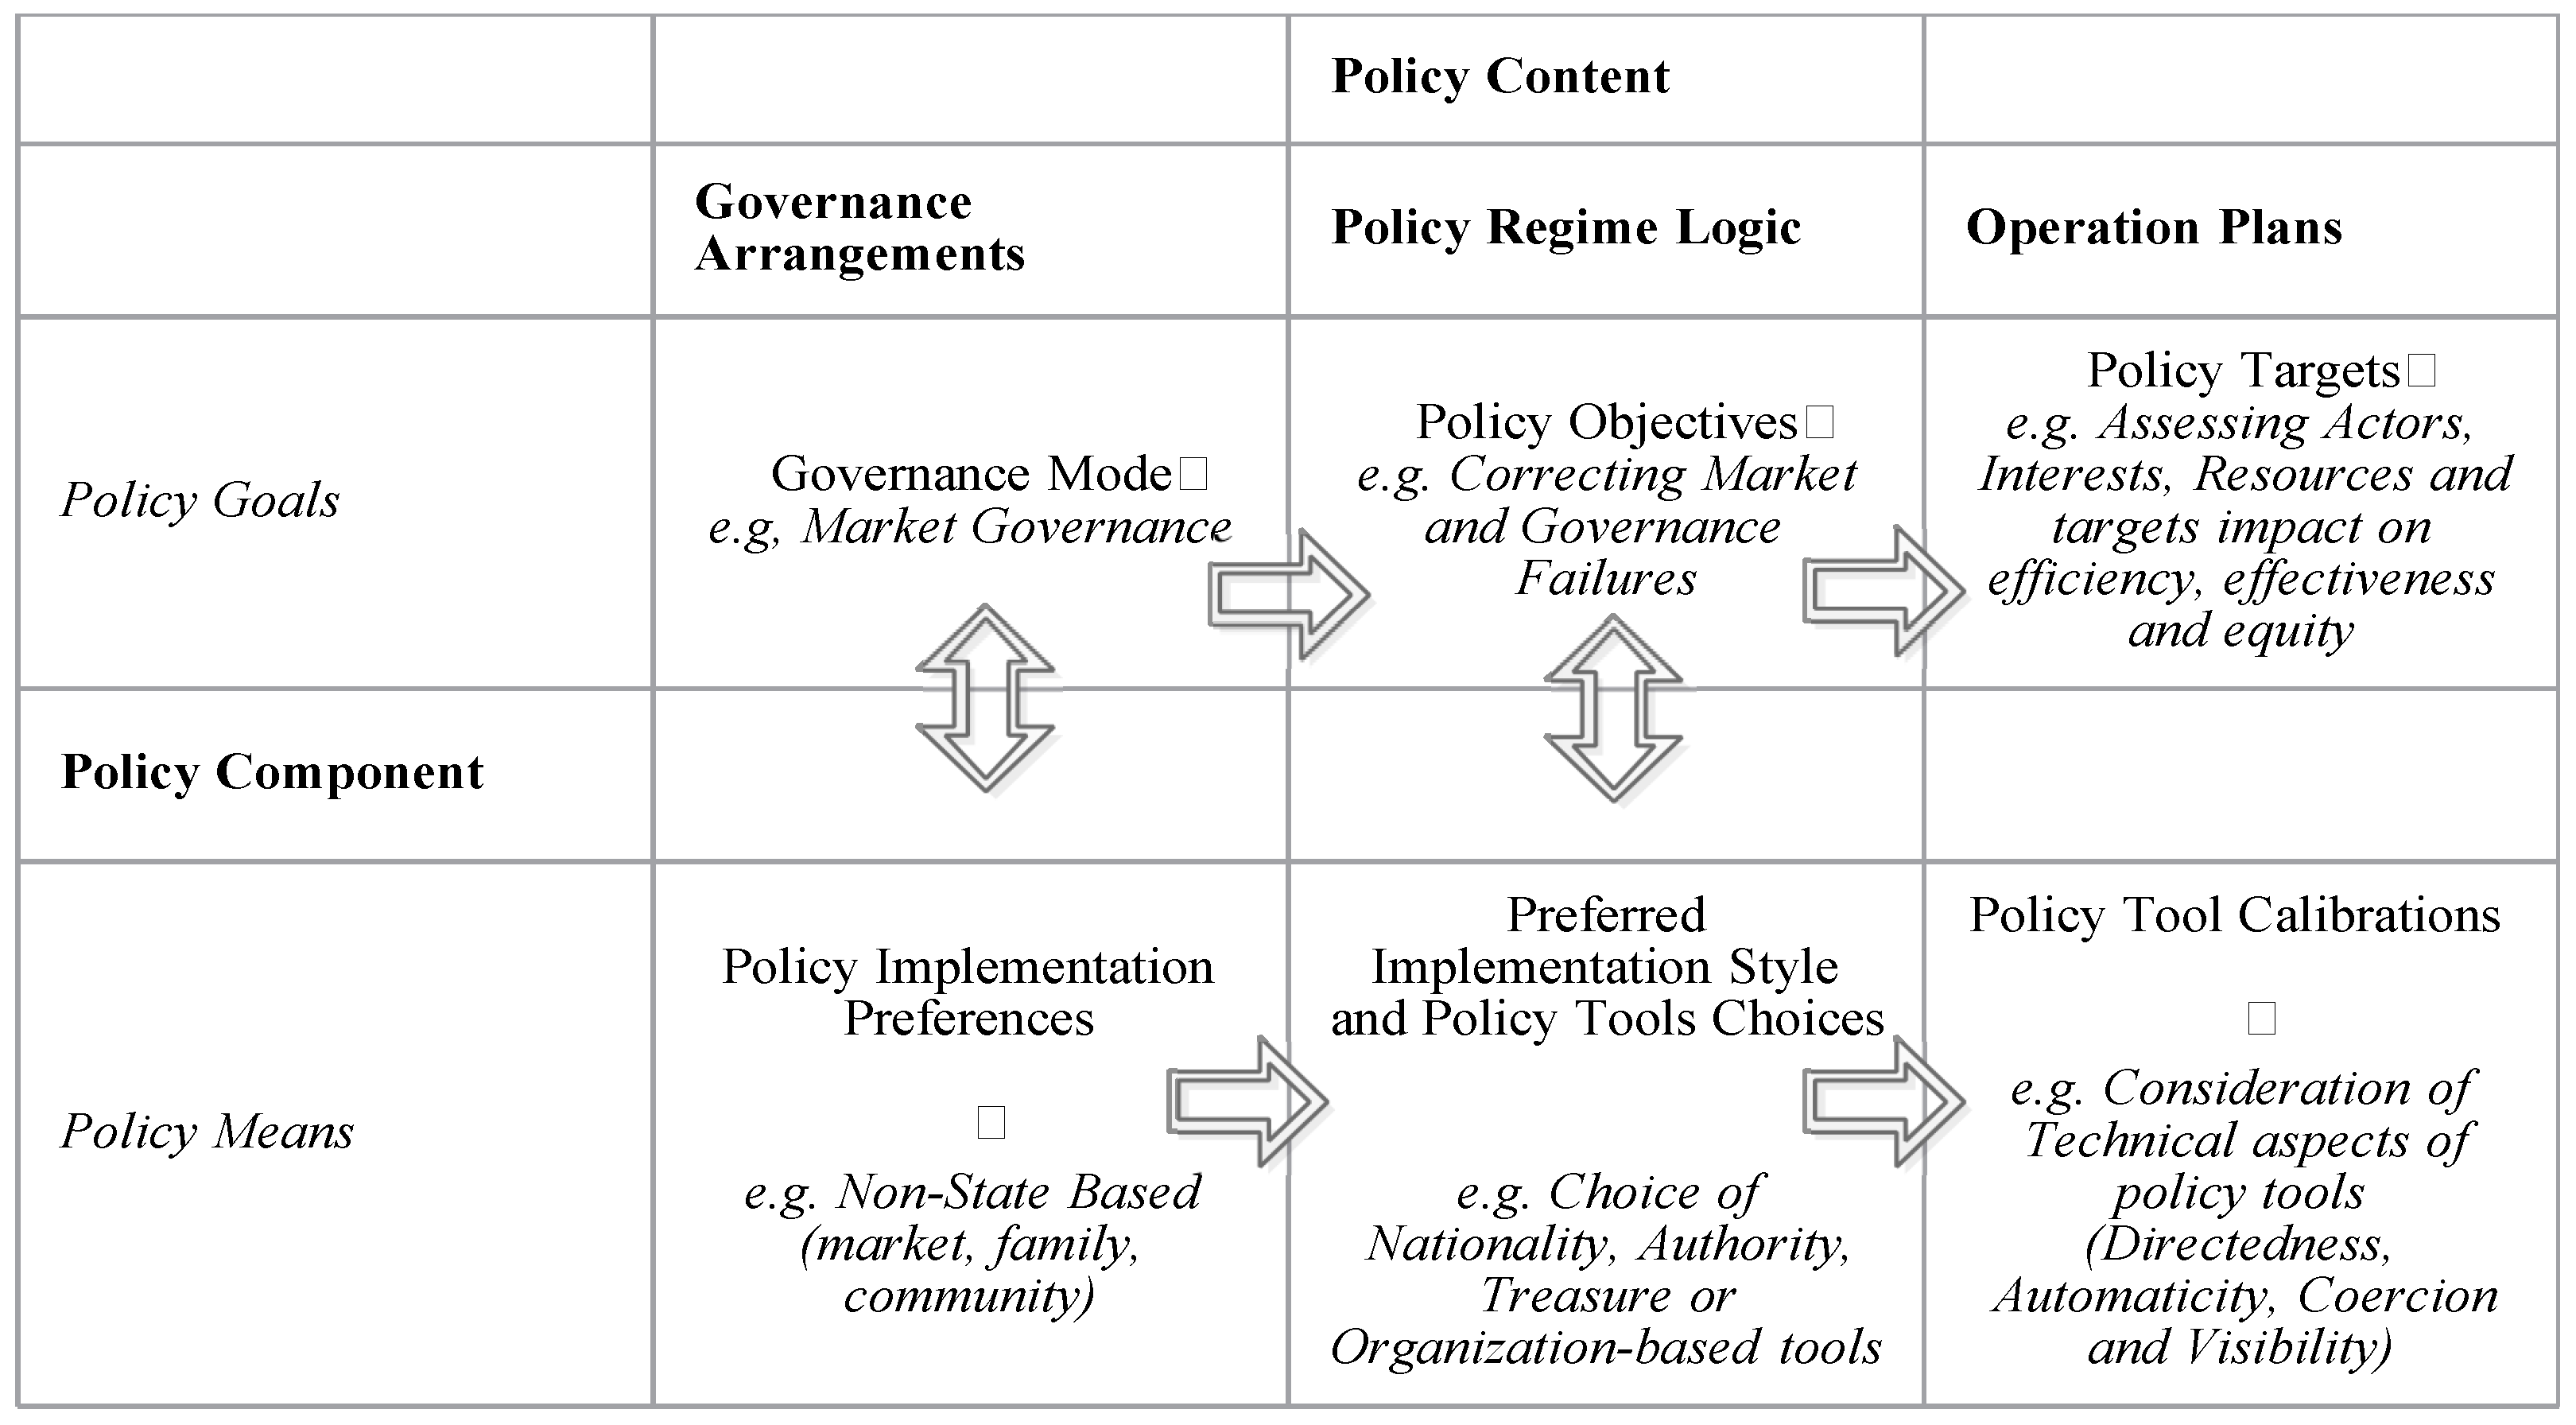
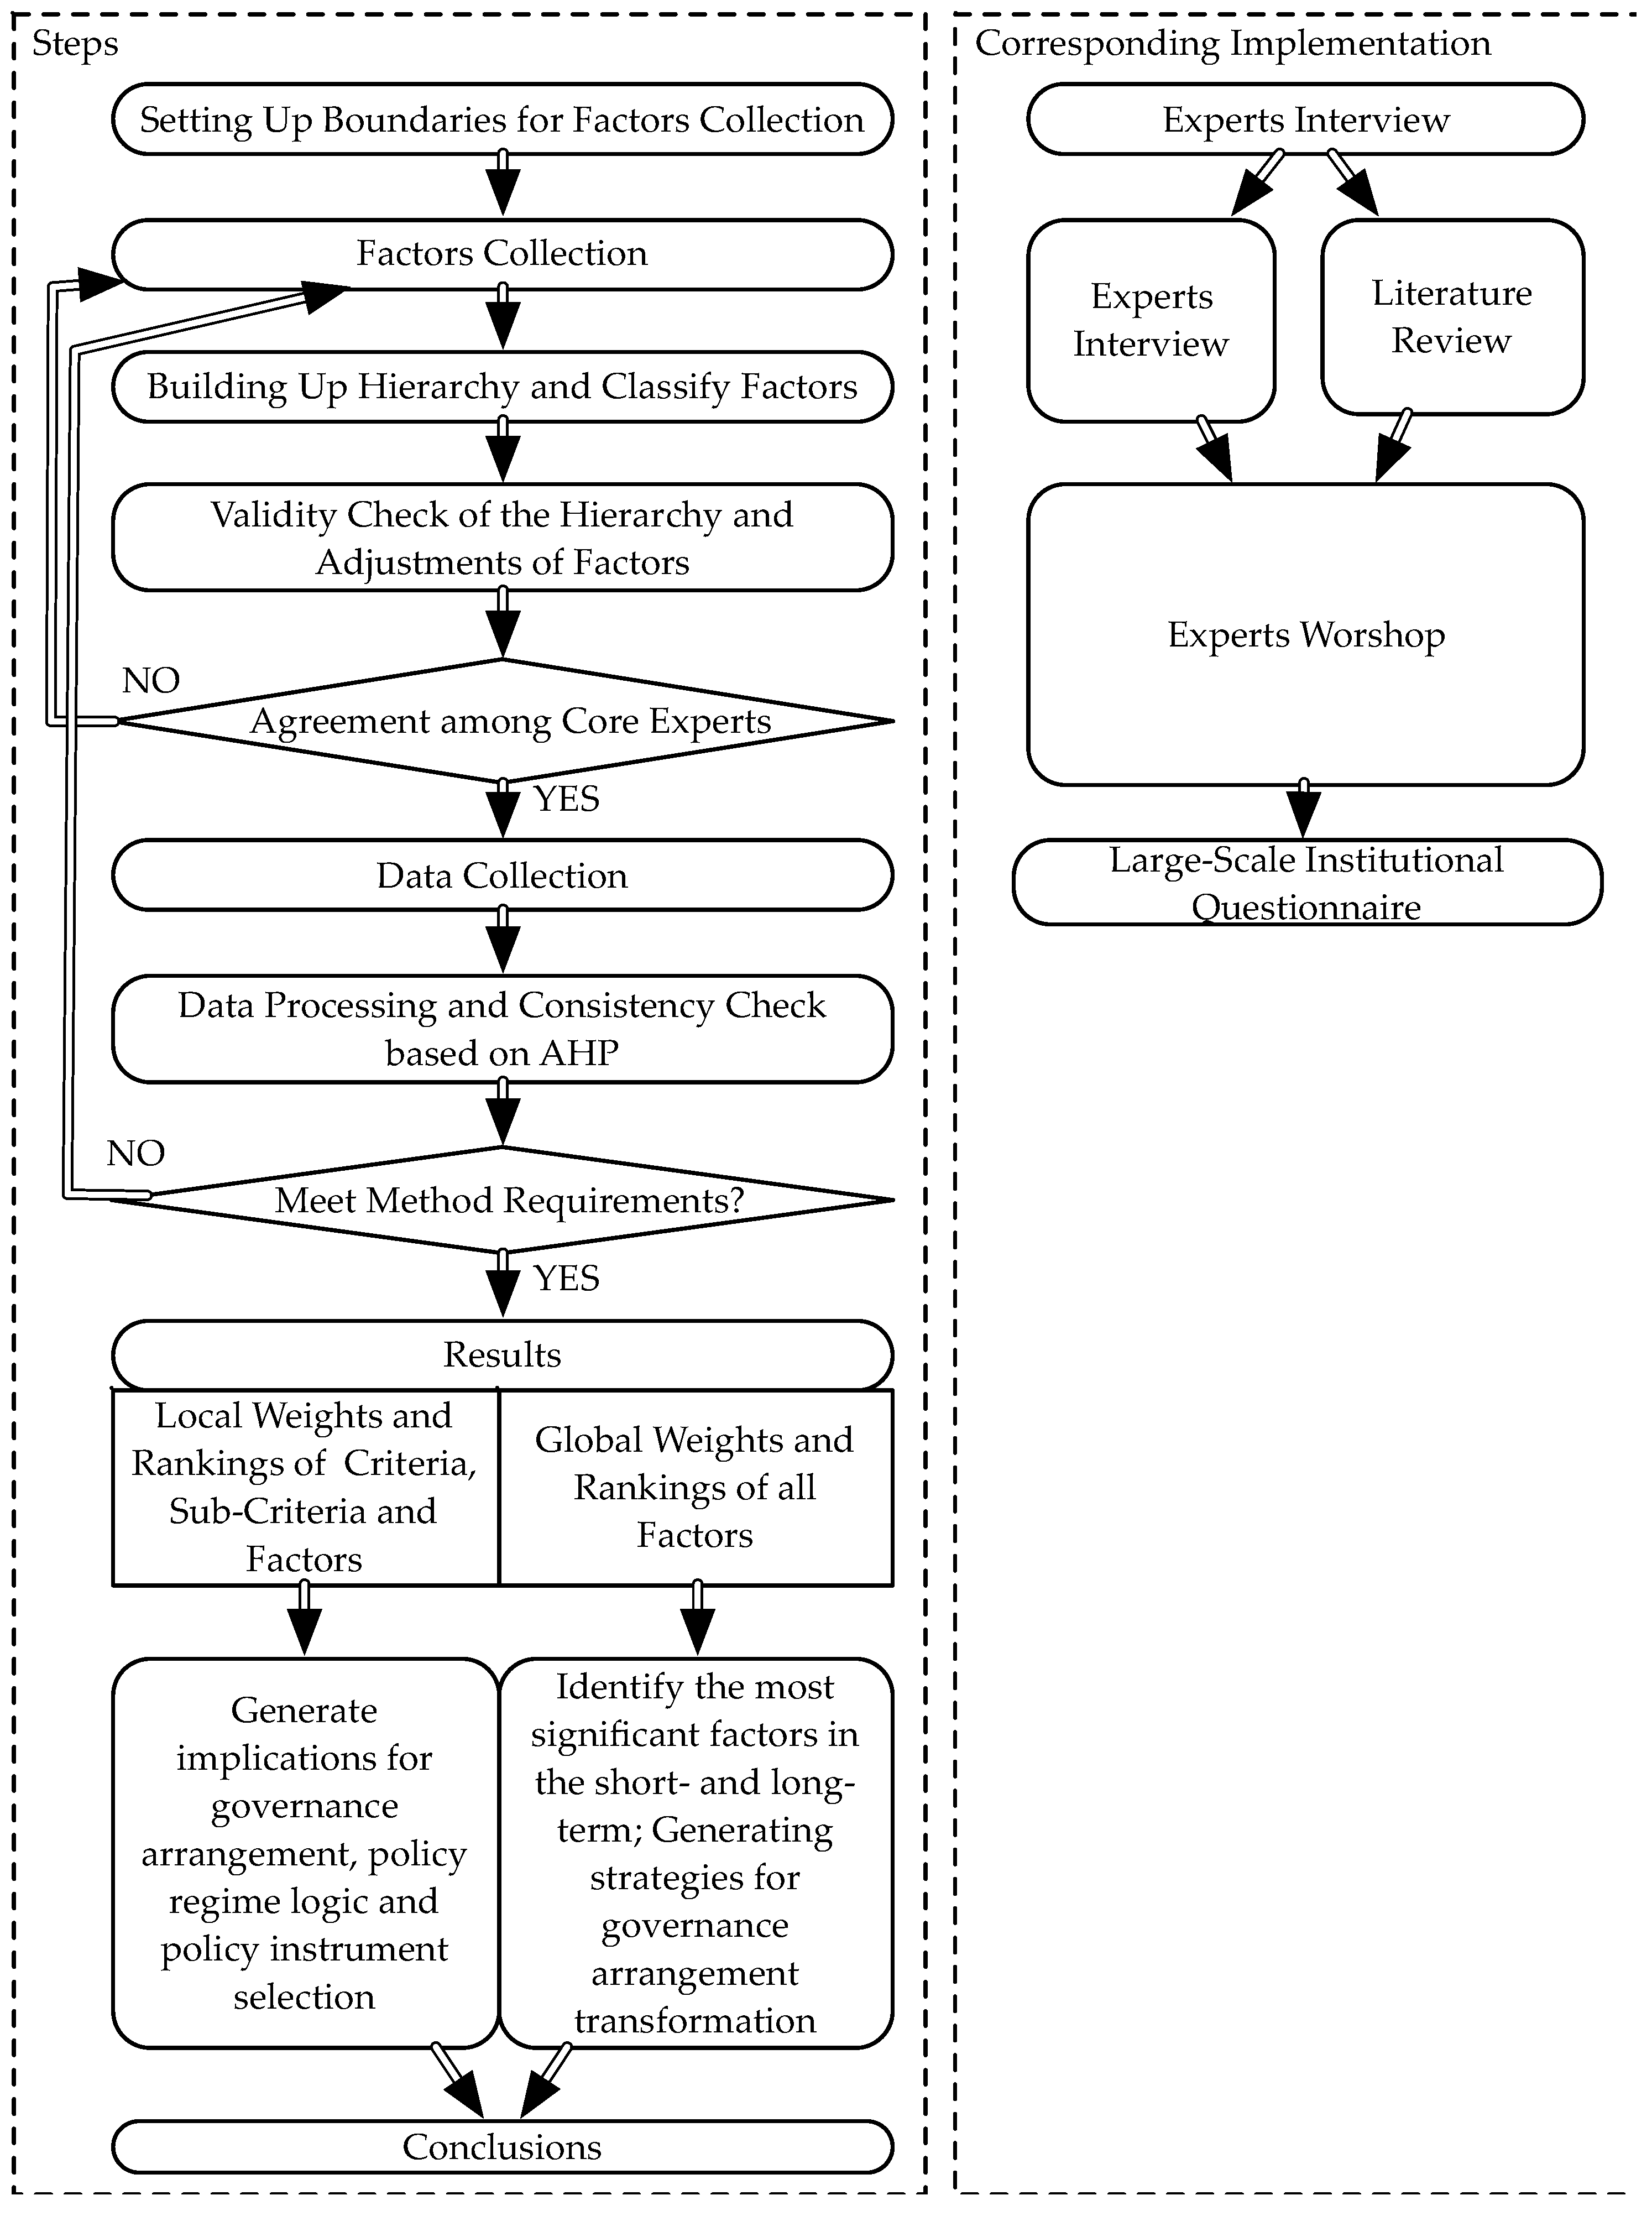
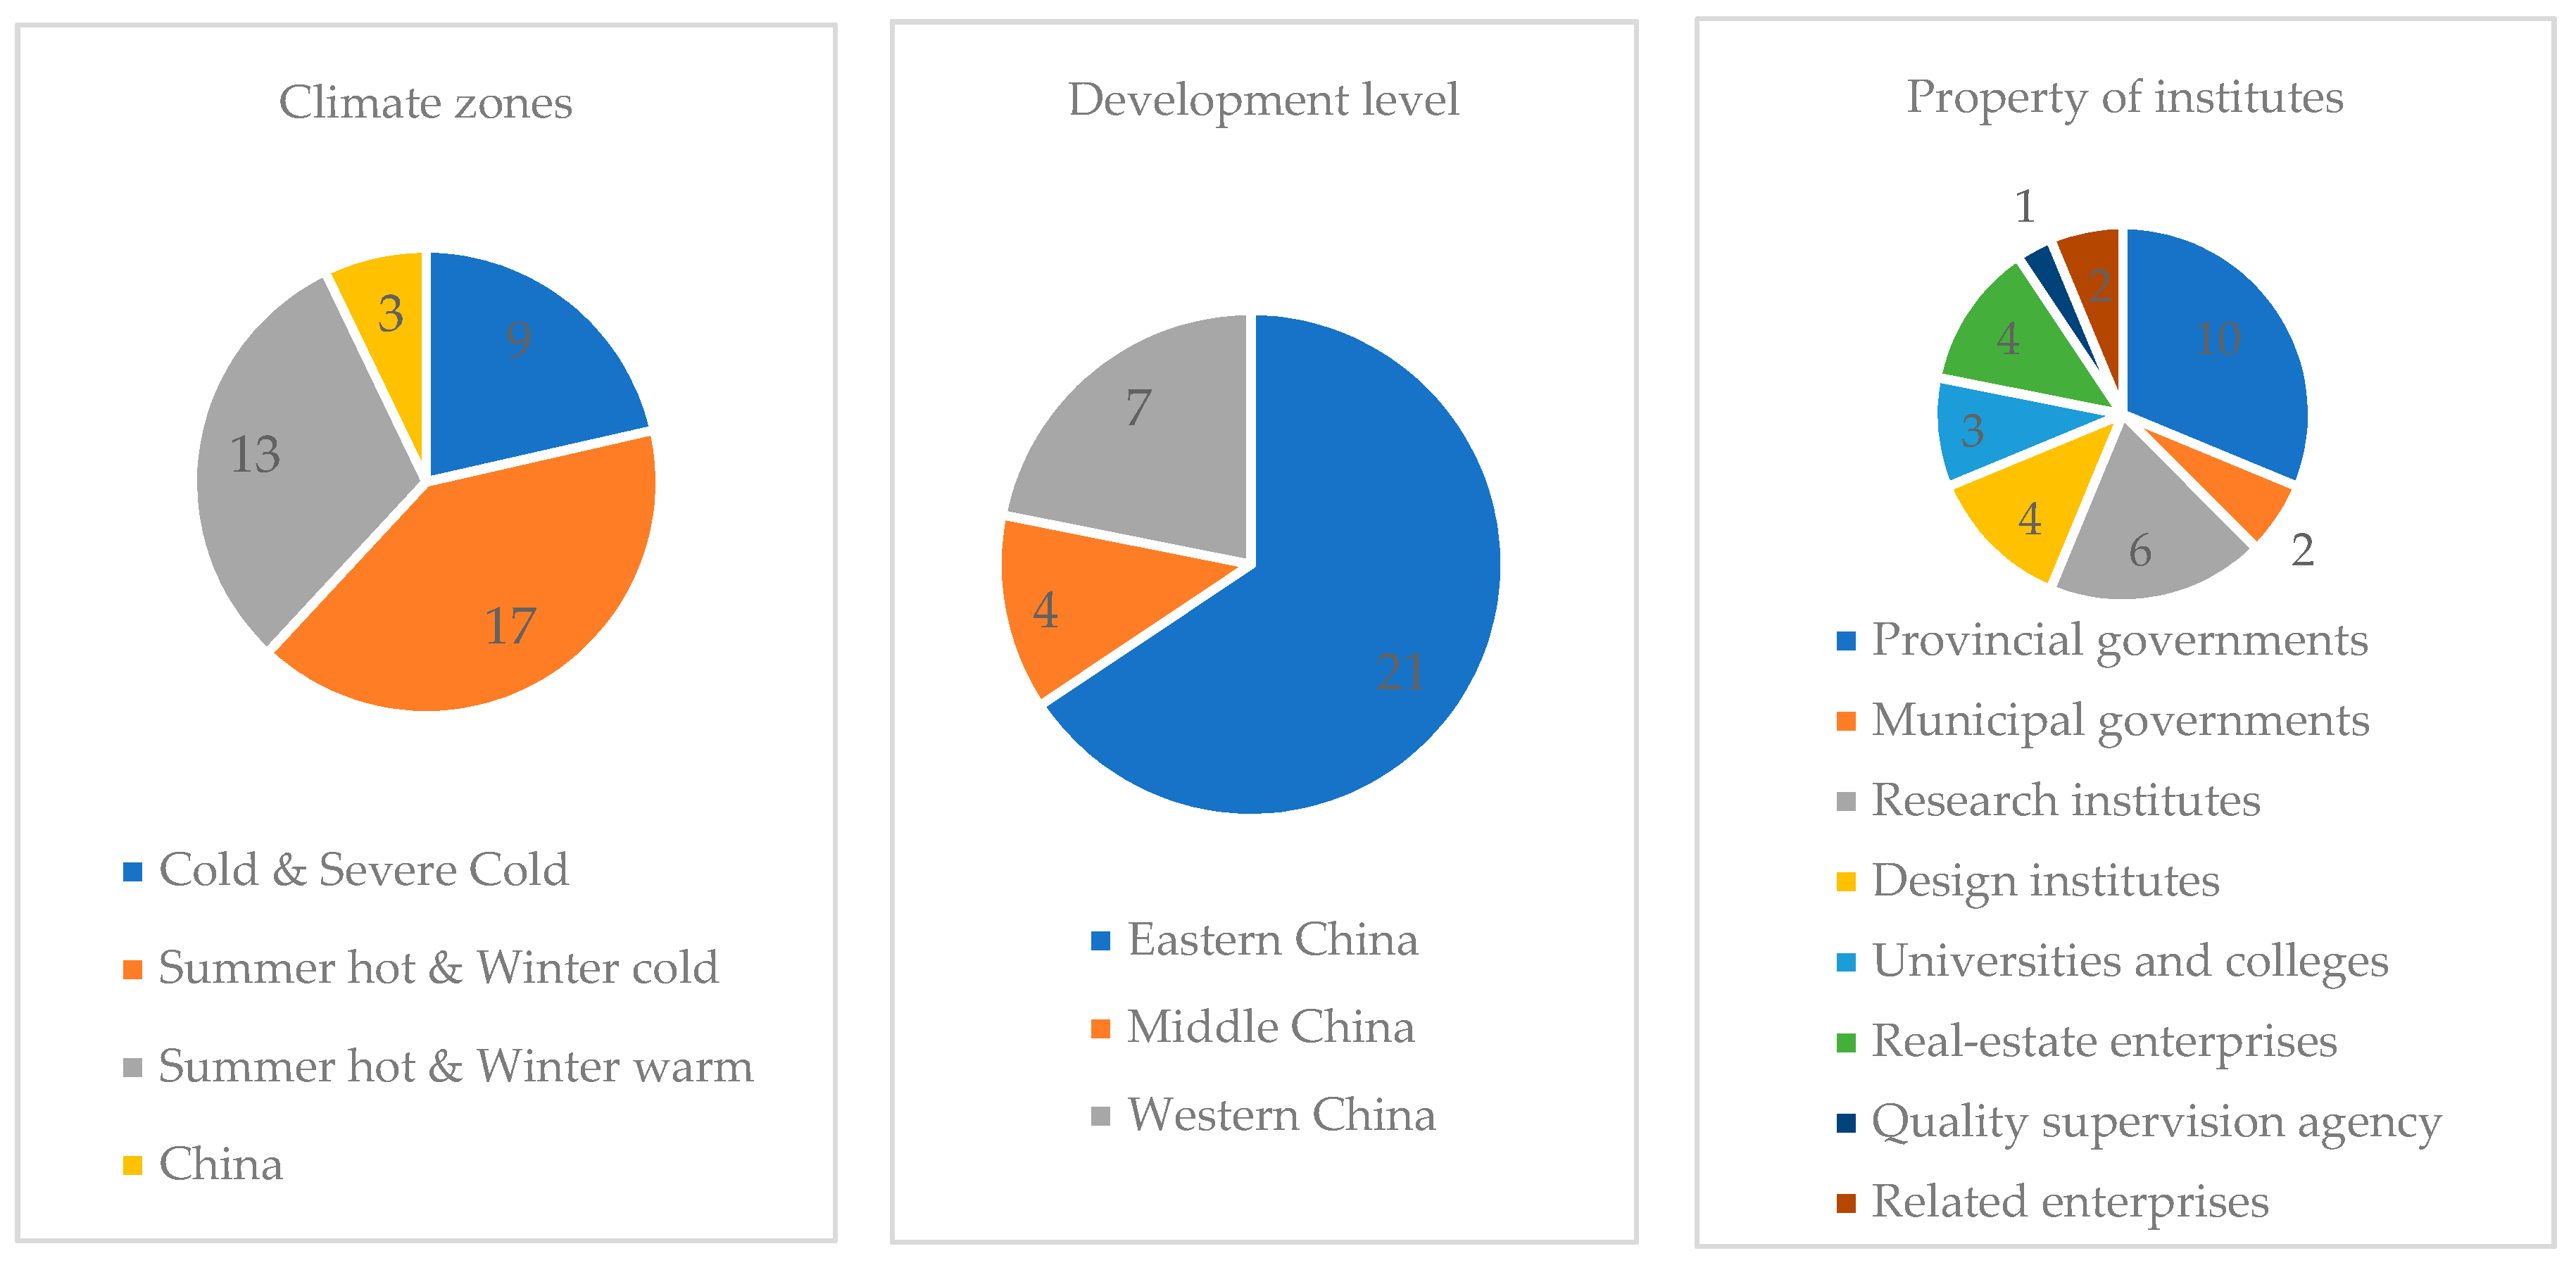
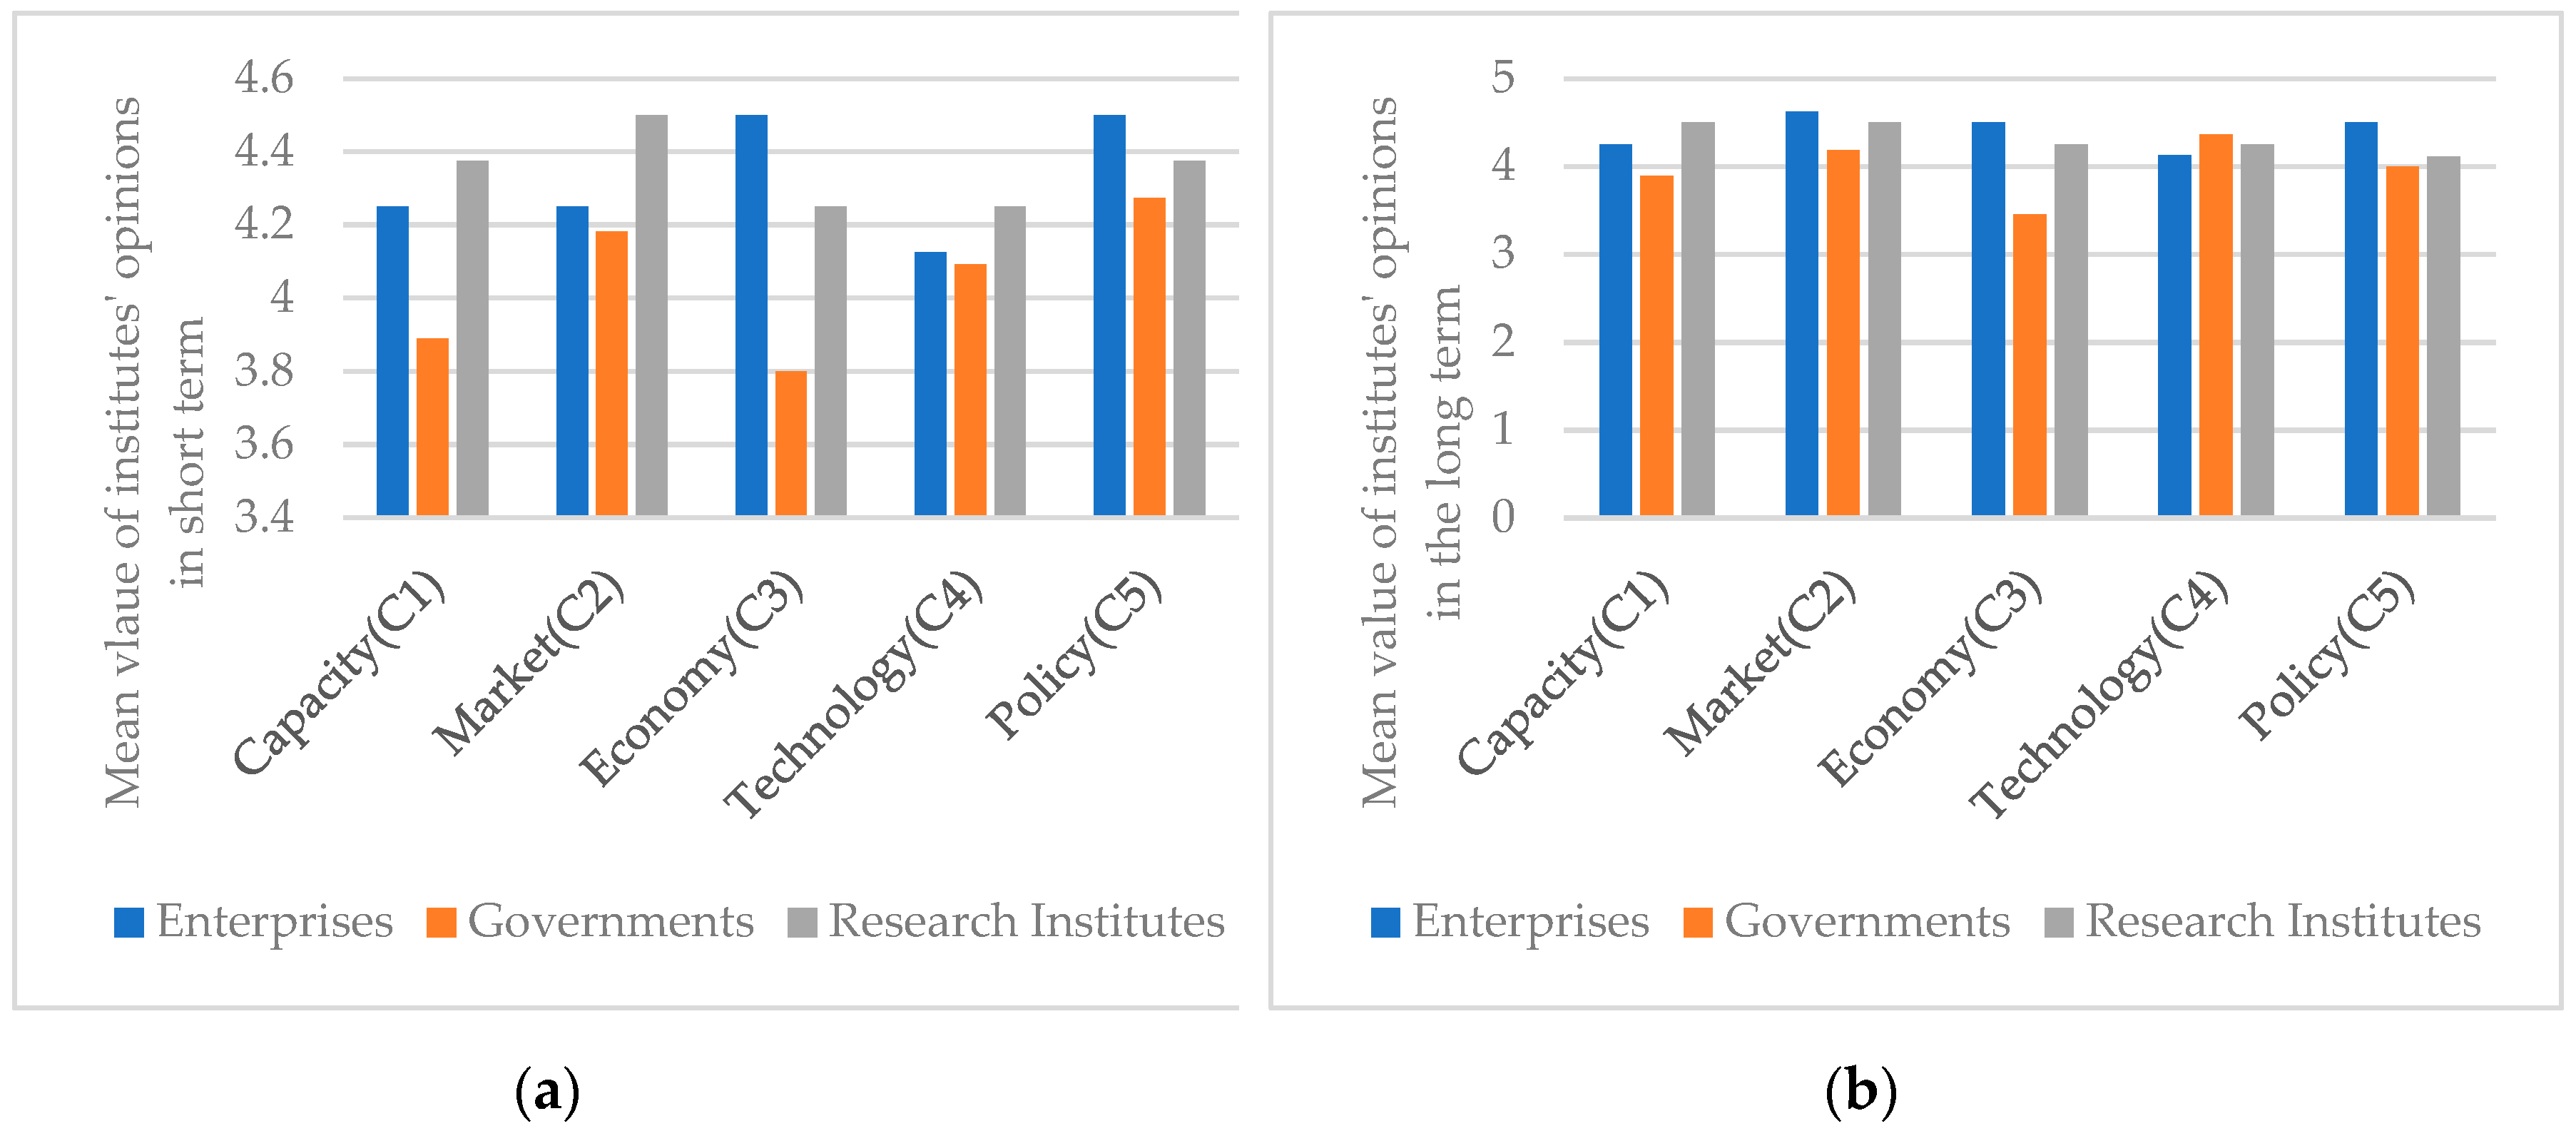
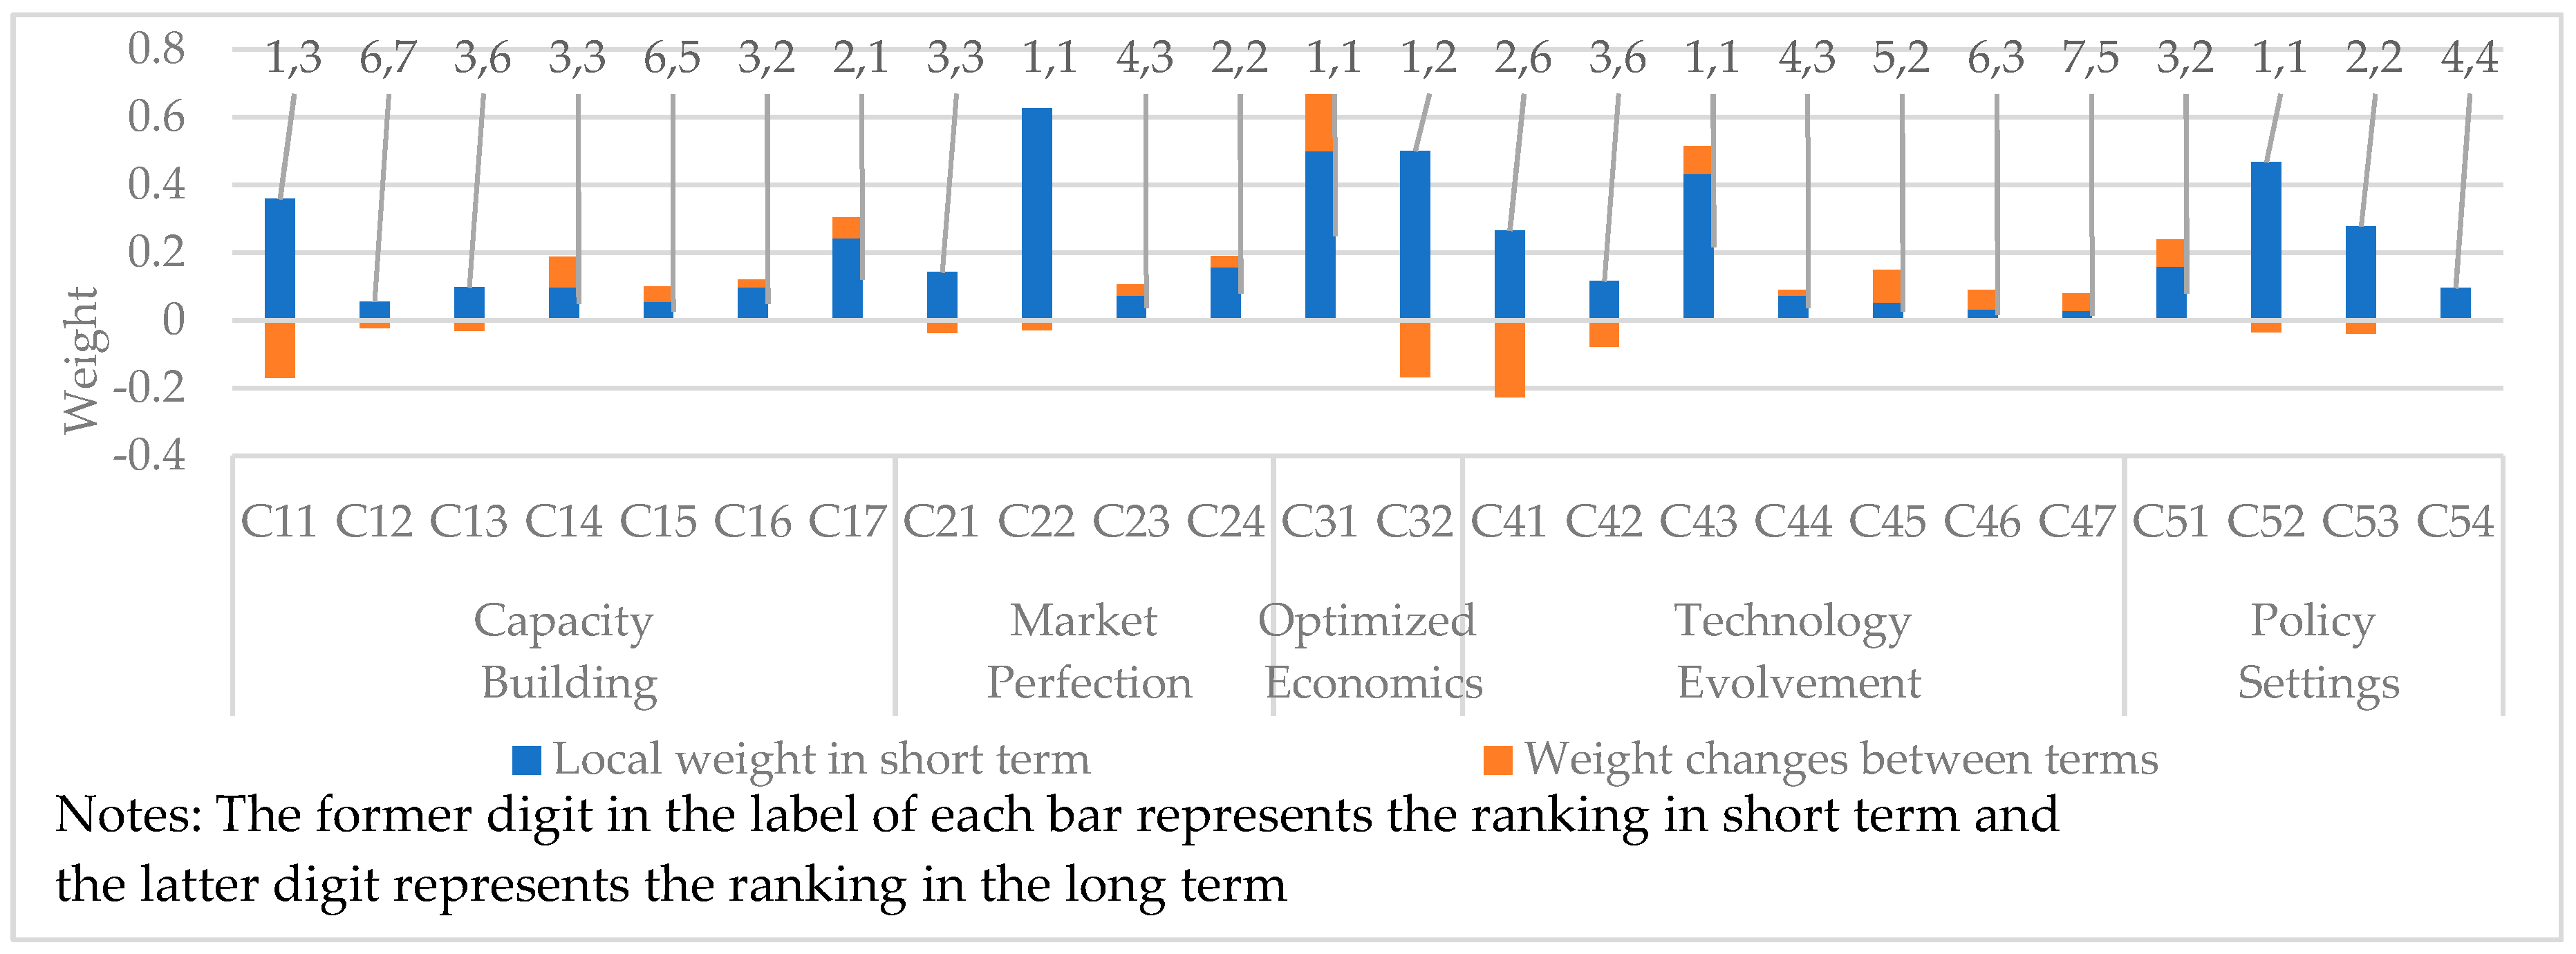
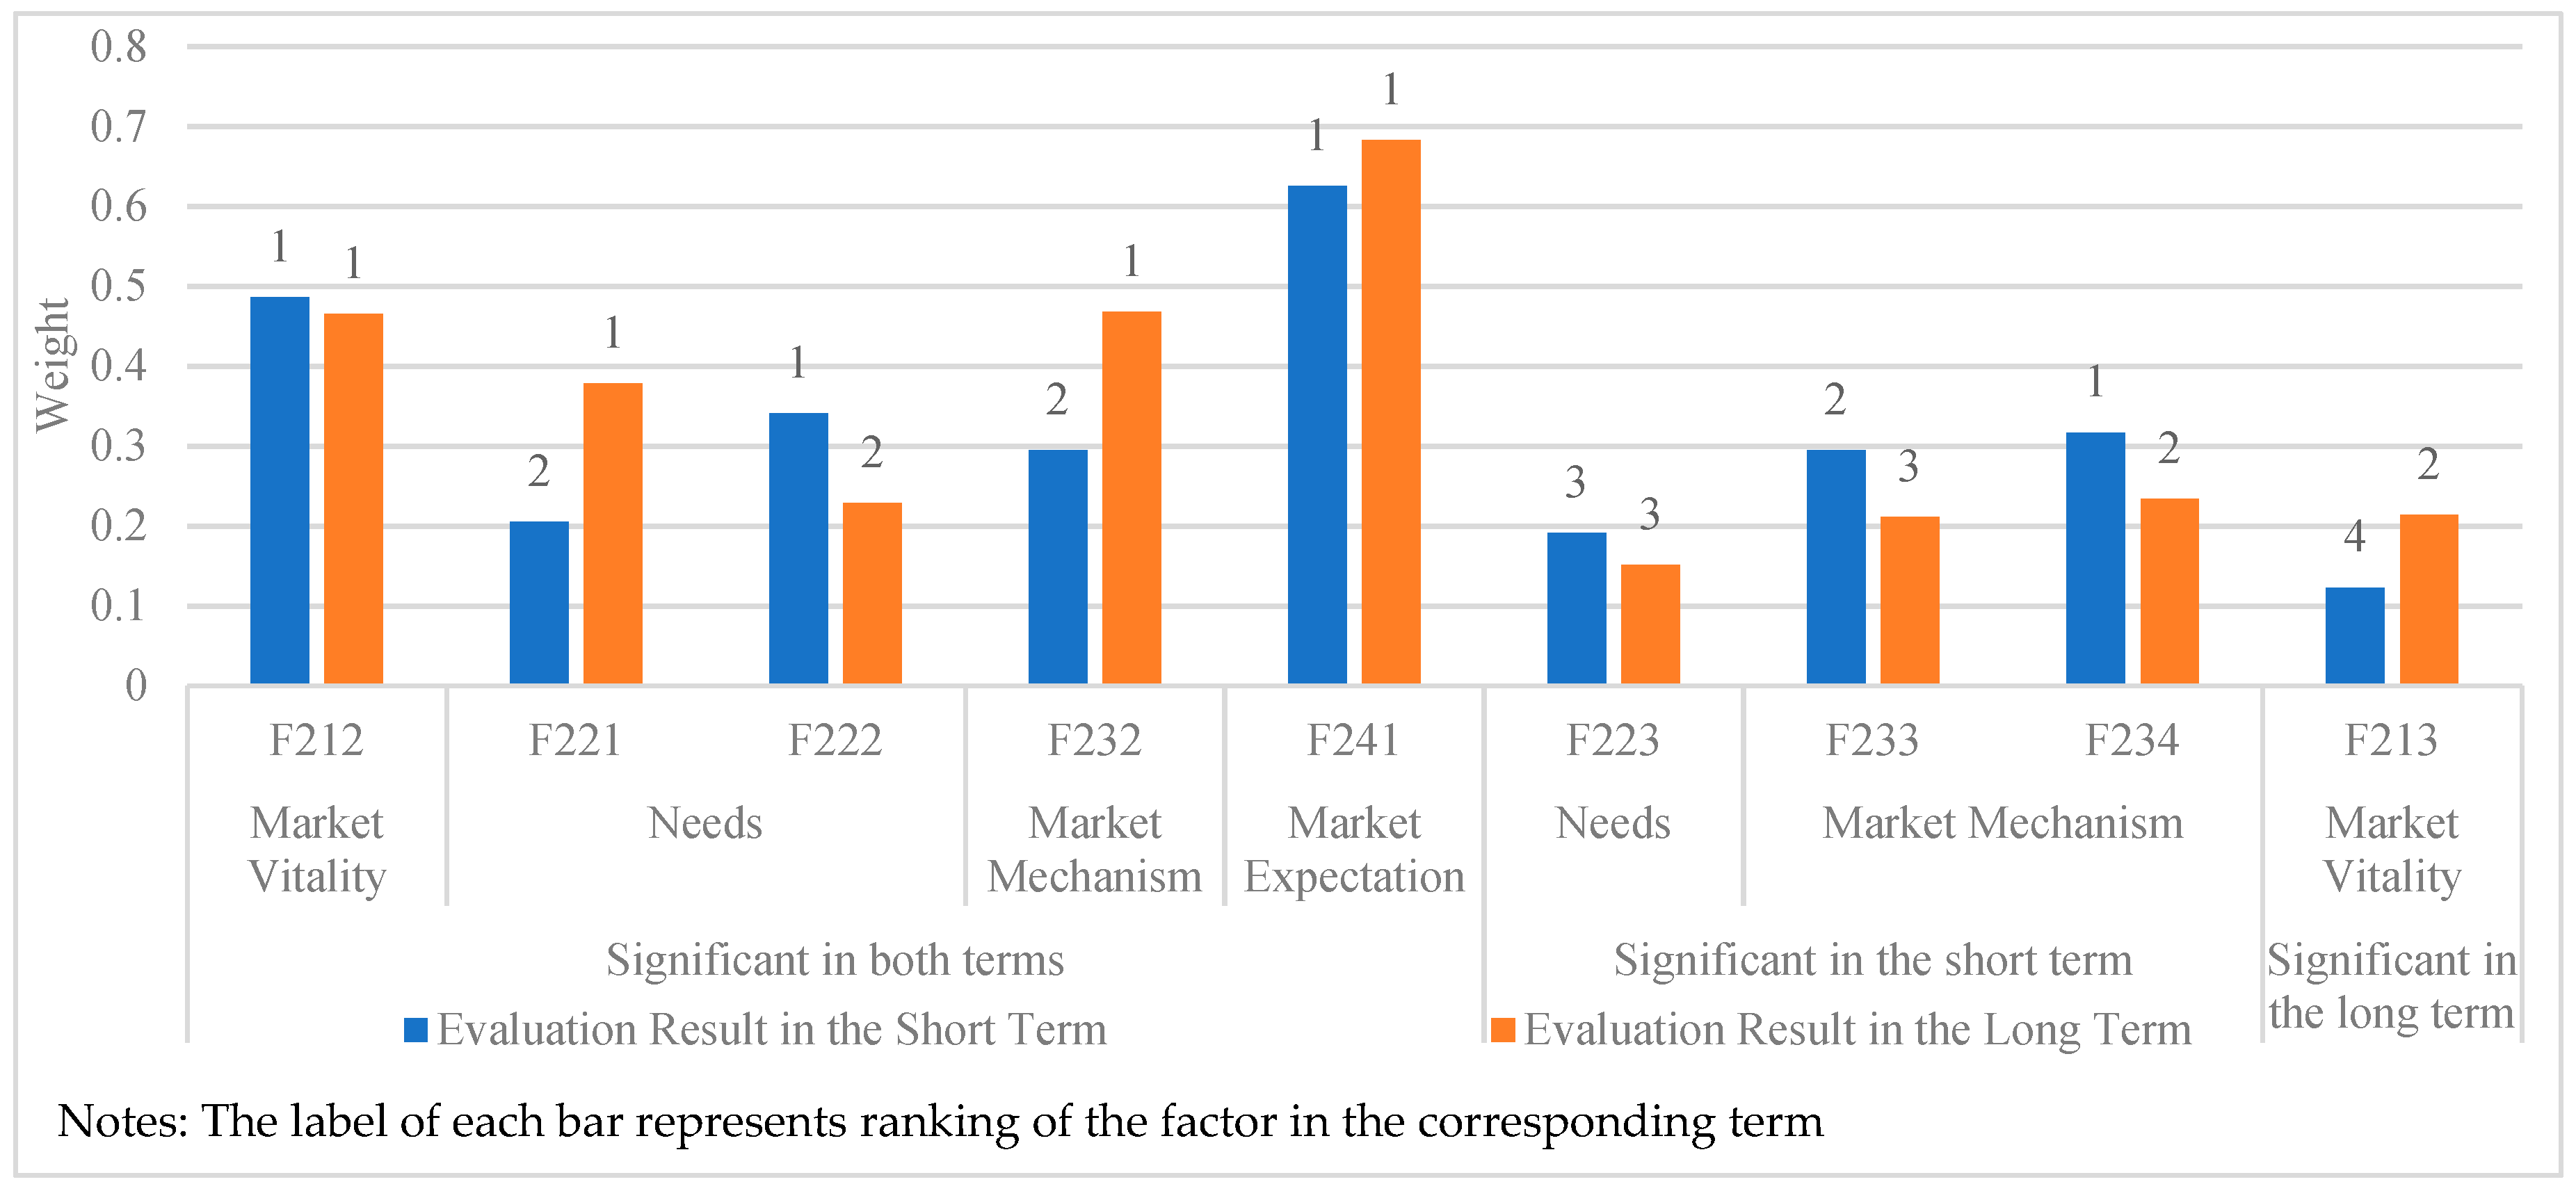
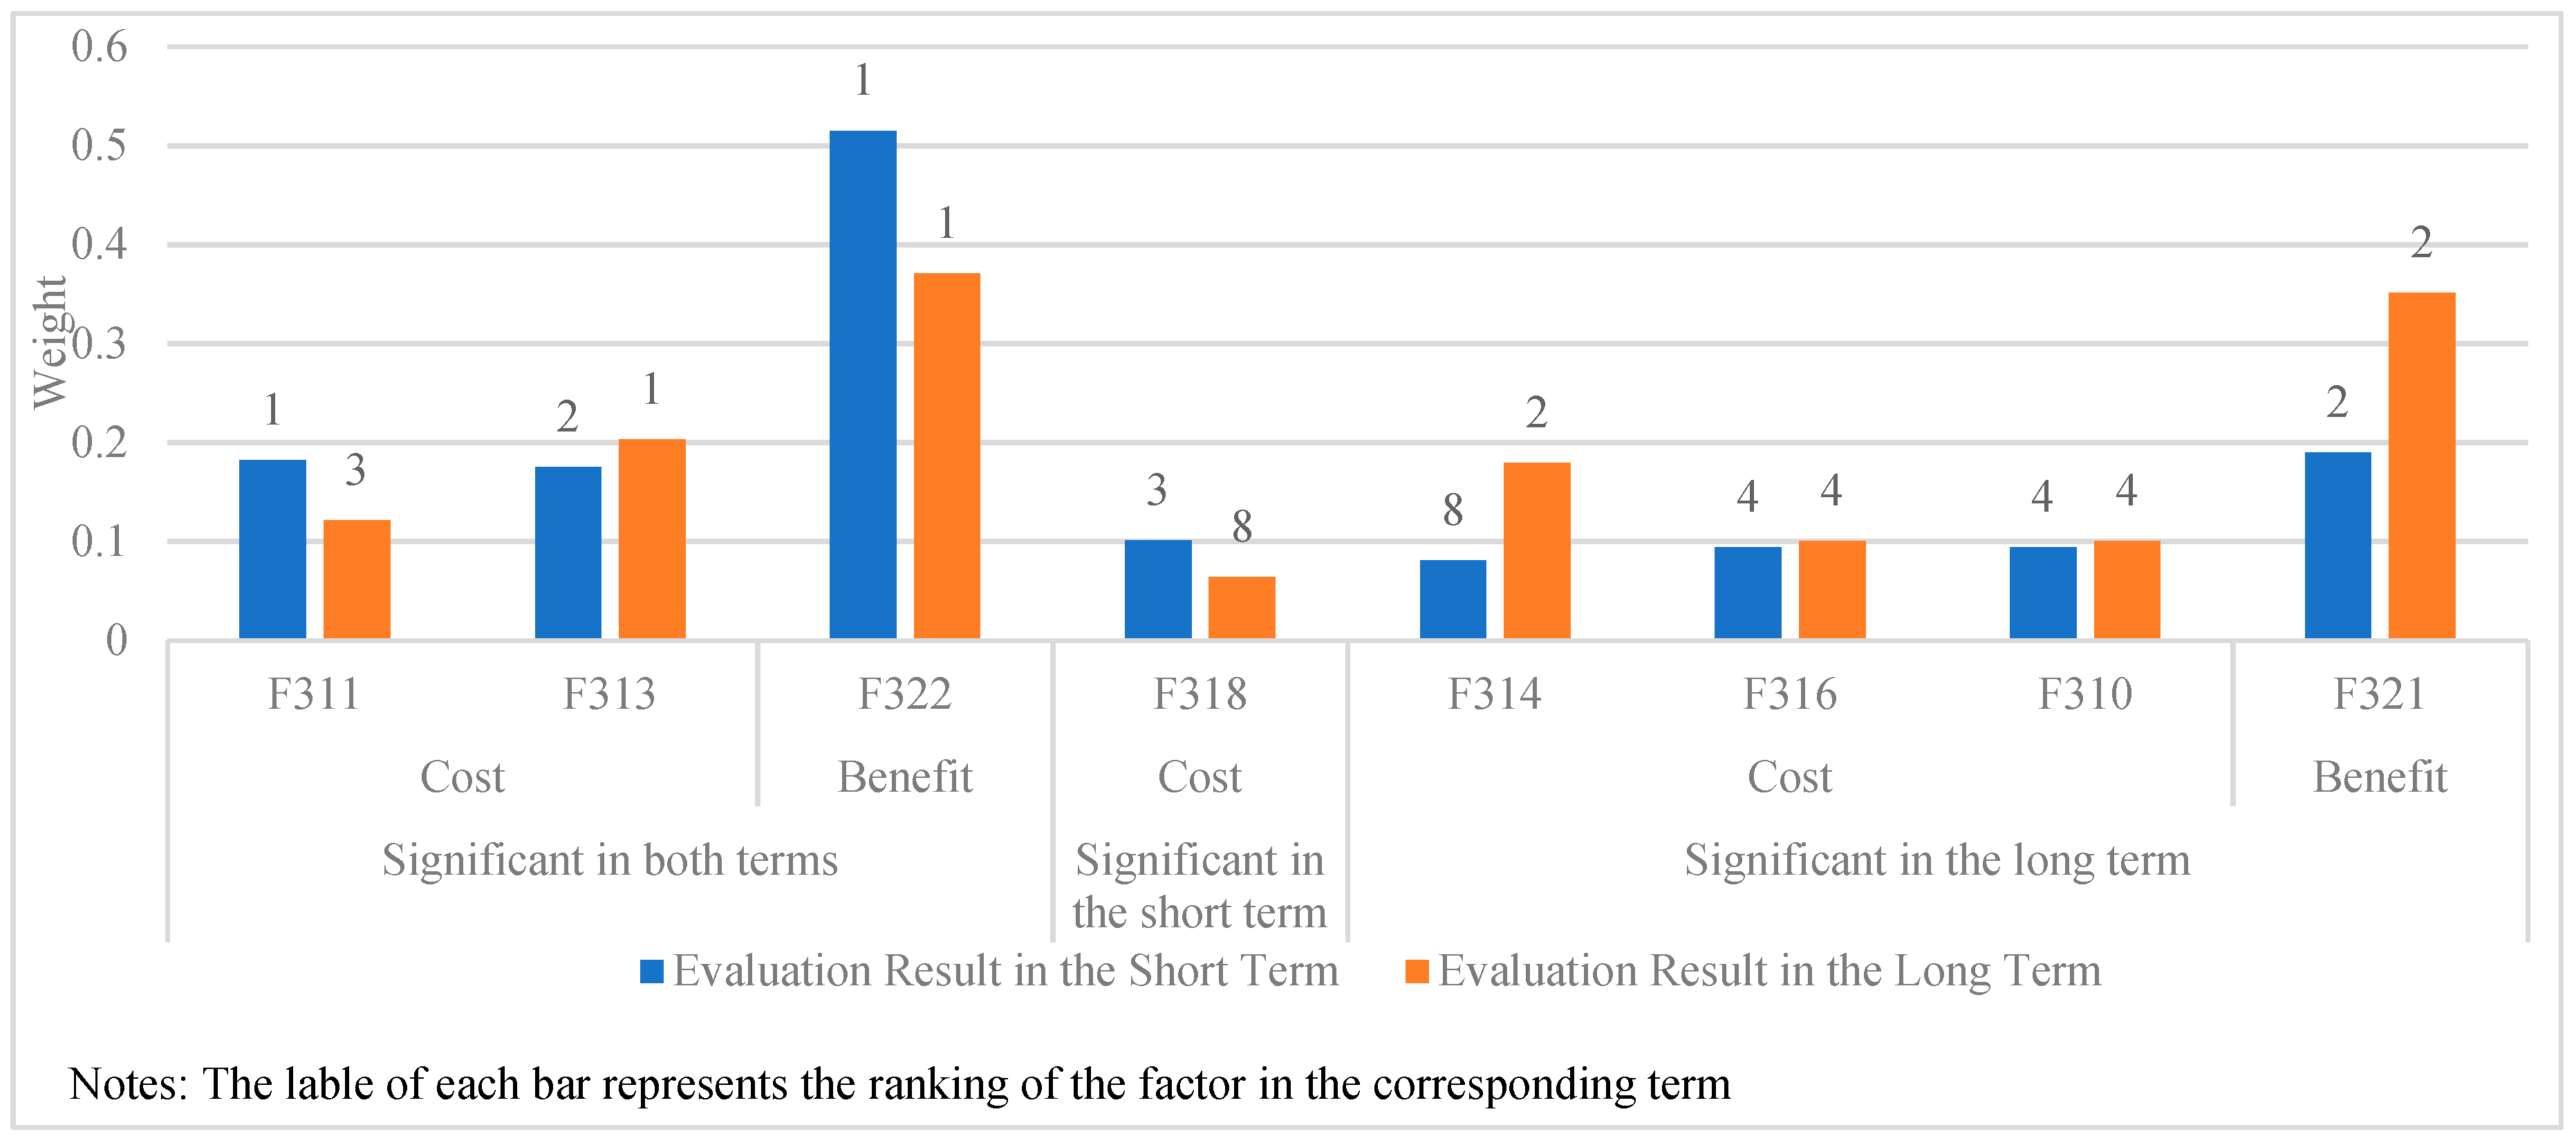
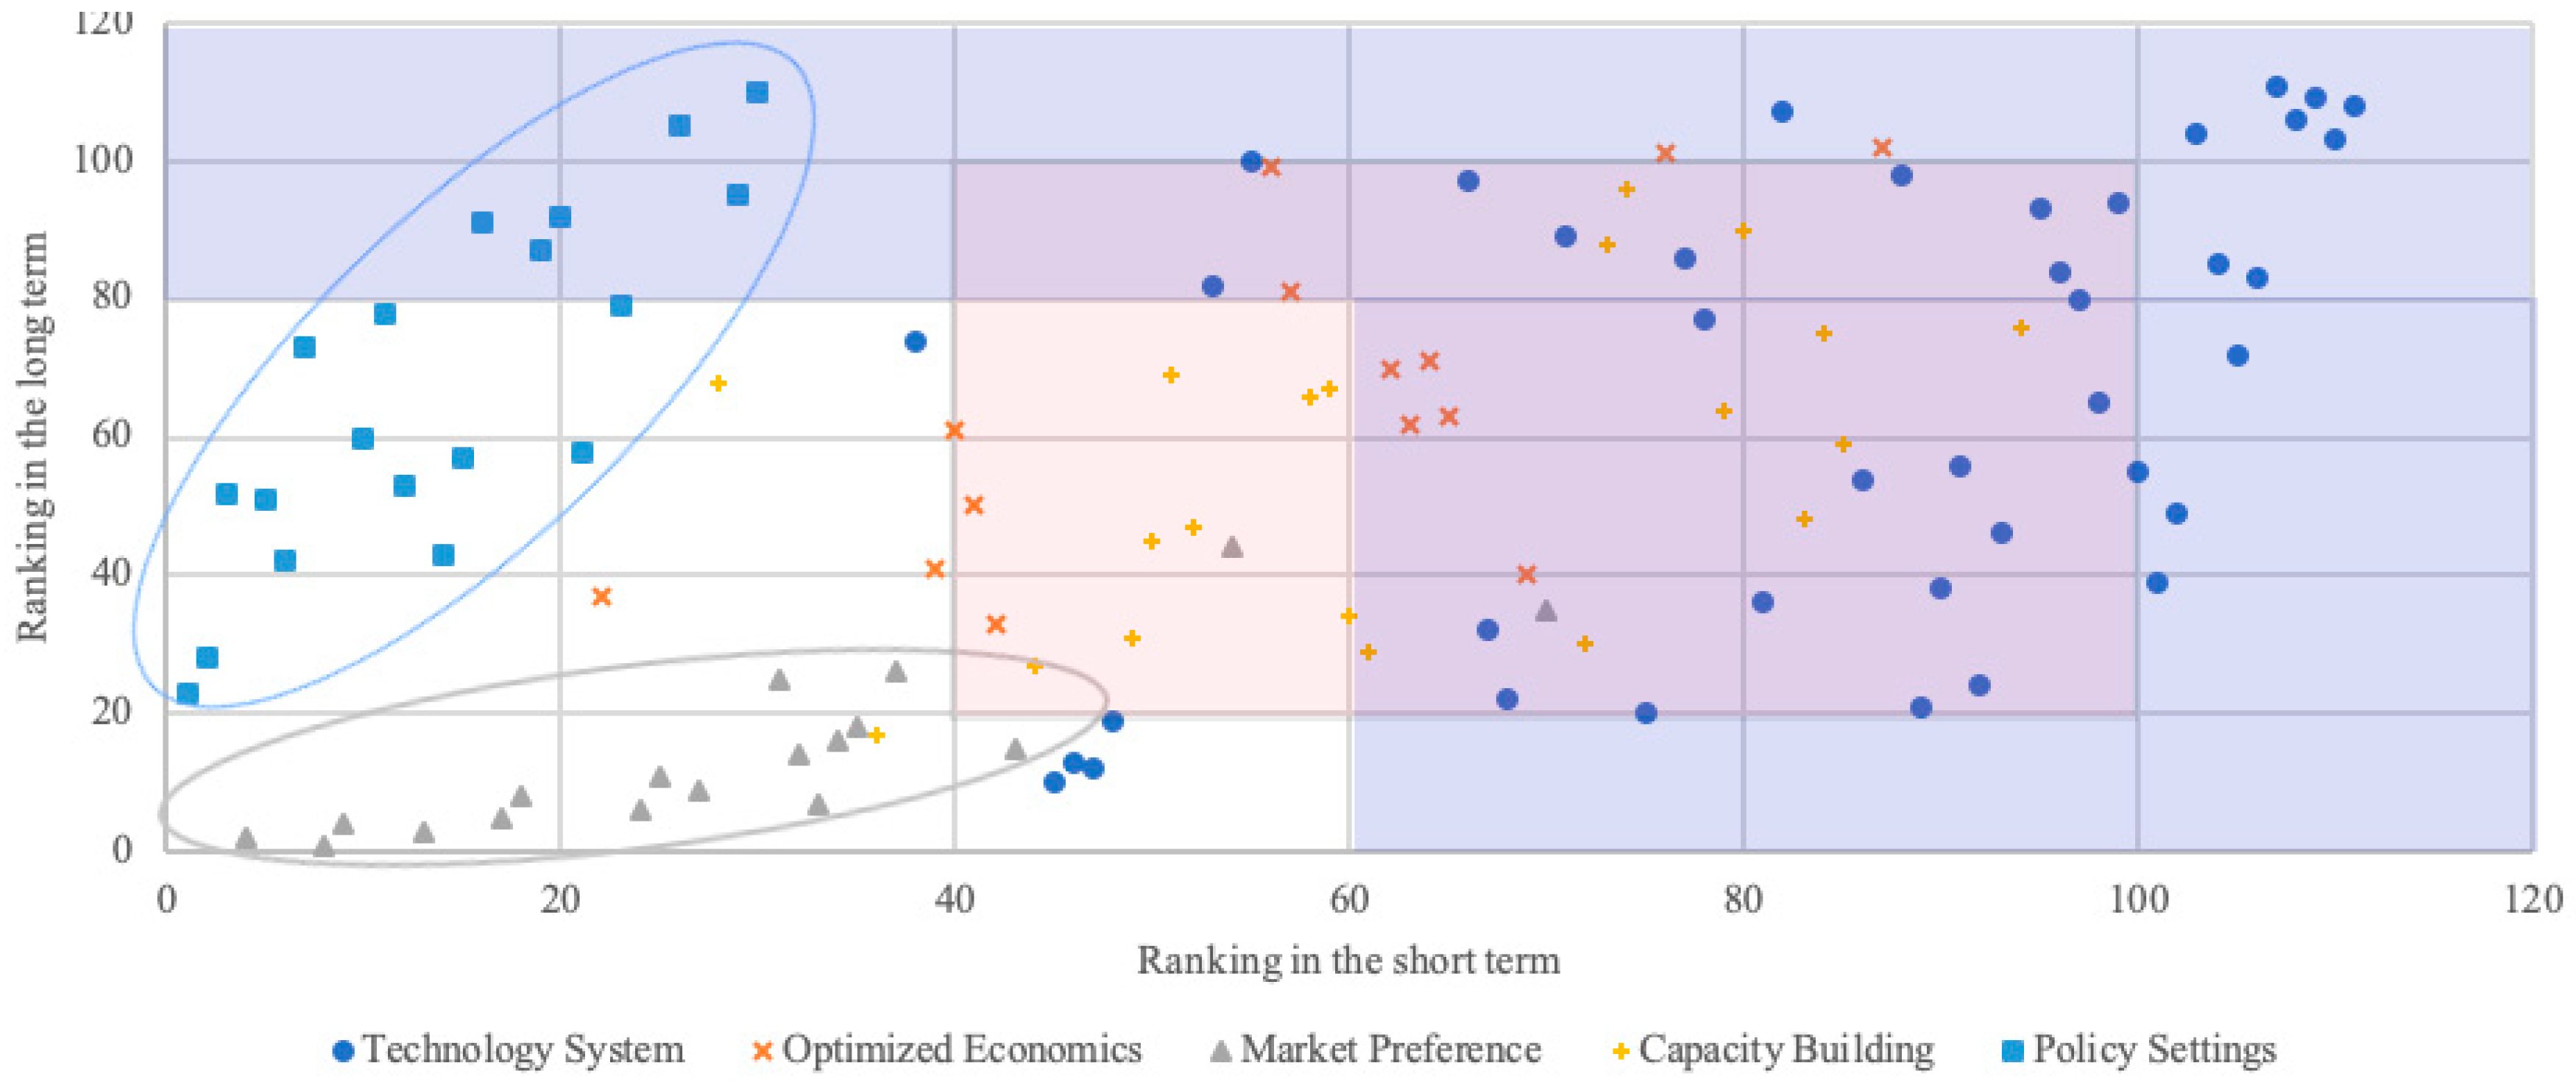
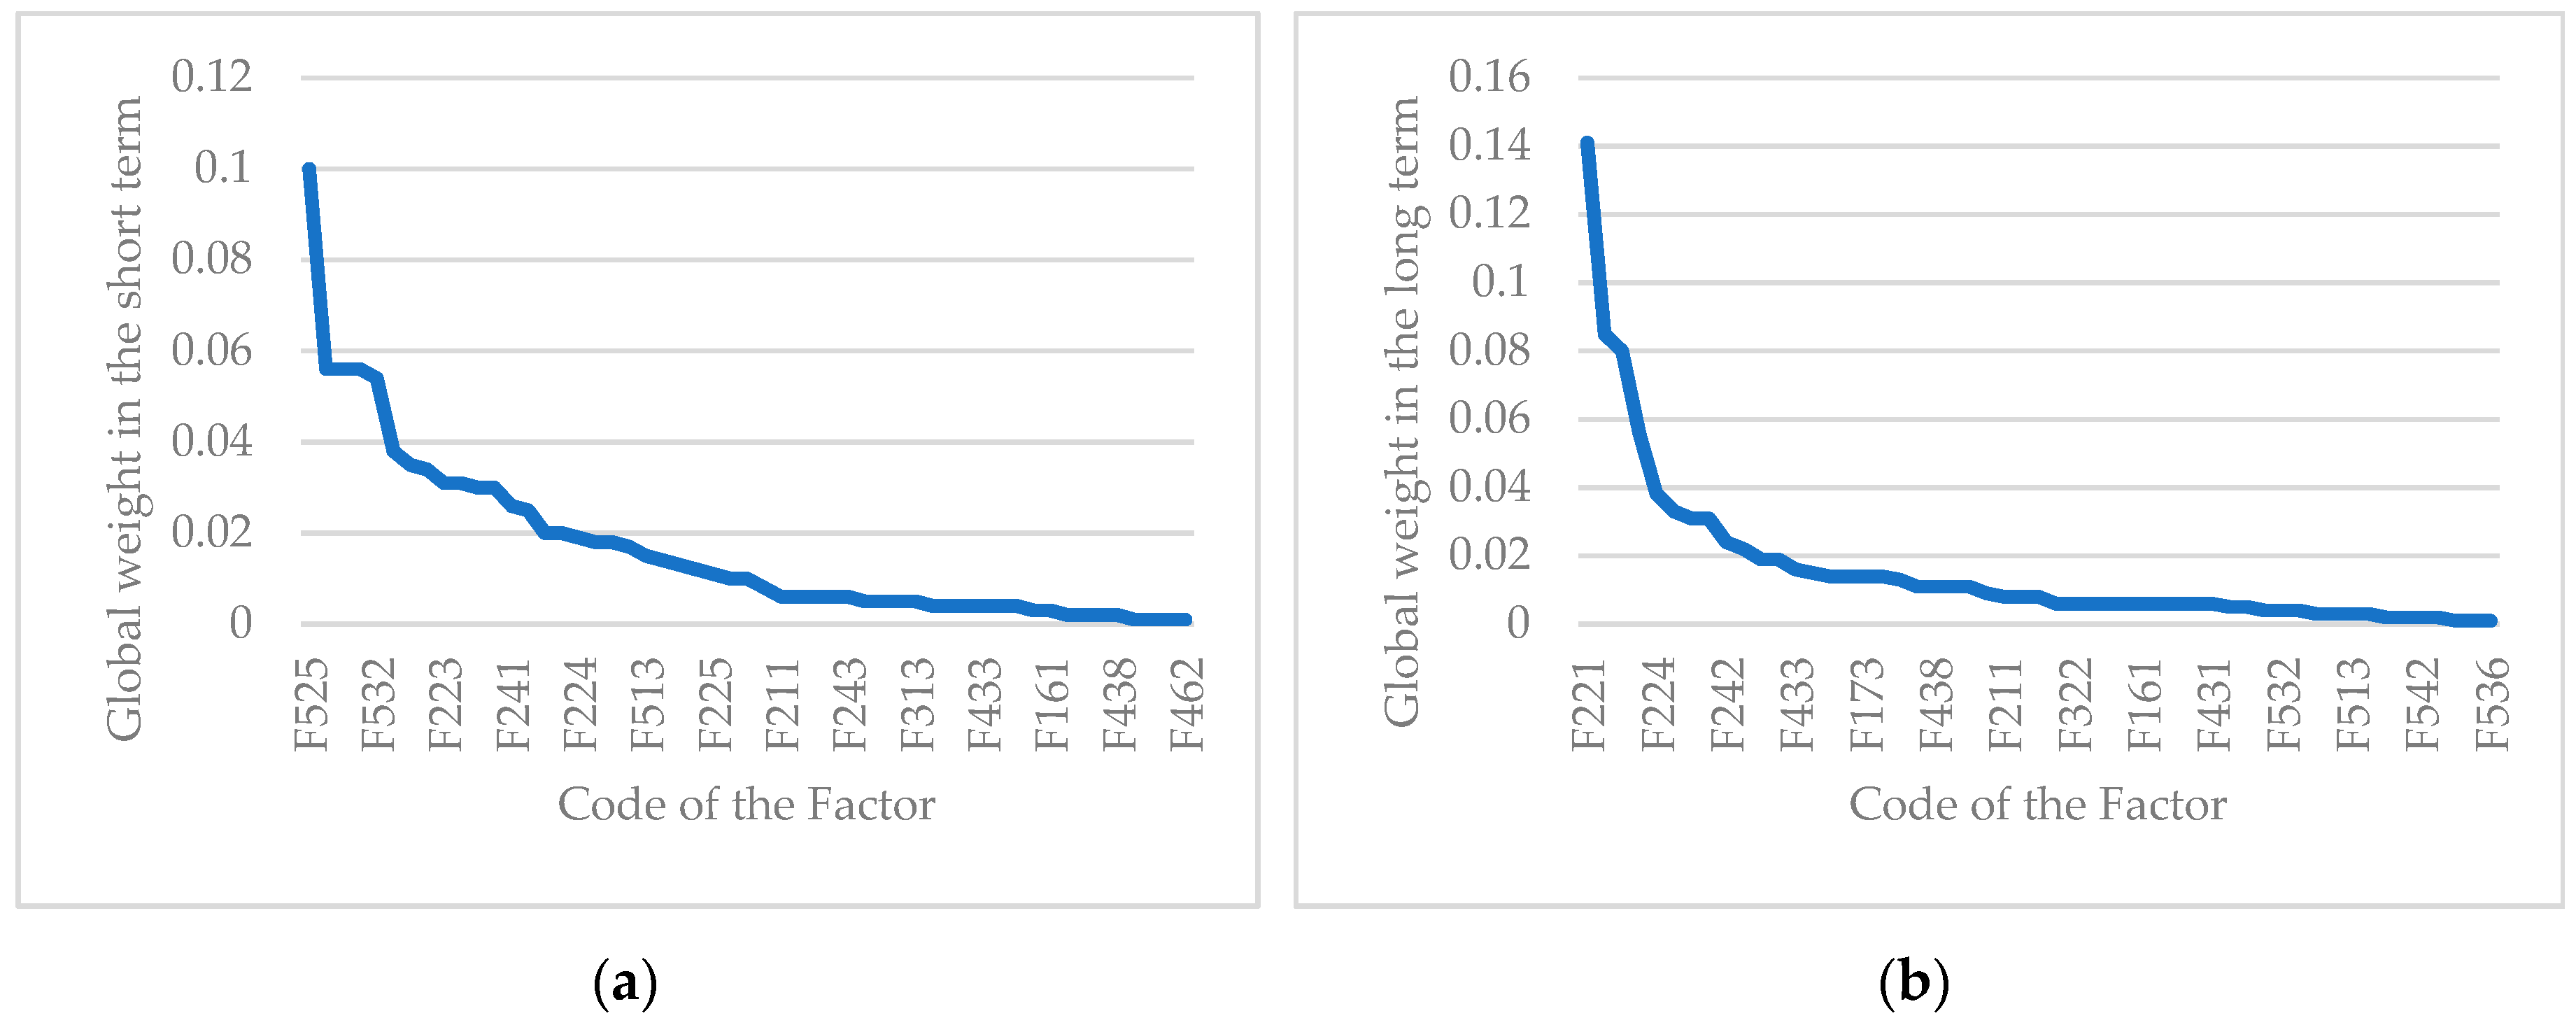
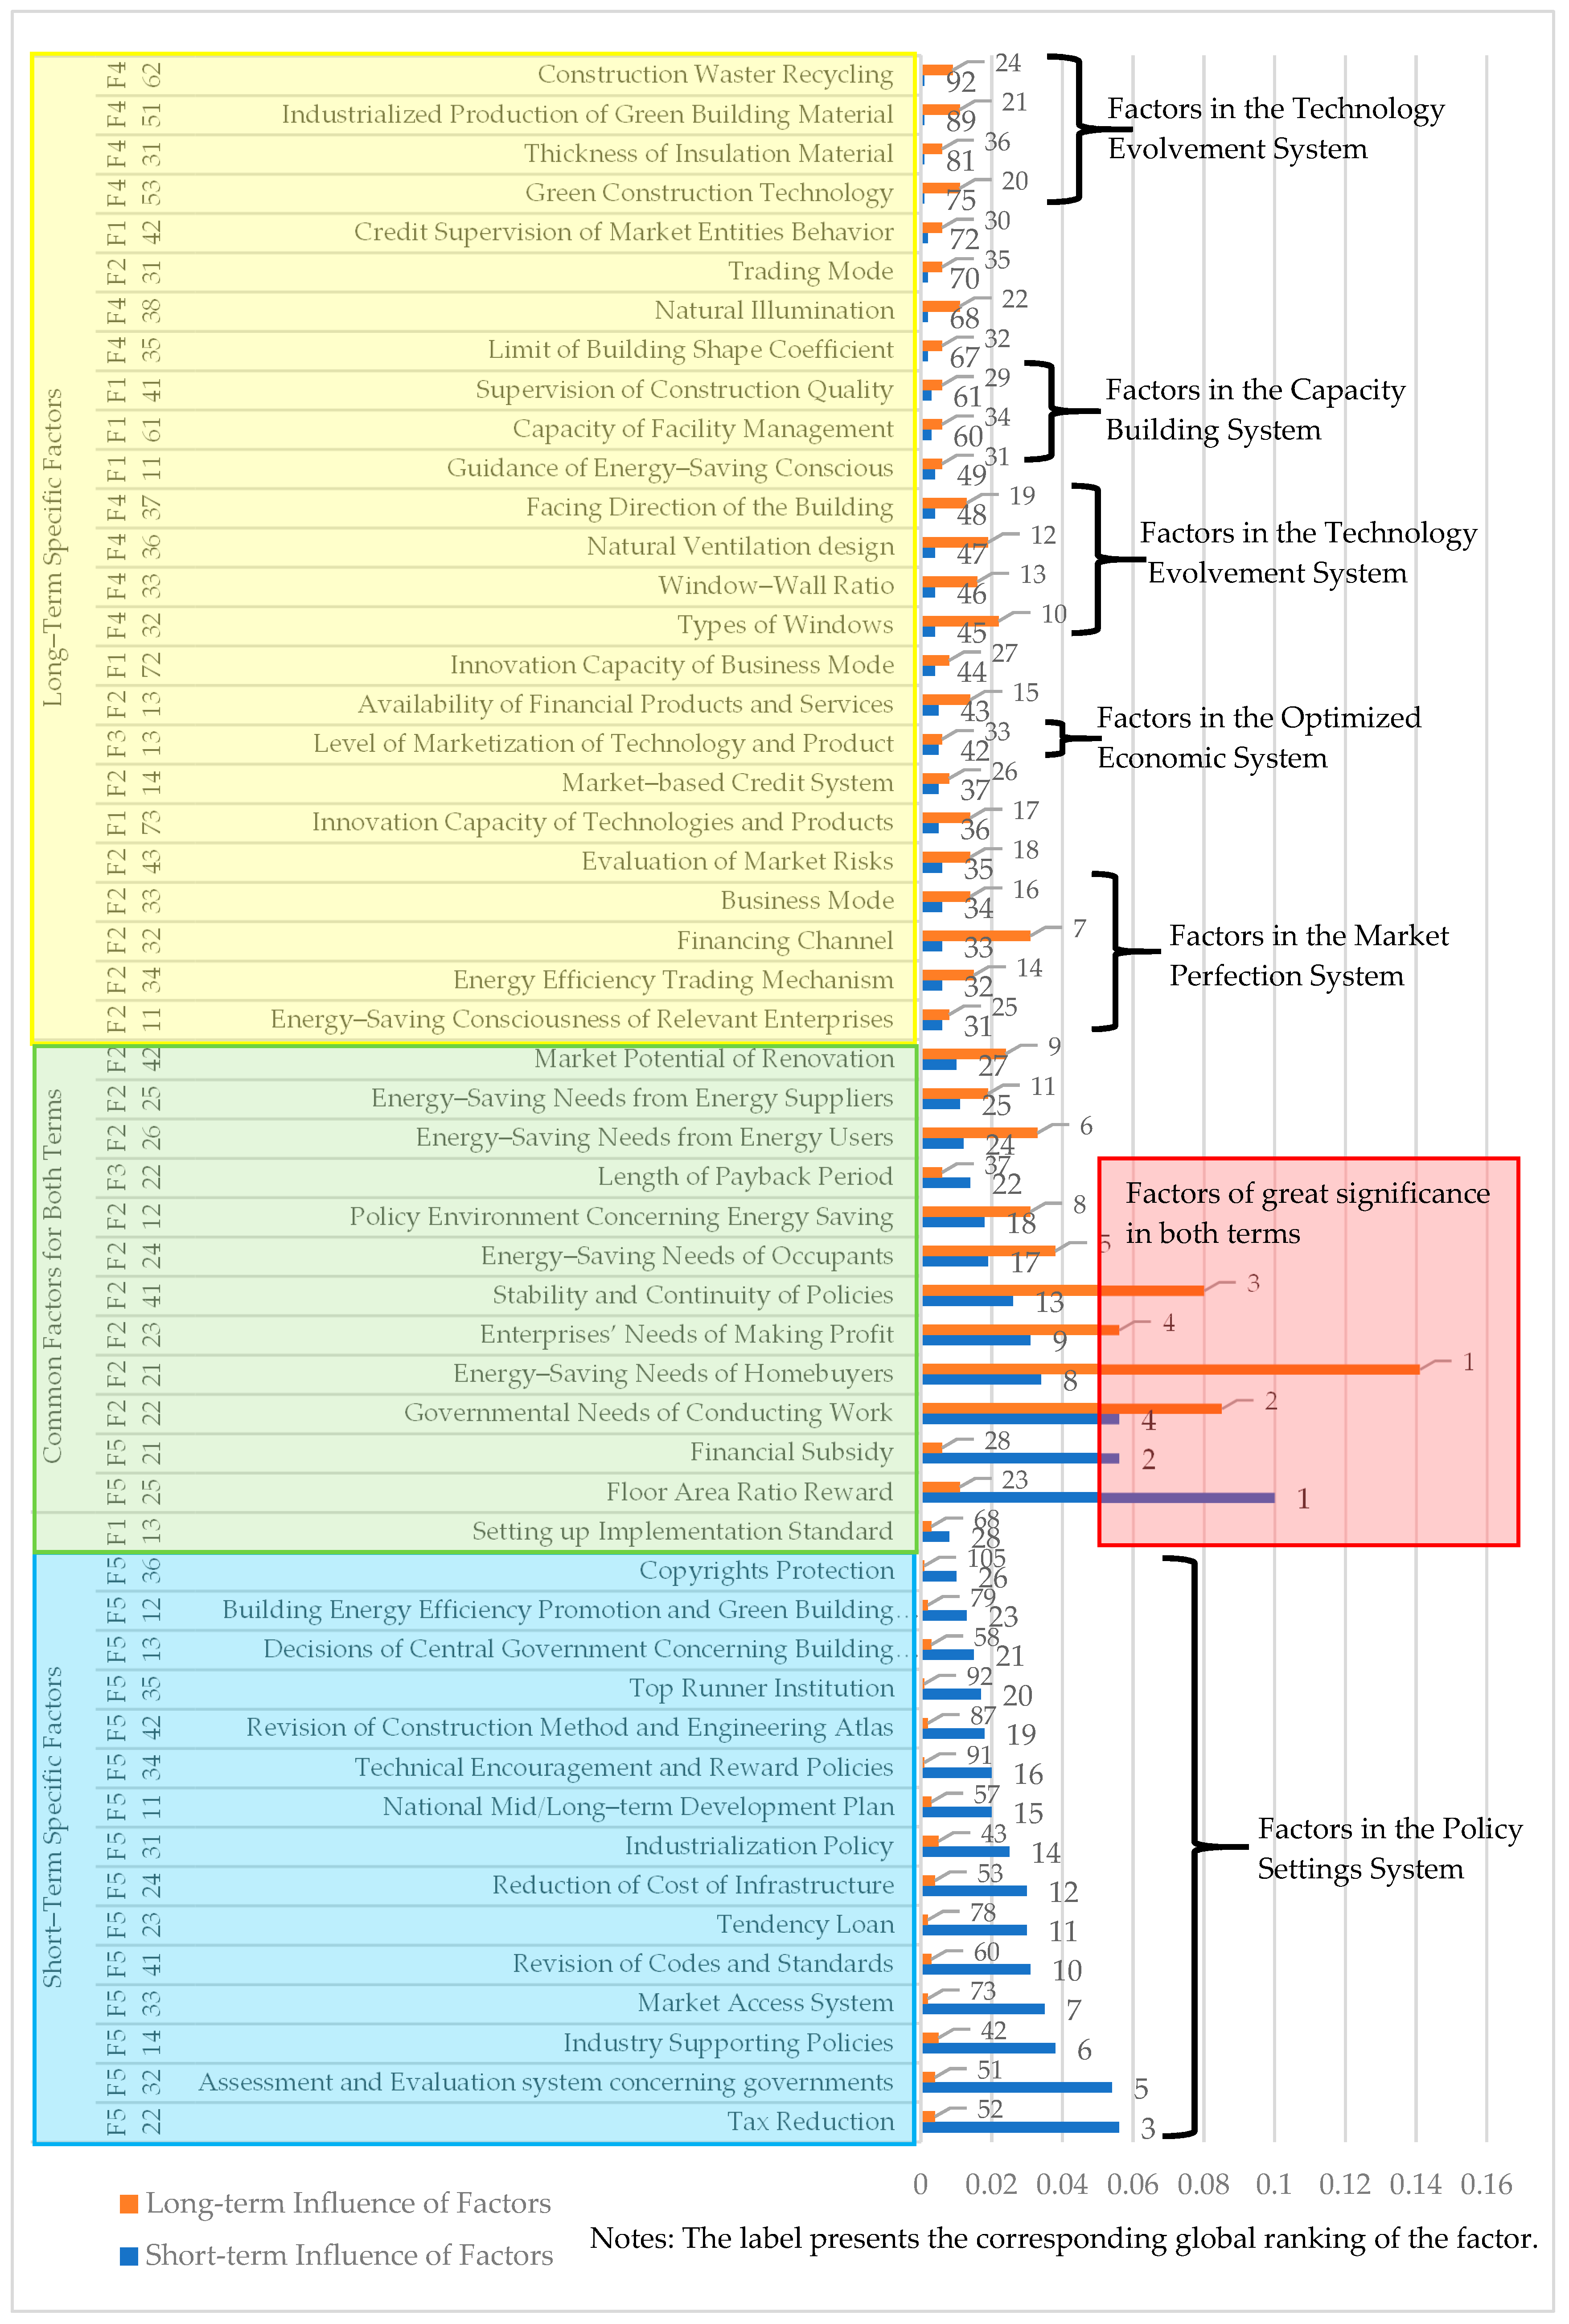


